Embed Size (px)
Citation preview

RESEARCH Open Access
A model for measuring healthcareaccessibility using the behavior of demand:a conditional logit model-based floatingcatchment area methodHoon Jang
Abstract
Background: Estimating realistic access to health services is essential for designing support policies for healthcaredelivery systems. Many studies have proposed a metric to calculate accessibility. However, patients’ realisticwillingness to use a hospital was not explicitly considered. This study aims to derive a new type of potentialaccessibility that incorporates a patient’s realistic preference in selecting a hospital.
Methods: This study proposes a floating catchment area (FCA)-type metric combined with a discrete choice model.Specifically, a new FCA-type metric (clmFCA) was proposed using a conditional logit model. Such a modelestimates patients’ realistic willingness to use health services. The proposed metric was then applied to calculatethe accessibility of obstetric care services in Korea.
Results: The clmFCA takes advantage of patients’ realistic preferences. Specifically, it can represent each patient’sheterogeneous characteristics regarding hospital choice. Such characteristics include bypassing behavior, whichcould not be considered using prior FCA metrics. Empirical analysis reveals that the clmFCA avoids themisestimation of accessibility to health services to an extent.
Conclusions: The clmFCA offers a new framework that more realistically estimates patients’ accessibility to healthservices. This is achieved by accurately estimating the potential demand for a service. The proposed method’seffectiveness was verified through a case study using nationwide data.
Keywords: Access to health, Floating catchment area, Conditional logit, Realistic preference, Obstetric care service
BackgroundIdentifying access to health services has been recognizedas an important issue for policymakers and researchersin the public health domain. Many countries, includingthe United States, have put great effort into measuringaccess to health services. Measuring such access is par-ticularly important for populations living in rural areas,which are more likely to suffer from limited access to
such services. It is important to note that if health ser-vice suppliers are not properly distributed, it may resultin increased unsatisfied demand and lead to undesirablehealth outcomes among patients. Therefore, accuratelymeasuring access to health services is key to improvingoverall access to health services and minimizing healthdisparities [1, 2].What is access to health services? In crude terms, it
can be defined as the ease of using health services toachieve a desired health level. It is also defined as “theoutcome of a process, determined by an interplay
© The Author(s). 2021 Open Access This article is licensed under a Creative Commons Attribution 4.0 International License,which permits use, sharing, adaptation, distribution and reproduction in any medium or format, as long as you giveappropriate credit to the original author(s) and the source, provide a link to the Creative Commons licence, and indicate ifchanges were made. The images or other third party material in this article are included in the article's Creative Commonslicence, unless indicated otherwise in a credit line to the material. If material is not included in the article's Creative Commonslicence and your intended use is not permitted by statutory regulation or exceeds the permitted use, you will need to obtainpermission directly from the copyright holder. To view a copy of this licence, visit http://creativecommons.org/licenses/by/4.0/.The Creative Commons Public Domain Dedication waiver (http://creativecommons.org/publicdomain/zero/1.0/) applies to thedata made available in this article, unless otherwise stated in a credit line to the data.
Correspondence: [email protected] of Global Business, Korea University Sejong Campus, 2511 Sejong-ro,Sejong, Republic of Korea
Jang BMC Health Services Research (2021) 21:660 https://doi.org/10.1186/s12913-021-06654-3
between the characteristics of the healthcare service sys-tem and potential users” [3]. The seminal work byPenchansky and Thomas [4] proposed access processcomponents using five dimensions: availability, accessi-bility, accommodation, affordability, and acceptability.Although this view has multi-dimensional characteris-tics, many other researchers have focused on distin-guishing potential and realized (or revealed) accessibility[2, 5, 6]. Among them, it is worth noting that Guagliardo[2] indicated that Penchansky and Thomas’ five charac-teristics could be regarded as the barriers that “impedeprogression from potential to realized access.”Realized (or revealed) accessibility refers to the actual
use of health services. It is calculated based on the actualutilization of health services [2, 5, 7–9]. Generally,obtaining a value for realized accessibility may be chal-lenging because it requires tremendous costs and re-sources such as a systemized data collectioninfrastructure. On the other hand, potential accessibilityconsiders the “probable utilization of health services”[10]. It is generally defined as the supply of health ser-vices to a nearby needy population. Measuring potentialaccessibility as realistically as possible is of persistentinterest to health providers or health policymakers. Thisis because monitoring the current status quo of healthservice provision is important in designing better pol-icies and planning for better health services.One of the notable metrics of potential accessibility is
the floating catchment area (FCA). This metric was ori-ginally derived from the gravity-based measure proposedin Weibull’s study [11]. By adapting the gravity-basedformula, it simultaneously considers the distance be-tween demand and supply and the supplier’s capacity.Following the publication of this work, subsequent re-searchers have studied the FCA method. The most fam-ous version of the method is the two-step FCA (2SFCA)[6]. Using population and supply level information, thismethod calculates the ratio of supply (i.e., physicians) tothe population. Although the 2SFCA has effectively mea-sured accessibility in many areas, it crucially failed to ad-dress some realistic features, such as potentialcompetition among the population. This is because itequally allocates demand to hospitals without consider-ing the other nearby hospitals’ availability. This resultsin an unreliable access score for decision-makers. Owingto its simplicity, it looks to further extensions such asthe enhanced 2SFCA, 3SFCA, and M2SFCA [12–14].For instance, the 3SFCA was developed to overcome
the shortcomings of the 2SFCA. Introducing a competi-tion weight based on travel time calculates a reasonableamount of demand, thereby reducing the risk of demandoverestimation. Similarly, the M2SFCA proposed byDelamater [14] comes from the motivation that all priormetrics have the same underlying assumption. That is,
all suppliers’ locations are optimally configured to meetthe need regarding health services. To address this, Dela-mater [14] introduced a decaying function for both de-mand and supply. In doing so, M2SFCA offers morerealistic access levels than other existing models.Recently, researchers have studied various exten-
sions and applications of the developed FCAmethods. For instance, new FCA-type metrics wereproposed by considering various transportationmodes [15–17] or non-spatial factors, such as gen-der, income level, etc. [18–22].Although prior works regarding the FCA have been
extensively studied, there have been no attempts to ex-plicitly consider the heterogeneous characteristics of de-mand for the computation of FCA metrics. Specifically,all existing metrics primarily assume that individualshave a single homogenous preference when using healthservices. Therefore, regardless of the situation in reality,existing FCA metrics equally divide the demand intotwo reachable suppliers with equal service capacities.Additionally, the prior metrics consider an interactionbetween demand and supply only by a weight function,defined by distance or travel time. A weight function istypically defined as a gradually decreasing function bydistance (or time). As such, prior metrics only have adiminishing mechanism in calculating accessibility tohealth services. However, there may be cases in whichpatients prefer to visit hospitals located far away overhospitals near their residence. This is another limitationof the prior FCA metrics.Motivated by this, the present study proposes a new
FCA metric by incorporating the heterogeneous charac-teristics of demand. As noted above, while prior metricsare effective to some extent, they do not elucidate thecomplex nature of access to health services in real-worldsettings. Specifically, they do not reflect each individual’sunique priorities when choosing their healthcare pro-vider. This study used a discrete choice model to addressthis issue. The discrete choice model, which has beenextensively studied in economics, provides a rigorousmathematical formula to calculate the patient’s willing-ness to use a certain healthcare provider. Thus, it pro-vides a more realistic representation of individuals’preferences when choosing a health provider. The pro-posed metric begins by using a conditional logit modelto estimate patients’ willingness to use health services.The author believes that this increases the accuracy ofcalculating the potential demand for a specific healthcareprovider. Consequently, this ultimately provides a moreaccurate accessibility score. Considering that obtainingthe true realized accessibility requires significant effort,this study offers a unique position in calculating morerealistic potential accessibility by using a discrete choicemodel.
Jang BMC Health Services Research (2021) 21:660 Page 2 of 11
Thereafter, the conditional logit model-based FCA(clmFCA) was applied to a real-world setting to examinethe differences between the prior metrics and the pro-posed metric. The clmFCA was used to calculate the ac-cessibility of the obstetric care system in Korea. Just asmany countries encounter difficulties in providing ad-equate levels of obstetric care services in rural areas,Korea also currently suffers from its obstetric care sys-tem’s poor level in rural areas [23–25]. This is mainlydue to such reasons as a low birth rate and the increas-ing financial burden incurred in sustainably operatinghospitals. Improving accessibility to obstetric care sys-tems is an urgent and vital task for the Korean govern-ment because such problems may ultimately lead tomany medical and socio-economic problems [26].In this regard, this empirical analysis contributes to a
better understanding of obstetric patients’ accessibilityto hospitals across the country. Through a comparisonwith traditional measures, this study determines how thedifferences among accessibility measures manifest inreal-world settings.
MethodsDiscrete choice modelTo incorporate the realistic behavior of potential de-mand, a discrete choice model that is based on the ran-dom utility theory is applied. This concept was originallyintroduced as a stimulus in psychology and economics[27, 28]. Among many different choice models, thisstudy uses the conditional logit model (CLM), assumingthat the errors are independent and identically distrib-uted through a Gumbel distribution. Notably, McFadden[29] first introduced the CLM, which has been exten-sively used in many areas, including economics, market-ing, and operations management, because of itssimplicity and tractability.1
The implementation of the clmFCA requires describ-ing the probability that a patient i will select hospital j,Pij. For this purpose, this study adopts the results pre-sented in the work of Hwang et al. [30], who used thesame experimental data as in the present study.Hwang et al. [30] analyzed patient preferences using
CLM. They first reviewed the literature to identify thefactors that contribute to the utility function. In thisstudy, obtaining personal data and private information isnot permitted because of privacy issues. This informa-tion is not easily obtained because demographic data,residential location information, and hospital visit re-cords may identify specific individuals. Therefore, we
used the following four covariates shown in Table 1. De-tails including the collection of studied data and variableselection procedure are provided in the SupplementalInformation.Using the dataset, Hwang et al. [30] subsequently de-
veloped the utility function Vij using eq. (1)2:
V ij ¼ −1:072LvH jHigh−0:174Urb
jCity−0:862Urb
jRural þ 0:151Numj−0:064τij
ð1ÞIn eq. 1, each coefficient represents the relative likeli-
hood of selecting a healthcare provider. For instance, −1.072 for LvHj
High is the probability of choosing ahigher-level hospital (tertiary/tier 3), which is 0.34 timeshigher than the probability of selecting a lower-levelhospital (primary/tier 1 or secondary/tier 2) (exp (−1.072) = 0.34). In summary, their model indicates thatpatients prefer to use the following: 1) lower-tier hospi-tals, 2) hospitals located in metropolitan (or urban)areas, 3) hospitals with more obstetrics specialists, and4) hospitals located closer to patients’ residential loca-tions. Using multiple validating procedures, Hwang et al.[30] confirmed that this model could estimate a patient’spreference for choosing a hospital. Details of the valid-ation process, including statistical results, are providedin the Supplemental Information.
The conditional logit model-based floating catchmentarea methodPrior FCA metrics still do not address the issue of esti-mating the true demand for health services despite thatthey have been widely applied to many areas. As men-tioned earlier, a well-estimated demand for the calcula-tion of spatial accessibility plays a key role in measuringtrue accessibility to health services. It helps hedge therisk of underestimating (or overestimating) the potentialvolume of demand for services, ultimately leading to de-signing more effective support programs and policies.Motivated by this, the present study proposes a metric
that incorporates a discrete choice model. It mathemat-ically computes an individual’s willingness to use a spe-cific healthcare provider to more accurately calculate thepotential demand for services. Specifically, a conditionallogit model attempts to create a decision mechanism ofhow an individual chooses his or her favored alternativesamong the available options. For instance, the choice ofwhich product to buy or which transportation mode to
1It is also worth noting that because the choice probability formula ofthe CLM is closed-form and only contains measurable factors, it canbe easily calculated. That is, it can incorporate various factors that ex-plain the choice process of the population as long as the utility func-tion has a computable form.
2McFadden’s pseudo R-squared (0.2748) and variable inflation factorfor all variables (≤ 1.2) confirm that this model is statistically valid.The authors also conducted a five-fold cross-validation process andconfirmed that it is acceptable to use the model for predictions (R2 be-tween the actual usage and the predicted numbers of visits attains0.7195 on average). It is worth noting that their model has been veri-fied by several experts, including physicians, and the overall results andtendencies are consistent with their practical application.
Jang BMC Health Services Research (2021) 21:660 Page 3 of 11
use to go to work are typical examples that can be ana-lyzed by discrete choice models.Based on a more realistic approximation of how an in-
dividual chooses their hospital, a new FCA metric is pro-posed in Table 2. Such a metric can consider realisticinformation regarding an individual’s hospitalpreference.It must be noted that Sj is the capacity of hospital j,
and Di denotes the demand (i.e., the number of potentialpatients for health services) at i. The clmFCA consists ofthree stages, beginning with the calculation of the choiceprobability of the demand. In step 1, the clmFCA com-putes the choice probability for each pair (i, j) using adiscrete choice model. Here, it is assumed that the entirepopulation located in i has the same preference forchoosing hospitals.3 The factors (Vij) and data for com-puting probability should be selected beforehand andprepared accordingly. Next, the clmFCA calculates thesupply to potential demand ratio for each facility j. Itdirectly applies the selection probability from i to j ra-ther than using a travel-like impedance function as isfound in classical FCA methods. This is a unique charac-teristic of the proposed metric. Specifically, it considerswillingness to use a hospital as part of demand, which iscombined with the choice probability (DjPij) of the de-mand. This is important in the sense that theclmFCA can consider features that occur in the realworld. Finally, the clmFCA adds the calculatedvalues obtained from step 2 with the choice prob-ability for each location i.Overall, the proposed method can systematically con-
sider a user’s preference in selecting health providers,unlike the conventional FCA methods. Particularly, theproposed method can account for both the user’s bypassbehavior, that is, when a patient bypasses the nearesthospital and prefers using a far-away one, and the popu-lation’s heterogeneous nature. In the virtual experiments,we confirmed that the proposed method is better thansome conventional FCA methods when considering apatient’s realistic characteristics (see Supplemental
Information for more details). This will help readersunderstand the difference between the proposed meas-ure and the benchmarking methods.
Case study: analyzing the potential accessibilityof South Korea’s obstetrics careDataA case study using real data was conducted to examinethe proposed model’s effectiveness. This study was ap-proved by the Institutional Review Board of the NationalMedical Center in Korea (IRB No. H-1604-065-003).The data were anonymized in regard to identifying infor-mation. Thus, informed consent was not required.This study used two types of data. One is the demand-
side data from the fertile age group (15–49 years old) inKorea, gathered from Korea’s National Statistical Office.As of 2015, the total number of fertile women in Koreawas approximately 13 million. Most of them were livingin metropolitan areas such as Seoul. For patient location,the present study uses the weighted centroids of eachsub-municipal areal unit and not individual residentiallocations. As of 2015, there were 3488 sub-municipalareal units in Korea. Moreover, this study uses the smal-lest available areal unit for analysis because it is ex-tremely difficult to access each individual residentialaddress for privacy and confidentiality reasons. Fig. 1(a)shows the geographical distribution and potential de-mand for services (i.e., the potential number of patientswho may use health services).For the supply side data, we used hospital information
obtained from the Health Insurance Review and Assess-ment Service (HIRA). As of 2015, there were 576 hospi-tals performing at least one labor and delivery service.Specifically, the capacity (beds) and geographical loca-tion information were obtained from the HIRA dataset.It should be noted that Korea operates a three-tieredhealthcare delivery system, where tier 3 provides thehighest level of medical services. Figure 1(b) shows thehospitals’ locations across the country. Similar to thedistribution of demand, most hospitals are located indensely populated areas (e.g., the northwest region).The last piece of data is travel time. This is obtained
based on the national road network provided by the Na-tional Transportation Database Service in Korea. Usingthe ArcGIS™10.0 network analysis tool, this study calcu-lated the travel time of all pairs between the residential
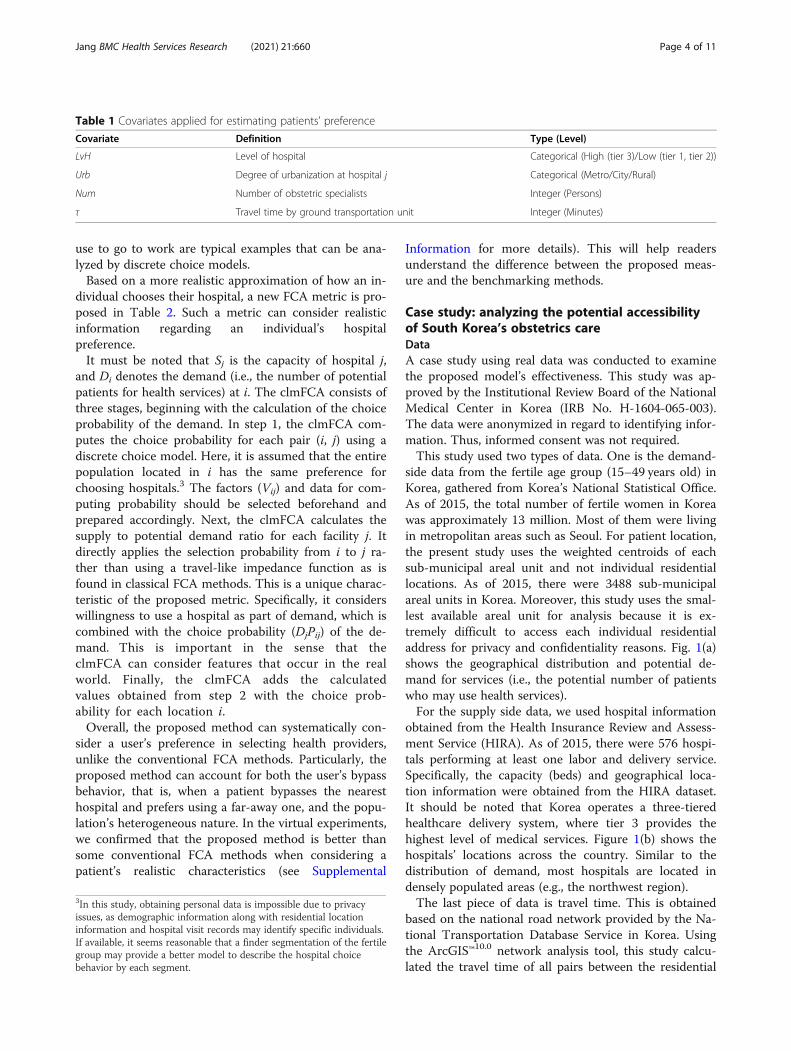
Table 1 Covariates applied for estimating patients’ preference
Covariate Definition Type (Level)
LvH Level of hospital Categorical (High (tier 3)/Low (tier 1, tier 2))
Urb Degree of urbanization at hospital j Categorical (Metro/City/Rural)
Num Number of obstetric specialists Integer (Persons)
τ Travel time by ground transportation unit Integer (Minutes)
3In this study, obtaining personal data is impossible due to privacyissues, as demographic information along with residential locationinformation and hospital visit records may identify specific individuals.If available, it seems reasonable that a finder segmentation of the fertilegroup may provide a better model to describe the hospital choicebehavior by each segment.
Jang BMC Health Services Research (2021) 21:660 Page 4 of 11

locations of demand (centroid of the municipal arealunit) and hospital locations. Based on the results of thestudy conducted by the Korean government, the thresh-old of whether a patient is within a catchment area of aparticular healthcare provider j is set as 60 min.4
ResultsAccessibility scoresThree well-known benchmarking accessibility measureswere chosen (2SFCA, 3SFCA, and M2SFCA) to comparethe accessibility scores of the clmFCA. It would be bene-ficial to discuss the advantages and disadvantages of theproposed method because the chosen measures have dif-ferent characteristics. A short illustration of these mea-sures is presented in the Supplemental Information.Table 3 presents the basic descriptive statistics for ac-
cessibility outcomes. The clmFCA provides the lowestaverage value of accessibility when compared to thethree benchmarking measures. The average access tohealthcare provider sets was 0.00098. The highest valueswere obtained for the 2SFCA (0.000183). However, thestandard deviation of accessibility scores from theclmFCA showed the highest values, while the 2SFCAshowed the lowest.Next, accessibility maps of the four metrics were pre-
sented. Figures 2(a) to (d) show the access scores ofhealthcare providers. As seen in Fig. 2, the geographicalpatterns of all four metrics were generally similar. Mostregions in green are generally rural areas. Those in yellowand orange are urban and metropolitan areas, respectively.Although the geographical patterns of all four mea-
sures are analogous, the magnitude of accessibility is stilldifferent. Consistent with the results from Table 3, theclmFCA showed the lowest level of access to healthcareproviders, compared to other metrics. Figure 3 presentsthe degree of difference between the clmFCA and thebenchmarking measures to more clearly understand thisdifference. In the case of 2SFCA, 2793 regions (over
3487 sub-municipal areal units) showed higher accessi-bility scores than the clmFCA. Although the degree ofdifference is different, it can be similarly observed thatthe benchmarking methods provide a higher accessibilityscore than the clmFCA.
Comparison with real observationsFour accessibility scores were compared with a timelyrelevance index (TRI). The TRI is a primary measure ofreal accessibility used in Korea to examine how potentialaccessibility computed from the four metrics is similarto real observations. TRI is defined as the proportion ofhospital usage within a time threshold (e.g., 60 min) overthe total number of instances of hospital usage in a par-ticular areal unit (e.g., municipal areal unit). A highvalue indicates that more people use health providersthat can be reached within an hour. This is based on theactual use of health services. Moreover, it considers thegeographical proximity between demand and supply(health provider). Therefore, the TRI is sufficientlyregarded as revealed accessibility, considering geograph-ical proximity.5
Table 4 and Fig. 4 show TRI’s descriptive statisticsand geographical patterns (aggregated into municipalareal units). Correlation coefficients were calculatedto compare the similarities between accessibilityscores and the TRI index. Table 5 shows the correl-ation coefficients between the four metrics and theTRI values. We reported Spearman’s correlation coef-ficient and the Kendall-tau correlation coefficient,which are non-parametric versions of the Pearsoncorrelation coefficient, because the units of measure-ment are different. As shown in Table 5, the pro-posed method shows the values 0.850 and 0.648 asthe highest among the four metrics.6
Table 2 The algorithm for calculating the proposed metric
Input{Pij for i ∈ I, j ∈ J, Sj for j ∈ J, Di for i ∈ I} = Output{Ai, for i ∈ I}
Step 1. Calculate the choice probability, Pij for each demand–supply pair (i, j)
- Pij ¼ expðVijÞPk∈ J
expðVikÞ (2)
Step 2. Calculate the supply to potential demand ratio, Rij, by fixing each facility j
- Rij ¼ S jPi∈IDiPij
(3)
Step 3. Sum the ratio, Rij, for each population location i
- Ai ¼P
j∈ Ji RijPij (4)
4A 60-min threshold is based on the results of the nationwide study inwhich the author was involved [26]. In this study, a threshold is deter-mined by considering both expert’s opinions and prior related studies.It is worth noting that this is a parameter that can vary when it appliesto different problems.
5Considering that obtaining revealed accessibility requires tremendouseffort and resources, we believe that TRI is appropriate to use as aproxy for revealed accessibility. It is worth noting that the goal of ourstudy is to design more “realistic” potential accessibility; it is thusreasonable to compare the results of our measure with TRI.6We also reported the ranking of accessibility scores of the fouraccessibility metrics and the TRI index to Section 1.6 of theSupplemental Information.
Jang BMC Health Services Research (2021) 21:660 Page 5 of 11

DiscussionThis study proposes a new accessibility measure typethat explicitly incorporates the patients’ willingness touse a healthcare provider. A realistic and plausiblemetric to measure access to health services is the firstand most crucial step in designing better policies to im-prove accessibility. However, obtaining real observationsrequires tremendous costs and effort. It is sometimesimpossible to gather such observations because of prac-tical limitations such as difficulty accessing private infor-mation. Conversely, the use of traditional metrics tocalculate potential accessibility has a drawback. Mostprior measures do not consider realistic demand prefer-ences. Therefore, the results of these methods may pro-vide incorrect information to policymakers. This maylead policymakers to design policies that are sub-optimalfor the population. Motivated by this, the present studydesigns a new FCA metric that incorporates a discretechoice model. To the best of the author’s knowledge, theproposed metric involving a rigorous mathematicalmodel explaining individuals’ willingness to choose aspecific healthcare provider has not been studied in
related literature. Therefore, it takes up a unique pos-ition in related areas of study.As mentioned earlier, the advantage of using the
clmFCA is its ability to more realistically identify poten-tial demand for each healthcare provider. Specifically,the clmFCA considers patients’ realistic behavior, suchas their bypass behavior, by incorporating the hospitalselection. Bypass behavior generally affects the size ofpotential demand in two different ways [31, 32]. For un-desirable healthcare providers, overestimations areavoided to a possible extent. Additionally, it also helps incorrecting underestimations for attractive healthcareproviders by considering unexpected arrivals to theseproviders. In particular, patients being able to freelychoose their hospital based on the individual’s prefer-ence is a typical situation in Korea. These preferencesinclude the patient’s travel time to the hospital.It must be noted that most FCA metrics use simple
procedures in estimating the potential demand for ser-vices. The 2SFCA assumes that the entire populationhas equal opportunities to use service providers withintheir catchment areas. On the other hand, the 3SFCAconsiders the competition effect when estimating de-mand. However, it simply divides the proportion ofweight calculated by travel time. Moreover, M2FCA andE2SFCA primarily use a decay function based on traveltime. Several FCA-type metrics consider non-spatial fac-tors (e.g., congestion in hospitals and transportationtypes). Nonetheless, they considered non-spatial factorsin a simple (or rough) manner. The present study is
Table 3 Descriptive statistics for each FCA metric (10−4)
Metric Average Standard deviation Minimum Maximum
2SFCA 1.83 0.74 0.00 4.44
3SFCA 1.67 1.26 0.00 19.5
M2SFCA 1.02 0.97 0.00 17.2
clmFCA 0.98 1.27 0.00 4.38
Fig. 1 Potential demand for health service (a); Hospital location (b)
Jang BMC Health Services Research (2021) 21:660 Page 6 of 11

novel because it explicitly combines a discrete choicemodel with FCA measures. In doing so, this study pro-vides a reasonable way to answer the question of how anindividual selects a hospital. Thus, this contributes toobtaining more accurate and realistic results regardingaccessibility to health services.Another contribution of this study is its applicability.
A general method of calculating potential accessibility,
applied to various healthcare systems, is proposed hereby incorporating a discrete choice model into an accessi-bility model. Such a method can adopt the unique char-acteristics of healthcare systems in the first step of theclmFCA. Traditional FCA metrics cannot consider theunique characteristics of various health systems becausethey do not account for the characteristics of differenthealthcare systems. However, the proposed method
Fig. 2 Accessibility scores of (a) 2SFCA; (b) 3SFCA; (c) M2SFCA; (d) clmFCA
Jang BMC Health Services Research (2021) 21:660 Page 7 of 11

appropriately reflects such characteristics using adiscrete choice model. Therefore, this would be one ofthe proposed model’s methodological merits as com-pared to the classical approaches.The effectiveness of the clmFCA can be twofold. First,
it hedges accessibility’s overestimation. Based on the ac-cessibility scores, the clmFCA primarily avoids overesti-mating the potential accessibility to healthcare providers.This is magnified when compared with the results of the2SFCA. The 2SFCA often provides unrealistic (i.e., over-estimated) access values because it does not have an ex-plicitly designed demand estimation model. Particularly,accessibility in regions where populations overlap inchoosing several providers (e.g., metropolitan or urbanareas) is more likely to be overestimated because it doesnot consider patients’ realistic preferences. However, theclmFCA accounts for this characteristic. That is, theproposed metric can provide realistic accessibility mea-sures through a well-estimated demand model.Second, the results from the clmFCA match well with the
revealed accessibility. Table 5 presents the results, where itcan be seen that the clmFCA provides accessibility trendssimilar to the TRI index. This is confirmed by analyzing thecorrelation coefficient between FCA-type metrics and the
TRI index. In the clmFCA, the correlation coefficient’svalue is greater than 0.80. Such a value implies a strong cor-relation between the potential accessibility from theclmFCA and the TRI index. In other words, the proposedmethod calculates appropriate values of accessibility whereit should be. This would be beneficial for policymakers whodesign policies and strategies to improve healthcare deliverysystems. For example, policymakers can design a way ofdeploying resources to medically serve underserved areas.They may likewise provide tailored packages of policiesusing the results from the clmFCA to cover demand con-sidering their living areas.Although this study proposes a new type of accessibil-
ity measure, it has several limitations. One limitation isthat a choice model is initially required to execute theclmFCA. If realistic data on patients’ willingness to visithospitals are not available, this study may not be super-ior to the existing methods. Another limitation is theneed for access to more relevant data to calculate health-care access. Although this study adapts patients’ prefer-ence in calculating healthcare access, it cannot use thefinest level of demand (i.e., each patient’s residential lo-cation) because of practical challenges such as access toprivate and confidential information. Moreover, the
Fig. 3 Histogram of differences in accessibility score between prior metrics and the clmFCA
Table 4 Descriptive statistics of TRI
Metric Average(Standard deviation)
Maximum/Minimum 1st and 3rd Quartile (IQR)
TRI 0.65 (0.34) 0.96/0.00 0.39/0.92 (0.52)
Jang BMC Health Services Research (2021) 21:660 Page 8 of 11

limited access to information on patient characteristicscan act as a barrier to obtaining a more realistic patientbehavior estimation model.
ConclusionThis study addresses the problem of calculating ac-cess to healthcare providers by designing a new FCAmetric. It provides an access measure that realisticallyidentifies patients’ accessibility to healthcare by
incorporating their willingness to use a healthcareprovider into the clmFCA. The study’s technical con-tribution is the development of a new metric that cancapture a patient’s willingness to choose a hospital,leading to a more realistic potential accessibilitymeasure. Such a metric has not been studied in re-lated fields to the best of the author’s knowledge.Next, this study applies the clmFCA to real-worldcases using nationwide data for obstetric care inKorea. The experimental results revealed the advan-tage of using the clmFCA. That is, it can estimate thepotential demand for services as accurately as pos-sible. Nonetheless, several areas can be further ad-dressed. Employing more sophisticated choice models(e.g., the health belief model) or adopting rigorous
Fig. 4 Geographical pattern of TRI
Table 5 Correlation between the TRI and the four metrics
Correlation Coefficient 2SFCA 3SFCA M2SFCA clmFCA
Spearman 0.675 0.730 0.703 0.850
Kendall-tau 0.487 0.559 0.517 0.648
Jang BMC Health Services Research (2021) 21:660 Page 9 of 11
mathematical models (including machine learningmethods to predict potential demand for health ser-vices) can be considered in future studies.
AbbreviationsCLM: Conditional logit model; clmFCA: Conditional logit model-based float-ing catchment area; FCA: Floating catchment area; M2SFCA: Modified twostep floating catchment area; 3SFCA: Three-step floating catchment area;2SFCA: Two-step floating catchment area; TRI: Timely relevance index
Supplementary InformationThe online version contains supplementary material available at https://doi.org/10.1186/s12913-021-06654-3.
Additional file 1.
AcknowledgementsThe author would like to thank Dr. Kyosang Hwang; I would also like tothank Mr. Lee Taeho for his helpful comments and for providing relevantdata for my study.
Author’s contributionsHJ did all of the work on this paper. The author read and approved themanuscript.
FundingThis research was partially supported by the National Research Foundationof Korea (NRF) grant funded by the Ministry of Science and ICT (No.NRF-2019R1F1A1063365).
Availability of data and materialsThe data analyzed in this study are from the Korean government, and thedata analysis is ongoing for subsequent publications. Therefore, the datasetsare not publicly available but are available on request from thecorresponding author.
Declarations
Ethics approval and consent to participateThese datasets were approved by the Institutional Review Board of theNational Medical Center in Korea (IRB No. H-1604-065-003). Because the data-sets were fully anonymized in regard to identifying personal information, in-formed consent was not required. Protocols are carried out in accordancewith relevant guidelines and regulations. The data used in this study are notpublicly available and do not contain personal identifying information.
Consent for publicationNot applicable.
Competing interestsThe author declares that there are no competing interests.
Received: 22 December 2020 Accepted: 17 June 2021
References1. Combier E, Charreire H, Vaillant ML, Michaut F, Ferdynus C, Amat-Roze JM,
et al. Perinatal health inequalities and accessibility of maternity services in arural French region: closing maternity units in Burgundy. Health Place. 2013;24:225–33. https://doi.org/10.1016/j.healthplace.2013.09.006.
2. Guagliardo MF. Spatial accessibility of primary care: concepts, methods andchallenges. Int J Health Geogr. 2004;3(1):3. https://doi.org/10.1186/1476-072X-3-3.
3. Khan AA. Bhardwaj. Access to health care. A conceptual framework and itsrelevance to health care planning. Eval Health Prof. 1994;17(1):60–76.https://doi.org/10.1177/016327879401700104.
4. Penchansky R, Thomas JW. The concept of access: definition andrelationship to consumer satisfaction. Med Care. 1981;19(2):127–40. https://doi.org/10.1097/00005650-198102000-00001.
5. Khan AA. An integrated approach to measuring potential spatial access tohealth care services. Socio-Econ Plan Sci. 1992;26(4):275–87. https://doi.org/10.1016/0038-0121(92)90004-O.
6. Luo W, Wang F. Measures of spatial accessibility to health care in a GISenvironment: synthesis and a case study in the Chicago region. EnvironPlann B Plann Des. 2003;30(6):865–84. https://doi.org/10.1068/b29120.
7. Aday LA, Andersen RM. Equity of access to medical care: a conceptual andempirical overview. Med Care. 1981;19(Supplement):4–27. https://doi.org/10.1097/00005650-198112001-00004.
8. Bissonnette L, Wilson K, Bell S, Shah TI. Neighbourhoods and potentialaccess to health acre: the role of spatial and aspatial factors. Health Place.2012;18(4):841–53. https://doi.org/10.1016/j.healthplace.2012.03.007.
9. Casas I, Delmelle E, Delmelle EC. Potential versus revealed access to careduring a dengue fever outbreak. J Transp Health. 2017;4:18–29. https://doi.org/10.1016/j.jth.2016.08.001.
10. Apparicio P, Gelb J, Dube AS, Kingham S, Gauvin L, Robitaille E. Theapproaches to measuring the potential spatial access to urban healthservices revisited: distance types and aggregation-error issues. Int J HealthGeogr. 2017;16(1):32. https://doi.org/10.1186/s12942-017-0105-9.
11. Weibull JW. An axiomatic approach to the measurement of accessibility. ResSci Urban Econ. 1976;6(4):357–79. https://doi.org/10.1016/0166-0462(76)90031-4.
12. Luo W, Qi Y. An enhanced two-step floating catchment area (E2SFCA)method for measuring spatial accessibility to primary care physicians. HealthPlace. 2009;15(4):1100–7. https://doi.org/10.1016/j.healthplace.2009.06.002.
13. Wan N, Zou B. A three-step floating catchment area method for analyzingspatial access to health services. Int J Georg Inf Sci. 2012;26(6):1073–89.https://doi.org/10.1080/13658816.2011.624987.
14. Delamater PL. Spatial accessibility in suboptimally configured health caresystems: a modified two-step floating catchment area (M2SFCA) metric.Health Place. 2013;24:30–43. https://doi.org/10.1016/j.healthplace.2013.07.012.
15. Langford M, Higgs G, Fry R. Multi-model two-step floating catchment areaanalysis of primary health care accessibility. Health Place. 2016;38:70–81.https://doi.org/10.1016/j.healthplace.2015.11.007.
16. Henning-Smith C, Evenson A, Kozhimannil K, Moscovice I. Geographicvariation in transportation concerns and adaptations to travel-limitinghealth conditions in the United States. J Transp Health. 2018;8:137–45.https://doi.org/10.1016/j.jth.2017.11.146.
17. Lin Y, Wan N, Sheets S, Gong X, Davies A. A multi-modal relative spatialaccess assessment approach to measure spatial accessibility to primary careproviders. Int J Health Geogr. 2018;17(1):33. https://doi.org/10.1186/s12942-018-0153-9.
18. Field K. Measuring the need for primary health care: an index of relativedisadvantage. Appl Geogr. 2000;20(4):305–32. https://doi.org/10.1016/S0143-6228(00)00015-1.
19. Wang F, Luo W. Assessing spatial and nonspatial factors for healthcareaccess: towards an integrated approach to defining health professionalshortage areas. Health Place. 2005;11(2):131–46. https://doi.org/10.1016/j.healthplace.2004.02.003.
20. Khakh AK, Fast V. Measuring spatial accessibility of healthcare services inCalgary (poster). J Transp Health. 2017;7:S13–4. https://doi.org/10.1016/j.jth.2017.11.023.
21. Frew R, Higgs G, Harding J, Langford M. Investigating geospatial datausability from a health geography perspective using sensitivity analysis: theexample of potential accessibility to primary healthcare. J Transp Health.2017;6:128–43. https://doi.org/10.1016/j.jth.2017.03.013.
22. Shen Q. Location characteristics of inner-city neighborhoods andemployment accessibility of low-wage workers. Environ Plan B Urban AnalCity Sci. 1998;25:345–65.
23. Grzybowski S, Stoll K, Kornelsen J. Distance matters: a population basedstudy examining access to maternity services for rural women. BMC HealthServ Res. 2011;11(1):147. https://doi.org/10.1186/1472-6963-11-147.
24. Kornelsen J, Stoll K, Grzybowski S. Stress and anxiety associated with lack ofaccess to maternity services for rural parturient women. Aust J Rural Health.2011;19(1):9–14. https://doi.org/10.1111/j.1440-1584.2010.01170.x.
25. Im GJ, Choi JW, Lim SM, Seo KH, Pakr YH. A survey of the medicalpractitioners’ offices in Korea 2011. J Korean Med Sci. 2012;55:390–403.
26. Jung H, Lee T, Kwak MY, Kim MJ, Shin HS, Lee T, Hwang KS, Kim YN, Jang H,Hwang JY, Eun SJ. Monitoring medically under-served areas in Korea. The
Jang BMC Health Services Research (2021) 21:660 Page 10 of 11

Korean ministry of health and welfare report. 2016. http://www.ppm.or.kr/board/thumbnailList.do?MENUID=A04030000, Accessed Jan 1, 2021.
27. Thurstone LL. Psychophysical analysis. Amer J Psychol. 1927;38(3):368–89.https://doi.org/10.2307/1415006.
28. Marschak T. Centralization and decentralization in economic organization.Econometrica. 1959;27(3):399–430. https://doi.org/10.2307/1909469.
29. DL MF. Conditional logit analysis of qualitative choice behavior. In:Zarembka P, editor. Frontiers in econometrics. New York: Academic Press;1993. p. 105–42.
30. Hwang K, Jang H, Lee T, Kim M, Shin H, Lee T. In: Cappanera P, Li J, Matta A,Sahin E, Vandaele N, Visintin F, editors. A choice model for estimatingrealized accessibility: case study for obstetrics care in Korea. Proceedings ofthe International Conference on Health Care Systems Engineering. Cham:Springer; 2017.
31. Akin J, Hutchinson P. Health-care facility choice and the phenomenon ofbypassing. Health Policy Plan. 1999;14(2):135–51. https://doi.org/10.1093/heapol/14.2.135.
32. Tappis H, Koblinsky M, Doocy S, Warren N, Peters DH. Bypassing primarycare facilities for childbirth: findings from a multilevel analysis of skilled birthattendance determinants in Afghanistan. J Midwifery Womens Health. 2016;61(2):185–95. https://doi.org/10.1111/jmwh.12359.
Publisher’s NoteSpringer Nature remains neutral with regard to jurisdictional claims inpublished maps and institutional affiliations.
Jang BMC Health Services Research (2021) 21:660 Page 11 of 11