Embed Size (px)
Citation preview

A model for joint choice of daily activity pattern types
of household members
MARK BRADLEY1,* & PETER VOVSHA2
1Mark Bradley Research & Consulting, 524 Arroyo Ave., Santa Barbara, CA, 93109, USA;2PB Consult, Parsons Brinckerhoff, Inc., 5 Penn Plaza, 17 Floor, New York, NY, 10001, USA
(*Author for correspondence, E-mail: [email protected])
Key words: daily activity pattern, intra-household interactions
Abstract. Intra-household interactions constitute an important aspect in modeling activity
and travel-related decisions. Recognition of this importance has recently produced a growing
body of research on various aspects of modeling intra-household interactions and group
decision-making mechanisms as well as first attempts to incorporate intra-household inter-
actions in regional travel demand models. The previously published research works were
mostly focused on time allocation aspect and less on generation of activity episodes, trips,
and travel tours that are necessary units for compatibility with regional travel demand
models. Also, most of the approaches were limited to household heads only and did not
consider explicitly the other household members as acting agents in the intra-household
decision making. A model is proposed for joint choice of daily activity pattern (DAP) types
for all household members that explicitly takes into account added group-wise utilities of
joint participation in the same activity. The model is based on the aggregate description of
individual DAP types by three main categories – mandatory travel pattern, non-mandatory
travel pattern, and at-home pattern. Important intra-household interactions can be captured
already at this aggregate level. A choice structure considers all possible combinations of
DAPs of all household members as alternatives. Utility function of each alternative includes
components corresponding to each individual DAP type as well as group-wise interaction
terms that correspond to joint choice of the same pattern by several household members.
Statistical analysis of intra-household interactions and estimation results of the choice model
are presented. The model estimation has confirmed a strong added utility of joint choice of
the same pattern for such person types as non-worker or part time worker in combination
with child, two retired persons, two children, and others. The proposed model represents a
part of the advanced regional model system being developed for the Atlanta Regional
Commission.
Abbreviation: DAP: daily activity pattern type; FW: full-time worker; H: individual
staying-at-home daily activity pattern type; HH: jointly chosen staying-at-home dailyactivity pattern type for two persons; M: individual mandatory daily activity patterntype; MM: jointly chosen mandatory daily activity pattern type for two persons; MMM:
jointly chosen mandatory daily activity pattern type for three persons; N: individualnon-mandatory-travel daily activity pattern type; NN: jointly chosen non-mandatory-travel daily activity pattern type for two persons; NNN: jointly chosen non-mandatory-travel daily activity pattern type for three persons; NW: non-worker (under 65); PS:
preschool child of age (under 6 years); PW: part-time worker; RT: retired person (65 or
Transportation (2005) 32: 545–571 � Springer 2005DOI: 10.1007/s11116-005-5761-0
older); SD: school child of driving age (16 or older); SP: school child of pre-driving age
(6–15 years); US: university student.
1. Introduction
Intra-household interactions constitute an important aspect in modeling
activity and travel-related decisions. Recognition of this importance has
recently produced a growing body of research on various aspects of modeling
intra-household interactions and group decision making mechanisms as well
as first attempts to incorporate intra-household interactions in regional tra-
vel demand models.
The previously published research works were mostly focused on intra-
household time allocation between activity types and household members.
Much less effort was made on understanding and modeling of generation of
activity episodes, trips, and travel tours. In particular, the works of Borgers
et al. (2002), Ettema et al. (2004), Fujii et al. (1999), Gliebe and Koppelman
(2002), Golob and MacNally (1997), Goulias (2002), Meka et al. (2002),
Schwanen et al. (2004), Townsend (1987), Zhang et al. (2002), Zhang et al.
(2004), Zhang and Fujiwara (2002) give examples of models for time alloca-
tion between various type of activities and household members. Though
these works provide valuable insights into the intra-household decision-mak-
ing mechanism they do not directly address requirements of the structure of
travel demand models that are based on discrete units of travel and discrete
choice modeling technique.
Most of the approaches including those proposed by Borgers et al.
(2002), Ettema et al. (2004), Gliebe and Koppelman (2002), Golob and Mac-
Nally (1997), Schwanen et al. (2004), Townsend (1987), Simma and Axhau-
sen (2001), Scott and Kanaroglou (2002), Srinivasan and Bhat (2004) were
limited to household heads only and did not consider explicitly the other
household members as active agents in the intra-household decision making.
In most cases, the model structure was essentially built on the assumption of
a ‘‘binary’’ household and could not be easily extended to incorporate more
than two interacting agents. This is another limitation that has to be lifted in
order to integrate intra-household interactions in the framework of regional
travel demand models.
The current paper presents an approach for joint modeling of daily activ-
ity pattern types for all household members. This aspect of intra-household
interactions relates to the most important aggregate attributes of individual
activity/travel behavior. The proposed model represents a part of the model
system currently being developed for the Atlanta Regional Commission
(ARC). The adopted structure represents a further development of the
individual daily activity pattern (DAP) type model applied in the framework
546

of the Mid-Ohio Regional Planning Commission (MORPC) and reported by
Vovsha et al. (2004a). The most important advancement of the ARC version
of the DAP type choice model compared to the MORPC version is that all
household members are modeled simultaneously while the MORPC version
was based on the sequential modeling of household members by a
predetermined order by person types.
The paper is organized as follows. The next section presents a classifica-
tion of intra-household interactions where coordination of DAP types is
considered as the upper-level interaction. The section that follows presents
the choice model structure and supporting statistical analysis of observed
individual and joint DAP types based on the recent household travel survey
undertaken for ARC. The next section presents the model estimation results.
The section that follows explains the placement of the developed model in
the framework of the regional models system. The last section contains
concluding remarks and directions for further research.
2. Classification of intra-household interactions
According to the general methodological approach adopted for the MORPC
and ARC model systems, intra-household coordination mechanism can be
stratified by three following principal layers of interactions:
1. Coordinated principal daily pattern types at the entire-day level. We con-
sider three principal daily pattern types: (1) mandatory (including work,
university or school activities, and possibly including additional out-of-
home non-mandatory activities); (2) non-mandatory travel (including only
non-mandatory activities, at least one of which is out of home); and (3)
staying at home (or absence from town) for the entire day. Statistical evi-
dence shows strong coordination between household members at this
principal level, resulting in such decisions as staying home for child care;
coordinated work commutes; and household members taking time off
together for major shopping trips, family events and vacations.
2. Episodic joint activity and travel. Even if household members have chosen
different pattern types (for example, one mandatory and the other non-
mandatory) they may participate in shared activities and/or joint travel
arrangements. We use a classification of typical joint activity and travel
types that support the development of operational choice models Vovsha
et al. (2004b). In particular, we distinguish fully joint travel tours for
shared activities from partially joint tours, in which household members
share transportation without participation in the same activity.
3. Intra-household generation and allocation of maintenance activities. Many
of the routine household maintenance activities (shopping, banking, visit-
547

ing post office, etc) are implemented and scheduled individually; however,
generation of such an activity and its allocation to a particular household
member is a function of a household decision-making process (Srinivasan
& Bhat 2004). Thus, these activities require an intra-household interaction
mechanism to be properly understood and modeled. Maintenance task
allocation mechanism may not be observed completely within a 1-day fra-
mework since most of the maintenance tasks have cycles longer than 1 day.
It is also assumed that all else being equal, a general hierarchy of intra-
household decision-making follows these three layers. Entire-day patterns
types are predicted first. Then, conditional upon the chosen daily pattern
types for each household member, the decisions regarding joint activities and
travel are made, and maintenance activities are generated and allocated to
persons. These assumptions provide a schematic and simplified view on the
extremely complicated real-world variety of travel behavior of the members
of a household and numerous interactions between them. This view,
however, has two important features:
• The proposed structure gives a good coverage for most frequent cases of
intra-household interactions observed in the household travel surveys; also
many complicated cases of joint activities and travel arrangement that do
not fall directly under one of the proposed categories, still should be only
slightly simplified or split in order to be brought in line with the proposed
structure.
• The propose structure serves as a constructive framework for derivation of
operational choice models that can be estimated based on available house-
hold travel surveys and applied in a framework of regional travel demand
models.
One of the possible ways to consider all household members rather than
household heads is to model different persons sequentially by conditioning
choice of the DAP of some household members by choices made by the
other household members. This approach to sequential modeling of DAP
types for all household members was adopted in the MORPC model system
(Vovsha et al. (2004a). This approach requires a priori fixing of a certain
order of processing persons within the household that constitutes a
drawback. The current paper represents an attempt to develop a model that
treats all household members simultaneously and taking into account all
possible cross-impacts of different household members on each other.
A general comparison of sequential and simultaneous choice structures
for modeling intra-household interactions was outlined in Vovsha et al.
(2004b). In a context of modeling DAP, it was shown that simultaneity is
essential only across limited number of aggregate dimensions where intra-
548

household coordination is strong. Numerous other DAP details can be
added by the subsequent set of models and either considered individually for
each person or as joint activity/travel episodes conditional upon the chosen
DAP types for each household member. This opens a way to formulate a
simultaneous choice model where the number of alternative DAP types for
each person is limited and thus, all possible combinations of them for all
household members still result in a manageable choice structure.
3. Coordinated DAP types of household members: choice structure
and statistical analysis
Classification of DAP types can be done in many different ways. DAP defi-
nition normally includes a list of activities undertaken by the person in the
course of entire day with some predetermined hierarchy of the activity types.
DAP may also include activity sequencing/scheduling attributes, activity
location (at-home versus out-of-home) as well as travel-related characteristics
(for example, number and structure of the travel tours).
The definition adopted for the current research is subject to the purpose
of joint modeling of DAP types of all household members as well as the
overall structure of the model system being developed for ARC. Similar to
the model system developed for MORPC (Vovsha et al. 2004a), in the ARC
model system the model for joint DAP types plays a role of the leading day-
level component that is designed to define the most important aggregate
characteristics of the activity/travel behavior as well as capture important
intra-household interactions at this level.
Individual DAP is classified by three main types that are mutually exclu-
sive and collectively exhaustive:
• Mandatory pattern (M) that includes at least one of the three mandatory
activities – work, university, or school implemented out of home. This con-
stitutes either a workday or university/school day, and may include addi-
tional non-mandatory activities such as separate home based tours or
intermediate stops on the mandatory tours.
• Non-mandatory pattern (N) that includes only maintenance and
discretionary out-of-home activities and at least one associated travel tour.
• At-home pattern (H) that includes only in-home activities. At the current
stage of model development, at home patterns are not distinguished by any
specific activity (work at home, take care of child, being sick, etc). Also
cases with complete absence from town (vacation, business travel) were
combined with this category. (There are not enough observations to war-
rant treating this as a separate pattern type, but it is nevertheless important
to include the possibility of absence from town in forecasting models.) The
549

trinary specification of individual DAP types opens a way to formulate a
model of joint choice of DAP types for all household members.
3.1. Choice structure
The choice structure adopted for the current research treats all possible com-
binations of individual DAP types for up to five household members in an
explicit way. This covers 98% of the observed households. For larger house-
holds with six or more members that constitute 2% of the observed cases,
the model refers to the five representative members while the rest of the
household members is modeled sequentially and conditional upon the chosen
DAP types for the five representatives.
The choice structure formally includes 363 alternatives that correspond to
all possible household sizes from 1 to 5:
1. Three alternatives for one-person households,
2. 3 · 3=9 alternatives for two-person households,
3. 3 · 3 · 3=27 alternatives for three-person households,
4. 3 · 3 · 3 · 3=81 alternative for four-person households,
5. 3 · 3 · 3 · 3 · 3=243 alternatives for five-person households.
Note that with this structure, the size of the model is very sensitive to the
number of basic DAP types considered. A model with four basic DAP types –
e.g. treating a combination of mandatory and non-mandatory activities as a
fourth pattern type – would require 4+16+64+256+1024=1364 alterna-
tives, almost four times as many alternatives as the model for three DAP types.
3.2. Observed frequency of individual DAP types
Table 1 below presents the observed frequency of individual DAP types for
different person categories for a regular workday that was tabulated based
on the data from the last activity-travel household survey undertaken in the
Atlanta region in 2001. The survey scope included 8069 households each sur-
veyed for two consecutive days with respect to all activities and travel under-
taken by all household members. After the exclusion of weekends, the survey
provided 13,760 valid household-days and 31,243 valid person-days for anal-
ysis of DAP types.
For purposes of descriptive analysis and the model specification, all per-
sons were classified into the following eight mutually exclusive and collec-
tively exhaustive person types:
1. FW – Full-time worker, including adults who have reported their main
occupation as full-time work (35 h or more a week) – 40.8% of the sur-
veyed persons.
550

2. PW – Part-time worker, including adults who have reported their main
occupation as part-time work (less than 35 h a week) – 5.3%.
3. US – University students, including all adults (18 or older) who have
reported their main occupation as full-time studying in university/college
even if they also work part time – 3.3%.
4. NW – Non-working adult, including persons who have not reported any
regular work or studying activity (homemakers or temporarily unem-
ployed) and under 65 years old – 12.9%.
5. RT – ‘‘Retired’’, including any non-working adult of 65 years or older –
7.5%.
6. SD – Schoolchild of driving age (16+), distinguished from younger school
children because access to a car has a significant impact on the activity/
travel behavior – 3.2%.
7. SP – Schoolchild of pre-driving age (6–15) – 10.1%.
8. PS – Pre-school age child of 0 to 5 years old – 7.4%.
The relative frequency of the DAP types is a strong function of the per-
son type. In particular person types non-workers (NW) and retired (RT) are
logically characterized by a very low percentage of mandatory patterns and
high percentage of non-mandatory and at-home patterns. In the opposite
way, person types FW (full-time workers) and SD and SP (school children)
are characterized by a very high percentage of mandatory patterns and low
percentage of non-mandatory and at-home patterns.
Since mandatory activities included all work, school, and university/col-
lege activities, every person type is characterized by a certain non-zero per-
centage of observed mandatory DAPs. School activities included day care
for preschool children. Mandatory activity is of course a different category
for preschool children, but it still preserves many features of conventional
Table 1. Observed frequency of individual DAP types.
Person type Total days Absolute frequency Relative frequency (%)
M N K M N H
1. FW – work full 14,559 11,844 1854 861 81.4 12.7 5.9
2. PW – work part 1792 1000 607 185 55.8 33.9 10.3
3. US – univ stud 1195 729 343 123 61.0 28.7 10.3
4. NW – non-work 4017 158 2681 1178 3.9 66.7 29.3
5. RT – retired 2894 73 1704 1117 2.5 58.9 38.6
6. SD – sch-drive 825 674 104 47 81.7 12.6 5.7
7. SP – sch-predr 3656 2834 600 222 77.5 16.4 6.1
8. PS – preschool 2305 750 753 802 32.5 32.7 34.8
Total 31,243 18,062 8646 4535 57.8 27.7 14.5
551
work/school activities – fixed schedule, predetermined location, long dura-
tion, normally chronologically first position in the DAP, etc.
The obvious strong dependence of the choice probability of the particular
DAP on the person type leads to the forming the entire-household choice
utility as a composition of person type-specific utility components. However,
the previously implemented analysis and estimation of the sequential DAP
choice model for MORPC has shown that there are strong interactions
between household members and preferences to implement certain patterns
jointly (Vovsha et al. 2004a). This means that the entire-household DAP
choice utility should have interaction terms, i.e. added utility of joint activity
participation on the top of the individual DAP choice utilities. In order to
understand better the structure of intra-household interactions at the level of
DAP type choices we analyze below the observed frequencies of pair-wise
and triple-wise combinations of individual DAP types.
3.3. Observed frequency of pair-wise DAP combinations
Table 2 below presents the observed frequency of pair-wise DAP combina-
tions by person types. There are 3 · 3=9 possible DAP combinations for
each of the 36 ordered pairs of eight person types. In order to reduce the
number of statistics to analyze we focus on two joint DAP types in particu-
lar – joint non-mandatory DAP (NN) and joint staying at home (HH) –
where we expect the added utility of joint participation in the same activity
should manifest itself in that the relative frequency of joint patterns would
be higher than just a product of the correspondent relative individual fre-
quencies shown in Table 1.
Table 2 is organized in the following way: For each pair of person types
it shows the absolute and relative frequency of the joint patterns NN and
HH. Then the expected relative frequency of the joint patterns NN and HH
is calculated as a product of individual frequencies (from Table 1). Then the
bias (observed versus expected relative frequency) is calculated. Finally, the
person type pairs are sorted by NN bias in order to highlight the most fre-
quent and strongest intra-household interactions.
Joint DAP means a coordinated choice of the same DAP type by two
household members, but it is not necessarily joint in the sense that the whole
activity-travel pattern or some of its components are pursued together.
It does not necessarily imply shared activities or joint travel arrangements,
though probability of shared activities and joint travel arrangements is much
higher for coordinated patterns; that is captured by the subsequent models
in the model system hierarchy.
552

In general, it should be noted that absolute majority of person type pairs
with only few exceptions are characterized by positive added utility of joint
DAP types. There are several person type pairs where intra-household inter-
actions are especially strong both in terms of the absolute number of the
observed joint patterns and significance of the relative positive biases. The
following important interactions should be mentioned:
• Joint non-mandatory and at-home patterns for person types NW and
pre-school child (PS). This is a logical reflection on the presence of a young
child and caretaking parent (most frequently, female) who is (most fre-
quently, temporary) unemployed.
• Joint non-mandatory and at-home patterns for two persons of type RT
(retired). This is also a logical combination of activities of two retired per-
sons in (most frequently) the framework of a household at the last lifecycle
stage. They normally do not have mandatory activities and tend to coordi-
nate both out-of-home and in-home non-mandatory activities.
• Joint non-mandatory and at-home patterns for person types PW and PS.
This represents a caretaking intra-household mechanism similar to the
‘‘non-worker – preschool child’’ mechanism described above with a strong
Table 2. Observed frequency of pair-wise DAP combinations.
Person types Absolute frequency Relative fre-
quency (%)
Expected fre-
quency (%)
Bias (%)
Total NN HH NN HH NN HH NN HH
NW PS 1207 450 309 37.3 25.6 21.8 10.2 15.5 15.4
RT RT 715 351 175 49.1 24.5 34.7 14.9 14.4 9.6
PW PS 406 98 45 24.1 11.1 11.1 3.6 13.0 7.5
PS PS 699 164 215 23.5 30.8 10.7 12.1 12.8 18.7
SP SP 1426 139 57 9.7 4.0 2.7 0.4 7.0 3.6
PW SP 839 89 17 10.6 2.0 5.6 0.6 5.0 1.4
SP PS 1071 107 66 10.0 6.2 5.4 2.1 4.6 4.1
SD SP 458 29 8 6.3 1.7 2.1 0.3 4.2 1.4
NW SP 1308 184 49 14.1 3.7 10.9 1.8 3.2 1.9
FW PS 2802 195 109 7.0 3.9 4.2 2.1 2.8 1.8
FW FW 4592 181 62 3.9 1.4 1.6 0.3 2.3 1.1
FW PW 1279 84 13 6.6 1.0 4.3 0.6 2.3 0.4
FW SP 4557 178 60 3.9 1.3 2.1 0.4 1.8 0.9
NW NW 443 204 116 46.0 26.2 44.5 8.6 1.5 17.6
FW US 910 45 12 4.9 1.3 3.6 0.6 1.3 0.7
FW SD 1080 23 18 2.1 1.7 1.6 0.3 0.5 1.4
FW RT 693 53 48 7.6 6.9 7.5 2.3 0.1 4.6
FW NW 2702 227 106 8.4 3.9 8.5 1.7 )0.1 2.2
Shaded areas corresponds to the most frequent intra-household interactions in both absolute and
relative terms. Table includes all two-way person-type combinations with 400+ observations.
553
gender bias towards female PWs. However, in this case, the caretaking par-
ent traded her/his work activity only partially.
• Joint non-mandatory and at-home patterns for two persons of type PS. In
households with two or more PS, the corresponding arrangements regard-
ing their day care, staying at home, or taking on tour for some other activ-
ity are frequently coordinated and made by the same adult household
member. These person type pairs as well as other numerous but less signifi-
cant interactions, represent potential interaction terms that should be
included into the joint choice utility function and tested statistically during
the model estimation.
3.4. Observed frequency of three-way DAP combinations
Table 3 below presents the observed frequency of three-way DAP combina-
tions by person type combinations. There are 3 · 3 · 3=27 possible DAP
combinations for each of the 120 ordered three-way combinations of eight
person types. We again focus on two particular joint DAP types – joint non-
mandatory DAP (NNN) and joint staying at home (HHH).
Table 3 is organized in the way similar to the Table 2. For each three-
way combination of person types, it shows the absolute and relative fre-
quency of the joint patterns NNN and HHH, the expected relative frequency
of the joint patterns NNN and HHH calculated as a product of individual
frequencies, and the bias of the observed versus expected relative frequency.
Finally, the person type combinations are sorted by the absolute HHH fre-
quency and only the first 20 triples are shown in order to highlight the most
frequent and strongest intra-household interactions.
Similar to the previously discussed pair-wise interactions, most of the
triple-wise interactions are also characterized with positive biases that are
manifestations of the added utility of participation in joint activities and
intra-household coordination. It should be noted that many of the person
type triples are characterized by a high value of some of the biases but a
very low absolute frequency because the sub-sample of households that
actually contains this triple of person types is small. Several other triple-
wise combinations like combinations of non-working adult types NW and
RT can be logically explained as a composition of pair-wise effects since
each person type triple can be broken into three pairs.
There are however several person type triples that are characterized by
significant absolute frequency of both joint patterns (NNN and HHH), sig-
nificant positive biases in relative terms, as well as can be better explained
logically as a group-wise effect than just a composition of pair-wise effects.
Among them combinations of the most frequent child caretaker of type NW
554
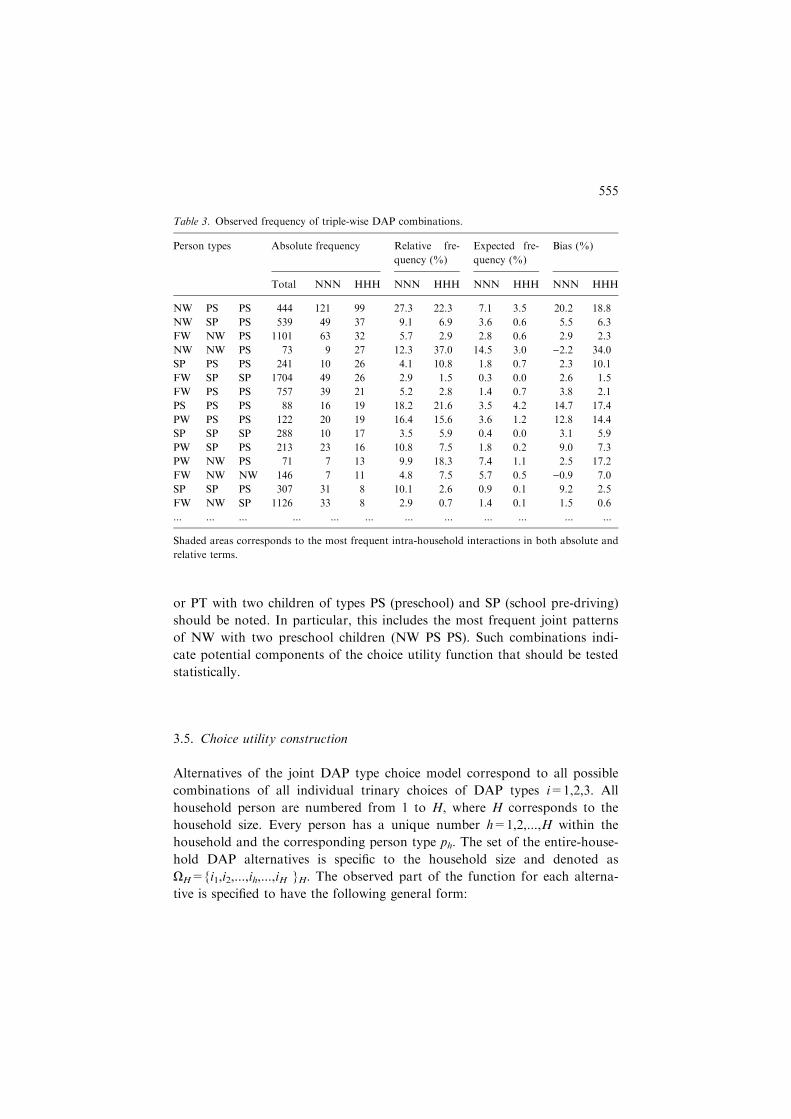
or PT with two children of types PS (preschool) and SP (school pre-driving)
should be noted. In particular, this includes the most frequent joint patterns
of NW with two preschool children (NW PS PS). Such combinations indi-
cate potential components of the choice utility function that should be tested
statistically.
3.5. Choice utility construction
Alternatives of the joint DAP type choice model correspond to all possible
combinations of all individual trinary choices of DAP types i=1,2,3. All
household person are numbered from 1 to H, where H corresponds to the
household size. Every person has a unique number h=1,2,...,H within the
household and the corresponding person type ph. The set of the entire-house-
hold DAP alternatives is specific to the household size and denoted as
XH={i1,i2,...,ih,...,iH }H. The observed part of the function for each alterna-
tive is specified to have the following general form:
Table 3. Observed frequency of triple-wise DAP combinations.
Person types Absolute frequency Relative fre-
quency (%)
Expected fre-
quency (%)
Bias (%)
Total NNN HHH NNN HHH NNN HHH NNN HHH
NW PS PS 444 121 99 27.3 22.3 7.1 3.5 20.2 18.8
NW SP PS 539 49 37 9.1 6.9 3.6 0.6 5.5 6.3
FW NW PS 1101 63 32 5.7 2.9 2.8 0.6 2.9 2.3
NW NW PS 73 9 27 12.3 37.0 14.5 3.0 )2.2 34.0
SP PS PS 241 10 26 4.1 10.8 1.8 0.7 2.3 10.1
FW SP SP 1704 49 26 2.9 1.5 0.3 0.0 2.6 1.5
FW PS PS 757 39 21 5.2 2.8 1.4 0.7 3.8 2.1
PS PS PS 88 16 19 18.2 21.6 3.5 4.2 14.7 17.4
PW PS PS 122 20 19 16.4 15.6 3.6 1.2 12.8 14.4
SP SP SP 288 10 17 3.5 5.9 0.4 0.0 3.1 5.9
PW SP PS 213 23 16 10.8 7.5 1.8 0.2 9.0 7.3
PW NW PS 71 7 13 9.9 18.3 7.4 1.1 2.5 17.2
FW NW NW 146 7 11 4.8 7.5 5.7 0.5 )0.9 7.0
SP SP PS 307 31 8 10.1 2.6 0.9 0.1 9.2 2.5
FW NW SP 1126 33 8 2.9 0.7 1.4 0.1 1.5 0.6
... ... ... ... ... ... ... ... ... ... ... ...
Shaded areas corresponds to the most frequent intra-household interactions in both absolute and
relative terms.
555

Ui1...iH ¼XH
h¼1Vihph þ
XH
h1¼1
XH
h2¼h1þ1W ih1¼ih2ð Þph1ph2
þXH
h1¼1
XH
h2¼h1þ1
XH
h3¼h2þ1Z ih1¼ih2¼ih3ð Þph1ph2ph3 þ . . .
where Vihph is the individual component of choice of the DAP type i by the
household member h of the person type p, W ih1¼ih2ð Þph1ph2 the pair-wise com-
ponent of joint choice of DAP type i by household members h1 and h2 of
the person types p1 and p2 consequently, Z ih1¼ih2¼ih3ð Þph1ph2ph3 the triple-wise
component of joint choice of DAP i by household members h1, h2, and h3 of
the person types p1, p2, and p3 consequently.
The individual choice utility component is specified to have the following
form:
Vihph ¼X
k2Kckipxkh ð2Þ
where k 2 K is the a set of individual, household, and zonal attributes, xkhthe value of the k attribute for the h person, ckip the coefficient for the k
attribute in the i alternative utility that is assumed to be specific to the per-
son type p but generic across persons h.
The pair-wise choice utility component is specified as:
W ih1¼ih2ð Þph1ph2 ¼ wip1p2 �1; if ih1 ¼ ih2 ¼ i; ph1 ¼ p1; ph2 ¼ p20; otherwise
�ð3Þ
where wip1p2 is the coefficient (added utility) for a dummy variable that corre-
sponds to joint choice of the DAP type i by two household members of
types p1 and p2. The triple-wise choice utility component is assumed to have
the following form:
Z ih1¼ih2¼ih3ð Þph1ph2ph3 ¼zip1p2p3�1; if ih1¼ ih2¼ ih3¼ i;ph1¼p1;ph2¼p2;ph3¼p0; otherwise
�
ð4Þ
where zip1p2p3 is the coefficient (added utility) for a dummy variable that cor-
responds to joint choice of the DAP type i by three household members of
types p1, p2, and p3.
The model overall has only 24 individual utility components of the form
(2) to estimate for three individual DAP types and eight person types. Thus,
most of the person variables (like age or gender), household variables (like
income or car ownership) and zonal variables (like area type or accessibility
to certain land uses) were tested in the individual utility component.
556

The number of potential pair-wise and triple-wise components is much
higher. For pair-wise components we have three joint DAP types (MM,
NN, HH) by 36 ordered person type pairs that comes to 108. For triple-
wise components we have three joint DAP types (MMM, NNN, HHH) by
120 ordered person type triples that comes to 360. Thus, it was decided at
the current stage of the model development that all group-wise compo-
nents would be estimated as alternative and person type specific dummies,
without interacting them with the other person, household, or zonal
attributes.
In the adopted structure, the individual DAP utility component is speci-
fied to account for most of the exogenous variables, while group-wise com-
ponents are intended to capture intra-household interactions that are
specified to be person-type specific and generic across other dimensions. This
limitation was adopted in order to make the choice model technically man-
ageable in estimation and application.
Any attempt to parameterize interaction terms with the other variables,
for example making intra-household interactions differential by three resi-
dential urban types (urban, suburban, and rural) would triple the number of
constants to estimate and also number of terms in all utility expressions. In
several attempts we ran out of the ALOGIT limits. In some other cases we
found that the sub-samples of actually chosen cases wore too thin.
In future research, this limitation will be lifted. In particular, several pub-
lished research works indicate on dependence of intensity of intra-household
interactions on spatial environment of the residential place (Ettema et al.
2004; Schwanen et al. 2004). This effect can be explored with the proposed
choice model structure. It will require introduction of area type and accessi-
bility variables in the interaction terms (3) and (4). This represents an inter-
esting avenue for future research.
The choice utility expression (1) can also include higher-order terms (like
quadruple-wise combinations, etc) that are relevant for households of size
four or larger. For this terms, even making them person-type specific like
pair-wise and triple-wise expressions (3) and (4), would require thousands of
potential combinations to consider. For this reason, these terms are kept
completely generic in a form of household-size specific dummies that indicate
on the choice of the same DAP types by all household members. For each
household with four or more members, three dummy variables were tested
that corresponded to three uniform choices of all household members
(MMMM..., NNNN..., and HHHH...)
In the estimation procedure, pair-wise terms were tested on the top of the
statistically successful individual terms, triple-wise terms were tested on the
top of statistically successful individual and pair-wise terms, and so forth,
557

whatever best explains intra-household interactions both statistically and
meaningfully. All else being equal, the lower-level terms were given a first
priority since they are simple in the model estimation and application. High-
er-level terms were adopted only if they had added significant explanatory
power on the top of the successful lower-level terms.
The proposed utility form resulted in a quite parsimonious structure to
estimate despite a large set of alternatives. The model does not have alterna-
tive-specific variables per se. It has 24 basic individual utility expressions
with stratified constants, 36 pair-wise person type interaction terms, and sev-
eral additional triple-wise and high order terms that proved to be significant.
In terms of the number of coefficients to estimate, it is not fundamentally
different from many other activity-based models. It was successfully esti-
mated on data from the ARC regional travel survey that is of a usual size
for metropolitan areas.
4. Estimation results
The logit estimation results for the model specification described above are
shown in Table 4. The coefficients are shown in three columns, related to
mandatory, non-mandatory and home day patterns. The first page of the
table and the top of the second page show the variables included in the indi-
vidual utility component. Some of the key findings are:
• Person type: The person-type-specific constants indicate that, all else equal,
FW and students are most likely to carry out mandatory patterns, while
NWs, retired and preschoolers are least likely to carry out either manda-
tory or non-mandatory travel patterns.
• Gender: The interactions of person-type with gender show that among full
time and PWs, females are less likely than males to go to work on a given
day, while among retired persons, females are more likely than males to
stay home.
• Age: Among very young children under age 6, the likelihood of going to
(pre)school increases with age. Among children age 6–15, the likelihood of
going to school is somewhat lower in the age categories 6–9 and 13–15,
relative to age 10–12. There are several reasons why school children may
miss school on a normal weekday. First of all, it can be sickness with
staying at home (or visiting doctor, or being hospitalized). Statistical analy-
sis has shown that there is an age impact on frequency of missing school
because of sickness – younger kids just get sick more frequently. Another
reason for missing school can be participation in (frequently not official)
work/non-work activity or just skipping classes. That is more frequent for
558

Table 4. Model estimation results.
Utility terms for three pattern types M – mandatory N – non-manda-
tory
H – home all day
Coefficient T-stat Coefficient T-stat Coefficient T-stat
Constants
FW – full-time worker 1.809 6.8 0.9652 17.2
PW – part-time worker )0.2456 )0.4 0.9854 6.6
US – university student 1.683 13.0 0.3354 1.0
NW – non-working adult )4.352 )3.8 )0.6639 )2.0RT – retired )7.499 )3.7 )0.5391 )1.5SD – driving age schoolchild 2.689 7.8 )0.03897 )0.1SP – pre-driving age schoolchild 3.105 20.5 0.5628 1.4
PS – pre-school child )0.2948 )1.8 )1.646 )4.1Age
PS – age 0–1 )0.4515 )3.3PS – age 4–5 0.6107 4.9
SP – age 6–9 )0.2943 )2.7SP – age 13–15 )0.7141 )4.1 )0.672 )3.7FW – age under 40 0.2091 4.9
RT – age over 80 0.7666 8.1
Gender
FW – female )0.1259 )2.9NW – female )0.743 )4.5RT – female 0.4769 5.0
Car ownership
NW – more cars than workers 0.6515 2.7 0.8168 8.4
RT – more cars than workers 2.992 3.0 1.056 8.2
PS – more cars than workers 0.2991 2.8
FW – fewer cars than workers 0.5039 4.5
NW – fewer cars than workers 0.8965 3.1
RT – fewer cars than workers 0.5496 1.3
SD – fewer cars than workers 0.6475 1.2
SP – fewer cars than workers 0.5862 2.8
PS – fewer cars than workers 0.5061 3.0
Household income
FW – income<$20,000 0.5313 4.3
RT – income<$20,000 0.533 5.7
PW – income<$20,000 0.3232 1.3
PW – income $50–100,000 )0.4032 )2.1PW – income>$100,000 0.4207 3.0 )0.3534 )1.3NW – income $50–100,000 )0.5602 )6.8NW – income>$100,000 )0.7188 )5.6SD – income<$20,000 1.307 3.0
SD – income $50–100,000 )0.5031 )1.2SD – income>$100,000 )2.046 )2.0PS – income $50–100,000 )0.5708 )5.9PS – income>$100,000 )0.6186 )4.3Accessibility
FW – peak accessibility to employment 0.1212 4.9
559

Table 4. Continued.
Utility terms for three pattern types M – mandatory N – non-manda-
tory
H – home all day
Coefficient T-stat Coefficient T-stat Coefficient T-stat
PW – peak accessibility to employment 0.2004 3.4
NW – peak accessibility to employment 0.2314 2.3
RT – peak accessibility to employment 0.2792 1.8
NW/RT/US – off-peak accessibility to retail 0.07207 2.4
SD/SP/PS – off-peak accessibility to retail 0.08233 2.3
FW/PW – usual work location is home )1.758 )23.1 0.1813 1.9
FW/PW – no usual work location )0.5935 )11.5SD/SP – no usual school location )0.866 )10.2Two way interactions
Full time · full time 0.141 2.5 1.123 12.3 1.626 11.2
Full time · part time 0.08845 1.0 0.4947 3.7 0.7407 2.4
Full time · university 0.4273 4.9 0.5523 3.4 1.183 3.9
Full time · NW 0.02186 0.2 0.9436 6.7
Full time · retired 0.3115 2.2 1.298 8.0
Full time · driving child 0.3842 3.9 0.4095 1.8 2.064 7.3
Full time · pre-driving child 0.2623 4.1 0.6008 5.1 1.501 9.7
Full time · PS 0.5118 5.9 0.751 6.6 0.9912 7.7
Part time · part time 1.135 5.0 1.032 3.0 0.8911 1.3
Part time · university 0.173 0.8 0.3355 1.0 1.642 2.8
Part time · NW 0.7477 3.8 0.7057 2.2
Part time · retired 0.09831 0.5 0.463 1.3
Part time · driving child 1.103 5.1 0.495 0.9 3.057 6.0
Part time · pre-driving child 0.3079 3.4 0.8984 6.8 0.7685 2.3
Part time · PS 0.5074 3.5 1.452 9.9 1.07 5.2
University · university 0.8726 6.0 1.054 5.3 1.018 1.4
University · NW 0.193 0.9 1.781 6.3
University · retired 0.4065 1.6 0.4835 0.8
University · driving child )0.0021 )0.1 1.62 4.0 1.546 1.5
University · pre-driving child 0.2975 2.1 0.5165 1.8 1.552 3.4
University · PS 0.2254 1.1 0.8973 4.1 1.34 5.2
NW · NW 0.6984 5.1 1.352 7.9
NW · retired 0.1864 1.4 1.209 8.2
NW · driving child 0.6801 3.2 0.5243 1.2
NW · pre-driving child 0.5646 5.1 0.8112 4.1
NW · PS 1.164 10.5 1.167 8.8
Retired · retired 0.7291 7.0 1.407 11.7
Retired · child (all ages) 0.2919 1.2 0.8632 3.2
Driving child · driving child 0.4794 1.4 1.512 2.2 2.198 2.5
Driving child · pre-driving child 0.5151 3.8 1.422 5.9 0.977 1.4
Driving child · PS 0.5516 1.4 1.273 2.4 1.467 2.7
Pre-driving child · pre-driving child 0.9731 8.8 1.553 11.3 2.8 15.8
Pre-driving child · PS 0.5961 5.0 0.6184 4.3 1.434 8.2
PS · PS 1.651 11.1 0.8771 5.7 1.378 9.5
Three way interactions***
FW · FW · FW 0.3133 3.4
560

older kids. A combination of these two factors may explain the result that
10–12 years old are the most frequent school attendees. Full time workers
under age 40 are more likely than older workers to go to work, while
retired persons age 80 or older are more likely to stay at home than youn-
ger retirees.
• Car ownership and competition: Non-working and retired adults are more
likely to attend a mandatory activity (typically school) or travel for non-
mandatory activities if there are more cars than there are workers in the
household. If on the other hand, there are fewer cars than workers in the
household, most person-types are more likely to stay at home all day, with
the strongest effect being found for non-working adults. Thus, non-working
adults are the most severely influenced by car competition.
• Household income: FWs, PWs, retirees and driving age students are all
more likely to stay home if they are in low income households (under
$20,000). PWs, non-working adults, driving age children and pre-school
children are all less likely to remain at home all day if they are in high
income households, with the effects generally stronger for incomes over
$100,000 than for incomes in the $50,000 to $100,000 range.
• Accessibility: All categories of adults are more likely to travel to mandatory
activities if the peak hour accessibility to employment from the residence
Table 4. Continued.
Utility terms for three pattern types M – mandatory N – non-manda-
tory
H – home all day
Coefficient T-stat Coefficient T-stat Coefficient T-stat
FW · FW · PW/NW 0.3495 2.4 0.4637 1.8
FW · FW · SP/PS
FW · PW/NW · PW/NW 0.3491 1.0 0.9573 2.8
FW · PW/NW · SP/PS 0.2939 1.4
FW · SP/PS · SP/PS 0.3553 2.3
PW/NW · PW/NW · PW/NW )1.386 )1.7 0.9881 2.9
PW/NW · PW/NW · SP/PS )0.8571 )3.8 0.4374 1.9
PW/NW · SP/PS · SP/PS 0.4747 2.4
SP/PS · SP/PS · SP/PS )0.3906 )2.1Interaction across all household members
Three person household – all same patterns )0.0671 )0.7 )0.3653 )2.5 )1.181 )6.0Four person household – all same patterns )0.6104 )2.6 )1.346 )4.0 )3.733 )7.5Five person household – all same patterns )1.528 )3.4 )3.453 )5.0 )8.621 )7.0Estimation statistics
Observations 13677
Alternatives 363
Final log-likelihood )19404.3Rho2(0) 0.422
Rho2(c) 0.264
561
zone is high. (Accessibility is measured using a function of attraction and tra-
vel impedance to all possible destinations, approximating the logsum from a
joint mode and destination choice model.) All person types except full time
and PWs are more likely to have non-mandatory travel patterns if the off-
peak accessibility to retail employment from the residence zone is high.
• Usual work and school locations: Workers, not surprisingly, are much less
likely to travel for mandatory activities if their usual workplace is at home.
They are also somewhat more likely to stay at home all day. Workers who
reported not having a usual workplace – e.g. construction workers with
variable work location – are less likely to have mandatory travel.
The second page of Table 4 shows the estimated two-way interactions
terms for each person-type combination, applied to alternatives where both
perform the same type of pattern (MM, NN or HH). The entire half-matrix
of 36 interaction terms was estimated for each pattern type, except for man-
datory patterns, where no interactions were estimated for NWs and retirees
who rarely choose such patterns. Some results worth noting include:
• All of the estimated two-way interactions are positive, except for a slightly
negative result for a combination of university student and driving age
child. The majority of the positive interactions are significantly different
from zero.
• For mandatory (M) patterns, the largest interaction is between two PS: If
one goes to pre-school, the other is likely to go also. There is also a large
interaction between two PWs, indicating that part-timers in the same
household tend to coordinate their schedules to work on the same days
(unless one needs to stay home to take care of children, which is captured
by other interaction terms). Other large positive interactions are between
two children of age 6–15, and between PWs and driving age children.
• For non-mandatory (N) travel patterns, the largest positive interactions are
among pairs of children, particularly children age 6 and older. There are
also large interactions between children under age 6 with PWs and non-
working adults: such young children often go everywhere with their care-
taker, and thus have the same DAP. The interactions between two FW or
two PWs are also fairly high: one is more likely to stay home from work
and do something else instead if the other does the same. Note that the
interactions between retired and all other person types are quite low.
Retired persons tend to interact mainly with other retired persons in the
household. Presence of two retired person indicate on an older household
with the corresponding changes in the life style.
• The interactions for stay at home (H) patterns are similar in many ways to
those for non-mandatory (N) patterns. The interactions are generally
562

highest for children, particular with other children and with NWs and
part-timers. Retirees tend to have smaller interactions. Students of driving
age (16+) show particularly strong interactions with working adults and
with other children in the same age group.
The final page of Table 4 shows the interactions terms for three-way per-
son type combinations and for all persons in households of three or more
people all choosing the same pattern. Because there are too many possible
three-way combinations to estimate all terms, we looked at interactions
between three specific groups of person types that seem to have similar
behavior in the descriptive analysis (see Table 3 above). These groups are:
• FW – Full time workers
• PW/NW – Part time workers plus Non-workers
• SP/PS – All children under age 16
In general, three-way interactions were only kept in the model if they
were significantly different from 0. The results are discussed below. In this
discussion, ‘‘non-workers’’ includes both PWs and non-working adults:
• Combinations of three adults including at least two FWs show strong
positive interactions for mandatory (MMM) patterns. If two of them go to
work, the third one will tend to go to work/school as well.
• Combinations of three children show a negative interaction for MMM pat-
terns. This may offset somewhat the positive interactions found for pairs of
children. (Note that each three-way interaction term is added in the utility
to three 2-way interactions – persons 1 and 2, persons 2 and 3, and persons
1 and 3.)
• For non-mandatory (NNN) patterns, there are negative interactions for 3
‘‘non-workers’’, and for 2 ‘‘non-workers’’ and a child. This may indicate
allocation of out-of-home maintenance activities across non-working
adults.
• Combinations of three adults that are a mix of FW and ‘‘non-workers’’
show a positive interaction for NNN. If two of them choose a non-manda-
tory pattern, the third is also more likely to.
• All three-way combinations that include 2 or more ‘‘non-workers’’ or at
least 1 ‘‘non-worker’’ and a child, are more likely than others to all choose
the stay at home pattern (HHH). These are the strongest three-way interactions
that were estimated, indicating that two-person interactions alone are not
sufficient to capture the phenomenon that certain types of household members
tend to stay at home with each other.
The final estimates in Table 4 are for combinations where everyone in
households of 3, 4 and 5 people choose the same pattern. The estimates are
563
all negative and increase in strength with household size and going from M
to N to H. These coefficients will tend to offset the positive two-way interac-
tions, which are additive across all household members and may become
somewhat redundant in the larger households. (Note that a three-person
household has 3 two-way interactions, while a four-person household has 6
and a five-person household has 10.)
Numerous statistical trials were implemented to capture a nested struc-
ture along such dimensions as dominant DAP types (for example, presence
of at least one mandatory DAP in the household versus the households
without a mandatory DAP) or joint DAP combinations (for example, pres-
ence of at least one pair-wise joint DAP of types MM, NN, or HH versus
the households without joint patterns), etc. In all tests the nesting coeffi-
cients proved to be not significantly different from 1.0. As a result, a multi-
nomial logit structure was finally adopted.
Additionally, attempts to capture scaling effects by introducing dummy
nodes with coefficients scaling each utility were implemented. In particular,
scaling by household size was tested, since in large households there are
more combinatorial opportunities to form joint pairs and triples of DAP
types. The scaling coefficients proved to be very close to 1.0 indicating that
the pair-wise and triple-wise components of the added utility of joint DAP
types are stable over the household sizes and generally exhibit an ‘‘additive’’
nature in large households.
Some discussion of the behavioral validity of the resulted multinomial
logit structure with numerous alternatives is needed since one can reasonably
argue that human decision-making probably does not proceed in this man-
ner. This is a very interesting aspect that relates to the fundamental view on
the choice model – is it a representation of a decision-making process or just
an analytical tool for predicting most probable outcomes? We are rather
inclined to consider the proposed model in the second sense and do not
claim that this structure fully captures the underlying decision-making pro-
cess. However, some process-based behavioral aspects can be associated with
the proposed model structure.
For example, though the choice structure includes hundreds of alterna-
tives, many of the utility components are individual with a limited addition
of interaction terms. Thus, in reality no one evaluate hundreds of utilities to
choose a joint pattern, but rather each person first evaluate three individual-
pattern-type utilities and has a preliminary choice, but then, the household
members interact and adjust their choices based on what the other members
choose. In this interpretation the model can even be applied iteratively
rather then simultaneously.
564
Another possible interpretation (in some sense, opposite to the first one)
is that persons in the household first make joint decisions (like going on
vacations together) and then make their individual choices conditional upon
the joint decisions made at the entire-household level. Following this behav-
ioral interpretation, we can view the current model as a hierarchical choice
structure where interactions occur at the upper level while individual choice
relate to the lower level.
Both approaches and the corresponding modifications of the model repre-
sent interesting avenues for future research.
5. Placement in the travel demand model system
The proposed model for joint choice of DAP types for household members
represents a part of the advanced regional travel demand model system
being currently developed for the Atlanta Regional Commission (ARC) by
PB Consult with participation of M. Bradley and J. Bowman. It has not
been applied at the time of writing, but will eventually be applied in the
framework of the ARC regional model system.
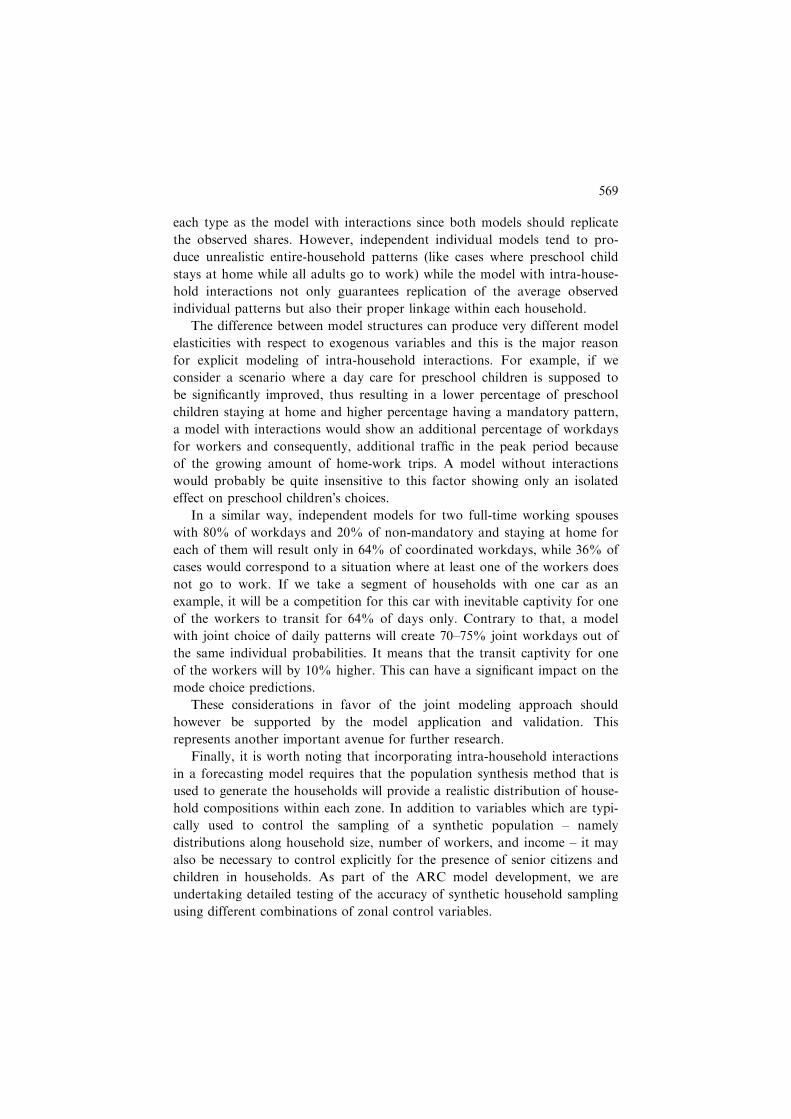
A general structure of the ARC model system is presented in Figure 1. It
represents a sequence of choice models applied in a conditional micro-simu-
lation fashion with numerous feedbacks between them. It is similar in many
respects to the structure of the previously developed MORPC model system
(Vovsha et al. 2004a), but it has several additional advanced features that
the MORPC system does not have.
The limited framework of the current paper allows for only a brief
description of the whole model system with the purpose of putting the joint
DAP in the general modeling context. The model system starts with the syn-
thesis of population by traffic analysis zones. The adopted population syn-
thesis technique allows for adjustment of multidimensional household
distributions to any set of zonal targets or marginal distributions as well as
adding any household-composition or person variables by matching the syn-
thesized households to observed households in PUMS. Then for each house-
hold, a set of longer-term choices is modeled that includes location of
regular workplace/school for each worker/student, as well as car-ownership
choice as a function of the household composition and residential location,
as well as the auto, walk and transit accessibility to the modeled work and
school locations of all household members.
The next sequence of models within the dotted lines refers to the opera-
tive day-level. The first two models relate to the most important aggregate
determinants of activity and travel behavior. This includes joint DAP type
choice for all household members that is described in the current paper in
565
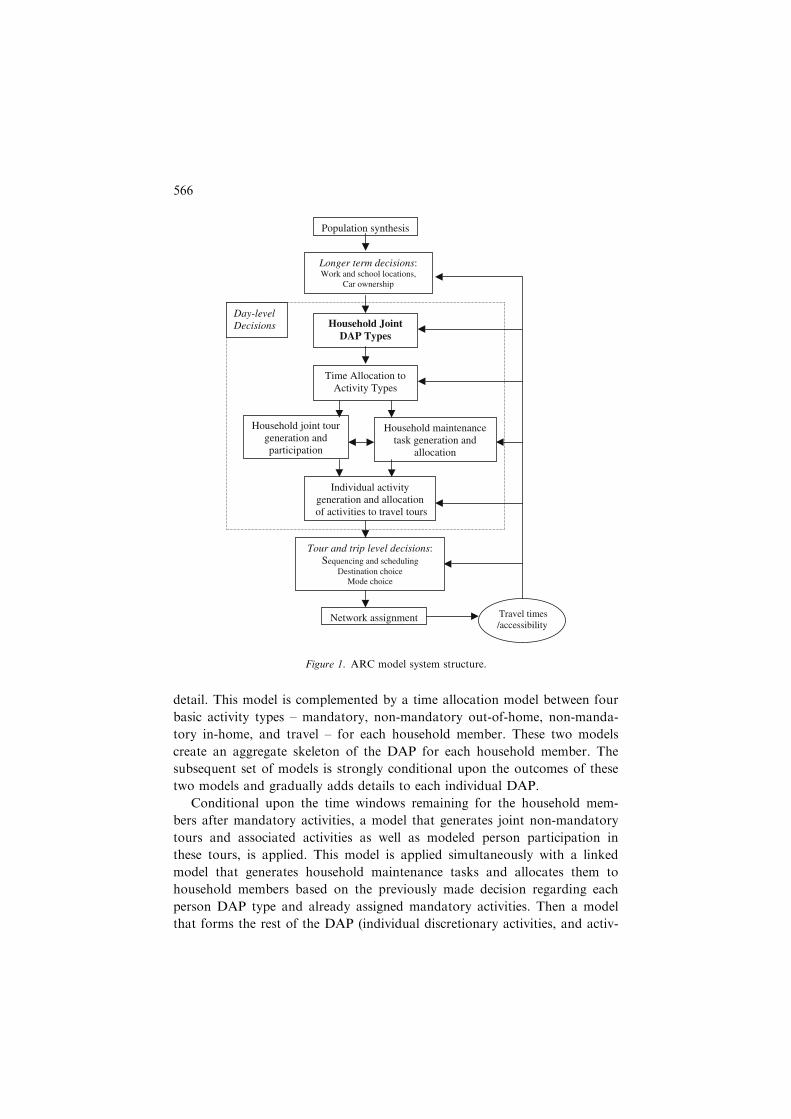
detail. This model is complemented by a time allocation model between four
basic activity types – mandatory, non-mandatory out-of-home, non-manda-
tory in-home, and travel – for each household member. These two models
create an aggregate skeleton of the DAP for each household member. The
subsequent set of models is strongly conditional upon the outcomes of these
two models and gradually adds details to each individual DAP.
Conditional upon the time windows remaining for the household mem-
bers after mandatory activities, a model that generates joint non-mandatory
tours and associated activities as well as modeled person participation in
these tours, is applied. This model is applied simultaneously with a linked
model that generates household maintenance tasks and allocates them to
household members based on the previously made decision regarding each
person DAP type and already assigned mandatory activities. Then a model
that forms the rest of the DAP (individual discretionary activities, and activ-
Population synthesis
Tour and trip level decisions:Sequencing and scheduling
Destination choiceMode choice
Individual activitygeneration and allocation
of activities to travel tours
Household joint tour generation and participation
Longer term decisions:Work and school locations,
Car ownership
Time Allocation to Activity Types
Household Joint DAP Types
Household maintenance task generation and
allocation
Network assignment
Day-levelDecisions
Travel times/accessibility
Figure 1. ARC model system structure.
566

ity/task/episode distribution by mandatory and non-mandatory tours) is
applied for each person.
The choice utility structure of the proposed joint DAP type model
assumes that additional utility is derived only by multiple household mem-
bers choosing to undertake the same DAP. At this stage it is still unknown
if the household members will actually share activities or household tasks.
Effects of joint activity episodes are modeled further in the model system
conditional upon the outcome of the current model and there is an addi-
tional joint participation utility captured at the episode level. Joint episodes
may occur between persons with different DAP types. However, the proba-
bility of joint episodes is much higher for persons with coordinated patterns,
than for persons with different patterns. This is captured by conditional link-
ages between the current model and the subsequent model for joint episodes.
The purpose of the current model is not to produce a detailed structure
of all episodic intra-household interactions but rather to account for most
important entire-day interactions that have an impact on the whole DAP
type, like having all-day vacation together, or staying at home because of
child sickness, etc.
The next model system components refer to the tour-level and trip-level
(stop-level) decision models. The tour-level models include primary destina-
tion choice for non-mandatory tours, scheduling of departure from home
and arrival back home for all tours, as well as entire-tour mode combination
choice. Further on, the location of each stop for the secondary activity epi-
sodes is modeled for each tour, detailed mode choice for each associated
trip, and the trip departure and arrival time.
Finally, highway network assignments and skims are performed, allowing
re-calculation of travel times for each trip. These travel times are fed back to
the DAP type and time allocation stage for each household and person.
Changing travel times affect the structure of time budget of each person
through the allocation procedure that will finally generate a different set of
activities and DAP structures. Feeding-back through individual DAP types
and time budgets is different from conventional upward feeding-back.
6. Conclusions and directions for further research
In this paper, we have demonstrated that modeling the DAP types of all
household members simultaneously captures much of the interaction
between people that cannot be captured by modeling them independently or
even sequentially. The estimates of the interactions between pairs and triads
567

of household members are generally significant and positive, indicating that
members of various types are prone to change their activities to match those
of other household members.
We have mentioned a number of ways that a model of this type could be
extended as part of further investigation. These include:
• Estimating the household interaction terms as function of other person and
household variables (such as age, gender, household size and composition,
income, car ownership) and zonal variables (urban density, accessibility to
destinations). For example, the interactions between the patterns of adults
and children may be found to be stronger for females than for males. The
urban travel environment may also have an impact on the structure of
interactions. Pair-wise and triple-wise interaction structure may be specific
to certain household size and composition.
• Expanding the model beyond three basic activity types. For example, the
mandatory pattern could be subdivided into those who only perform man-
datory activities out of home during the day versus those who carry out
both out of home mandatory and non-mandatory activities. Non-manda-
tory activities could also be divided into maintenance and discretionary
activities (although this distinction is generally less clear from survey data
than is the distinction between mandatory and non-mandatory).
• Integrating an activity time allocation model with this model. This would
require a combination discrete/continuous model with many linked endoge-
nous variables. It would be quite a challenge to estimate such a model and
still retain all of the discrete information on intra-household interactions
that is contained in the model presented here.
• Adding behavioral realism to the multi-dimensional choice structure by
meaningful nesting levels corresponding to entire-household joint decisions
As we integrate this model with other models in the ARC model system,
and possibly in other similar model systems, it will become more clear how
such a model can best support the entire household travel/activity forecast-
ing process. A particular area of focus will be how the model can best pro-
vide inputs to other models of intra-household interactions, including not
only fully joint tours and allocated maintenance activities, but also possibly
including partially joint travel and activities such as picking up or dropping
off other household members.
It is important to recognize to what extent the number and type of activi-
ties predicted by this model is different than that produced by an DAP
model without intra-household interactions, using the same input variables.
Independent models for each person with a full set of alternative-specific
constants will give probably the same average number of activity patterns of
568
each type as the model with interactions since both models should replicate
the observed shares. However, independent individual models tend to pro-
duce unrealistic entire-household patterns (like cases where preschool child
stays at home while all adults go to work) while the model with intra-house-
hold interactions not only guarantees replication of the average observed
individual patterns but also their proper linkage within each household.
The difference between model structures can produce very different model
elasticities with respect to exogenous variables and this is the major reason
for explicit modeling of intra-household interactions. For example, if we
consider a scenario where a day care for preschool children is supposed to
be significantly improved, thus resulting in a lower percentage of preschool
children staying at home and higher percentage having a mandatory pattern,
a model with interactions would show an additional percentage of workdays
for workers and consequently, additional traffic in the peak period because
of the growing amount of home-work trips. A model without interactions
would probably be quite insensitive to this factor showing only an isolated
effect on preschool children�s choices.In a similar way, independent models for two full-time working spouses
with 80% of workdays and 20% of non-mandatory and staying at home for
each of them will result only in 64% of coordinated workdays, while 36% of
cases would correspond to a situation where at least one of the workers does
not go to work. If we take a segment of households with one car as an
example, it will be a competition for this car with inevitable captivity for one
of the workers to transit for 64% of days only. Contrary to that, a model
with joint choice of daily patterns will create 70–75% joint workdays out of
the same individual probabilities. It means that the transit captivity for one
of the workers will by 10% higher. This can have a significant impact on the
mode choice predictions.
These considerations in favor of the joint modeling approach should
however be supported by the model application and validation. This
represents another important avenue for further research.
Finally, it is worth noting that incorporating intra-household interactions
in a forecasting model requires that the population synthesis method that is
used to generate the households will provide a realistic distribution of house-
hold compositions within each zone. In addition to variables which are typi-
cally used to control the sampling of a synthetic population – namely
distributions along household size, number of workers, and income – it may
also be necessary to control explicitly for the presence of senior citizens and
children in households. As part of the ARC model development, we are
undertaking detailed testing of the accuracy of synthetic household sampling
using different combinations of zonal control variables.
569

Acknowledgements
We would like to acknowledge the contributions of colleagues on work lead-
ing up to the research presented in this paper, including Dr. John Bowman,
Guy Rousseau of the Atlanta Regional Commission, and Eric Petersen, Bob
Donnelly, and Gordon Schultz of PB Consult. We also wish to thank the
anonymous reviewers for valuable suggestions and help in improving the
paper.
References
Borgers A. Hofman F & Timmermans H (2002) Conditional choice modeling of time allocation
among spouses in transport settings. European Journal of Transport and Infrastructure Research
2: 5–17.
Ettema D, Schwanen T & Timmeramns H (2004) The effect of locational factors on task and time
allocation in households. Paper presented at the 83 Annual Meeting of the Transportation
Research Board, Washington, DC.
Fujii S, Kitamura R & Kishizawa K (1999) Analysis of individuals’ joint activity engagement using
a model system of activity-travel behavior and time use. Transportation Research Record 1676,
11–19.
Gliebe J & Koppelman F (2002) A model of joint activity participations between household
members. Transportation 29: 49–72.
Golob T & McNally M (1997) A model of activity participation and travel interactions between
household heads. Transportation Research B 31B(3): 177–194.
Goulias K (2002) Multilevel analysis of daily time use and time allocation to activity types
accounting for complex covariance structures using correlated random effects Transportation
29: 31–48.
Meka S, Pendyala R & Kumara M (2002) A structural equations analysis of within-household
activity and time allocation between two adults. Paper presented at the 81st Annual Meeting of
the Transportation Research Board, Washington.
Schwanen T, Ettema D & Timmermans H (2004) Spatial patterns of intra-household interactions in
maintenance activity participation. Paper presented at the Conference on Progress in Activity-
Based Analysis, EIRASS, Maastricht, Netherlands.
Townsend TA (1987) The effects of household characteristics on the multi-day time allocations and
travel/activity patterns of households and their members. Unpublished Ph.D. dissertation,
Northwestern University, Evanston, IL.
Zhang J, Timmermans H & Borgers A (2002) A utility-maximizing model of household time use for
independent, shared and allocated activities incorporating group decision mechanism. Trans-
portation Research Record 1807: 1–8.
Zhang J & Fujiwara A (2004) Representing heterogeneous intra-household interactions in the
context of time allocation. Paper presented at the 83rd Annual Meeting of the Transportation
Research Board, Washington, DC.
Zhang J, Timmeramns H & Borgers A (2004) Model structure kernel for household task and time
allocation incorporating household interaction and inter-activity dependency. Paper presented
at the 83rd Annual Meeting of the Transportation Research Board, Washington, DC.
Simma A & Axhausen KW (2001) Within-household allocation of travel – the case of upper
Austria. Transportation Research Record 1752, 69–75.
570

Scott D & Kanaroglou P (2002) An activity-episode generation model that captures interaction
between household heads: development and empirical analysis. Transportation Research B 36B:
875–896.
Srinivasan S & Bhat C (2004) Modeling the generation and allocation of shopping activities in a
household. Paper presented at the 83rd Annual Meeting of the Transportation Research
Board, Washington, DC.
Vovsha P, Petersen E & Donnelly R. (2004a) Impact of intra-household interactions on individual
daily activity-travel patterns. Paper presented at the 83rd Annual Meeting of the Transpor-
tation Research Board, Washington, DC.
Vovsha P, Gliebe J, Petersen E & Koppelman F (2004b) Comparative analysis of sequential and
simultaneous choice structures for modeling intra-household interactions. Paper presented at
the Conference on Progress in Activity-Based Analysis, EIRASS, Maastricht, Netherlands.
About the authors
Mark Bradley is an independent consultant based in Santa Barbara, California. He
has degrees in Operations Research from Cornell University and in Systems Simula-
tion Modeling from Dartmouth College. For more than twenty years, he has carried
out consulting projects to apply state-of-the-art travel demand modeling methods. He
spent ten years working in Europe with Hague Consulting Group before returning to
the United States in 1995.
Peter Vovsha, Ph.D. is Principal Professional Associate of PB Consult, Parsons
Brinckerhoff, Inc, based in New York, NY. He holds a Ph.D degree in Operation
Research from the Moscow University of Technology. He served as the principal
investigator in large-scale model development projects in such major cities as
Moscow (Russia), Tel-Aviv and Jerusalem (Israel), New York and Columbus (US),
Montreal (Canada), and others.
571