Embed Size (px)
Citation preview
ORIGINAL ARTICLE Open Access
Urban household cooking energy choice:an example of Bauchi metropolis, NigeriaDanladi Yusufu Bisu1, Aondoyila Kuhe2* and Humphrey Aondover Iortyer2
Abstract
Background: The use of traditional energy sources such as wood, animal dung and agricultural residue by householdshas been in practice since time immemorial. This has however been identified as a cause of environmental problemssuch as excessive deforestation and the cause of the premature death of about 4.3 million people yearly; it caused thedeath of about 396,000 people in Sub-Saharan Africa, where Nigeria is located, in 2002. It was also responsible for 2.7 %of the global burden of disease in that year. The reasons for fuel choice are different for different locations. This paperpresents the results of a study in the factors affecting the cooking energy choice of households in Bauchi metropolis,North-east Nigeria. The aim of the study was to provide site-specific information that will aid the formulationof an effective energy policy which will result in safer and sustainable energy behaviour among householdsin Bauchi and Nigeria as a nation. The study therefore determined the cooking energy consumption patternof the household and whether it follows the energy ladder model and also determined the factors thatinfluence cooking energy choice.
Methods: Two-step random sampling was used along with a semi-structured questionnaire to collect data.Descriptive statistics, T test and regression analysis were used to analyse the data through the help ofMicrosoft excel™ and SPSS.
Results: The results show that biomass fuel is still being used heavily while the use of LPG has improved.Electricity and solar energy are only used by households as secondary cooking energy. The fuel use patternis characterized by multiple fuel use, conforming more to the fuel stacking hypothesis than energy ladder hypothesis.Change in household size, dwelling ownership status, change of season, income, level of education, dwelling location,availability and affordability are the factors that were found to influence household cooking energy choice.
Conclusions: This paper concludes that the heavy use of biomass for cooking in Bauchi metropolis is notenvironmentally healthy and requires serious attention. The major recommendation of the study is that policiesencouraging the availability and use of efficient and environmentally friendly energy sources should be formulated andimplemented.
Keywords: Sustainability, Energy choice, Consumption pattern, Household, Cooking energy
BackgroundEnergy is a key ingredient for social, economic and in-dustrial development of every nation [1–4]. However, ac-cess to modern, affordable and reliable energy services isan enormous challenge facing the African continent,particularly Nigeria [5]. African Development BankGroup [6] reported that the national electricity accessand per capita consumption for Nigeria is only 48 % and
149 kWh, respectively. This is less than for Senegal(56 % and 187 kWh/person), Cote d’Ivoire (59.5 % and212 kWh/person), Ghana (72 % and 344 kWh/person)and Maroc (98.96 and 826 kWh/person), who have farless amounts of energy resources than Nigeria. This en-ergy poverty is experienced more by Nigerian ruraldwellers that have an access rate of less than 30 %. Moreso, electricity supply in the country is characterized byfrequent power outages, which has rendered the ‘publicsupply a standby source as many consumers who cannotafford irregular and poor quality service substitute more
* Correspondence: [email protected] of Mechanical Engineering, Federal University of Agriculture,Makurdi, NigeriaFull list of author information is available at the end of the article
Energy, Sustainabilityand Society
© 2016 The Author(s). Open Access This article is distributed under the terms of the Creative Commons Attribution 4.0International License (http://creativecommons.org/licenses/by/4.0/), which permits unrestricted use, distribution, andreproduction in any medium, provided you give appropriate credit to the original author(s) and the source, provide a link tothe Creative Commons license, and indicate if changes were made.
Bisu et al. Energy, Sustainability and Society (2016) 6:15 DOI 10.1186/s13705-016-0080-1
expensive captive supply alternatives to minimize thenegative consequences of power supply interruptions ontheir production activities and profitability’, causingabout 20 % of the investment in industrial projects to beallocated to mostly more expensive and alternativesources of electricity [7]. This acute shortage and irregu-lar supply of clean energy sources has also caused morehouseholds in Nigeria to depend on traditional energysources such as wood, animal dung and agriculturalresidue causing personal health and environmental prob-lems such as excessive deforestation [8], estimated at300,000 ha per year.In Nigeria, about 65 % of the total energy consump-
tion is taken by the household, probably due to underdevelopment of the industrial sector. Cooking accountsfor about 91 % of the total domestic energy consumption[3]. Despite the abundance of renewable, environmen-tally friendly energy sources [9], about three billionpeople worldwide still use solid fuels for their basicneeds which include cooking, boiling water and spaceheating. Data shared by [10] shows that the use of bio-mass as fuel has been increasing, while the use of higherfuels decrease at a highly unacceptable rate. It showsthat between 1980 and 2004, the use of firewood in-creased from 47.6 to 70.8 %, while the use of keroseneand electricity declined from 49 to 26.6 % and from 2.6to 0.5 %, respectively. The use of liquefied petroleum gas(LPG) has also remained low (1.1 %) through the period.The problem seems to be worsening as about 86 % ofhouseholds still depend on fuel wood as their source ofenergy [3]. Indoor cooking using solid fuels have beendescribed as a ‘dangerous activity’ which is responsiblefor the premature death of about 4.3 million peopleyearly [11]. It was responsible for the death of about396,000 people in Sub-Saharan Africa, where Nigeria islocated, in 2002. It was also responsible for 2.7 % of theglobal burden of disease in that year [12, 13].This calls for interventions that will facilitate changing
the energy consumption behaviour of households andindividuals towards minimal household health risk andenvironmental sustainability. International organizationssuch as the United Nations (UN), World HealthOrganization (WHO) and the World Bank are makingfrantic efforts to change the trend. The UN has launchedthe Sustainable Energy for All (SE4ALL) campaign withthe aim of ensuring universal access to clean, safe andmodern energy services; doubling the global rate of im-provement in energy efficiency and doubling the shareof renewable energy in the global energy mix by 2030[14, 15]. The World Bank has recently launched the‘Africa Clean Cooking Energy Solutions’ to promote dis-semination and adoption of clean cooking solutions andthe ‘East Asia and Pacific region’s Clean Stove Initiative’(CSI) to scale up access to advanced cooking stoves for
rural poor households through country-specific technicalassistance and a regional knowledge-sharing and cooper-ation forum [14]. These efforts have, however, notyielded the desired result as most households in Africastill depend on inefficient energy sources [16].For these efforts to yield useful results, research is
required, as a first step, into the factors that influenceenergy choice and consumption behaviour of house-holds, especially due to the fact that household fuel con-sumption varies tremendously across geographic regionsdue to disparities in availability of different amenitiesand energy sources [17, 18].Several theories have been used in attempts to explain
household energy choice. One theory that has been usedextensively in studying household energy choice is the‘energy ladder model’. The energy ladder model classifieshousehold fuels into three groups: traditional, transitionand advanced fuels. The model assumes that low-income households would use the traditional fuels untiltheir socio-economic status improves and then they willrationally switch completely to the transition fuels. Ac-cording to this theory, a further increase in householdincome will then lead to another rational transition tothe advanced fuels [19, 20]. In other words, the energyladder model attributes household fuel choice and tran-sition to only income. It assumes that households willascend the imaginary ladder in a somewhat linear pro-gression pattern, by switching completely to higher levelfuels as their income improve [21, 22]. However, thismodel has been criticized heavily for its lack of consider-ation of the intricate interactions that characterizeenergy transition, family differences, cultural factors,personal preferences, etc.Consequent upon the observed weaknesses of the
‘energy ladder’ model, alternative models have beenproposed. One of such models is the ‘fuel stacking’model proposed by [23]. This model assumes thathousehold energy use patterns depend on severalfactors (not only income) which could be social, eco-nomic, cultural, or even personal preferences. There-fore, rather than transiting linearly to cleaner fuels,households tend to increase the number of fuels usedwithout actually abandoning the old ones [24]. Thefuel stacking model has been found to be true by manyresearchers such as [10], [14] and [25], who found fuelstacking to be practiced more by households withhigher income. In other words, households increasedthe number of fuels they used as their income in-creased. ‘Such behaviour is associated with the factthat while households were more likely to afford tobuy additional cooking stoves if new fuel types re-quired them, there were also various other reasons todo so, including preferences for a particular fuel typeused to cook a particular type of food, for a particular
Bisu et al. Energy, Sustainability and Society (2016) 6:15 Page 2 of 12

time or occasion, for convenience, or due to uncer-tainty about the supply of a fuel type’ [26].Growing concerns over limitations in the ability of in-
dividual consumer characteristics to explain variations inconsumer behaviour has necessitated appeals to examinesituational influences on behaviour. It has been arguedthat situational factors may account for more variancethan actor-related variables, hence the need to considerboth individual and situational factors in explaining con-sumer behaviour [27, 28]. This study therefore investi-gates the factors which influence households’ choice oftheir cooking energy. Energy in this case refers to all en-ergy types, both renewable and non-renewable. The aimis to provide site-specific information that will aid theformulation of an effective energy policy which willresult in safer and sustainable energy behaviour amonghouseholds in Bauchi and Nigeria as a nation. Specific-ally, the study attempts to answer the followingresearch questions:
� What is the cooking energy consumption pattern ofhouseholds in Bauchi metropolis?
� Does the cooking energy consumption pattern ofhouseholds in Bauchi metropolis follow the energyladder hypothesis?
� What are the factors that influence cooking energychoice of households in Bauchi metropolis?
MethodsStudy area and dataBauchi metropolis is the largest city in Bauchi state ofthe North-east geopolitical zone of Nigeria. It is the statecapital and the capital of Bauchi Local GovernmentArea. It is located on latitude 10.3098 and longitude9.8452. The city has a population of 316,173 and a landmass of 3687 km2. In the context of this research,Bauchi metropolis was considered to include seven sub-urban residential areas namely, Rafin-Zurfi, Birshi,Kafin-Tafawa, Wuntin-Dada, Miri, Turwun, Inkil andGudum. A two-step stratified random sampling wasemployed to collect data. The study utilizes a cross-sectional data collected in 2014/2015 through personalinterview of 100 households which were randomlyselected from the city and seven suburban residentialareas. The distribution of respondents is presented inTable 1.
Data collection and analysis techniquesThe instrument used for data collection is a semi-structured questionnaire consisting of questions onhousehold demographics, fuel and cooking technologychoice, fuel budget, awareness of harmful effects of usingtraditional fuels and technologies and the adoption ofclean energy and modern technologies for cooking. The
questionnaire was administered to either householdheads or their spouses because they are responsible forcooking energy decisions. If these two were not available,the questionnaire was administered to a female memberof the household who was up to 15 years of age andusually took part in cooking energy decisions. This is toensure that information obtained was dependable andfrom reliable sources. Trained research assistantsassisted in the administration of the questionnaires.Face-to-face method of questionnaire administrationwas used.Microsoft Excel™ and Statistical Package for Social
Sciences (SPSS) were used to analyse the data. T testwas used to compare variables, while multi-variable lin-ear regression analysis was used to determine relation-ships between variables. The Microsoft Excel™ was usedfor descriptive statistical analysis.
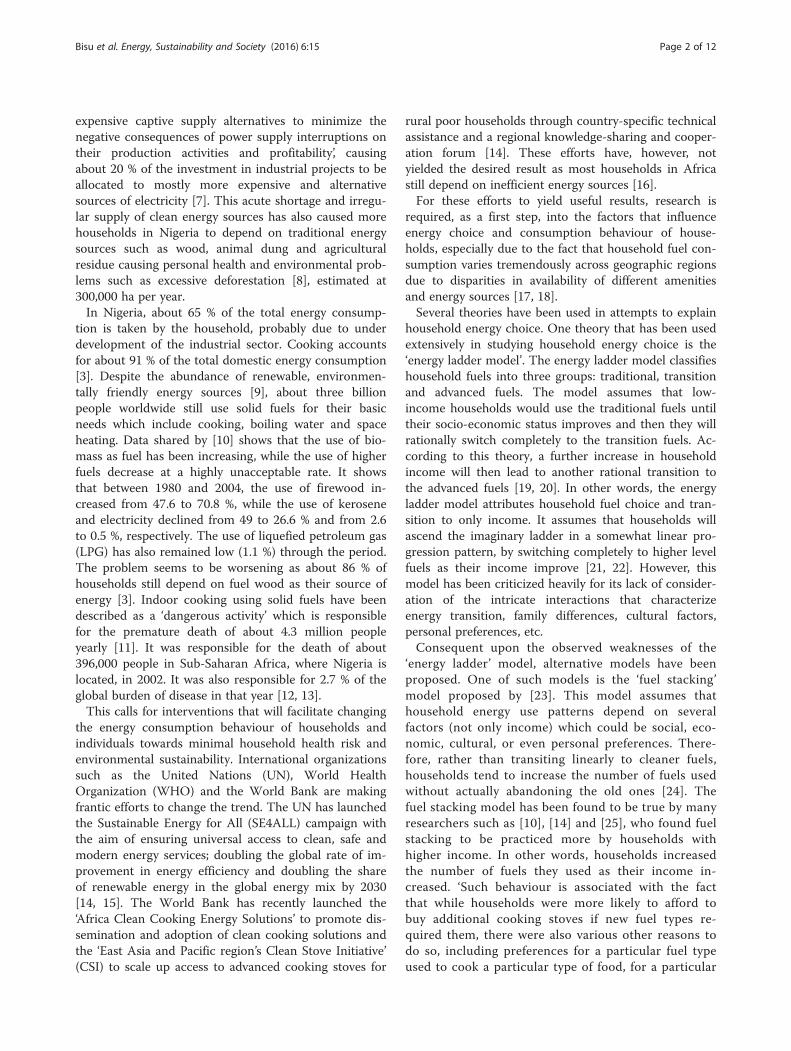
Results and discussionResultsSocio-economic characteristics of respondentsThe distribution of the respondents according to genderis 61.3 % male and 38.7 % female. The mean family sizeof the respondents is 7 (S.D = 3.67). With regard to theownership status of households’ dwelling, 44.7 % werepersonally owned while 32.1 % were rented. The annualincome distribution of households is shown in Fig. 1,ranging from N36,000 ($150) to N7,200,000 ($30,000).Based on their levels of education, the respondents are
distributed as shown in Fig. 2. For the households,
Table 1 Distribution of respondents
Residential area group Sample residentialarea
Number ofrespondents
Barracks Yelwa police barracks 5
Township police barracks 7 (25)
Shada-wanka cantonment 8
School of armour 5
Suburbs Wuntin-Dada 5
Kafin-Tafawa 8 (25)
Turwun 7
Inkil 5
Gov’t quarters/housingestates
Old GRA 8
State low-cost 5 (25)
Tambari housing estate 5
Tafawa-Balewa housing estate 7
General township Nasarawa-Jahun 8
Dutsen-tanshi 5 (25)
Igbo-quarters 7
Gwallaga 5
Total number of respondents 100
Bisu et al. Energy, Sustainability and Society (2016) 6:15 Page 3 of 12
15.3 % have attained post graduate education; 41.6 %have acquired tertiary education up to undergraduatelevel, while 35.4 % had primary education and 7.7 %are illiterate.Figure 3 shows the access and consumption rates of
the various cooking energy types available to house-holds in Bauchi metropolis. It shows that 100 % ofrespondents have access to the sun, since it is natur-ally available; 92.6 % of the households have theirdwellings connected to the national grid. The energytype with least access rate is LPG (52.7 %), despitethe abundance of petroleum resources in Nigeria. Itshould be noted that the low availability (absence ofenergy when needed due to inconsistent supply (asshown in Figs. 4 and 5)) of electricity may be thereason for its low consumption rate by households(7.29 %).Solar energy has the least consumption rate (1 %)
probably due to lack of possession of appropriate
technology (e.g. solar cookers, as they are not readilyavailable in the market), while only 26 % of householdsuse LPG for cooking. Paired sample T test analysisshows that there is a significant difference between ac-cess and consumption rates of households’ cooking en-ergy. It gives a t value of 3.031 and a p value of 0.029.More so, a paired sample correlation analysis gives acorrelation coefficient of −0.235, signifying very low andnegative correlation between the access and consump-tion rates. This shows that in Bauchi metropolis, Nigeria,access to an energy source (being connected to the grid,for example) does not necessarily lead to high consump-tion rate of such energy. For example, accessibility ofelectricity does not translate into availability, as shownin Fig. 4, where electricity supply is so inconsistent thatonly 6 % of households have electricity available tothem between 5 and 7 days per week. More so, most ofthe respondents (73 %) only have electricity availablefor 1–5 h per day, while only a mere 1 % of respon-dents can boast of enjoying electricity supply for 16 to20 h per day (Fig. 5); the sun is accessible by all, butonly few (1 %) have the means to convert it into usefulenergy for cooking, probably due to scarcity of appro-priate appliances.
Prices of cooking energyThe prices of cooking energy were determined for thecooking energy types considered in this study thus:wood N7 ($0.03)/kg; charcoal N35 ($0.15)/kg; keroseneN120 ($0.5)/L; LPG N280 ($1.2)/kg and electricityN43.91 ($0.18)/kWh. None of the energy types is subsi-dized, and there is no incentive for consuming any ofthe energy types.
Cooking energy consumption patternThe primary and secondary cooking energy consump-tion patterns for households in Bauchi metropolis are
Fig. 1 Annual income of households
Fig. 2 Level of education of respondents
Bisu et al. Energy, Sustainability and Society (2016) 6:15 Page 4 of 12

shown in Fig. 6. The primary cooking energy con-sumption pattern shows that kerosene has the high-est consumption rate of 41 % followed by wood35 %. LPG is the next with utilization rate of 24 %,followed by charcoal (20 %). The households do notuse electricity or solar energy as primary cookingenergy.For the secondary cooking energy consumption pat-
tern, the use of wood, charcoal and kerosene in-creased to 36, 23 and 47 %, respectively, while theuse of LPG dropped to 8 %. Of the households, 7and 1 % use electricity and solar energy, respectively,as secondary cooking energy. T test result shows thatthere is no significant difference between the primaryand secondary cooking energy consumption patternsat 95 % confidence level; it gives a t value of −0.135and p value of 0.898. This means that consumptionpatterns of households’ primary and secondary cook-ing energy are statistically the same; the variation isnegligible.
Households’ cooking energy mixFifteen per cent of the respondents use only one fuel,while 85 % use multiple fuels. The maximum number offuels combined in a household is 4. Table 2 shows thedetails of cooking energy mix for households.
Factors affecting households’ cooking energy choiceFactors which influenced respondents’ choice of theircooking energy were compiled and analysed as shownin Fig. 7.Estimated models have been generated through the
multi-variable linear regression analysis for the con-sumption of each of the primary fuels considered inthis study. The energy sources (solar energy and elec-tricity) which are being used only as secondary energyhave been left out of this analysis, since they are notof primary concern to the households. The resultshows that while change in household size (Chs),dwelling ownership status (DOS), change of season(CS), income (Ic), level of education (Ed), dwelling lo-cation (DL), availability (Av) and affordability (Af )are influential to households’ fuel choice, type of food,
Fig. 3 Households’ cooking energy access and consumption rate
Fig. 4 Electricity availability in households (days per week) Fig. 5 Electricity availability in households (hours per day)
Bisu et al. Energy, Sustainability and Society (2016) 6:15 Page 5 of 12

taste of food, quantity of food, land lord’s rules, easeof use, fastness, scarcity of primary fuel and genderhave no significant influence on households’ fuelchoice. Equations (1), (2), (3) and (4) represent theestimated fuel consumption models for wood (W),charcoal (C), kerosene (K) and LPG (L), respectively.
W ¼ 42:788 þ 29:488Chsþ 17:499DOS– 322:748Cs
– 14:082Ic– 13:398Edð1Þ
Equation (1) shows that an increase in the family sizeof a household in the study area will result in an increaseof 29.488 kg of wood, while a change in the dwellingownership status of a single household from rented topersonally owned dwelling in the study area will result
in an increase of 17.499 kg of wood (Fig. 10). However,when the season changes from dry to rainy season,when a households’ income increases and when theeducation level of a households’ cooking energy deci-sion maker increases, then wood consumption willdecrease by 322.748, 14.082 and 13.398 kg, respectively(Figs. 9 and 12).
C ¼ 7:601 þ 1:837Dl– 10:002Av ð2Þ
Equation (2) shows that charcoal consumption is af-fected by only two factors, dwelling location and avail-ability. It shows that if a household in the study areachanges location from a barracks or government quar-ters/housing estates to a residential area in the suburbor general township, then charcoal consumption will in-crease by 1.837 kg (Fig. 11). However, a decrease in theavailability of charcoal will result in a decrease in itsconsumption by 10.002 kg.
K ¼ –0: 699þ 7:654Avþ 3:651Cs–5:713Chs
–2:348DOSð3Þ
Equation (3) shows that an increase in the availabilityof kerosene in the study area will result in a 7.654 L in-crease in its consumption. This is important because ofthe unsteady nature of kerosene supply. A change fromdry to rainy season will also increase kerosene consump-tion by 3.651 L. However, as the size of one householdincrease, kerosene consumption drops by 5.713 L as itbecomes too expensive for the large family (so they tendto switch to cheaper fuels). Kerosene consumption alsodecreases by 2.348 L with one household personallyowning its dwelling. Personal ownership of a dwellinggives the households’ freedom to use any fuel of theirchoice. More so, the household is likely to have more
Fig. 6 Households’ cooking energy consumption patterns
Table 2 Households’ fuel mix
Fuel mix Population (%)
Wood only 32.2
Kerosene only 20.83
Electricity only 0.00
Charcoal only 17.09
LPG only 7.25
Solar only 0.00
Wood + kerosene 17.71
Wood + kerosene + charcoal 3.21
LPG + kerosene + solar 8.21
LPG + kerosene 1.04
LPG + electricity 4.27
Kerosene + electricity + wood 4.17
LPG + wood + charcoal 3.13
LPG + wood 5.21
Wood + LPG + kerosene + charcoal 10.42
Bisu et al. Energy, Sustainability and Society (2016) 6:15 Page 6 of 12

space available for external kitchen construction and forstorage of bulky fuels like wood and charcoal.
L ¼ 4:276þ 1:286Af –3:003Av–1:116Chs ð4Þ
Equation (4) shows that LPG consumption is increasedby 1.286 kg when one household in the study area is ableto afford to acquire it and appropriate technology to useit for cooking. This means that an improvement in theeconomic status of a household increases its capacity toacquire the technology for LPG use. For example, Fig. 12shows how LPG consumption increases with increase inhouseholds’ income. However, if the LPG availabilitydecreases, its consumption will reduce by 3.003 kg dueto scarcity. In this case, households are forced to turn toalternative fuels. The equation also shows that an in-crease in household size will also result in the decreasein LPG usage by 1.116 kg as cooking which it becomesuneconomical for the family.The influences of gender, level of education, dwelling
ownership status, dwelling location and income on thecooking energy choice of households were further ana-lysed as presented in Figs. 8, 9, 10, 11 and 12. These pro-vide more explanation on the nature of influence of eachof the factors on household fuel choice. More so, they
provide information on the fuel switching behaviour ofthe households.
Influence of gender on cooking energy choiceFigure 8 gives a graphical description of the influence ofgender on the choice of cooking energy by respondents.The result shows that more males (36 %) prefer woodthan the female (35 %). In charcoal utilization, males(31 %) exceed females (28 %). Forty-five per cent ofmales and 37 % of females use kerosene. However, only19 % males and 29 % females use LPG for cooking.The results further shows that while 25.3 % of fe-males use electricity for cooking, only 22 % of malesuse it. Finally, solar energy is only used by 2 % ofmales. T test gives a t value of 0.443 against a p valueof 0.681, indicating that there is no significant differ-ence in the cooking energy preferences of males andfemales. In other words, gender does not really haveany significant influence on cooking energy choice ofhouseholds in the study area.
Influence of level of education on households’ cookingenergy choiceFigure 9 shows the relationship between cooking energychoice and respondents’ level of education. The result
Fig. 7 Factors affecting cooking energy choice
Fig. 8 Influence of gender on cooking energy choice Fig. 9 Influence of education on households’ cooking energy choice
Bisu et al. Energy, Sustainability and Society (2016) 6:15 Page 7 of 12
shows that while wood, charcoal and kerosene utilizationdecline with increasing level of education, electricityutilization increases gradually with rising level of educa-tion, while LPG utilization rises sharply with increase inthe level of education. Solar energy utilization tends torise with level of education and then drops to zero.Regression analysis shows that education is strongly cor-related with cooking energy choice in the householdswith 97.8 % (R = 0.978) of variations in the regressorsexplained.
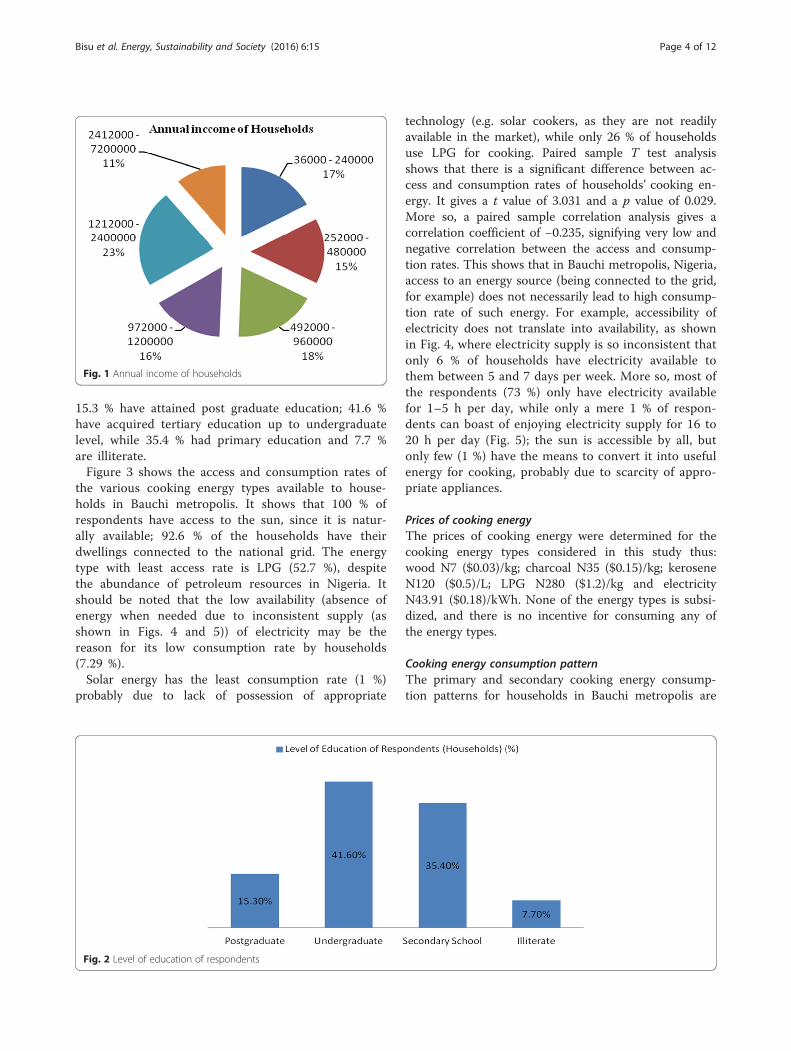
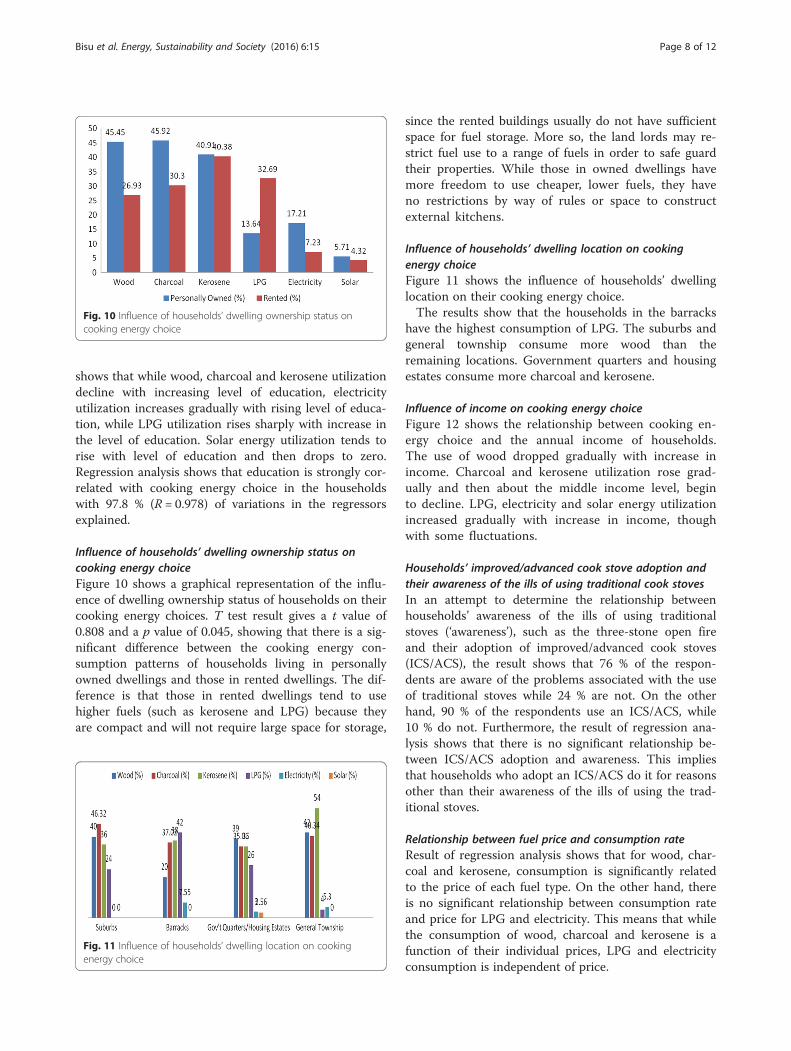
Influence of households’ dwelling ownership status oncooking energy choiceFigure 10 shows a graphical representation of the influ-ence of dwelling ownership status of households on theircooking energy choices. T test result gives a t value of0.808 and a p value of 0.045, showing that there is a sig-nificant difference between the cooking energy con-sumption patterns of households living in personallyowned dwellings and those in rented dwellings. The dif-ference is that those in rented dwellings tend to usehigher fuels (such as kerosene and LPG) because theyare compact and will not require large space for storage,
since the rented buildings usually do not have sufficientspace for fuel storage. More so, the land lords may re-strict fuel use to a range of fuels in order to safe guardtheir properties. While those in owned dwellings havemore freedom to use cheaper, lower fuels, they haveno restrictions by way of rules or space to constructexternal kitchens.
Influence of households’ dwelling location on cookingenergy choiceFigure 11 shows the influence of households’ dwellinglocation on their cooking energy choice.The results show that the households in the barracks
have the highest consumption of LPG. The suburbs andgeneral township consume more wood than theremaining locations. Government quarters and housingestates consume more charcoal and kerosene.
Influence of income on cooking energy choiceFigure 12 shows the relationship between cooking en-ergy choice and the annual income of households.The use of wood dropped gradually with increase inincome. Charcoal and kerosene utilization rose grad-ually and then about the middle income level, beginto decline. LPG, electricity and solar energy utilizationincreased gradually with increase in income, thoughwith some fluctuations.
Households’ improved/advanced cook stove adoption andtheir awareness of the ills of using traditional cook stovesIn an attempt to determine the relationship betweenhouseholds’ awareness of the ills of using traditionalstoves (‘awareness’), such as the three-stone open fireand their adoption of improved/advanced cook stoves(ICS/ACS), the result shows that 76 % of the respon-dents are aware of the problems associated with the useof traditional stoves while 24 % are not. On the otherhand, 90 % of the respondents use an ICS/ACS, while10 % do not. Furthermore, the result of regression ana-lysis shows that there is no significant relationship be-tween ICS/ACS adoption and awareness. This impliesthat households who adopt an ICS/ACS do it for reasonsother than their awareness of the ills of using the trad-itional stoves.
Relationship between fuel price and consumption rateResult of regression analysis shows that for wood, char-coal and kerosene, consumption is significantly relatedto the price of each fuel type. On the other hand, thereis no significant relationship between consumption rateand price for LPG and electricity. This means that whilethe consumption of wood, charcoal and kerosene is afunction of their individual prices, LPG and electricityconsumption is independent of price.
Fig. 10 Influence of households’ dwelling ownership status oncooking energy choice
Fig. 11 Influence of households’ dwelling location on cookingenergy choice
Bisu et al. Energy, Sustainability and Society (2016) 6:15 Page 8 of 12

Discussion of resultsThe results show that although kerosene is predomin-antly used as a primary cooking fuel, biomass is still be-ing heavily used, while electricity and solar energy areonly used as secondary cooking energy. Compared tothe results of other studies such as [10] which cover thewhole country (Nigeria), there is an improvement in theuse of kerosene and LPG for cooking. The heavy use ofbiomass has resulted in deforestation in all parts ofBauchi state and heavy erosion in some parts, leading toheavy agricultural loses due to the washing away of farmlands and crops. Some major roads, such as the Bauchi-Dass-Tafawa Balewa road, are being threatened by thefast spreading gully erosion by Bayara village. The heavyuse of biomass fuels may be as a result of low-incomelevels as shown in Fig. 1. It is also attributable to thepoor availability of electricity resulting from inconsistentsupply (Figs. 4 and 5). The increase in the use ofkerosene and LPG for cooking is as a result of in-creased availability due to improvement in relevantinfrastructure such as the increase in the number offilling stations which brings the commodities closer tothe people and also due to the lack of reliable electri-city supply.The results further show that many of the households
use multiple fuels. This may be connected to the factthat some fuels are not always available and seasonalchanges are likely to induce change of fuel (Fig. 7). Theuse of some higher fuels (LPG, electricity and solar) in-creased with rise in income, while firewood, charcoaland kerosene use declined. This shows that as the in-come increased, households’ economic status improveand are more likely to afford and shift to modern cook-ing facilities.Change in household size is one factor that affects
wood consumption. Bauchi state is dominated by Islam,
which allows the marrying of up to four wives, therebyincreasing the tendency of an increase in the size of thefamily. The culture of the people is such that necessi-tates maintaining ties with extended relations resultingin visitations especially during festive periods. Theresulting increase in family size due to visitations ormarrying more wives and the attendant increase in thenumber of children makes cooking with more expensivehigher fuels uneconomical and may necessitate switch-ing to cheaper fuels such as wood, thereby increasing itsconsumption. Also, personal ownership of a dwellinggives the owner freedom to use any fuel for cooking.More so, they are likely to have more space to constructan external kitchen to accommodate lower fuels such aswood, thereby increasing its consumption.Wood consumption has however been shown be de-
crease with change of season, increase in income andlevel of education of the respondents. This is possiblebecause when the season changes from dry to rainy sea-son, wood becomes difficult to use due to poor burningrate and inefficient combustion resulting from increasedmoisture content. More so, wood is mostly brought intothe metropolis from villages with bad roads that arehardly motorable during the rainy season; this causes aprice hike due to scarcity resulting from shortage in sup-ply, forcing the household to go for alternative fuels thatare available and more efficient. When the level of edu-cation of a person increase, the tendency is to get betterjobs with higher income resulting in a movement up thesocio-economic ladder. This further results in a desire touse higher or cleaner fuels to suit their new socio-economic status. This therefore affects wood consump-tion negatively.On charcoal consumption, it has been shown in the
result that Dl and Av are the influential factors. Refer-ence to Fig. 11, more charcoal is consumed in the
Fig. 12 Influence of income on households’ cooking energy choice
Bisu et al. Energy, Sustainability and Society (2016) 6:15 Page 9 of 12

suburbs and the general township than the barracks andgovernment quarters/housing estates. This implies thatcharcoal consumption will increase if a household relo-cates from the barracks or government quarters to thesuburbs or general township. This is probably because ofthe restrictions on the free flow of vehicles into the bar-racks, especially those with bulky and concealed content,owing to the security challenges being experienced cur-rently in the study area, and the nature of the buildingsin the barracks and government quarters or housingestates which mostly have internal kitchens with little orno space for keeping bulky fuels. The availability ofcharcoal usually decreases during the rainy season withattendant price hike due to production and transporta-tion difficulties since it is mostly produced in the villageswhere the roads are not very good during the rainy sea-son. The increase in price resulting from scarcity willhave a negative resultant effect on its consumption.An increase in availability increases the consumption
of kerosene, implying that a reduction in availabilityprobably due to scarcity may cause a price hike, therebyreducing its consumption since price affects it. Thismeans that encouraging kerosene consumption will re-quire increasing the availability of the commodity at lowprice. Another important factor in kerosene consump-tion is change of season from dry to rainy season, whichresults in increased kerosene consumption. This is be-cause wood and charcoal become more difficult and in-efficient to use and also expensive due to increasedmoisture content and scarcity, respectively. Kerosenehowever is not affected by moisture, and since it is moreavailable, households that cannot afford higher fuels fallback to it.Household size is significantly related to kerosene con-
sumption. When the number of people in a family in-creases, the quantity of food to be cooked also increase,making kerosene consumption uneconomical. Therefore,the household is forced to fall back to cheaper, lowerfuels. Dwelling ownership status significantly influencesthe consumption of kerosene by a household. Thismeans that relocating from a rented to household dwell-ing to a personally owned one reduces kerosene con-sumption. This is because personal ownership of adwelling in urban areas means better income and a risein the socio-economic status of the owner. It also meansmore space and no restrictions by way of tenancy ruleson type of fuel to be used. These give the owner thefreedom to shift to other fuels either higher or lower,since they are likely to have more space to store bulkyfuels and construct an external kitchen.In the household, LPG consumption was found to be
related negatively with availability and household size andpositively with affordability. The relationship with avail-ability is consistent with the finding of [29] who found
that the main barrier to gas use in some villages inPakistan was the lack of availability of the LPG in suffi-cient quantity to meet the need of the consumers. Thesituation in Bauchi is that there are few shops for sellingLPG, and many consumers have to travel long distance tobuy the commodity. More so, the sellers have to buy itfrom depots located far away from Bauchi. This thereforediscourages LPG consumption. On the household size, anincrease in the household size translates into the demandfor a larger quantity of food to be cooked at a time. Thismakes the use of gas unattractive because the gas stoveavailable in the market is too small to accommodate verylarge pots. Insisting on using gas for such large pots mayrequire industrial burners which will definitely consumemore gas. Since there are cheaper alternatives, householdsprefer to go for them, thereby reducing gas consumption.The positive relationship between LGP consumption
and affordability corroborates the finding of [29] and[22], who found cost to be one of the barriers to use gasfor cooking in households. Affordability is a function ofthe consumer’s income. Therefore, LGP consumptionincreased probably due to increasing availability and asmore consumers’ income increased (Fig. 12) due tomore of them getting better paying jobs resulting fromincreased education (Fig. 9).The finding that no significant relationship exists
between households’ and restaurants’ awareness of theills of using traditional fuels and cooking technologiesand their rate of adoption of ICS/ACS for cooking isconsistent with the findings of [30] who, in a study toinvestigate the relationship between attitude and actualhuman behaviour, found that attitudes do not alwaystranslate into actual behaviour. This finding was corro-borated by [31] who found that electricity consumerswho were generally sympathetic to environmental issuesdid not necessarily adopt green tariffs. This thereforepresents the need for more investigation into the factorswhich influence ICS/ACS adoption. Berger and Corbin[32] have suggested that cultural, socio-economic andsituational circumstances are capable of affecting actualhuman behaviour. Therefore, further research in thatdirection may yield some desirable result.
ConclusionsThis study focused on household cooking energy choicein Bauchi metropolis, North-east Nigeria. It was based ona survey data generated through the use of a questionnairepersonally administered by the researchers and assistants.The results show that biomass is still being used heavilyby households as the primary and secondary cookingenergy. The use of LPG is seen to be rising, while electri-city and solar energy are only used as the secondary cook-ing energy by very few households. This is as a result ofthe poor availability of electricity due to epileptic supply.
Bisu et al. Energy, Sustainability and Society (2016) 6:15 Page 10 of 12
The cooking energy consumption patterns follow thefuel stacking model as most households use multiplefuels. However, households transit gradually to higherfuels as income and level of education increase.The results of the study also show that several factors
affect household cooking energy choice. These includechange in household size, dwelling ownership status,change of season, income, level of education, dwellinglocation, availability, and affordability. On the otherhand, type of food, taste of food, quantity of food, landlord’s rules, ease of use, fastness, scarcity of primary fueland gender have no significant influence on households’fuel choice.
RecommendationsThe high rate of wood and charcoal consumption has adestructive tendency on the nation’s forest resources. Oneway to reduce this is to make wood and charcoal con-sumption sustainable by encouraging local communitiesto have woodlots. The family woodlots will provide therequired firewood, while it improves soil fertility.The government and policymakers should take adequate
steps to ensure that all citizens have access to modern,environmentally friendly energy resources and therelevant technologies for their sustainable consumption ataffordable costs. The factors which influence energyconsumption should be used as a guide. The governmentshould identify and develop clear policy incentives forincreased private sector participation in delivery of off-grid power and improved cook stoves.Evidence of the positive influence of education on
modern energy consumption suggests that energy educa-tion should be included in the nation’s curriculum atleast up to the secondary school level, in order to incul-cate the idea of responsible and sustainable energybehaviour in the minds of young Nigerians.The evidence of the influence of location on energy
consumption suggests that the supply of electricity andother modern energy sources and appliances should beextended to rural areas. This could increase their consump-tion and the adoption of green technologies for cookingand activities, thereby reducing pressure on the nation’sforest resources. A public-private partnership may be usefulin this.The influence of income and affordability on energy
consumption suggests that poverty is a problem mitigat-ing sustainable energy consumption. In order to over-come this, the government should provide incentives forhouseholds and businesses which will encourage themto use clean energy sources and motivate them to effi-ciently use them. This can be achieved through microfi-nance interventions that will provide credit access tohouseholds and businesses to help them acquire technolo-gies for clean energy utilization. Moreover, clean energy
technologies such as improved cook stoves can be madecheaper by granting tax holidays/waivers to companiesinvolved in such businesses.
AbbreviationsLPG, liquefied petroleum gas (used in this text to represent all cookinggases); ICS/ACS, improved/advanced cook stove.
Competing interestsThe authors declare that they have no competing interests.
Authors’ contributionsThe study was designed by all the three authors. Data collection, collationand analysis were done by DYB. AK supervised the project and drafted thearticle, and it was proof read and edited by HAI. All authors read andapproved the final manuscript.
AcknowledgementsThe authors wish to acknowledge IJEEE and the anonymous reviewers forgranting them the opportunity to publish this article. We appreciate thenumerous individuals and organizations who have contributed in one wayor another towards the successful completion of this publication.
Author details1Department of mechanical Engineering Technology, Federal Polytechnic,Bauchi, Nigeria. 2Department of Mechanical Engineering, Federal Universityof Agriculture, Makurdi, Nigeria.
Received: 15 October 2015 Accepted: 14 May 2016
References1. Saeed SH, Sharma DK (2012) Non-conventional energy resources. KATSON
Books, New Delhi2. Banos R, Manzano-Agugliaro F, Montoya FGC, Alcayde A, Gomez J (2011)
Optimization methods applied to renewable and sustainable energy: a review.Renew Sust Energ Rev 15:1753–1766
3. Oyedepo O (2012) Energy and sustainable development in Nigeria: the wayforward. Energy Sustain Soc 2:15
4. Chukwu PU, Ibrahim IU, Ojosu JO, Iortyer HA (2014) Sustainable energyfuture for Nigeria: the role of engineers. J Sustain Dev Stud 6(2):242–259
5. Baiyegunhi LJS, Hassan MB (2014) Rural household fuel energy transition:evidence from Giwa LGA Kaduna State, Nigeria. Energy Sustain Dev20(2014):30–35
6. African Development Bank Group (AFDB) (2014) West Africa monitorquarterly, vol 3., pp 14–15
7. Iwayemi I (2008) Investment in electricity generation and transmission inNigeria: issues and options. International Association for Energy EconomicsNewsletter, First Quarter, 2008., pp 37–42
8. Mwampamba TH, Ghilardi A, Sander K, Chaix KJ (2013) Dispelling commonmisconceptions to improve attitudes and policy outlook on charcoal indeveloping countries. Energy Sustain Dev 17:75–85
9. Hossain KA (2012) Global energy consumption pattern and GDP. Int J RenewEnergy Technol Res 1(1):23–29, ISSN:2325–3924
10. Ogwumike FO, Ozughalu UM, Abiona GA (2014) Household energy use anddeterminants: evidence from Nigeria. Int J Energy Econ Policy 4(2):248–262
11. WHO (2010) Household air pollution and health. USA: Fact Sheet No 292.,Available at http://www.who.int/mediacentre/factsheets/fs292/en/
12. Elledge MF, Nandasema S, Philips MJ, Thornburg VE: Environmental healthrisk and the use of biomass stoves in Sri Lanka. Research Brief, RTI Press
13. WHO (2006) Fuel for Life: Household energy and health. Geneva. Availableat http://www.who.int/indoorair/publiactions/fuelforlife.pdf Accessed 20May 2015
14. Malla S, Timilsina GR (2014) Household cooking fuel choice and adoption ofimproved cook stoves in developing countries: a review. Policy Research WorkingPaper 6903. The World Bank Development Research Group; Environment andEnergy Team. http://econ.worldbank.org. Accessed 15 Aug 2014
15. Wilson E (2012) Energy equity: can the UN sustainable energy for allinitiative make a difference? International Institute for Environment and
Bisu et al. Energy, Sustainability and Society (2016) 6:15 Page 11 of 12

Development, http://www.iied.org/energy-equity-can-un-sustainable-energy-for-all-initiative-make-difference. Accessed 15 June 2014
16. Kichonge B, John GR, Mkilaha ISN, Hameer S (2014) Modelling of futureenergy demand for Tanzania. J Energy Technol Policy 4(7):16–31
17. Wuyuam P, Zerriffi H, Jihua P (2008) Household level fuel switching in ruralHubei, program on energy and sustainable development. Stanford, Workingpaper No. 79, August 2008
18. Yu B, Zhang J, Fujiwara A (2012) Analysis of the residential location choiceand household energy consumption behaviour by incorporating multipleself-selection effects. Energy Policy 46(2012):319–334
19. Barnes DF, Krutilla K, Hyde W (2005) The urban household energy transition:energy, poverty, and the environment in the developing world. World Bankhttps://www.esmap.org/sites/esmap.org/files/Rpt_UrbanEnergyTransition.pdf. Accessed 19 Sept 2014
20. Heltberg R: Factors determining household fuel choice in Guatemala,environment and development economics. Shaftesbury Road Cambridge,UK: University Printing House; 10:337–16
21. Farsi M, Fillipini M, Pachauri S (2007) Fuel choices in urban Indian households,environment and development economics. Cambridge University Press12(06): 757–774
22. Osiolo, Helen H (2009) Enhancing household fuel choice and substitution inKenya, Kippra discussion paper no. 102. http://searchworks.stanford.edu/view/9608349. Accessed 7 Sept 2015
23. Masera O, Saatkanp B, Kammen D (2000) From linear fuel switching tomultiple cooking strategies: a critique and alternative to the energy laddermodel. World Dev 28(12):2083–2103
24. Risseeuw, Natasha: Household energy in Mozambique: a study on thesocio-economic and cultural determinants of stove and fuel transitions.Research Project, IVM Institute for Environmental Studies, http://www.ivm.vu.nl/en/Images/Risseeuw_Natasha__-_FINAL_THESIS_tcm234-352225.pdfAugust 2012 Accessed 7 Sept 2015
25. Yonemitsu A, Njenga M, Iiyama M, Matsushita S (2015) A choice experimentstudy on fuel preference of Kibera slum households in Kenya. Int J EnvironSci Dev 6;(3):196-200
26. Mekonnen A, Gebre Egziabher Z, Kassie M, Kolin G (2009) Income alonedoesn’t determine adoption and choice of fuel types: evidence fromhouseholds in Tigrai and major cities in Ethiopia, environment fordevelopment (EFD) policy brief www.environmentfordevelopment.orgAccessed 26 July 2014
27. Belk RW (1975) Situational variables and consumer behaviour. J Consum Res2 https://jcr.oxfordjournals.org/content/jcr/2/3/157.full.pdf
28. Bartiaux F, Gosselain V, Stamova G, Ozolina L, Gara E (2011) Knowledge onclimate change and energy saving renovations by apartment owners inBulgaria and Lavita. A quantitative study. Int Rev Soc Res 1(3):133–154
29. Jan I, Khan H, Hayat S (2012) Determinants of rural household choices: anexample from Pakistan. Pol J Environ Stud 21(3):635–641
30. Lapiere RT (1934) Attitudes versus actions. Soc Forces 13(2):230–23731. Ozaki R, Shaw I (2014) Adoption and use behaviour of consumers of
energy-sustainable technologies. Energy Business Research Laboratory,Imperial College, London http://wwwf.imperial.ac.uk/business-school/research/energy-business-research-laboratory/research/adoption-and-use-behaviour-of-consumers-of-energy-sustainable-technologies/
32. Berger IE, Corbin RM (1992)Percieved Effectiveness and faith in others asmoderators of environmentally responsible behaviour. J Pub Policy Mark11(2):7989 http://www.jstor.org/stable/30000276
Submit your manuscript to a journal and benefi t from:
7 Convenient online submission
7 Rigorous peer review
7 Immediate publication on acceptance
7 Open access: articles freely available online
7 High visibility within the fi eld
7 Retaining the copyright to your article
Submit your next manuscript at 7 springeropen.com
Bisu et al. Energy, Sustainability and Society (2016) 6:15 Page 12 of 12