Embed Size (px)
Citation preview
A Low Carbon Society Scenario Study for Khon-Kaen Province, Thailand
Savitri Garivait, Awassada Phongphiphat, Agapol Junpen, Komsilp Wang-Yao, and Sirintorthep Towprayoon
16 February, 2012
The 17th AIM International Workshop
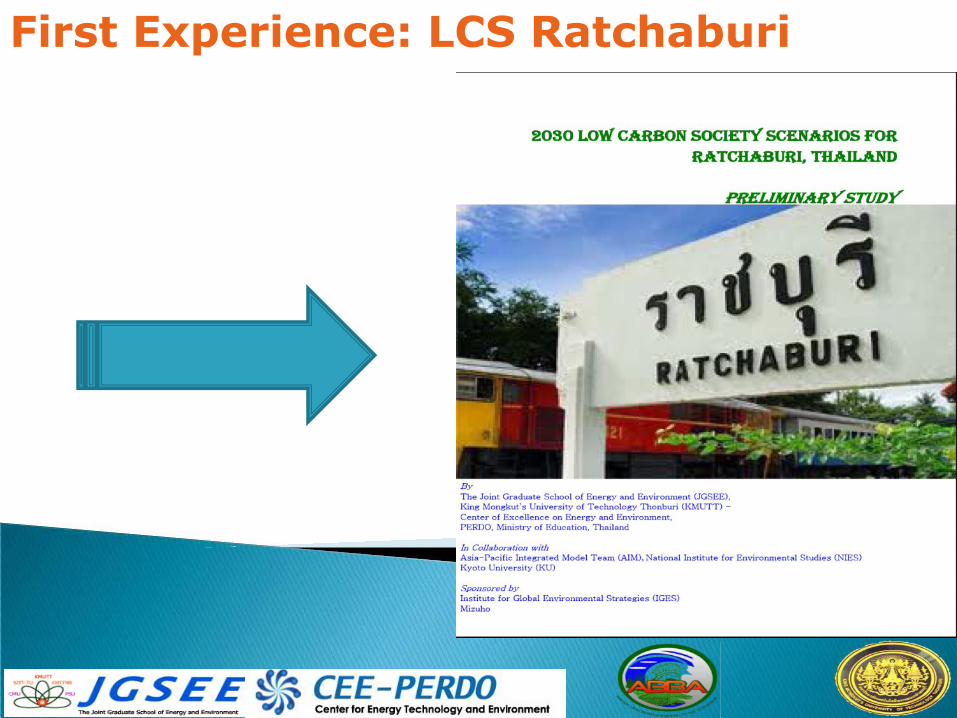
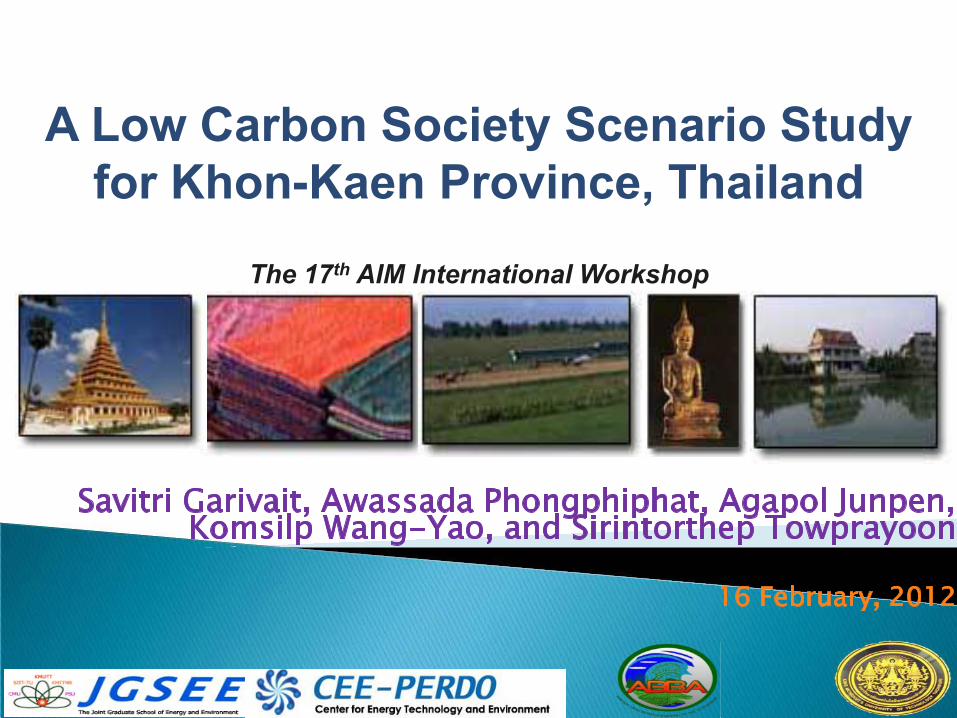
First Experience: LCS Ratchaburi
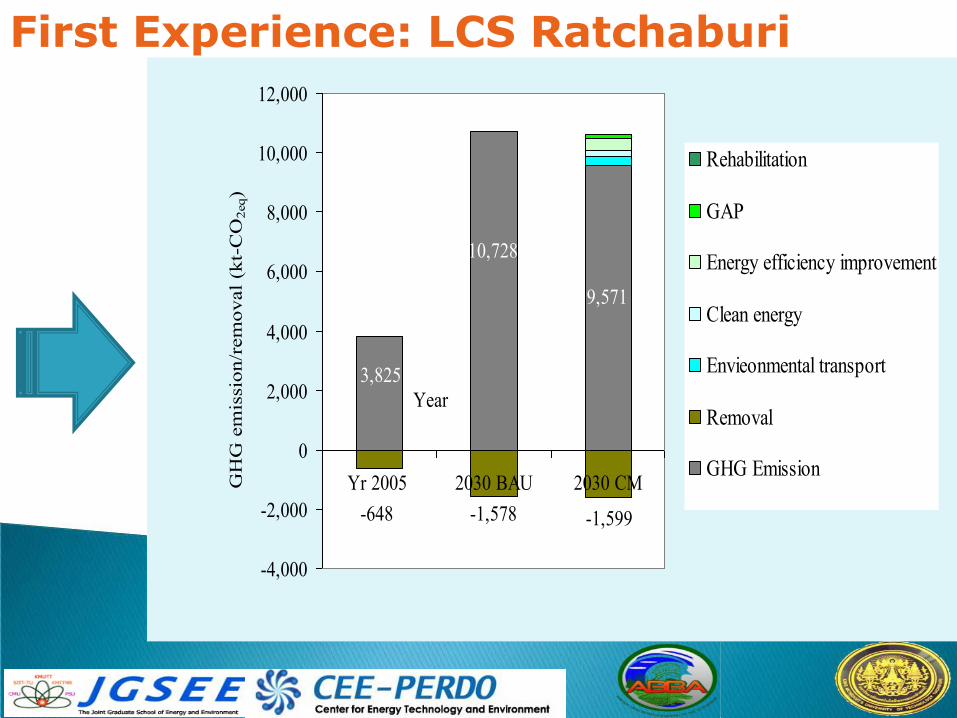
First Experience: LCS Ratchaburi
3,825
10,728
9,571
-648 -1,578 -1,599
-4,000
-2,000
0
2,000
4,000
6,000
8,000
10,000
12,000
Yr 2005 2030 BAU 2030 CM
Year
GH
G e
mis
sion
/rem
oval
(kt
-CO
2eq)
Rehabilitation
GAP
Energy efficiency improvement
Clean energy
Envieonmental transport
Removal
GHG Emission
Motivation to Develop LCSS for Khon-Kaen • Khon Kaen has developed a roadmap of Khon
Kaen towards Low Carbon City since 2009 to support Khon Kaen’s Declaration on Climate Change Adaptation and Mitigation 2020
• Khon Kaen’s vision of LCS : To become the Low Carbon City of Greater Mekong Sub-region
• Khon Kaen’s Socio-economic Development Plan : To become the 3H = Happiness Community, Healthy City, and Hub of GMS
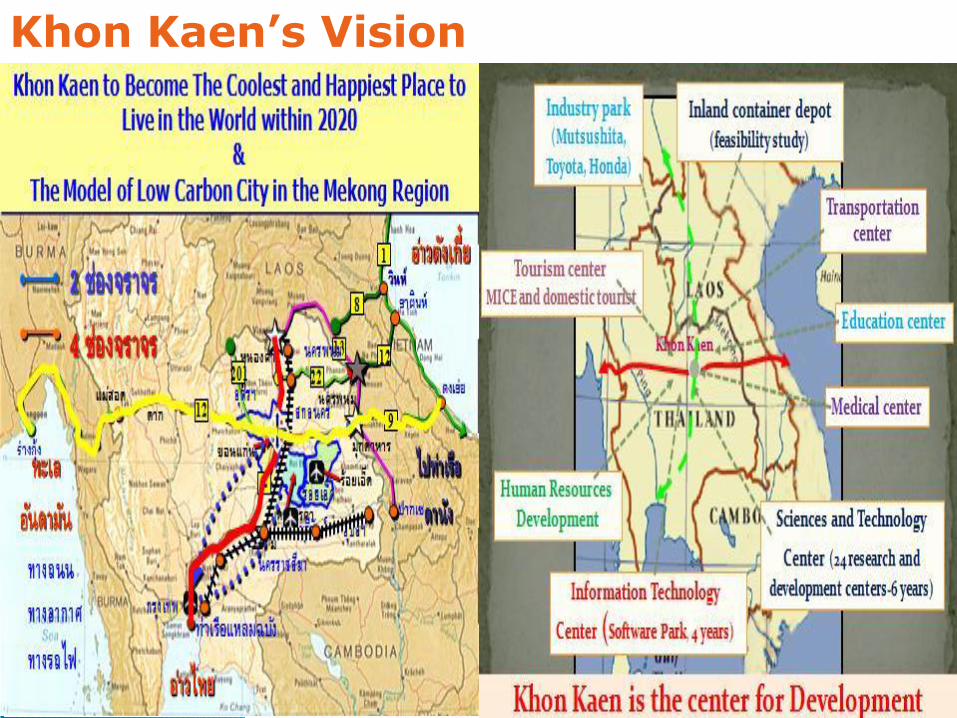
Khon Kaen’s Vision
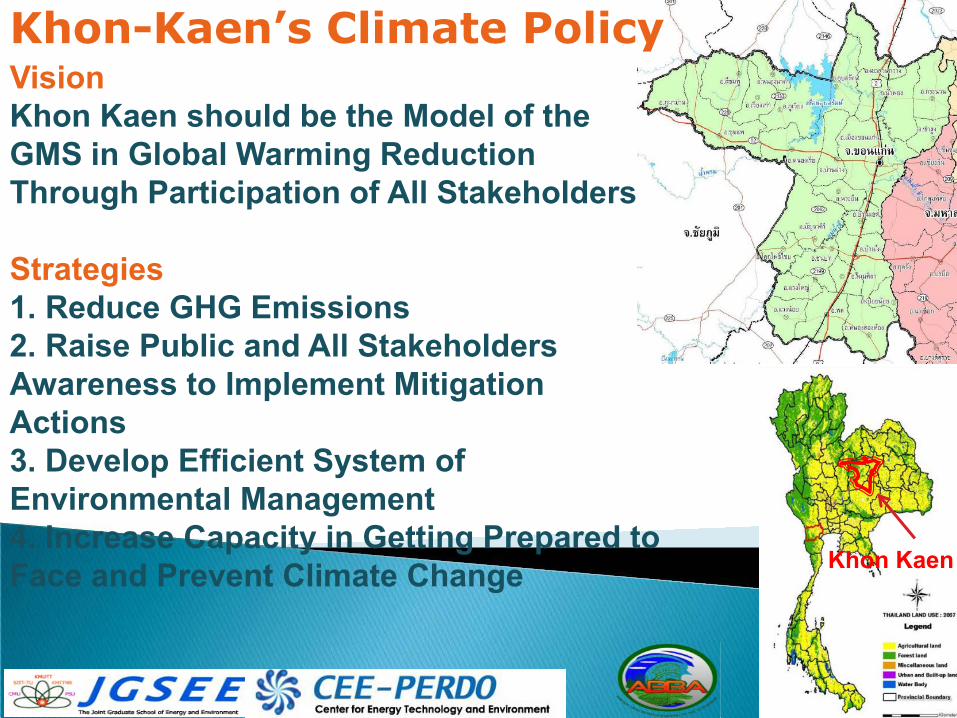
Vision Khon Kaen should be the Model of the GMS in Global Warming Reduction Through Participation of All Stakeholders Strategies 1. Reduce GHG Emissions 2. Raise Public and All Stakeholders Awareness to Implement Mitigation Actions 3. Develop Efficient System of Environmental Management 4. Increase Capacity in Getting Prepared to Face and Prevent Climate Change Khon Kaen
Khon-Kaen’s Climate Policy
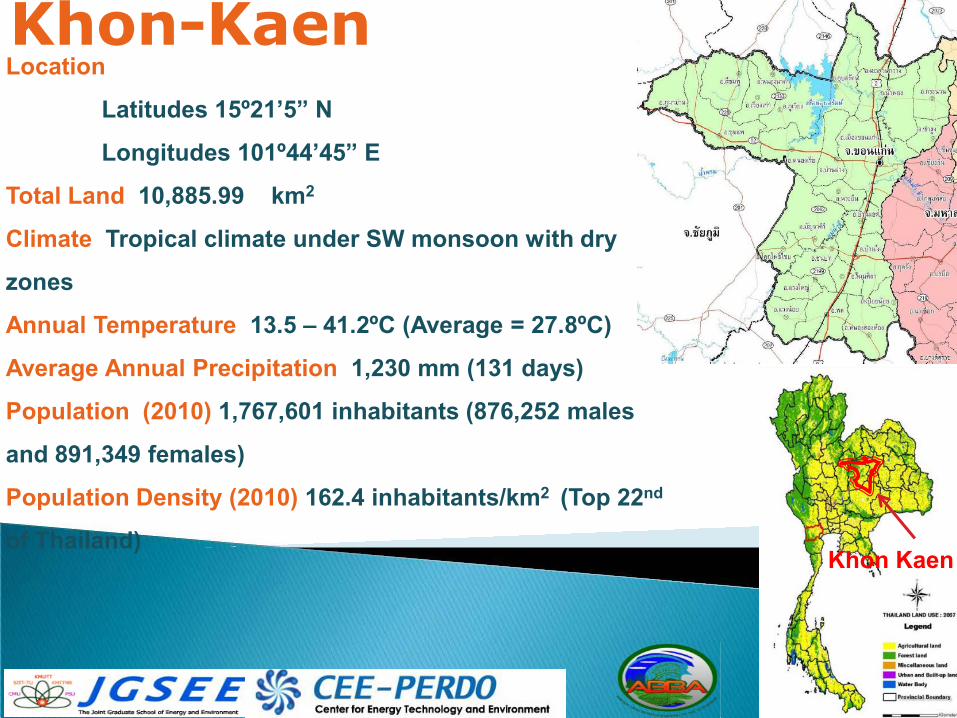
Khon-Kaen Location
Latitudes 15º21’5” N
Longitudes 101º44’45” E
Total Land 10,885.99 km2
Climate Tropical climate under SW monsoon with dry
zones
Annual Temperature 13.5 – 41.2ºC (Average = 27.8ºC)
Average Annual Precipitation 1,230 mm (131 days)
Population (2010) 1,767,601 inhabitants (876,252 males
and 891,349 females)
Population Density (2010) 162.4 inhabitants/km2 (Top 22nd
of Thailand) Khon Kaen
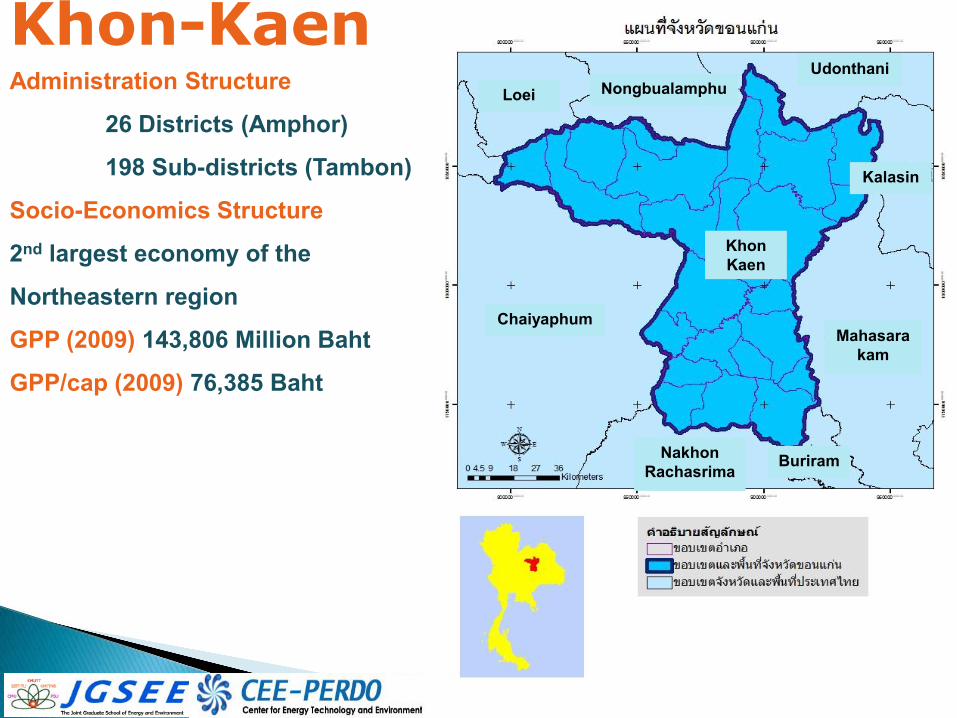
Khon-Kaen Administration Structure
26 Districts (Amphor)
198 Sub-districts (Tambon)
Socio-Economics Structure
2nd largest economy of the
Northeastern region
GPP (2009) 143,806 Million Baht
GPP/cap (2009) 76,385 Baht
Loei Nongbualamphu Udonthani
Kalasin
Mahasarakam
Buriram Nakhon Rachasrima
Chaiyaphum
Khon Kaen
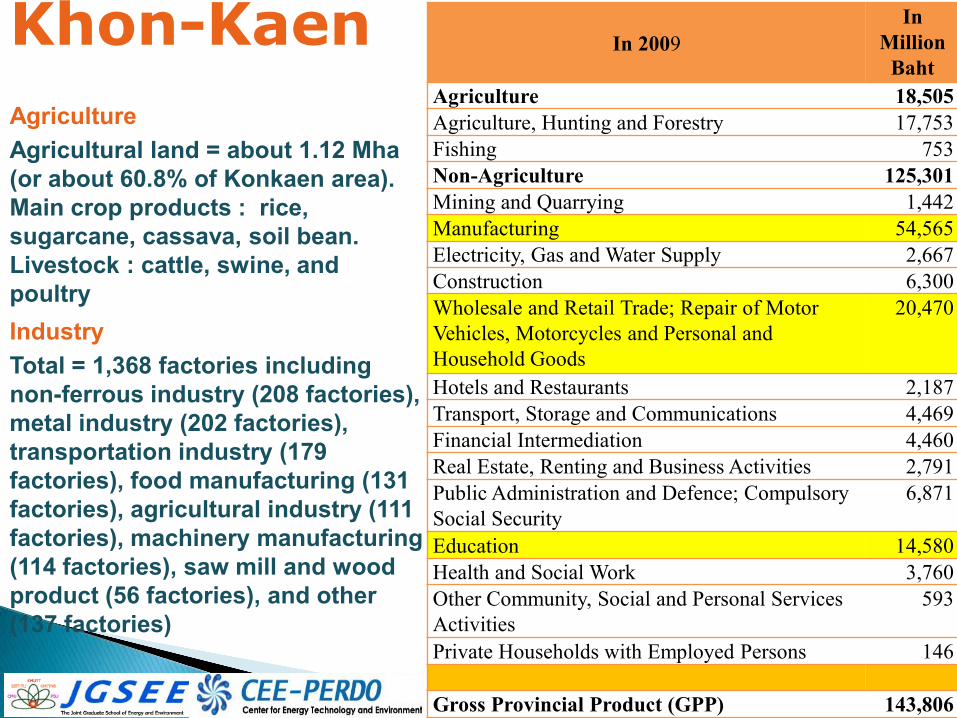
Khon-Kaen
Agriculture Agricultural land = about 1.12 Mha (or about 60.8% of Konkaen area). Main crop products : rice, sugarcane, cassava, soil bean. Livestock : cattle, swine, and poultry Industry Total = 1,368 factories including non-ferrous industry (208 factories), metal industry (202 factories), transportation industry (179 factories), food manufacturing (131 factories), agricultural industry (111 factories), machinery manufacturing (114 factories), saw mill and wood product (56 factories), and other (137 factories)
In 2009 In
Million Baht
Agriculture 18,505 Agriculture, Hunting and Forestry 17,753 Fishing 753 Non-Agriculture 125,301 Mining and Quarrying 1,442 Manufacturing 54,565 Electricity, Gas and Water Supply 2,667 Construction 6,300 Wholesale and Retail Trade; Repair of Motor Vehicles, Motorcycles and Personal and Household Goods
20,470
Hotels and Restaurants 2,187 Transport, Storage and Communications 4,469 Financial Intermediation 4,460 Real Estate, Renting and Business Activities 2,791 Public Administration and Defence; Compulsory Social Security
6,871
Education 14,580 Health and Social Work 3,760 Other Community, Social and Personal Services Activities
593
Private Households with Employed Persons 146 Gross Provincial Product (GPP) 143,806
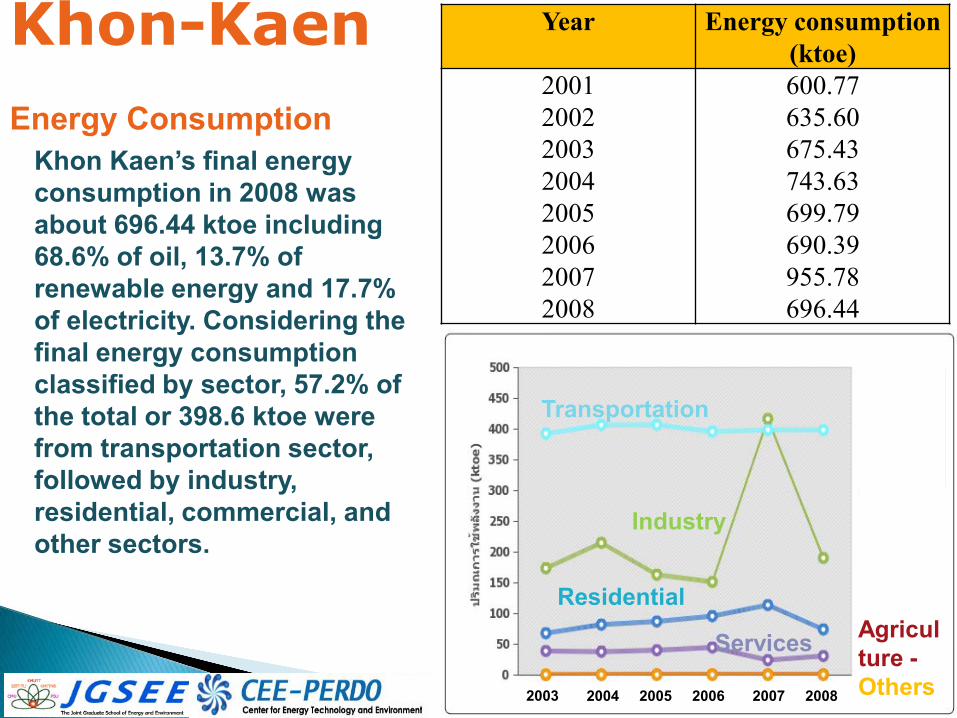
Khon-Kaen
Energy Consumption Khon Kaen’s final energy consumption in 2008 was about 696.44 ktoe including 68.6% of oil, 13.7% of renewable energy and 17.7% of electricity. Considering the final energy consumption classified by sector, 57.2% of the total or 398.6 ktoe were from transportation sector, followed by industry, residential, commercial, and other sectors.
Year Energy consumption (ktoe)
2001 600.77 2002 635.60 2003 675.43 2004 743.63 2005 699.79 2006 690.39 2007 955.78 2008 696.44
Transportation
Industry
Residential
Services Agriculture - Others 2003 2004 2005 2006 2007 2008
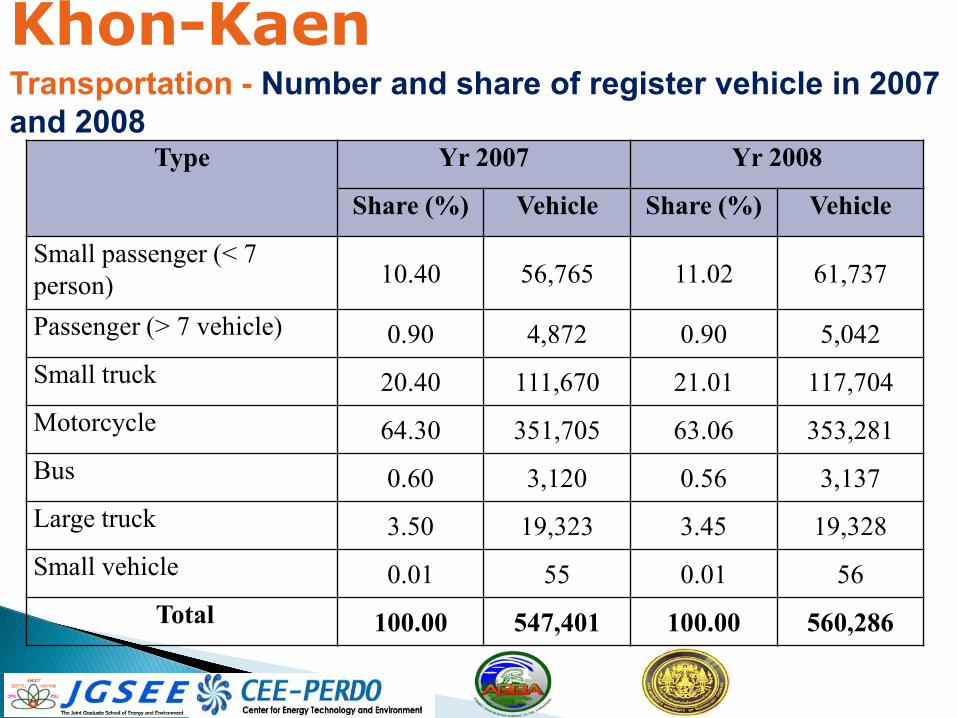
Khon-Kaen Transportation - Number and share of register vehicle in 2007 and 2008
Type Yr 2007 Yr 2008
Share (%) Vehicle Share (%) Vehicle
Small passenger (< 7 person) 10.40 56,765 11.02 61,737
Passenger (> 7 vehicle) 0.90 4,872 0.90 5,042 Small truck 20.40 111,670 21.01 117,704 Motorcycle 64.30 351,705 63.06 353,281 Bus 0.60 3,120 0.56 3,137 Large truck 3.50 19,323 3.45 19,328 Small vehicle 0.01 55 0.01 56
Total 100.00 547,401 100.00 560,286
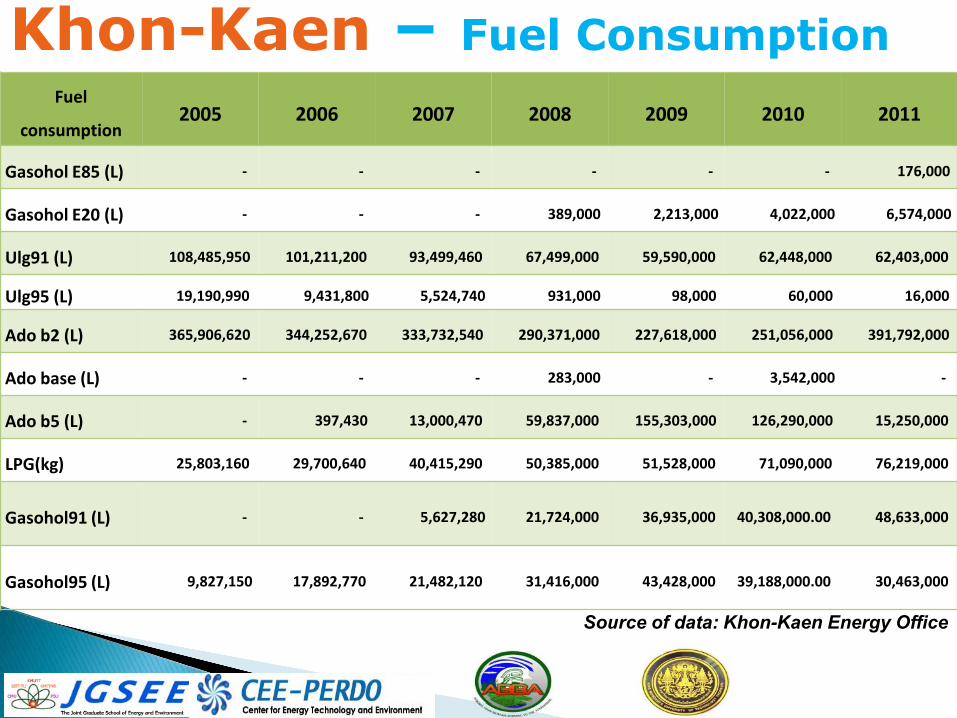
Khon-Kaen – Fuel Consumption
Source of data: Khon-Kaen Energy Office
Fuel
consumption 2005 2006 2007 2008 2009 2010 2011
Gasohol E85 (L) - - - - - - 176,000
Gasohol E20 (L) - - - 389,000 2,213,000 4,022,000 6,574,000
Ulg91 (L) 108,485,950 101,211,200 93,499,460 67,499,000 59,590,000 62,448,000 62,403,000
Ulg95 (L) 19,190,990 9,431,800 5,524,740 931,000 98,000 60,000 16,000
Ado b2 (L) 365,906,620 344,252,670 333,732,540 290,371,000 227,618,000 251,056,000 391,792,000
Ado base (L) - - - 283,000 - 3,542,000 -
Ado b5 (L) - 397,430 13,000,470 59,837,000 155,303,000 126,290,000 15,250,000
LPG(kg) 25,803,160 29,700,640 40,415,290 50,385,000 51,528,000 71,090,000 76,219,000
Gasohol91 (L) - - 5,627,280 21,724,000 36,935,000 40,308,000.00 48,633,000
Gasohol95 (L) 9,827,150 17,892,770 21,482,120 31,416,000 43,428,000 39,188,000.00 30,463,000
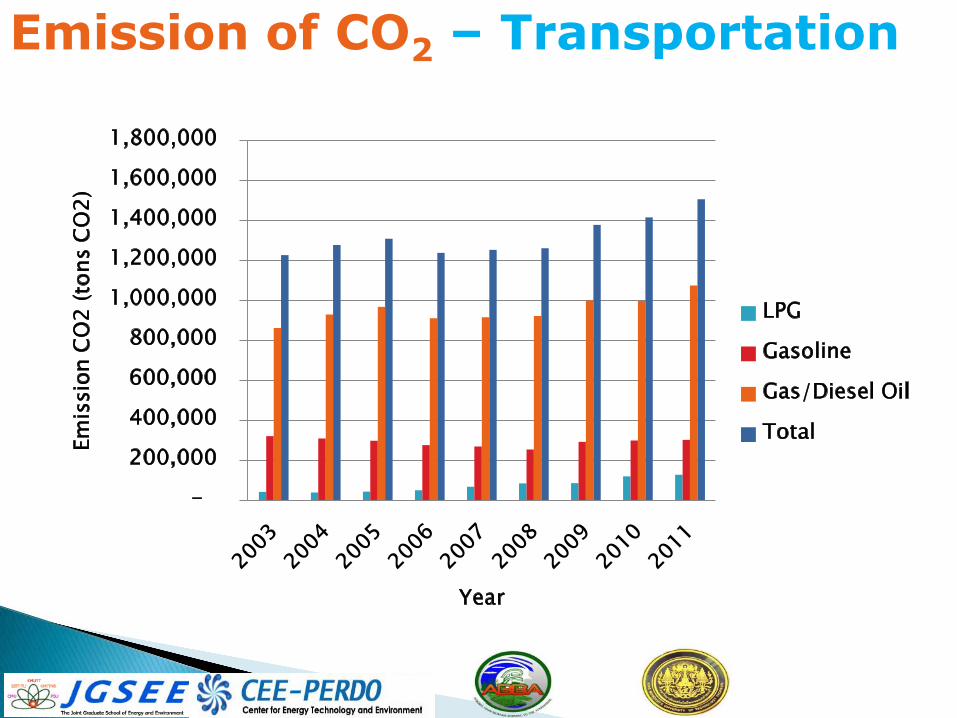
Emission of CO2 – Transportation
- 200,000 400,000 600,000 800,000
1,000,000 1,200,000 1,400,000 1,600,000 1,800,000
Emis
sion
CO2
(ton
s CO
2)
Year
LPG Gasoline Gas/Diesel Oil Total
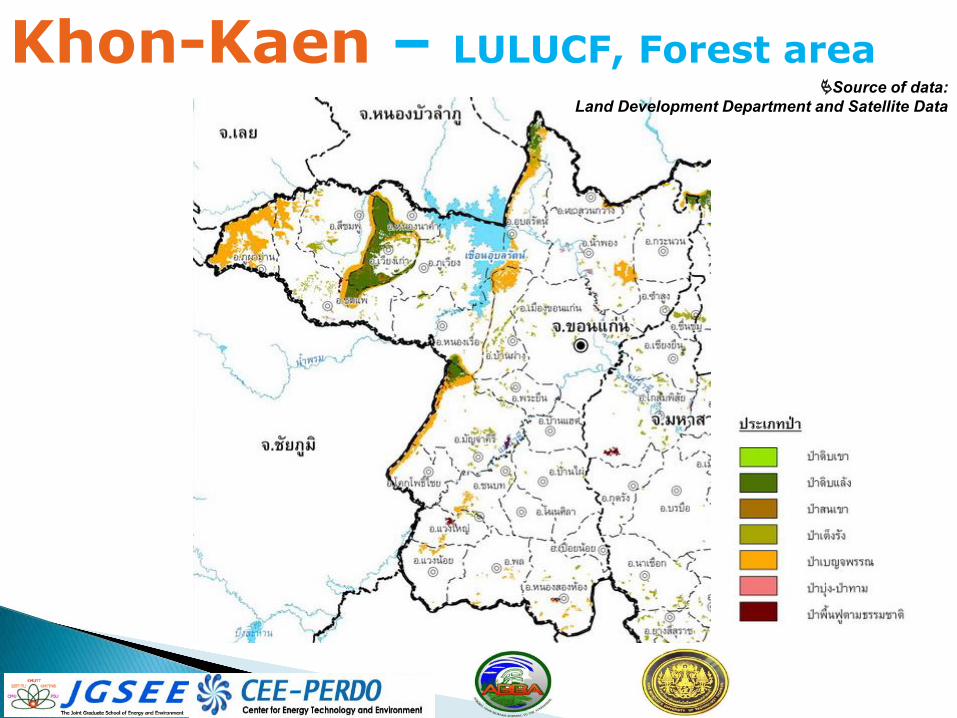
Khon-Kaen – LULUCF, Forest area Source of data:
Land Development Department and Satellite Data
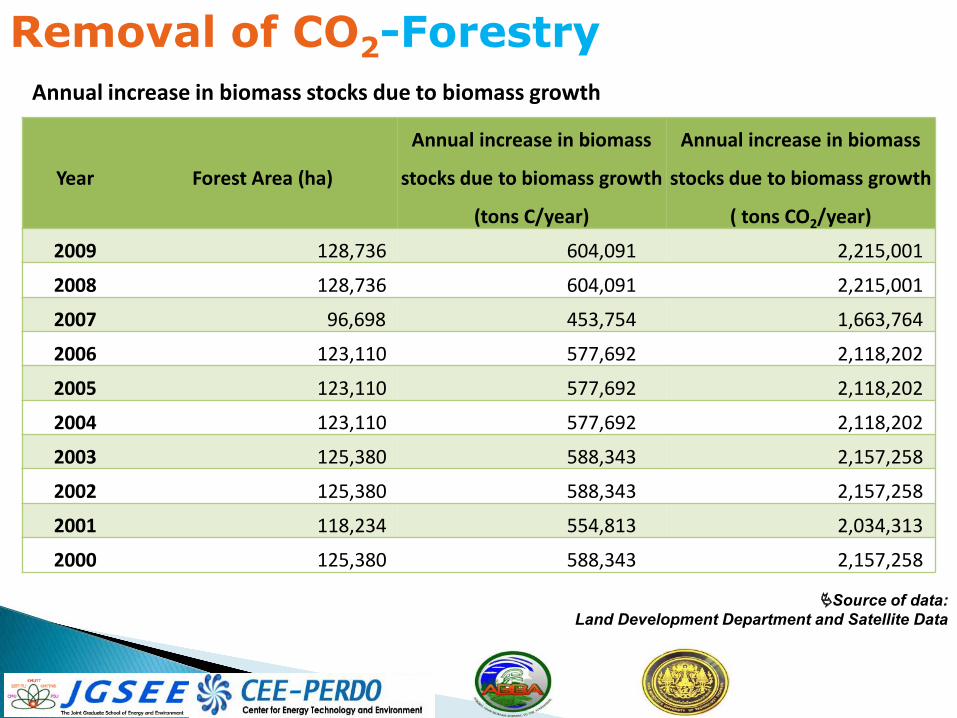
Removal of CO2-Forestry
Year Forest Area (ha)
Annual increase in biomass
stocks due to biomass growth
(tons C/year)
Annual increase in biomass
stocks due to biomass growth
( tons CO2/year)
2009 128,736 604,091 2,215,001
2008 128,736 604,091 2,215,001
2007 96,698 453,754 1,663,764
2006 123,110 577,692 2,118,202
2005 123,110 577,692 2,118,202
2004 123,110 577,692 2,118,202
2003 125,380 588,343 2,157,258
2002 125,380 588,343 2,157,258
2001 118,234 554,813 2,034,313
2000 125,380 588,343 2,157,258
Annual increase in biomass stocks due to biomass growth
Source of data: Land Development Department and Satellite Data
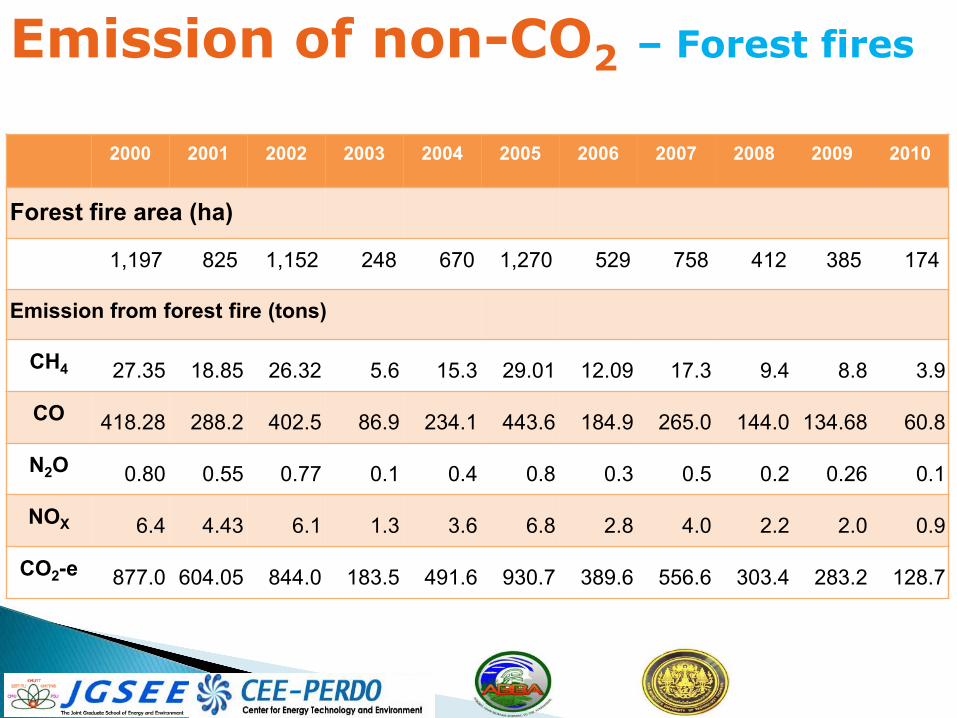
Emission of non-CO2 – Forest fires
2000 2001 2002 2003 2004 2005 2006 2007 2008 2009 2010
Forest fire area (ha)
1,197 825 1,152 248 670 1,270 529 758 412 385 174
Emission from forest fire (tons)
CH4 27.35 18.85 26.32 5.6 15.3 29.01 12.09 17.3 9.4 8.8 3.9
CO 418.28 288.2 402.5 86.9 234.1 443.6 184.9 265.0 144.0 134.68 60.8
N2O 0.80 0.55 0.77 0.1 0.4 0.8 0.3 0.5 0.2 0.26 0.1
NOX 6.4 4.43 6.1 1.3 3.6 6.8 2.8 4.0 2.2 2.0 0.9
CO2-e 877.0 604.05 844.0 183.5 491.6 930.7 389.6 556.6 303.4 283.2 128.7
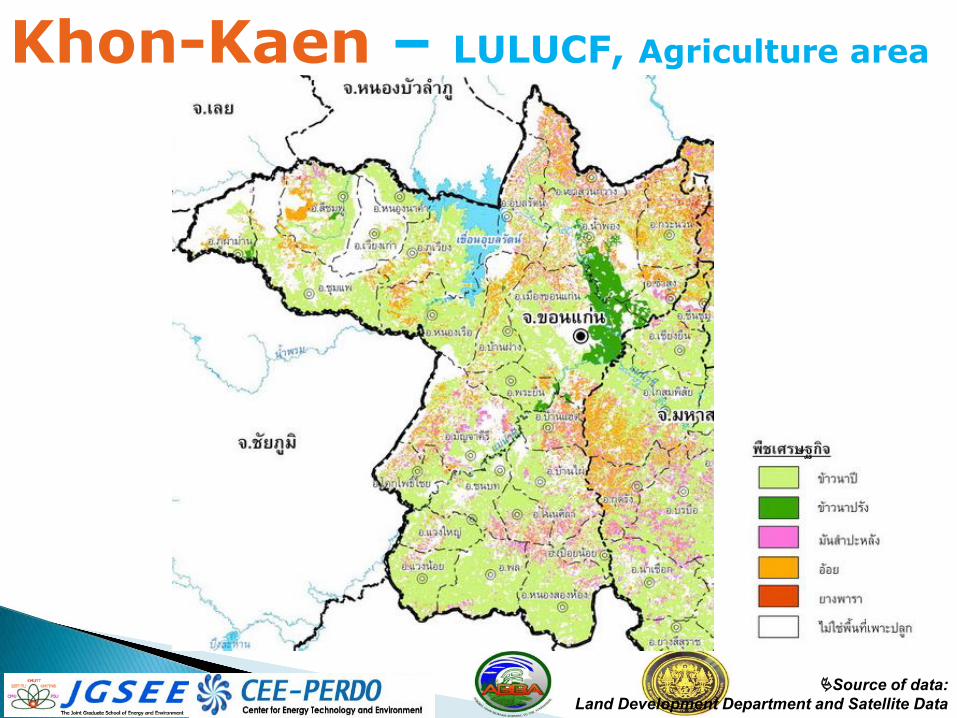
Khon-Kaen – LULUCF, Agriculture area
Source of data:Land Development Department and Satellite Data
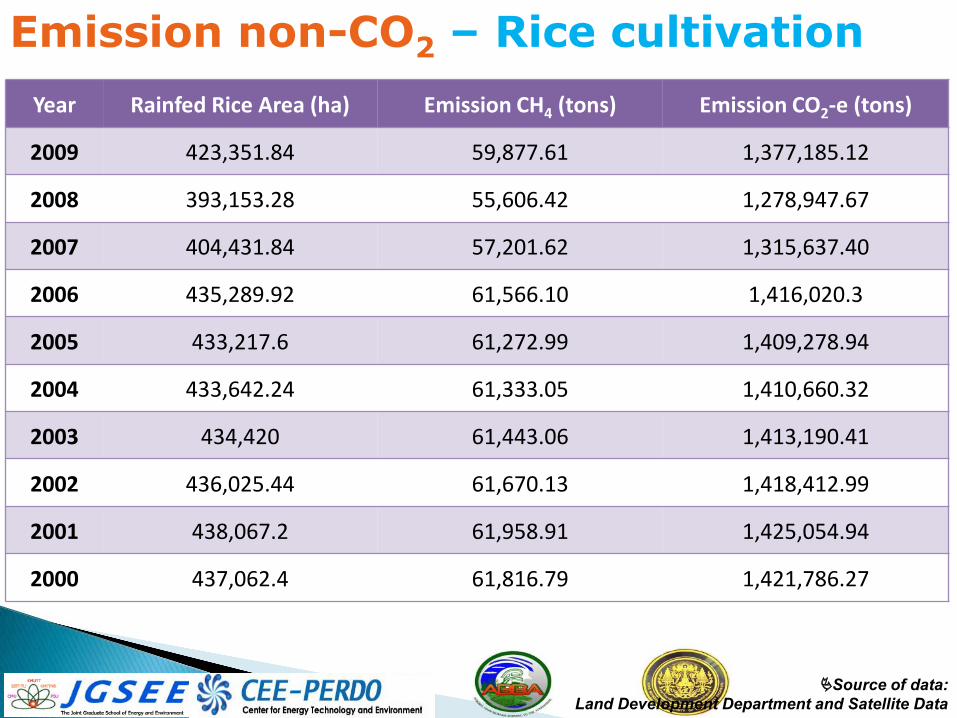
Emission non-CO2 – Rice cultivation
Source of data:Land Development Department and Satellite Data
Year Rainfed Rice Area (ha) Emission CH4 (tons) Emission CO2-e (tons)
2009 423,351.84 59,877.61 1,377,185.12
2008 393,153.28 55,606.42 1,278,947.67
2007 404,431.84 57,201.62 1,315,637.40
2006 435,289.92 61,566.10 1,416,020.3
2005 433,217.6 61,272.99 1,409,278.94
2004 433,642.24 61,333.05 1,410,660.32
2003 434,420 61,443.06 1,413,190.41
2002 436,025.44 61,670.13 1,418,412.99
2001 438,067.2 61,958.91 1,425,054.94
2000 437,062.4 61,816.79 1,421,786.27
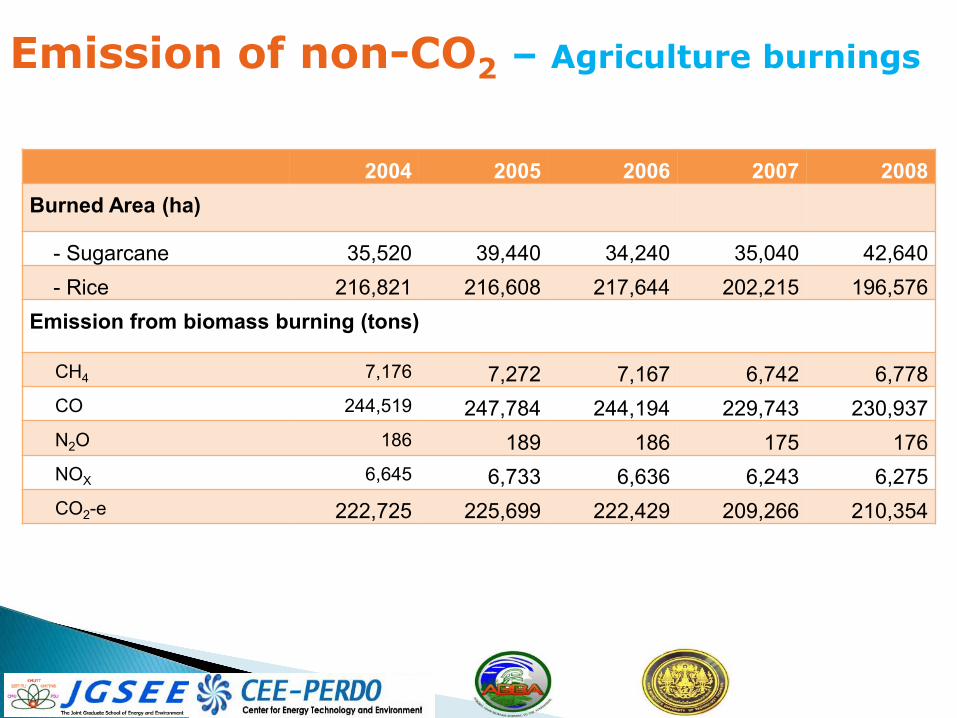
Emission of non-CO2 – Agriculture burnings
2004 2005 2006 2007 2008
Burned Area (ha)
- Sugarcane 35,520 39,440 34,240 35,040 42,640
- Rice 216,821 216,608 217,644 202,215 196,576
Emission from biomass burning (tons)
CH4 7,176 7,272 7,167 6,742 6,778
CO 244,519 247,784 244,194 229,743 230,937
N2O 186 189 186 175 176
NOX 6,645 6,733 6,636 6,243 6,275
CO2-e 222,725 225,699 222,429 209,266 210,354
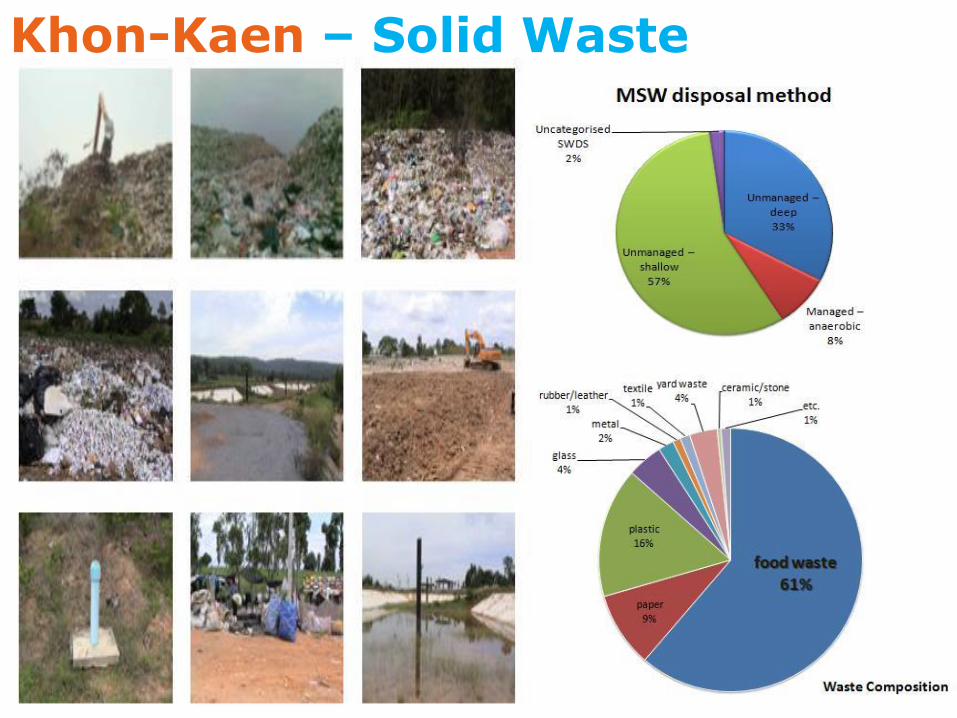
Khon-Kaen – Solid Waste
Next Steps Forward
• To perform emissions projections for BAU and CM scenarios using ExSS and IPCC GLs
• Evaluate the effectiveness of CM set based on Khon Kaen’s Development Plan
• Use findings and lessons learnt to support Bangkok Metropolitan Administration in developing the BMA Master Plan on Climate Change Adaptation and Mitigation 2013-2023 funded by JICA
22
ขอบคุณค่ะ Khob Khun Kha
สวสัดคี่ะ Sawasdee Kha
Finally… Live Coolly with Strategy
(LCS)