Embed Size (px)
Citation preview
A long-term program to monitorthe health of nearshore reefsRegional evaluation and site selection
Report prepared for the Northern Rivers CatchmentManagement Authority and the NSW Departmentof Environment and Climate Change, March 2009
Stephen D. A. Smith, Steven J. Dalton,Matthew A. Harrison and Thomas Bowling
1
LONG-TERM PROGRAM TO MONITOR THE HEALTH OF NEARSHORE REEFS
Regional evaluation and site selection
S. D. A. Smith1,2
S. J. Dalton1,2
M. A. Harrison1,2
and T. Bowling1
1National Marine Science Centre
Coffs Harbour NSW 2450 2School of Environmental and Rural Science
University of New England NSW
Report prepared for the Northern Rivers Catchment Management Authority and the NSW Department of Environment and Climate Change. March 2009.
2
Acknowledgements We would like to thank the following people for assistance with various aspects of the 2008 work (for those contributing to data collected in 2006, which is also included in this report, see Smith et al. 2006): Funding: This report is a synthesis of data collected primarily under NRCMA contracts. However, additional data collection in 2008, from 6 reefs in Marine Protected Areas, was funded by NSW DECC as part of the habitat mapping program. Roger Stanley (NRCMA) and Dr Alan Jordan (DECC) were the primary contacts at the two agencies. Research assistance: Dr Michael Rule (debris, echinoderms, fish), Margie Mohring (debris and echinoderms) and Sasha Posthuma-Grbic (echinoderms) provided diving assistance in 2008. Boating, diving and logistic support in 2008: Sawtell to Nambucca – Gary Shipley (NMSC), Mike Davey and Steve Starling (Jetty Dive Centre); Tweed Coast – Mal Hennesy, Byron Bay – Matt Dasey and Andrew Page (NSW Marine Park Authority, Cape Byron Marine Park) , Wooli – Mick Christian and Stan Young. Production of Figs. 1, 2: Kathryn James. This report should be cited as: Smith, S. D. A., Dalton, S. J., Harrison, M. A. and Bowling, T. (2009). Long term program to monitor the health of nearshore reefs. Regional evaluation and site selection. A National Marine Science Centre Report to the Northern Rivers Catchment Management Authority and the NSW Department of Environment and Climate Change. March 2009. 24 pp. Contact details for the principal author: Assoc. Prof. Steve Smith, National Marine Science Centre, PO Box J321, Coffs Harbour, NSW 2450. Email: [email protected]
3
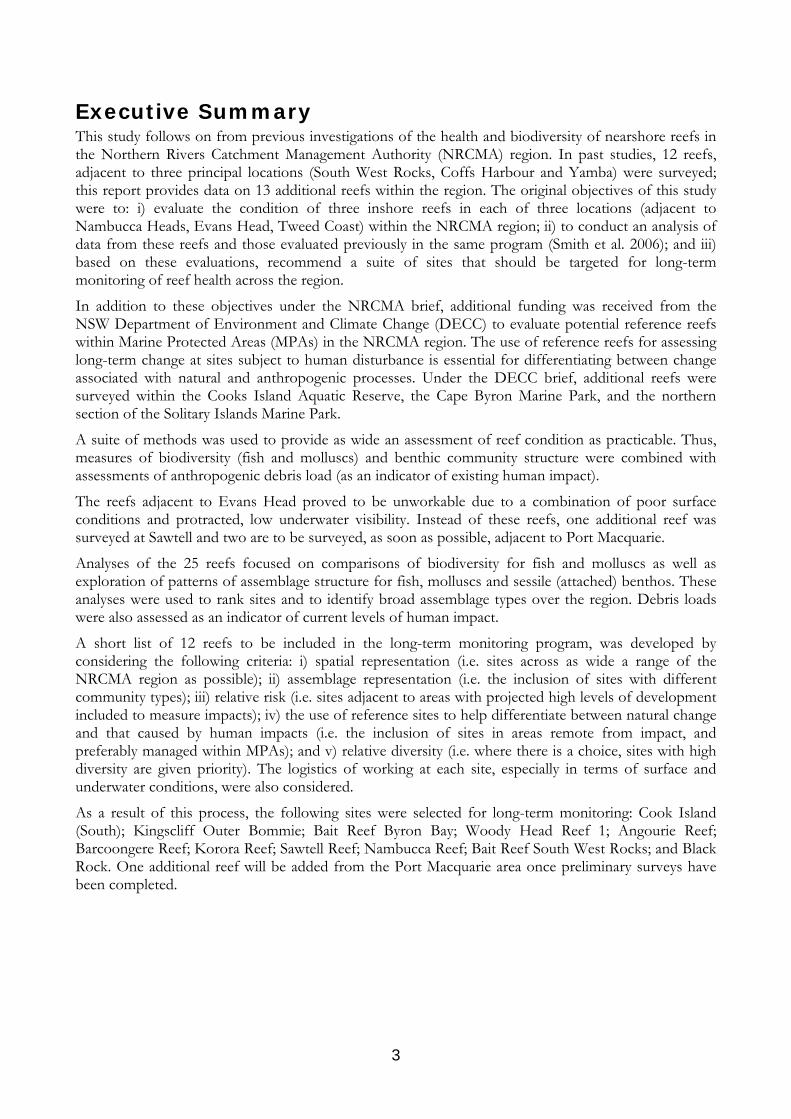
Executive Summary This study follows on from previous investigations of the health and biodiversity of nearshore reefs in the Northern Rivers Catchment Management Authority (NRCMA) region. In past studies, 12 reefs, adjacent to three principal locations (South West Rocks, Coffs Harbour and Yamba) were surveyed; this report provides data on 13 additional reefs within the region. The original objectives of this study were to: i) evaluate the condition of three inshore reefs in each of three locations (adjacent to Nambucca Heads, Evans Head, Tweed Coast) within the NRCMA region; ii) to conduct an analysis of data from these reefs and those evaluated previously in the same program (Smith et al. 2006); and iii) based on these evaluations, recommend a suite of sites that should be targeted for long-term monitoring of reef health across the region.
In addition to these objectives under the NRCMA brief, additional funding was received from the NSW Department of Environment and Climate Change (DECC) to evaluate potential reference reefs within Marine Protected Areas (MPAs) in the NRCMA region. The use of reference reefs for assessing long-term change at sites subject to human disturbance is essential for differentiating between change associated with natural and anthropogenic processes. Under the DECC brief, additional reefs were surveyed within the Cooks Island Aquatic Reserve, the Cape Byron Marine Park, and the northern section of the Solitary Islands Marine Park.
A suite of methods was used to provide as wide an assessment of reef condition as practicable. Thus, measures of biodiversity (fish and molluscs) and benthic community structure were combined with assessments of anthropogenic debris load (as an indicator of existing human impact).
The reefs adjacent to Evans Head proved to be unworkable due to a combination of poor surface conditions and protracted, low underwater visibility. Instead of these reefs, one additional reef was surveyed at Sawtell and two are to be surveyed, as soon as possible, adjacent to Port Macquarie.
Analyses of the 25 reefs focused on comparisons of biodiversity for fish and molluscs as well as exploration of patterns of assemblage structure for fish, molluscs and sessile (attached) benthos. These analyses were used to rank sites and to identify broad assemblage types over the region. Debris loads were also assessed as an indicator of current levels of human impact.
A short list of 12 reefs to be included in the long-term monitoring program, was developed by considering the following criteria: i) spatial representation (i.e. sites across as wide a range of the NRCMA region as possible); ii) assemblage representation (i.e. the inclusion of sites with different community types); iii) relative risk (i.e. sites adjacent to areas with projected high levels of development included to measure impacts); iv) the use of reference sites to help differentiate between natural change and that caused by human impacts (i.e. the inclusion of sites in areas remote from impact, and preferably managed within MPAs); and v) relative diversity (i.e. where there is a choice, sites with high diversity are given priority). The logistics of working at each site, especially in terms of surface and underwater conditions, were also considered.
As a result of this process, the following sites were selected for long-term monitoring: Cook Island (South); Kingscliff Outer Bommie; Bait Reef Byron Bay; Woody Head Reef 1; Angourie Reef; Barcoongere Reef; Korora Reef; Sawtell Reef; Nambucca Reef; Bait Reef South West Rocks; and Black Rock. One additional reef will be added from the Port Macquarie area once preliminary surveys have been completed.
4
Contents Acknowledgements ..................................................................................................................................... 2
Executive Summary ..................................................................................................................................... 3
Introduction .................................................................................................................................................. 5
Methods ........................................................................................................................................................ 5
Study sites ................................................................................................................................................. 5
Field and laboratory methods ................................................................................................................ 6
General study design .......................................................................................................................... 6
Fish community structure ................................................................................................................. 9
Mollusc biodiversity ......................................................................................................................... 10
Benthic community structure ......................................................................................................... 10
Debris ................................................................................................................................................. 11
Habitat complexity ........................................................................................................................... 11
Statistical methods ................................................................................................................................. 11
Univariate methods .......................................................................................................................... 12
Multivariate methods ....................................................................................................................... 12
Results ......................................................................................................................................................... 13
General ................................................................................................................................................... 13
Fish community structure .................................................................................................................... 13
Comparative diversity ...................................................................................................................... 13
Multivariate analyses ......................................................................................................................... 13
Mollusc community structure .............................................................................................................. 15
Comparative diversity ...................................................................................................................... 15
Multivariate analyses ......................................................................................................................... 15
Benthic community structure .............................................................................................................. 16
Multivariate analyses ......................................................................................................................... 16
Debris surveys ....................................................................................................................................... 17
Discussion ................................................................................................................................................... 20
References ................................................................................................................................................... 22
Appendix 1: Summary of data values for each reef .............................................................................. 24
5
Introduction The primary objectives of this study, which was funded jointly by the Northern Rivers Catchment Management Authority (NRCMA) and NSW Department of Environment and Climate Change (DECC), was to provide reports on the biodiversity, condition and health of nearshore reefs within the marine section of the Northern Rivers region of New South Wales. The work, which builds on the results of surveys conducted in 2006 (Smith et al. 2006), represents the final planning stage for the implementation of a Long-term Monitoring Program (LTMP) for reef health in the NRCMA region. The rationale for targeting nearshore reefs is that they are the first diverse marine habitat likely to be affected by changes in adjacent land-use; thus, they are useful targets for monitoring associated anthropogenic effects (Smith et al. 2008).
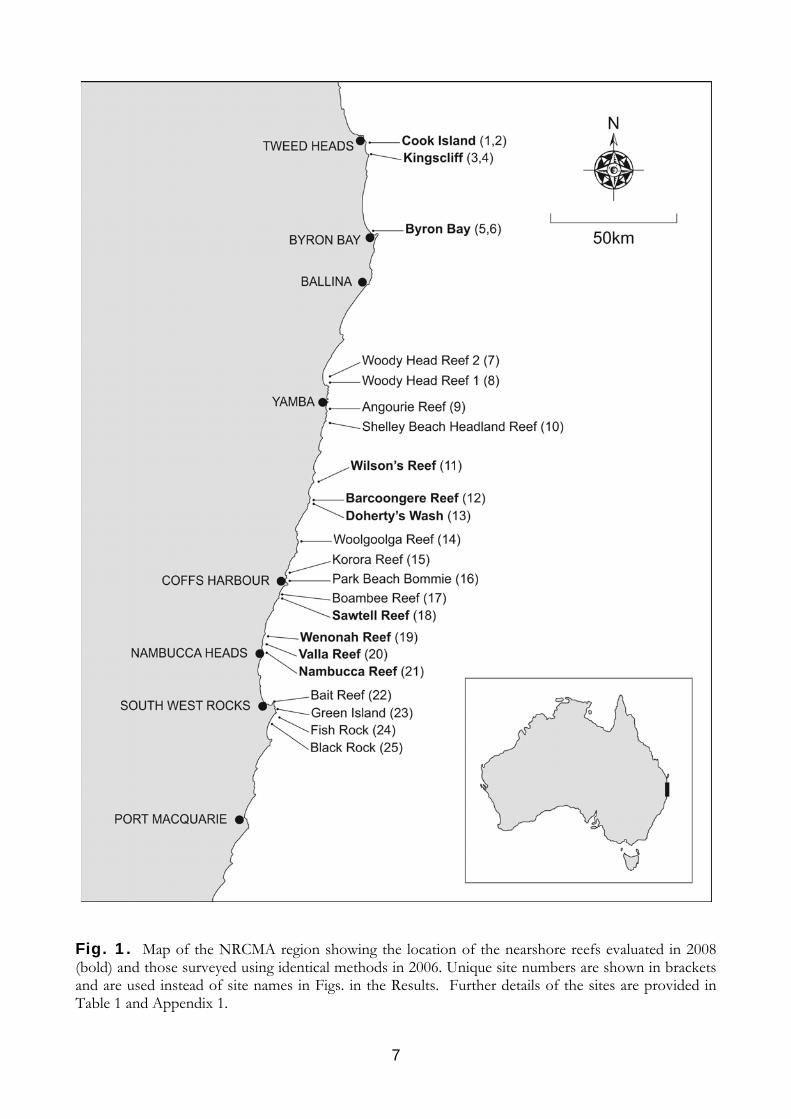
Previous work focused on three key locations within the region - South West Rocks, Coffs Harbour and Yamba. The additional survey work conducted during this study focused on locations that were chosen to: i) improve coverage of the NRCMA coastal region; ii) assess the influence of specific biogeographic/oceanographic features; and iii) provide data from reefs within Marine Protected Areas (MPAs) to act as reference sites for long-term monitoring. Thus, surveys were conducted at the northern end of the NRCMA region (Tweed Coast) and reefs adjacent to Nambucca Heads were evaluated as this area lies on the biogeographic boundary between the Tweed-Moreton and Manning Shelf bioregions. Reefs adjacent to Evans Head, an area of known upwelling, were also targeted but conditions throughout the survey period (primarily very poor underwater visibility) prevented data collection at this location (see below). Finally, reefs in the Cook Island Aquatic Reserve (CIAR), Cape Byron Marine Park (CBMP) and Solitary Islands Marine Park (SIMP) were targeted to provide spatially representative reference sites.
Specifically, the study had the following nominated aims:
1. evaluation of the condition of inshore reefs potentially threatened by land-based activity;
2. comparison of biodiversity and anthropogenic impacts across the full range of reefs for which similar data are available (i.e. including 12 surveyed in 2006); and
3. the recommendation of a subset of sites that will be the focus of a Long-term Monitoring Program with the objective of evaluating the effects of changing land-use patterns on marine communities.
Methods
Study sites The initial design of this study was to target groups of three reefs adjacent to (north to south) the Tweed Coast, Evans Head and Nambucca Heads. With the supplementary funding from NSW DECC, additional sites were targeted in the CIAR (1), CBMP (2) and SIMP (3).
For the non-MPA locations, three reefs were targeted to provide an indication of variation within a region as well as between regions. A high level of small-scale variation was the primary finding of previous work on nearshore reefs within the region (Smith et al. 2006, Smith et al. 2008) and so it is important that a number of sites are evaluated within a location to quantify this variation.
There are relatively few reefs on the Tweed Coast that are less than 2 km from shore with sufficient reef area within a depth range of 8-12 m depth (the protocol for the nearshore reef program - Smith et al. 2006, Rule & Smith 2007). As a result, the southern reef associated with Cook Island and two sections of reef adjacent to Kingscliff, were targeted. The site at Cook Island was selected not only because it was the closest to shore of the island-associated fringing reef, but also because surveys have been conducted at this site in the past, allowing a broader evaluation of temporal change (Edwards &
6
Smith 2005). One additional site, on the northern aspect of Cook Island, was chosen as a reference site within the MPA (Fig. 1, Table 1).
Two reefs, within the relatively protected embayment to the north of Cape Byron, were surveyed within the CBMP. While both sites were surveyed as part of the MPA component of the work they also improved spatial coverage of sampling sites across the northern section of the NRCMA region (Fig. 1, Table 1).
The Evans Head coastal region is of considerable interest given its relatively low levels of development and position adjacent to an area of known upwelling. For this reason, three sites were to be targeted from the extensive section of nearshore reefs to the south of Evans Head. However, with the combination of coastal runoff (including tannin-stained water from Jerusalem Creek), naturally low levels of visibility, and the exposed nature of the study sites, surveys could not be completed despite numerous planned trips. For this reason, alternative sites were targeted (one at Sawtell and two adjacent to Port Macquarie – the latter two are still to be surveyed – see below).
Three reefs were selected in the northern section of the SIMP as reference sites. Barcoongere Reef was within a designated Sanctuary Zone while the other two sites (Wilson’s Reef and Doherty’s Wash) provided data from varying distances from shore (420-1750 m – see Appendix 1).
Nambucca Heads is the boundary between the Manning Shelf (to the south) and Tweed-Moreton bioregions and, as such, was a nominated region of interest for evaluation of the composition and health of reef communities. There are very extensive sections of reef northwards from Nambucca Heads and three site were chosen immediately offshore from Nambucca, Valla Beach and Wenonah Headland (Fig. 1, Table 1).
Study locations and sites evaluated in this study are shown in Fig. 1 and specific coordinates for each site are listed in Table 1.
Field and laboratory methods
General study design The suite of methods used in this study was chosen to provide as wide an assessment of reef condition as practicable. Thus, measures of biodiversity were combined with assessments of anthropogenic debris load as well as surveys of coral health and condition. The reasons for choosing each of the variables, as well as the specific methods used to assess them, are outlined below.
The overall approach (methods and design) for the surveys was based on initial work conducted in nearshore reef habitats in south-eastern Queensland and far-northern NSW in the past (Edwards & Smith 2005, Smith et al. 2005, 2006, 2008). The extensive surveys conducted in 2006 further refined the methods and resulted in the recommendation of a standard protocol for such studies (Rule & Smith 2007). A brief description of the methods appears below; full details are provided in Rule & Smith (2007).
The main sampling unit for data collection was a 25-m transect across which the majority of the quantitative data were collected. Thus, at each reef, four 25-m transects were randomly placed within a depth-range of 8-12 m and each of the main sampling methods was performed sequentially across these transects (Fig. 2). For the most part, and to reduce confounding associated with differences in depth, transects were deployed in a narrower depth range (8-10 m) wherever possible. Experience from previous surveys using the same methods indicated that four replicate transects provide data that are both precise and cost-effective for descriptions of biotic patterns on nearshore reefs (Edwards & Smith 2005, Smith et al. 2006, 2008).
7
Fig. 1. Map of the NRCMA region showing the location of the nearshore reefs evaluated in 2008 (bold) and those surveyed using identical methods in 2006. Unique site numbers are shown in brackets and are used instead of site names in Figs. in the Results. Further details of the sites are provided in Table 1 and Appendix 1.
8
Where possible, transects were deployed from a random point in the middle of the reef, at radial intervals of 90o. Thus, viewed from above, transects radiated out from a central point and formed a cross. On some smaller reefs, or on fragmented reefs, this pattern could not always be achieved and so, in such cases, transects were allocated randomly across the available reef habitat. In all cases, transects were deployed so that they were spaced by at least 10 m (including at the centre of the cross) to maximise the likelihood that each was independent of all others.
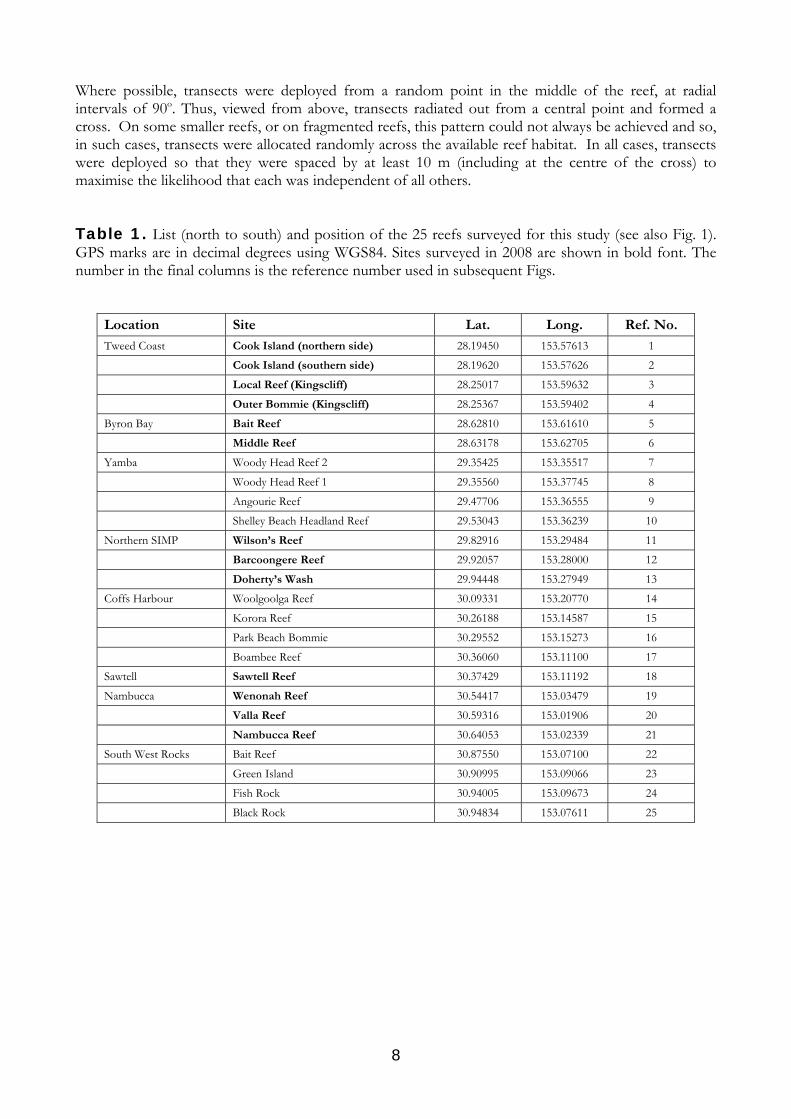
Table 1. List (north to south) and position of the 25 reefs surveyed for this study (see also Fig. 1). GPS marks are in decimal degrees using WGS84. Sites surveyed in 2008 are shown in bold font. The number in the final columns is the reference number used in subsequent Figs.
Location Site Lat. Long. Ref. No.
Tweed Coast Cook Island (northern side) 28.19450 153.57613 1
Cook Island (southern side) 28.19620 153.57626 2
Local Reef (Kingscliff) 28.25017 153.59632 3
Outer Bommie (Kingscliff) 28.25367 153.59402 4
Byron Bay Bait Reef 28.62810 153.61610 5
Middle Reef 28.63178 153.62705 6
Yamba Woody Head Reef 2 29.35425 153.35517 7
Woody Head Reef 1 29.35560 153.37745 8
Angourie Reef 29.47706 153.36555 9
Shelley Beach Headland Reef 29.53043 153.36239 10
Northern SIMP Wilson’s Reef 29.82916 153.29484 11
Barcoongere Reef 29.92057 153.28000 12
Doherty’s Wash 29.94448 153.27949 13
Coffs Harbour Woolgoolga Reef 30.09331 153.20770 14
Korora Reef 30.26188 153.14587 15
Park Beach Bommie 30.29552 153.15273 16
Boambee Reef 30.36060 153.11100 17
Sawtell Sawtell Reef 30.37429 153.11192 18
Nambucca Wenonah Reef 30.54417 153.03479 19
Valla Reef 30.59316 153.01906 20
Nambucca Reef 30.64053 153.02339 21
South West Rocks Bait Reef 30.87550 153.07100 22
Green Island 30.90995 153.09066 23
Fish Rock 30.94005 153.09673 24
Black Rock 30.94834 153.07611 25
9
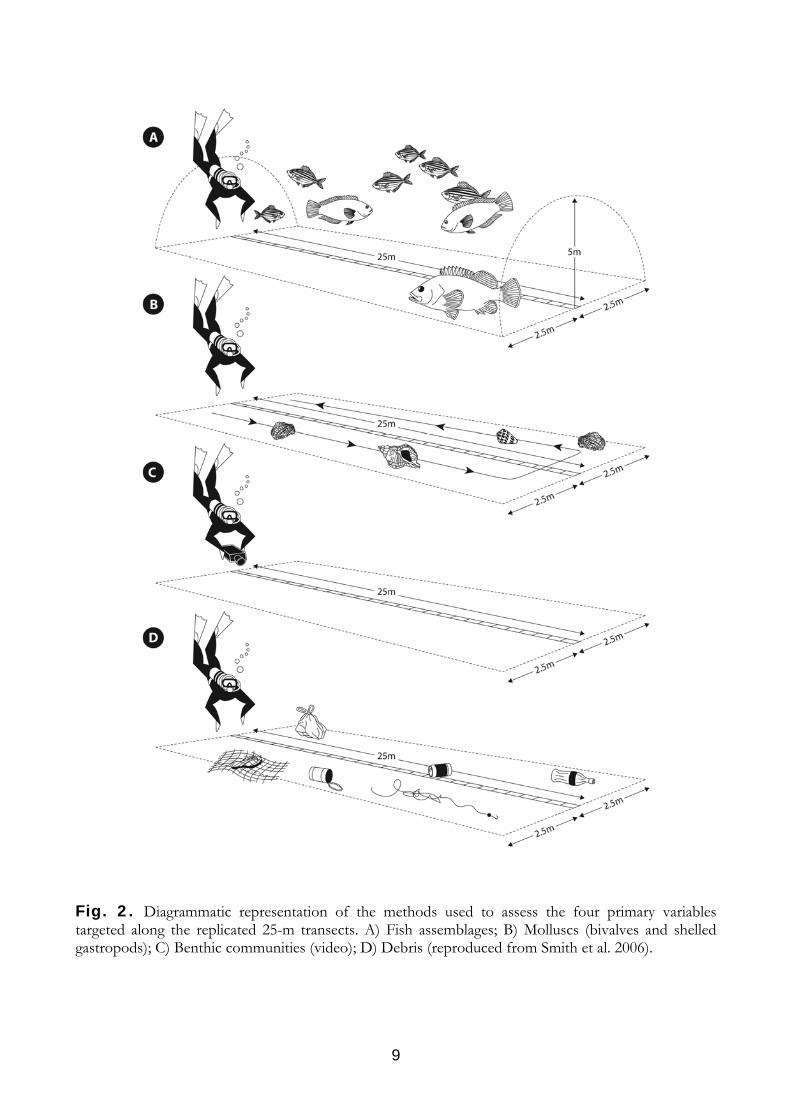
Fig. 2. Diagrammatic representation of the methods used to assess the four primary variables targeted along the replicated 25-m transects. A) Fish assemblages; B) Molluscs (bivalves and shelled gastropods); C) Benthic communities (video); D) Debris (reproduced from Smith et al. 2006).
10
Fish community structure Fish are one of the most visible components of reef communities and fish assemblages are known to respond to a variety of human impacts. Fish also represent an important commercial and recreational resource and so there is considerable public interest in the composition of assemblages and, in particular, how these might be affected by human impacts (Smith et al. 2005).
Fish communities were compared using quantitative counts within a corridor measuring 2.5 m either side of the tape-measure and to a height of 5 m above the substratum (Fig. 2A). Using this method, the identity and number of pelagic fish (i.e. those associated with the water column) are assessed during the first passage of the transect and benthic and demersal fish are documented during the return swim within the same corridor. The time taken to complete each transect is dependent on the abundance and diversity of the fish assemblage; an upper limit of 30 min. per transect was applied in all cases. Pelagic fish are known to be highly variable over space and time (most aggregate in schools and move through areas quickly). For this reason, while they were evaluated if encountered, the data reported in the Results section of the report excludes these species.
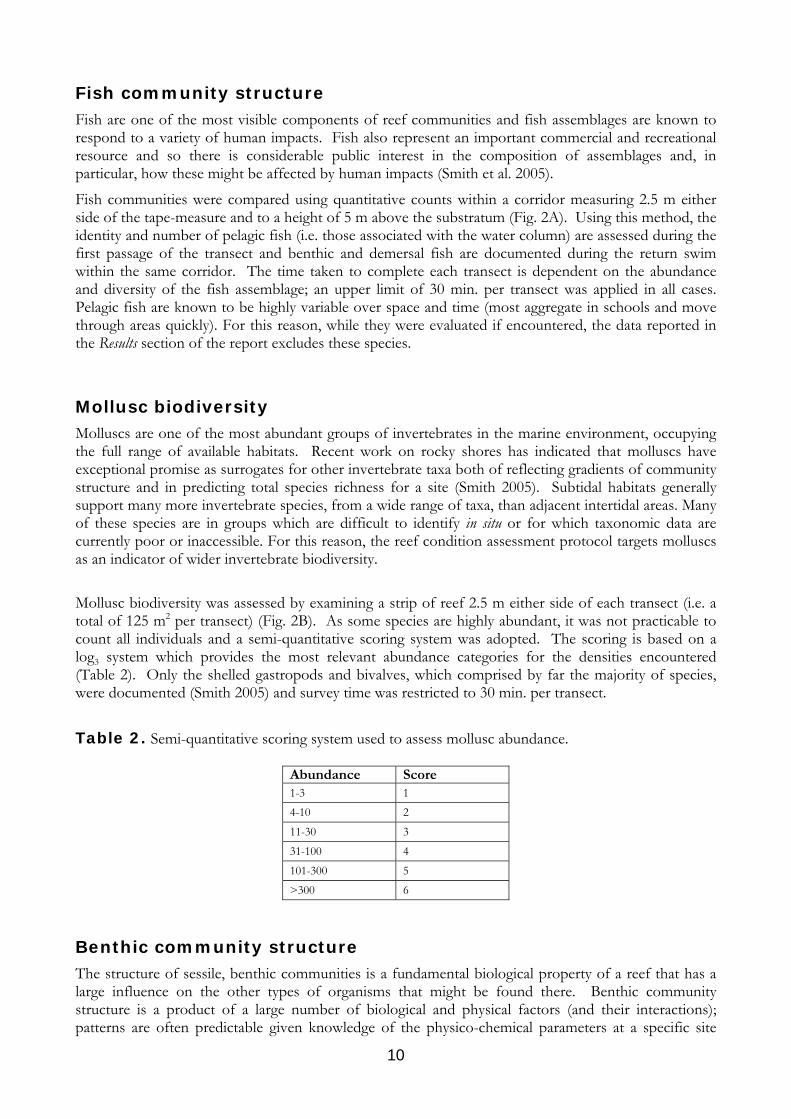
Mollusc biodiversity Molluscs are one of the most abundant groups of invertebrates in the marine environment, occupying the full range of available habitats. Recent work on rocky shores has indicated that molluscs have exceptional promise as surrogates for other invertebrate taxa both of reflecting gradients of community structure and in predicting total species richness for a site (Smith 2005). Subtidal habitats generally support many more invertebrate species, from a wide range of taxa, than adjacent intertidal areas. Many of these species are in groups which are difficult to identify in situ or for which taxonomic data are currently poor or inaccessible. For this reason, the reef condition assessment protocol targets molluscs as an indicator of wider invertebrate biodiversity. Mollusc biodiversity was assessed by examining a strip of reef 2.5 m either side of each transect (i.e. a total of 125 m2 per transect) (Fig. 2B). As some species are highly abundant, it was not practicable to count all individuals and a semi-quantitative scoring system was adopted. The scoring is based on a log3 system which provides the most relevant abundance categories for the densities encountered (Table 2). Only the shelled gastropods and bivalves, which comprised by far the majority of species, were documented (Smith 2005) and survey time was restricted to 30 min. per transect.
Table 2. Semi-quantitative scoring system used to assess mollusc abundance.
Abundance Score 1-3 1
4-10 2
11-30 3
31-100 4
101-300 5
>300 6
Benthic community structure The structure of sessile, benthic communities is a fundamental biological property of a reef that has a large influence on the other types of organisms that might be found there. Benthic community structure is a product of a large number of biological and physical factors (and their interactions); patterns are often predictable given knowledge of the physico-chemical parameters at a specific site
11
(e.g. depth, salinity, latitude, wave exposure, surrounding habitat type). For these reasons, amongst others, assessments of benthic community structure are important components of reef studies.
Benthic community structure at each reef was assessed using standard video-transect methods (Fig. 2C). The camera was held at an angle of 45o, approximately 0.5 m above the substratum and just to the side of the tape-measure, while a diver slowly swam the length of the transect (Page et al. 2001). The presence and percentage cover of the different substratum types and biotic (biological) groups was subsequently determined in the laboratory by pausing the tape at predetermined intervals and identifying the categories lying below 5 points placed on the monitor. Habitat-forming taxa were identified to the highest level of taxonomic resolution possible (species targeted) and data summaries at lower levels of resolution (e.g. broad taxon and growth-form) were also produced. A total of 300 data points were assessed for each transect and data summaries were facilitated by the use of CPCe software (Kohler & Gill 2006). Where present, hard corals were enumerated and examined (in situ) to determine the presence of stressors such as disease, bleaching and aggregations of predators.
Debris Debris has been identified as one of the Key Threatening Processes to marine habitats and organisms in Australia (Department of the Environment & Heritage 2003), especially to threatened and/or endangered species. As much of the debris present in marine habitats originates from adjacent coasts, nearshore reefs are likely to come into early contact with a range of debris types. In addition, due to ease of access, nearshore reefs are targeted by fishers; fishing debris is therefore commonly seen on many of these reefs (Smith et al. 2006, 2008). An assessment of debris load will thus provide an indication of risk to nearshore reefal habitats and biota.
Debris was documented and removed (where possible or appropriate1) in a corridor 2.5 m either side of the tape-measure (Fig. 2D). Items were subsequently counted and classified into broad categories based on material and use (see Results). An additional 30-min., timed survey was conducted outside the transects to document other debris within the site.
Habitat complexity Habitat complexity or rugosity can have a strong effect on community structure, especially for fish (Gratwicke & Speight 2005, Carraro & Gladstone 2006, Lingo & Szedlmayer 2006). Thus assessments of complexity are important in the interpretation of studies of community patterns among reefs.
Substratum heterogeneity at each reef was determined using the ‘rope-and-chain’ method (Luckhurst & Luckhurst 1978). This technique consisted of contouring a second tape measure to the substratum under the already established, horizontal, 25-m transect to provide an outline length for the substratum. The ratio of the contoured measurement to the horizontal measurement was then used as a simple indication of habitat complexity. These data are not presented in this report.
Statistical methods The primary objectives of this report were to compare the biodiversity and patterns of community structure across the 25 reefs that have been surveyed. The purpose of this evaluation was to provide a short-list of sites that would be targeted for further long-term monitoring. For this reason, the most appropriate analytical methods were basic descriptions of species richness for molluscs and fish (i.e.
1 Larger pieces of debris may become habitat for marine biota – these were noted but left in situ.
12
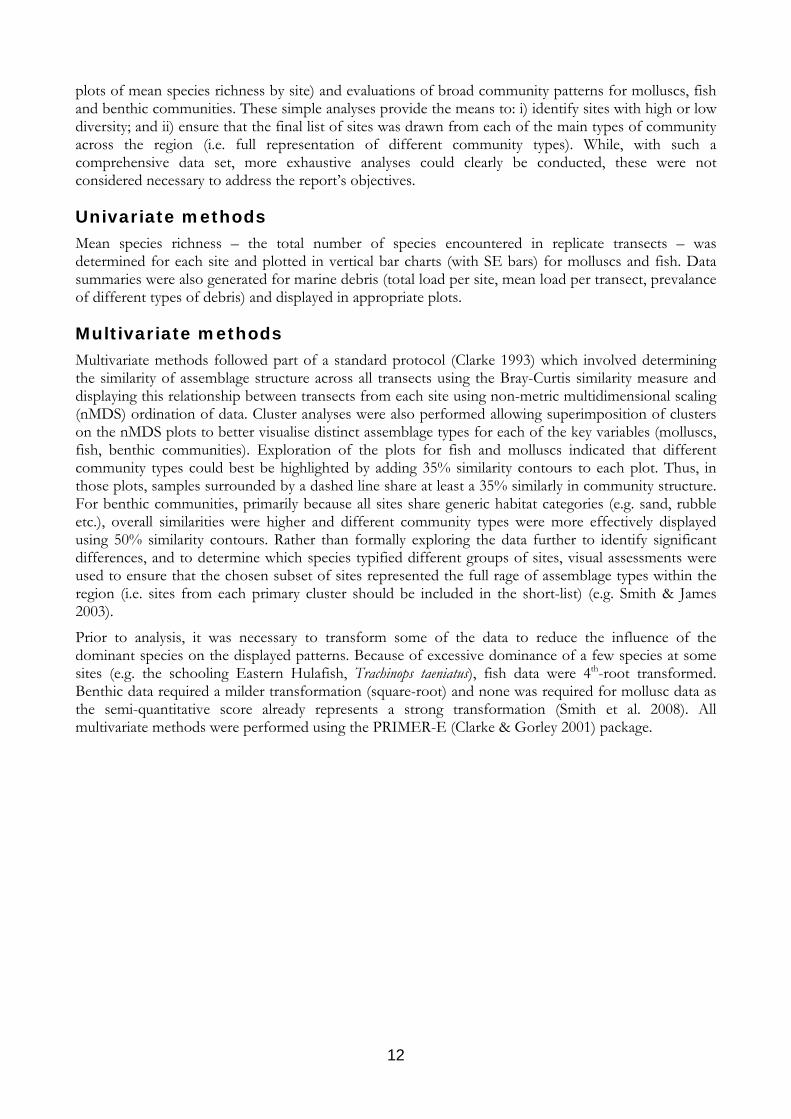
plots of mean species richness by site) and evaluations of broad community patterns for molluscs, fish and benthic communities. These simple analyses provide the means to: i) identify sites with high or low diversity; and ii) ensure that the final list of sites was drawn from each of the main types of community across the region (i.e. full representation of different community types). While, with such a comprehensive data set, more exhaustive analyses could clearly be conducted, these were not considered necessary to address the report’s objectives.
Univariate methods Mean species richness – the total number of species encountered in replicate transects – was determined for each site and plotted in vertical bar charts (with SE bars) for molluscs and fish. Data summaries were also generated for marine debris (total load per site, mean load per transect, prevalance of different types of debris) and displayed in appropriate plots.
Multivariate methods Multivariate methods followed part of a standard protocol (Clarke 1993) which involved determining the similarity of assemblage structure across all transects using the Bray-Curtis similarity measure and displaying this relationship between transects from each site using non-metric multidimensional scaling (nMDS) ordination of data. Cluster analyses were also performed allowing superimposition of clusters on the nMDS plots to better visualise distinct assemblage types for each of the key variables (molluscs, fish, benthic communities). Exploration of the plots for fish and molluscs indicated that different community types could best be highlighted by adding 35% similarity contours to each plot. Thus, in those plots, samples surrounded by a dashed line share at least a 35% similarly in community structure. For benthic communities, primarily because all sites share generic habitat categories (e.g. sand, rubble etc.), overall similarities were higher and different community types were more effectively displayed using 50% similarity contours. Rather than formally exploring the data further to identify significant differences, and to determine which species typified different groups of sites, visual assessments were used to ensure that the chosen subset of sites represented the full rage of assemblage types within the region (i.e. sites from each primary cluster should be included in the short-list) (e.g. Smith & James 2003).
Prior to analysis, it was necessary to transform some of the data to reduce the influence of the dominant species on the displayed patterns. Because of excessive dominance of a few species at some sites (e.g. the schooling Eastern Hulafish, Trachinops taeniatus), fish data were 4th-root transformed. Benthic data required a milder transformation (square-root) and none was required for mollusc data as the semi-quantitative score already represents a strong transformation (Smith et al. 2008). All multivariate methods were performed using the PRIMER-E (Clarke & Gorley 2001) package.
13
Results
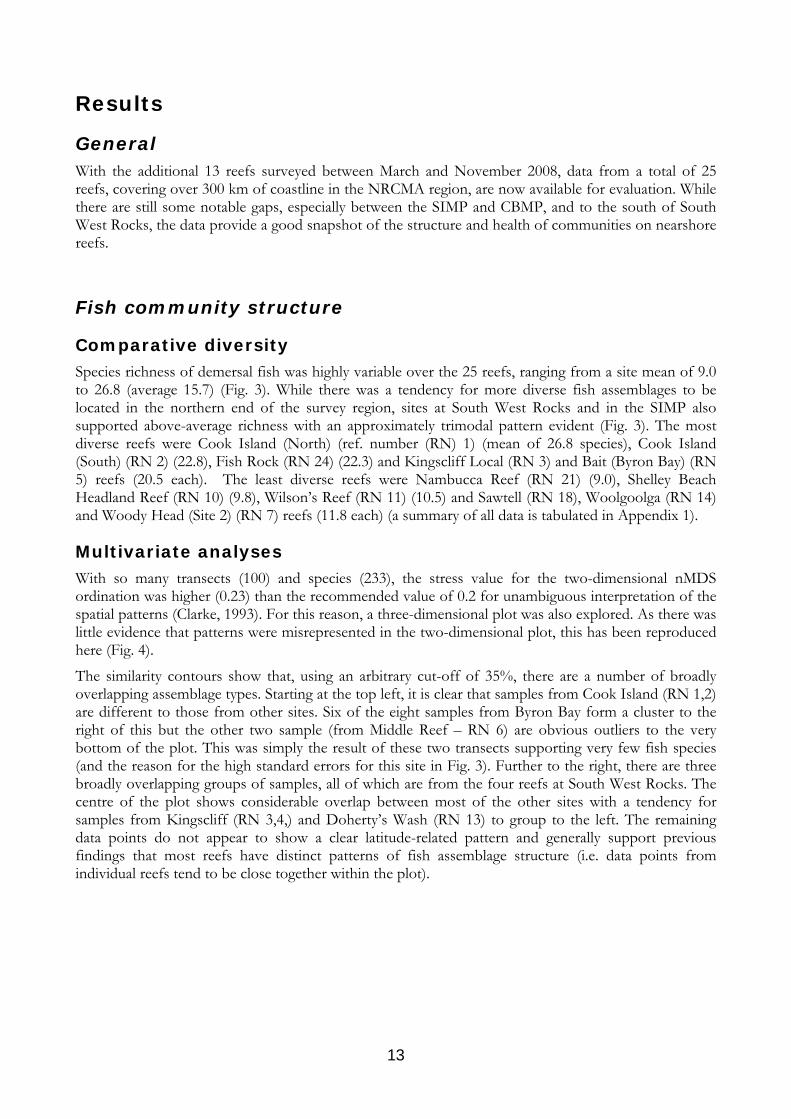
General With the additional 13 reefs surveyed between March and November 2008, data from a total of 25 reefs, covering over 300 km of coastline in the NRCMA region, are now available for evaluation. While there are still some notable gaps, especially between the SIMP and CBMP, and to the south of South West Rocks, the data provide a good snapshot of the structure and health of communities on nearshore reefs.
Fish community structure
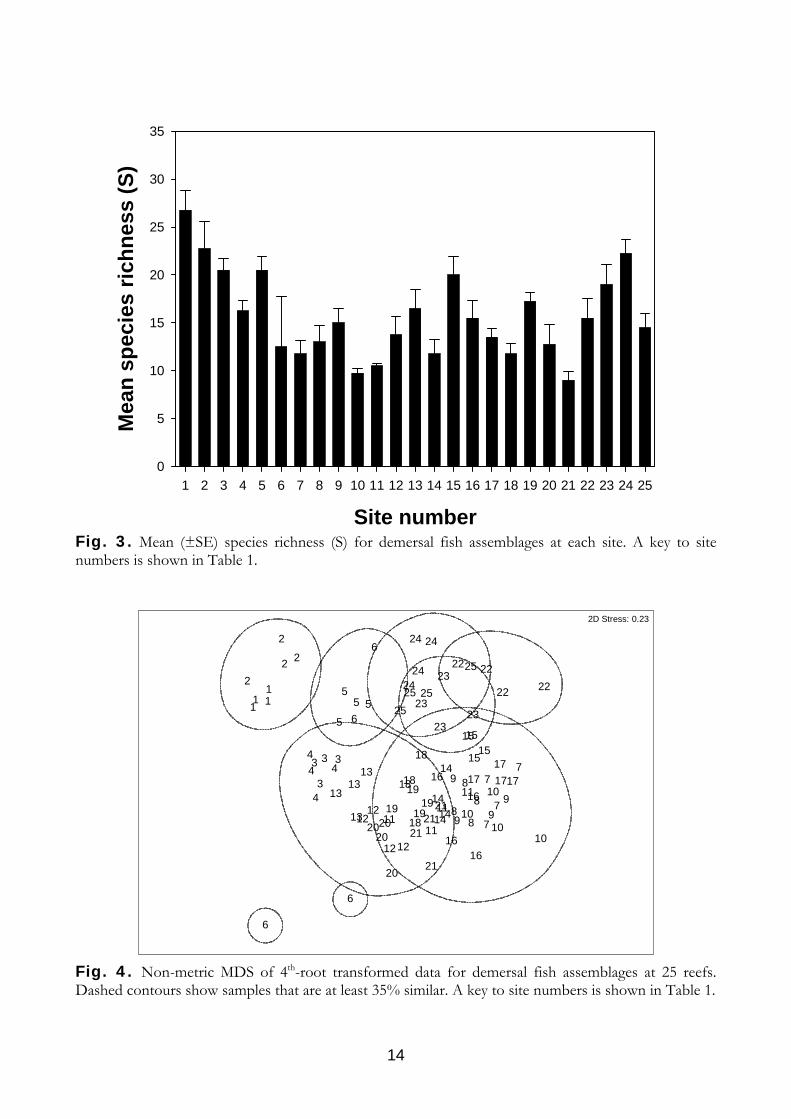
Comparative diversity Species richness of demersal fish was highly variable over the 25 reefs, ranging from a site mean of 9.0 to 26.8 (average 15.7) (Fig. 3). While there was a tendency for more diverse fish assemblages to be located in the northern end of the survey region, sites at South West Rocks and in the SIMP also supported above-average richness with an approximately trimodal pattern evident (Fig. 3). The most diverse reefs were Cook Island (North) (ref. number (RN) 1) (mean of 26.8 species), Cook Island (South) (RN 2) (22.8), Fish Rock (RN 24) (22.3) and Kingscliff Local (RN 3) and Bait (Byron Bay) (RN 5) reefs (20.5 each). The least diverse reefs were Nambucca Reef (RN 21) (9.0), Shelley Beach Headland Reef (RN 10) (9.8), Wilson’s Reef (RN 11) (10.5) and Sawtell (RN 18), Woolgoolga (RN 14) and Woody Head (Site 2) (RN 7) reefs (11.8 each) (a summary of all data is tabulated in Appendix 1).
Multivariate analyses With so many transects (100) and species (233), the stress value for the two-dimensional nMDS ordination was higher (0.23) than the recommended value of 0.2 for unambiguous interpretation of the spatial patterns (Clarke, 1993). For this reason, a three-dimensional plot was also explored. As there was little evidence that patterns were misrepresented in the two-dimensional plot, this has been reproduced here (Fig. 4).
The similarity contours show that, using an arbitrary cut-off of 35%, there are a number of broadly overlapping assemblage types. Starting at the top left, it is clear that samples from Cook Island (RN 1,2) are different to those from other sites. Six of the eight samples from Byron Bay form a cluster to the right of this but the other two sample (from Middle Reef – RN 6) are obvious outliers to the very bottom of the plot. This was simply the result of these two transects supporting very few fish species (and the reason for the high standard errors for this site in Fig. 3). Further to the right, there are three broadly overlapping groups of samples, all of which are from the four reefs at South West Rocks. The centre of the plot shows considerable overlap between most of the other sites with a tendency for samples from Kingscliff (RN 3,4,) and Doherty’s Wash (RN 13) to group to the left. The remaining data points do not appear to show a clear latitude-related pattern and generally support previous findings that most reefs have distinct patterns of fish assemblage structure (i.e. data points from individual reefs tend to be close together within the plot).
14
Site number1 2 3 4 5 6 7 8 9 10 11 12 13 14 15 16 17 18 19 20 21 22 23 24 25
Mea
n sp
ecie
s ric
hnes
s (S
)
0
5
10
15
20
25
30
35
Fig. 3. Mean (±SE) species richness (S) for demersal fish assemblages at each site. A key to site numbers is shown in Table 1.
9
99
9
55
55 22
22 22
22
1212
1212
25
25
25 25
1717
17 17
111
1
22
2
2
13
1313
13
24
2424
24
2323
23
23
3 33
3
44
4
415
1515
15
6
6
6
6
21
2121
21
16
1616
161818
18
18
10
1010
1020
20
2020
19 19
1919
1111
1111
88
88
77
7
714
14
14
14
2D Stress: 0.23
Fig. 4. Non-metric MDS of 4th-root transformed data for demersal fish assemblages at 25 reefs. Dashed contours show samples that are at least 35% similar. A key to site numbers is shown in Table 1.
15
Mollusc community structure
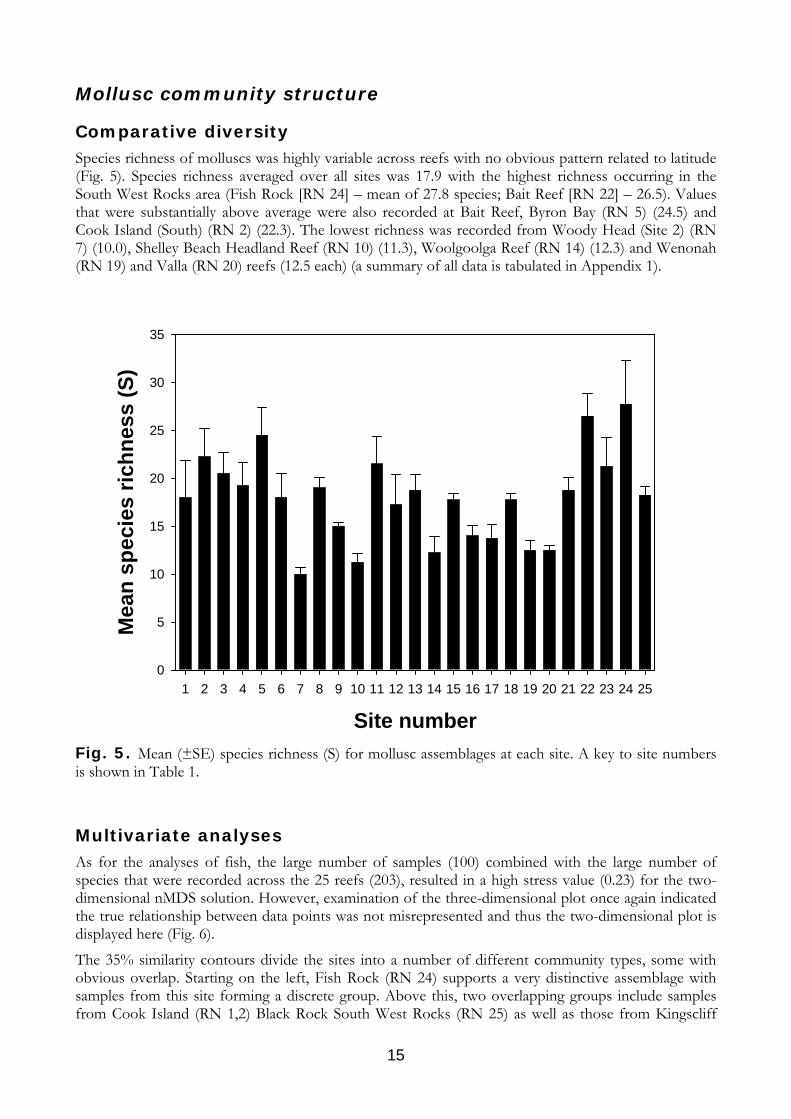
Comparative diversity Species richness of molluscs was highly variable across reefs with no obvious pattern related to latitude (Fig. 5). Species richness averaged over all sites was 17.9 with the highest richness occurring in the South West Rocks area (Fish Rock [RN 24] – mean of 27.8 species; Bait Reef [RN 22] – 26.5). Values that were substantially above average were also recorded at Bait Reef, Byron Bay (RN 5) (24.5) and Cook Island (South) (RN 2) (22.3). The lowest richness was recorded from Woody Head (Site 2) (RN 7) (10.0), Shelley Beach Headland Reef (RN 10) (11.3), Woolgoolga Reef (RN 14) (12.3) and Wenonah (RN 19) and Valla (RN 20) reefs (12.5 each) (a summary of all data is tabulated in Appendix 1).
Site number1 2 3 4 5 6 7 8 9 10 11 12 13 14 15 16 17 18 19 20 21 22 23 24 25
Mea
n sp
ecie
s ric
hnes
s (S
)
0
5
10
15
20
25
30
35
Fig. 5. Mean (±SE) species richness (S) for mollusc assemblages at each site. A key to site numbers is shown in Table 1.
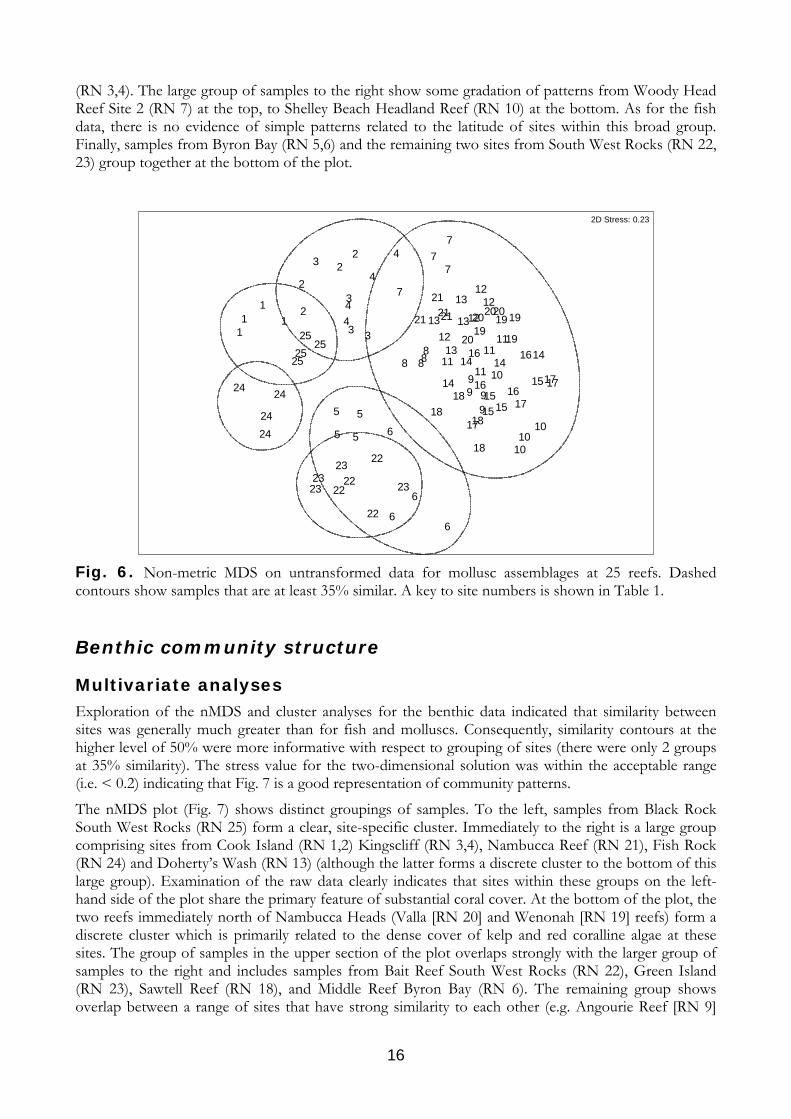
Multivariate analyses As for the analyses of fish, the large number of samples (100) combined with the large number of species that were recorded across the 25 reefs (203), resulted in a high stress value (0.23) for the two-dimensional nMDS solution. However, examination of the three-dimensional plot once again indicated the true relationship between data points was not misrepresented and thus the two-dimensional plot is displayed here (Fig. 6).
The 35% similarity contours divide the sites into a number of different community types, some with obvious overlap. Starting on the left, Fish Rock (RN 24) supports a very distinctive assemblage with samples from this site forming a discrete group. Above this, two overlapping groups include samples from Cook Island (RN 1,2) Black Rock South West Rocks (RN 25) as well as those from Kingscliff
16
(RN 3,4). The large group of samples to the right show some gradation of patterns from Woody Head Reef Site 2 (RN 7) at the top, to Shelley Beach Headland Reef (RN 10) at the bottom. As for the fish data, there is no evidence of simple patterns related to the latitude of sites within this broad group. Finally, samples from Byron Bay (RN 5,6) and the remaining two sites from South West Rocks (RN 22, 23) group together at the bottom of the plot.
99
99
5 5
55
22
22
22
22
12
1212
1225
2525
25
17
17
17
17
1
111
2
2
22
13 13
13
13
24
24
24
24
232323
23
3
33
3
4
4
4
4
1515
1515
6
6
6
6
21
212121
16 16
16 16
18
18
18
18 1010
10
10
2020
20
20 191919
19
11
1111
118888
7
7
77
14
14
14 14
2D Stress: 0.23
Fig. 6. Non-metric MDS on untransformed data for mollusc assemblages at 25 reefs. Dashed contours show samples that are at least 35% similar. A key to site numbers is shown in Table 1.
Benthic community structure
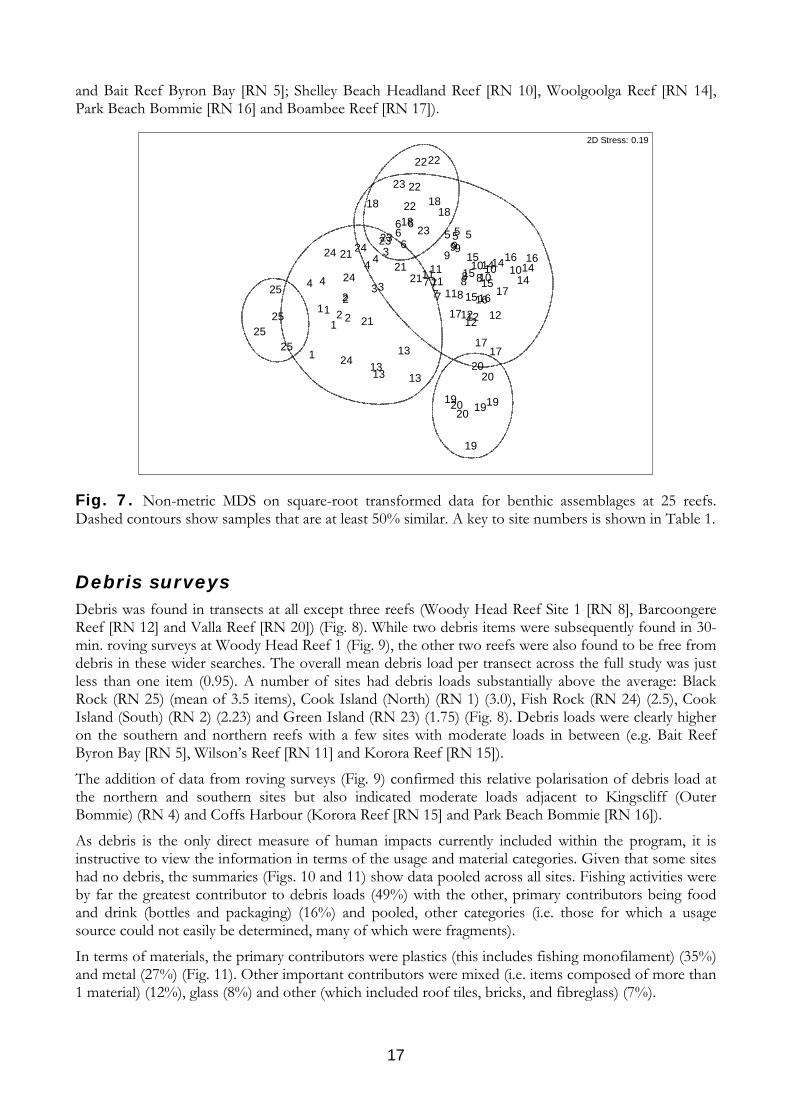
Multivariate analyses Exploration of the nMDS and cluster analyses for the benthic data indicated that similarity between sites was generally much greater than for fish and molluscs. Consequently, similarity contours at the higher level of 50% were more informative with respect to grouping of sites (there were only 2 groups at 35% similarity). The stress value for the two-dimensional solution was within the acceptable range (i.e. < 0.2) indicating that Fig. 7 is a good representation of community patterns.
The nMDS plot (Fig. 7) shows distinct groupings of samples. To the left, samples from Black Rock South West Rocks (RN 25) form a clear, site-specific cluster. Immediately to the right is a large group comprising sites from Cook Island (RN 1,2) Kingscliff (RN 3,4), Nambucca Reef (RN 21), Fish Rock (RN 24) and Doherty’s Wash (RN 13) (although the latter forms a discrete cluster to the bottom of this large group). Examination of the raw data clearly indicates that sites within these groups on the left-hand side of the plot share the primary feature of substantial coral cover. At the bottom of the plot, the two reefs immediately north of Nambucca Heads (Valla [RN 20] and Wenonah [RN 19] reefs) form a discrete cluster which is primarily related to the dense cover of kelp and red coralline algae at these sites. The group of samples in the upper section of the plot overlaps strongly with the larger group of samples to the right and includes samples from Bait Reef South West Rocks (RN 22), Green Island (RN 23), Sawtell Reef (RN 18), and Middle Reef Byron Bay (RN 6). The remaining group shows overlap between a range of sites that have strong similarity to each other (e.g. Angourie Reef [RN 9]
17
and Bait Reef Byron Bay [RN 5]; Shelley Beach Headland Reef [RN 10], Woolgoolga Reef [RN 14], Park Beach Bommie [RN 16] and Boambee Reef [RN 17]).
17
17
17
17
141414
1416 16
161615
15
15
159999
101010 108 88
87777
22
22
22
22
2525
25
25
24
24
24
24
23
23232355 55
6
66
6
12121212
11
111111
13 1313
13
1
1
11
22
2
2
3
3
34 44 4
2121
21
21
20
2020
20 19
19
19 19
1818
1818
2D Stress: 0.19
Fig. 7. Non-metric MDS on square-root transformed data for benthic assemblages at 25 reefs. Dashed contours show samples that are at least 50% similar. A key to site numbers is shown in Table 1.
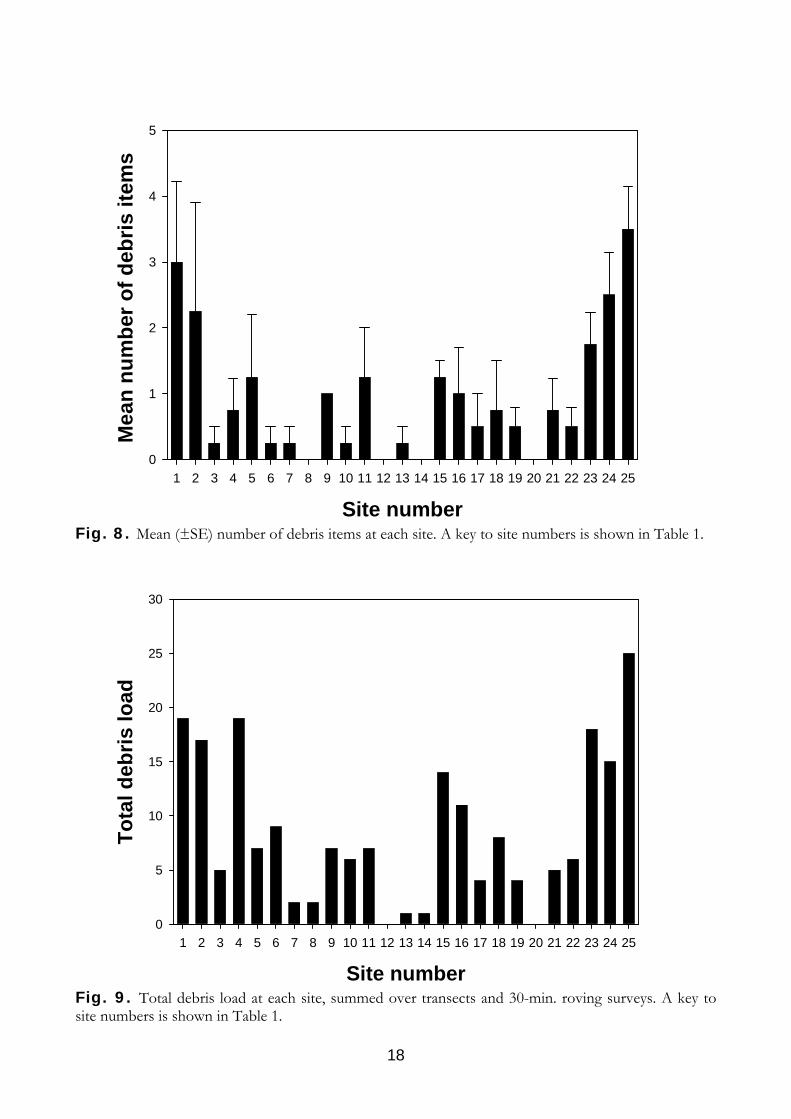
Debris surveys Debris was found in transects at all except three reefs (Woody Head Reef Site 1 [RN 8], Barcoongere Reef [RN 12] and Valla Reef [RN 20]) (Fig. 8). While two debris items were subsequently found in 30-min. roving surveys at Woody Head Reef 1 (Fig. 9), the other two reefs were also found to be free from debris in these wider searches. The overall mean debris load per transect across the full study was just less than one item (0.95). A number of sites had debris loads substantially above the average: Black Rock (RN 25) (mean of 3.5 items), Cook Island (North) (RN 1) (3.0), Fish Rock (RN 24) (2.5), Cook Island (South) (RN 2) (2.23) and Green Island (RN 23) (1.75) (Fig. 8). Debris loads were clearly higher on the southern and northern reefs with a few sites with moderate loads in between (e.g. Bait Reef Byron Bay [RN 5], Wilson’s Reef [RN 11] and Korora Reef [RN 15]).
The addition of data from roving surveys (Fig. 9) confirmed this relative polarisation of debris load at the northern and southern sites but also indicated moderate loads adjacent to Kingscliff (Outer Bommie) (RN 4) and Coffs Harbour (Korora Reef [RN 15] and Park Beach Bommie [RN 16]).
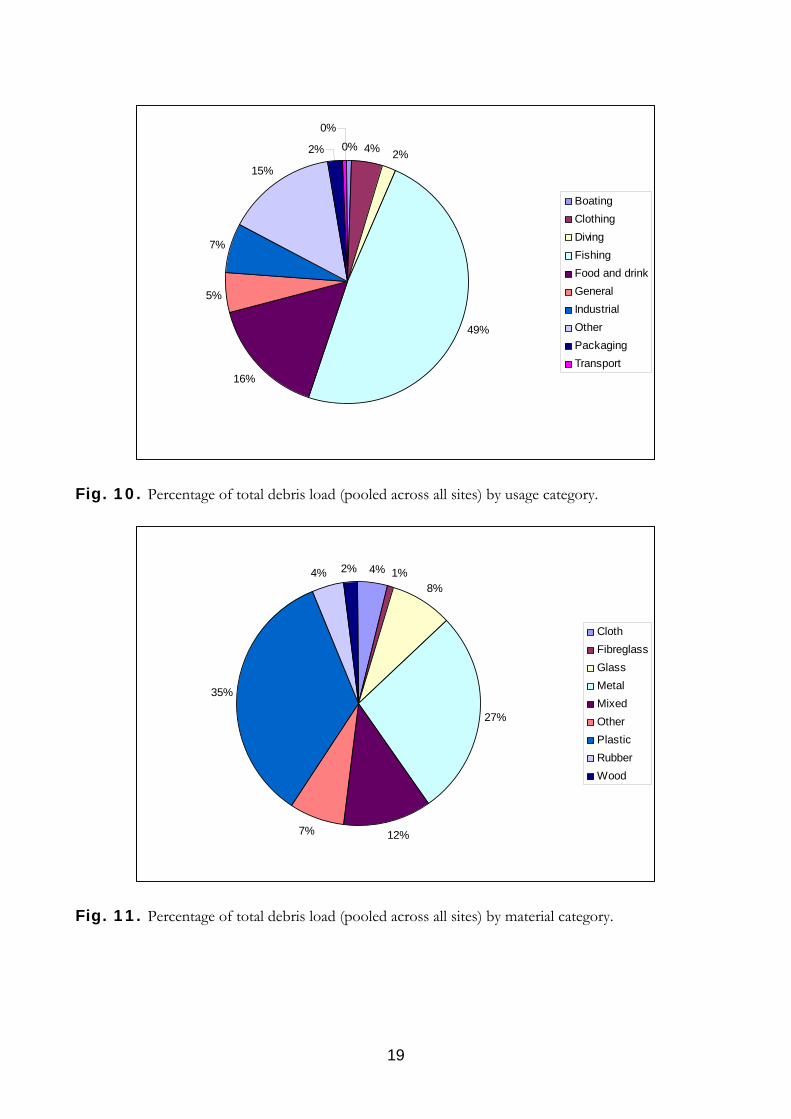
As debris is the only direct measure of human impacts currently included within the program, it is instructive to view the information in terms of the usage and material categories. Given that some sites had no debris, the summaries (Figs. 10 and 11) show data pooled across all sites. Fishing activities were by far the greatest contributor to debris loads (49%) with the other, primary contributors being food and drink (bottles and packaging) (16%) and pooled, other categories (i.e. those for which a usage source could not easily be determined, many of which were fragments).
In terms of materials, the primary contributors were plastics (this includes fishing monofilament) (35%) and metal (27%) (Fig. 11). Other important contributors were mixed (i.e. items composed of more than 1 material) (12%), glass (8%) and other (which included roof tiles, bricks, and fibreglass) (7%).
18
Site number1 2 3 4 5 6 7 8 9 10 11 12 13 14 15 16 17 18 19 20 21 22 23 24 25
Mea
n nu
mbe
r of d
ebris
item
s
0
1
2
3
4
5
Fig. 8. Mean (±SE) number of debris items at each site. A key to site numbers is shown in Table 1.
Site number1 2 3 4 5 6 7 8 9 10 11 12 13 14 15 16 17 18 19 20 21 22 23 24 25
Tota
l deb
ris lo
ad
0
5
10
15
20
25
30
Fig. 9. Total debris load at each site, summed over transects and 30-min. roving surveys. A key to site numbers is shown in Table 1.
19
0% 4% 2%
49%
16%
5%
7%
15%
2%
0%
BoatingClothingDivingFishingFood and drinkGeneralIndustrialOtherPackagingTransport
Fig. 10. Percentage of total debris load (pooled across all sites) by usage category.
4% 1%8%
27%
12%7%
35%
4% 2%
ClothFibreglassGlassMetalMixedOtherPlasticRubberWood
Fig. 11. Percentage of total debris load (pooled across all sites) by material category.
20
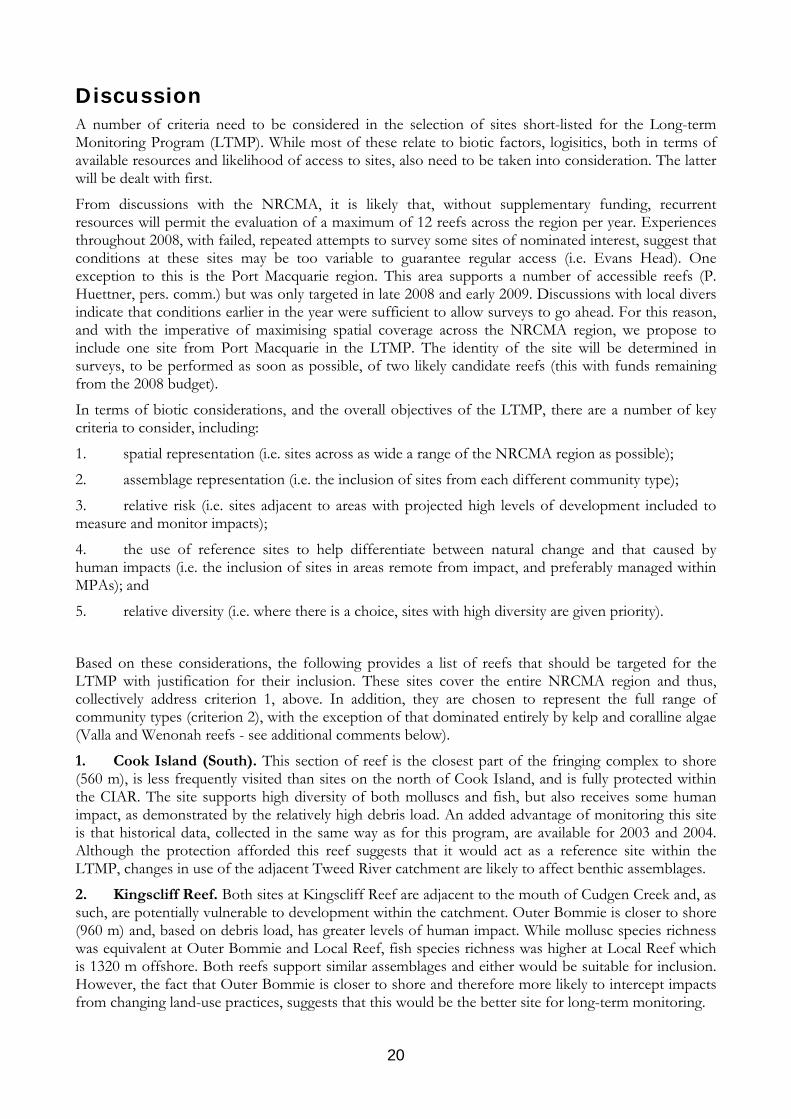
Discussion A number of criteria need to be considered in the selection of sites short-listed for the Long-term Monitoring Program (LTMP). While most of these relate to biotic factors, logisitics, both in terms of available resources and likelihood of access to sites, also need to be taken into consideration. The latter will be dealt with first.
From discussions with the NRCMA, it is likely that, without supplementary funding, recurrent resources will permit the evaluation of a maximum of 12 reefs across the region per year. Experiences throughout 2008, with failed, repeated attempts to survey some sites of nominated interest, suggest that conditions at these sites may be too variable to guarantee regular access (i.e. Evans Head). One exception to this is the Port Macquarie region. This area supports a number of accessible reefs (P. Huettner, pers. comm.) but was only targeted in late 2008 and early 2009. Discussions with local divers indicate that conditions earlier in the year were sufficient to allow surveys to go ahead. For this reason, and with the imperative of maximising spatial coverage across the NRCMA region, we propose to include one site from Port Macquarie in the LTMP. The identity of the site will be determined in surveys, to be performed as soon as possible, of two likely candidate reefs (this with funds remaining from the 2008 budget).
In terms of biotic considerations, and the overall objectives of the LTMP, there are a number of key criteria to consider, including:
1. spatial representation (i.e. sites across as wide a range of the NRCMA region as possible);
2. assemblage representation (i.e. the inclusion of sites from each different community type);
3. relative risk (i.e. sites adjacent to areas with projected high levels of development included to measure and monitor impacts);
4. the use of reference sites to help differentiate between natural change and that caused by human impacts (i.e. the inclusion of sites in areas remote from impact, and preferably managed within MPAs); and
5. relative diversity (i.e. where there is a choice, sites with high diversity are given priority).
Based on these considerations, the following provides a list of reefs that should be targeted for the LTMP with justification for their inclusion. These sites cover the entire NRCMA region and thus, collectively address criterion 1, above. In addition, they are chosen to represent the full range of community types (criterion 2), with the exception of that dominated entirely by kelp and coralline algae (Valla and Wenonah reefs - see additional comments below).
1. Cook Island (South). This section of reef is the closest part of the fringing complex to shore (560 m), is less frequently visited than sites on the north of Cook Island, and is fully protected within the CIAR. The site supports high diversity of both molluscs and fish, but also receives some human impact, as demonstrated by the relatively high debris load. An added advantage of monitoring this site is that historical data, collected in the same way as for this program, are available for 2003 and 2004. Although the protection afforded this reef suggests that it would act as a reference site within the LTMP, changes in use of the adjacent Tweed River catchment are likely to affect benthic assemblages.
2. Kingscliff Reef. Both sites at Kingscliff Reef are adjacent to the mouth of Cudgen Creek and, as such, are potentially vulnerable to development within the catchment. Outer Bommie is closer to shore (960 m) and, based on debris load, has greater levels of human impact. While mollusc species richness was equivalent at Outer Bommie and Local Reef, fish species richness was higher at Local Reef which is 1320 m offshore. Both reefs support similar assemblages and either would be suitable for inclusion. However, the fact that Outer Bommie is closer to shore and therefore more likely to intercept impacts from changing land-use practices, suggests that this would be the better site for long-term monitoring.
21
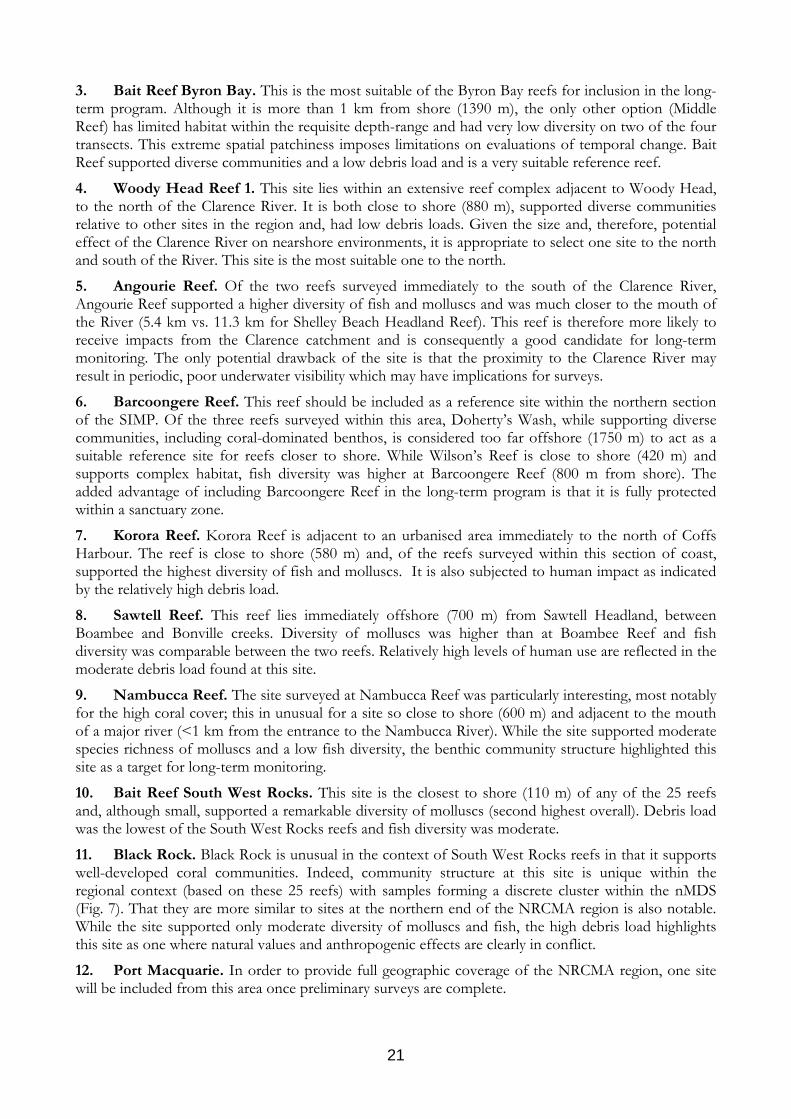
3. Bait Reef Byron Bay. This is the most suitable of the Byron Bay reefs for inclusion in the long-term program. Although it is more than 1 km from shore (1390 m), the only other option (Middle Reef) has limited habitat within the requisite depth-range and had very low diversity on two of the four transects. This extreme spatial patchiness imposes limitations on evaluations of temporal change. Bait Reef supported diverse communities and a low debris load and is a very suitable reference reef.
4. Woody Head Reef 1. This site lies within an extensive reef complex adjacent to Woody Head, to the north of the Clarence River. It is both close to shore (880 m), supported diverse communities relative to other sites in the region and, had low debris loads. Given the size and, therefore, potential effect of the Clarence River on nearshore environments, it is appropriate to select one site to the north and south of the River. This site is the most suitable one to the north.
5. Angourie Reef. Of the two reefs surveyed immediately to the south of the Clarence River, Angourie Reef supported a higher diversity of fish and molluscs and was much closer to the mouth of the River (5.4 km vs. 11.3 km for Shelley Beach Headland Reef). This reef is therefore more likely to receive impacts from the Clarence catchment and is consequently a good candidate for long-term monitoring. The only potential drawback of the site is that the proximity to the Clarence River may result in periodic, poor underwater visibility which may have implications for surveys.
6. Barcoongere Reef. This reef should be included as a reference site within the northern section of the SIMP. Of the three reefs surveyed within this area, Doherty’s Wash, while supporting diverse communities, including coral-dominated benthos, is considered too far offshore (1750 m) to act as a suitable reference site for reefs closer to shore. While Wilson’s Reef is close to shore (420 m) and supports complex habitat, fish diversity was higher at Barcoongere Reef (800 m from shore). The added advantage of including Barcoongere Reef in the long-term program is that it is fully protected within a sanctuary zone.
7. Korora Reef. Korora Reef is adjacent to an urbanised area immediately to the north of Coffs Harbour. The reef is close to shore (580 m) and, of the reefs surveyed within this section of coast, supported the highest diversity of fish and molluscs. It is also subjected to human impact as indicated by the relatively high debris load.
8. Sawtell Reef. This reef lies immediately offshore (700 m) from Sawtell Headland, between Boambee and Bonville creeks. Diversity of molluscs was higher than at Boambee Reef and fish diversity was comparable between the two reefs. Relatively high levels of human use are reflected in the moderate debris load found at this site.
9. Nambucca Reef. The site surveyed at Nambucca Reef was particularly interesting, most notably for the high coral cover; this in unusual for a site so close to shore (600 m) and adjacent to the mouth of a major river (<1 km from the entrance to the Nambucca River). While the site supported moderate species richness of molluscs and a low fish diversity, the benthic community structure highlighted this site as a target for long-term monitoring.
10. Bait Reef South West Rocks. This site is the closest to shore (110 m) of any of the 25 reefs and, although small, supported a remarkable diversity of molluscs (second highest overall). Debris load was the lowest of the South West Rocks reefs and fish diversity was moderate.
11. Black Rock. Black Rock is unusual in the context of South West Rocks reefs in that it supports well-developed coral communities. Indeed, community structure at this site is unique within the regional context (based on these 25 reefs) with samples forming a discrete cluster within the nMDS (Fig. 7). That they are more similar to sites at the northern end of the NRCMA region is also notable. While the site supported only moderate diversity of molluscs and fish, the high debris load highlights this site as one where natural values and anthropogenic effects are clearly in conflict.
12. Port Macquarie. In order to provide full geographic coverage of the NRCMA region, one site will be included from this area once preliminary surveys are complete.
22
As outlined above, this list of 12 sites will provide comprehensive cover of the reef types within the NRCMA region. However, in reducing the number of reefs from 25 to 12, and given the high levels of variation evident between reefs, even those in relatively close proximity (Smith et al. 2006, Smith et al. 2008), it is inevitable that some community types will be excluded from the program. Given the focus of the program on nearshore reefs (see rationale in the Introduction), the decision to exclude Fish Rock and Doherty’s Wash was primarily made on the basis that they were essentially mid-shelf sites (1950 m and 1720 m offshore, respectively) that were relatively remote from terrestrially-based impacts. However, the omission of other sites was largely driven by their comparative biotic data. One community type that is not currently represented in the program is the kelp/red coralline algae habitat associated with Wenonah and Valla reefs. This community type is also a feature of reefs adjacent to Port Macquarie (P. Huettner, pers. comm.) and, thus, may be represented once a site has been chosen from that area. However, should it be possible to extend the program, it would be useful to include Wenonah Reef as an example of this community type.
References Carraro, R. & W. Gladstone. 2006. Habitat preferences and site fidelity of the ornate wobbegong shark (Orectolobus ornatus) on rocky reefs of New South Wales. Pacific Science 60: 207-223.
Clarke, K.R. 1993. Non-parametric multivariate analyses of changes in community structure. Australian Journal of Ecology 18: 117-143.
Clarke, K.R. & R.N. Gorley. 2001. PRIMER 5 for Windows, PRIMER-E, Plymouth.
Department of the Environment & Heritage. 2003. Key Threatening Processes: Harmful Marine Debris. pp. 2, Department of the Environment & Heritage, Canberra, ACT.
Edwards, R.A. & S.D.A. Smith. 2005. Subtidal assemblages associated with a geotextile reef in south-east Queensland, Australia. Marine and Freshwater Research 56: 133-142.
Gratwicke, B. & M.R. Speight. 2005. Effects of habitat complexity on Caribbean marine fish assemblages. Marine Ecology Progress Series 292: 301-310.
Kohler, K.E. & S.M. Gill. 2006. Coral Point Count with Excel extensions (CPCe): A Visual Basic program for the determination of coral and substrate coverage using random point count methodology. Computers and Geosciences 32: 1259-1269.
Lingo, M.E. & S.T. Szedlmayer. 2006. The influence of habitat complexity on reef fish communities in the northeastern Gulf of Mexico. Environmental Biology of Fishes 76: 71-80.
Luckhurst, B.E. & K. Luckhurst. 1978. Analysis of the substratum variables on coral reefs Marine Biology 49: 317-323.
Page, C., G. Coleman, R. Ninio & K. Osbourne. 2001. Surveys of benthic reef communities using underwater video. Long-term monitoring of the Great Barrier Reef. Australian Institute of Marine Science, Townsville. 45 pp.
Rule, M.J. & S.D.A. Smith. 2007. A long-term monitoring programme for the marine communities of northern New South Wales: A standard protocol for data collection on nearshore reefs. National Marine Science Centre, Coffs Harbour. National Marine Science Centre, Coffs Harbour, NSW. 59 pp. + appendices pp.
Smith, S.D.A. 2005. Rapid assessment of invertebrate biodiversity on rocky shores: where there's a whelk there's a way. Biodiversity and Conservation 14: 3565-3576.
23
Smith, S.D.A., R.A. Edwards, S.J. Dalton & M. Harrison. 2005. Biological assessment of fish and benthic communities at Palm Beach Bait Reef, Gold Coast, Queensland. pp. 24, University of New England, National Marine Science Centre, Coffs Harbour, Australia.
Smith, S.D.A. & K.A. James. 2003. Rapid assessment of rocky shore biodiversity in the Byron Bay region, University of New England, Coffs Harbour, Australia.
Smith, S.D.A., H.A. Malcolm, M.J. Rule, S.J. Dalton & M. Harrison. 2006. Rapid Biodiversity Assessment of Inshore Reefs. pp. 46 pp. + appendices, University of New England, National Marine Science Centre, Coffs Harbour, NSW.
Smith, S.D.A., M.J. Rule, M. Harrison & S.J. Dalton. 2008. Monitoring the sea change: preliminary assessment of the conservation value of nearshore reefs, and existing impacts, in a high-growth, coastal region of subtropical eastern Australia. Marine Pollution Bulletin 56: 525-534.
24
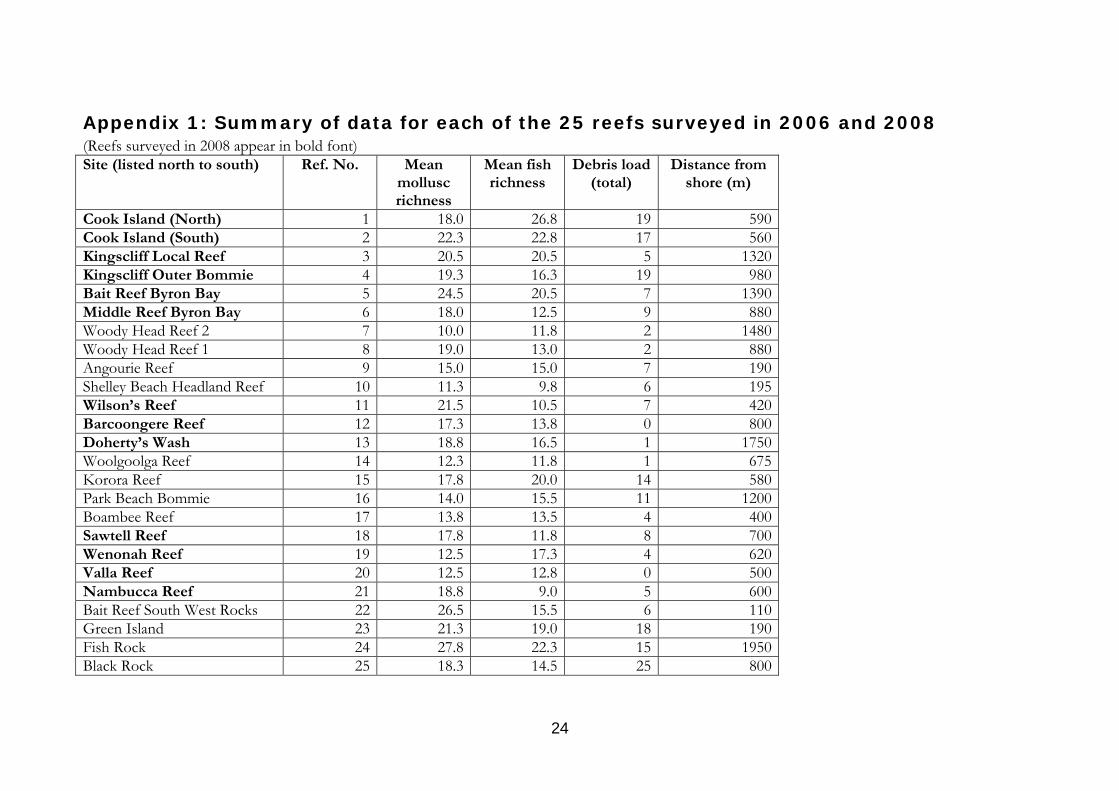
Appendix 1: Summary of data for each of the 25 reefs surveyed in 2006 and 2008 (Reefs surveyed in 2008 appear in bold font) Site (listed north to south) Ref. No. Mean
mollusc richness
Mean fish richness
Debris load (total)
Distance from shore (m)
Cook Island (North) 1 18.0 26.8 19 590Cook Island (South) 2 22.3 22.8 17 560Kingscliff Local Reef 3 20.5 20.5 5 1320Kingscliff Outer Bommie 4 19.3 16.3 19 980Bait Reef Byron Bay 5 24.5 20.5 7 1390Middle Reef Byron Bay 6 18.0 12.5 9 880Woody Head Reef 2 7 10.0 11.8 2 1480Woody Head Reef 1 8 19.0 13.0 2 880Angourie Reef 9 15.0 15.0 7 190Shelley Beach Headland Reef 10 11.3 9.8 6 195Wilson’s Reef 11 21.5 10.5 7 420Barcoongere Reef 12 17.3 13.8 0 800Doherty’s Wash 13 18.8 16.5 1 1750Woolgoolga Reef 14 12.3 11.8 1 675Korora Reef 15 17.8 20.0 14 580Park Beach Bommie 16 14.0 15.5 11 1200Boambee Reef 17 13.8 13.5 4 400Sawtell Reef 18 17.8 11.8 8 700Wenonah Reef 19 12.5 17.3 4 620Valla Reef 20 12.5 12.8 0 500Nambucca Reef 21 18.8 9.0 5 600Bait Reef South West Rocks 22 26.5 15.5 6 110Green Island 23 21.3 19.0 18 190Fish Rock 24 27.8 22.3 15 1950Black Rock 25 18.3 14.5 25 800

CONTACT DETAILS
Street Address Bay DriveCharlesworth Bay Coffs Harbour
Postal Address PO Box J321Coffs Harbour NSW 2450 Australia
Telephone 61 2 6648 3900Facsimile 61 2 6651 6580
Email [email protected] Web www.nmsc.edu.au
The NMSC is a Corporate Entity owned jointly by Southern Cross University
and the University of New England