Embed Size (px)
Citation preview
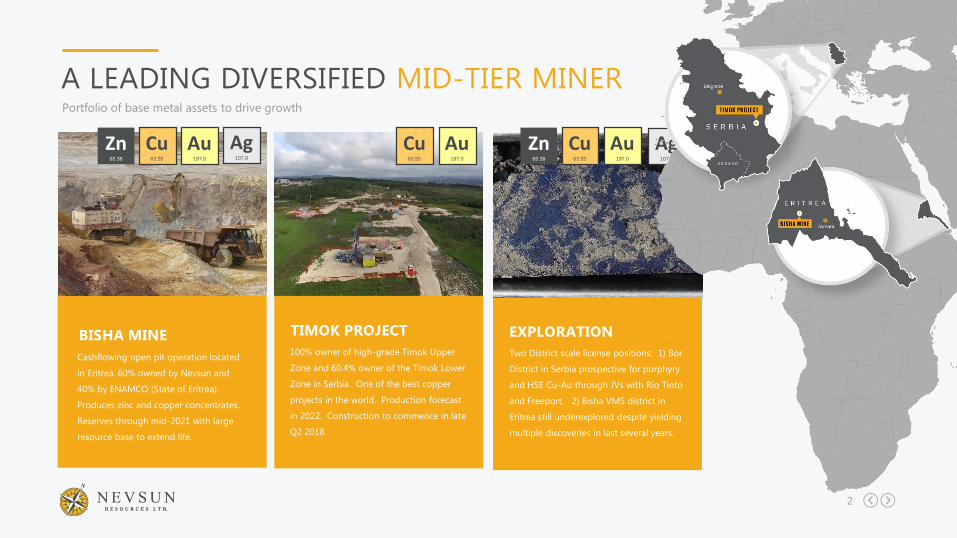
A LEADING DIVERSIFIED
MID-TIER MINER
CORPORATE PRESENTATION
Q2 2018
TSX & NYSE AMERICAN NSU
2
A LEADING DIVERSIFIED MID-TIER MINERPortfolio of base metal assets to drive growth
Cashflowing open pit operation located
in Eritrea. 60% owned by Nevsun and
40% by ENAMCO (State of Eritrea).
Produces zinc and copper concentrates.
Reserves through mid-2021 with large
resource base to extend life.
BISHA MINE100% owner of high-grade Timok Upper
Zone and 60.4% owner of the Timok Lower
Zone in Serbia. One of the best copper
projects in the world. Production forecast
in 2022. Construction to commence in late
Q2 2018.
TIMOK PROJECT
Two District scale license positions; 1) Bor
District in Serbia prospective for porphyry
and HSE Cu-Au through JVs with Rio Tinto
and Freeport. 2) Bisha VMS district in
Eritrea still underexplored despite yielding
multiple discoveries in last several years.
EXPLORATION
Zn65.38
Au197.0
Ag107.9
Cu63.55
Au197.0
Cu63.55
Zn65.38
Au197.0
Cu63.55
Ag107.9
3
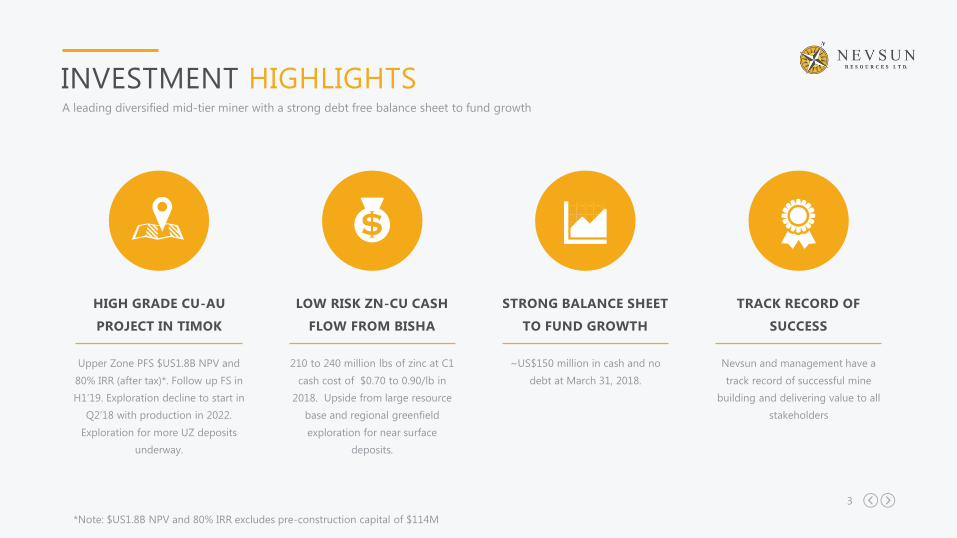
INVESTMENT HIGHLIGHTSA leading diversified mid-tier miner with a strong debt free balance sheet to fund growth
Upper Zone PFS $US1.8B NPV and
80% IRR (after tax)*. Follow up FS in
H1’19. Exploration decline to start in
Q2’18 with production in 2022.
Exploration for more UZ deposits
underway.
HIGH GRADE CU-AU
PROJECT IN TIMOK
LOW RISK ZN-CU CASH
FLOW FROM BISHA
210 to 240 million lbs of zinc at C1
cash cost of $0.70 to 0.90/lb in
2018. Upside from large resource
base and regional greenfield
exploration for near surface
deposits.
STRONG BALANCE SHEET
TO FUND GROWTH
~US$150 million in cash and no
debt at March 31, 2018.
TRACK RECORD OF
SUCCESS
Nevsun and management have a
track record of successful mine
building and delivering value to all
stakeholders
*Note: $US1.8B NPV and 80% IRR excludes pre-construction capital of $114M
4
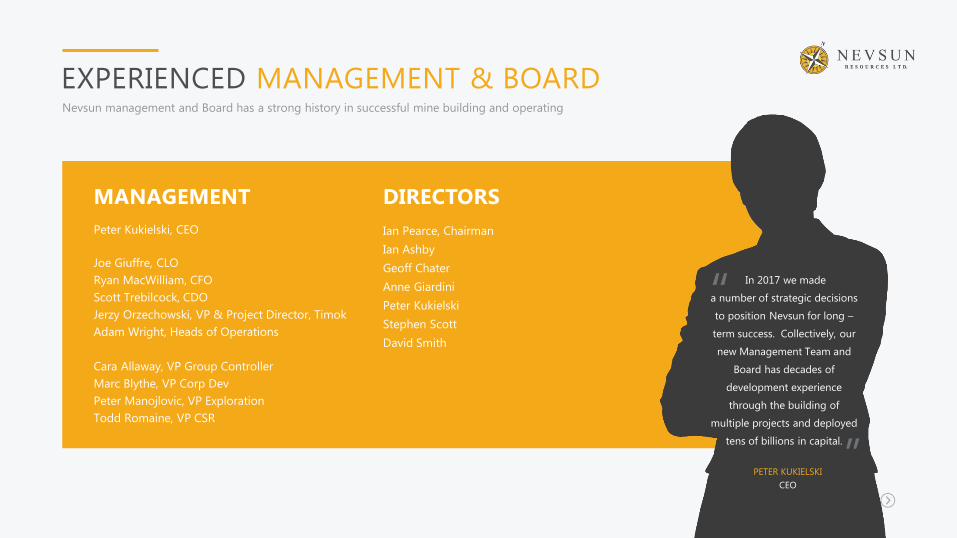
EXPERIENCED MANAGEMENT & BOARDNevsun management and Board has a strong history in successful mine building and operating
Peter Kukielski, CEO
Joe Giuffre, CLO
Ryan MacWilliam, CFO
Scott Trebilcock, CDO
Jerzy Orzechowski, VP & Project Director, Timok
Adam Wright, Heads of Operations
Cara Allaway, VP Group Controller
Marc Blythe, VP Corp Dev
Peter Manojlovic, VP Exploration
Todd Romaine, VP CSR
MANAGEMENT
Ian Pearce, Chairman
Ian Ashby
Geoff Chater
Anne Giardini
Peter Kukielski
Stephen Scott
David Smith
DIRECTORS
PETER KUKIELSKI
CEO
“
”
In 2017 we made
a number of strategic decisions
to position Nevsun for long –
term success. Collectively, our
new Management Team and
Board has decades of
development experience
through the building of
multiple projects and deployed
tens of billions in capital.
5
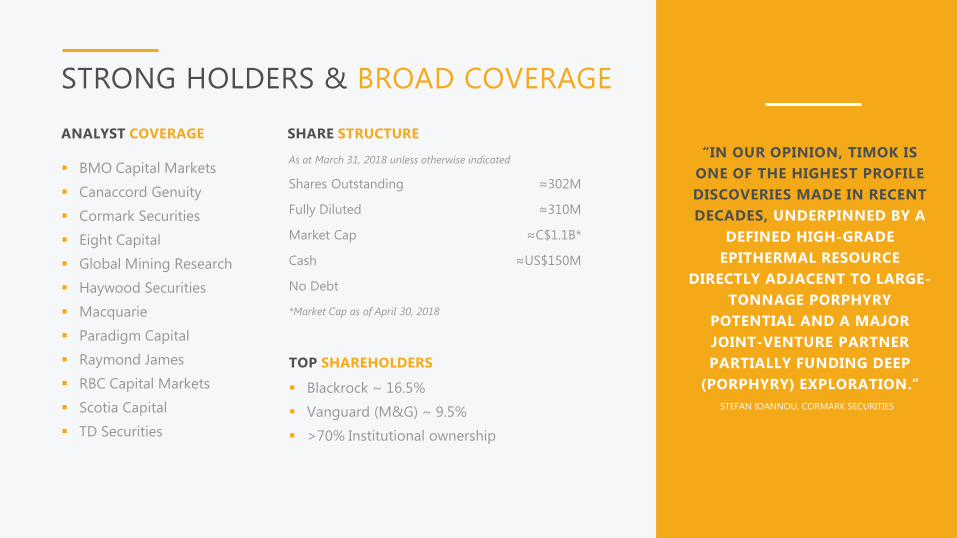
STRONG HOLDERS & BROAD COVERAGE
▪ BMO Capital Markets
▪ Canaccord Genuity
▪ Cormark Securities
▪ Eight Capital
▪ Global Mining Research
▪ Haywood Securities
▪ Macquarie
▪ Paradigm Capital
▪ Raymond James
▪ RBC Capital Markets
▪ Scotia Capital
▪ TD Securities
ANALYST COVERAGE
▪ Blackrock ~ 16.5%
▪ Vanguard (M&G) ~ 9.5%
▪ >70% Institutional ownership
TOP SHAREHOLDERS
As at March 31, 2018 unless otherwise indicated
Shares Outstanding ≈302M
Fully Diluted ≈310M
Market Cap ≈C$1.1B*
Cash ≈US$150M
No Debt
SHARE STRUCTURE
“IN OUR OPINION, TIMOK IS
ONE OF THE HIGHEST PROFILE
DISCOVERIES MADE IN RECENT
DECADES, UNDERPINNED BY A
DEFINED HIGH-GRADE
EPITHERMAL RESOURCE
DIRECTLY ADJACENT TO LARGE-
TONNAGE PORPHYRY
POTENTIAL AND A MAJOR
JOINT-VENTURE PARTNER
PARTIALLY FUNDING DEEP
(PORPHYRY) EXPLORATION.”
STEFAN IOANNOU, CORMARK SECURITIES
*Market Cap as of April 30, 2018
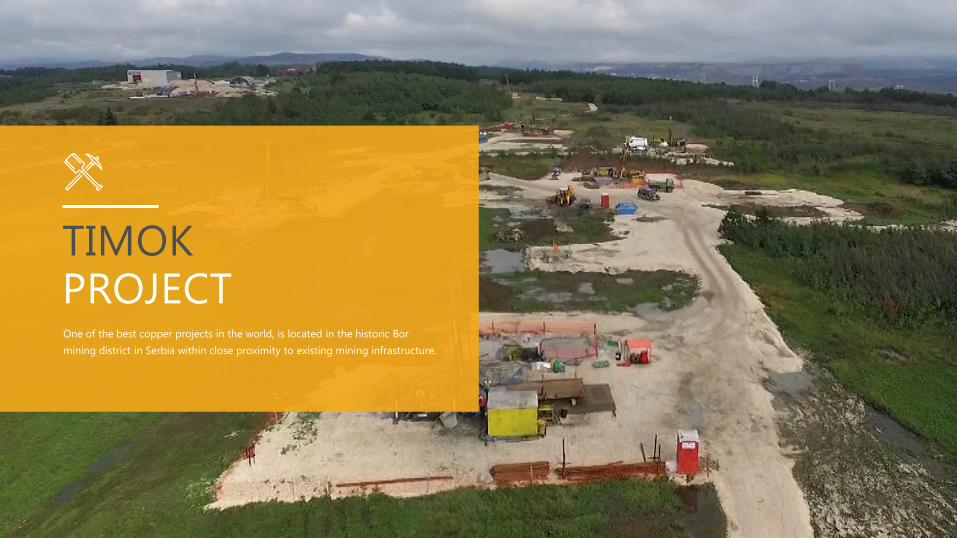
TIMOKPROJECTOne of the best copper projects in the world, is located in the historic Bor
mining district in Serbia within close proximity to existing mining infrastructure.
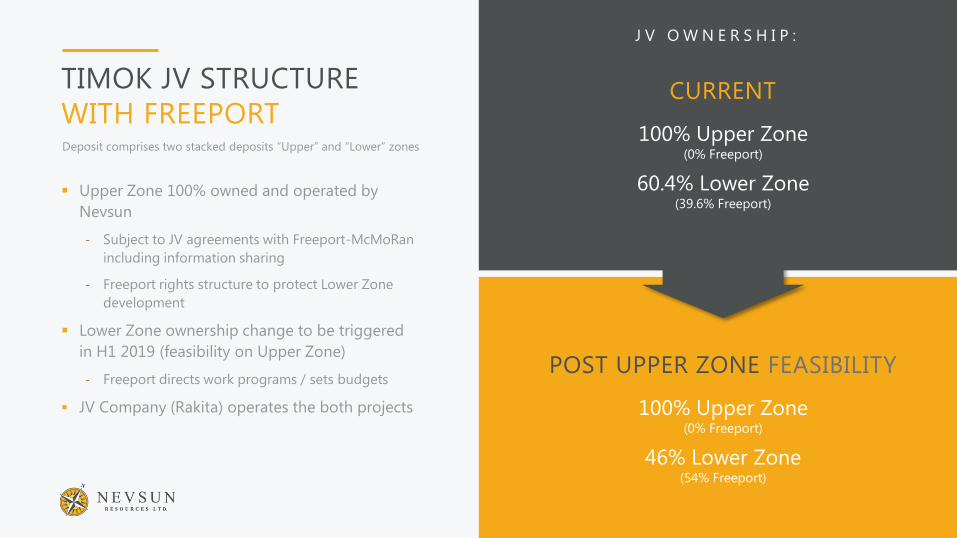
TIMOK JV STRUCTURE
WITH FREEPORTDeposit comprises two stacked deposits “Upper” and “Lower” zones
POST UPPER ZONE FEASIBILITY
100% Upper Zone (0% Freeport)
46% Lower Zone(54% Freeport)
▪ Upper Zone 100% owned and operated by
Nevsun
- Subject to JV agreements with Freeport-McMoRan
including information sharing
- Freeport rights structure to protect Lower Zone
development
▪ Lower Zone ownership change to be triggered
in H1 2019 (feasibility on Upper Zone)
- Freeport directs work programs / sets budgets
▪ JV Company (Rakita) operates the both projects
J V O W N E R S H I P :
CURRENT
100% Upper Zone (0% Freeport)
60.4% Lower Zone(39.6% Freeport)
8
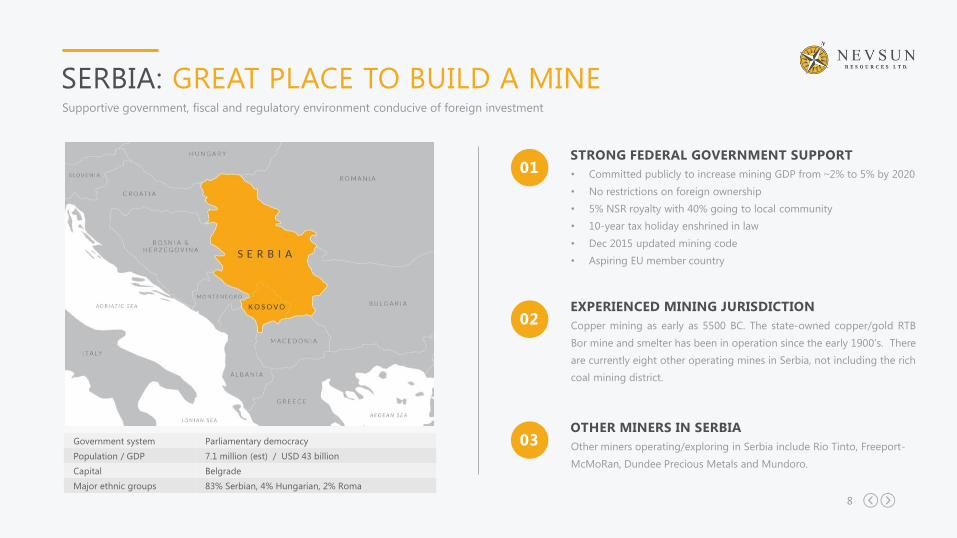
SERBIA: GREAT PLACE TO BUILD A MINESupportive government, fiscal and regulatory environment conducive of foreign investment
• Committed publicly to increase mining GDP from ~2% to 5% by 2020
• No restrictions on foreign ownership
• 5% NSR royalty with 40% going to local community
• 10-year tax holiday enshrined in law
• Dec 2015 updated mining code
• Aspiring EU member country
STRONG FEDERAL GOVERNMENT SUPPORT01
Copper mining as early as 5500 BC. The state-owned copper/gold RTB
Bor mine and smelter has been in operation since the early 1900’s. There
are currently eight other operating mines in Serbia, not including the rich
coal mining district.
EXPERIENCED MINING JURISDICTION02
Other miners operating/exploring in Serbia include Rio Tinto, Freeport-
McMoRan, Dundee Precious Metals and Mundoro.
OTHER MINERS IN SERBIA03Government system Parliamentary democracy
Population / GDP 7.1 million (est) / USD 43 billion
Capital Belgrade
Major ethnic groups 83% Serbian, 4% Hungarian, 2% Roma
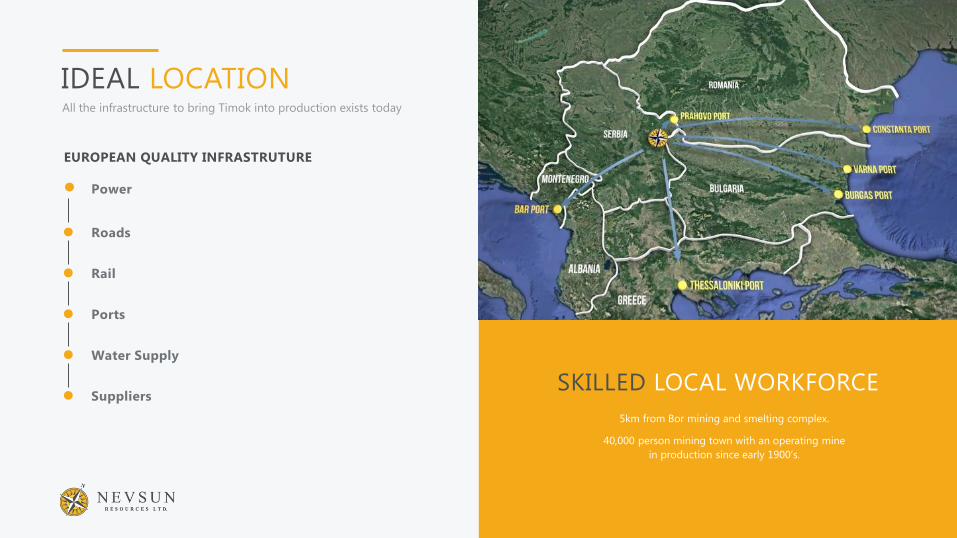
IDEAL LOCATIONAll the infrastructure to bring Timok into production exists today
SKILLED LOCAL WORKFORCE
5km from Bor mining and smelting complex.
40,000 person mining town with an operating mine
in production since early 1900’s.
Power
Roads
Ports
Water Supply
Suppliers
Rail
EUROPEAN QUALITY INFRASTRUTURE
10
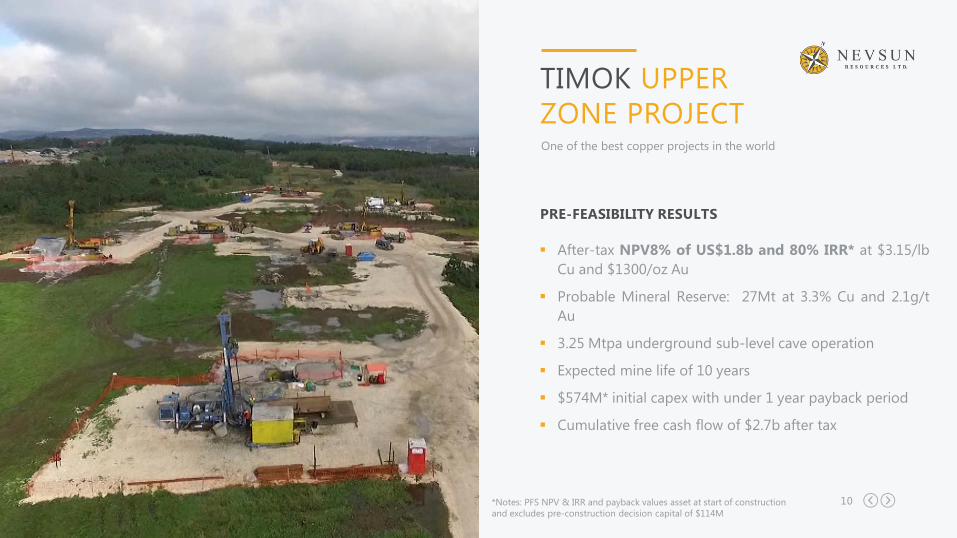
▪ After-tax NPV8% of US$1.8b and 80% IRR* at $3.15/lb
Cu and $1300/oz Au
▪ Probable Mineral Reserve: 27Mt at 3.3% Cu and 2.1g/t
Au
▪ 3.25 Mtpa underground sub-level cave operation
▪ Expected mine life of 10 years
▪ $574M* initial capex with under 1 year payback period
▪ Cumulative free cash flow of $2.7b after tax
TIMOK UPPER
ZONE PROJECTOne of the best copper projects in the world
PRE-FEASIBILITY RESULTS
*Notes: PFS NPV & IRR and payback values asset at start of construction
and excludes pre-construction decision capital of $114M
11
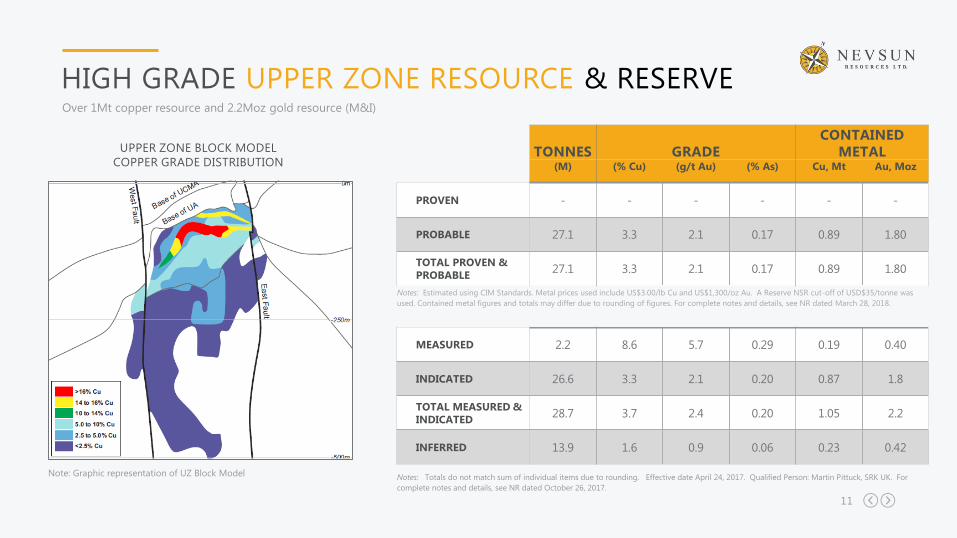
HIGH GRADE UPPER ZONE RESOURCE & RESERVEOver 1Mt copper resource and 2.2Moz gold resource (M&I)
TONNES GRADE
CONTAINED
METAL(M) (% Cu) (g/t Au) (% As) Cu, Mt Au, Moz
PROVEN - - - - - -
PROBABLE 27.1 3.3 2.1 0.17 0.89 1.80
TOTAL PROVEN &
PROBABLE27.1 3.3 2.1 0.17 0.89 1.80
Notes: Totals do not match sum of individual items due to rounding. Effective date April 24, 2017. Qualified Person: Martin Pittuck, SRK UK. For
complete notes and details, see NR dated October 26, 2017.
Note: Graphic representation of UZ Block Model
UPPER ZONE BLOCK MODEL
COPPER GRADE DISTRIBUTION
MEASURED 2.2 8.6 5.7 0.29 0.19 0.40
INDICATED 26.6 3.3 2.1 0.20 0.87 1.8
TOTAL MEASURED &
INDICATED28.7 3.7 2.4 0.20 1.05 2.2
INFERRED 13.9 1.6 0.9 0.06 0.23 0.42
Notes: Estimated using CIM Standards. Metal prices used include US$3.00/lb Cu and US$1,300/oz Au. A Reserve NSR cut-off of USD$35/tonne was
used. Contained metal figures and totals may differ due to rounding of figures. For complete notes and details, see NR dated March 28, 2018.
12
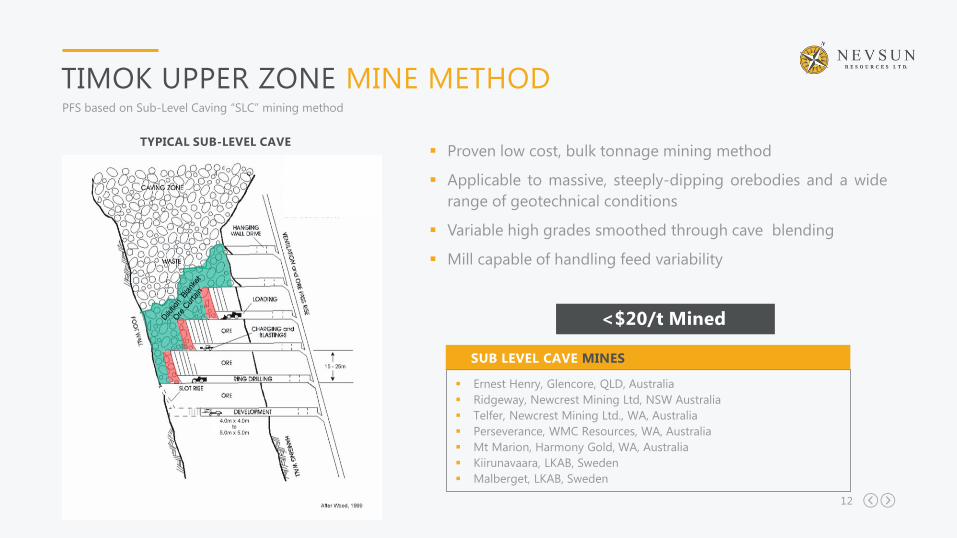
TIMOK UPPER ZONE MINE METHODPFS based on Sub-Level Caving “SLC” mining method
TYPICAL SUB-LEVEL CAVE▪ Proven low cost, bulk tonnage mining method
▪ Applicable to massive, steeply-dipping orebodies and a wide
range of geotechnical conditions
▪ Variable high grades smoothed through cave blending
▪ Mill capable of handling feed variability
<$20/t Mined
SUB LEVEL CAVE MINES
▪ Ernest Henry, Glencore, QLD, Australia
▪ Ridgeway, Newcrest Mining Ltd, NSW Australia
▪ Telfer, Newcrest Mining Ltd., WA, Australia
▪ Perseverance, WMC Resources, WA, Australia
▪ Mt Marion, Harmony Gold, WA, Australia
▪ Kiirunavaara, LKAB, Sweden
▪ Malberget, LKAB, Sweden
13
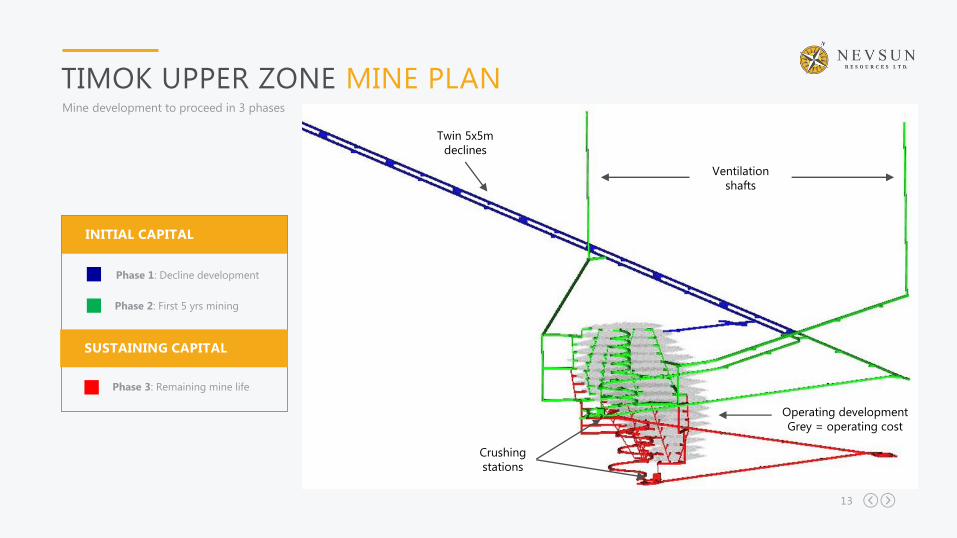
TIMOK UPPER ZONE MINE PLANMine development to proceed in 3 phases
INITIAL CAPITAL
Phase 1: Decline development
Phase 2: First 5 yrs mining
SUSTAINING CAPITAL
Phase 3: Remaining mine life
Ventilation
shafts
Twin 5x5m
declines
Operating development
Grey = operating cost
Crushing
stations
14
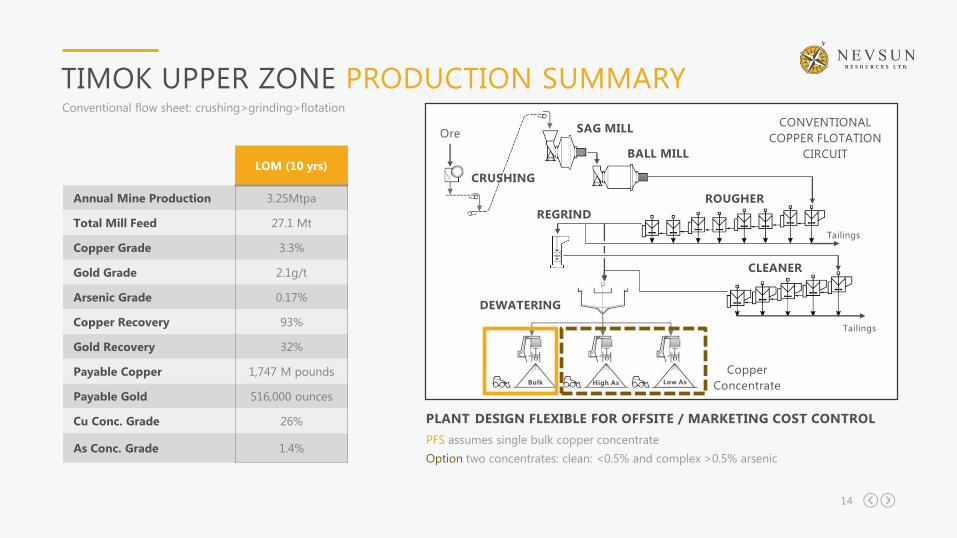
TIMOK UPPER ZONE PRODUCTION SUMMARYConventional flow sheet: crushing>grinding>flotation
PLANT DESIGN FLEXIBLE FOR OFFSITE / MARKETING COST CONTROL
PFS assumes single bulk copper concentrate
Option two concentrates: clean: <0.5% and complex >0.5% arsenic
LOM (10 yrs)
Annual Mine Production 3.25Mtpa
Total Mill Feed 27.1 Mt
Copper Grade 3.3%
Gold Grade 2.1g/t
Arsenic Grade 0.17%
Copper Recovery 93%
Gold Recovery 32%
Payable Copper 1,747 M pounds
Payable Gold 516,000 ounces
Cu Conc. Grade 26%
As Conc. Grade 1.4%
ROUGHER
CLEANER
DEWATERING
REGRIND
CRUSHING
SAG MILL
BALL MILL
CONVENTIONAL
COPPER FLOTATION
CIRCUIT
Bulk High As Low As
Copper
Concentrate
Tailings
Ore
Tailings
15
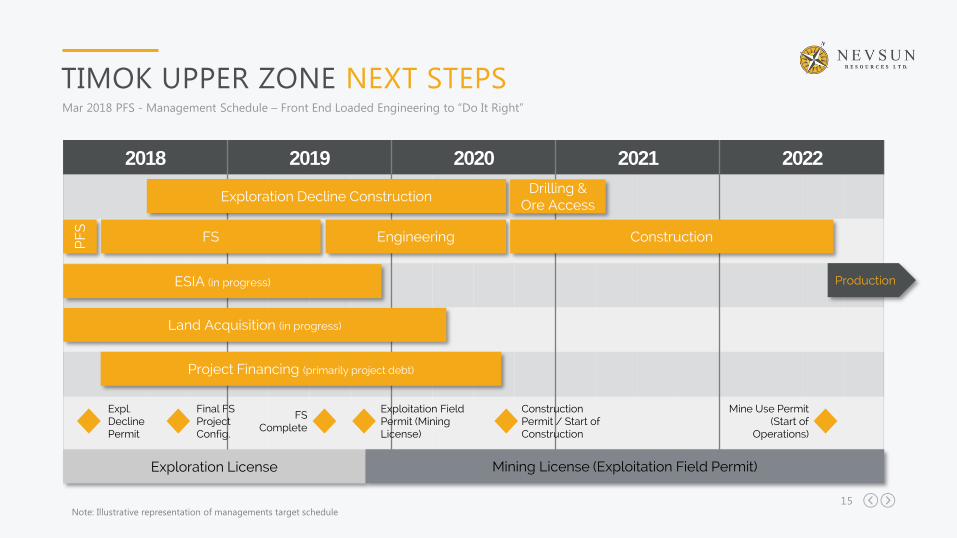
TIMOK UPPER ZONE NEXT STEPSMar 2018 PFS - Management Schedule – Front End Loaded Engineering to “Do It Right”
2018 2019 2020 2021 2022
Exploration Decline Construction
EngineeringPFS
ESIA (in progress)
FS
Production
Land Acquisition (in progress)
Expl. Decline Permit
Exploitation Field Permit (Mining License)
Construction Permit / Start of Construction
Mine Use Permit(Start of
Operations)
Exploration License Mining License (Exploitation Field Permit)
Construction
Drilling & Ore Access
Final FS Project Config.
FS Complete
Project Financing (primarily project debt)
Note: Illustrative representation of managements target schedule
16
Pre-production capital cost of $574M, including contingency
28%
34%
21%
17%
Underground Surface
Indirect & Startup Contingency
I N I T I A L P F S C A P I T A L B R E A K D O W N
TIMOK UPPER ZONE CAPITAL COSTS
Initial Capital
(M)
Sustaining Capital
(M)
UG Mine Development & Infrastructure $159 $119
Site Development $49 -
Process Plant $99 $30
TSF / Water $47 $59
Indirect Costs $106 -
Capitalized Startup Cost $17 -
Contingency $96 $31
Total Capex $574 $239
Owner costs pre-construction decision $71 -
Decline costs pre-construction decision $43 -
Total pre-construction decision $114
17
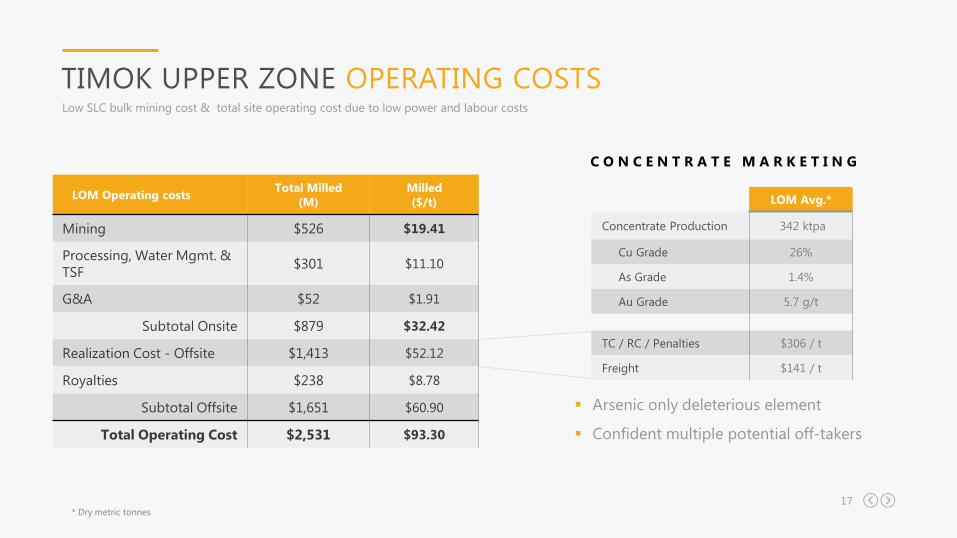
Low SLC bulk mining cost & total site operating cost due to low power and labour costs
TIMOK UPPER ZONE OPERATING COSTS
LOM Operating costsTotal Milled
(M)
Milled
($/t)
Mining $526 $19.41
Processing, Water Mgmt. &
TSF$301 $11.10
G&A $52 $1.91
Subtotal Onsite $879 $32.42
Realization Cost - Offsite $1,413 $52.12
Royalties $238 $8.78
Subtotal Offsite $1,651 $60.90
Total Operating Cost $2,531 $93.30
C O N C E N T R A T E M A R K E T I N G
▪ Arsenic only deleterious element
▪ Confident multiple potential off-takers
LOM Avg.*
Concentrate Production 342 ktpa
Cu Grade 26%
As Grade 1.4%
Au Grade 5.7 g/t
TC / RC / Penalties $306 / t
Freight $141 / t
* Dry metric tonnes
18
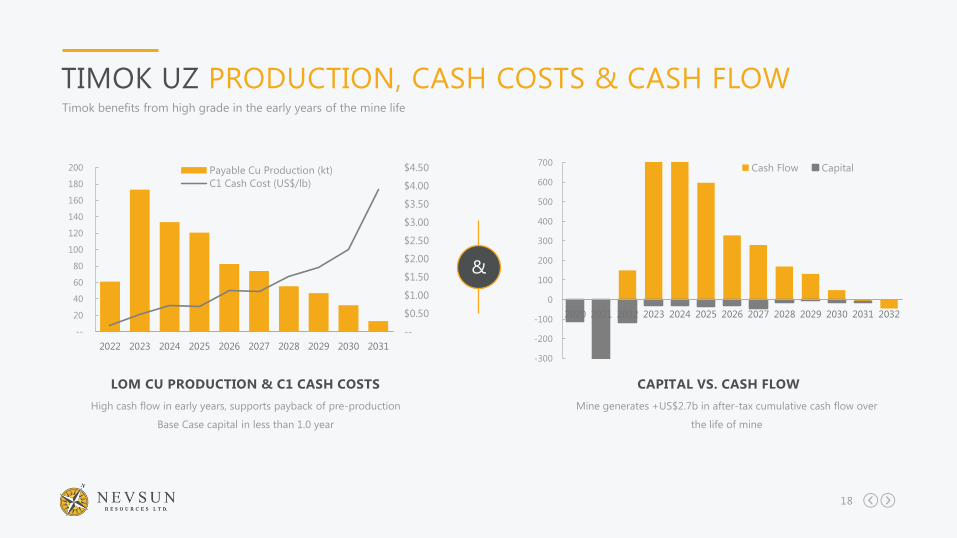
TIMOK UZ PRODUCTION, CASH COSTS & CASH FLOWTimok benefits from high grade in the early years of the mine life
--
$0.50
$1.00
$1.50
$2.00
$2.50
$3.00
$3.50
$4.00
$4.50
--
20
40
60
80
100
120
140
160
180
200
2022 2023 2024 2025 2026 2027 2028 2029 2030 2031
Payable Cu Production (kt)
C1 Cash Cost (US$/lb)
High cash flow in early years, supports payback of pre-production
Base Case capital in less than 1.0 year
LOM CU PRODUCTION & C1 CASH COSTS
Mine generates +US$2.7b in after-tax cumulative cash flow over
the life of mine
CAPITAL VS. CASH FLOW
-300
-200
-100
0
100
200
300
400
500
600
700
2020 2021 2022 2023 2024 2025 2026 2027 2028 2029 2030 2031 2032
Cash Flow Capital
&
19
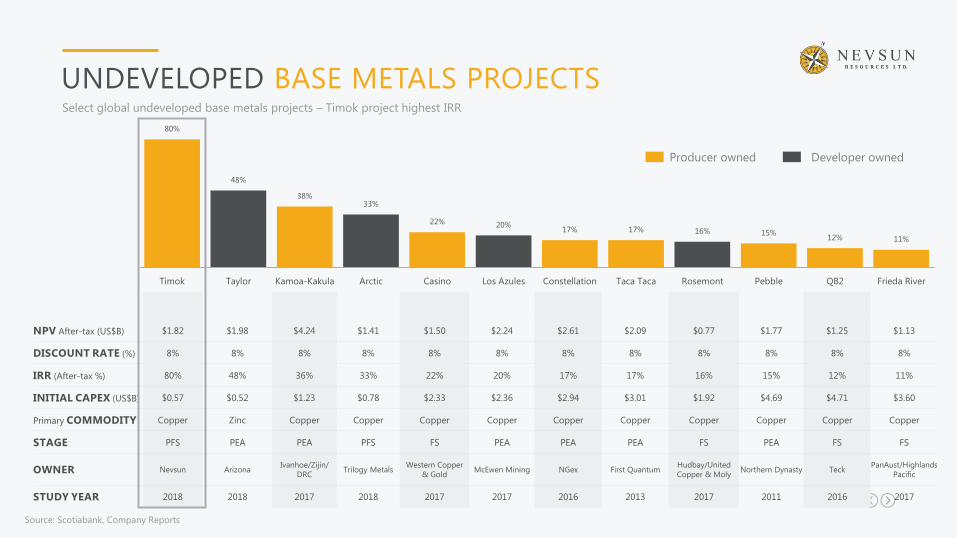
UNDEVELOPED BASE METALS PROJECTSSelect global undeveloped base metals projects – Timok project highest IRR
80%
48%
38%33%
22% 20%17% 17% 16% 15%
12% 11%
Timok Taylor Kamoa-Kakula Arctic Casino Los Azules Constellation Taca Taca Rosemont Pebble QB2 Frieda River
Producer owned Developer owned
Source: Scotiabank, Company Reports
NPV After-tax (US$B) $1.82 $1.98 $4.24 $1.41 $1.50 $2.24 $2.61 $2.09 $0.77 $1.77 $1.25 $1.13
DISCOUNT RATE (%) 8% 8% 8% 8% 8% 8% 8% 8% 8% 8% 8% 8%
IRR (After-tax %) 80% 48% 36% 33% 22% 20% 17% 17% 16% 15% 12% 11%
INITIAL CAPEX (US$B) $0.57 $0.52 $1.23 $0.78 $2.33 $2.36 $2.94 $3.01 $1.92 $4.69 $4.71 $3.60
Primary COMMODITY Copper Zinc Copper Copper Copper Copper Copper Copper Copper Copper Copper Copper
STAGE PFS PEA PEA PFS FS PEA PEA PEA FS PEA FS FS
OWNER Nevsun ArizonaIvanhoe/Zijin/
DRCTrilogy Metals
Western Copper
& GoldMcEwen Mining NGex First Quantum
Hudbay/United
Copper & MolyNorthern Dynasty Teck
PanAust/Highlands
Pacific
STUDY YEAR 2018 2018 2017 2018 2017 2017 2016 2013 2017 2011 2016 2017

20
TIMOK PROJECT NEXT STEPSFront end loading to “do it right”
UPPER ZONE NEXT STEPS
Updated PEA in October 2017
Pre-feasibility study in Q1 2018z
Lower Zone resource – mid-2018z
Feasibility study in mid-2019z
Production anticipated in 2022z
Ongoing drilling to find more Upper Zone style depositsz
Begin decline development Q2 2018z
21
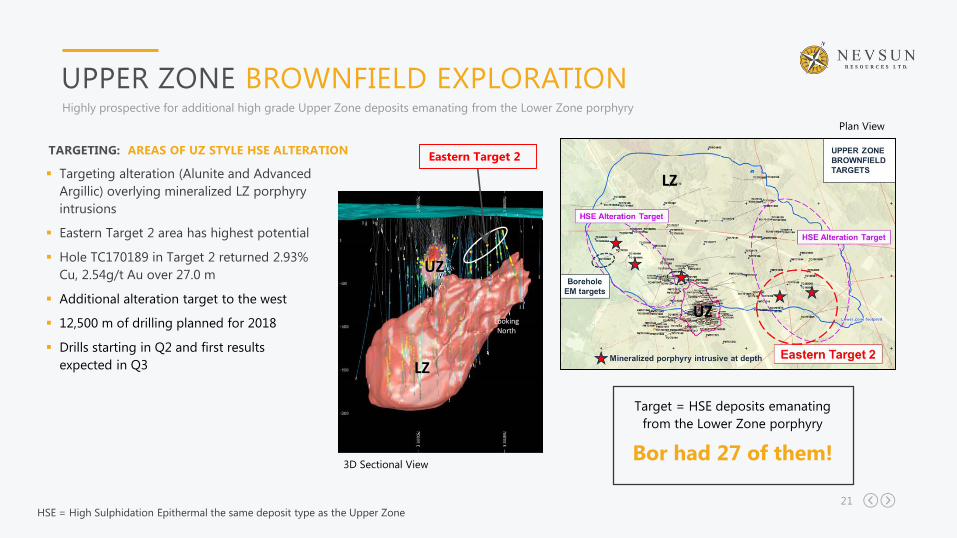
UPPER ZONE BROWNFIELD EXPLORATIONHighly prospective for additional high grade Upper Zone deposits emanating from the Lower Zone porphyry
TARGETING: AREAS OF UZ STYLE HSE ALTERATION
▪ Targeting alteration (Alunite and Advanced
Argillic) overlying mineralized LZ porphyry
intrusions
▪ Eastern Target 2 area has highest potential
▪ Hole TC170189 in Target 2 returned 2.93%
Cu, 2.54g/t Au over 27.0 m
▪ Additional alteration target to the west
▪ 12,500 m of drilling planned for 2018
▪ Drills starting in Q2 and first results
expected in Q3 LZ
UZ
Looking North
Eastern Target 2
Target = HSE deposits emanating
from the Lower Zone porphyry
Bor had 27 of them!
Plan View
3D Sectional View
HSE = High Sulphidation Epithermal the same deposit type as the Upper Zone
LZ
UZ
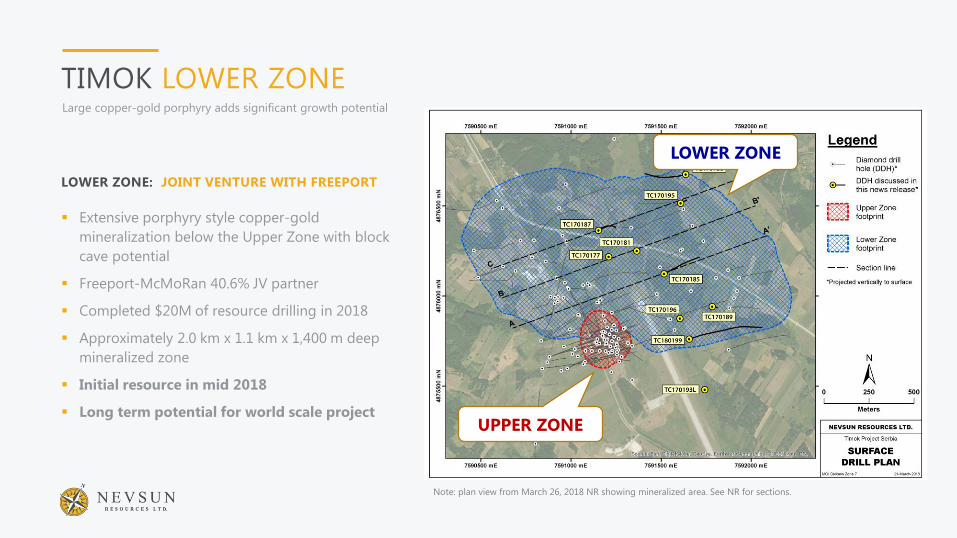
TIMOK LOWER ZONELarge copper-gold porphyry adds significant growth potential
LOWER ZONE: JOINT VENTURE WITH FREEPORT
▪ Extensive porphyry style copper-gold
mineralization below the Upper Zone with block
cave potential
▪ Freeport-McMoRan 40.6% JV partner
▪ Completed $20M of resource drilling in 2018
▪ Approximately 2.0 km x 1.1 km x 1,400 m deep
mineralized zone
▪ Initial resource in mid 2018
▪ Long term potential for world scale project
LOWER ZONE
UPPER ZONE
Note: plan view from March 26, 2018 NR showing mineralized area. See NR for sections.
23
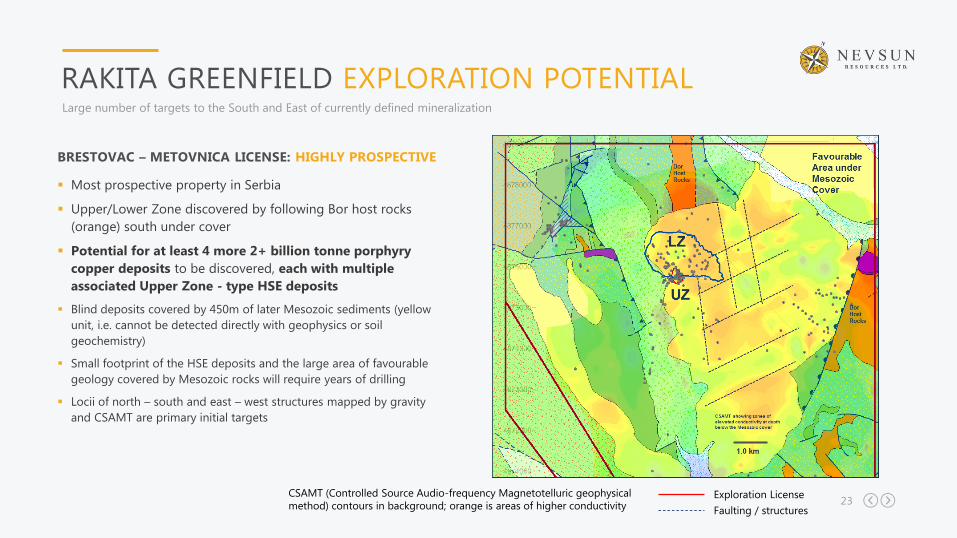
RAKITA GREENFIELD EXPLORATION POTENTIALLarge number of targets to the South and East of currently defined mineralization
BRESTOVAC – METOVNICA LICENSE: HIGHLY PROSPECTIVE
▪ Most prospective property in Serbia
▪ Upper/Lower Zone discovered by following Bor host rocks
(orange) south under cover
▪ Potential for at least 4 more 2+ billion tonne porphyry
copper deposits to be discovered, each with multiple
associated Upper Zone - type HSE deposits
▪ Blind deposits covered by 450m of later Mesozoic sediments (yellow
unit, i.e. cannot be detected directly with geophysics or soil
geochemistry)
▪ Small footprint of the HSE deposits and the large area of favourable
geology covered by Mesozoic rocks will require years of drilling
▪ Locii of north – south and east – west structures mapped by gravity
and CSAMT are primary initial targets
Exploration LicenseCSAMT (Controlled Source Audio-frequency Magnetotelluric geophysical
method) contours in background; orange is areas of higher conductivity Faulting / structures
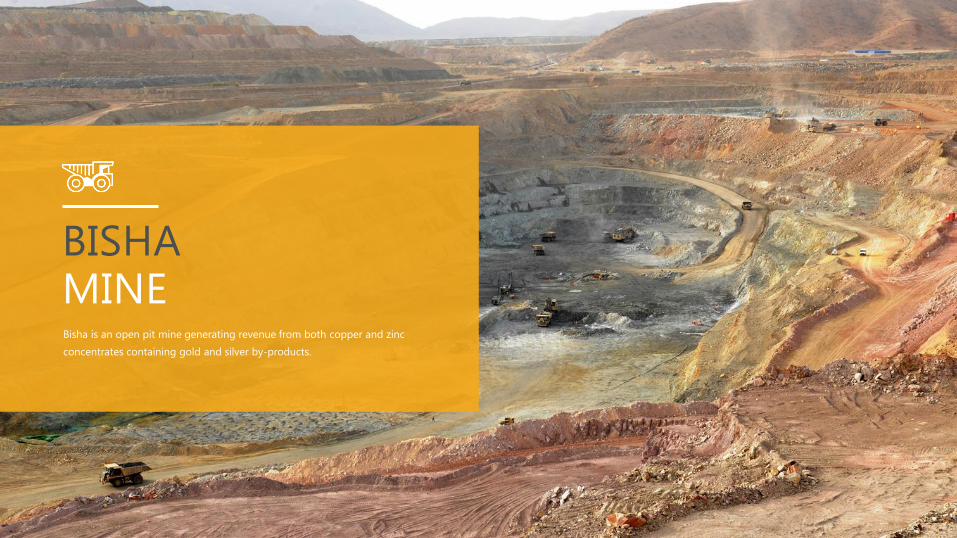
BISHAMINEBisha is an open pit mine generating revenue from both copper and zinc
concentrates containing gold and silver by-products.
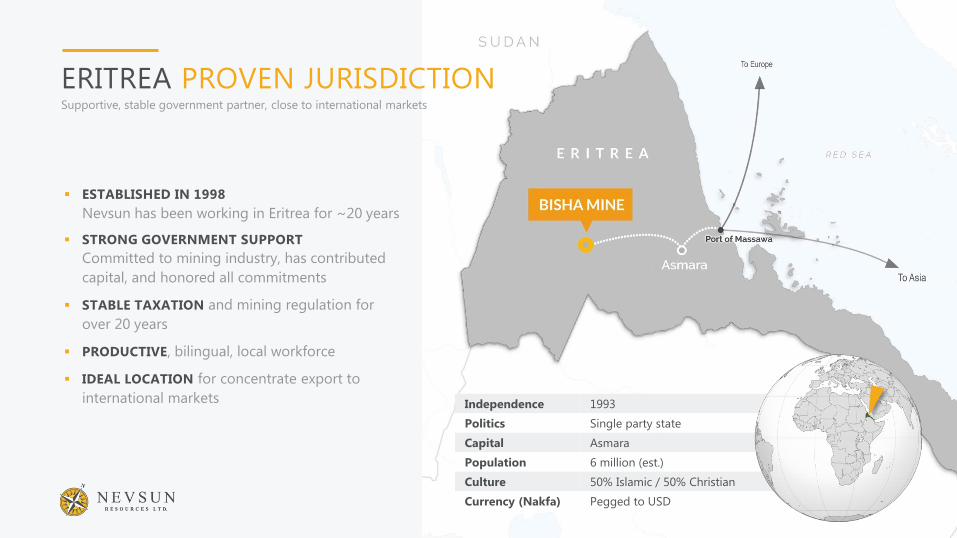
ERITREA PROVEN JURISDICTIONSupportive, stable government partner, close to international markets
Independence 1993
Politics Single party state
Capital Asmara
Population 6 million (est.)
Culture 50% Islamic / 50% Christian
Currency (Nakfa) Pegged to USD
▪ ESTABLISHED IN 1998
Nevsun has been working in Eritrea for ~20 years
▪ STRONG GOVERNMENT SUPPORT
Committed to mining industry, has contributed
capital, and honored all commitments
▪ STABLE TAXATION and mining regulation for
over 20 years
▪ PRODUCTIVE, bilingual, local workforce
▪ IDEAL LOCATION for concentrate export to
international markets
26
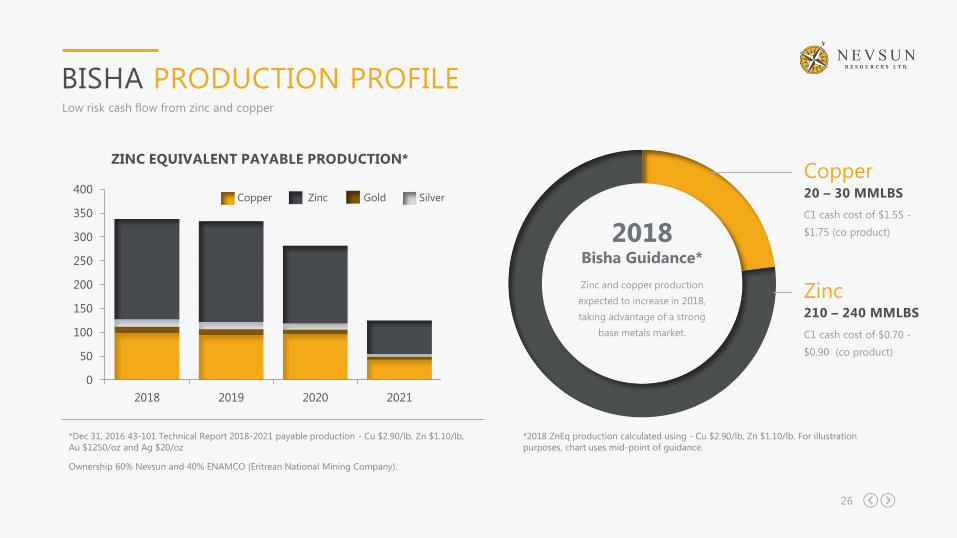
BISHA PRODUCTION PROFILELow risk cash flow from zinc and copper
0
50
100
150
200
250
300
350
400
2018 2019 2020 2021
Copper Zinc Gold Silver
ZINC EQUIVALENT PAYABLE PRODUCTION*
*Dec 31, 2016 43-101 Technical Report 2018-2021 payable production - Cu $2.90/lb, Zn $1.10/lb,
Au $1250/oz and Ag $20/oz
Ownership 60% Nevsun and 40% ENAMCO (Eritrean National Mining Company).
C1 cash cost of $1.55 -
$1.75 (co product)
20 – 30 MMLBS
Copper
C1 cash cost of $0.70 -
$0.90 (co product)
210 – 240 MMLBS
ZincZinc and copper production
expected to increase in 2018,
taking advantage of a strong
base metals market.
2018 Bisha Guidance*
*2018 ZnEq production calculated using - Cu $2.90/lb, Zn $1.10/lb. For illustration
purposes, chart uses mid-point of guidance.
27
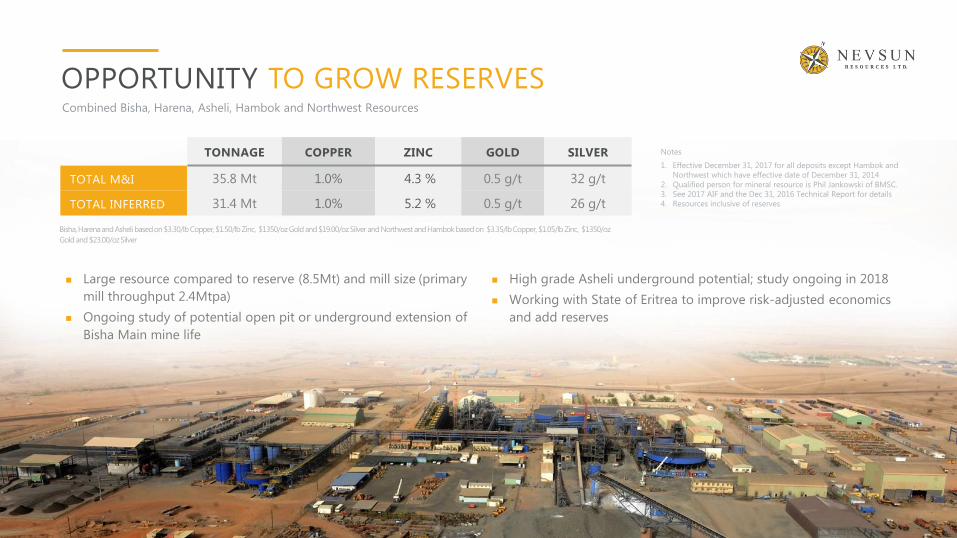
OPPORTUNITY TO GROW RESERVESCombined Bisha, Harena, Asheli, Hambok and Northwest Resources
◼ Large resource compared to reserve (8.5Mt) and mill size (primary
mill throughput 2.4Mtpa)
◼ Ongoing study of potential open pit or underground extension of
Bisha Main mine life
◼ High grade Asheli underground potential; study ongoing in 2018
◼ Working with State of Eritrea to improve risk-adjusted economics
and add reserves
TONNAGE COPPER ZINC GOLD SILVER
TOTAL M&I 35.8 Mt 1.0% 4.3 % 0.5 g/t 32 g/t
TOTAL INFERRED 31.4 Mt 1.0% 5.2 % 0.5 g/t 26 g/t
Bisha, Harena and Asheli based on $3.30/lb Copper, $1.50/lb Zinc, $1350/oz Gold and $19.00/oz Silver and Northwest and Hambok based on $3.35/lb Copper, $1.05/lb Zinc, $1350/oz
Gold and $23.00/oz Silver
Notes
1. Effective December 31, 2017 for all deposits except Hambok and
Northwest which have effective date of December 31, 2014
2. Qualified person for mineral resource is Phil Jankowski of BMSC.
3. See 2017 AIF and the Dec 31, 2016 Technical Report for details
4. Resources inclusive of reserves
28
Gap Area
DISTRICT SCALE EXPLORATION ERITREATens of highly prospective untested VMS targets
2018 EXPLORATION
▪ $7m budget for 15km of exploration in 2018
▪ Targeting shallow near-mine copper, gold and
silver discoveries.
▪ $3m budget for Harena and Asheli studies
BROWNFIELD TARGETS
▪ Gap Area, Bisha Village, Asheli North
GREENFIELD TARGETS
▪ VTEM priority follow-up (stars)
▪ Railway & Tekawda trends
▪ MX-124 (new trend) altered felsics
▪ Asheli & Asheli North trends
VMS = Volcanogenic Massive Sulphides = polymetallic CU-Zn-Au-Ag targets; already discovered seven on licenses
Favorable Horizons
for VMS deposits800+ km2 of licenses
75+ km of favorable horizon
29
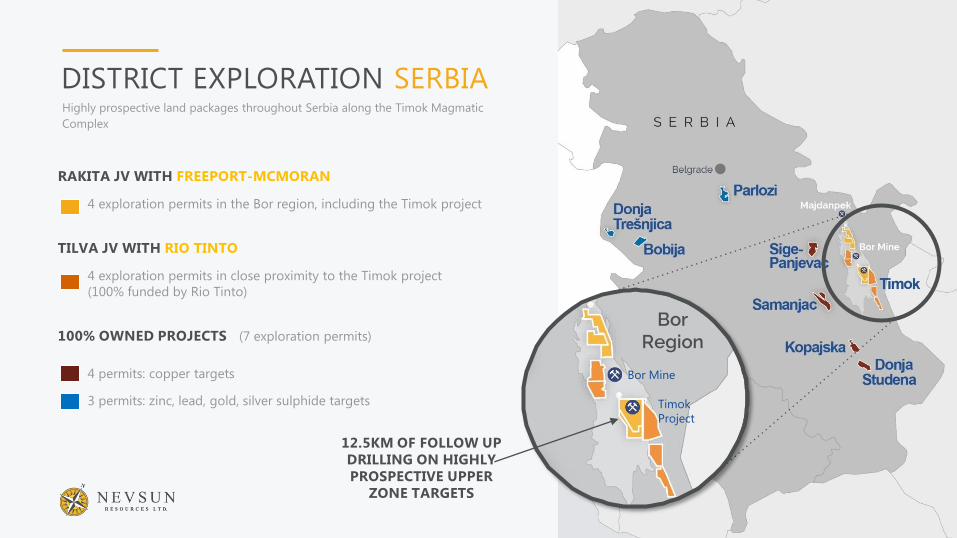
DISTRICT EXPLORATION SERBIAHighly prospective land packages throughout Serbia along the Timok Magmatic
Complex
RAKITA JV WITH FREEPORT-MCMORAN
4 exploration permits in the Bor region, including the Timok project
TILVA JV WITH RIO TINTO
4 exploration permits in close proximity to the Timok project
(100% funded by Rio Tinto)
100% OWNED PROJECTS (7 exploration permits)
4 permits: copper targets
3 permits: zinc, lead, gold, silver sulphide targets Timok
Project
Bor Mine
Bor Region
12.5KM OF FOLLOW UP
DRILLING ON HIGHLY
PROSPECTIVE UPPER
ZONE TARGETS
30
These risks, uncertainties and factors include general business, economic, competitive, political,
regulatory and social uncertainties; actual results of exploration activities and economic
evaluations; fluctuations in currency exchange rates; changes in project parameters; changes in
costs, including labour, infrastructure, operating and production costs; future prices of copper,
gold, zinc, silver and other minerals; resource estimates and variations of mineral grade or
recovery rates; metallurgical challenges; operating or technical difficulties in connection with
exploration; land acquisition; mining method, production profile and mine plan; other
development or mining activities, including the failure of plant, equipment or processes to
operate as anticipated; delays in exploration, development and construction activities; changes
in government legislation and regulation; the ability to maintain and renew existing licenses
and permits and the ability to obtain other required licences and permits in a timely manner or
at all; the ability to obtain financing on acceptable terms and in a timely manner or at all;
contests over title to properties; employee relations and shortages of skilled personnel and
contractors; the speculative nature of, and the risks involved in, the exploration, development
and mining business; and other factors and risks discussed in the Company’s AIF and MD&A.
The Company’s forward-looking statements are based on the beliefs, expectations and
opinions of management on the date the statements are made and the Company assumes no
obligation to update such forward-looking statements in the future, except as required by law.
For the reasons set forth above, investors should not place undue reliance on the Company’s
forward-looking statements.
Further information concerning risks and uncertainties associated with these forward-looking
statements and our business can be found in our AIF for the year ended December 31, 2016,
which is available on the Company’s website (www.nevsun.com), filed under our profile on
SEDAR (www.sedar.com) and on EDGAR (www.sec.gov) under cover of Form 40-F.
FORWARD LOOKING STATEMENT
This Presentation contains forward-looking statements or forward-looking information within
the meaning of the United States Private Securities Litigation Reform Act of 1995, and
applicable Canadian securities laws. All statements, other than statements of historical facts, are
forward looking statements including statements with respect to the Company’s continuing
and future operations in Eritrea, Serbia and elsewhere that the Company has operations or
business interests.
Forward-looking statements are frequently, but not always, identified by words such as
“expects”, “anticipates”, “believes”, “hopes”, “intends”, “estimated”, “potential”, “possible” and
similar expressions, or statements that events, conditions or results “will”, “may”, “could” or
“should” occur or be achieved. Forward-looking statements are statements concerning the
Company’s current beliefs, plans and expectations about the future, including but not limited
to statements and information made concerning: statements relating to the business, prospects
and future activities of, and development plans related to the Company, anticipated dividends,
goals, strategies, future growth, exploration activities, the adequacy of financial resources and
other events or conditions that may occur in the future.
These forward-looking statements are based on a number of assumptions which, while
considered reasonable by the Company, are subject to risks and uncertainties. In addition to
the assumptions contained herein, these assumptions include the assumptions described in the
Company’s Annual Information Form (“AIF”) and the Company’s management's discussion and
analysis for the year ended December 31, 2017 ("MD&A"). The Company cautions readers that
forward-looking statements involve and are subject to known and unknown risks, uncertainties
and other factors which may cause actual results, performance or achievements to differ
materially from those expressed in or implied by such forward-looking statements and forward-
looking statements are not guarantees of future results, performance or achievement.
THANK YOU
Please feel free to contact us! We’d love to hear from you.
Heather Taylor
604-623-4712 / [email protected]
Investor Relations
www.nevsun.com
@NevsunNSU
nevsun-resources
Follow us on: