Embed Size (px)
Citation preview
A HYBRID VIDEO RECOMMENDATION SYSTEM BASED ON A GRAPH-BASED ALGORITHM
A THESIS SUBMITTED TO THE GRADUATE SCHOOL OF NATURAL AND APPLIED SCIENCES
OF MIDDLE EAST TECHNICAL UNIVERSITY
BY
GİZEM ÖZTÜRK
IN PARTIAL FULFILLMENT OF THE REQUIREMENTS FOR
THE DEGREE OF MASTER OF SCIENCE IN
COMPUTER ENGINEERING
SEPTEMBER 2010

ii
Approval of the thesis:
A HYBRID VIDEO RECOMMENDATION SYSTEM BASED ON A GRAPH-BASED ALGORITHM
submitted by GİZEM ÖZTÜRK in partial fulfillment of the requirements for the degree of Master of Science in Computer Engineering Department, Middle East Technical University by,
Prof. Dr. Canan Özgen _____________________ Dean, Graduate School of Natural and Applied Sciences
Prof. Dr. Adnan Yazıcı _____________________ Head of Department, Computer Engineering
Assoc. Prof. Dr. Nihan Kesim Çiçekli ____________________ Supervisor, Computer Engineering Dept., METU
Examining Committee Members:
Prof. Dr. Mehmet R. Tolun _____________________ Computer Engineering Dept., Çankaya University
Assoc. Prof. Dr. Nihan Kesim Çiçekli _____________________ Computer Engineering Dept., METU
Assoc. Prof. Dr. Ferda Nur Alpaslan _____________________ Computer Engineering Dept., METU
Assoc. Prof. Dr. Ahmet Coşar _____________________ Computer Engineering Dept., METU
Dr. Ayşenur Birtürk _____________________ Computer Engineering Dept., METU
Date: 16.09.2010

iii
I hereby declare that all information in this document has been obtained and presented in accordance with academic rules and ethical conduct. I also declare that, as required by these rules and conduct, I have fully cited and referenced all material and results that are not original to this work.
Name, Last name: Gizem Öztürk
Signature :
iv
ABSTRACT
A HYBRID VIDEO RECOMMENDATION SYSTEM BASED ON A
GRAPH-BASED ALGORITHM
ÖZTÜRK, Gizem
M.S., Department of Computer Engineering
Supervisor: Assoc. Prof. Nihan KESİM ÇİÇEKLİ
September 2010, 76 pages
This thesis proposes the design, development and evaluation of a hybrid video
recommendation system. The proposed hybrid video recommendation system is based
on a graph algorithm called Adsorption. Adsorption is a collaborative filtering algorithm
in which relations between users are used to make recommendations. Adsorption is used
to generate the base recommendation list. In order to overcome the problems that occur
in pure collaborative system, content based filtering is injected. Content based filtering
uses the idea of suggesting similar items that matches user preferences. In order to use
content based filtering, first, the base recommendation list is updated by removing weak
recommendations. Following this, item similarities of the remaining list are calculated
and new items are inserted to form the final recommendations. Thus, collaborative
recommendations are empowered considering item similarities. Therefore, the
developed hybrid system combines both collaborative and content based approaches to
produce more effective suggestions.
Keywords: Recommendation systems, collaborative filtering, content based filtering,
graph based recommendation, information extraction
v
ÖZ
GRAFİK TABANLI B İR ALGOR İTMAYA DAYALI H İBRİT VİDEO
ÖNERİ SİSTEMİ
ÖZTÜRK, Gizem
Yüksek Lisans, Bilgisayar Mühendisliği Bölümü
Tez Yöneticisi: Doç. Dr. Nihan KESİM ÇİÇEKLİ
Eylül 2010, 76 sayfa
Bu tez, hibrit bir video öneri sisteminin tasarım, geliştirme ve değerlendirme bölümlerini
sunar. Sunulan hibrit video öneri sistemin temeli Adsorption adındaki bir grafik
algoritmasına dayanır. Adsorption, işbirlikçi filtrelemeye dayalı bir algoritmadır ve öneri
yapmak için kullanıcılar arasındaki benzerlikleri göz önünde bulundurur. Adsorption,
temel öneri listesini elde etmekte kullanılır. Sadece işbirlikçi filtrelemenin
kullanılmasıyla oluşan sorunları aşmak için içerik bazlı filtreleme de sisteme eklenir.
İçerik bazlı filtreleme, kullanıcının tercihlerine uyan benzer maddeleri önerir. İçerik
bazlı filtrelemeyi kullanabilmek için öncelikle temel öneri listesinden zayıf nesneler
çıkarılır. Bunun ardından, kalan nesnelerin önerilmeyen nesnelerle olan benzerlik
oranları hesaplanır ve yeni nesneler listeye eklenir. Böylece, işbirlikçi öneriler nesneler
arasındaki benzerliğe göre güçlendirilir. Buna bağlı olarak da geliştirilen sistem,
işbirlikçi ve içerik bazlı yaklaşımları birleştirerek daha verimli öneriler ortaya koyar.
Anahtar Kelimeler: Öneri sistemleri, işbirlikçi filtreleme, içerik bazlı filtreleme, grafik
tabanlı öneri, bilgi çıkarma
vi
To Emine Demirkan,
Rest in peace my dear grandmother …

vii
ACKNOWLEDGEMENTS
Firstly, I would like to express the deepest appreciation to Assoc. Prof. Dr. Nihan Kesim
Çiçekli for her guidance, support and encouragement throughout this study. It was really
a pleasure working with such a friendly, thoughtful, intellectual and insightful
supervisor.
I am deeply grateful to my mother Hale Öztürk and my father Gürhan Öztürk for their
endless love and concern. I also want to thank to my grandmother Melahat Öztürk and to
all my family members for encouraging me with their belief and love.
I would like to thank the Scientific and Technological Research Council of Turkey
(TÜBİTAK) for providing the financial means throughout this study.
I am deeply indebted to my friends, Hilal Karaman Cevahir, Gözde Özbal, Ertay Kaya
and Goncagül Demirdizen for their encouragement and sharing experiences not only
about their thesis studies but also with real life.
Finally, my special thanks go to my husband Ali Demir who has supported me in all
areas of my life and make my dreams come true by promising a life in which we can
walk together.
viii
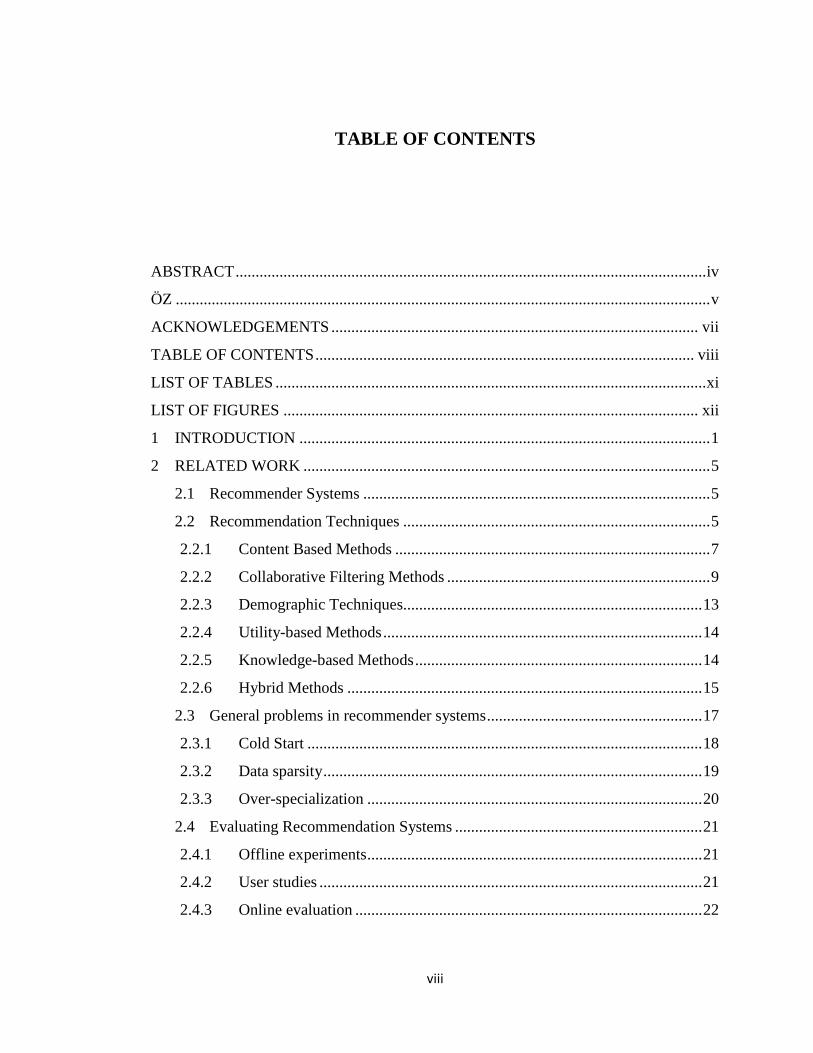
TABLE OF CONTENTS
ABSTRACT ...................................................................................................................... iv
ÖZ ...................................................................................................................................... v
ACKNOWLEDGEMENTS ............................................................................................ vii
TABLE OF CONTENTS ............................................................................................... viii
LIST OF TABLES ............................................................................................................ xi
LIST OF FIGURES ........................................................................................................ xii
1 INTRODUCTION ....................................................................................................... 1
2 RELATED WORK ...................................................................................................... 5
2.1 Recommender Systems ....................................................................................... 5
2.2 Recommendation Techniques ............................................................................. 5
2.2.1 Content Based Methods ............................................................................... 7
2.2.2 Collaborative Filtering Methods .................................................................. 9
2.2.3 Demographic Techniques........................................................................... 13
2.2.4 Utility-based Methods ................................................................................ 14
2.2.5 Knowledge-based Methods ........................................................................ 14
2.2.6 Hybrid Methods ......................................................................................... 15
2.3 General problems in recommender systems ...................................................... 17
2.3.1 Cold Start ................................................................................................... 18
2.3.2 Data sparsity ............................................................................................... 19
2.3.3 Over-specialization .................................................................................... 20
2.4 Evaluating Recommendation Systems .............................................................. 21
2.4.1 Offline experiments .................................................................................... 21
2.4.2 User studies ................................................................................................ 21
2.4.3 Online evaluation ....................................................................................... 22
ix
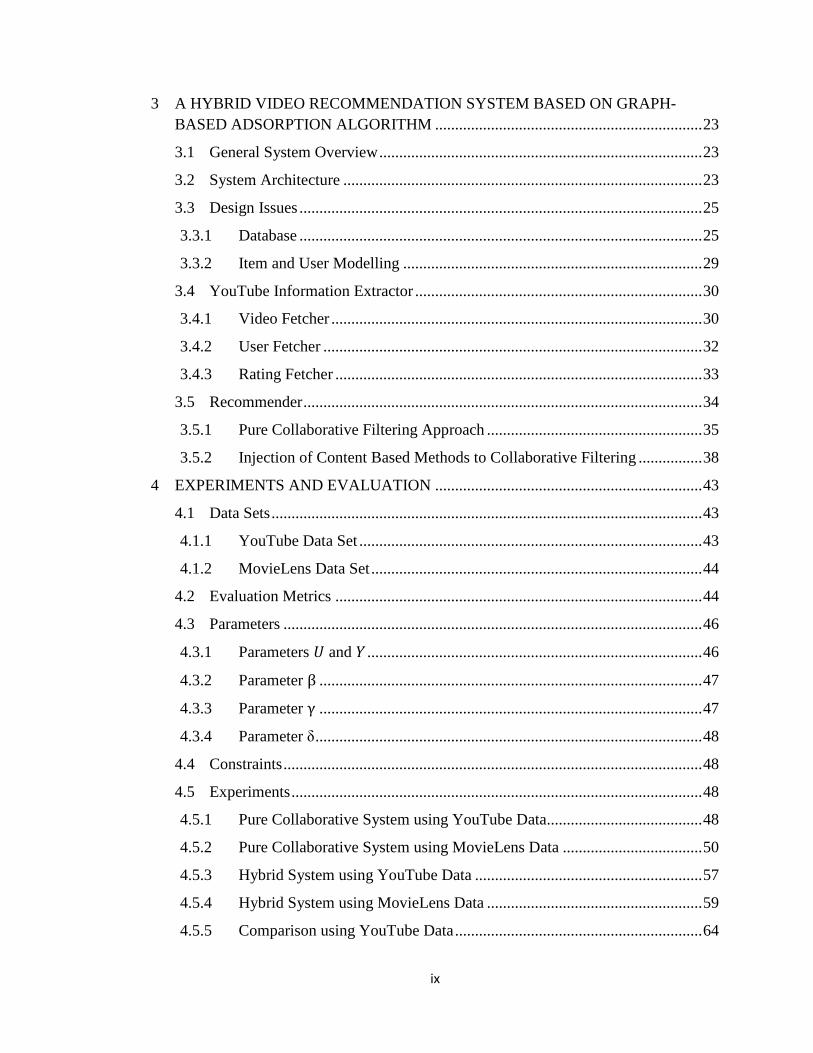
3 A HYBRID VIDEO RECOMMENDATION SYSTEM BASED ON GRAPH-BASED ADSORPTION ALGORITHM ................................................................... 23
3.1 General System Overview ................................................................................. 23
3.2 System Architecture .......................................................................................... 23
3.3 Design Issues ..................................................................................................... 25
3.3.1 Database ..................................................................................................... 25
3.3.2 Item and User Modelling ........................................................................... 29
3.4 YouTube Information Extractor ........................................................................ 30
3.4.1 Video Fetcher ............................................................................................. 30
3.4.2 User Fetcher ............................................................................................... 32
3.4.3 Rating Fetcher ............................................................................................ 33
3.5 Recommender .................................................................................................... 34
3.5.1 Pure Collaborative Filtering Approach ...................................................... 35
3.5.2 Injection of Content Based Methods to Collaborative Filtering ................ 38
4 EXPERIMENTS AND EVALUATION ................................................................... 43
4.1 Data Sets ............................................................................................................ 43
4.1.1 YouTube Data Set ...................................................................................... 43
4.1.2 MovieLens Data Set ................................................................................... 44
4.2 Evaluation Metrics ............................................................................................ 44
4.3 Parameters ......................................................................................................... 46
4.3.1 Parameters � and � .................................................................................... 46
4.3.2 Parameter β ................................................................................................ 47
4.3.3 Parameter γ ................................................................................................ 47
4.3.4 Parameter δ ................................................................................................. 48
4.4 Constraints ......................................................................................................... 48
4.5 Experiments ....................................................................................................... 48
4.5.1 Pure Collaborative System using YouTube Data....................................... 48
4.5.2 Pure Collaborative System using MovieLens Data ................................... 50
4.5.3 Hybrid System using YouTube Data ......................................................... 57
4.5.4 Hybrid System using MovieLens Data ...................................................... 59
4.5.5 Comparison using YouTube Data .............................................................. 64

x
4.5.6 Comparison using MovieLens Data ........................................................... 64
5 CONCLUSION AND FUTURE WORK .................................................................. 68
REFERENCES ................................................................................................................. 70
xi
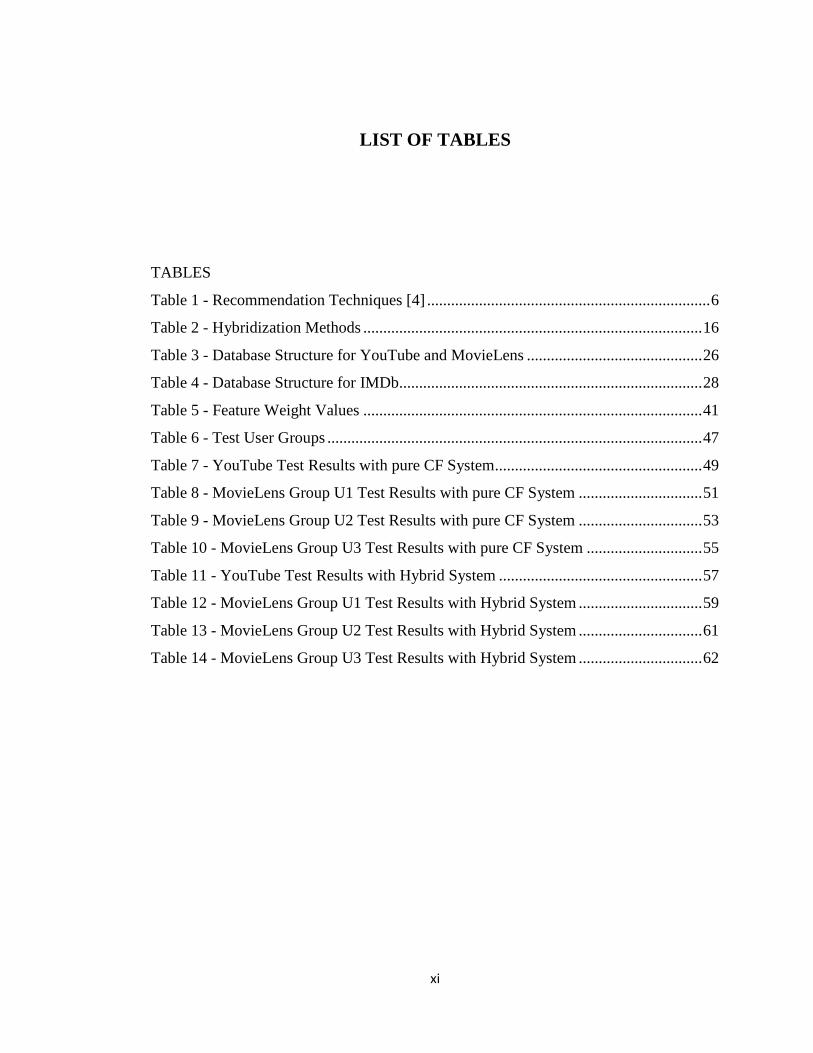
LIST OF TABLES
TABLES
Table 1 - Recommendation Techniques [4] ....................................................................... 6
Table 2 - Hybridization Methods ..................................................................................... 16
Table 3 - Database Structure for YouTube and MovieLens ............................................ 26
Table 4 - Database Structure for IMDb............................................................................ 28
Table 5 - Feature Weight Values ..................................................................................... 41
Table 6 - Test User Groups .............................................................................................. 47
Table 7 - YouTube Test Results with pure CF System .................................................... 49
Table 8 - MovieLens Group U1 Test Results with pure CF System ............................... 51
Table 9 - MovieLens Group U2 Test Results with pure CF System ............................... 53
Table 10 - MovieLens Group U3 Test Results with pure CF System ............................. 55
Table 11 - YouTube Test Results with Hybrid System ................................................... 57
Table 12 - MovieLens Group U1 Test Results with Hybrid System ............................... 59
Table 13 - MovieLens Group U2 Test Results with Hybrid System ............................... 61
Table 14 - MovieLens Group U3 Test Results with Hybrid System ............................... 62
xii
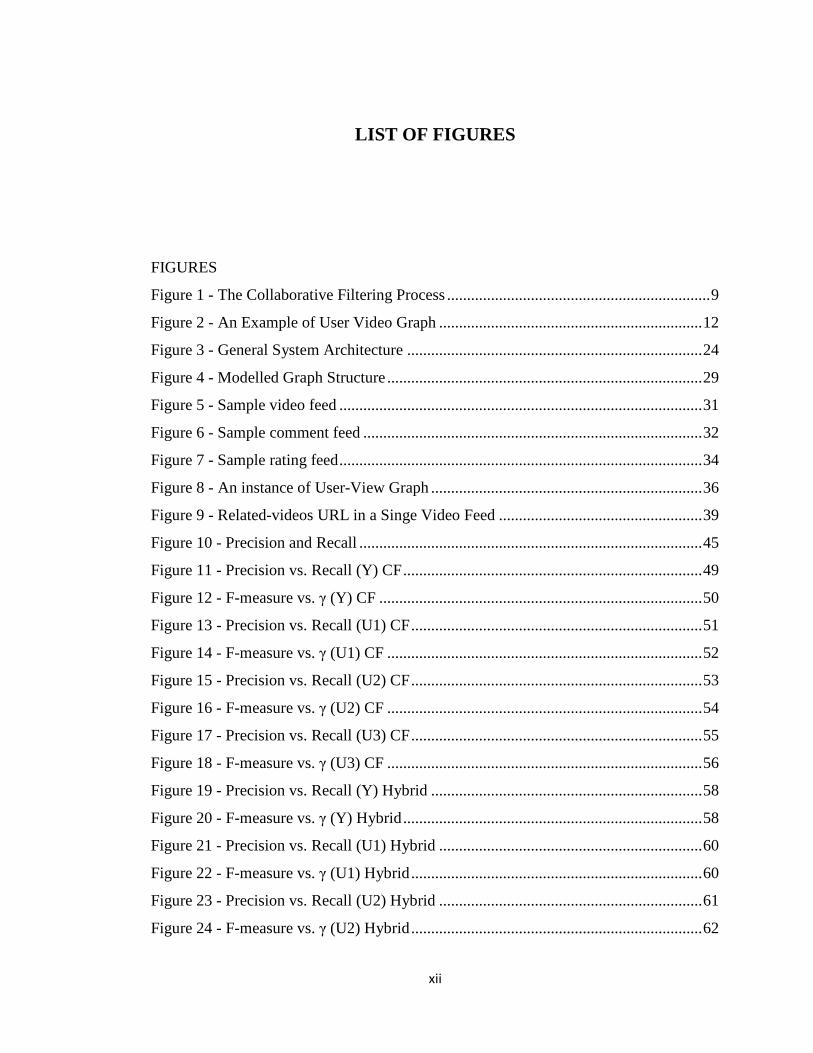
LIST OF FIGURES
FIGURES
Figure 1 - The Collaborative Filtering Process .................................................................. 9
Figure 2 - An Example of User Video Graph .................................................................. 12
Figure 3 - General System Architecture .......................................................................... 24
Figure 4 - Modelled Graph Structure ............................................................................... 29
Figure 5 - Sample video feed ........................................................................................... 31
Figure 6 - Sample comment feed ..................................................................................... 32
Figure 7 - Sample rating feed ........................................................................................... 34
Figure 8 - An instance of User-View Graph .................................................................... 36
Figure 9 - Related-videos URL in a Singe Video Feed ................................................... 39
Figure 10 - Precision and Recall ...................................................................................... 45
Figure 11 - Precision vs. Recall (Y) CF ........................................................................... 49
Figure 12 - F-measure vs. γ (Y) CF ................................................................................. 50
Figure 13 - Precision vs. Recall (U1) CF ......................................................................... 51
Figure 14 - F-measure vs. γ (U1) CF ............................................................................... 52
Figure 15 - Precision vs. Recall (U2) CF ......................................................................... 53
Figure 16 - F-measure vs. γ (U2) CF ............................................................................... 54
Figure 17 - Precision vs. Recall (U3) CF ......................................................................... 55
Figure 18 - F-measure vs. γ (U3) CF ............................................................................... 56
Figure 19 - Precision vs. Recall (Y) Hybrid .................................................................... 58
Figure 20 - F-measure vs. γ (Y) Hybrid ........................................................................... 58
Figure 21 - Precision vs. Recall (U1) Hybrid .................................................................. 60
Figure 22 - F-measure vs. γ (U1) Hybrid ......................................................................... 60
Figure 23 - Precision vs. Recall (U2) Hybrid .................................................................. 61
Figure 24 - F-measure vs. γ (U2) Hybrid ......................................................................... 62
xiii
Figure 25 - Precision vs. Recall (U3) Hybrid .................................................................. 63
Figure 26 - F-measure vs. γ (U3) Hybrid ......................................................................... 63
Figure 27 - F-measure vs. γ (Y) Comparison ................................................................... 64
Figure 28 - F-measure vs. γ (U1) Comparison ................................................................. 65
Figure 29 - F-measure vs. γ (U2) Comparison ................................................................. 66
Figure 30 - F-measure vs. γ (U3) Comparison ................................................................. 66
1
CHAPTER 1
INTRODUCTION
Internet has already become a part of our lives. There is no doubt that it is the easiest
way to reach data so people use Internet in their daily lives. However, the data on the
Internet is increasing continuously. Everyday a huge amount of information is uploaded
in many different topics so it becomes a difficult task for users to find out the
appropriate information available online.
Recommendation systems have arisen to provide convenient suggestions to the users.
These systems can be used for different purposes in several domains from offering
papers to researchers to helping consumers in e-commerce. There are recommendation
systems in different domains such as films, television programs, video, music, books,
news, images, web pages [1]. It can be said that, recommendation systems basically aim
to overcome the difficulty of finding proper information. Available systems try to help
their users to find the correct data they want. Among the most famous ones Amazon is
recommending books in book domain. Last.fm helps users to find the songs that they
want to listen. MovieLens tries to guide users to reach the movies they might like.
IMDb, which is also in movie domain, has a big information archive about movies.
The roots of research on recommendations systems extend to the mid-1990s when the
first papers about collaborative filtering are released [2]. As it is also important in
business considering especially e-commerce, both industry and academic world has
given a great importance to recommendation systems. Thus, a lot of research has been
2
done about recommendation systems. It is still a hot subject in terms of research because
current applications have deficiencies suggesting correct items to users.
Former research work was based on the idea of prediction of ratings only. In other
words, the problem seems to guess the rating of unrated items by users. Guessing ratings
for unseen items can be easily used for recommending new items to the users [2]. Later,
researches deals with more complex prediction approaches. Especially, with the
improvement of information technologies, recommender systems make use of
techniques such as information retrieval, user modelling and machine learning.
Recommender systems can be broadly divided into three categories according to the
approach they used to make recommendations. These are content-based
recommendation, collaborative recommendation and hybrid recommendation [43]. In
content-based recommendation, items are suggested according to their similarity to the
items the user selected before. In collaborative recommendation, items are suggested
according to the similarity between users with similar habits. Hybrid systems combine
these methods to obtain better performance.
Adsorption [27] is a collaborative filtering algorithm which is already applied to
YouTube successfully. In YouTube, there are millions of videos available and users can
state whether they like the video or not. Adsorption uses this rating information and tries
to reach unrated videos using a graph-based algorithm. The newly reached videos are
suggested to users as new recommendations.
In this thesis a hybrid system which uses both collaborative filtering and content based
approaches is proposed for recommending videos to users. By merging different
approaches, it is intended to give more powerful results than using pure methods
individually. In this thesis, Adsorption algorithm [27] is enriched by content based
approach to provide better suggestions. Besides using rating archives, video and movie
content information is also used to suggest new items which help to reinforce
recommendations.
3
In evaluating the proposed hybrid system two data sets have been used: YouTube and
MovieLens. The data crawled from YouTube dataset is highly sparse. MovieLens
provides a regular dataset containing users, movies and ratings, which make this dataset
more appropriate for adding the content based approach. The proposed algorithm is
tested on both datasets. The improvements in recommendations were more obvious on
the MovieLens data.
Adsorption algorithm [27] is among the new generation graph-based collaborative
filtering methods. This method is not used together with content-based recommendation
before. In this thesis, the results of Adsorption algorithm are improved by adding
content-based techniques to obtain more accurate suggestions. Beside videos in
YouTube, Adsorption algorithm is also applied to movie domain in MovieLens.
In summary, the main contribution of this thesis is improving the results of Adsorption
algorithm by injecting content-based similarities between videos for the purpose of
enhancing recommendations.
The rest of the thesis is organized in the following way:
Chapter 2 focuses on the related work about recommendation systems. A detailed
description of the recommendation systems is presented including types of
recommendation systems, and different approaches that are used in these systems. As
well as a formal classification, works that are already available in the literature are
addressed and explained according to the methods they utilize. While explaining
existing works, useful parts of these works are featured, deficiencies are also mentioned.
In Chapter 3, the main work that is done for the development of the hybrid
recommendation system is stated. The system architecture is presented and modules that
form the complete design are explained in detail. Approaches and algorithms which are
used in the system are discussed.

4
Chapter 4 is evaluation part in which experiments are involved. Tests that are
completed in order to determine the success of the developed system are stated and
results are declared.
Chapter 5 concludes the thesis with a brief discussion of the obtained system including
specific contributions. In addition, possible future work is stated.
5
CHAPTER 2
RELATED WORK
In this chapter general concepts and the terminology about recommendation systems
(RS) are presented. Different recommendation techniques are explained and algorithms
that are used to build RS are referred. Previous works are discussed considering the
techniques they are used.
2.1 Recommender Systems
With the increase of the Internet usage and the available huge data, recommendations
became a part of life [3]. No matter what the domain is, a huge amount of information is
online and it becomes a difficult task to select items that are necessary. Recommender
systems try to overcome this challenge and aim to map people with the correct items.
More formally, recommender systems can be defined as systems which generate
personal suggestions as an output or guide users individually to reach relevant and useful
items among a lot of possible options [4]. Recommender systems generally produce a set
of items which are aimed to take the attention of the current user in a high degree, so it
can be said that the recommender system is a mapping between users and items
involving a value of interest [63].
2.2 Recommendation Techniques
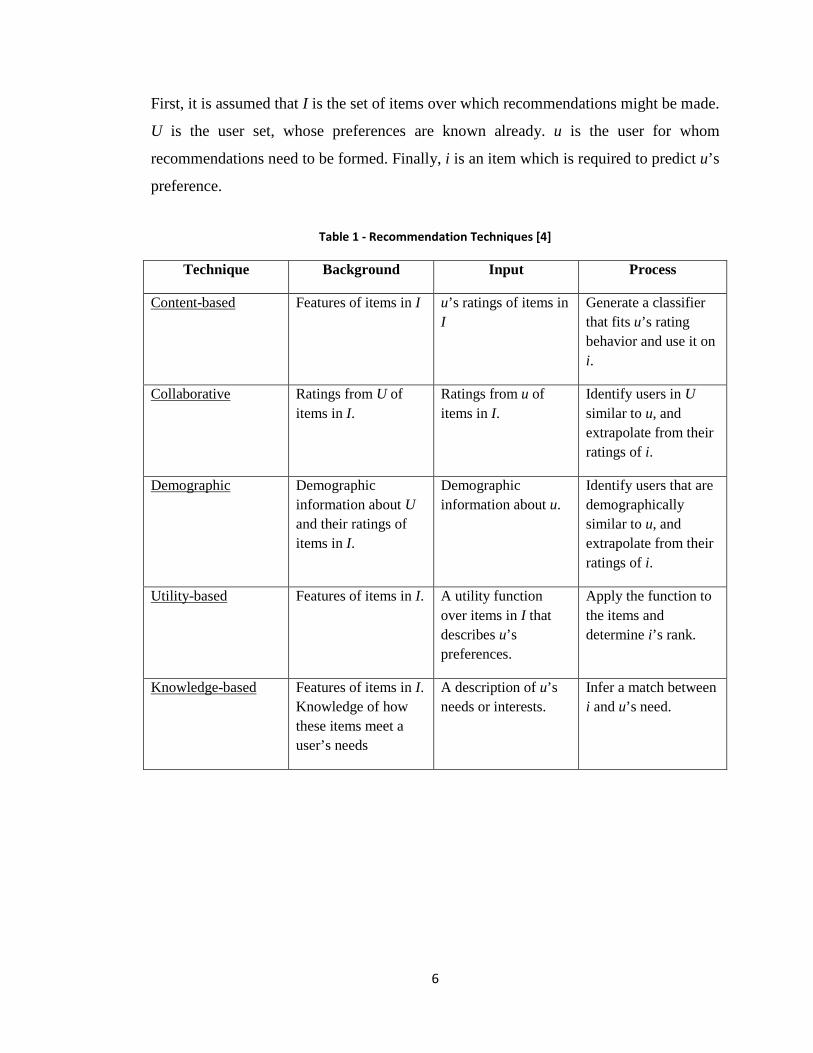
Recommendation techniques can be divided into five main approaches which are
summarized in Table 1. The following assumptions are made to construct the table:
6
First, it is assumed that I is the set of items over which recommendations might be made.
U is the user set, whose preferences are known already. u is the user for whom
recommendations need to be formed. Finally, i is an item which is required to predict u’s
preference.
Table 1 - Recommendation Techniques [4]
Technique Background Input Process
Content-based Features of items in I u’s ratings of items in I
Generate a classifier that fits u’s rating behavior and use it on i.
Collaborative Ratings from U of items in I.
Ratings from u of items in I.
Identify users in U similar to u, and extrapolate from their ratings of i.
Demographic Demographic information about U and their ratings of items in I.
Demographic information about u.
Identify users that are demographically similar to u, and extrapolate from their ratings of i.
Utility-based Features of items in I. A utility function over items in I that describes u’s preferences.
Apply the function to the items and determine i’s rank.
Knowledge-based Features of items in I. Knowledge of how these items meet a user’s needs
A description of u’s needs or interests.
Infer a match between i and u’s need.
7
2.2.1 Content Based Methods
Content based recommendation systems suggest items based on the correlation between
the content of the item and user’s preferences [5]. They try to suggest items that are
similar to the items which are preferred by the user in the past [6].
A content based recommendation system needs user feedback to learn the preferences of
the user. Generally, user profiles are constructed in order to represent user choices. The
information that is necessary for constructing the user profile can be obtained in two
ways. They are implicit and explicit feedbacks [7]:
Explicit feedback: The user provides data willingly. Generally, users are forced to fill
forms at the beginning of a sign up process. In these forms basic demographic
information such as age, gender, education, occupation, location or user interests, is
requested. The user can state interests as “I like action films” or “I don’t like horror
films”. As another option, feedback can be obtained by collecting ratings that are
assigned to the items. However, since this technique depends on asking the user to spend
time on the system, users might be bothered of this process.
Implicit feedback: The user is not aware of the fact that he/she is providing feedback.
This type of feedback can be gathered by monitoring the user activity. For instance, in
video domain, a system can keep the list of watched movies or even better, it can be
thought that if a user u, watches more than half of a video v, it can be considered as “u
likes v”. In this type, users are not disturbed, but the gathered results might not be as
relevant as the results that are collected from explicit feedback.
Early systems start with text-filtering. For instance, a tool called SIFT (The Stanford
Information Filtering Tool) is proposed in [59]. In SIFT users are subscribed to the
system and they construct a profile by stating the words to favour or block [60]. Profiles
can be changed manually by users. For each profile 20 articles are retrieved daily. In
[59], it is stated that SIFT usage is increased to 1400 subscriptions in a month and there
is a considerable amount of positive user-feedback.
8
PURE [8] is an article recommendation system which is based on content-based
recommendation. The system is tested using PubMed [9] database which is one of the
biggest databases about biological and medical sciences. The obtained results show that
the system is useful for users to find articles that are appropriate with the user’s
preference.
Machine learning and information retrieval algorithms are used in order to specify user
favorites and create user profiles. Generally, vector space models (VSM) are used in
order to characterize user and item profiles [10]. PRES (Personalized Recommender
System) [5] is another content-based filtering system which recommends articles related
to home improvements. System promises learning with the use of feedback from user.
To accomplish learning, relevance feedback [11] method by Rocchio is used which
works in the vector space model.
The advantage of content-based methods is that, implicit feedback is enough to construct
such a system. Beside this, the database grows with ratings providing the improvement
of system performance in time. However, this fact is a clue of a bottleneck which occurs
at the early steps of the system because there must be sufficient number of ratings in
order to obtain a reliable system.
In this thesis, recommendations are firstly done using collaborative filtering (CF). As a
result of CF, a recommendation list is obtained. Then, selected items in this list are
compared with other items which are not in the list. This comparison is done according
to item contents, and new items are suggested as well. So, recommendations are
extended using CB filtering methods. Therefore, benefits of content-based approach are
obtained.
9
2.2.2 Collaborative Filtering Methods
In collaborative filtering, the basic idea is “similar users have similar preferences” [12].
Or it can be said that, to find the correct suggestions for the current user, other users that
are similar to the current user are figured out by observing their choices. By using this
information, the preference of the current user can be guessed for specific items and a
list of items can be constructed which includes the items that the active user might
prefer.
Collaborative filtering can be divided into two as prediction and recommendation [13].
Collaborative prediction is the task of predicting user preferences for items, using
currently available preferences, and the relation with the preferences’ of other users.
Collaborative recommendation is developing a set of items which the active user might
like most.
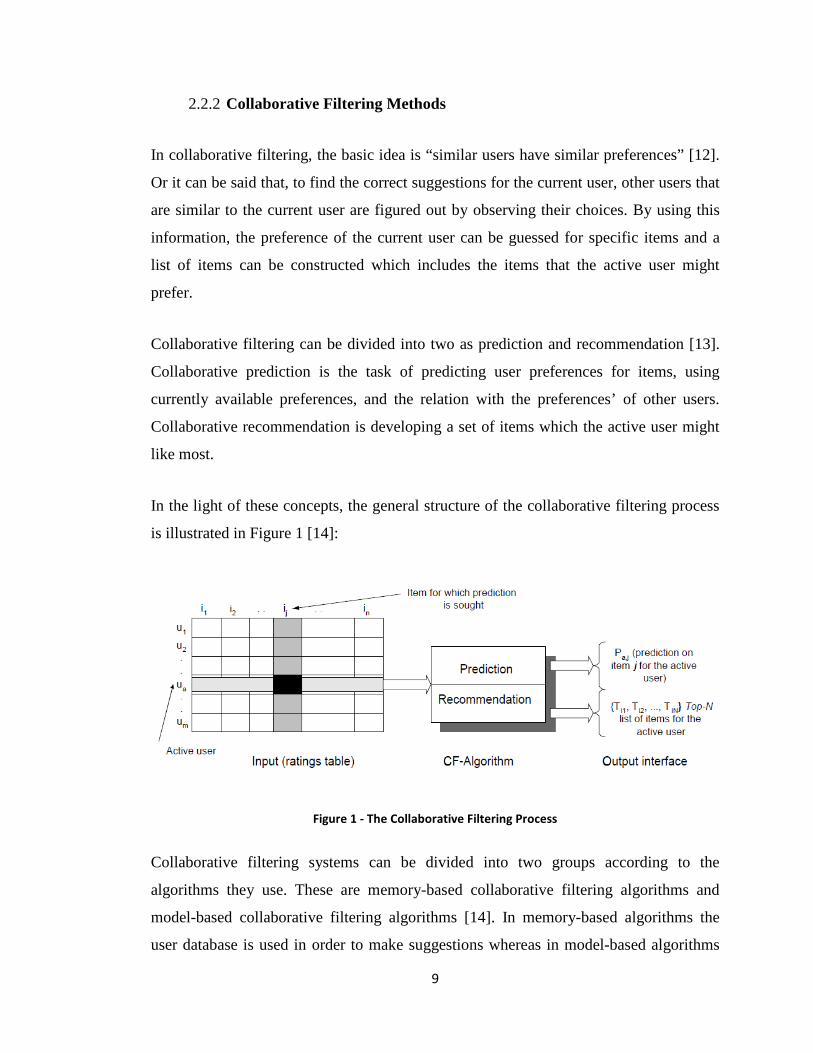
In the light of these concepts, the general structure of the collaborative filtering process
is illustrated in Figure 1 [14]:
Figure 1 - The Collaborative Filtering Process
Collaborative filtering systems can be divided into two groups according to the
algorithms they use. These are memory-based collaborative filtering algorithms and
model-based collaborative filtering algorithms [14]. In memory-based algorithms the
user database is used in order to make suggestions whereas in model-based algorithms
10
the user database is used in a preparation process to learn a model, later this model is
used to make suggestions [13].
At the early steps collaborating filtering systems are categorized into two separate
models which are pull-active collaborative filtering and push active collaborative
filtering [15]. In pull-active systems such as Tapestry [16], the responsible party is the
user to request recommendations from the database. In push-active systems the user
pushes the item to a specific group of users, and makes suggestions to them. An example
of push-active systems is presented in [17] which is used to recommend a document to
the related people in the company. Automated collaborative filtering (ACF) systems
save users from making choices.
In [61] collaborative filtering techniques are applied in order to obtain accurate results in
movie search. More specifically collaborative filtering algorithms are used to compute
personalized item authorities in search [61]. A prototype movie search engine called
MAD6 (Movies, Actors, and Directors with 6 degrees of separation) is proposed. In the
system besides collaborative filtering information retrieval techniques are also used in
order to obtain relevant suggestions. The system is evaluated using online and offline
experiments. According to test results, it is stated that both for online and offline
experiments proposed collaborative system works better than IMDb and Yahoo! Movies
search.
GroupLens [18][19] (newsgroup articles domain), Ringo [20] (music domain) and Video
Recommender [21] (movie domain) are among the examples of ACF [22]. Amazon.com
is also a famous recommender in which the recommendation system uses item-based
collaborative filtering approach [23]. Other successful implementations of collaborative-
based systems are MovieFinder.com and CDNow.com which is later purchased by
Amazon.com [24].
MovieLens [25] is one of the most popular movie recommendation systems, which uses
collaborative filtering. For the watched items a MovieLens user give ratings from 1 to 5
(1 means “Awful” and 5 for “Must See”). If there is no rating on a movie, the system
11
assumes that movie has not been watched yet. Then, ratings of all users are used to
suggest unwatched movies to the current user [15].
The problem with the MovieLens is that the system requests information from the user.
When a new user joins, he/she should read the list of several movies and give ratings
among the ones which are watched before. This operation is very time consuming
because MovieLens expects at least 15 ratings to produce coherent recommendations.
At the beginning, the user should spare time to fill these forms which is not much
desired by many users.
Graph-based approaches are popular for developing collaborative filtering systems. A
graph based recommendation algorithm is proposed in [67]. Nodes of the graph are
formed by users and edges of the graph are formed by similarity ratios between users.
Recommendations are done by traversing the nodes which also enables catching
transitive relations [68]. Experiments show that the described algorithm performs
successfully on test data.
In [27] a collaborative approach is used which is developed for recommending videos in
YouTube [28]. In the system, a graph based semi-supervised [26][29], [30] algorithm
called “Adsorption” is proposed. It is actually stated as an algorithmic framework which
is appropriate for the systems where the set of labelled items is very small but the
number of unlabelled items is larger. So, Adsorption algorithm is used when there are
both labelled and unlabeled items in the graph and the aim is to set labels to all unknown
nodes.
It is stated that there are several ways of classifying labels in a graph [27]. Some of the
most well known of these approached are: nearest neighbour, shortest distance, commute
time or electrical resistance [27]. But most of these touches are very time consuming and
they are not able to end up in a reasonable time especially in a spread and huge graph
structure. Commute distance is more sensible than others but it is also too expensive and
generally do not allow improvements. To overcome these difficulties User-Video graph
12
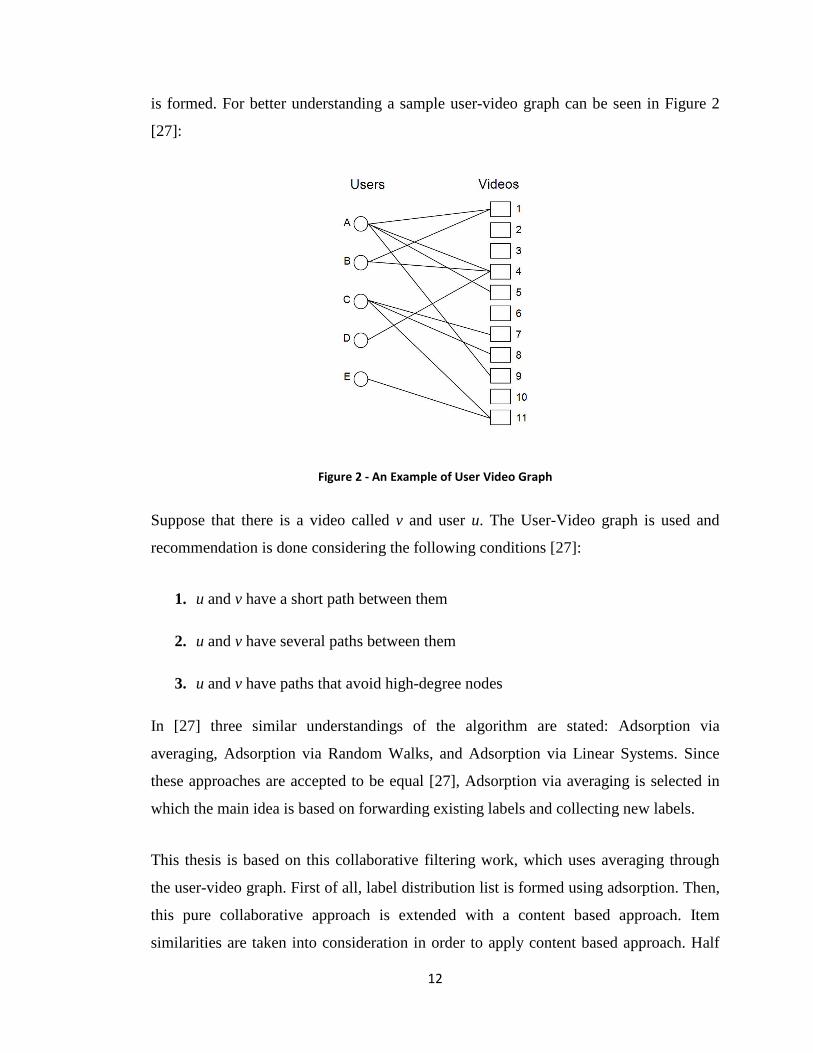
is formed. For better understanding a sample user-video graph can be seen in Figure 2
[27]:
Figure 2 - An Example of User Video Graph
Suppose that there is a video called v and user u. The User-Video graph is used and
recommendation is done considering the following conditions [27]:
1. u and v have a short path between them
2. u and v have several paths between them
3. u and v have paths that avoid high-degree nodes
In [27] three similar understandings of the algorithm are stated: Adsorption via
averaging, Adsorption via Random Walks, and Adsorption via Linear Systems. Since
these approaches are accepted to be equal [27], Adsorption via averaging is selected in
which the main idea is based on forwarding existing labels and collecting new labels.
This thesis is based on this collaborative filtering work, which uses averaging through
the user-video graph. First of all, label distribution list is formed using adsorption. Then,
this pure collaborative approach is extended with a content based approach. Item
similarities are taken into consideration in order to apply content based approach. Half
13
of the distribution list is kept and other items are removed in order to make space. New
items are obtained by calculating item similarities and these items are inserted to the
empty places. So, a new distribution list is produced. This list is used as the
recommendation list in order to obtain more accurate results.
2.2.3 Demographic Techniques
Demographic information such as country, age, gender, education can be used in order
to cluster users. Demographic information of a user is compared with existing clusters.
The most relevant cluster is found for the user. Also, items are separated and weighted
according to their characteristics. These classes are compared and finally, items in the
most matching cluster are recommended for user.
Generating clusters is the key issue when using demographic filtering. For this reason,
Krulwich [31] builds the approach of demographic generalization and used this concept
in Lifestyle Finder. With demographic generalization, user profiles are constructed by
taking the advantage of a large-scale database of demographic data. In Lifestyle Finder,
this approach is tested and results show that the demographic filtering is useful to create
user profiles.
Privacy is one of the most important issues in demographic filtering. In [32], this issue is
addressed. The system proposes ALAMBIC a system for e-commerce and promises to
satisfy the necessities of privacy using demographic filtering. ALAMBIC suggests a
system in which recommendations are based on feedback of users with similar
demographic information.
Generally, demographic filtering techniques are combined with other recommendation
methods. For instance, in [33] collaborative filtering is combined with demographic data
for automatic music recommendation and satisfying results are obtained.
The advantage of these kinds of systems is recommendations can be done independent
of the user history (ratings, favourites etc.) However it might be difficult to obtain
14
demographic information. This data might be retrieved from users directly. IP addresses
can also be used but only limited data such as country / city can be obtained. For these
reasons demographic filtering techniques cannot be applied to systems in which
anonymous user concept exists [34].
2.2.4 Utility-based Methods
Utility-based recommendation methods try to model a user’s multi-attribute utility
function and recommend items with highest utilities based on this function [10]. So,
utility-based methods guess the importance of the items for each user and do
recommendations based on the user preferences.
RBFN (radial basis function networks) and SMARTER (Simple Multi-Attribute Rating
Technique Exploiting Ranks) are two utility-based methods. In [10] these methods are
compared with classical content-based vector-space model method. The comparison is
done in terms of recommendation accuracy, time expense, and user perceptions in the
contexts of recommending different types of items. According to the results item type
has an effect on the recommendation accuracy and time expense. Vector-space model
method is more appropriate if the items have nominal attributes. SMARTER should be
preferred if items have numerical attributes. Finally, RBFN gives reasonable results
independent of the item type.
Utility-based methods do not need statics in order to do suggestions, so new item and
new user problems do not affect the results of these systems. The drawbacks of utility-
based methods are: system does not come up to new facts, and a utility function must be
provided.
2.2.5 Knowledge-based Methods
In a knowledge-based system, there are three types of knowledge [4]. These are
catalogue knowledge, functional knowledge and user knowledge. First of all in
catalogue knowledge, the items and their features should be known clearly. Considering
15
a web-based car recommendation system, the system must know that “Symbol” is also a
member of “Renault” which is also a “French” made car. In functional knowledge the
system should be able to match the correct items according to the user needs. If a house
searching system is considered; when the user enters the keywords “calm” the system
should fetch houses such as “not in city centre”, “a detached house not an apartment”,
“riverside”, or “around trees”. Finally, in user knowledge, the system needs to know
about the user, which is generally the demographic information about the user.
In [35] systems using KB methods are reviewed. One is Entree which is a restaurant
recommender. Another one Recommender.com is a web site which provides movie
research.
The good point with KB systems is they do not suffer from cold-start problems.
Because, the necessary information should already be known and new data is not
constructed later on.
The bottleneck of the Knowledge-based recommender systems is that, they suffer from
all situations in which there is lack of information. Therefore, in order to obtain required
data, a detailed knowledge mining should be done, but since this is a very expensive
process, it is generally not preferred. As another disadvantage, KB recommender
systems can make suggestions only with the information that is given. KB systems
cannot come up with new information as a collaborative system does.
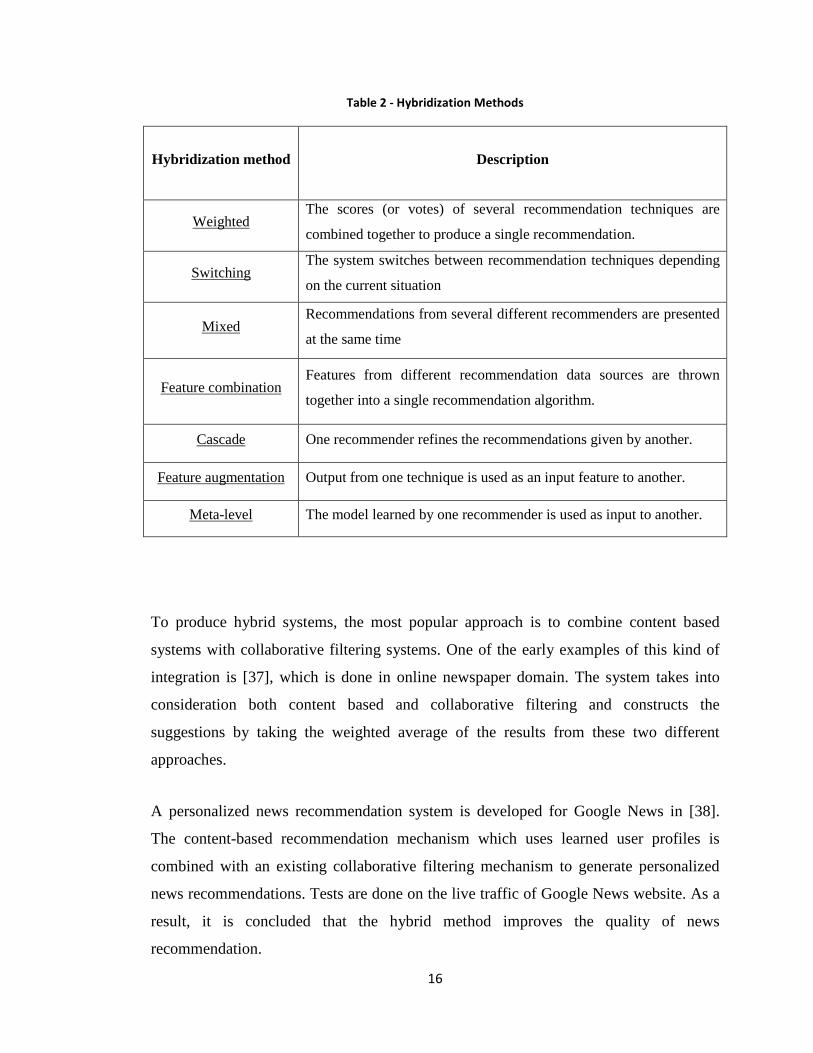
2.2.6 Hybrid Methods
Each type of recommendation techniques has its own strengths and weaknesses. The
disadvantages of pure systems can be overcome by combining different techniques [36].
Hybrid methods produce recommendation systems in which at least two of the existing
techniques are used. The aim is to take benefits of all techniques and obtain more
relevant suggestions.
In [4], some of the blending methods are discussed. They are summarized in Table 2.
16
Table 2 - Hybridization Methods
Hybridization method Description
Weighted The scores (or votes) of several recommendation techniques are
combined together to produce a single recommendation.
Switching The system switches between recommendation techniques depending
on the current situation
Mixed Recommendations from several different recommenders are presented
at the same time
Feature combination Features from different recommendation data sources are thrown
together into a single recommendation algorithm.
Cascade One recommender refines the recommendations given by another.
Feature augmentation Output from one technique is used as an input feature to another.
Meta-level The model learned by one recommender is used as input to another.
To produce hybrid systems, the most popular approach is to combine content based
systems with collaborative filtering systems. One of the early examples of this kind of
integration is [37], which is done in online newspaper domain. The system takes into
consideration both content based and collaborative filtering and constructs the
suggestions by taking the weighted average of the results from these two different
approaches.
A personalized news recommendation system is developed for Google News in [38].
The content-based recommendation mechanism which uses learned user profiles is
combined with an existing collaborative filtering mechanism to generate personalized
news recommendations. Tests are done on the live traffic of Google News website. As a
result, it is concluded that the hybrid method improves the quality of news
recommendation.
17
System in [62], works for movie domain. A hybrid system is described in which a
content-boosted collaborative filtering approach is followed. In the system, existing
user-rating vector is very sparse. First of all, content based predictor is applied to the
user-rating vector. The resulting pseudo user-ratings vector contains both real user
ratings and predicted ratings for unrated items. Then the obtained vectors are combined
to form a user-rating matrix. The constructed matrix is passed to the collaborative
filtering system. Collaborative filtering outputs final recommendations. It is reported
that the hybrid system gives better results than using pure content based or pure
collaborative systems.
In [66], a graph based model is developed for building e-commerce recommender
systems. A two-layer graph model is presented in which the nodes represent products
and customers accordingly. Edges between customers represent similarity between
customers whereas edges between products represent product similarity. On the other
hand, links between two layers demonstrate purchase history. A generic data
representation is provided and this proposed model can be used with different
recommendation techniques which are content-based, collaborative and hybrid
recommendations. Content-based approach is used by activating only product
information. To apply collaborative approach, customer-layer and inter-layer links are
used. Finally, all edges are activated in order to obtain the hybrid approach. Evaluation
results show that the hybrid method performs better than both collaborative and content-
based methods.
In this thesis, advantages of both collaborative filtering and content based methods are
used. Recommendations obtained by collaborative filtering are enhanced using content
based methods. Therefore, this work represents a hybrid recommendation system using
cascade hybridization method.
2.3 General problems in recommender systems
In recommender systems, different problems can occur, depending on the techniques
that are used. These can be summarized as the following:
18
2.3.1 Cold Start
Recommender systems might suffer from cold start problem [39]. These systems use
collected information to make reasonable recommendations. There are situations in
which there is lack of required data and a recommender system suffers in these
situations. These problems can be gathered into three groups which are new user, new
item and new system.
New user: When a new user signs up to a recommendation system, there is only little
information about that user. So, it is very difficult for the system to produce realistic
recommendations.
Both collaborative filtering and content based filtering techniques suffer from the new
user – cold start problem. In order to build the user profile and produce coherent results,
there should be enough user feedback, which is generally the ratings that are given to the
items [2].
New item: This problem is seen when there is a newly added item to the system. In this
situation, there is not enough feedback that is provided for that item by users.
Especially collaborative filtering techniques suffer from this problem. Because in
collaborative filtering recommendations are based on the previously given ratings to the
items by other users. Therefore when a new an item is added there is no data about that
item. Considering movie domain, when a new movie is added to the recommendation
system, there is no rating that is given to that movie. So, until a sufficient number of
ratings are given to that item by users, the new item is not recommended by the system
[2].
New system: New system problem is the synthesis of the new user and new item
problems which occurs clearly when a systems has just been constructed.
19
In [40], cold start problem is addressed. Cold-start problem is splitted as: user side and
item side. The work concentrates on user side in which there is a new user who does not
have any preferences over the existing items. Therefore a hybrid model is constructed
which is based on the analysis of two probabilistic aspect models using pure
collaborative filtering to combine with the users’ data. MovieLens data set is used to test
the system. According to the results, it is found out that this model helps to solve the
user-side cold-start problem to some extent.
2.3.2 Data sparsity
Data sparsity plays an important role in recommendation systems. In [12], data sparsity
problem is addressed in collaborative filtering. In the work, it is concluded that the
sparsity of the data directly affects the obtained results of collaborative filtering
recommendation systems.
Considering movie domain, there may be a lot of movies that are rated by few people.
Even if the users, who rate the movie, give high ratings, this kind of movies would not
be recommended very often [2].
Systems such as [41] try to eliminate the data sparsity problem. In [41], a method is
suggested to enhance similarity matrices under sparse data as well. The evaluation is
done using Movie-Lens data. Experiments are done using different sparsity levels.
Results show that the proposed Random Walk Recommender algorithm outperforms two
other item-oriented methods in different sparsity levels, especially giving best results
when the data is sparse.
In this thesis, primary approach is using YouTube data. YouTube has a big database but,
it does not share its dataset with public. So, YouTube data is formed by crawling and
due to this reason, it is very scattered. For each person, the number of seen movies and
ratings are very low and this makes it difficult to work with this data. Because of the
high sparsity of YouTube data, one of the regular dataset alternatives MovieLens is also
20
used. In MovieLens dataset, each user has at least 20 ratings and this makes the dataset
more uniform than YouTube dataset.
2.3.3 Over-specialization
In content-based filtering, the system aims to suggest items that are highly matching
with the user profile. This causes a user to face with similar recommendations
continuously that are already rated, not different ones that the user might like [42]. This
problem is called over-specialization and pure content-based filtering systems often
experience this problem [43].
This problem can be solved with inserted randomness in a degree. In [44], it has been
proposed that the use of a genetic algorithm can be a solution in terms of information
filtering. Beside this, Outside-The-Box (OTB) recommendation [45] proves that taking
some risks are helpful to overcome over-specialization problem.
There are several other methods trying to overcome this problem. For instance CHIP
(Cultural Heritage Information Personalization) is a CB recommender system which
uses semantic relations, claiming that the usage of semantic relations can partially solve
the over-specialization problem by providing additional information and retrieving new
concepts [46][47].
As over-specialization problem is related with content-based filtering, collaborative
filtering techniques can be used in order to eliminate the problem. However, [48] deals
with over-specialization problem by presenting a personalization strategy without
making use of collaborative filtering approaches. In the system a different reasoning
mechanism is used which offers semantically related items, instead of using semantic
approaches and finally, the obtained system is used for recommending TV-programs.
21
2.4 Evaluating Recommendation Systems
After building the recommendation system, the next step is making tests on the system
in order to prove its usefulness. Because there are several different methods to evaluate a
recommender system, the system designers must decide on a proper approach that will
be employed to the system [49]. Selecting proper algorithms is a key issue in order to
construct successful systems.
The evaluation of recommender systems can be divided into three main parts which are
offline experiments, user studies, and online evaluation.
2.4.1 Offline experiments
Offline experiments are performed using the data that is already available. This data set
is generally the ratings that are collected from users. In these methods, it is aimed to
simulate the interaction of users to the system [49]. Since offline experiments do not
interact directly with the user, the evaluation can be done using different techniques just
with a little cost.
In this thesis, data that simulates the user behavior is collected so offline experiments fit
very well for the needs. Especially considering the timing issues, offline experiments are
used to evaluate the system behavior.
2.4.2 User studies
User studies are generally performed by asking users to interact with the system. During
this period user behaviors are monitored and recorded. The goal is to collect quantitative
measurements [49]. In most of the cases users are asked to fill questionnaires, before,
during and at the end of the task.
22
2.4.3 Online evaluation
This kind of experiments collect more accurate results than other techniques as they
measure the system behavior in reality. Measurements are done while the system is
running. However, there is a risk that unexpected results might occur and this might
cause the system even crash [49]. Therefore, before applying online evaluation, basic
tests should be done in offline environment to provide safety.
23
CHAPTER 3
A HYBRID VIDEO RECOMMENDATION SYSTEM BASED ON
GRAPH-BASED ADSORPTION ALGORITHM
3.1 General System Overview
The hybrid recommendation system that is developed in this thesis is an application
which aims to select appropriate videos or movies for users.
The developed recommendation system can be used both for YouTube and MovieLens.
Recommendations are done according to both collaborative and contend based features.
First, ratings are guessed according to collaborative relations. Then, content based
features are injected to provide a hybrid system.
3.2 System Architecture
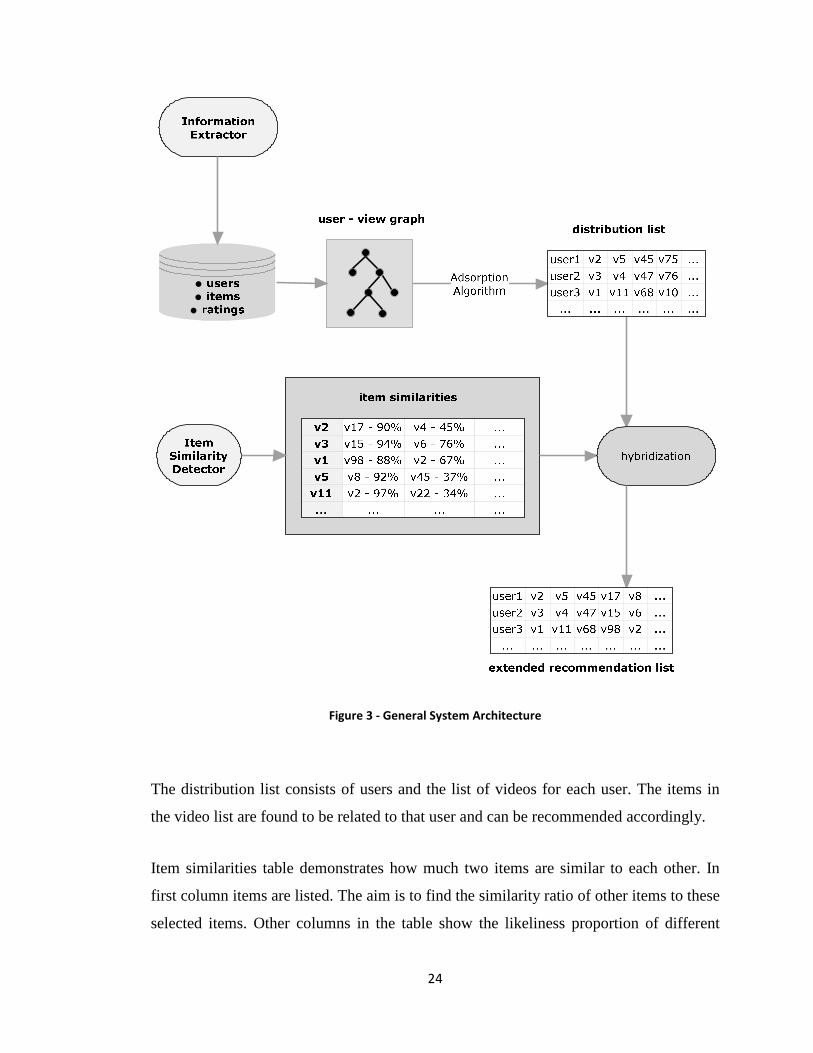
The generated hybrid recommendation system consists of different modules. Each
module is developed for a specific task. The general system architecture is presented in
Figure 3.
24
Figure 3 - General System Architecture
The distribution list consists of users and the list of videos for each user. The items in
the video list are found to be related to that user and can be recommended accordingly.
Item similarities table demonstrates how much two items are similar to each other. In
first column items are listed. The aim is to find the similarity ratio of other items to these
selected items. Other columns in the table show the likeliness proportion of different
25
items. For instance, the similarity between v2 and v17 is 90%, v2 and v4 is 45%, v3 and
v15 is 94%, etc.
3.3 Design Issues
The designed recommender system is able to work with two different databases. The
first one is YouTube database, the second one is MovieLens database. Besides in order
to insert content based techniques IMDb database is also used together with the
MovieLens dataset.
3.3.1 Database
MySQL [50] which is one of the most popular open-source databases is used during the
development of the recommendation system. Java Persistence Architecture API (JPA)
[51] is used in the design of the system. JPA is a Java specification which enables
accessing, persisting and managing data between Java objects / classes and a relational
database. Currently, JPA is admitted to be a standard for Object-Relational Mapping
(ORM).
JPA cannot make any actions by itself as it is just a set of interfaces. So, it needs
implementation. Recently, there are implementations of JPA and in this work Hibernate
is used. Hibernate is an open-source implementation of JPA. So by the help of JPA and
Hibernate a Java class is mapped to the relational database table. So, the user does not
have to think about neither table structures nor joining tables.
In JPA, there is an EntityManager API. This API provides processing queries and
transactions on the objects against the database. Beside this, there is also an object level
query language, JPQL [52]. JPQL is used for querying objects in the database. These
recent technologies simplify database modelling and shorten queries that are needed to
reach database items.
26
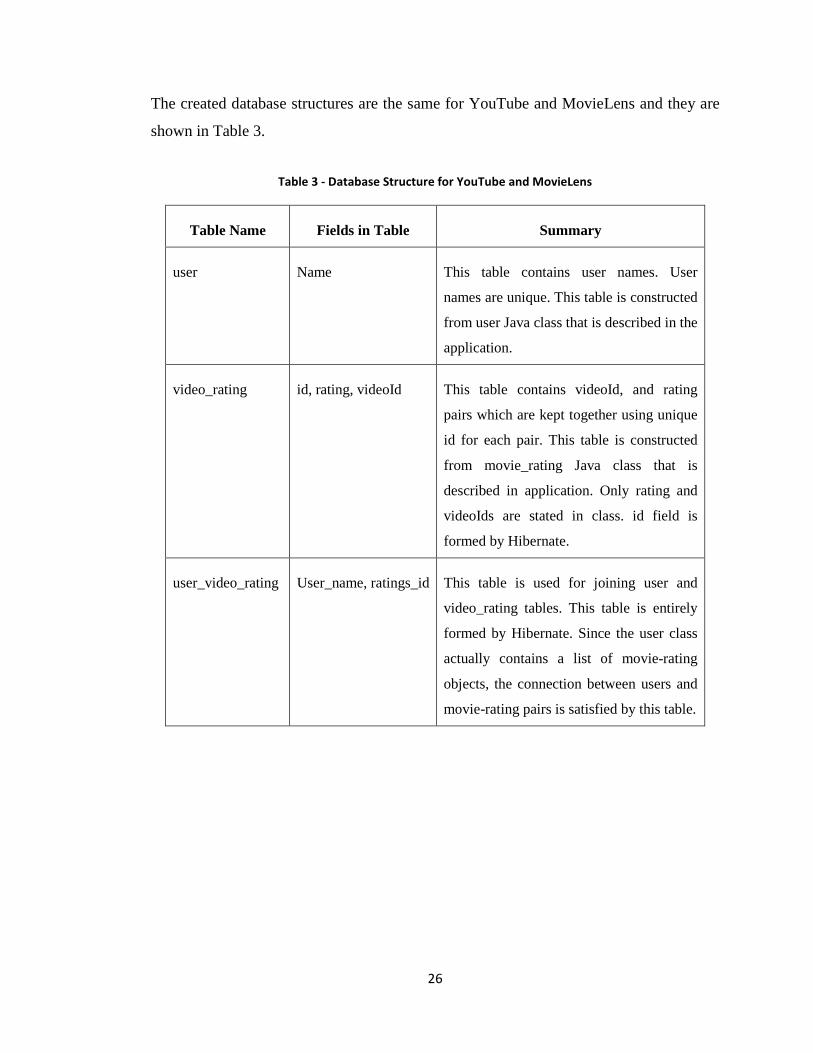
The created database structures are the same for YouTube and MovieLens and they are
shown in Table 3.
Table 3 - Database Structure for YouTube and MovieLens
Table Name Fields in Table Summary
user Name This table contains user names. User
names are unique. This table is constructed
from user Java class that is described in the
application.
video_rating id, rating, videoId This table contains videoId, and rating
pairs which are kept together using unique
id for each pair. This table is constructed
from movie_rating Java class that is
described in application. Only rating and
videoIds are stated in class. id field is
formed by Hibernate.
user_video_rating User_name, ratings_id This table is used for joining user and
video_rating tables. This table is entirely
formed by Hibernate. Since the user class
actually contains a list of movie-rating
objects, the connection between users and
movie-rating pairs is satisfied by this table.
27
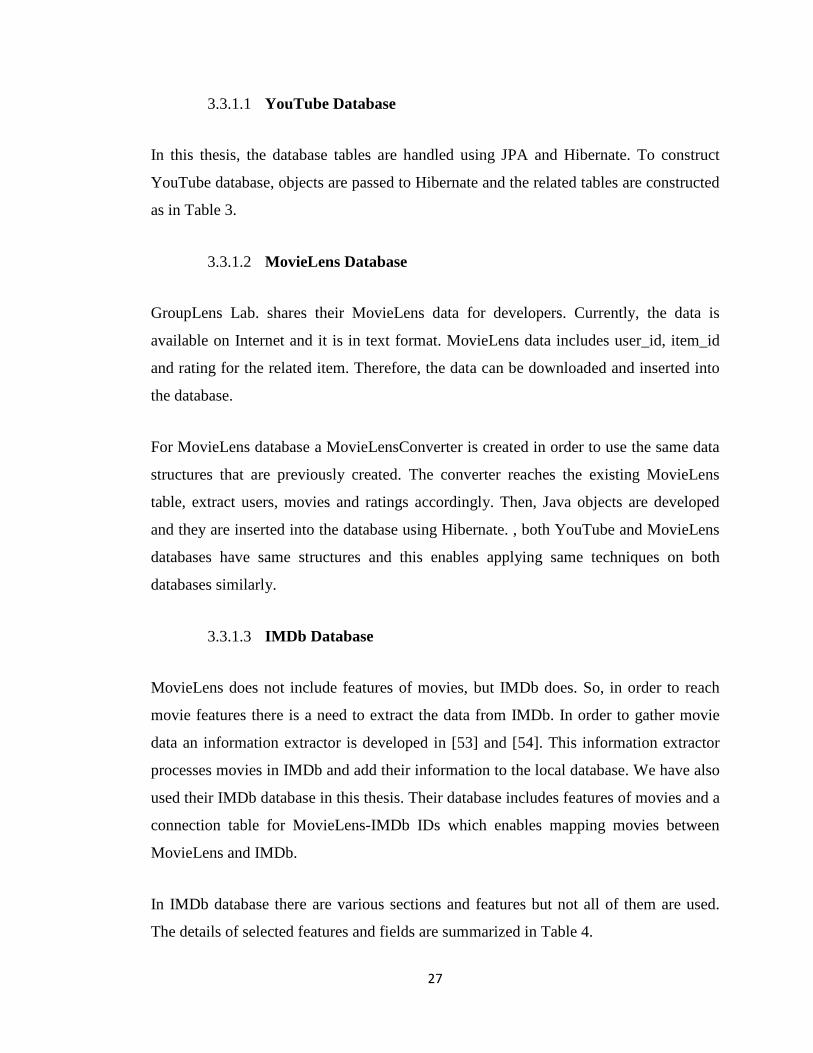
3.3.1.1 YouTube Database
In this thesis, the database tables are handled using JPA and Hibernate. To construct
YouTube database, objects are passed to Hibernate and the related tables are constructed
as in Table 3.
3.3.1.2 MovieLens Database
GroupLens Lab. shares their MovieLens data for developers. Currently, the data is
available on Internet and it is in text format. MovieLens data includes user_id, item_id
and rating for the related item. Therefore, the data can be downloaded and inserted into
the database.
For MovieLens database a MovieLensConverter is created in order to use the same data
structures that are previously created. The converter reaches the existing MovieLens
table, extract users, movies and ratings accordingly. Then, Java objects are developed
and they are inserted into the database using Hibernate. , both YouTube and MovieLens
databases have same structures and this enables applying same techniques on both
databases similarly.
3.3.1.3 IMDb Database
MovieLens does not include features of movies, but IMDb does. So, in order to reach
movie features there is a need to extract the data from IMDb. In order to gather movie
data an information extractor is developed in [53] and [54]. This information extractor
processes movies in IMDb and add their information to the local database. We have also
used their IMDb database in this thesis. Their database includes features of movies and a
connection table for MovieLens-IMDb IDs which enables mapping movies between
MovieLens and IMDb.
In IMDb database there are various sections and features but not all of them are used.
The details of selected features and fields are summarized in Table 4.
28
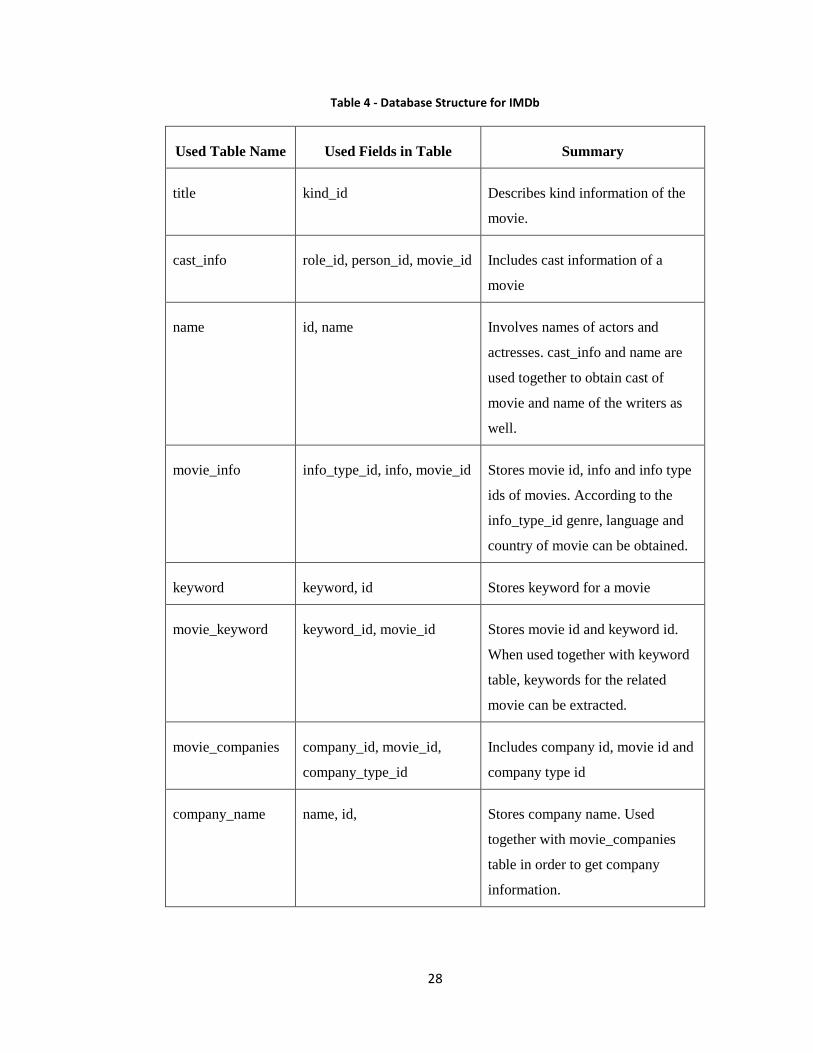
Table 4 - Database Structure for IMDb
Used Table Name Used Fields in Table Summary
title kind_id Describes kind information of the
movie.
cast_info role_id, person_id, movie_id Includes cast information of a
movie
name id, name Involves names of actors and
actresses. cast_info and name are
used together to obtain cast of
movie and name of the writers as
well.
movie_info info_type_id, info, movie_id Stores movie id, info and info type
ids of movies. According to the
info_type_id genre, language and
country of movie can be obtained.
keyword keyword, id Stores keyword for a movie
movie_keyword keyword_id, movie_id Stores movie id and keyword id.
When used together with keyword
table, keywords for the related
movie can be extracted.
movie_companies company_id, movie_id,
company_type_id
Includes company id, movie id and
company type id
company_name name, id, Stores company name. Used
together with movie_companies
table in order to get company
information.
29
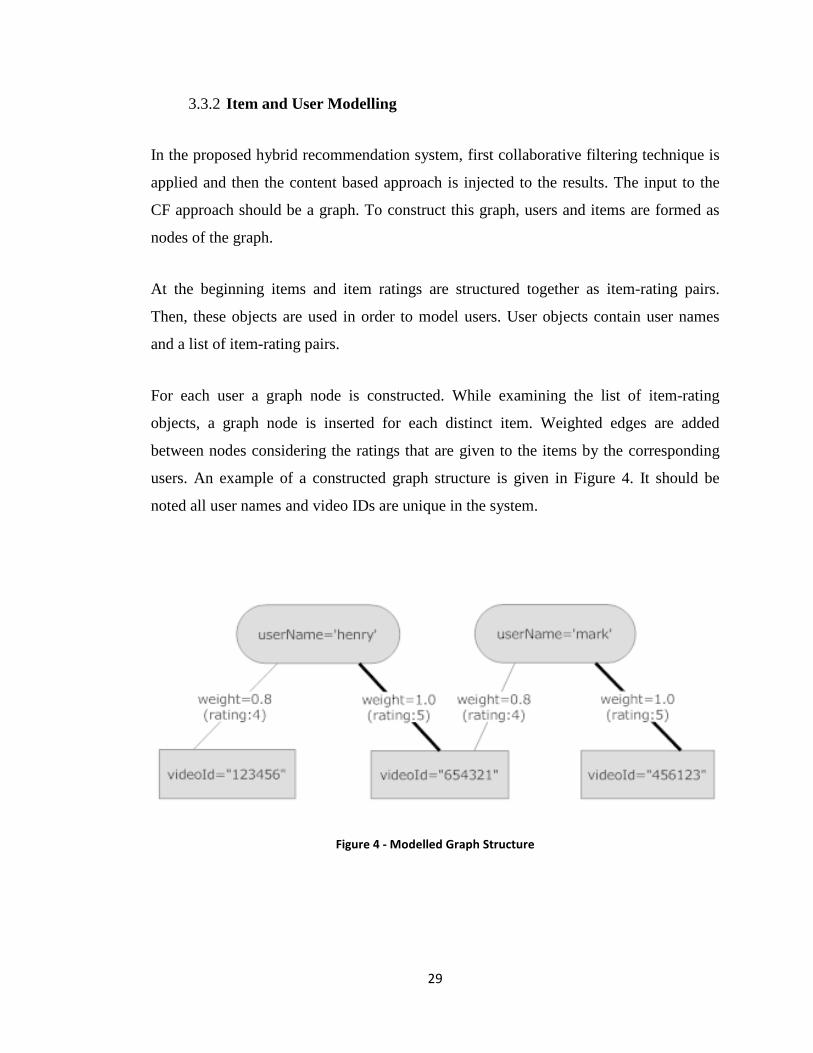
3.3.2 Item and User Modelling
In the proposed hybrid recommendation system, first collaborative filtering technique is
applied and then the content based approach is injected to the results. The input to the
CF approach should be a graph. To construct this graph, users and items are formed as
nodes of the graph.
At the beginning items and item ratings are structured together as item-rating pairs.
Then, these objects are used in order to model users. User objects contain user names
and a list of item-rating pairs.
For each user a graph node is constructed. While examining the list of item-rating
objects, a graph node is inserted for each distinct item. Weighted edges are added
between nodes considering the ratings that are given to the items by the corresponding
users. An example of a constructed graph structure is given in Figure 4. It should be
noted all user names and video IDs are unique in the system.
Figure 4 - Modelled Graph Structure
30
3.4 YouTube Information Extractor
YouTube does not provide a database that can be used in this thesis. For this reason it
was necessary to develop a module to crawl YouTube and construct the YouTube
database.
YouTube provides an API [55] in order to help developers to implement client
applications. With the API methods, only a limited amount of information can be
extracted. But the available methods are helpful to implement a data set extracting
module. We used this API to retrieve the necessary data to construct our data set.
There are different YouTube APIs available for different programming languages. These
are Java, .NET, PHP and Python [55]. In this thesis, Java API is preferred for the reason
that it is object-oriented and there are numerous libraries available for Java. Besides,
Java is used within Eclipse which is an open-source IDE [56]. Especially in Eclipse,
Java is very well supported which makes easier for a developer to build applications
using Java and Eclipse together.
The YouTube dataset module is implemented by using the Java Platform, Eclipse IDE
and the API which is provided by YouTube. The extracted data includes user
information, such as user name, list of pre-watched and rated videos, and given ratings.
Periodically, the system checks for updates in user information and inserts new data
accordingly. This enables the data to stay up to date.
The task of collecting data for our database continued nearly four months. During that
period 15,090 users are added to the system with 117,604 videos and 177,733 ratings.
3.4.1 Video Fetcher
Since the list of YouTube users is not readily available via YouTube API, various videos
are visited as a first step to collect user data. There are standard feeds such as top_rated,
31
most_viewed, top_favorites, most_popular, most_recent, most_discussed which are
provided by YouTube. These standard feeds can be used as in the following:
http://gdata.youtube.com/feeds/api/standardfeeds/recently_featured
http://gdata.youtube.com/feeds/api/standardfeeds/most_popular
http://gdata.youtube.com/feeds/api/standardfeeds/top_rated?time=today
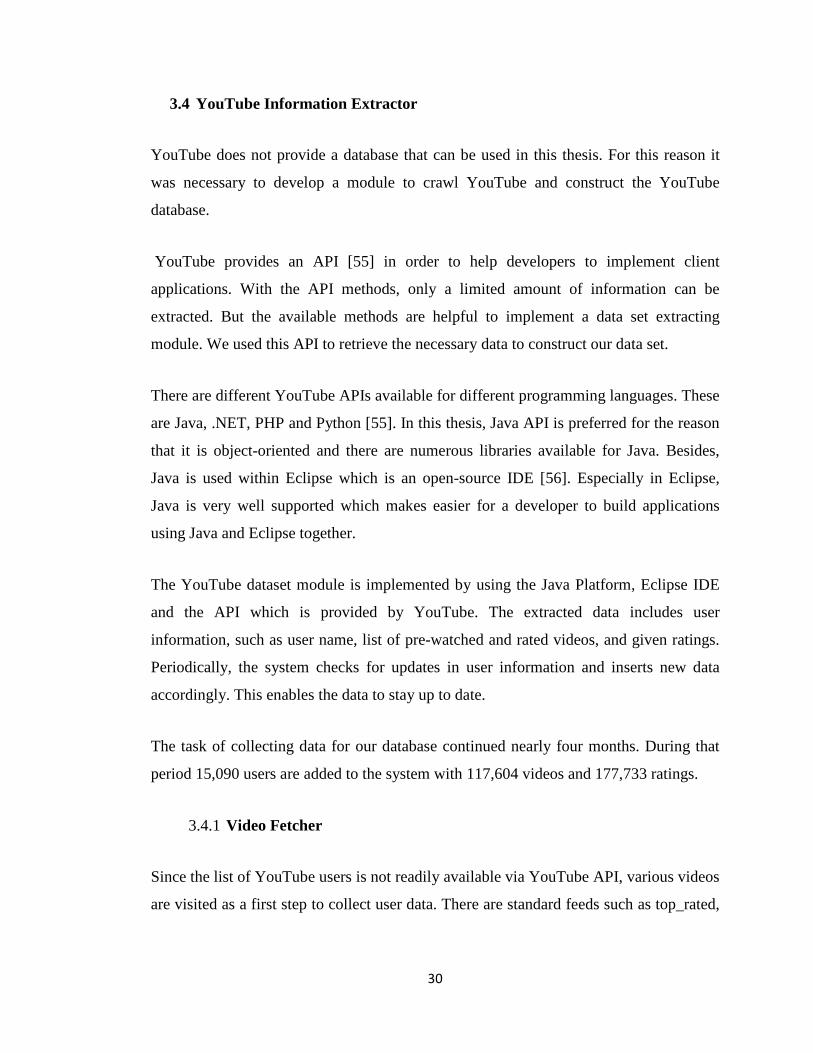
The returned feeds are in xml format. For each movie there is an <entry> tag and all
information about the movie exists in the <entry> tag. Figure 5 is an example of an entry
tag for the video in most_popular feed (less important parts are eliminated):
Figure 5 - Sample video feed
32
Beside standard feeds, videos are also retrieved by key-based searches. For instance
when “flute” is typed and the related videos are searched, a list of videos are returned
that fits the search criteria. The list of returned videos is inserted as new videos to the
system database.
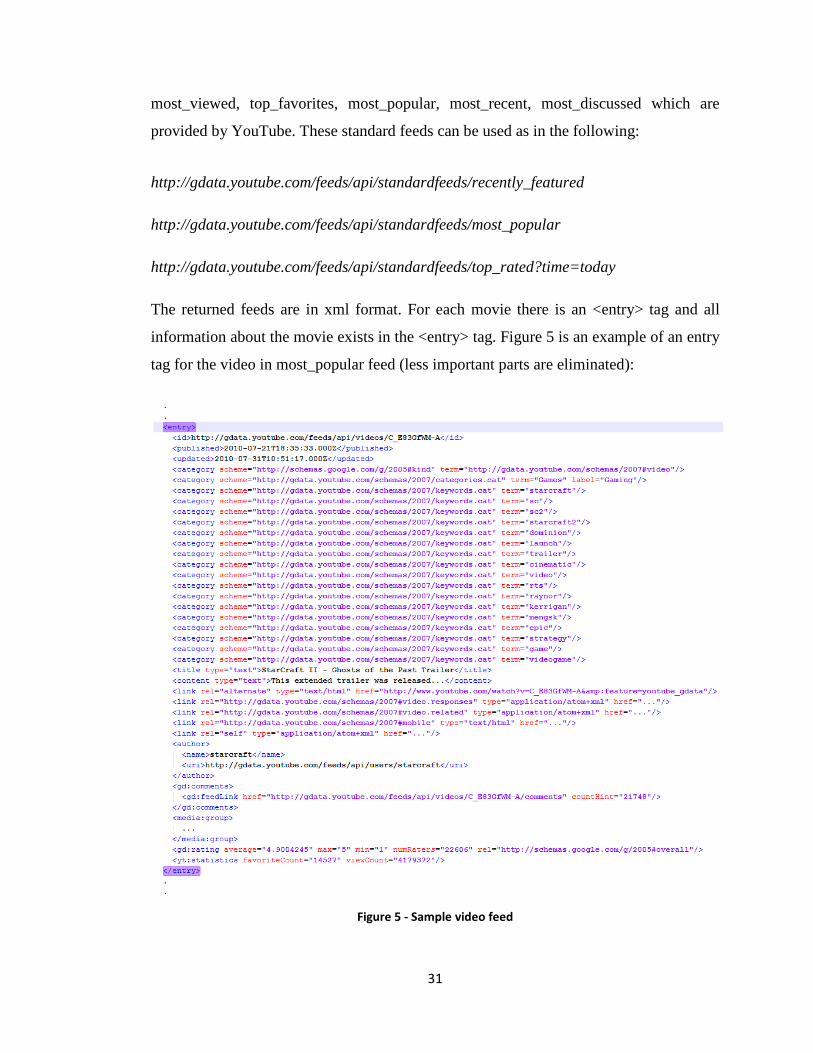
3.4.2 User Fetcher
The obtained xml files contain video information including a feed link for comments of
the corresponding video. Its format is as follows:
http://gdata.youtube.com/feeds/api/videos/d1_JBMrrYw8/comments
The keyword ‘d1_JBMrrYw8’ is the video-id for video ‘Avatar Movie Trailer [HD]’.
Each video has a unique video id which identifies the video.
Each comment stays in a separate <entry> tag as it is like in video feeds. Its format is
shown in Figure 6.
Figure 6 - Sample comment feed
33
Comment feed is retrieved because it contains the list of users who share their opinions
about the video. But YouTube does not allow getting all comments (therefore users).
The number of comments that can be retrieved for each video item is limited to 1000
and it can be taken in groups of 50.
3.4.3 Rating Fetcher
User names are extracted from comments, and they are added to the database. The next
step is getting ratings of users. In YouTube, each user has their events feed. If the users
agree to share their activities, these feeds can be retrieved from YouTube system.
Activity feeds contain information such as rated videos, favourite videos and
commented videos. But, in order to fetch this data YouTube requests developer-key
which can be obtained with Google accounts [57]. This developer-key is used in
requesting feeds. A sample request is as follows:
http://gdata.youtube.com/feeds/api/users/gizozturk/events?v=2&key=AI39si4ysIkjnbqC5TNtBZMPXBsuLqzWHtw6TuvZoBiCvchRIXnmiV_H8aaSLF-3gd_cuwDN6AvqSwENct-b6nAU3gGOdTHdOw
This link retrieves the events of the YouTube user ‘gizozturk’. However, there is also a
restriction in YouTube such that a developer is not allowed to retrieve feeds which
occurred more than 60 days before the time of request [55]. Activity feeds are parsed
and rated videos are added to the database with the given ratings. In addition, favourite
videos are also added assuming the user has given a rating 5.
During the time of collecting data, YouTube has changed their rating system.
Previously, users were giving ratings in a range of [0, 5]. However in the new version of
YouTube, users explain their tastes by marking ‘like’ or ‘dislike’ options. In order to
provide compatibility, prior ratings are converted to values between [0, 1]. In other
words, if a user likes a video it is assumed that the user has given a rating of 1 to that
video, and 0 otherwise.
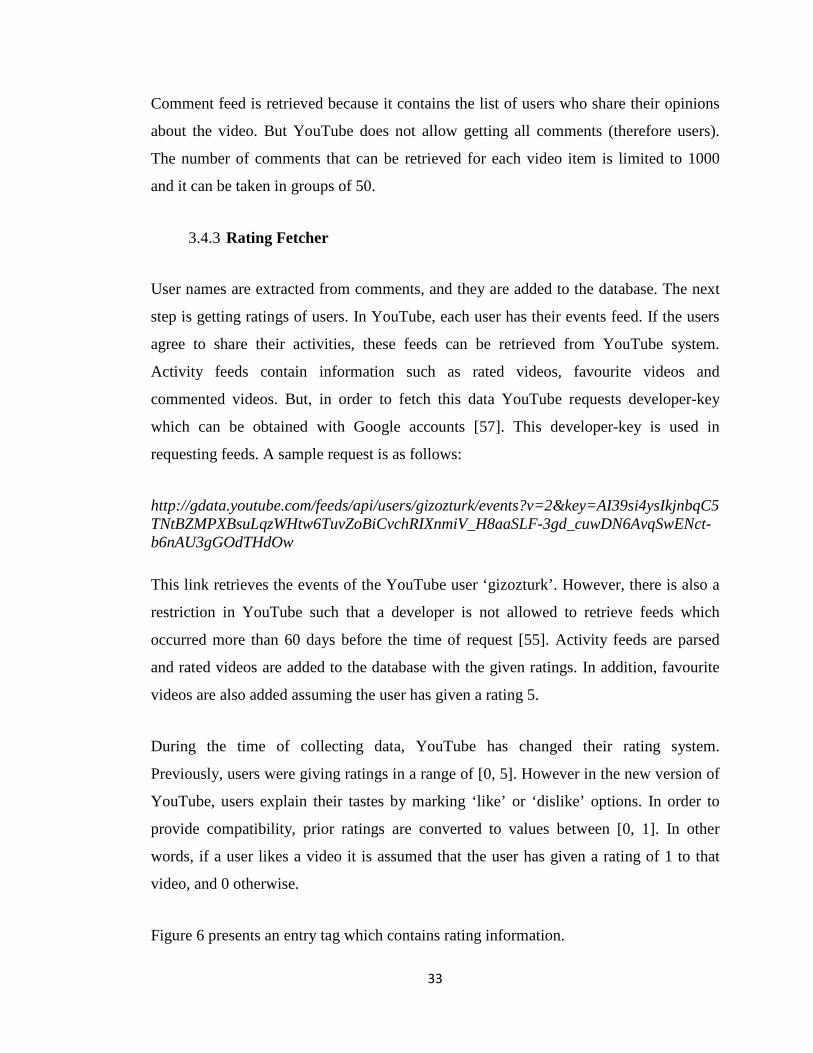
Figure 6 presents an entry tag which contains rating information.
34
Figure 7 - Sample rating feed
This rating feed is in the new rating structure. It can be seen that the rating value in this
example is ‘like’ which is automatically assumed to be ‘5’.
There is also a module that scans through all users, fetches their activities and update
ratings if there are changes. This module runs periodically to gather up-to-date
information.
3.5 Recommender
The proposed recommender system uses both collaborative filtering and content based
approaches in order to provide suggestions. Collaborative filtering technique forms the
predictions for the movies and content based approach aims to improve the obtained
results.
The following sections clarify both the collaborative filtering recommendation and
insertion of content based features within the generated system.
35
3.5.1 Pure Collaborative Filtering Approach
Collaborative filtering is one of the most successful techniques in recommendation
systems and it makes use of preferences of many users in order to predict interests of the
current user. Here, the underlying assumption is that users who have similar interests in
the past would have similar interests in the future too.
In general, it can be said that collaborative filtering examines the previously given
ratings of all users to the items and use them in order to guess the ratings of unrated
items for the active user.
In this work, a graph-based collaborative filtering algorithm is used. The algorithm is
called Adsorption.
3.5.1.1 Adsorption Algorithm
Adsorption algorithm is a general framework when there is a rich graph structure, in
which there are both labelled and unlabeled items and it can be used for classification
and learning [27].
There are different versions of Adsorption algorithm and the basis of the algorithm
arises from the idea of finding the optimum way of classifying items in a graph in terms
of labels that are already put on some other items. In other words the problem is giving
labels to the unlabeled items using labelled items in the graph structure. The versions of
adsorption algorithm are ‘Adsorption via Averaging’, ‘Adsorption via Random Walks’
and ‘Adsorption via Linear Systems’. According to the theorem given in [27] all three
version of the Adsorption algorithms are equal. In this work ‘Adsorption via Averaging’
version is used due to memory and time issues.
As Adsorption algorithm is a graph based method, there is a need to represent items as
nodes of graph to apply it in YouTube domain. To achieve this, the graph architecture is
built involving YouTube users and available videos and Adsorption is thought to work
36
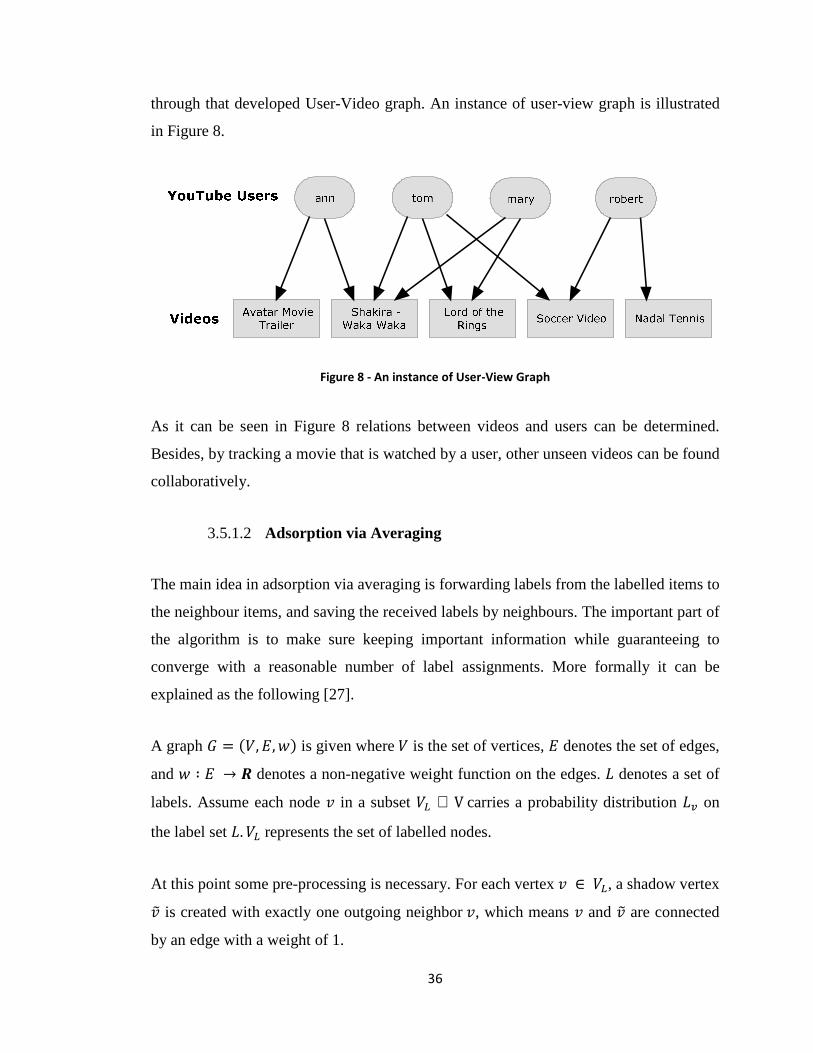
through that developed User-Video graph. An instance of user-view graph is illustrated
in Figure 8.
Figure 8 - An instance of User-View Graph
As it can be seen in Figure 8 relations between videos and users can be determined.
Besides, by tracking a movie that is watched by a user, other unseen videos can be found
collaboratively.
3.5.1.2 Adsorption via Averaging
The main idea in adsorption via averaging is forwarding labels from the labelled items to
the neighbour items, and saving the received labels by neighbours. The important part of
the algorithm is to make sure keeping important information while guaranteeing to
converge with a reasonable number of label assignments. More formally it can be
explained as the following [27].
A graph � = ��,�,�� is given where � is the set of vertices, � denotes the set of edges,
and � ∶ � → denotes a non-negative weight function on the edges. denotes a set of
labels. Assume each node � in a subset �� ⊆ V carries a probability distribution � on
the label set .�� represents the set of labelled nodes.
At this point some pre-processing is necessary. For each vertex � ∈ ��, a shadow vertex
�� is created with exactly one outgoing neighbor �, which means � and �� are connected
by an edge with a weight of 1.
37
The pseudo-code of the algorithm is as follows:
Input: � = ��,�,��, ,��.
repeat
for each � ∈ � ∪ � do:
Let � = ∑ �(�, �)��
end-for
Normalize � to have unit � norm
until convergence
Output: Distributions {��
| � ∈ �}
In order to apply the algorithm, the first step is to create the user-view graph.
Considering effective usage of memory and processor, videos which have a rating lower
than the decided threshold are pruned and not added to the graph. After experimenting
with different values it is decided to set this threshold value to 4. That is, if a user has
given 4 to a movie, that movie is added to the graph by adding an edge between that user
and the movie. If the rating of the movie is 2 it is not added to the graph.
After the pruning step, a shadow node is created for each user and video, which is the
end of the graph construction part.
Each node of the graph is traversed one by one and its label distribution list is updated
according to its neighbours. First, the label distribution list of the current node is cleared.
Then, this list is reconstructed by traversing its neighbours and copying their label
distribution lists. The edge weight between the current node and its neighbour is also
taken into account in this process. For instance, if the edge weight is 0.6 between the
current node and its neighbour, neighbour label distribution list is multiplied with 0.6
and copied to the distribution list of the current node. This copying process is continued
38
with the neighbour of the neighbour of the current node and so on. While going deeper,
the effect of labels reduces dramatically and time and memory constraints become
crucial. For this reason, the system uses only the first 3 levels of the neighbour label
distributions.
The size of the label distribution list limits the labels which will be carried to the next
iteration. Therefore, after the label distribution list is formed, it is sorted and poor labels
are deleted from the list.
This process continues until the label distribution list of all nodes converges. To be more
precise, whenever the label distribution list of all nodes remains same on an iteration, the
algorithm terminates.
3.5.2 Injection of Content Based Methods to Collaborative Filtering
To increase the strength of recommendations it is decided to add content based filtering
to the results obtained by collaborative filtering.
The content based method that is used in this thesis does not provide recommendations
itself. Instead, it is used to recommend videos/movies to the users that are similar to the
ones obtained with the Adsorption algorithm. The aim is to suggest different but also
relevant items to the users.
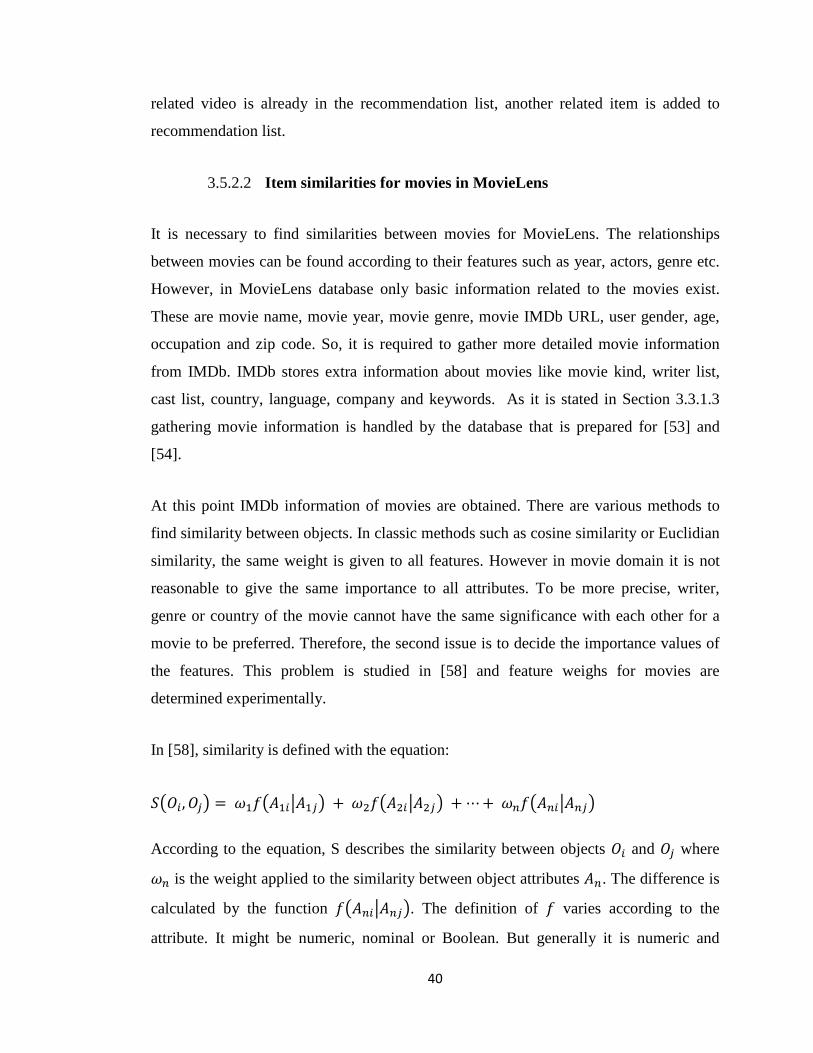
Content based approach is added by using item similarities. As two different datasets are
used in this thesis, two different similarity methods are applied, one for YouTube dataset
and one for MovieLens dataset. Collaborative results are sorted by relevance and less
relevant results are replaced with content based similarity results.
39
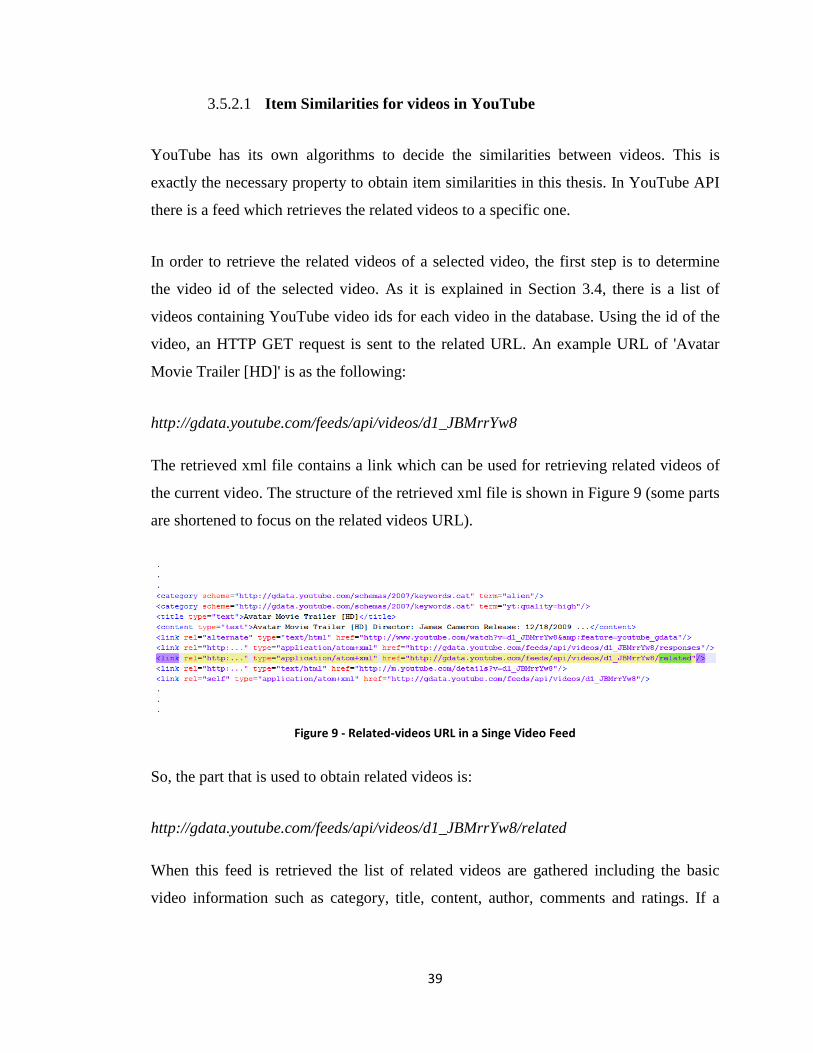
3.5.2.1 Item Similarities for videos in YouTube
YouTube has its own algorithms to decide the similarities between videos. This is
exactly the necessary property to obtain item similarities in this thesis. In YouTube API
there is a feed which retrieves the related videos to a specific one.
In order to retrieve the related videos of a selected video, the first step is to determine
the video id of the selected video. As it is explained in Section 3.4, there is a list of
videos containing YouTube video ids for each video in the database. Using the id of the
video, an HTTP GET request is sent to the related URL. An example URL of 'Avatar
Movie Trailer [HD]' is as the following:
http://gdata.youtube.com/feeds/api/videos/d1_JBMrrYw8
The retrieved xml file contains a link which can be used for retrieving related videos of
the current video. The structure of the retrieved xml file is shown in Figure 9 (some parts
are shortened to focus on the related videos URL).
Figure 9 - Related-videos URL in a Singe Video Feed
So, the part that is used to obtain related videos is:
http://gdata.youtube.com/feeds/api/videos/d1_JBMrrYw8/related
When this feed is retrieved the list of related videos are gathered including the basic
video information such as category, title, content, author, comments and ratings. If a
40
related video is already in the recommendation list, another related item is added to
recommendation list.
3.5.2.2 Item similarities for movies in MovieLens
It is necessary to find similarities between movies for MovieLens. The relationships
between movies can be found according to their features such as year, actors, genre etc.
However, in MovieLens database only basic information related to the movies exist.
These are movie name, movie year, movie genre, movie IMDb URL, user gender, age,
occupation and zip code. So, it is required to gather more detailed movie information
from IMDb. IMDb stores extra information about movies like movie kind, writer list,
cast list, country, language, company and keywords. As it is stated in Section 3.3.1.3
gathering movie information is handled by the database that is prepared for [53] and
[54].
At this point IMDb information of movies are obtained. There are various methods to
find similarity between objects. In classic methods such as cosine similarity or Euclidian
similarity, the same weight is given to all features. However in movie domain it is not
reasonable to give the same importance to all attributes. To be more precise, writer,
genre or country of the movie cannot have the same significance with each other for a
movie to be preferred. Therefore, the second issue is to decide the importance values of
the features. This problem is studied in [58] and feature weighs for movies are
determined experimentally.
In [58], similarity is defined with the equation:
����,��� = ������������ + ������������ + ⋯ + ������������
According to the equation, S describes the similarity between objects �� and �� where
�� is the weight applied to the similarity between object attributes ��. The difference is
calculated by the function ����������. The definition of � varies according to the
attribute. It might be numeric, nominal or Boolean. But generally it is numeric and
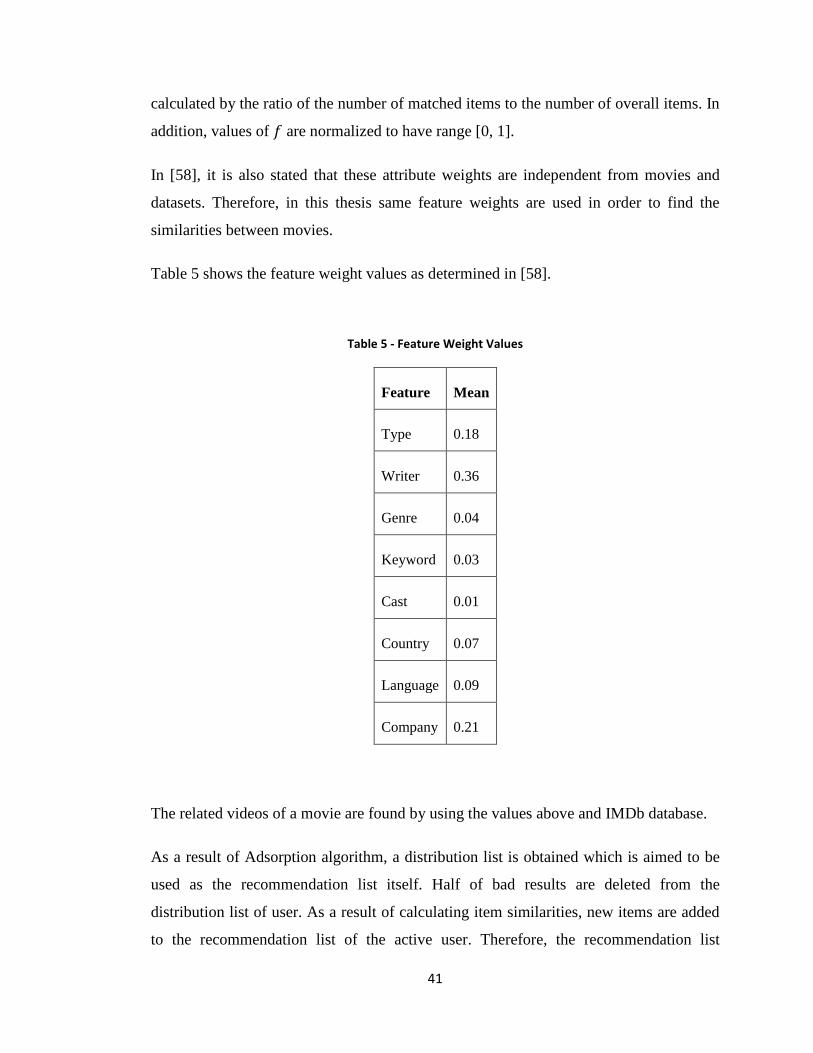
41
calculated by the ratio of the number of matched items to the number of overall items. In
addition, values of � are normalized to have range [0, 1].
In [58], it is also stated that these attribute weights are independent from movies and
datasets. Therefore, in this thesis same feature weights are used in order to find the
similarities between movies.
Table 5 shows the feature weight values as determined in [58].
Table 5 - Feature Weight Values
Feature Mean
Type 0.18
Writer 0.36
Genre 0.04
Keyword 0.03
Cast 0.01
Country 0.07
Language 0.09
Company 0.21
The related videos of a movie are found by using the values above and IMDb database.
As a result of Adsorption algorithm, a distribution list is obtained which is aimed to be
used as the recommendation list itself. Half of bad results are deleted from the
distribution list of user. As a result of calculating item similarities, new items are added
to the recommendation list of the active user. Therefore, the recommendation list

42
contains items from both collaborative filtering and content based filtering providing a
hybrid recommendation to the user.
43
CHAPTER 4
EXPERIMENTS AND EVALUATION
This chapter presents the experiments that were carried out in order to evaluate the
performance of the system. First, the datasets that are used for evaluating the system are
described. Then, the used metrics are specified. Next, the evaluation of the hybrid
system is performed including comparisons with two different datasets. Finally, results
are presented with graphical charts.
4.1 Data Sets
In this thesis two different datasets are used in order to evaluate the proposed system.
These are YouTube data set and MovieLens data set.
4.1.1 YouTube Data Set
There is not enough information available in the YouTube site to be used as a dataset.
For this reason an information extractor is implemented to form the YouTube dataset.
This dataset includes:
• 177733 ratings • 117604 videos • 15090 users
As the values indicate, the YouTube dataset is very sparse, which is clearly an
undesirable property for evaluation.
In addition, similar videos are extracted and added to database for the content-based
approach. So, the similar videos also become part of the YouTube dataset.

44
4.1.2 MovieLens Data Set
There are three different data sets available in MovieLens to help developers to evaluate
their recommendation systems [25]. These are:
1. 100,000 ratings for 1682 movies by 943 users
2. 1 million ratings for 3900 movies by 6040 users
3. 10 million ratings and 100,000 tags for 10681 movies by 71567 users
In this thesis the first of these available datasets is used. The selected dataset has the
following features:
1. Ratings are assigned from 1 to 5 (1 means very bad, 5 means very good)
2. Each user has rated at least 20 movies
3. Simple demographic information of the users (age, gender, occupation, zip) is
provided
In order to use the available MovieLens dataset, there is a need to map the information
in the database to the current data structure. For this purpose, as it is stated in Chapter 3,
MovieLensConverter is constructed. Users and ratings are extracted from database and
they are converted to the available format.
For the content-based part it is necessary to calculate similarities of movies. IMDb IDs
are necessary for this purpose. Data in IMDb contains information about movies such as
genre, writer, country and company. Therefore, IMDb data is used and movie features
are also taken into consideration.
4.2 Evaluation Metrics
There are different approaches to evaluate the performance of an information retrieval
system. One can investigate time / space efficiency, effectiveness of results or pleasure
of user [64]. This thesis focuses on evaluating the effectiveness of results.
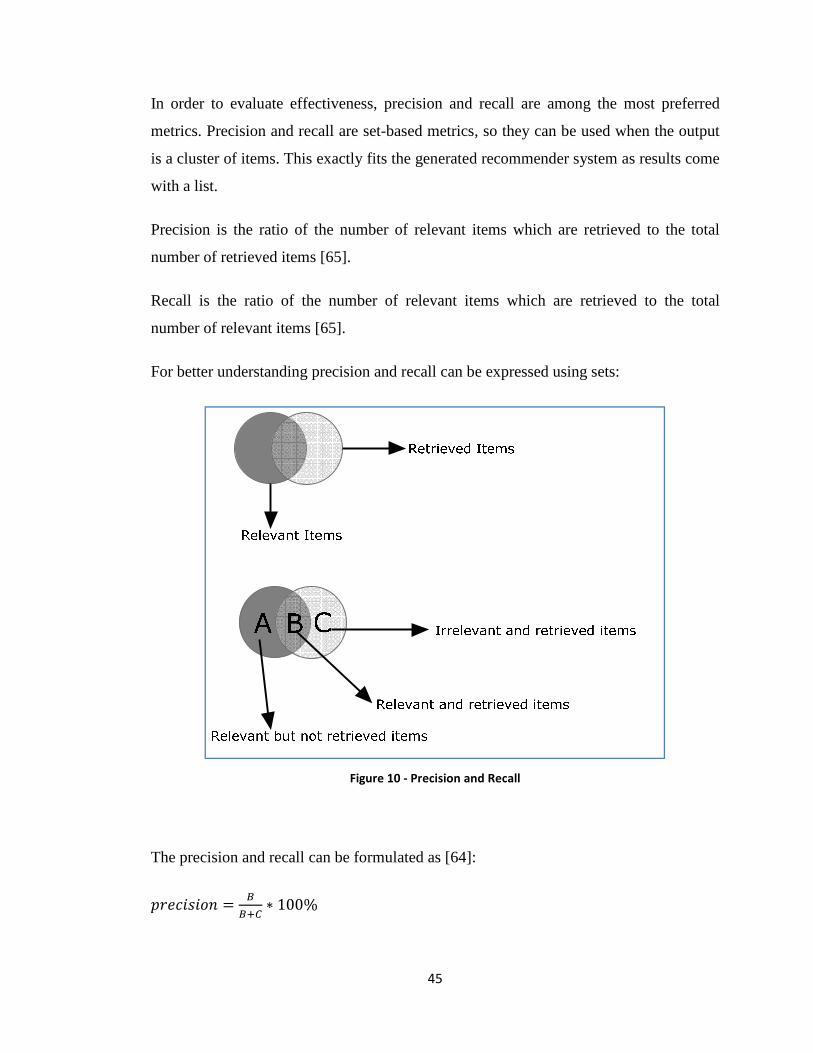
45
In order to evaluate effectiveness, precision and recall are among the most preferred
metrics. Precision and recall are set-based metrics, so they can be used when the output
is a cluster of items. This exactly fits the generated recommender system as results come
with a list.
Precision is the ratio of the number of relevant items which are retrieved to the total
number of retrieved items [65].
Recall is the ratio of the number of relevant items which are retrieved to the total
number of relevant items [65].
For better understanding precision and recall can be expressed using sets:
Figure 10 - Precision and Recall
The precision and recall can be formulated as [64]:
��������� =
�∗ 100%
46
��� !! =
�∗ 100%
F-measure is also a metric for evaluation which combines precision and recall. Actually
F-measure is the harmonic mean of precision and recall. So, F-measure can be calculated
by the formula:
" = 2 ∗ ���������∗�������
���������������
In this thesis precision, recall and F-Measure values are calculated in order to evaluate
the system performance.
4.3 Parameters
There are various parameters that may be changed in order to examine results in
different perspectives. These are �,�,�, �,# parameters and their explanations are given
in the following.
4.3.1 Parameters $ and %
In order to evaluate the system, different user groups are formed according to the
number of ratings they gave to items. � denotes the user groups for MovieLens users
and � denotes user groups for YouTube users.
User groups are formed differently for YouTube and MovieLens dataset. Because of the
high data sparsity of YouTube, only one group of users is formed. This group contains
20 users and average rating of the group is 70. On the other hand, in MovieLens dataset
three types of user groups are constructed. The groups �1, �2 and �3 are formed
according to their average number of ratings. The details for both YouTube and
MovieLens user-sets are shown in
Table 6.
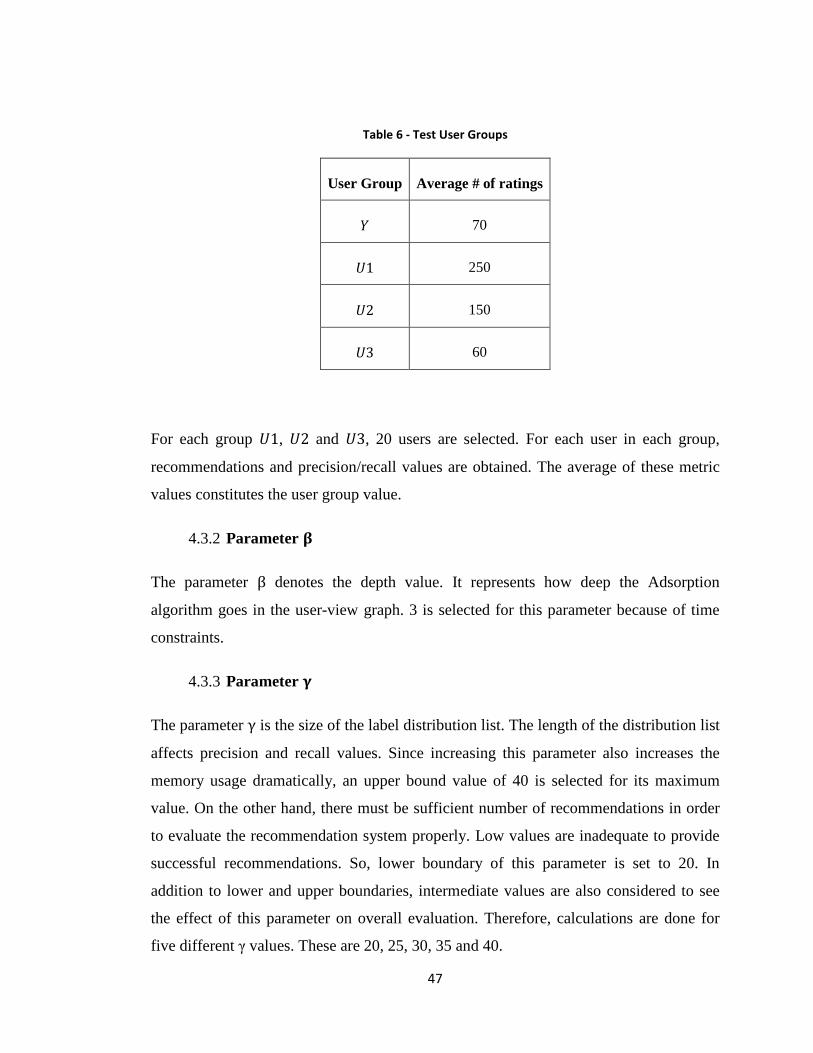
47
Table 6 - Test User Groups
User Group Average # of ratings
� 70
�1 250
�2 150
�3 60
For each group �1, �2 and �3, 20 users are selected. For each user in each group,
recommendations and precision/recall values are obtained. The average of these metric
values constitutes the user group value.
4.3.2 Parameter &
The parameter β denotes the depth value. It represents how deep the Adsorption
algorithm goes in the user-view graph. 3 is selected for this parameter because of time
constraints.
4.3.3 Parameter '
The parameter γ is the size of the label distribution list. The length of the distribution list
affects precision and recall values. Since increasing this parameter also increases the
memory usage dramatically, an upper bound value of 40 is selected for its maximum
value. On the other hand, there must be sufficient number of recommendations in order
to evaluate the recommendation system properly. Low values are inadequate to provide
successful recommendations. So, lower boundary of this parameter is set to 20. In
addition to lower and upper boundaries, intermediate values are also considered to see
the effect of this parameter on overall evaluation. Therefore, calculations are done for
five different γ values. These are 20, 25, 30, 35 and 40.
48
4.3.4 Parameter δ
The parameter # is the threshold value of ratings. While traversing the videos that are
rated by a user, related video is added as a video node only if its rating is equal to or
higher than the value of #. It is assumed that, users give ratings above 3 (in a 1 to 5
rating system) to videos they like. Because of this, 4 is selected for this parameter.
4.4 Constraints
Since there are lots of users and ratings in YouTube database (which form a huge graph
with many nodes), it becomes a necessity to reduce the number of users. So, randomly
selected 10000 users are kept and others are not included in the graph.
4.5 Experiments
This section present the results of experiments that were carried out for both CF and
hybrid systems. Experiments are done using both YouTube and MovieLens datasets.
Therefore precision/recall values are indicated for both datasets and related curves are
plotted accordingly.
4.5.1 Pure Collaborative System using YouTube Data
Because of the data sparsity problem, common videos between users are very rare and
this makes it harder to traverse the graph and reach new videos. Besides, even if there
are common videos, they are usually popular videos which may be watched by millions
of people who are most probably do not have common interests. In addition, the nodes
that are reached through popular nodes may not reflect the effectiveness of
recommendations. So, it is a challenging task to suggest different videos other than
popular ones.
4.5.1.1 Results For (
In this experiment, the effectiveness of pure CF system is evaluated using YouTube
data. For user-set Y calculations are done and the results are presented in Table 7.
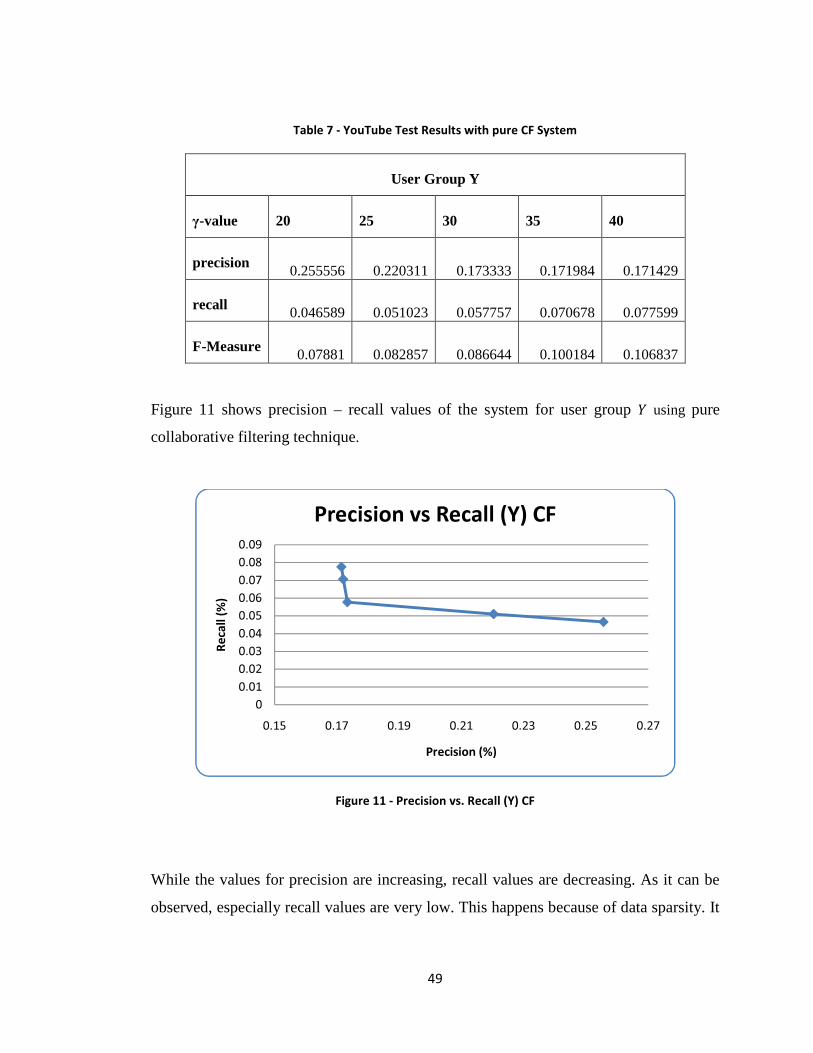
49
Table 7 - YouTube Test Results with pure CF System
User Group Y
γ-value 20 25 30 35 40
precision 0.255556 0.220311 0.173333 0.171984 0.171429
recall 0.046589 0.051023 0.057757 0.070678 0.077599
F-Measure 0.07881 0.082857 0.086644 0.100184 0.106837
Figure 11 shows precision – recall values of the system for user group � using pure
collaborative filtering technique.
Figure 11 - Precision vs. Recall (Y) CF
While the values for precision are increasing, recall values are decreasing. As it can be
observed, especially recall values are very low. This happens because of data sparsity. It
0
0.01
0.02
0.03
0.04
0.05
0.06
0.07
0.08
0.09
0.15 0.17 0.19 0.21 0.23 0.25 0.27
Re
call
(%
)
Precision (%)
Precision vs Recall (Y) CF
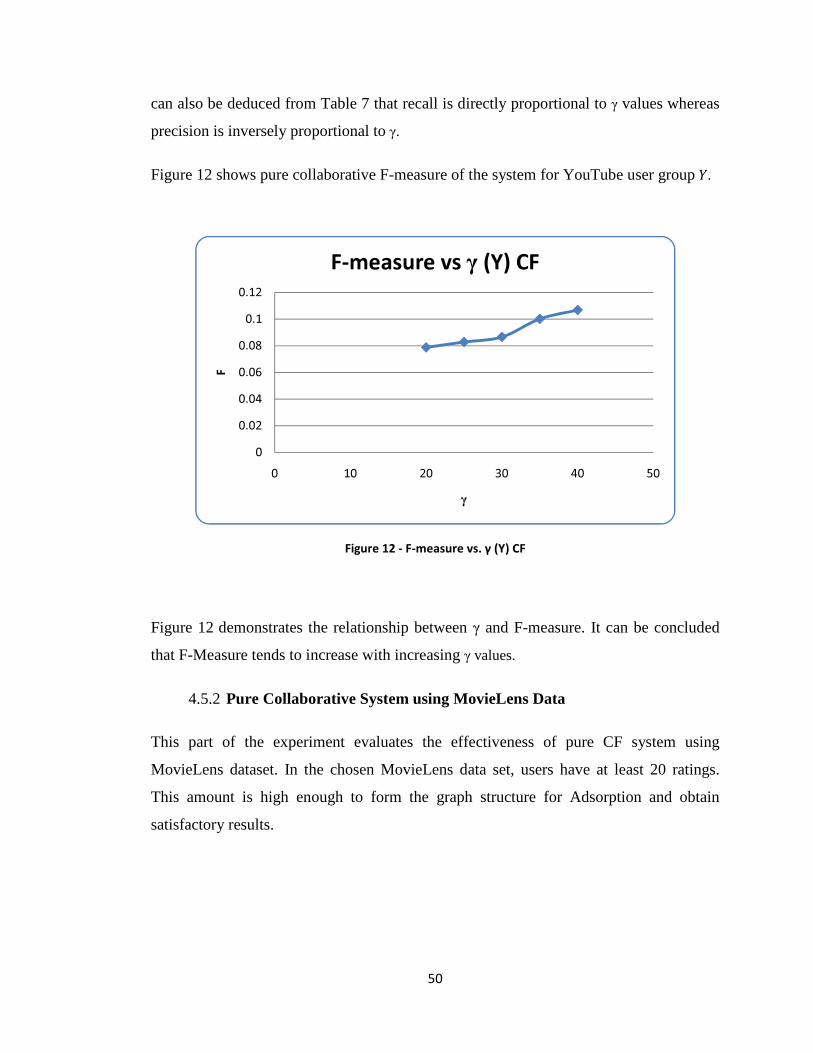
50
can also be deduced from Table 7 that recall is directly proportional to γ values whereas
precision is inversely proportional to γ.
Figure 12 shows pure collaborative F-measure of the system for YouTube user group �.
Figure 12 - F-measure vs. γ (Y) CF
Figure 12 demonstrates the relationship between γ and F-measure. It can be concluded
that F-Measure tends to increase with increasing γ values.
4.5.2 Pure Collaborative System using MovieLens Data
This part of the experiment evaluates the effectiveness of pure CF system using
MovieLens dataset. In the chosen MovieLens data set, users have at least 20 ratings.
This amount is high enough to form the graph structure for Adsorption and obtain
satisfactory results.
0
0.02
0.04
0.06
0.08
0.1
0.12
0 10 20 30 40 50
F
γ
F-measure vs γ (Y) CF
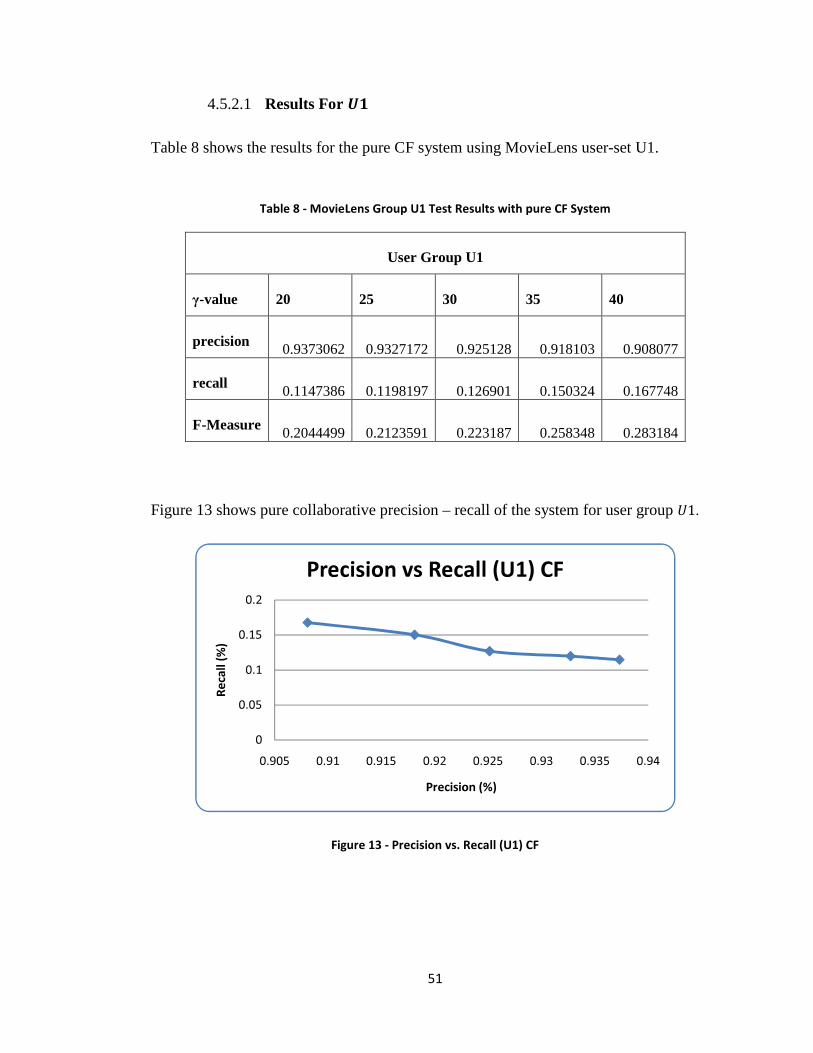
51
4.5.2.1 Results For $)
Table 8 shows the results for the pure CF system using MovieLens user-set U1.
Table 8 - MovieLens Group U1 Test Results with pure CF System
User Group U1
γ-value 20 25 30 35 40
precision 0.9373062 0.9327172 0.925128 0.918103 0.908077
recall 0.1147386 0.1198197 0.126901 0.150324 0.167748
F-Measure 0.2044499 0.2123591 0.223187 0.258348 0.283184
Figure 13 shows pure collaborative precision – recall of the system for user group �1.
Figure 13 - Precision vs. Recall (U1) CF
0
0.05
0.1
0.15
0.2
0.905 0.91 0.915 0.92 0.925 0.93 0.935 0.94
Re
call
(%
)
Precision (%)
Precision vs Recall (U1) CF
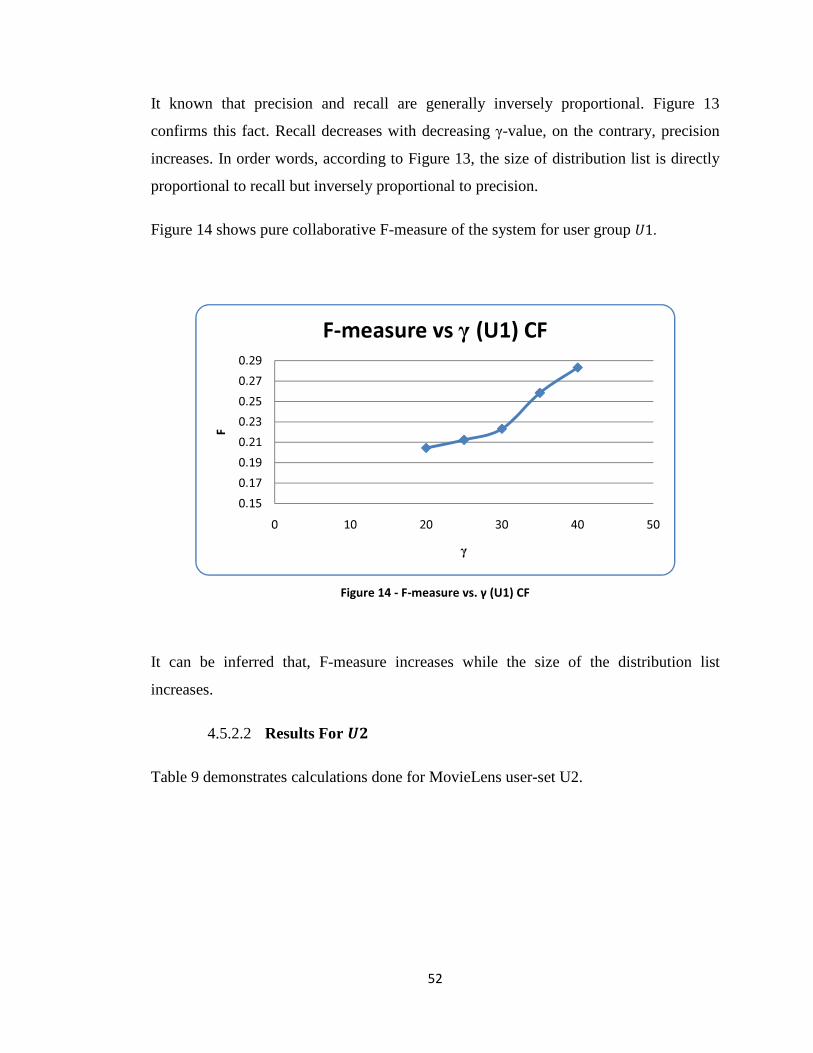
52
It known that precision and recall are generally inversely proportional. Figure 13
confirms this fact. Recall decreases with decreasing γ-value, on the contrary, precision
increases. In order words, according to Figure 13, the size of distribution list is directly
proportional to recall but inversely proportional to precision.
Figure 14 shows pure collaborative F-measure of the system for user group �1.
Figure 14 - F-measure vs. γ (U1) CF
It can be inferred that, F-measure increases while the size of the distribution list
increases.
4.5.2.2 Results For $*
Table 9 demonstrates calculations done for MovieLens user-set U2.
0.15
0.17
0.19
0.21
0.23
0.25
0.27
0.29
0 10 20 30 40 50
F
γ
F-measure vs γ (U1) CF
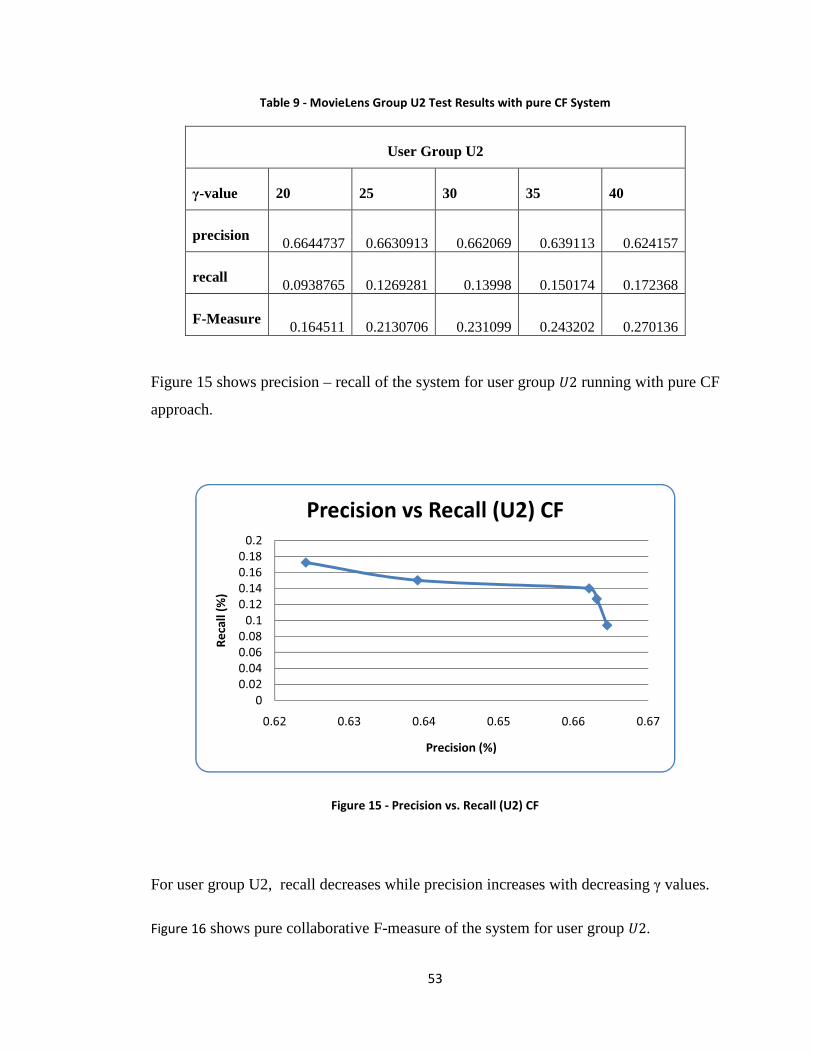
53
Table 9 - MovieLens Group U2 Test Results with pure CF System
User Group U2
γ-value 20 25 30 35 40
precision 0.6644737 0.6630913 0.662069 0.639113 0.624157
recall 0.0938765 0.1269281 0.13998 0.150174 0.172368
F-Measure 0.164511 0.2130706 0.231099 0.243202 0.270136
Figure 15 shows precision – recall of the system for user group �2 running with pure CF
approach.
Figure 15 - Precision vs. Recall (U2) CF
For user group U2, recall decreases while precision increases with decreasing γ values.
Figure 16 shows pure collaborative F-measure of the system for user group �2.
0
0.02
0.04
0.06
0.08
0.1
0.12
0.14
0.16
0.18
0.2
0.62 0.63 0.64 0.65 0.66 0.67
Re
call
(%
)
Precision (%)
Precision vs Recall (U2) CF
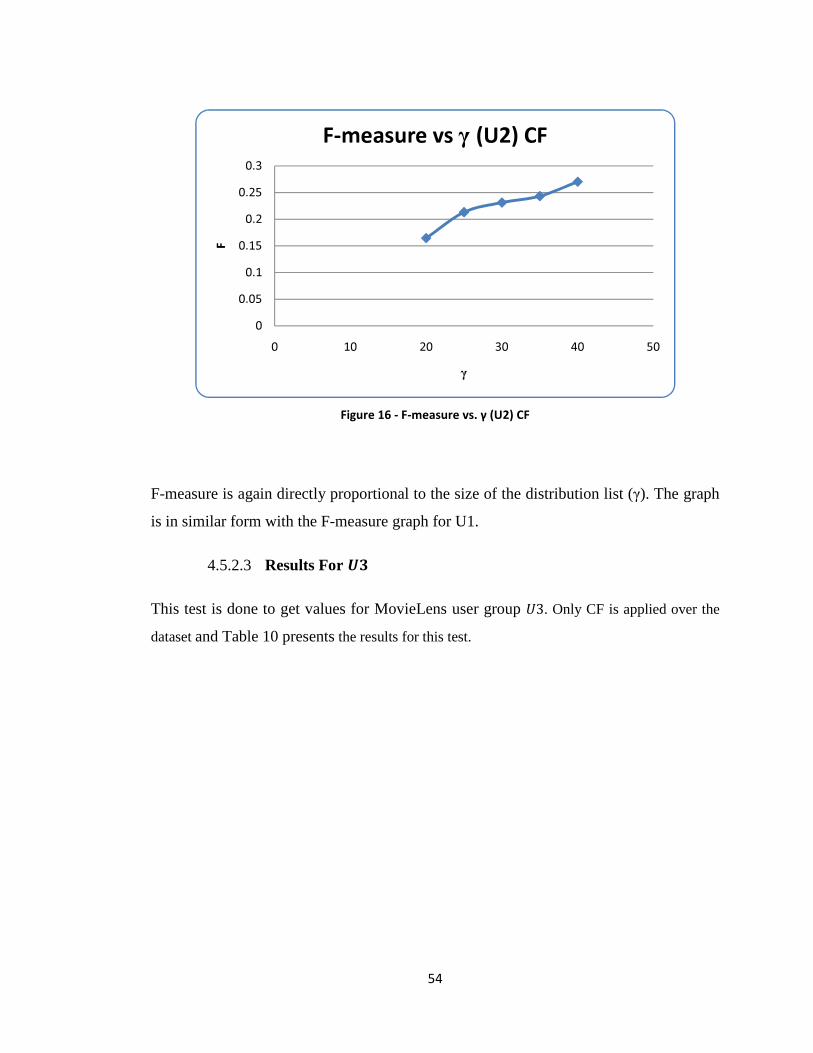
54
Figure 16 - F-measure vs. γ (U2) CF
F-measure is again directly proportional to the size of the distribution list (γ). The graph
is in similar form with the F-measure graph for U1.
4.5.2.3 Results For $+
This test is done to get values for MovieLens user group �3. Only CF is applied over the
dataset and Table 10 presents the results for this test.
0
0.05
0.1
0.15
0.2
0.25
0.3
0 10 20 30 40 50
F
γ
F-measure vs γ (U2) CF
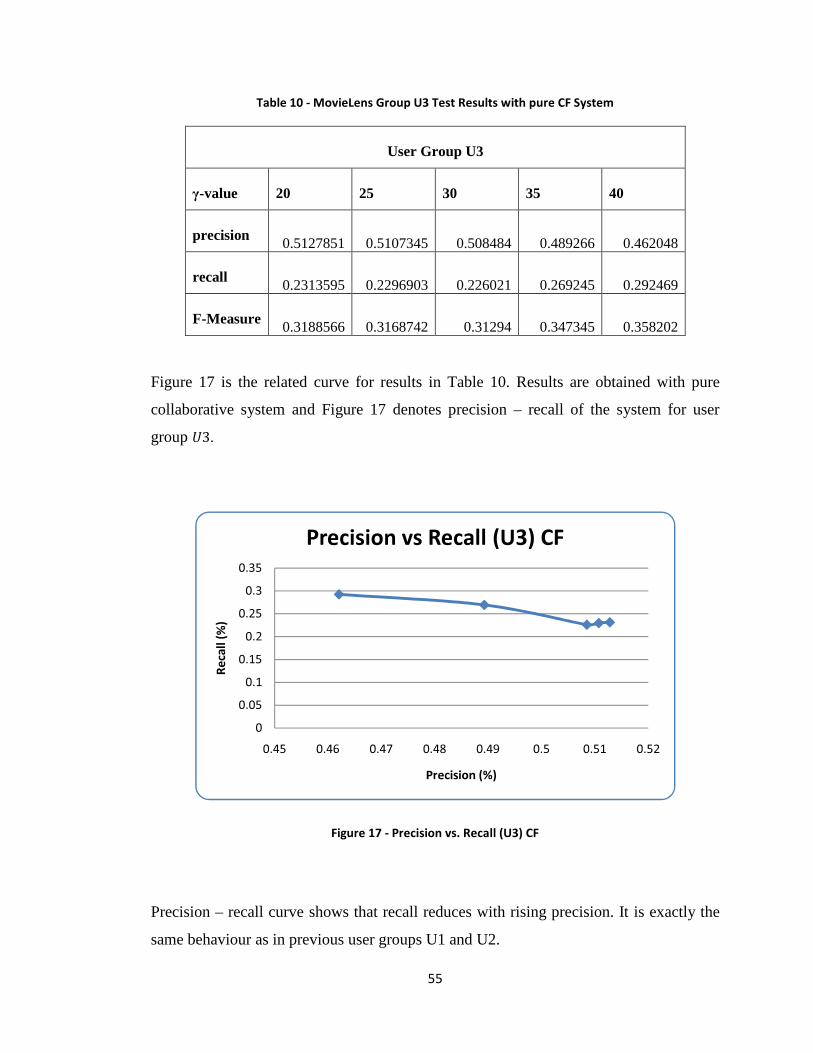
55
Table 10 - MovieLens Group U3 Test Results with pure CF System
User Group U3
γ-value 20 25 30 35 40
precision 0.5127851 0.5107345 0.508484 0.489266 0.462048
recall 0.2313595 0.2296903 0.226021 0.269245 0.292469
F-Measure 0.3188566 0.3168742 0.31294 0.347345 0.358202
Figure 17 is the related curve for results in Table 10. Results are obtained with pure
collaborative system and Figure 17 denotes precision – recall of the system for user
group �3.
Figure 17 - Precision vs. Recall (U3) CF
Precision – recall curve shows that recall reduces with rising precision. It is exactly the
same behaviour as in previous user groups U1 and U2.
0
0.05
0.1
0.15
0.2
0.25
0.3
0.35
0.45 0.46 0.47 0.48 0.49 0.5 0.51 0.52
Re
call
(%
)
Precision (%)
Precision vs Recall (U3) CF
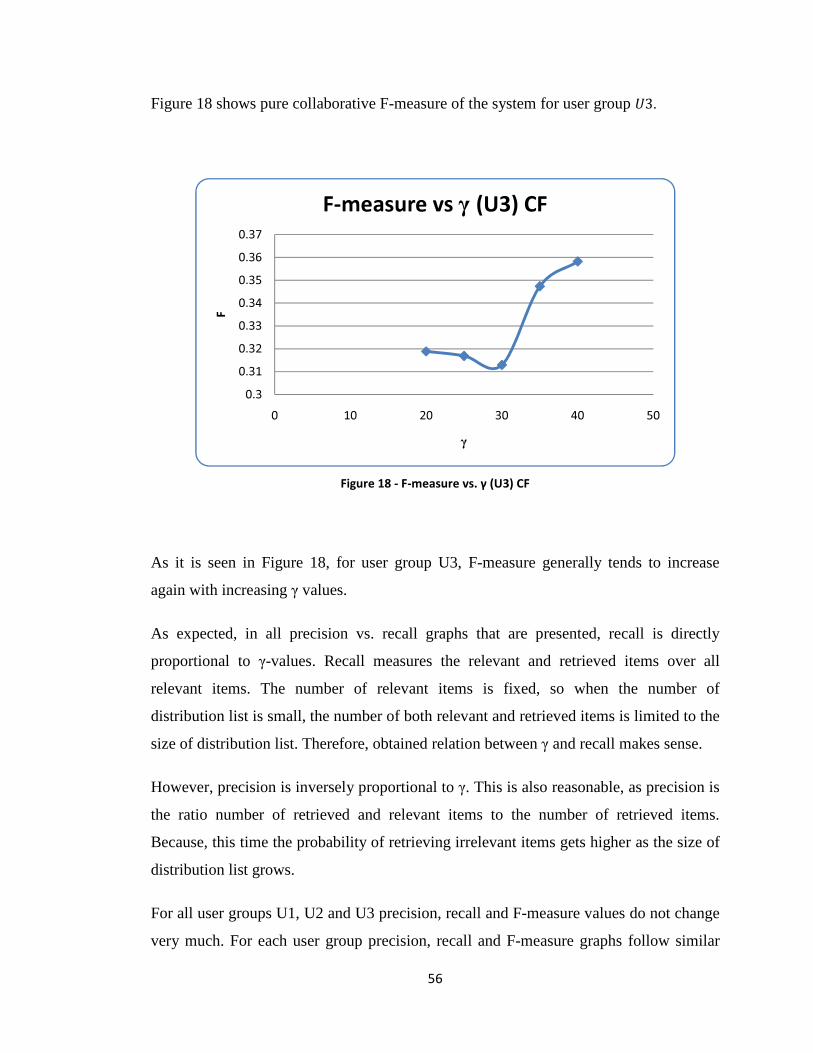
56
Figure 18 shows pure collaborative F-measure of the system for user group �3.
Figure 18 - F-measure vs. γ (U3) CF
As it is seen in Figure 18, for user group U3, F-measure generally tends to increase
again with increasing γ values.
As expected, in all precision vs. recall graphs that are presented, recall is directly
proportional to γ-values. Recall measures the relevant and retrieved items over all
relevant items. The number of relevant items is fixed, so when the number of
distribution list is small, the number of both relevant and retrieved items is limited to the
size of distribution list. Therefore, obtained relation between γ and recall makes sense.
However, precision is inversely proportional to γ. This is also reasonable, as precision is
the ratio number of retrieved and relevant items to the number of retrieved items.
Because, this time the probability of retrieving irrelevant items gets higher as the size of
distribution list grows.
For all user groups U1, U2 and U3 precision, recall and F-measure values do not change
very much. For each user group precision, recall and F-measure graphs follow similar
0.3
0.31
0.32
0.33
0.34
0.35
0.36
0.37
0 10 20 30 40 50
F
γ
F-measure vs γ (U3) CF
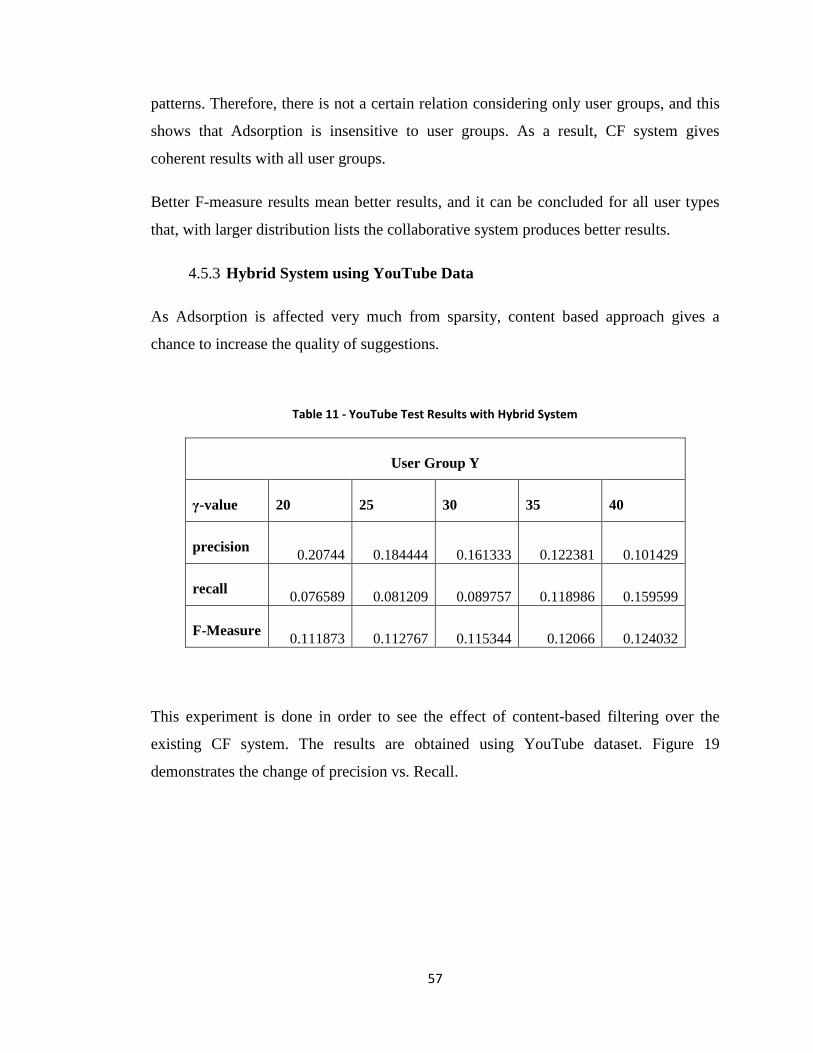
57
patterns. Therefore, there is not a certain relation considering only user groups, and this
shows that Adsorption is insensitive to user groups. As a result, CF system gives
coherent results with all user groups.
Better F-measure results mean better results, and it can be concluded for all user types
that, with larger distribution lists the collaborative system produces better results.
4.5.3 Hybrid System using YouTube Data
As Adsorption is affected very much from sparsity, content based approach gives a
chance to increase the quality of suggestions.
Table 11 - YouTube Test Results with Hybrid System
User Group Y
γ-value 20 25 30 35 40
precision 0.20744 0.184444 0.161333 0.122381 0.101429
recall 0.076589 0.081209 0.089757 0.118986 0.159599
F-Measure 0.111873 0.112767 0.115344 0.12066 0.124032
This experiment is done in order to see the effect of content-based filtering over the
existing CF system. The results are obtained using YouTube dataset. Figure 19
demonstrates the change of precision vs. Recall.
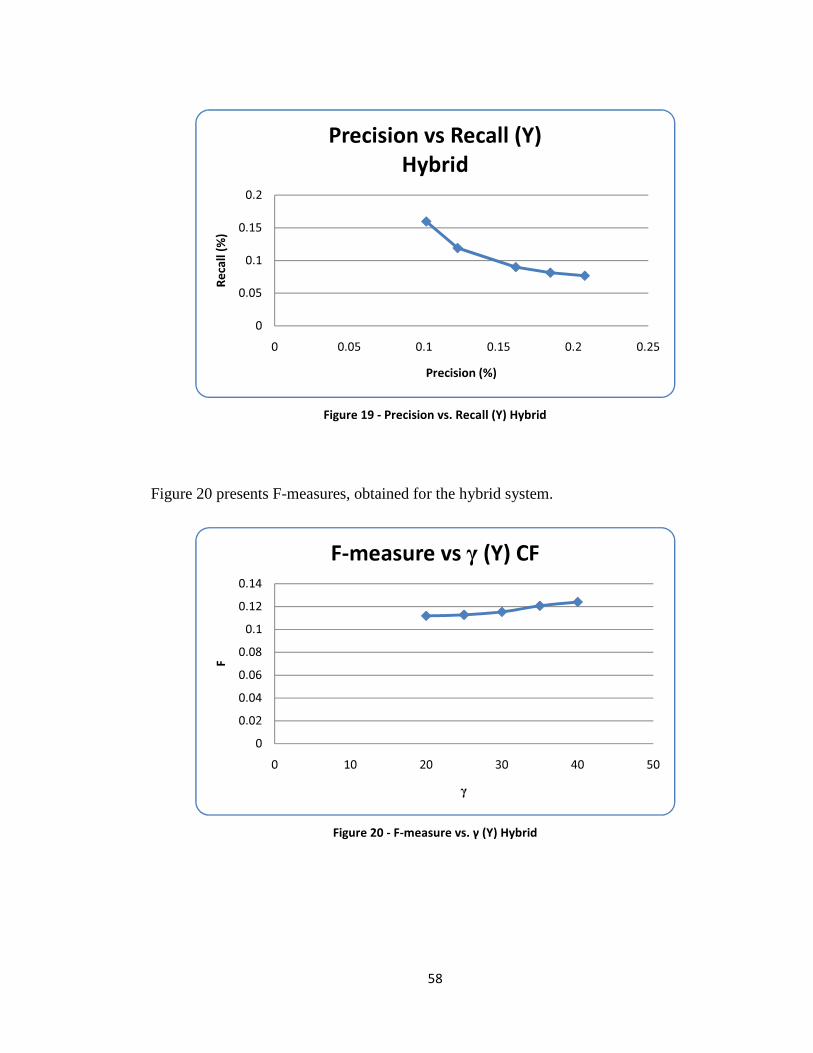
58
Figure 19 - Precision vs. Recall (Y) Hybrid
Figure 20 presents F-measures, obtained for the hybrid system.
Figure 20 - F-measure vs. γ (Y) Hybrid
0
0.05
0.1
0.15
0.2
0 0.05 0.1 0.15 0.2 0.25
Re
call
(%
)
Precision (%)
Precision vs Recall (Y)
Hybrid
0
0.02
0.04
0.06
0.08
0.1
0.12
0.14
0 10 20 30 40 50
F
γ
F-measure vs γ (Y) CF
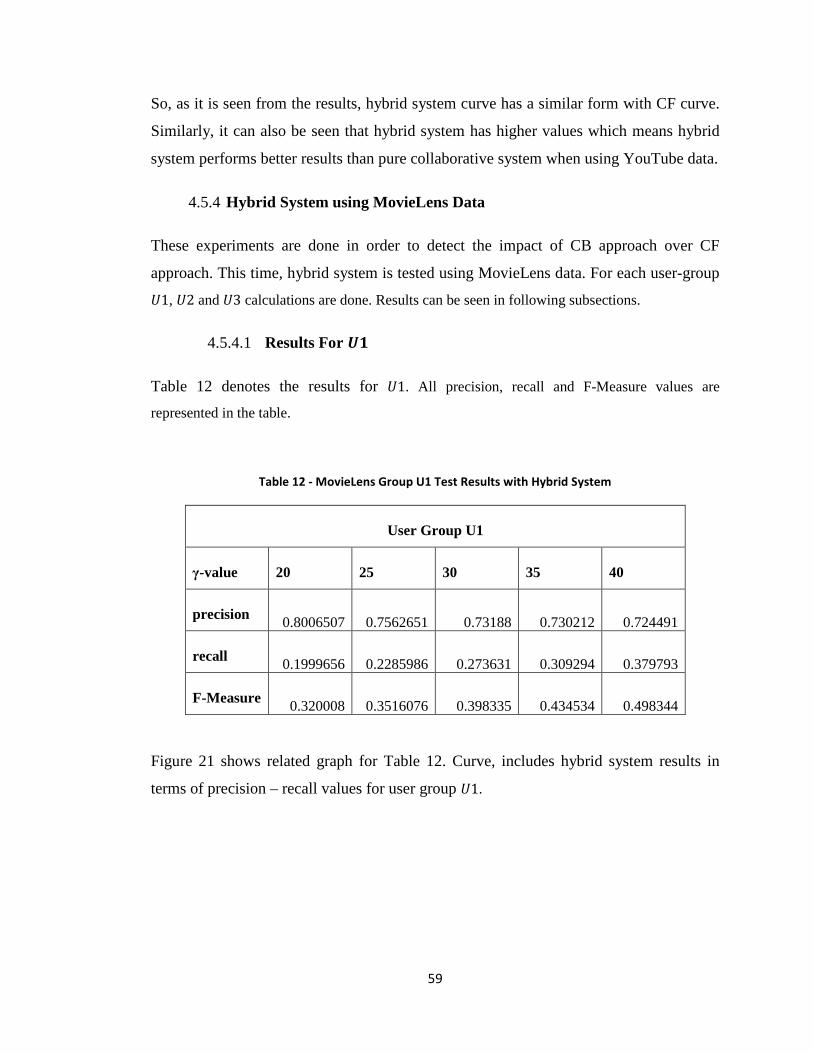
59
So, as it is seen from the results, hybrid system curve has a similar form with CF curve.
Similarly, it can also be seen that hybrid system has higher values which means hybrid
system performs better results than pure collaborative system when using YouTube data.
4.5.4 Hybrid System using MovieLens Data
These experiments are done in order to detect the impact of CB approach over CF
approach. This time, hybrid system is tested using MovieLens data. For each user-group
�1, �2 and �3 calculations are done. Results can be seen in following subsections.
4.5.4.1 Results For $)
Table 12 denotes the results for �1. All precision, recall and F-Measure values are
represented in the table.
Table 12 - MovieLens Group U1 Test Results with Hybrid System
User Group U1
γ-value 20 25 30 35 40
precision 0.8006507 0.7562651 0.73188 0.730212 0.724491
recall 0.1999656 0.2285986 0.273631 0.309294 0.379793
F-Measure 0.320008 0.3516076 0.398335 0.434534 0.498344
Figure 21 shows related graph for Table 12. Curve, includes hybrid system results in
terms of precision – recall values for user group �1.
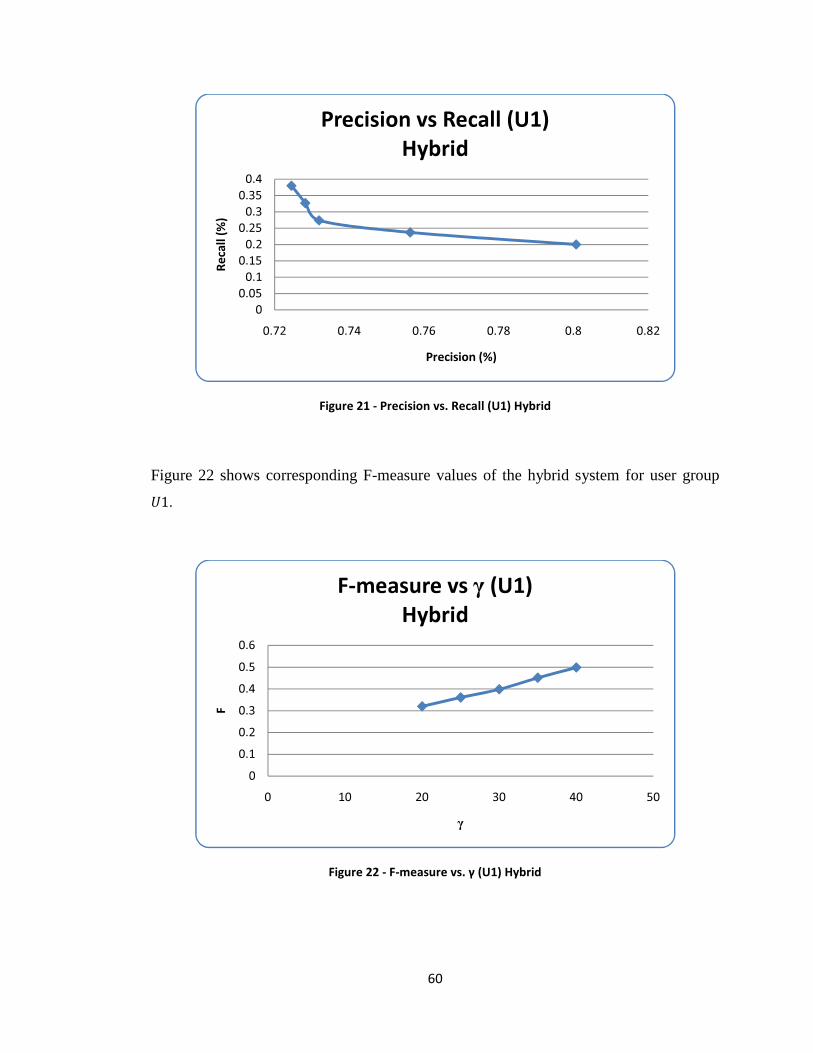
60
Figure 21 - Precision vs. Recall (U1) Hybrid
Figure 22 shows corresponding F-measure values of the hybrid system for user group
�1.
Figure 22 - F-measure vs. γ (U1) Hybrid
0
0.05
0.1
0.15
0.2
0.25
0.3
0.35
0.4
0.72 0.74 0.76 0.78 0.8 0.82
Re
call
(%
)
Precision (%)
Precision vs Recall (U1)
Hybrid
0
0.1
0.2
0.3
0.4
0.5
0.6
0 10 20 30 40 50
F
γ
F-measure vs γ (U1)
Hybrid
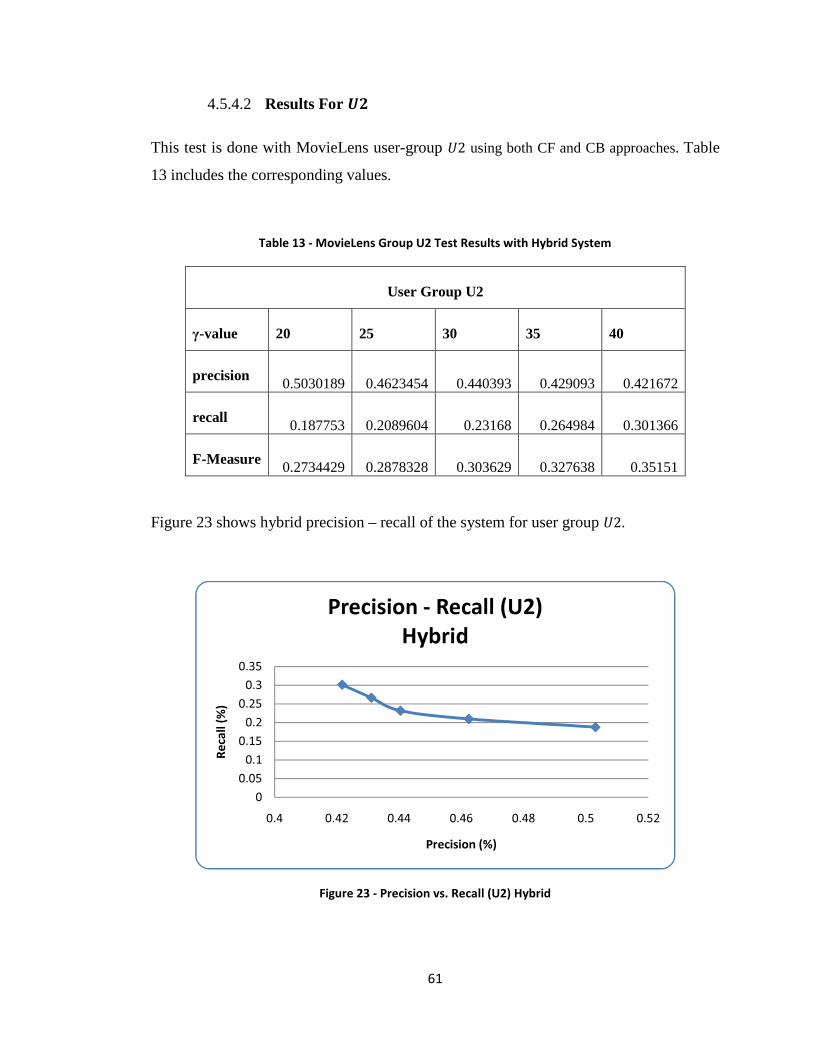
61
4.5.4.2 Results For $*
This test is done with MovieLens user-group �2 using both CF and CB approaches. Table
13 includes the corresponding values.
Table 13 - MovieLens Group U2 Test Results with Hybrid System
User Group U2
γ-value 20 25 30 35 40
precision 0.5030189 0.4623454 0.440393 0.429093 0.421672
recall 0.187753 0.2089604 0.23168 0.264984 0.301366
F-Measure 0.2734429 0.2878328 0.303629 0.327638 0.35151
Figure 23 shows hybrid precision – recall of the system for user group �2.
Figure 23 - Precision vs. Recall (U2) Hybrid
0
0.05
0.1
0.15
0.2
0.25
0.3
0.35
0.4 0.42 0.44 0.46 0.48 0.5 0.52
Re
call
(%
)
Precision (%)
Precision - Recall (U2)
Hybrid
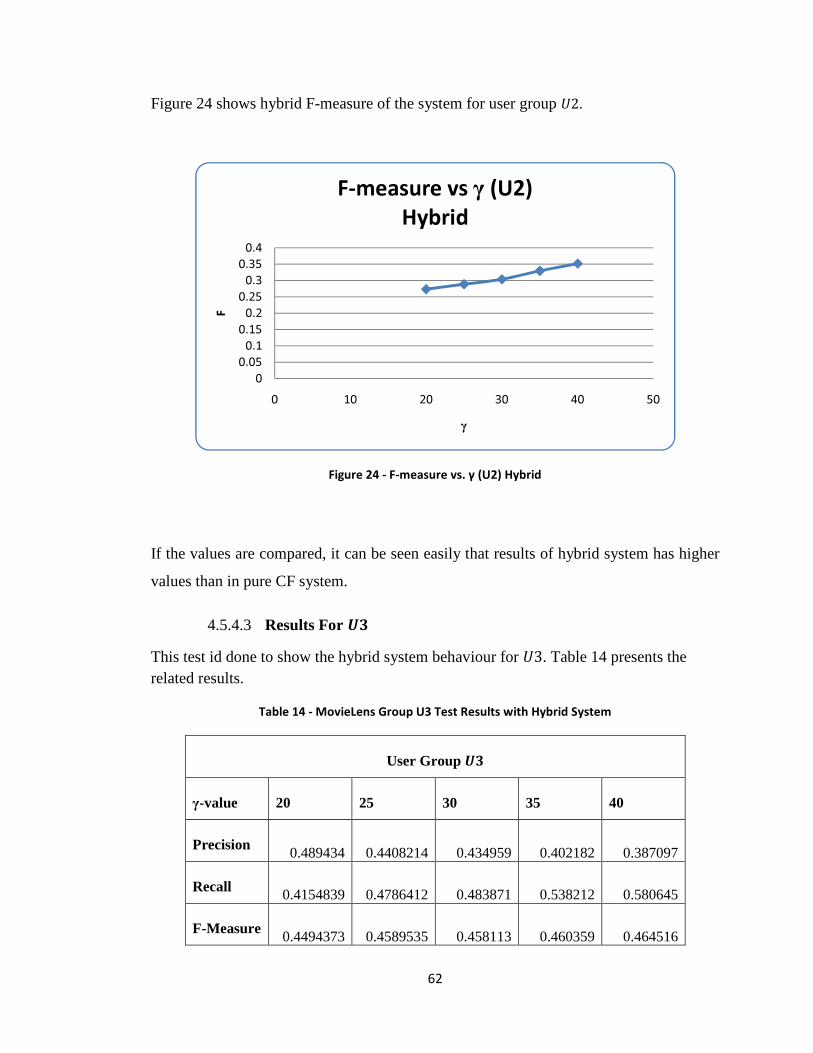
62
Figure 24 shows hybrid F-measure of the system for user group �2.
Figure 24 - F-measure vs. γ (U2) Hybrid
If the values are compared, it can be seen easily that results of hybrid system has higher
values than in pure CF system.
4.5.4.3 Results For $+
This test id done to show the hybrid system behaviour for �3. Table 14 presents the related results.
Table 14 - MovieLens Group U3 Test Results with Hybrid System
User Group �
γ-value 20 25 30 35 40
Precision 0.489434 0.4408214 0.434959 0.402182 0.387097
Recall 0.4154839 0.4786412 0.483871 0.538212 0.580645
F-Measure 0.4494373 0.4589535 0.458113 0.460359 0.464516
0
0.05
0.1
0.15
0.2
0.25
0.3
0.35
0.4
0 10 20 30 40 50
F
γ
F-measure vs γ (U2)
Hybrid
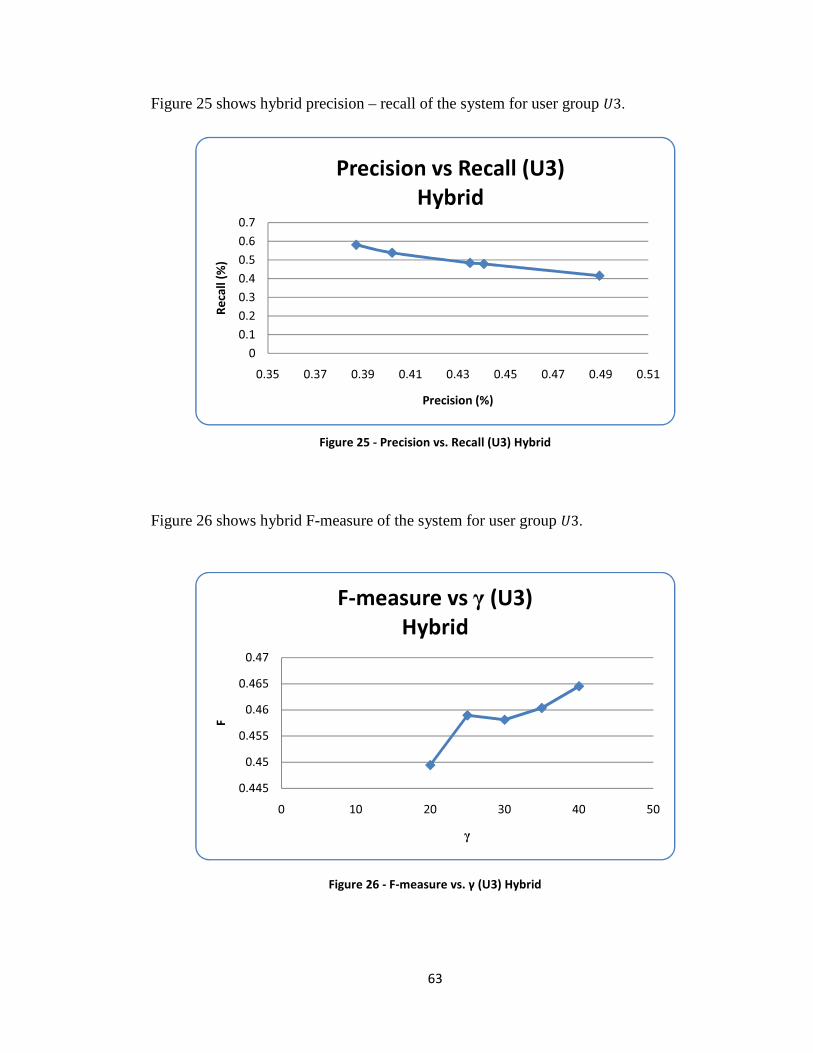
63
Figure 25 shows hybrid precision – recall of the system for user group �3.
Figure 25 - Precision vs. Recall (U3) Hybrid
Figure 26 shows hybrid F-measure of the system for user group �3.
Figure 26 - F-measure vs. γ (U3) Hybrid
0
0.1
0.2
0.3
0.4
0.5
0.6
0.7
0.35 0.37 0.39 0.41 0.43 0.45 0.47 0.49 0.51
Re
call
(%
)
Precision (%)
Precision vs Recall (U3)
Hybrid
0.445
0.45
0.455
0.46
0.465
0.47
0 10 20 30 40 50
F
γ
F-measure vs γ (U3)
Hybrid
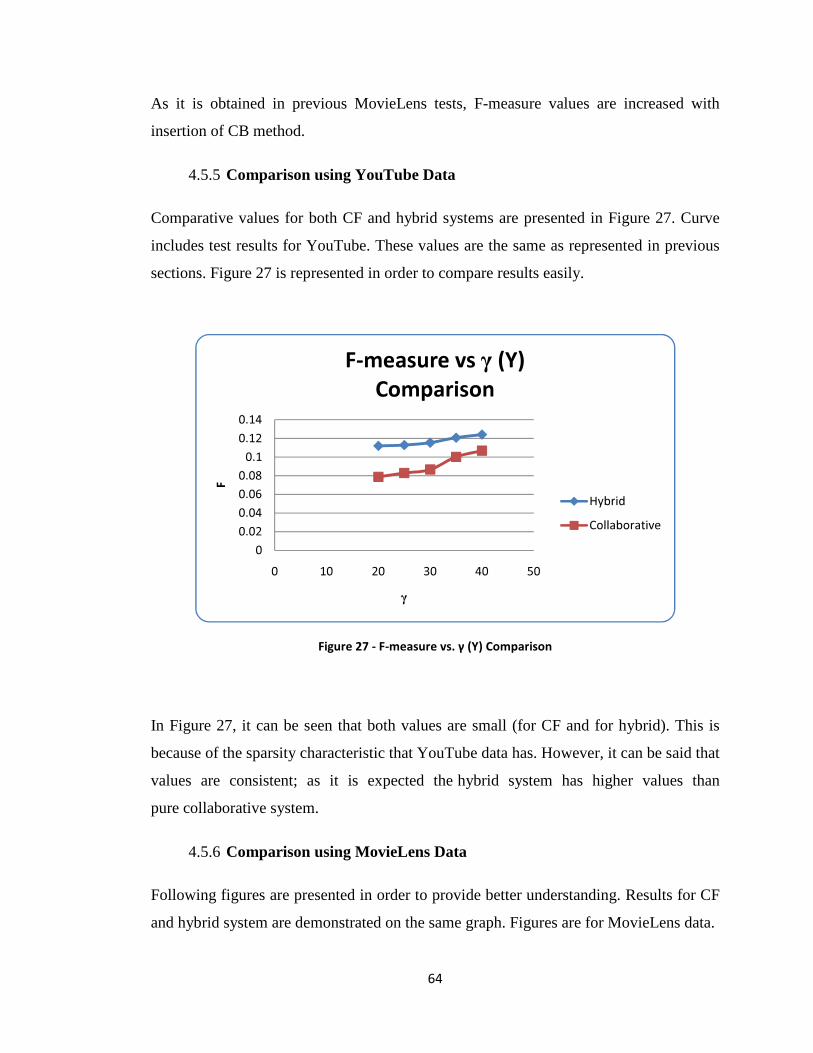
64
As it is obtained in previous MovieLens tests, F-measure values are increased with
insertion of CB method.
4.5.5 Comparison using YouTube Data
Comparative values for both CF and hybrid systems are presented in Figure 27. Curve
includes test results for YouTube. These values are the same as represented in previous
sections. Figure 27 is represented in order to compare results easily.
Figure 27 - F-measure vs. γ (Y) Comparison
In Figure 27, it can be seen that both values are small (for CF and for hybrid). This is
because of the sparsity characteristic that YouTube data has. However, it can be said that
values are consistent; as it is expected the hybrid system has higher values than
pure collaborative system.
4.5.6 Comparison using MovieLens Data
Following figures are presented in order to provide better understanding. Results for CF
and hybrid system are demonstrated on the same graph. Figures are for MovieLens data.
0
0.02
0.04
0.06
0.08
0.1
0.12
0.14
0 10 20 30 40 50
F
γ
F-measure vs γ (Y)
Comparison
Hybrid
Collaborative
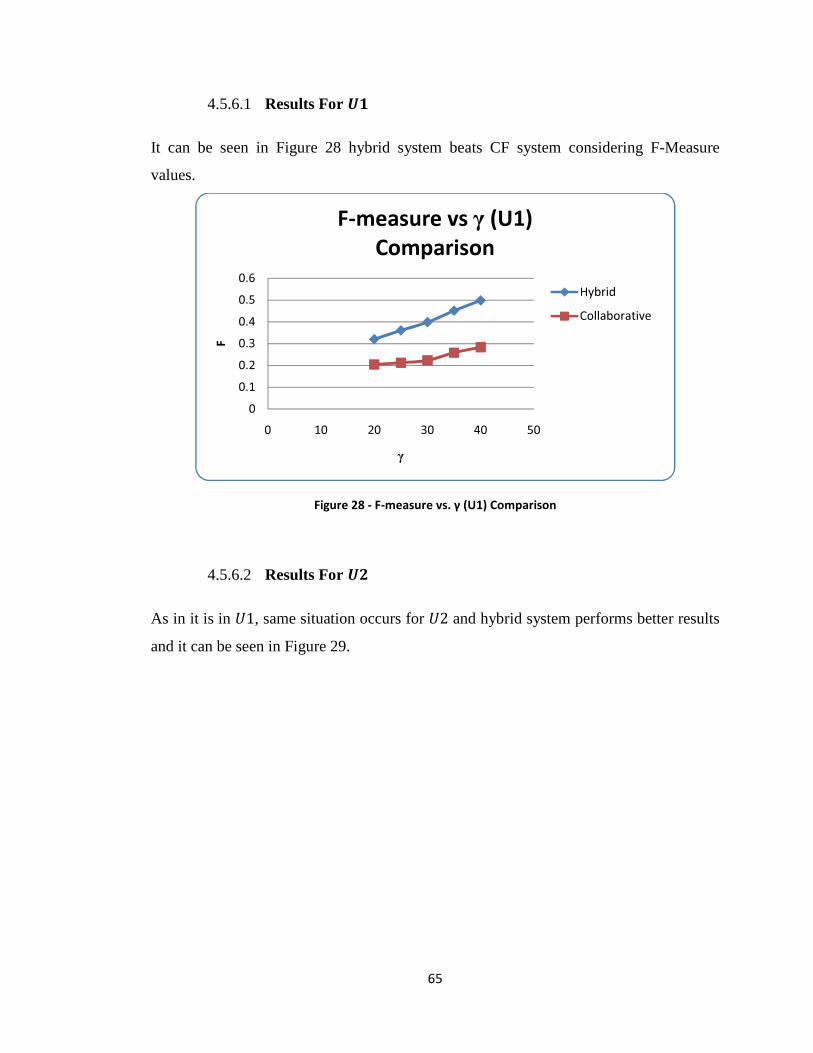
65
4.5.6.1 Results For $)
It can be seen in Figure 28 hybrid system beats CF system considering F-Measure
values.
Figure 28 - F-measure vs. γ (U1) Comparison
4.5.6.2 Results For $*
As in it is in �1, same situation occurs for �2 and hybrid system performs better results
and it can be seen in Figure 29.
0
0.1
0.2
0.3
0.4
0.5
0.6
0 10 20 30 40 50
F
γ
F-measure vs γ (U1)
Comparison
Hybrid
Collaborative
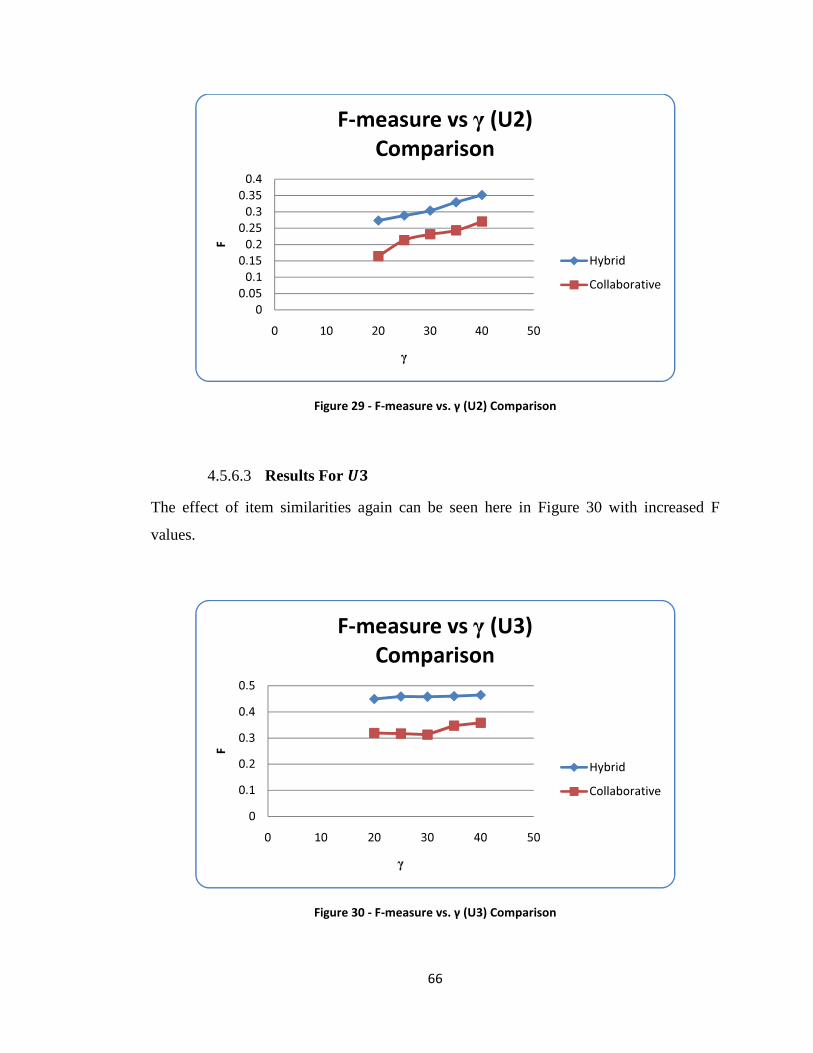
66
Figure 29 - F-measure vs. γ (U2) Comparison
4.5.6.3 Results For $+
The effect of item similarities again can be seen here in Figure 30 with increased F
values.
Figure 30 - F-measure vs. γ (U3) Comparison
0
0.05
0.1
0.15
0.2
0.25
0.3
0.35
0.4
0 10 20 30 40 50
F
γ
F-measure vs γ (U2)
Comparison
Hybrid
Collaborative
0
0.1
0.2
0.3
0.4
0.5
0 10 20 30 40 50
F
γ
F-measure vs γ (U3)
Comparison
Hybrid
Collaborative

67
In all figures, hybrid curves have higher values than CF curves. This means that more
accurate results are obtained by inserting CB approach in CF approach. So, it can be said
that considering item similarities and applying CB filtering approach improves result for
recommendation system.

68
CHAPTER 5
CONCLUSION AND FUTURE WORK
In this thesis, a hybrid recommendation system is presented. The system uses both
collaborative filtering and content-based recommendation techniques. Base is the
collaborative part in which a graph based algorithm called Adsorption is used. Content
information is retrieved from both IMDb and YouTube and this is used in order to
propose a better system.
The design, implementation and evaluation parts of the work are described in detail.
First Adsorption algorithm, which is a graph-based collaborative filtering algorithm, is
implemented. The implementation is done so that the collaborative filtering
recommendations are generated with both YouTube and MovieLens datasets. Secondly,
content based recommendation techniques are used. Enhancement is done on the
distribution list which is retrieved from the collaborative filtering. To make use of
content based approaches item-item similarities are found. According to the similarity
results new movies which are not included in the result of collaborative recommendation
are inserted to the list and recommended to the user.
Experiments are done and the effect of the hybrid system is evaluated. Results show that
the hybrid system has a better performance on recommendations than using pure
collaborative algorithm. It is also found out that system gives more successful results
when MovieLens dataset is used which means good results are obtained when the data is
not sparse.

69
The recommendation system proposed in this thesis works offline and makes offline
predictions. Considering video domain, the next step can be to integrate this system to
an online organization where users watch videos online.
The system gives better results when the data is not sparse. That is why results with
MovieLens data is better that YouTube. As a future work the system can be extended so
that even with sparse data the system can give more appropriate suggestions to users.
70
REFERENCES
[1] Recommendation Systems, http://en.wikipedia.org/wiki/Recommender_system, last accessed 30 August 2010.
[2] Gediminas Adomavicius, Alexander Tuzhilin, “Towards the Next Generation of Recommender Systems: A Survey of the State-of-the-Art and Possible Extensions” IEEE Transactions on Knowledge and Data Engineering, VOL. 17, NO.6, June 2005.
[3] Basu, C., Hirsh, H., Cohen W., “Recommendation as classification: Using social and content-based information in recommendation”, In Proceedings of the Fifteenth National Conference on Artificial Intelligence, 1998.
[4] Robin Burke, “Hybrid Recommender Systems: Survey and Experiments”, In User Modeling and User-Adapted Interaction, Vol. 12, No. 4. pp. 331-370, 2002.
[5] R. van Meteren, M. van Someren, “Using content-based filtering for recommendation.” In Proceedings of the Machine Learning in the New Information Age: ML- net/ECML2000 Workshop.
[6] L. Terveen, W. Hill, “Beyond Recommender Systems: Helping People Help Each Other”, In Carroll, J., (Ed.), HCI in the New Millennium. Addison Wesley, pp. 475-486, 2001.
[7] Gauch, S., Speretta, M., Chandramouli, A., Micarelli, A., “User Profiles for Personalized Information Access”, The Adaptive Web, pp. 54-89, 2007.
[8] Yoneya, T. and Mamitsuka, H., “PURE: A PubMed Article Recommendation System Based on Content-based Filtering”, In the Proceedings of the Seventh International Workshop on Bioinformatics and Systems Biology, pp. 267-276, 2007.
[9] PubMed, http://www.ncbi.nlm.nih.gov/pubmed/, last accessed on 30 August 2010.
71
[10] Shiu-li Huang, “Comparision of Utility-Based Recommendation Methods”, PACIS (Pacific Asia Conference on Information systems), 2008
[11] Rocchio, J. “Relevance Feedback in Information Retrieval. In: G. Salton (ed.). The SMART System: Experiments in Automatic Document Processing”, Prentice Hall, 1971.
[12] Miha Grcar, Dunja Miadenic, Blaz Fortuna, Marko Grobelnik, “Data sparsity issues in the collaborative filtering framework”, 7th International Workshop on Knowledge Discovery on the Web, 2005
[13] Rasna R. Walia, “Collaborative Filtering: A Comparison of Graph-Based Semi-Supervised Learning Methods and Memory-Based Methods”, 4th Annual International Conference on Computing and ICT Research - ICCIR, pp. 70-84, 2008.
[14] Badrul Sarwar, George Karypis, Joseph Konstan, and John Riedl, “ItemBased Collaborative Filtering Recommendation Algorithms”, In the Proceedings of the 10th international conference on World Wide Web, pp. 285 – 295, 2001.
[15] J. Ben Schafer, Dan Frankowski, Jon Herlocker, Shilad Sen, “Collaborative Filtering Recommender Systems”, The Adaptive Web, 2007.
[16] Goldberg D, Nichols, D., Oki, B.M., Terry, D. “Using Collaborative Filtering To Weave An Information Tapestry.” Communications of the ACM, vol. 35, pp. 61–70, 1992.
[17] Maltz D, Ehrlich, E. “Pointing The Way: Active Collaborative Filtering.” In Proceedings of ACM CHI'95 Conference on Human Factors in Computing Systems, ACM, pp. 202–209, 1995.
[18] Konstan, J.A., Miller, B., Maltz, D., Herlocker, J., Gordon, L., Riedl, J. “GroupLens: Applying Collaborative Filtering To Usenet News.” Communications of the ACM, vol. 40, pp. 77–87, 1997.
[19] Resnick, P., Iacovou, N., Suchak, M., Bergstrom, P., Riedl, J. “Grouplens: An Open Architecture For Collaborative Filtering Of Netnews.” In Proceedings of the ACM conference on Computer supported cooperative work. ACM Press pp. 175-186, 1994.
72
[20] Shardanand, U., Maes, P., “Social Information Filtering: Algorithms for Automating "Word of Mouth"”, ACM Press, pp. 210-217, 1995.
[21] Hill, W., Stead, L., Rosenstein, M., Furnas, G. “Recommending and Evaluating Choices in a Virtual Community of Use”, In Proceedings of ACM CHI'95 Conference on Human Factors in Computing Systems. ACM Press p. 194-201, 1995.
[22] Jonathan L. Herlocker, Joseph A. Konstan, John Riedl, “Explaining Collaborative Filtering Recommendations”, In the Proceedings of the ACM conference on Computer supported cooperative work, pp. 241 - 250, 2000.
[23] Anne Yun-An Chen, Dennis McLeod, “Collaborative Filtering for Information Recommendation Systems”, Encyclopedia of E-Commerce, E-Government, and Mobile Commerce, pp. 118-123, 2006.
[24] CDNow, http://en.wikipedia.org/wiki/CDNOW, last accessed on 30 August 2010.
[25] MovieLens, http://www.movielens.org/, last accessed on 30 August 2010
[26] Xiaojin Zhu, “Semi-Supervised Learning Literature Survey”, pp. 3-7, 2006.
[27] S. Baluja, R. Seth, D. Sivakumar, Y. Jing, J. Yagnik, S. Kumar, D. Ravichandran, M. Aly, “Video Suggestion and Discovery for YouTube: Taking Random Walks Through the View Graph”, In the Proceedings of WWW, 2008.
[28] YouTube, www.youtube.com, last accessed on 30 August 2010.
[29] Partha Pratim Talukdar, Koby Crammer, “New Regularized Algorithms for Transductive Learning”, Proceedings of the European Conference on Machine Learning and Knowledge Discovery in Databases: Part II, pp. 442 – 457, 2009.
[30] Olivier Chapelle, Bernhard Schölkopf, Alexander Zien “Introduction to Semi-Supervised Learning”, Semi-Supervised Learning, pp. 3-14, 2006.
[31] B. Krulwich, “Lifestyle finder: Intelligent user profiling using large-scale demographic data,” Artificial Intelligence Magazine, vol. 18, 1997
73
[32] Aïmeur, E., Brassard, G., Fernandez, J. M., Mani Onana, F. S., “Privacy preserving demographic filtering”, In the Proceedings of the ACM symposium on Applied computing, 2006.
[33] Billy Yapriady, Alexandra L. Uitdenbogerd, “Combining Demographic Data with Collaborative Filtering for Automatic Music Recommendation”, Knowledge-Based Intelligent Information and Engineering Systems, pp. 201-207, 2005.
[34] Przemyslaw Kazienko, Pawel Kolodziejsk, “Personalized Integration of Recommendation Methods for E-commerce”, Journal of Computer Science and Applications, vol. 3, 2006.
[35] Robin Burke, “Knowledge-based recommender systems”, In Encyclopedia of Library and Information Systems, Vol. 69, 2000
[36] Janusz Sobecki, “Implementations of Web-based Recommender Systems Using Hybrid Methods”, International Journal of Computer Science & Applications Vol. 3 Issue 3, pp 52 – 64, 2006.
[37] Claypool, M., Gokhale, A., Miranda, T., Murnikov, P., Netes, D. and Sartin, M. “Combining Content-Based and Collaborative Filters in an Online Newspaper”. In Proceedings of ACM SIGIR Workshop on Recommender Systems, 1999.
[38] Jiahui Liu, Peter Dolan, Elin Rønby Pedersen, “Personalized News Recommendation Based on Click Behavior”, In the Proceedings of the 14th international conference on Intelligent user interfaces, 2010.
[39] Mark Van Setten, “Supporting people in finding information, Hybrid recommender systems and goal-based structuring”, Telematica Instituut Fundamental Research Series, vol. 016, 2005.
[40] Xuan Nhat Lam, Thuc Vu, Trong Duc Le, Anh Duc Duong, “Addressing cold-start problem in recommendation systems”, In the Proceedings of the 2nd international conference on Ubiquitous information management and communication, 2008.
[41] Hilmi Yildirim, Mukkai S. Krishnamoorthy, “A Random Walk Method for Alleviating the Sparsity Problem in Collaborative Filtering”, In the Proceedings of the 2008 ACM conference on Recommender systems, 2008.
74
[42] Jason M. Adams, Paul N. Bennett, Anthony Tomasic, “Combining Personalized Agents to Improve Content-Based Recommendations”, CMU LTI Technical Report, 2007.
[43] Marko Balabanovic, Yoav Shoham, Fab, “content-based, collaborative recommendation.(Special Section: Recommender Systems)”, Communications of the ACM vol.40, pp. 66, 1997.
[44] Sheth, B., Maes, P., “Evolving agents for personalized information filtering”, In Proceedings of the 9th IEEE Conference on Artificial Intelligence for Applications, 1993.
[45] Zeinab Abbassi, Sihem Amer-Yahia, Laks V.S. Lakshmanan, Sergei Vassilvitskii, Cong Yu, “Getting Recommender Systems to Think Outside the Box”, In the Proceedings of the third ACM conference on Recommender systems, pp. 285-288, 2009.
[46] Wang, Y., Stash, N., Aroyo, L., Hollink, L. and Schreiber, G., “Using Semantic Relations for Content-based Recommender Systems in Cultural Heritage”, Workshop on Ontology Patterns (WOP) at International Semantic Web Conference (ISWC), October, 2009.
[47] Yiwen Wang , Natalia Stash , Lora Aroyo , Laura Hollink , Guus Schreiber, “Semantic Relations in Content-based Recommender Systems”, Proc. 5th International Conference on Knowledge Capture (K-CAP 2009), September 1-4, 2009, Redondo Beach, CA, pages 209-210. ACM, 2009.
[48] Blanco-Fernandez, Y., Pazos-arias, J., Gil-Solla, A., Ramos-Cabrer, M., Lopez-Nores, M., “Providing Entertainment by Content-based Filtering and Semantic Reasoning in Intelligent Recommender Systems”, IEEE Transactions on Consumer Electronics, 2008.
[49] Guy Shani, Asela Gunawardana, “Evaluating Recommendation Systems”, http://research.microsoft.com, 2009.
[50] MySQL, http://www.mysql.com/, last accessed on 30 August 2010.
[51] JPA, http://www.jcp.org/en/jsr/detail?id=317, last accessed on 30 August 2010.
75
[52] JPQL, http://download.oracle.com/docs/cd/E16340_01/apirefs.1111/e13946/ejb3_langref.html, last accessed on 30 August 2010.
[53] Gozde Ozbal, “A Content Boosted Collaborative Filtering Approach for Movie Recommendation Based on Local & Global User Similarity and Missing Data Prediction” Master Thesis, Middle East Technical University, 2009.
[54] Hilal Karaman, “A Content Based Movie Recommendation System Empowered By Collaborative Missing Data Prediction” Master Thesis, Middle East Technical University, 2010.
[55] YouTube API, http://code.google.com/apis/youtube/, last accessed 30 August 2010.
[56] Eclipse, http://www.eclipse.org/, last accessed 30 August 2010.
[57] Google Accounts, https://www.google.com/accounts/, last accessed 30 August 2010.
[58] Souvik Debnath, Niloy Ganguly, Pabitra Mitra, “Feature weighting in content based recommendation system using social network analysis,” WWW, 2008.
[59] Yan, T.W. and H. Garcia-Molina: 1995, ‘SIFT—A Tool for Wide-Area Information Dissemination’. In: Proceedings of the 1995 USENIX Technical Conference. pp. 177–186.
[60] D.W. Oard, “The state of the art in text filtering,” User Modeling and User-Adapted Interaction, Vol. 7, No. 3, pp. 141–178, 1997.
[61] Seung-Taek Park, David M. Pennock, Applying Collaborative Applying Collaborative Filtering Techniques to Movie Search for Better Ranking and Browsing, 2007, ACM, KDD’07.
[62] Prem Melville, Raymond J. Mooney, Ramadass Nagarajan, “Content-Boosted Collaborative Filtering for Improved Recommendations”, 2002, AAAI
76
[63] Bamshad Mobasher, “Recommender Systems”, Kunstliche Intelligenz, Special Issue on Web Mining. No. 3, PP. 41-43, 2007.
[64] C. J. van Rijsbergen, “Information Retrieval”. London; Boston. Butterworth, 2nd Edition 1979
[65] Donna Harman, Gerald Candela, “Retrieving Records from a Gigabyte of Text on a Minicomputer Using Statistical Ranking”, Journal of the American Society for Information Science, December 1990
[66] Zan Huang, Wingyan Chung, Hsinchun Chen, “A Graph Model for E-Commerce Recommender Systems”, Journal of the American Society for Information Science and Technology, 2004
[67] Charu C. Aggarwal, Joel L. Wolf, Kun-Lung Wu, Philip S. Yu, “Horting hatches an egg: A new graph-theoretic approach to collaborative filtering”, Proceedings of the fifth ACM SIGKDD international conference on Knowledge discovery and data mining, 1999
[68] M. Deshpande, G. Karypis, “Item-Based Top-N Recommendation Algorithms”, ACM Transactions on Information Systems, Vol. 22, No. 1, January 2004, Pages 143–177.