Embed Size (px)
Citation preview
R E S E A R C H P R O G R A M S
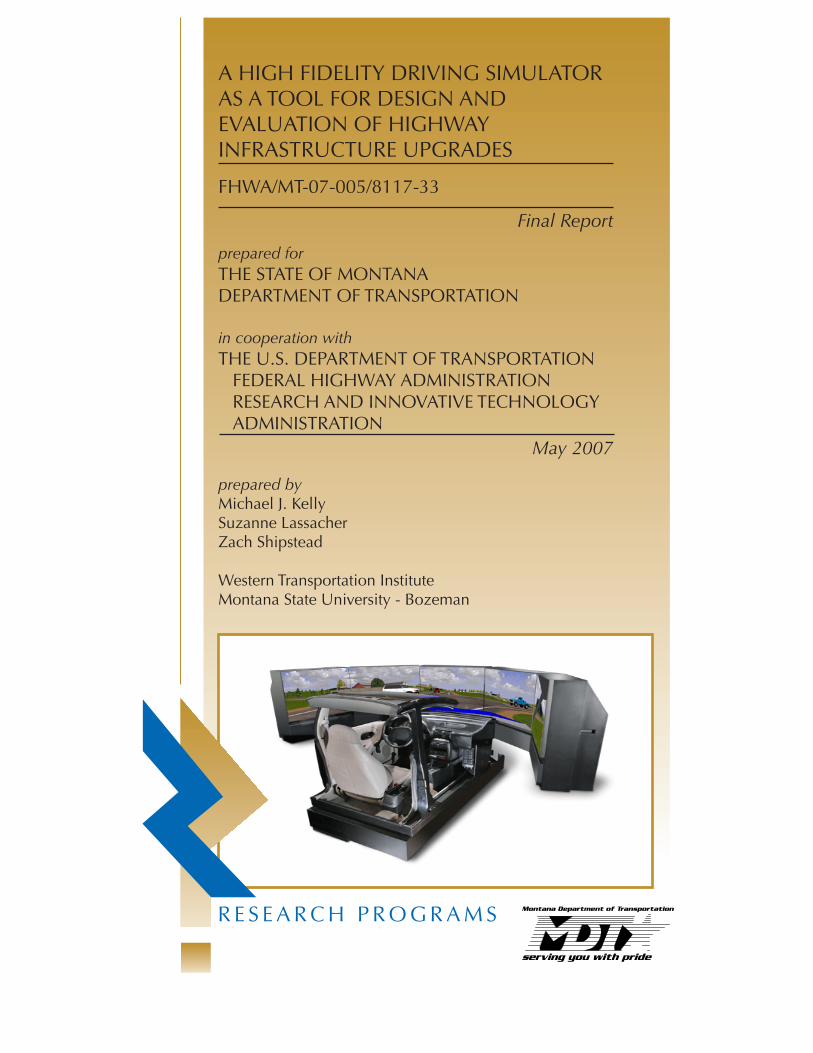
A HIGH FIDELITY DRIVING SIMULATOR AS A TOOL FOR DESIGN AND EVALUATION OF HIGHWAY INFRASTRUCTURE UPGRADES
Final Report
prepared forTHE STATE OF MONTANADEPARTMENT OF TRANSPORTATION
in cooperation withTHE U.S. DEPARTMENT OF TRANSPORTATION
FEDERAL HIGHWAY ADMINISTRATIONRESEARCH AND INNOVATIVE TECHNOLOGYADMINISTRATION
May 2007
prepared byMichael J. KellySuzanne LassacherZach Shipstead
Western Transportation InstituteMontana State University - Bozeman
FHWA/MT-07-005/8117-33

You are free to copy, distribute, display, and perform the work; make derivative works; make commercial use of the work under the condition that you give the original author and sponsor credit. For any reuse or distribution, you must make clear to others the license terms of this work. Any of these conditions can be waived if you get permission from the sponsor. Your fair use and other rights are in no way affected by the above.
A HIGH FIDELITY DRIVING SIMULATOR AS A TOOL FOR DESIGN
AND EVALUATION OF HIGHWAY INFRASTRUCTURE UPGRADES
by
Michael J. Kelly, PhD, CPE
Senior Research Scientist
Suzanne Lassacher
Research Associate
Zach Shipstead
Graduate Research Assistant
Western Transportation Institute
College of Engineering
Montana State University
A report prepared for the
MONTANA DEPARTMENT OF TRANSPORTATION
in cooperation with the
U.S. DEPARTMENT OF TRANSPORTATION
FEDERAL HIGHWAY ADMINISTRATION
May 2007
High Fidelity Driving Simulator Technical Report Documentation Page
Western Transportation Institute ii
TECHNICAL REPORT DOCUMENTATION PAGE
1. Report No. FHWA/MT-07-005/8117-33 2. Government Accession No. 3. Recipient's Catalog No.
5. Report Date May 2007 4. Title and Subtitle A High Fidelity Driving Simulator as a Tool for Design and Evaluation of Highway Infrastructure Upgrades 6. Performing Organization Code
414030
7. Author(s)
Michael J. Kelly, Suzanne Lassacher, Zach Shipstead
8. Performing Organization Report No.
10. Work Unit No. 9. Performing Organization Name and Address Western Transportation Institute Montana State University Bozeman, MT 59717-4250
11. Contract or Grant No. 8117-33
13. Type of Report and Period Covered
Final Report May 2006 – January 2007
12. Sponsoring Agency Name and Address Research Programs Montana Department of Transportation 2701 Prospect Avenue PO Box 201001 Helena MT 59620-1001
14. Sponsoring Agency Code 5401
15. Supplementary Notes Research performed in cooperation with the Montana Department of Transportation and the US Department of Transportation, Federal Highway Administration. This report can be found at http://www.mdt.mt.gov/research/projects/safety/high_fidelity/final_report.pdf.
16. Abstract
A rapid prototyping approach was used in the driving simulation laboratory at the Western Transportation Institute (WTI) to simulate approximately 22 miles of US 191 between the Big Sky Resort community and the northern mouth of the Gallatin Canyon. Custom roadway tiles for the simulation were designed and programmed from The Montana Department of Transportation (MDT) “as built” plans for the highway, topographic maps, and video taken from a vehicle driving the route. The simulations may be used to help the MDT develop and refine safety countermeasures for that roadway. The primary benefit of the visualization and rapid prototyping approach using interactive, immersive simulators is that it provides an opportunity for formative evaluation, allowing engineers to refine the design at an early stage in the system development process before significant resources are invested in the deployment.
As a demonstration and evaluation of the technology, a study of driver response to speed limits posted on virtual dynamic message signs over the roadway was conducted. Such signs may be used to post speed limits that vary according to road conditions. Drivers were tested with posted speed limits of 50 MPH, 60 MPH, and in a control condition with no posted limits. There was little difference in driving behavior between drivers with no posted limits and those with a 60 MPH limit posted. Drivers with a posted 50 MPH limit reduced their speeds by approximately 6 MPH. Drivers with the 50 MPH limit also showed decreased variation in lane position (i.e., fewer and/or smaller deviations from center of lane).
17. Key Words Visualization, Driving Simulation, Variable Speed Limits
18. Distribution Statement Unrestricted. This document is available through the National Technical Information Service, Springfield, VA 21161.
19. Security Classif. (of this report) Unclassified
20. Security Classif. (of this page)
Unclassified
21. No. of Pages 27
22. Price
High Fidelity Driving Simulator Metric Conversion Chart
Western Transportation Institute Page iii
METRIC CONVERSION CHART
High Fidelity Driving Simulator Disclaimer
DISCLAIMER This document is disseminated under sponsorship of the Montana Department of Transportation and the United States Department of Transportation in the interest of information exchange. The State of Montana and the United States Government assume no liability of its contents or use thereof.
The contents of this report reflect the views of the authors, who are responsible for the facts and accuracy of the data presented herein. The contents do not necessarily reflect the official policies of the Montana Department of Transportation or the United States Department of Transportation.
The State of Montana and the United States Government do not endorse products or manufacturers. Trademarks or manufacturers' names appear herein only because they are considered essential to the object of this document.
This report does not constitute a standard, specification, or regulation.
ALTERNATE FORMAT STATEMENT The Montana Department of Transportation attempts to provide reasonable accommodations for any known disability that may interfere with a person participating in any service, program, or activity of the Department. Alternative accessible formats of this document will be provided upon request. For further information, call (406)444-7693, TTY (800)335-7592, or Montana Relay at 711
.
Western Transportation Institute Page iv
High Fidelity Driving Simulator Acknowledgements
ACKNOWLEDGEMENTS The work was performed under Contract 8117-33 between the State of Montana, Department of Transportation and the Montana State University. Ms. Susan Sillick served as the project's technical monitor.
The project was also supported by the United States Department of Transportation Research and Innovative Technology Administration.
Western Transportation Institute Page v
High Fidelity Driving Simulator Table of Contents
TABLE OF CONTENTS 1. Introduction..............................................................................................................................1
1.1. The Safety Challenge...................................................................................................... 1
1.2. Interactive Visualization for Countermeasure Design.................................................... 3
2. Methodology............................................................................................................................5
2.1. The Western Transportation Institute Driving Simulation Laboratory........................... 5
2.2. Creating a Simulated World............................................................................................ 6
2.3. Creating the US 191 Simulator World............................................................................ 7
2.4. Evaluation of Variable Speed Limit Signs...................................................................... 9
2.5. Testing........................................................................................................................... 10
2.5.1. Participants............................................................................................................ 10
2.5.2. Procedures............................................................................................................. 10
3. Results....................................................................................................................................12
3.1. Participant Completion Rate ......................................................................................... 12
3.2. Driving Speeds.............................................................................................................. 12
3.3. Driving Precision .......................................................................................................... 13
3.4. Learning Effects............................................................................................................ 14
4. Conclusions and Recommendations ......................................................................................16
4.1. Simulator Adaptation Syndrome................................................................................... 16
4.2. Driver Sampling............................................................................................................ 16
4.3. DMS Sign Messages ..................................................................................................... 17
4.4. Tile Limitations............................................................................................................. 17
4.5. Contracted Versus In-house Tile and Entity Development .......................................... 18
4.6. Effectiveness of the Simulation Approach ................................................................... 18
5. References..............................................................................................................................19
Western Transportation Institute Page vi
High Fidelity Driving Simulator List of Figures
LIST OF FIGURES Figure 1: The Gallatin Canyon Area (courtesy Google Imagery). ................................................. 1
Figure 2: A 35 MPH Bridge over Gallatin River (courtesy Google Imagery). .............................. 2
Figure 3: Typical Roadway Section (courtesy Google Imagery). .................................................. 2
Figure 4: Artist’s Conception of the Driving Simulator. ................................................................ 5
Figure 5: Entering 35 MPH Bridge (Actual). ................................................................................. 8
Figure 6: Entering 35 MPH Bridge (Visualization)........................................................................ 8
Figure 7: Entering 35 MPH Bridge in Foggy Weather (Visualization)......................................... 8
Figure 8: Simulated DMS Sign....................................................................................................... 9
Figure 9: Speeds Driven on Road Geometry Types at Three Posted Speed Limits. .................... 12
Figure 10: Comparison Between Simulator Speeds and Spot Speed Study Speeds..................... 13
Figure 11: Deviation from Lane Center at Three Posted Speed Limits....................................... 14
Figure 12: Speeds on Drive 1 and Drive 2.................................................................................... 15
Figure 13: Mean Deviation (absolute feet) From Centerline........................................................ 15
Western Transportation Institute Page vii
High Fidelity Driving Simulator Executive Summary
EXECUTIVE SUMMARY US Highway 191 in southwestern Montana has been identified as the location of a number of crash clusters. While the long-term historic crash rate is not significantly greater than that for similar highways with similar traffic densities, the crashes that do happen tend to receive great visibility. Because of the roadway geometry and the lack of practical alternative routes, crashes and incidents in this area have a disproportionate impact on transportation in this heavily traveled corridor.
A rapid prototyping approach was used in the driving simulation laboratory at the Western Transportation Institute (WTI) to simulate approximately 22 miles of US 191 between the Big Sky Resort community and the northern mouth of the Gallatin Canyon. Custom roadway tiles for the simulation were designed and programmed from MDT’s “as built” plans for the highway, topographic maps, and video taken from a vehicle driving the route. The simulations may be used to help the Montana Department of Transportation (MDT) develop and refine safety countermeasures for that roadway.
Projected safety-related system deployments such as dynamic message signs and revised delineation can be electronically simulated on a geo-typical roadway. MDT engineers can “drive the roadway” to examine the impacts of prototype deployments. A sample of drivers can drive the scenarios to test the effectiveness of deployments. If changes in the systems are suggested, the simulation can be easily altered to represent the new specifications and the refinements.
The primary benefit of the visualization and rapid prototyping approach using interactive, immersive simulators is that it provides an opportunity for formative evaluation, allowing engineers to refine the design at an early stage in the system development process before significant resources are invested in the deployment. The proposed system hardware and operations are all produced by computer graphics for a very small fraction of the cost of the actual deployment. Changes at this point may involve only a “click and drag” operation on a computer interface, changing one image for another, switching JPEG images of signs, or selecting alternative commands. By evaluating and refining the deployment early in the process, considerable time and money can be saved if changes need to be made to achieve the desired traffic objectives.
As a demonstration and evaluation of the technology, a study of driver response to speed limits posted on dynamic message signs over the roadway was conducted. Such signs are used in some states (e.g., Washington) to post speed limits that vary according to road conditions. Samples of drivers were tested with posted speed limits of 50 MPH, 60 MPH, and a control condition with no posted limits. There was little difference in driving behavior between drivers with no posted limits (85th percentile speed = 53.15 MPH) and those with a 60 MPH (85th percentile speed = 53.65 MPH) limit posted. Drivers with a posted 50 MPH limit reduced their speeds by approximately 6 MPH (85th percentile speed = 47.65 MPH). Drivers with the 50 MPH limit also showed decreased variation in lane position (i.e., fewer and/or smaller deviations from center of lane).
Western Transportation Institute Page viii
High Fidelity Driving Simulator Introduction
1. INTRODUCTION
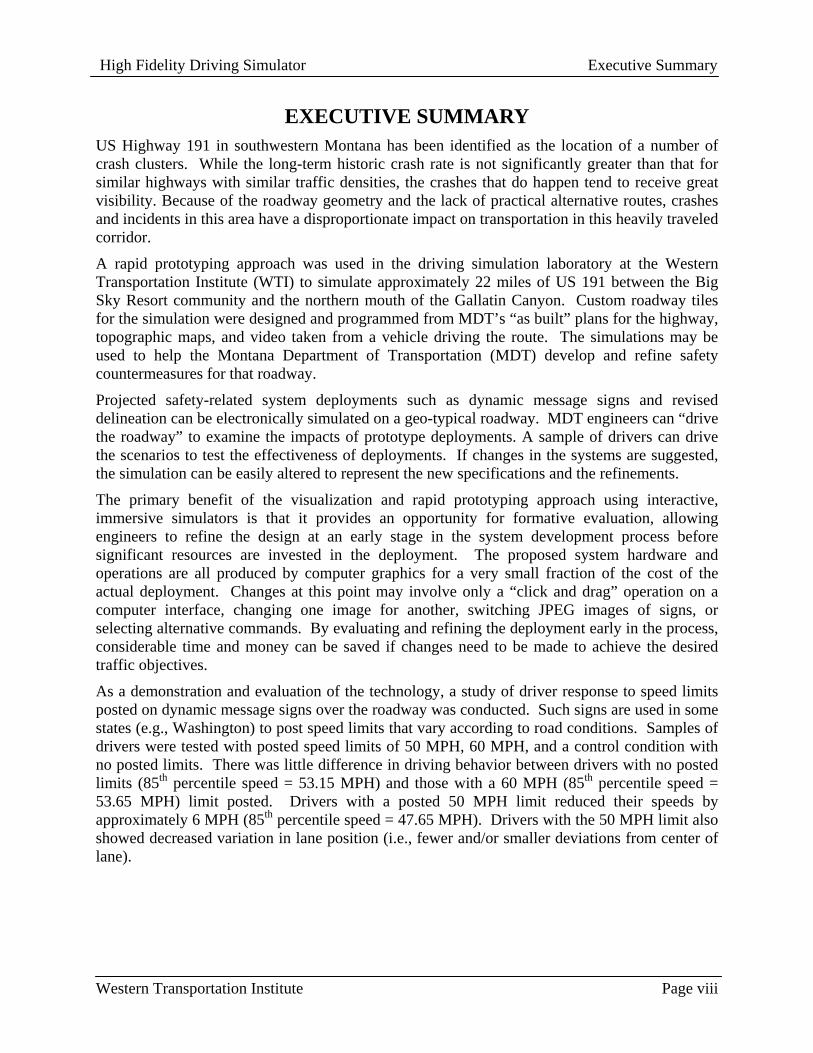
1.1. The Safety Challenge US 191 in Southwestern Montana is the primary route to the west entrance of Yellowstone National Park as well as a major transportation corridor between Montana and Idaho. The 25-mile Gallatin Canyon section of US 191 between Bozeman and Big Sky is a scenic mountain highway characterized by frequent sharp curves and a narrow right-of-way constrained by canyon walls and a major river. A large percentage of drivers are unfamiliar with the highway and with safe driving speeds at given locations and under different weather conditions. Crashes are frequently attributed to distracted drivers watching wildlife, whitewater rafters, or the scenery.
Traffic flow is marked by a significant speed variance with limited opportunities for passing slow-moving trucks and recreational vehicles. Development of the community and ski resort of Big Sky has greatly increased traffic with significant numbers of trucks carrying building supplies and carloads of construction and service workers moving between Bozeman and Big Sky. Weather and road conditions are unpredictable and frequently include ice on bridges and in shaded areas. Drivers unfamiliar with the road may exceed safe speeds in the short radius curves. Figure 1 shows an aerial photo of the whole Gallatin Canyon area north of Big Sky including US 191 and the surrounding terrain.
Figure 1: The Gallatin Canyon Area (courtesy Google Imagery).
Western Transportation Institute 1
High Fidelity Driving Simulator Introduction
During 2006, this section of highway experienced a spike in fatal traffic crashes that was substantially higher than the long-term crash experience on that roadway. While this spike in fatalities is probably an aberration when compared with the historical crash rate, it does signal a reason for concern. Projections suggest that the traffic and safety challenges will only worsen in the future years due to continued development of a major residential and business area adjacent to Big Sky.
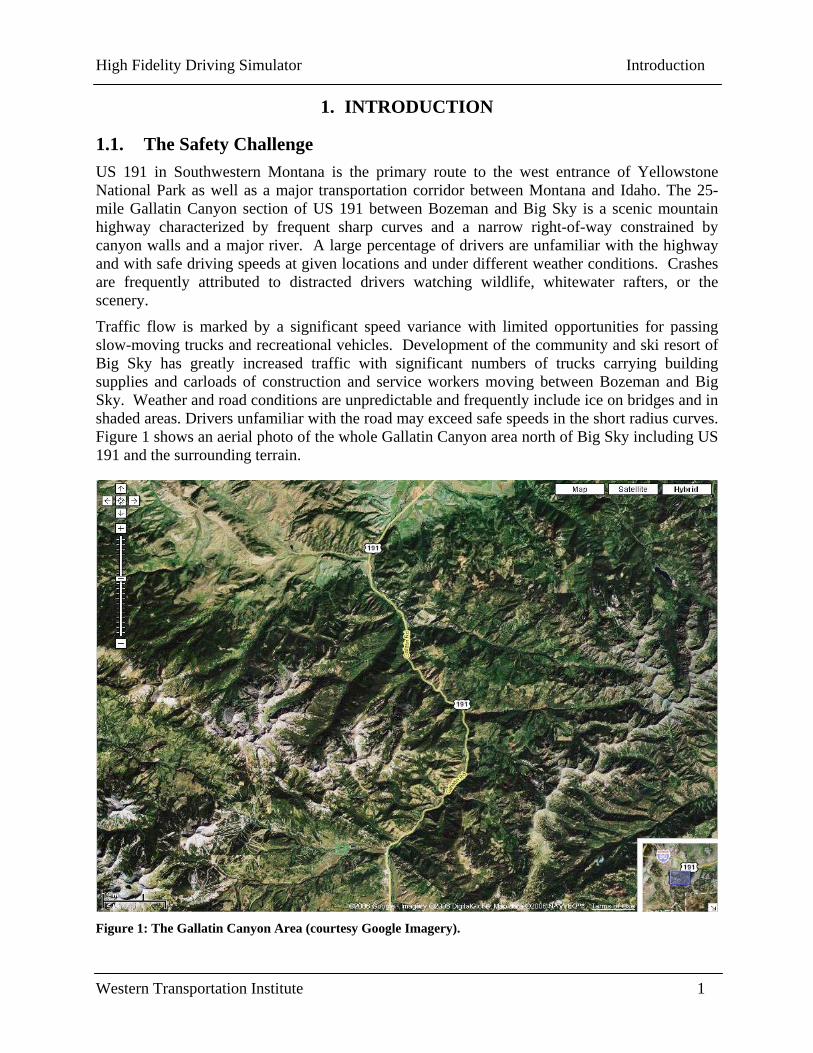
Figures 2 and 3 show aerial views of specific areas of the highway to show the kinds of terrain and roadway geometry that are common. Figure 2 shows the region of a bridge over the Gallatin River in which there is an advisory speed limit of 35 MPH. The roadway north of the bridge overlooks a center of whitewater rafting activity and often has parked cars and pedestrians on or adjacent to the roadway. South of the bridge, the southbound driver passes from an area of bright sunlight into a heavily forested area with deep shadows. Visual adaptation to the illumination transients creates potential problems. Figure 3 shows a typical section of the highway with the river immediately west of the road and numerous curves winding through the forested mountains
Figure 2: A 35 MPH Bridge over Gallatin River (courtesy Google Imagery).
Figure 3: Typical Roadway Section (courtesy Google Imagery).
Western Transportation Institute 2
High Fidelity Driving Simulator Introduction
Most of the roadway is posted with a 60 MPH speed limit, but with advisory speeds of 45 MPH and even 35 MPH in some of the areas with short radius curves and limited sight distance. Enforcement of safe driving speeds is a challenge. Because of the nature of the roadway, there are few areas in which law enforcement officers can stop to measure traffic speeds or to pull over and ticket violators. The use of photographic speed enforcement has been discussed but it would require legislative action and there is little evidence of its long-term effectiveness in controlling speeds. Voluntary compliance with safe speeds for existing driving conditions becomes a key.
1.2. Interactive Visualization for Countermeasure Design A number of high-profile crashes have suggested the need for improved travel advisories and warning information for drivers to reinforce the voluntary compliance. Curve speed warning systems, variable speed limits, upgraded lane delineation, and real-time road condition alerts including icy road warnings are all candidate countermeasures. The efficacy of these deployments on US 191 needs to be tested before expensive installations of these systems are made.
One approach to this problem is the application of visualization or a high fidelity immersive driving simulation to evaluate potential countermeasures. Simulation of improvements in transportation vehicles, routing, information sources, and procedures is a time-tested way to “get it right” before committing to a final plan and deployment. In aviation, rapid prototyping of cockpit displays, layouts, and procedures, using medium fidelity simulation and inputs from aircrew members, is a required step in systems development. The approach is becoming more widely used with marine and railroad engine control/display development. It is also widely employed in the design of user interfaces to complex software systems.
Computer simulation and rapid prototyping of highway transportation system upgrades and improvements is not a unique approach. Computer-based visualization has been used to provide demonstrations for construction projects. Highly realistic images of a proposed roadway, bridge, or other structure are computer-generated. These are usually still photos although applications of interactive virtual reality systems are increasingly used. The images are often used to demonstrate to stakeholders how a proposed road or structure will appear. In some cases, the computer-generated photos are used to evaluate potential line of sight, visibility, and safety of intersection configurations and other elements.
Approaches using an interactive driving simulator for prototyping and evaluation of large projects have been attempted and found successful. During construction of the Boston Central Artery project, for example, a potential problem was perceived with the location of routing and exit signs in the low ceilings, curves, and grade changes of the tunnels. The University of Massachusetts was contracted to use a driving simulator to simulate the tunnels and evaluate whether the signs could be seen and used (Upchurch, et al., 2002). In the evaluation, it was discovered that some of the signs had to be relocated because they could not be seen and read in time for the driver to safely move into the exit lane. A similar approach was then used to evaluate routing signs above ground in the vicinity of Logan International Airport.
Using the Highway Driving Simulator, the U.S. Federal Highway Administration has worked with the Missouri Department of Transportation to develop an interactive simulation of a newly designed freeway interchange (Granda, 2006). The simulator allowed the engineers to evaluate and refine design features of the structure and traffic controls before the new interchange was
Western Transportation Institute 3
High Fidelity Driving Simulator Introduction
built. The wrap-around visual displays allowed the individual designers to drive through their designs and the design team to walk into the virtual world and discuss potential changes.
To assist in evaluating potential safety countermeasures for the Gallatin Canyon corridor of US 191, WTI has developed an immersive simulation of that roadway that may be used to visualize and evaluate the effects of those countermeasures on driver behavior and safety. The simulation uses the high fidelity WTI driving simulation laboratory. It allows highway engineers and members of the driving public to drive a representation of that roadway to determine whether specific safety countermeasures will influence the drivers’ behavior toward safer driving performance.
.
Western Transportation Institute 4
High Fidelity Driving Simulator Methodology
2. METHODOLOGY
2.1. The Western Transportation Institute Driving Simulation Laboratory WTI’s Driving Simulation Laboratory is centered on a DriveSafety 500C fixed base simulator in a light and sound controlled 35 square meter room. An adjacent office is used for subject reception, briefing, and data analysis. Adjacent to these rooms is a 100 square meter room designed to house a future motion-based multi-cab simulator.
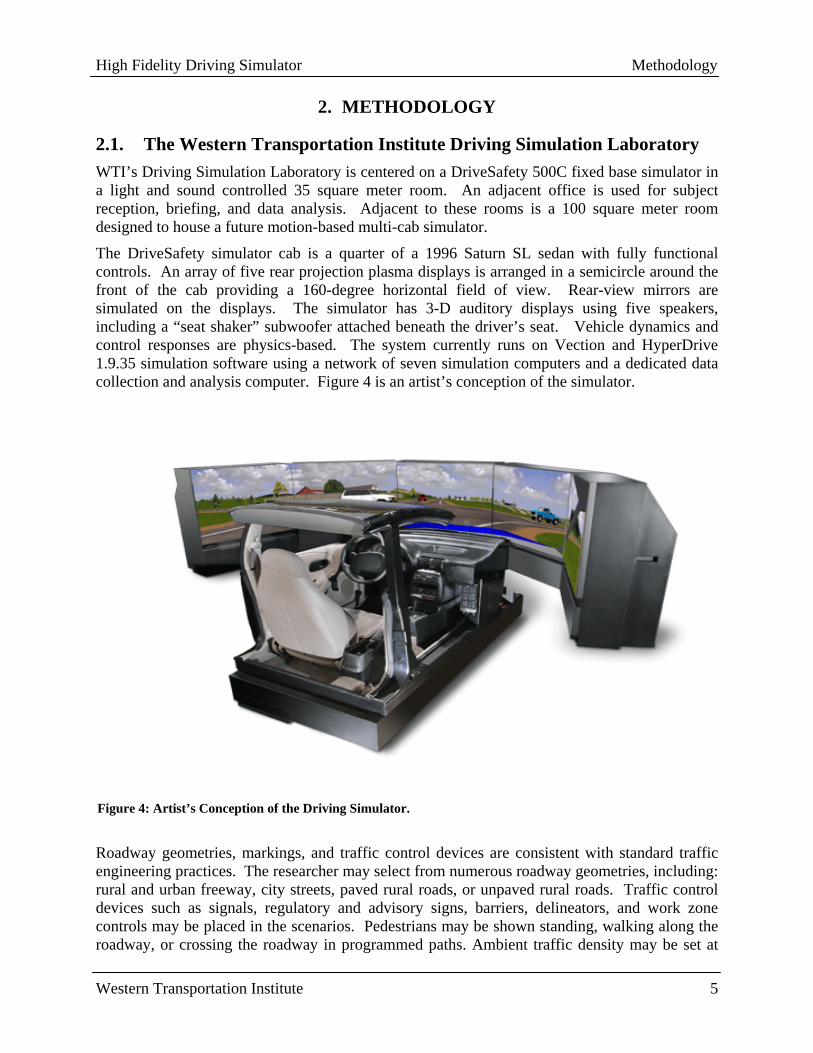
The DriveSafety simulator cab is a quarter of a 1996 Saturn SL sedan with fully functional controls. An array of five rear projection plasma displays is arranged in a semicircle around the front of the cab providing a 160-degree horizontal field of view. Rear-view mirrors are simulated on the displays. The simulator has 3-D auditory displays using five speakers, including a “seat shaker” subwoofer attached beneath the driver’s seat. Vehicle dynamics and control responses are physics-based. The system currently runs on Vection and HyperDrive 1.9.35 simulation software using a network of seven simulation computers and a dedicated data collection and analysis computer. Figure 4 is an artist’s conception of the simulator.
Figure 4: Artist’s Conception of the Driving Simulator.
Roadway geometries, markings, and traffic control devices are consistent with standard traffic engineering practices. The researcher may select from numerous roadway geometries, including: rural and urban freeway, city streets, paved rural roads, or unpaved rural roads. Traffic control devices such as signals, regulatory and advisory signs, barriers, delineators, and work zone controls may be placed in the scenarios. Pedestrians may be shown standing, walking along the roadway, or crossing the roadway in programmed paths. Ambient traffic density may be set at
Western Transportation Institute 5
High Fidelity Driving Simulator Methodology
desired levels and particular makes and models of vehicles may be selected, including: passenger cars, delivery trucks, motorcycles, and other vehicles. The ambient vehicles drive autonomously, obeying all traffic rules unless they are programmed for an abnormal or illegal maneuver (e.g., speeding or running a red light.) Scenarios may select day or night driving. The nighttime condition replicates a partially moonlit night with limited scotopic visibility, street and building lights, a full moon, and many visible stars. Weather conditions may be simulated to include rain, snow, wind, ice, or fog in the scenario.
Driver performance data currently are recorded at a rate of 15 Hz (although rates of up to 60Hz may be used). Forty-eight raw variables including measures of vehicle speed, lane position, lateral and longitudinal acceleration, steering and braking behavior, vehicle states, collisions, and near collisions, may be recorded for analysis. For practical purposes, this amounts to detailed snapshots of the measures taken approximately every two meters of travel at highway speeds.
The simulator has been used for tests of driver distraction by cell phones, animal-vehicle collision countermeasures, lane departure warnings, elderly driver abilities and behavior, and proprietary collision avoidance systems.
2.2. Creating a Simulated World Developing testing scenarios on the WTI Driving Simulation Laboratory is a straightforward task. Using the HyperDrive 1.9.35 software system, users can define terrain, roadway types, and scenario entities from a set of standard menus. First the roadways, traffic conditions, and natural and cultural features for the desired scenario are determined. Tiles representing the appropriate roadway and terrain features are selected and assembled end-to-end to create the simulation “world”. The programmer then selects from a library of buildings, vegetation, parked and moving vehicles, pedestrians, animals, and other such static and dynamic entities. These are inserted onto the tiles using a “drag and drop” process. For moving entities, “triggers” defining the initiating condition and the speed and path of the object are entered. Performance measures (up to 48 measures) for data collection purposes are then selected. Finally, environmental conditions (e.g., daytime/nighttime, precipitation, visibility, coefficient of friction) are selected.
Using the generic tiles supplied to all purchasers, the user can create a roadway containing many of the specific features needed for testing. For example, WTI created a representation of the I-90 roadway over Bozeman Pass to test the effects of alternative animal warning signs on vehicle speed and driver alertness (Stanley, Lassacher and Hardy, 2006). Tiles representing approximately 20 miles of a divided highway with Jersey barriers in the median were placed in a generic hilly rural terrain. In one location, a “road kill” was placed to suggest the presence of animals. Custom signs representing alternative warning signs were developed and placed on the scenario “world”. Near the end of the scenario, a group of deer was triggered to wander onto the roadway. Effectiveness of the alternative signs was evaluated by changes in driver speed and distance from the obstacles when the brakes were actuated.
Existing tiles delivered with HyperDrive represent generic terrain with relatively flat urban terrain, freeway terrain, and slightly hilly rural terrain. Where the generic terrain is not an adequate representation of the planned driving environment, a custom simulator world of specially programmed tiles may be obtained. As an example, Slick, et al. (2006) used custom tiles representing the streets of Manhattan, Kansas, for a study of the efficacy of driver training in the simulator versus training in an actual vehicle. The custom world duplicated the in-vehicle
Western Transportation Institute 6
High Fidelity Driving Simulator Methodology
driving training environment of the streets of that city to ensure that both groups were trained in identical environments.
Safety countermeasures are among the dozens of traffic control entities that may be inserted by click and drag menu selections from the standard simulation menus. Installing a dynamic message sign (DMS) over a roadway, for example, requires inserting the DMS “bridge” to support the sign; selecting and placing the sign board on the bridge structure; and selecting the sign content, layout, and letter fonts. Messages are typed onto the sign screens. Messages requiring multiple screens may be selected in the same way. The entire process requires only a few minutes. Static regulatory and advisory signs may be selected from a menu or, if necessary, created from a custom digital image file and inserted into the scene.
2.3. Creating the US 191 Simulator World An analysis of serious crashes on US 191 identified crash clusters near Mileposts 52, 61, and 66 in the Gallatin Canyon. Another crash cluster was identified north of the canyon mouth near the community of Gallatin Gateway at milepost 77. With guidance from MDT, it was decided to concentrate efforts on areas within the canyon, itself, for simulation and visualization studies.
The manufacturer of the simulation system, DriveSafety, Inc., developed a series of six custom tiles representing the highway and terrain of US 191 through Gallatin Canyon between milepost 48 and milepost 70. To develop this simulation, DVD footage of the roadway was recorded and sent to the simulator manufacturer. In addition, the engineering road drawings for typical horizontal curve profiles, and GPS data for each mile marker (north and southbound) along the segment of roadway of interest were supplied. The manufacturer’s tile designer also employed the USGS mapping information. The GPS data was not used as the measured latitude/longitude data did not register accurately with the latitude/longitude coordinates in the USGS mapping system. The designer used MultiGen Creator Pro and Adobe Photoshop software to generate the visual database. Additional proprietary software was employed by the manufacturer to generate the additional datasets required for the real-time system. The visualization included the two-lane highway bordered by mountains and a river. Both sides of the right-of-way were forested and guard rails were placed along the road as it curved next to the river. The two bridges over the river were protected by concrete barriers. The visual simulation prepared by DriveSafety did not include cultural features, such as buildings and fences. These were added in the appropriate locations using the HyperDrive data base of simulation entities. A custom guard rail entity was made available to allow WTI to place additional guard rails by a click-and-drag operation. Because of the complexity of accurately aligning guard rail ends in the simulation, this proved to be a cumbersome and time consuming task. In some areas, trees were also added to the tiles to more closely resemble the heavily forested roadsides. One necessary departure from the real world roadway was that the rural buildings and fences on the generic simulation entities menu are of typical design for a rural Midwestern landscape. In the real-world environment of US 191, a much greater amount of rustic materials such as logs and rock is used in building.
Western Transportation Institute 7
High Fidelity Driving Simulator Methodology
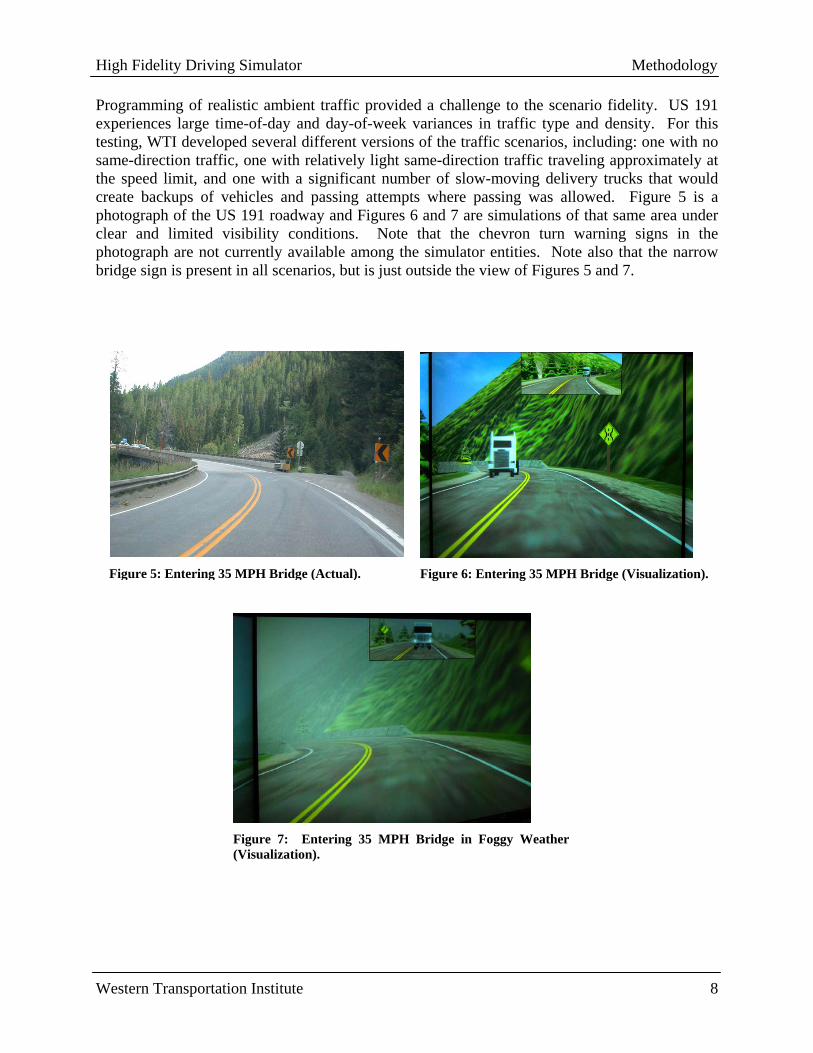
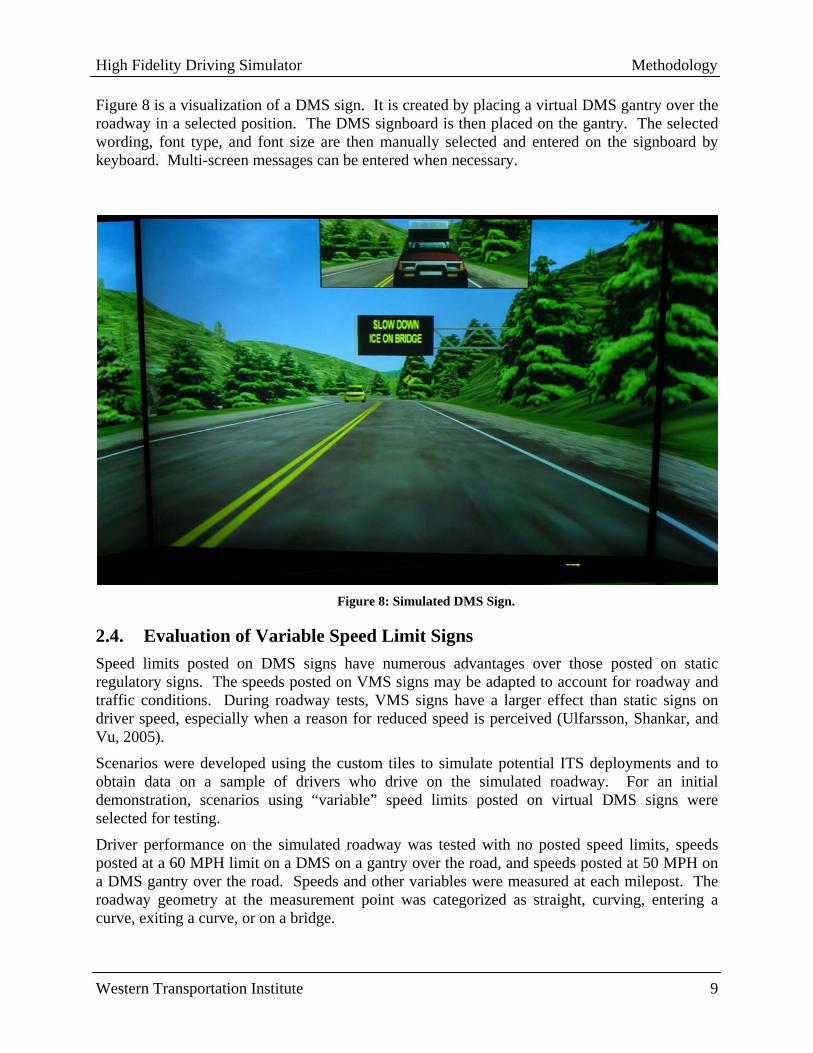
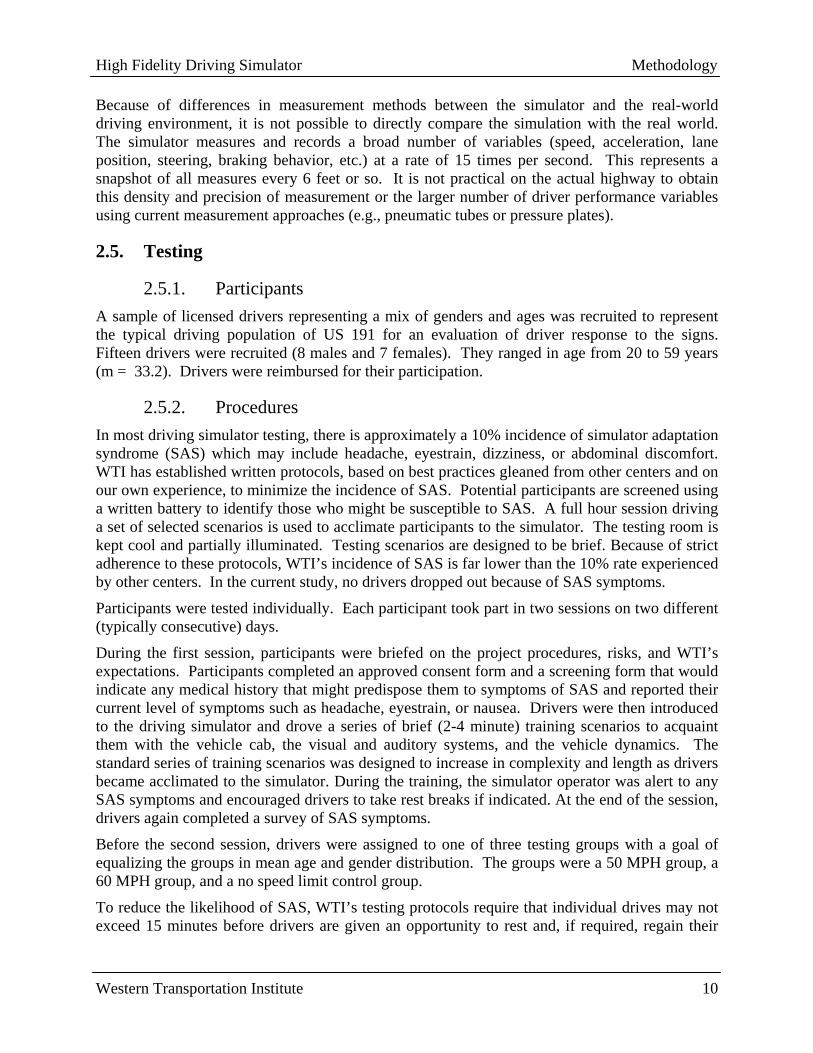
Programming of realistic ambient traffic provided a challenge to the scenario fidelity. US 191 experiences large time-of-day and day-of-week variances in traffic type and density. For this testing, WTI developed several different versions of the traffic scenarios, including: one with no same-direction traffic, one with relatively light same-direction traffic traveling approximately at the speed limit, and one with a significant number of slow-moving delivery trucks that would create backups of vehicles and passing attempts where passing was allowed. Figure 5 is a photograph of the US 191 roadway and Figures 6 and 7 are simulations of that same area under clear and limited visibility conditions. Note that the chevron turn warning signs in the photograph are not currently available among the simulator entities. Note also that the narrow bridge sign is present in all scenarios, but is just outside the view of Figures 5 and 7.
Western Transportation Institute 8
Figure 5: Entering 35 MPH Bridge (Actual). Figure 6: Entering 35 MPH Bridge (Visualization).
Figure 7: Entering 35 MPH Bridge in Foggy Weather (Visualization).
High Fidelity Driving Simulator Methodology
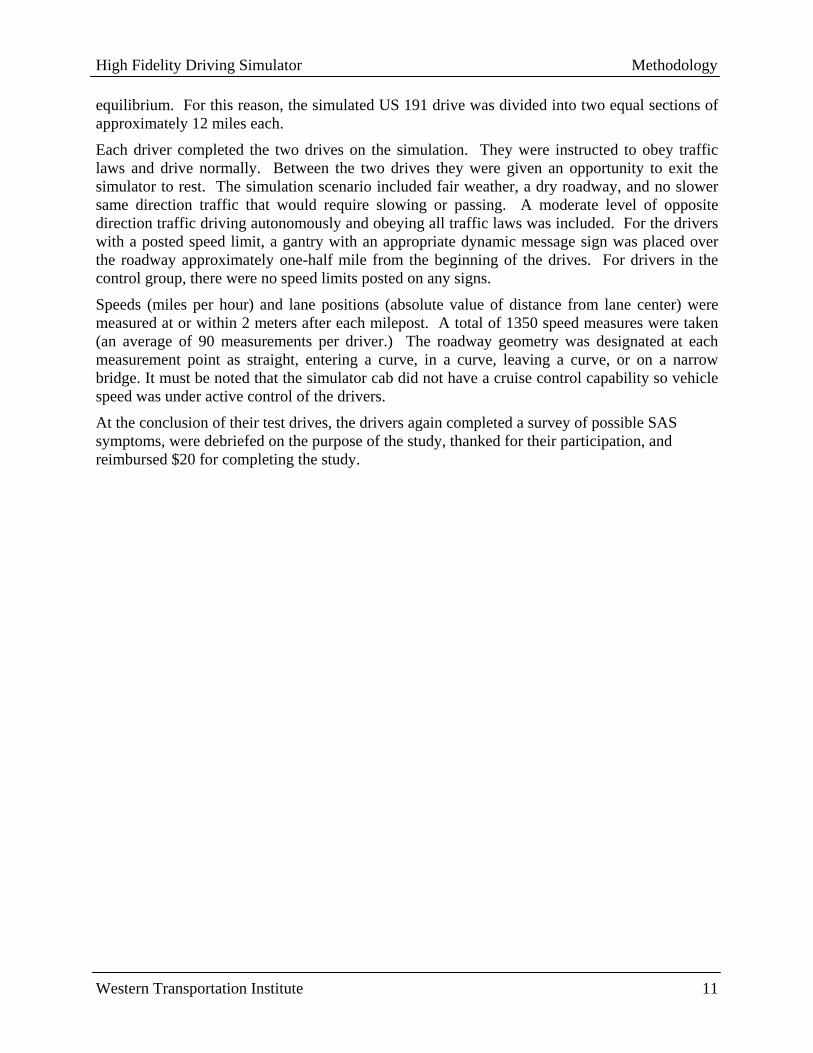
Figure 8 is a visualization of a DMS sign. It is created by placing a virtual DMS gantry over the roadway in a selected position. The DMS signboard is then placed on the gantry. The selected wording, font type, and font size are then manually selected and entered on the signboard by keyboard. Multi-screen messages can be entered when necessary.
Figure 8: Simulated DMS Sign.
2.4. Evaluation of Variable Speed Limit Signs Speed limits posted on DMS signs have numerous advantages over those posted on static regulatory signs. The speeds posted on VMS signs may be adapted to account for roadway and traffic conditions. During roadway tests, VMS signs have a larger effect than static signs on driver speed, especially when a reason for reduced speed is perceived (Ulfarsson, Shankar, and Vu, 2005).
Scenarios were developed using the custom tiles to simulate potential ITS deployments and to obtain data on a sample of drivers who drive on the simulated roadway. For an initial demonstration, scenarios using “variable” speed limits posted on virtual DMS signs were selected for testing.
Driver performance on the simulated roadway was tested with no posted speed limits, speeds posted at a 60 MPH limit on a DMS on a gantry over the road, and speeds posted at 50 MPH on a DMS gantry over the road. Speeds and other variables were measured at each milepost. The roadway geometry at the measurement point was categorized as straight, curving, entering a curve, exiting a curve, or on a bridge.
Western Transportation Institute 9
High Fidelity Driving Simulator Methodology
Because of differences in measurement methods between the simulator and the real-world driving environment, it is not possible to directly compare the simulation with the real world. The simulator measures and records a broad number of variables (speed, acceleration, lane position, steering, braking behavior, etc.) at a rate of 15 times per second. This represents a snapshot of all measures every 6 feet or so. It is not practical on the actual highway to obtain this density and precision of measurement or the larger number of driver performance variables using current measurement approaches (e.g., pneumatic tubes or pressure plates).
2.5. Testing
2.5.1. Participants A sample of licensed drivers representing a mix of genders and ages was recruited to represent the typical driving population of US 191 for an evaluation of driver response to the signs. Fifteen drivers were recruited (8 males and 7 females). They ranged in age from 20 to 59 years (m = 33.2). Drivers were reimbursed for their participation.
2.5.2. Procedures In most driving simulator testing, there is approximately a 10% incidence of simulator adaptation syndrome (SAS) which may include headache, eyestrain, dizziness, or abdominal discomfort. WTI has established written protocols, based on best practices gleaned from other centers and on our own experience, to minimize the incidence of SAS. Potential participants are screened using a written battery to identify those who might be susceptible to SAS. A full hour session driving a set of selected scenarios is used to acclimate participants to the simulator. The testing room is kept cool and partially illuminated. Testing scenarios are designed to be brief. Because of strict adherence to these protocols, WTI’s incidence of SAS is far lower than the 10% rate experienced by other centers. In the current study, no drivers dropped out because of SAS symptoms.
Participants were tested individually. Each participant took part in two sessions on two different (typically consecutive) days.
During the first session, participants were briefed on the project procedures, risks, and WTI’s expectations. Participants completed an approved consent form and a screening form that would indicate any medical history that might predispose them to symptoms of SAS and reported their current level of symptoms such as headache, eyestrain, or nausea. Drivers were then introduced to the driving simulator and drove a series of brief (2-4 minute) training scenarios to acquaint them with the vehicle cab, the visual and auditory systems, and the vehicle dynamics. The standard series of training scenarios was designed to increase in complexity and length as drivers became acclimated to the simulator. During the training, the simulator operator was alert to any SAS symptoms and encouraged drivers to take rest breaks if indicated. At the end of the session, drivers again completed a survey of SAS symptoms.
Before the second session, drivers were assigned to one of three testing groups with a goal of equalizing the groups in mean age and gender distribution. The groups were a 50 MPH group, a 60 MPH group, and a no speed limit control group.
To reduce the likelihood of SAS, WTI’s testing protocols require that individual drives may not exceed 15 minutes before drivers are given an opportunity to rest and, if required, regain their
Western Transportation Institute 10
High Fidelity Driving Simulator Methodology
equilibrium. For this reason, the simulated US 191 drive was divided into two equal sections of approximately 12 miles each.
Each driver completed the two drives on the simulation. They were instructed to obey traffic laws and drive normally. Between the two drives they were given an opportunity to exit the simulator to rest. The simulation scenario included fair weather, a dry roadway, and no slower same direction traffic that would require slowing or passing. A moderate level of opposite direction traffic driving autonomously and obeying all traffic laws was included. For the drivers with a posted speed limit, a gantry with an appropriate dynamic message sign was placed over the roadway approximately one-half mile from the beginning of the drives. For drivers in the control group, there were no speed limits posted on any signs.
Speeds (miles per hour) and lane positions (absolute value of distance from lane center) were measured at or within 2 meters after each milepost. A total of 1350 speed measures were taken (an average of 90 measurements per driver.) The roadway geometry was designated at each measurement point as straight, entering a curve, in a curve, leaving a curve, or on a narrow bridge. It must be noted that the simulator cab did not have a cruise control capability so vehicle speed was under active control of the drivers.
At the conclusion of their test drives, the drivers again completed a survey of possible SAS symptoms, were debriefed on the purpose of the study, thanked for their participation, and reimbursed $20 for completing the study.
Western Transportation Institute 11
High Fidelity Driving Simulator Results
3. RESULTS
3.1. Participant Completion Rate All of the recruited drivers successfully completed the trials. No participants dropped out due to SAS symptoms. While there were apparent individual differences in speed and erratic driving, these appeared to be within normal tolerances and no participants were dropped from the study as performance outliers.
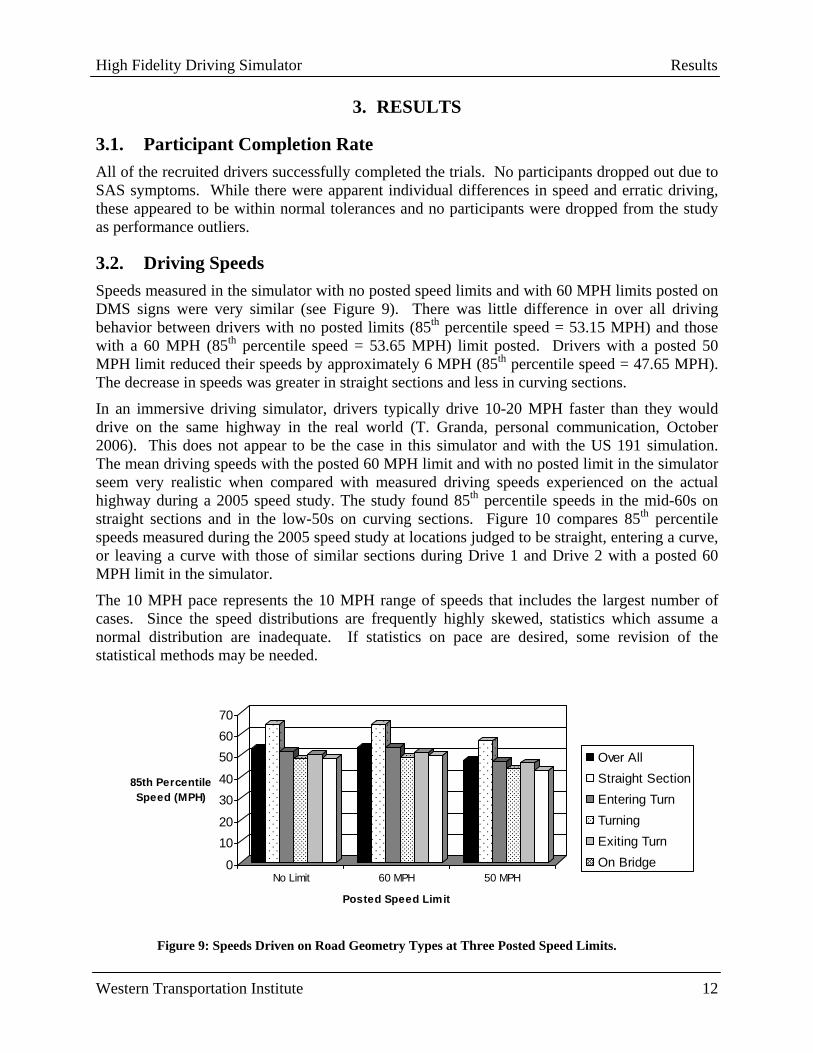
3.2. Driving Speeds Speeds measured in the simulator with no posted speed limits and with 60 MPH limits posted on DMS signs were very similar (see Figure 9). There was little difference in over all driving behavior between drivers with no posted limits (85th percentile speed = 53.15 MPH) and those with a 60 MPH (85th percentile speed = 53.65 MPH) limit posted. Drivers with a posted 50 MPH limit reduced their speeds by approximately 6 MPH (85th percentile speed = 47.65 MPH). The decrease in speeds was greater in straight sections and less in curving sections.
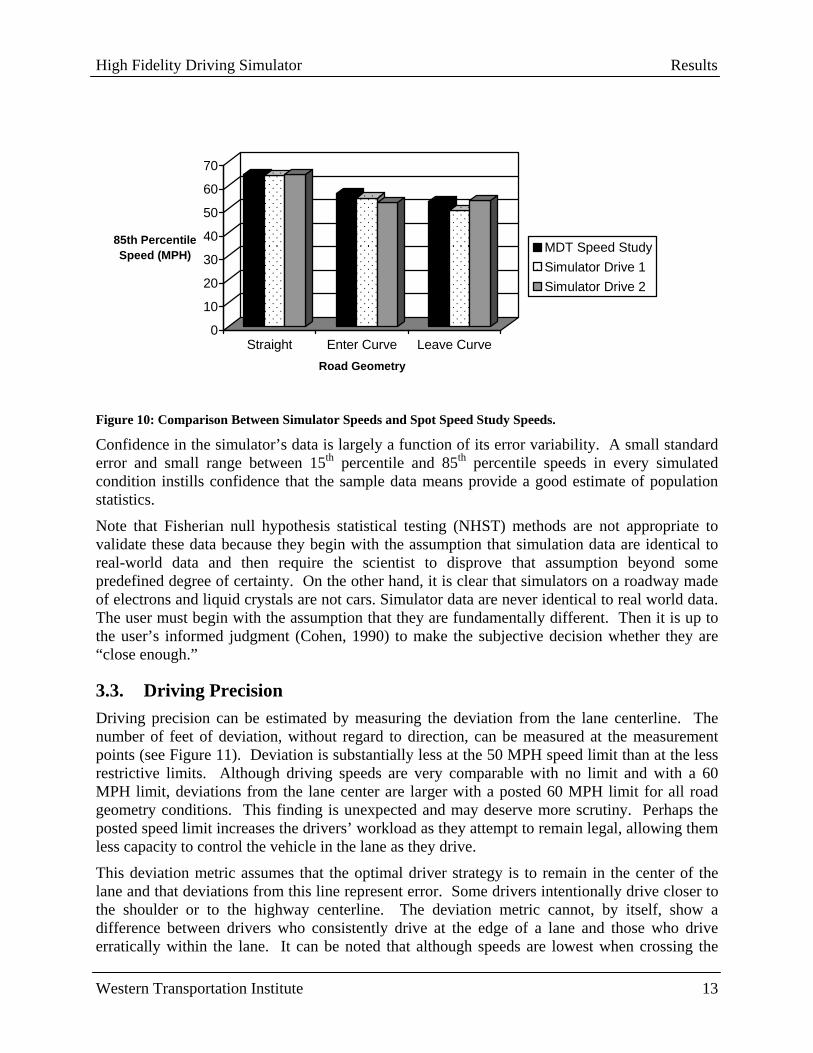
In an immersive driving simulator, drivers typically drive 10-20 MPH faster than they would drive on the same highway in the real world (T. Granda, personal communication, October 2006). This does not appear to be the case in this simulator and with the US 191 simulation. The mean driving speeds with the posted 60 MPH limit and with no posted limit in the simulator seem very realistic when compared with measured driving speeds experienced on the actual highway during a 2005 speed study. The study found 85th percentile speeds in the mid-60s on straight sections and in the low-50s on curving sections. Figure 10 compares 85th percentile speeds measured during the 2005 speed study at locations judged to be straight, entering a curve, or leaving a curve with those of similar sections during Drive 1 and Drive 2 with a posted 60 MPH limit in the simulator.
The 10 MPH pace represents the 10 MPH range of speeds that includes the largest number of cases. Since the speed distributions are frequently highly skewed, statistics which assume a normal distribution are inadequate. If statistics on pace are desired, some revision of the statistical methods may be needed.
0
1020
3040
506070
85th Percentile Speed (MPH)
No Limit 60 MPH 50 MPH
Posted Speed Limit
Over AllStraight SectionEntering TurnTurningExiting TurnOn Bridge
Figure 9: Speeds Driven on Road Geometry Types at Three Posted Speed Limits.
Western Transportation Institute 12
High Fidelity Driving Simulator Results
0
10
20
30
40
50
60
70
85th Percentile Speed (MPH)
Straight Enter Curve Leave CurveRoad Geometry
MDT Speed StudySimulator Drive 1Simulator Drive 2
Figure 10: Comparison Between Simulator Speeds and Spot Speed Study Speeds.
Confidence in the simulator’s data is largely a function of its error variability. A small standard error and small range between 15th percentile and 85th percentile speeds in every simulated condition instills confidence that the sample data means provide a good estimate of population statistics.
Note that Fisherian null hypothesis statistical testing (NHST) methods are not appropriate to validate these data because they begin with the assumption that simulation data are identical to real-world data and then require the scientist to disprove that assumption beyond some predefined degree of certainty. On the other hand, it is clear that simulators on a roadway made of electrons and liquid crystals are not cars. Simulator data are never identical to real world data. The user must begin with the assumption that they are fundamentally different. Then it is up to the user’s informed judgment (Cohen, 1990) to make the subjective decision whether they are “close enough.”
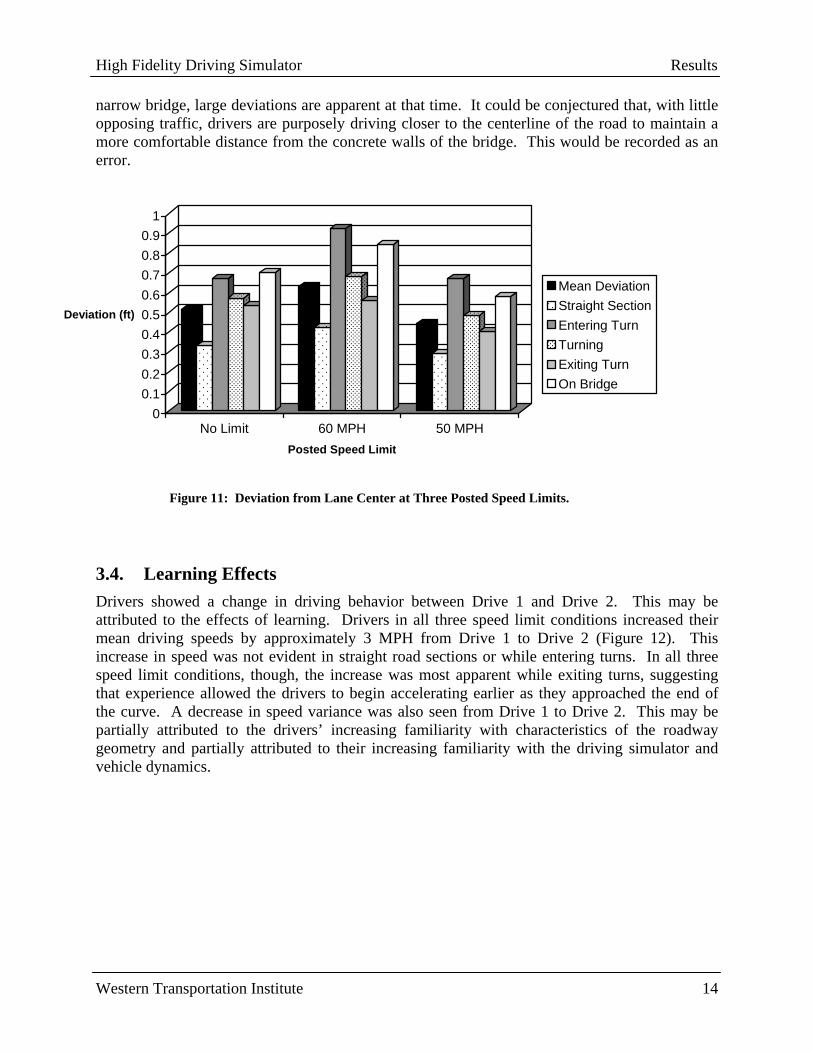
3.3. Driving Precision Driving precision can be estimated by measuring the deviation from the lane centerline. The number of feet of deviation, without regard to direction, can be measured at the measurement points (see Figure 11). Deviation is substantially less at the 50 MPH speed limit than at the less restrictive limits. Although driving speeds are very comparable with no limit and with a 60 MPH limit, deviations from the lane center are larger with a posted 60 MPH limit for all road geometry conditions. This finding is unexpected and may deserve more scrutiny. Perhaps the posted speed limit increases the drivers’ workload as they attempt to remain legal, allowing them less capacity to control the vehicle in the lane as they drive.
This deviation metric assumes that the optimal driver strategy is to remain in the center of the lane and that deviations from this line represent error. Some drivers intentionally drive closer to the shoulder or to the highway centerline. The deviation metric cannot, by itself, show a difference between drivers who consistently drive at the edge of a lane and those who drive erratically within the lane. It can be noted that although speeds are lowest when crossing the
Western Transportation Institute 13
High Fidelity Driving Simulator Results
narrow bridge, large deviations are apparent at that time. It could be conjectured that, with little opposing traffic, drivers are purposely driving closer to the centerline of the road to maintain a more comfortable distance from the concrete walls of the bridge. This would be recorded as an error.
00.10.20.30.40.50.60.70.80.9
1
Deviation (ft)
No Limit 60 MPH 50 MPHPosted Speed Limit
Mean DeviationStraight SectionEntering TurnTurningExiting TurnOn Bridge
Figure 11: Deviation from Lane Center at Three Posted Speed Limits.
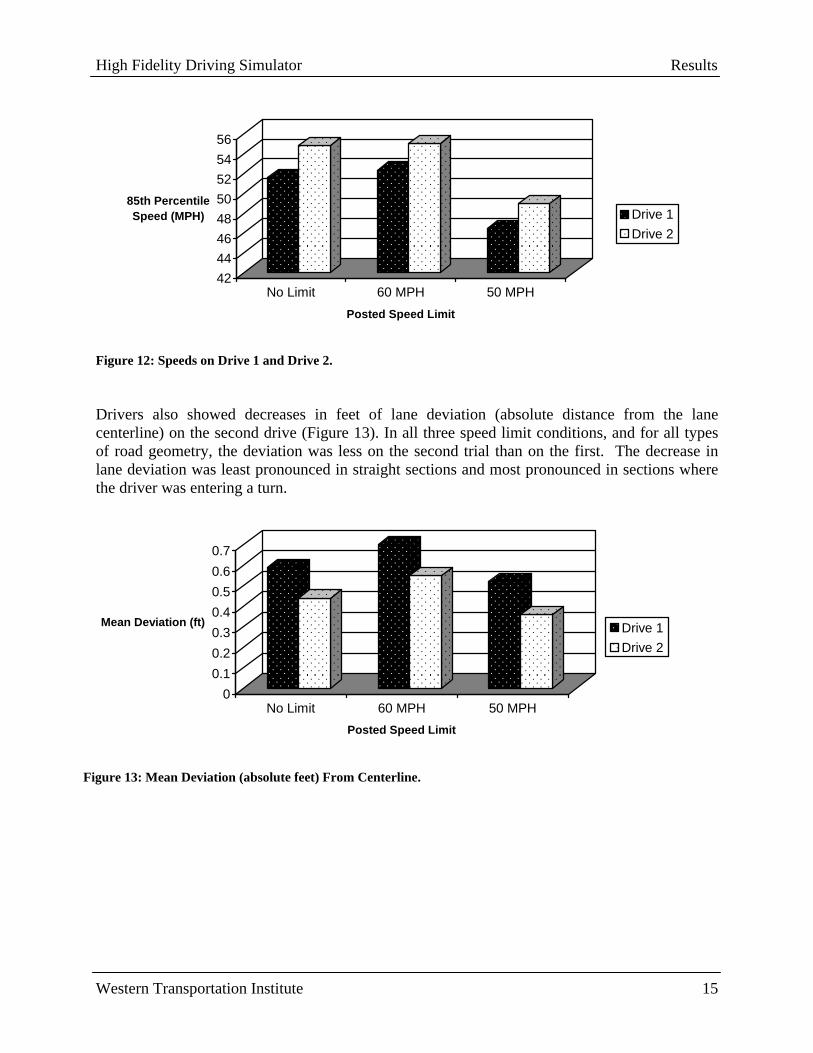
3.4. Learning Effects Drivers showed a change in driving behavior between Drive 1 and Drive 2. This may be attributed to the effects of learning. Drivers in all three speed limit conditions increased their mean driving speeds by approximately 3 MPH from Drive 1 to Drive 2 (Figure 12). This increase in speed was not evident in straight road sections or while entering turns. In all three speed limit conditions, though, the increase was most apparent while exiting turns, suggesting that experience allowed the drivers to begin accelerating earlier as they approached the end of the curve. A decrease in speed variance was also seen from Drive 1 to Drive 2. This may be partially attributed to the drivers’ increasing familiarity with characteristics of the roadway geometry and partially attributed to their increasing familiarity with the driving simulator and vehicle dynamics.
Western Transportation Institute 14
High Fidelity Driving Simulator Results
4244464850525456
85th Percentile Speed (MPH)
No Limit 60 MPH 50 MPHPosted Speed Limit
Drive 1Drive 2
Figure 12: Speeds on Drive 1 and Drive 2.
Drivers also showed decreases in feet of lane deviation (absolute distance from the lane centerline) on the second drive (Figure 13). In all three speed limit conditions, and for all types of road geometry, the deviation was less on the second trial than on the first. The decrease in lane deviation was least pronounced in straight sections and most pronounced in sections where the driver was entering a turn.
00.10.20.30.40.50.60.7
Mean Deviation (ft)
No Limit 60 MPH 50 MPHPosted Speed Limit
Drive 1Drive 2
Figure 13: Mean Deviation (absolute feet) From Centerline.
Western Transportation Institute 15
High Fidelity Driving Simulator Conclusions and Recommendations
4. CONCLUSIONS AND RECOMMENDATIONS
The Gallatin Canyon project was a small project to explore the simulation/visualization technology application of a medium fidelity immersive driving simulator for evaluating driver responses to advanced crash avoidance systems on a rural highway. In the future, additional crash avoidance systems may be explored. There is interest among several agencies in a simulation test of lighted centerline delineation to make the roadway more visible in inclement weather. Delineator lights have been developed as simulator entities and would be available for testing. A lane departure warning system simulating virtual shoulder and centerline rumble strips has been developed and tested on a generic terrain for a different project and would be available for testing on a specific roadway, such as US 191.
WTI’s current driving simulator was designed primarily for training and driver performance research using generic roadways and features. While this study has demonstrated that it is possible to expand the simulator’s role into visualization tasks, numerous challenges are presented. WTI has begun the process of obtaining a second, higher fidelity driving simulator that could specifically be used to support visualization and simulation studies. Many of the lessons learned in this initial study are guiding the requirements for WTI’s next-generation driving simulator. Some of these lessons are described below.
4.1. Simulator Adaptation Syndrome Simulator adaptation syndrome (SAS) or, more commonly, simulator sickness is always an issue when using an immersive driving simulator (c.f., Mollenhauer, 2004). This syndrome may include dizziness, headache, or abdominal discomfort while in the presence of the moving visual scenes. As part of previous studies, the drivers are routinely screened for these symptoms both before and after testing. During earlier studies, WTI researchers found that approximately 10 percent of drivers reported increased levels of these symptoms after a drive. The frequency and intensity of SAS appears to be greater in female drivers and to increase with age.
WTI researchers have identified several procedures for minimizing SAS, including: prescreening drivers for medical histories of motion sickness or other predisposing factors, presenting a carefully designed program of pre-training to acclimate the drivers to the simulator, using testing scenarios of no more than 15 minutes in length, and maintaining a minimum level of ambient lighting in the simulator room to prevent the driver from becoming totally immersed in the simulation. Motion systems that closely match accelerations with visual displays also reduce the incidence of SAS.
4.2. Driver Sampling While age and gender differences in susceptibility to SAS create challenges in driver selection, it is crucial that a representative sample of drivers be tested. For convenience, many research centers recruit a standard subject pool of university freshmen for simulation testing. The authors have found that younger drivers perform differently than drivers above, say, 30 years of age. Younger drivers score much higher on tests of perceptual and cognitive skills related to driving. They also have more experience with gaming and simulation. As in the real world, younger subjects tend to take more risks and have more crashes than older drivers. In order to generalize results to the driving population, simulation testing must sample from the entire range of drivers.
Western Transportation Institute 16
High Fidelity Driving Simulator Conclusions and Recommendations
4.3. DMS Sign Messages Some issues arose in the development of messages to be displayed on the DMS signs. In the WTI system, message content is entered as free text so the user must be familiar with any conventions for message content and structure. For the development of messages for the simulator, widely accepted standard guidelines (e.g., Dudek, 2004) should be consulted and observed. In addition, several states have developed message content guidelines for DMS, but there are some differences in practice between jurisdictions. Appropriate local guidelines for the roadway segment should be identified, where available, and should guide the format and content of messages displayed in the simulator.
4.4. Tile Limitations The proprietary software used to develop the simulation could not easily simulate elements of the near-vertical rock faces that appear in some areas of the canyon due to limitations in the slope and distance of the terrain. Terrain tiles representing higher and steeper mountains were available and could have been added adjacent to tiles containing the roadway to provide a view of distant mountains, but because of the many short radius curves in the roadway, it would have been impractical to place these next to the roadway.
One issue of driving in terrain with mountains and trees is the influence of sunny versus shady areas. In the real world, shady areas are more likely to have icy or wet roadways providing reduced road friction. The alternating areas of light and darkness also affect the driver’s vision and may hide an obstacle, or even a curve, in the deeper shadows. The current WTI simulator does not have a capability to simulate shadows. A future simulator will have this capability.
The tiles developed by the manufacturer displayed guard rails in most of the appropriate areas along the highway. A few areas lacked guard rails that needed to be added to the simulation. A guard rail entity was included with the available scenario entities, but it was overly cumbersome and time-consuming to use. It required the user to roughly place the guard rail section and then gradually slide the ends into a more accurate alignment with adjoining rails. For barriers with any degree of thickness (e.g., Jersey barriers), alignment of the straight barrier sections on a curving roadway geometry was a particular challenge. Alternative methods of adding such roadside barriers need to be explored, especially including a friendlier user interface.
As mentioned in Section 2.3, cultural features available in the standard simulator entity set represent Midwestern architectural styles. In addition, numerous signs such as turn warning chevrons are not available in the menus. Custom entities such as these can be produced using digital photo processing techniques to create new structure fronts or new signs and pasting them on existing buildings or signs.
Changes in roadway geometry (e.g., road widening or restriping) are more complicated and require new base tiles. Production of the new tile is costlier than revising entities placed on a given tile. Based on experience in this project, simulating a change in geometry requires approximately 30 person-hours of effort at a cost of approximately $5,000 depending on the complexity of the terrain.
Western Transportation Institute 17
High Fidelity Driving Simulator Conclusions and Recommendations
4.5. Contracted Versus In-house Tile and Entity Development A major advantage of visualization and rapid prototyping is that it can be done quickly. Working with the simulator manufacturer to develop custom tiles can become a time-consuming process involving negotiation of contracts and fitting the scenario development time into the manufacturer’s schedule. Revisions and corrections to the tiles may require several iterations of this process. Such lengthy and complex interactions with the manufacturer can reduce the overall efficiency of the prototyping process. WTI is exploring ways to shorten this process, including obtaining an ability to develop the custom tiles in-house through greater access to the proprietary code used for development or through use of alternative software that makes the tile development and revision features available to the user. Another advanced feature under exploration with potential partners is the ability to directly import CAD drawings to automatically create accurate roadway tiles.
4.6. Effectiveness of the Simulation Approach Evaluation and refinement of highway design features using immersive simulation is being shown to be effective in numerous environments, including: planning and contextual design; design of structures; design of structures and geometric features; design of alternative geometries, such as roundabouts; and design of driver information and support systems. Emerging simulation technologies allow simulation of real world roadway sections on which proposed new geometries and infrastructure-based safety countermeasures can be evaluated.
This exploratory study has demonstrated that immersive driving simulation can provide valid data on driver responses to such countermeasures. Speeds measured in the simulator were very close to those measured on the roadway in spot speed studies. The 85th percentile speeds on the highway showed very minor changes with the reduction of the speed limits from 70 MPH to 60 MPH while WTI’s simulation study found only minimal differences between speeds with a posted 60 MPH limit and with no posted limit.
Additional research is needed to better define simulation requirements and evaluation procedures for extending this design/evaluation approach.
Western Transportation Institute 18
High Fidelity Driving Simulator References
5. REFERENCES
Cohen, J. (1990). Things I have learned (so far). American Psychologist. 45(12). 1304-1312.
Dudek, C. L. (2004). Changeable Message Sign Operation and Messaging Handbook. Report No. FHWA-OP-03-070. Washington: Federal Highway Administration.
Granda, T. (2006). The Use of Simulation Visualization as an Aid to Roadway Design. Presented at the Fifth International Visualization in Transportation Symposium and Workshop. Denver, October 2006.
Mollenhauer, M. (2004). Simulator Adaptation Syndrome Literature Review. Realtime Technologies Technical Report, 2004.
Slick, R.F., Kim, E., Evans, D.F., and Steele, J.P. (2006). Using Simulators to Train Novice Teen Drivers: Assessing Psychological Fidelity as a Precursor of Transfer of Training. Presented at the Asian Conference on Driving Simulation. Tokyo, May 2006.
Stanley, L. M., Lassacher, S., and Hardy, A. (2006). Driver Responses to Enhanced Wildlife Advisories in a Simulated Environment. Transportation Research Board Annual Meeting Proceedings, Washington D.C., January 2006.
Ulfarsson, G.F., Shankar, V.N., & Vu, P. (2005). Effect of variable message and speed limit signs on mean speeds and speed deviations. Int. J. Vehicle Information and Communication Systems. 1 (1/2). 69-87.
Upchurch, J., Fisher, D., Carpenter, R.A., & Dutta, A. (2002). Freeway Guide Sign Design for Central Artery Tunnel: Boston, Massachusetts. In Transportation Research Record Number 1801. Washington: Transportation Research Board. pp. 9-17.
Western Transportation Institute 19

125 copies of this public document were produced at an
estimated cost of $1.80 each, for a total cost of $224.46. This includes $116.07 for postage and $108.39 for printing.