Embed Size (px)
Citation preview

14 Poonam Bharti, Dr. Shivjeet Kour
Research Cell: An International Journal of Engineering Science, Special Issue April 2018, Vol. 28,
UGC Approved Journal (S.No.63019) ISSN: 2229-6913(Print), ISSN: 2320-0332(Online), Web Presence: http://ijoe.vidyapublications.com
© 2018 Vidya Publications.Authors are responsible for any plagiarism issues.
A Geographical Analysis of Agricultural Workers in Punjab-
Haryana Plains: 2011
Poonam Bharti1, Dr. Shivjeet Kaur
2
Research Scholar, Assistant Professor
Department of Geography, PunjabiUniversity Patiala, Punjab
Department of Geography, Punjabi University Patiala, Punjab 1Poonam [email protected]
ABSTRACT
The major objective of the paper is to analyze the existing patterns of agricultural workers,
cultivators and agricultural laborers in Punjab-Haryana Plains during 2011. For achieving the
above objective, the study is divided into five parts. Firstly, the proportion of workers to total
population is discussed. The second part deals with variations in agricultural workers. But the
third part explains the spatial patterns of cultivators. While in fourth part agricultural laborers are
discussed. Finally conclusions are drawn and suggestions are made in fifth part. It is observed
from the study that average share of workers in the study region is 35.07 per cent which varies
between 20.04 per cent in Rohtak district to 42.67 per cent in Mansa district. In case of
proportion of agricultural workers to total workers is 40.06 per cent for the study region and
recorded lowest of 9.83 per cent in Faridabad district and highest of 63.51 per cent in Jind
district. In case of cultivators to total agricultural workers, the region’s average is 68.17 per cent
which ranges between 40.67 per cent in Fazilka district to 79.55 per cent in Mahendragarh
district. The proportion of agricultural laborers to total agricultural workers in the study region is
41.29 per cent. It is found lowest of 20.45 per cent in case of Mahendragarh district and highest
of 59.33 per cent in Fazilka district. It is also found that these spatial variations in total workers,
agricultural workers, agricultural laborers and cultivators are governed by the physio-socio-
economic factors. It is also observed that urbanization and industrialization play their significant
role in the spatial patterns of these variables. The present study is empirical in nature and is
based on secondary sources of data. District is taken as unit of study. Simple statistical methods
are used for deriving the results and cartographic techniques are used for mapping the results.
INTRODUCTION
In today’s world the agricultural sector employs half of the world’s labor force with an estimated
1.3 billion works active in agricultural production worldwide. The majority of agricultural
workers are found in developing countries. A great majority are small scale farmers. They have
been more often victims rather the beneficiaries of the green revolution, the technological
development and globalization trends which characterized the 20th
century (Manigandan and
Vetrivel, 2013). According to the National Commission on labor “an agricultural laborer is one
who is basically unskilled and unorganized and has little for its livelihood other than personal

Research Cell: An International Journal of Engineering Sciences ISSN: 2229-6913 Issue April 2018, Vol. 28 15
Research Cell: An International Journal of Engineering Science, Special Issue April 2018, Vol. 28,
UGC Approved Journal (S.No.63019) ISSN: 2229-6913(Print), ISSN: 2320-0332(Online), Web Presence: http://ijoe.vidyapublications.com
© 2018 Vidya Publications.Authors are responsible for any plagiarism issues.
labor”. All those persons who derive a major part of their income as payment for work
performed on the farms of others can be designated as agricultural laborers. For a major part of
the year they should work on the land of the others on wages. One of the most distinguished
features of the rural economy of India has been the growth in the number of agricultural workers,
cultivators and agricultural laborers engaged in crop production. (Padhi, 2007).
Mamaoria (1976), states that one of the most disquieting features of the rural economy of India
has been the growth in the number of agricultural workers (cultivators and agricultural laborers)
engaged in crop production. Morgan and Pugh (1971) observed that the phenomenon of under-
employment, under development and surplus population are all simultaneously manifested in the
daily lives and livings of agricultural laborers. The level of labor input per unit of land or capital
depends on its availability, its cost and the need to achieve a given level of output. Systems of
production vary in their total labor requirements as well as in the seasonality of their demands
Farming remains a traditional occupation for a majority of farmers (cultivators) and farm
laborers. This helps to explain the fact that the agricultural laborer is less occupationally mobile
than other forms of employment. The size of agricultural labor is declining in the western world
but labor productivity increasing, due mainly to the substitution of machinery for men. The level
of labor inputs depends on various interrelated factors, including its cost and availability, land
quality, the desire to obtain a particular level of output and the type of farm system practiced
(Ilbery, 1985). The availability of labor is also an important factor in farming. Labor
requirements for different crops and different livestock vary immensely (Symons, 1968).
The availability of labor is also a major constraint in the agricultural land use and cropping
patterns of a region. Labor represents all human services other than decision making and capital.
The availability of labor, its quantity and quality at the period of peak labor demand have great
influence on decision making process of the farmers. The different crops and agrarian system
vary in their total labor requirements. The labor inputs vary considerably round the year for most
of the agricultural enterprises with the result that many farmers employ a mixed system of
production in order to keep their labor fully employed. Even then in many parts of India,
seasonal unemployment remains on most of the holdings, while during the peak periods of
sowing (rice, wheat, sugarcane, vegetables and potatoes) and harvesting there acute shortage of
labor which influences the sowing and harvesting operations and there by affect the decision of a
farmer whether to grow or not a crop (Husain, 1997).
OBJECTIVES
The major purpose of the present paper is to reveal the spatial distribution of agricultural workers
in Punjab-Haryana Plain. It is also the aim of the paper to know the factors responsible for
distribution of agricultural work force in 2011.

16 Poonam Bharti, Dr. Shivjeet Kour
Research Cell: An International Journal of Engineering Science, Special Issue April 2018, Vol. 28,
UGC Approved Journal (S.No.63019) ISSN: 2229-6913(Print), ISSN: 2320-0332(Online), Web Presence: http://ijoe.vidyapublications.com
© 2018 Vidya Publications.Authors are responsible for any plagiarism issues.
METHODOLOGY
This study is empirical in nature and secondary sources of data are taken. Simple statistical
techniques are used for deriving the results and cartographic techniques are applied for mapping
the results.
STUDY AREA
It is situated in north-west of India and contains Punjab and Haryana states with total reporting
area of 94,572 sq km which comprises 2.88 percent of the total reporting area of India. Its extent
ranges between 27°37’ North latitude to 32°32’ North latitude and between 73°55’ East
longitude to 77°46’ East longitude.

Research Cell: An International Journal of Engineering Sciences ISSN: 2229-6913 Issue April 2018, Vol. 28 17
Research Cell: An International Journal of Engineering Science, Special Issue April 2018, Vol. 28,
UGC Approved Journal (S.No.63019) ISSN: 2229-6913(Print), ISSN: 2320-0332(Online), Web Presence: http://ijoe.vidyapublications.com
© 2018 Vidya Publications.Authors are responsible for any plagiarism issues.
The study area is a homogenous plain with exception of Shiwaliks in north-east and shoot outs of
Aravallis in the south. Average annual rainfall is 60 cm. There are severe winters and severe
summers. Annual co-efficient of variability in annual rainfall is over 20 per cent. There are 43
districts. Out of total population of 53057317 persons, 33853551 persons are rural and 19241249
are urban.
DISCUSSION
This paper is divided into four parts and is discussed as under:
Total workers
Agricultural workers
Cultivators
Agricultural Laborers
TOTAL WORKERS
There are 18680313 workers out of 53174800 of the total population of the study region
which yield 35.13 per cent of the total population. The per cent age of the total workers to the
total population is lowest of 24.04 per cent in Rohtak district and highest of 42.67 per cent in
Mansa district. The region’s average of 35.13 is not uniformly distributed. Some districts have
high per cent of work force as compared to other districts. For knowing the spatial variations in
workers Fig.2 is mapped which portrays 3 categories. These are discussed below:
1. Areas of high work force (above 38 per cent): This category is confined to western
parts of the region and is found in a continuous belt which runs from Bhiwani district to
Bathinda district. 7 districts form this belt namely Bhiwani, Hisar, Jind, Fatehabad, Mansa,
Sirsa and Bathinda. Except this compact belt there is one more district namely Fazilka. These
are the lagging behind districts of the study region where most of the population is engaged in
agricultural activities and there either cultivators or agricultural laborers. The level of literacy is
low. Socio-economic condition is also poor because majority of the population is working on
farms.
2. Areas of moderate work force (34-38 per cent): Twenty three districts form this
category and region’s average of 35.13 per cent also falls in it. It is found in one compact belt
and one patch. The belt contains 20 districts namely Amritsar, Tarn Taran, Kapurthala,
Jalandhar, Firozpur, Muktsar, Faridkot, Moga, Ludhiana, Barnala, sangrur, fatehgarh sahib, s.a.s
nagar, Panchkula, Patiala, Kurukshetra, Kaithal, Karnal, Panipat, Sonipat. Here it varies
between 34-38 per cent. These areas are mixture of agricultural and non-agricultural activities.
Literacy is also varying between moderate to high. Industrial developed districts like Jalandhar,
Ludhiana, Panchkula, S.A.S. Nagar, Karnal, Panipat, Gurgaon, etc. also fall in it. From
agricultural point of view this belt is highly developed. Agriculture is highly mechanized which
requires comparatively less labor force. Most of the people working in industrial town. The
main reasons for moderate work force in these industrialized districts are migrated labor from

18 Poonam Bharti, Dr. Shivjeet Kour
Research Cell: An International Journal of Engineering Science, Special Issue April 2018, Vol. 28,
UGC Approved Journal (S.No.63019) ISSN: 2229-6913(Print), ISSN: 2320-0332(Online), Web Presence: http://ijoe.vidyapublications.com
© 2018 Vidya Publications.Authors are responsible for any plagiarism issues.
Uttar Pradesh, Bihar and Madhya Pradesh. Another patch of this category is lying in the south
comprising the districts of Gurgaon, Rewari and Mehandragrh. Gurgaon is highly industrialized
and Rewari and Mehandragarh are highly developed industrially in recent times. But majority of
work force is from outside the region. Secondly some workers shifted to Delhi permanently
which also affected the workers proportion of total population.
Research Cell: An International Journal of Engineering Sciences ISSN: 2229-6913 Issue April 2018, Vol. 28 19
Research Cell: An International Journal of Engineering Science, Special Issue April 2018, Vol. 28,
UGC Approved Journal (S.No.63019) ISSN: 2229-6913(Print), ISSN: 2320-0332(Online), Web Presence: http://ijoe.vidyapublications.com
© 2018 Vidya Publications.Authors are responsible for any plagiarism issues.
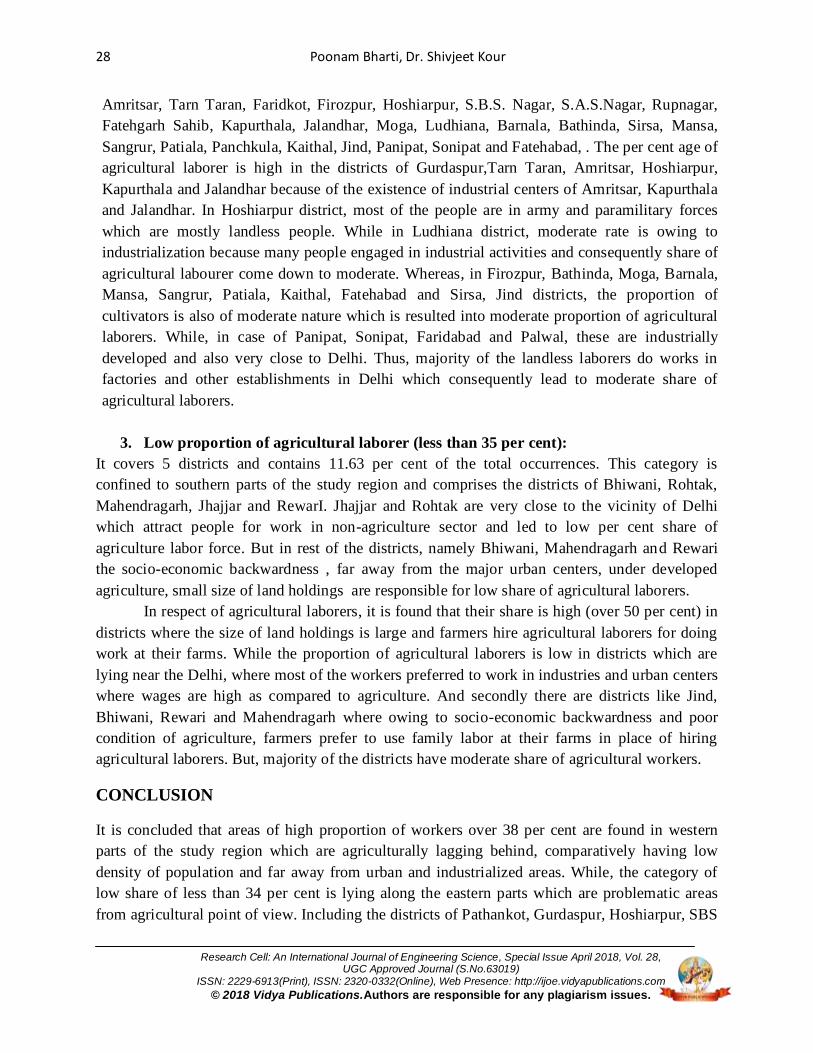
3. Areas of low work force (less than 34 per cent): There are total 12 districts in this
category and are lying along the eastern part. There is one belt and three patches of this
category. The belt runs from Pathankot to Rupnagar along the shiwalik.and covers districts of
Pathankot, Gurdaspur, Hoshiarpur, Nawashaher, Rupnagar. Here there shiwalik foothills,
piedmont plains, high density of population. Owing to difficult terrain most of the people are in
government jobs even the literacy level is also high. These are some of the reasons for low work
force in this belt. Other districts are Ambala, Yamunanagar, Rohtak, Jhajjar, Faridabad and
Mewat which have recorded low proportion of total workers.
From above discussion, it is concluded that areas with high proportion of workers (over 38 per
cent) are found in western parts of the study region which are agriculturally lagging behind,
comparatively low density of population and far away from industrialized areas. While, the
categories of low share of workers (less than 34 per cent) lying along the eastern parts which are
problematic areas from agricultural point of view which are Pathankot, Gurdaspur and
Hoshiarpur lying along Delhi. Most of the people of these districts have migrated to Delhi and as
a result work force is low. Whereas it is moderate in areas between these two categories which
are industrially advanced and are having six districts with high magnitude of industrialization. In
addition to it these are agriculturally developed also.
AGRICULTURAL WORKERS
An agricultural worker is someone who works on a farm, maintaining the quality of farms, crops,
and by operating machinery and doing physical labor. He may be cultivator or laborer on wages.
Out of 1,86,80313 workers the number of agricultural workers is 74,83,371 in Punjab-Haryana
plains during 2011.In other words, agricultural workers constitute 40.06 per cent of the total
workers. But this figure of 40.06 per cent is not uniformly distributed in all districts of the study
region and owing to different reasons like presence of industries, urban centers, literacy rate,
predominance of agricultural activities, tertiary activities etc. The proportion of agricultural
workers in the study region ranges between 9.83 per cent in Faridabad district and 63.51 per cent
in Jind district. Thus for making an in depth study of the spatial distribution of agricultural
workers an attempt is made and for this purpose figure is mapped which depict three categories
which are as follow:
1. Category of high proportion of agricultural workers (over 50 per cent): It is found in
south-western and western parts of the study region. It covers the districts of Fazilka, Muktsar,
Sirsa, Mansa, Fatehabad, Hisar, Jind, Kaithal, Rohtak, Bhiwani, Mahendragarh, Mewat and
Palwal. These are lying far away from the major industrial and urban centers like Amritsar,
Jalandhar, Ludhiana, S.A.S. Nagar, Faridabad, Gurgaon and the National Capital Delhi and
region’s capital Chandigarh. Moreover, degree of infrastructural development, level of literacy
etc. are also low. Owing to above reasons for majority of the workers opted for work in
agricultural sector either as cultivators or agricultural laborers. Due to all these factors, the share
of agricultural workers is recorded high.

20 Poonam Bharti, Dr. Shivjeet Kour
Research Cell: An International Journal of Engineering Science, Special Issue April 2018, Vol. 28,
UGC Approved Journal (S.No.63019) ISSN: 2229-6913(Print), ISSN: 2320-0332(Online), Web Presence: http://ijoe.vidyapublications.com
© 2018 Vidya Publications.Authors are responsible for any plagiarism issues.
2. Category of moderate proportion of agricultural workers (30-50 per cent): Region’s
average of 40.06 per cent falls in this category. It is lying between the categories of low and high
per cent share of

Research Cell: An International Journal of Engineering Sciences ISSN: 2229-6913 Issue April 2018, Vol. 28 21
Research Cell: An International Journal of Engineering Science, Special Issue April 2018, Vol. 28,
UGC Approved Journal (S.No.63019) ISSN: 2229-6913(Print), ISSN: 2320-0332(Online), Web Presence: http://ijoe.vidyapublications.com
© 2018 Vidya Publications.Authors are responsible for any plagiarism issues.
Table no. 2
Punjab-Haryana plains: per cent share of agricultural workers to total workers-2011
Sr.No. Districts Per cent of Total workers
1 Gurdaspur 38.78
2 Pathankot 18.00
3 Amritsar 26.82
4 Tarn taran 51.76
5 Kapurthala 34.36
6 Jalandhar 19.67
7 Nawashaher 31.92
8 Hoshiarpur 32.83
9 Rupnagar 28.74
10 S.A.S. Nagar 17.60
11 Ludhiana 18.63
12 Firozpur 40.01
13 Fazilka 59.6
14 Faridkot 48.42
15 Muktsar 58.92
16 Moga 48.45
17 Bathinda 49.07
18 Mansa 59.76
19 Sangrur 43.77
20 Barnala 48.15
21 Patiala 30.64
22 Fatehgarh Sahib 30.56
23 Ambala 29.60
24 Panchkula 18.68
25 Yamunanagar 34.62
26 Kurukshetra 45.96
27 Kaithal 57.14
28 Karnal 47.67
29 Panipat 32.61
30 Sonipat 46.65
31 Rohtak 58.26
31 Jhajjar 48.14
33 Faridabad 9.83
34 Gurgaon 15.26
35 Rewari 38.76
36 Mahendragarh 55.36
37 Bhiwani 62.97
38 Jind 63.51
39 Hisar 58.60
40 Fatehabad 62.38
41 Sirsa 62.01
42 Mewat 55.01
43 Palwal 49.16
Average 40.06
Source: Economic and Statistical Organization of Punjab and Haryana

22 Poonam Bharti, Dr. Shivjeet Kour
Research Cell: An International Journal of Engineering Science, Special Issue April 2018, Vol. 28,
UGC Approved Journal (S.No.63019) ISSN: 2229-6913(Print), ISSN: 2320-0332(Online), Web Presence: http://ijoe.vidyapublications.com
© 2018 Vidya Publications.Authors are responsible for any plagiarism issues.
.
agricultural workers. The districts which are found in this category are Gurdaspur, Tarn Taran,
Kapurthala, Hoshiarpur, S.B.S. Nagar, Firozpur, Faridkot, Muktsar, Moga, Bathinda, Barnala,
Sangrur, Fatehgarh Sahib and Patiala of Punjab and Yamunanagar, Kurukshetra, Karnal, Panipat
Sonipat, Jhajjar and Rewari districts of Haryana. In case of districts falling in Punjab state, the
reasons are moderately industrial development, moderately infrastructural development, and
moderate literacy rate and nearest to the highly urbanized and industrialized districts. But reasons
for districts which fall in Haryana are firstly Kurukshetra, Ambala, Karnal, Panipat and sonipat
are lying along the G.T. road, secondly Rohtak and Jhajjar districts are very close to Delhi and
Gurgaon. Thus a high proportion of workers are commuters to Gurgaon and Delhi from these
districts. They go for work in industries and tertiary activities. Therefore owing to all these
reasons the proportion of agricultural workers is recorded moderate in this category.
3. Category of low proportion of agricultural workers (less than 30 per cent): This
category is largely confined to North-Eastern parts of the study region. There are 10 districts in
this category namely Pathankot, Amritsar, Jalandhar, Rupnagar, Ludhiana, S.A.S Nagar,
Panchkula, Ambala, Gurgaon and Faridabad. The proportion of agricultural workers is low in
Pathankt owing to the presence of Pathankot cantonment which provides employment to the
local people and moreover unfriendly relief for agriculture purposes. While the districts of
Amritsar, Jalandhar, Ludhiana, S.A.S. Nagar, Rupnagar, Gurgaon and Faridabad are highly
industrialized as compared to the other parts of the study region. Moreover high literacy rate,
and modernized agriculture, small size of land holdings etc. are responsible for low share of
agricultural workers in this category. All these factors combinedly provide employment to
workers in non-agricultural sector and as a result the proportion of agricultural workers is noted
low
From the above discussion, it is clear that, areas which are far away from industrialized and
urbanized areas have high proportion of agriculture workers. Whereas with areas with small land
holdings and have major urban and industrialized centers like Jalandhar, Ludhiana, Gurgaon,
Fridabad, Delhi, tricity of Mohali, Chandigarh, Panchkula the proportion of agricultural workers
is low. But areas lying between these two categories of high and low proportion are having
moderate share of agricultural workers because these are having moderate magnitude of
urbanization and industrialization, but are good in agriculture.
CULTIVATORS
A person who cultivates land either of his own or on rent for cultivation, for money, kind or
share of crop is called as cultivators. In Punjab and Haryana plains the proportion of cultivators
to the total agricultural workers is 58.71 per cent according to 2011 census. Proportion of
cultivators varies 40.67 per cent in Fazilka district and 79.55 per cent in Mahendragarh district.

Research Cell: An International Journal of Engineering Sciences ISSN: 2229-6913 Issue April 2018, Vol. 28 23
Research Cell: An International Journal of Engineering Science, Special Issue April 2018, Vol. 28,
UGC Approved Journal (S.No.63019) ISSN: 2229-6913(Print), ISSN: 2320-0332(Online), Web Presence: http://ijoe.vidyapublications.com
© 2018 Vidya Publications.Authors are responsible for any plagiarism issues.
To know this great variation in the distribution of cultivators figured 3 is mapped which portrays
three categories. These categories are discussed below:
1. Category of high per cent share of cultivators (>65 per cent): Five districts comprise this
category which are confined to south-western parts of the study region and form a continuous
belt. Districts fall in this category are Bhiwani, Rohtak, Jhajjar, Mewat, Mahendragarh and
Rewari. In case of Rohtak and Jhajjar majority of the landless labourers preferred to work in
factories and in other services in the cities of Gurgaon, Faridabad and Delhi. In other districts
owing to low literacy, small size of landholding and less developed agricultural infrastructure
farmers hardly use hired labour because of the avalability of family labour. These are main
reasons for high proportion of cultivators in this category.
2. Category of moderate per cent share of cultivators (50-70per cent): This category
comprises the districts namely Gurdaspur, Amritsar, Tarn Taran, Kapurthala, Hoshiarpur,
Rupnagar, S.A.S. Nagar, S.B.S. Nagar, Panchkula, Jalandhar, Firozpur, Moga, Ludhiana,
Barnala, Bathinda, Sangrur, Mansa, Fatehgarh Sahib, Patiala, Sirsa, Kaithal, Panipat, Sonipat,
Faridabad, Palwal, Hisar and Gurgaon. It is found in one compact belt and two patches. In all
these areas, proportion of cultivators varies from 50 to 70 per cent which shows that farmers
cultivate there land without hiring large number of agricultural laborers.

24 Poonam Bharti, Dr. Shivjeet Kour
Research Cell: An International Journal of Engineering Science, Special Issue April 2018, Vol. 28,
UGC Approved Journal (S.No.63019) ISSN: 2229-6913(Print), ISSN: 2320-0332(Online), Web Presence: http://ijoe.vidyapublications.com
© 2018 Vidya Publications.Authors are responsible for any plagiarism issues.
Table no. 3
Punjab-Haryana plains: per cent share of cultivators to total workers-2011
Sr.No. Districts Per cent of agricultural workers
1 Gurdaspur 59.98
2 Pathankot 49.59
3 Amritsar 50.61
4 Tarn taran 58.78
5 Kapurthala 56.58
6 Jalandhar 56.24
7 Nawashaher 65.31
8 Hoshiarpur 54.69
9 Rupnagar 67.95
10 S.A.S. Nagar 65.22
11 Ludhiana 58.79
12 Firozpur 53.80
13 Fazilka 40.67
14 Faridkot 49.61
15 Muktsar 43.81
16 Moga 52.65
17 Bathinda 52.43
18 Mansa 53.97
19 Sangrur 63.13
20 Barnala 60.86
21 Patiala 55.94
22 Fatehgarh Sahib 67.41
23 Ambala 47.99
24 Panchkula 67.53
25 Yamunanagar 45.64
26 Kurukshetra 44.51
27 Kaithal 59.91
28 Karnal 45.64
29 Panipat 53.62
30 Sonipat 58.31
31 Rohtak 74.02
31 Jhajjar 71.47
33 Faridabad 48.61
34 Gurgaon 67.40
35 Rewari 78.44
36 Mahendragarh 79.55
37 Bhiwani 73.54
38 Jind 69.29
39 Hisar 65.42
40 Fatehabad 57.43
41 Sirsa 52.77
42 Mewat 65.34
43 Palwal 60.12
Average 58.70
Source: Economic and Statistical Organization of Punjab and Haryana

Research Cell: An International Journal of Engineering Sciences ISSN: 2229-6913 Issue April 2018, Vol. 28 25
Research Cell: An International Journal of Engineering Science, Special Issue April 2018, Vol. 28,
UGC Approved Journal (S.No.63019) ISSN: 2229-6913(Print), ISSN: 2320-0332(Online), Web Presence: http://ijoe.vidyapublications.com
© 2018 Vidya Publications.Authors are responsible for any plagiarism issues.
These labourers also prefer to work in urban centers like Jalandhar, Amritsar, Ludhiana, Patiala,
Panipat, Faridabad and Gurgaon etc. secondly in all these areas, agriculture is modernized and
farmers prefer seasonal labor which generally comes from UP and Bihar during peak like
transplantation of rice and harvesting of rice and wheat crops. Owing to the above mentioned
reasons, the proportion of agricultural labor force is noted low which consequently lead to
moderate share of cultivators.
3. Category of low per cent share of cultivators (<50 per cent): It is found in two belts
and one patch. First belt contains the districts of Fazilka, Muktsar, Faridkot. Here the size of land
holding is large and farmers have to hire agricultural labourer on large scale for doing farm
work. Moreover, it is very lagging behind areas in respect of literacy and agricultural
infrastructure. The second belt is having four districts namely Ambala, Kurukshetra,
Yamunanagar and Karnal. Here most of the farmers hire labour force owing to moderate to large
size of lands supplemented by fertile lands. Among them some of the farmers are absentee land
lords who don’t cultivate their lands themselves and hire more agricultural labour force which
resulted into low share of cultivators. In Faridabad, the number of cultivator is also low because
here also farmers prefer to work in factories or in urban areas and thus most of the work is done
by hire labour force in their lands. In case of Pathankot, the terrain is hilly and some farmers are
very big landlords which prefer to hire agricultural labour force for doing their
Thus above discussion reveals that areas with small size of land holdings, nearness to the major
urban centers like Delhi, Gurgaon, Panchkula, S.A.S. Nagar, etc. have high share of cultivators.
While, areas which are far away from the major urban centers and having large size of land
holdings are having low per cent share of cultivators. But areas with urbanization,
industrialization and moderate size of land holdings have moderate proportion of cultivators.
AGRICULTURAL LABORERS
Any person who worked on others land for wages whether in cash or kind or share is regarded as
an agricultural laborer. Such a person has no risk in cultivation because he worked in another
person’s land for wages. Moreover, an agricultural laborer had no right of lease or contract of
land on which he worked.
Share of agricultural laborers to the total agricultural workers is 41.29 per cent in Punjab-
Haryana plains. But this average of 41.29 per cent is not uniformly distributed throughout the
study region. It is lowest of 20.45 per cent in Mahendragarh district and highest 59.33 per cent)
in Fazilka district. To know the spatial variations in agricultural laborers fig. 4 is mapped which
depicts three categories and these are discussed below:
1. High proportion of agricultural laborers (over 50 per cent):
This category does not found in a compact belt, but it is scattered in two belts and one patch.
First belt of this category comprises the districts of Fazilka, Muktsar and Faridkot. Here the per
cent share of agricultural laborer is higher owing to the large size of land holdings and as a result

26 Poonam Bharti, Dr. Shivjeet Kour
Research Cell: An International Journal of Engineering Science, Special Issue April 2018, Vol. 28,
UGC Approved Journal (S.No.63019) ISSN: 2229-6913(Print), ISSN: 2320-0332(Online), Web Presence: http://ijoe.vidyapublications.com
© 2018 Vidya Publications.Authors are responsible for any plagiarism issues.
farmers require a large number of work forces to work on their farms. Secondly, it is backward
area from the point of literacy, urbanization, industrialization and agricultural infrastructural
facilities etc. Thus the landless workers do not have enough opportunities to earn their livelihood
from non-agricultural sector. Therefore they have to confine themselves to agricultural sector for
earning their livelihood on other land. The second belt of this category comprises the districts of
Ambala, Yamunanagr, Kurukshetra and Karnal. In this part of the study region, moderate size of
land holdings and intensive cultivation which required more agricultural labourers. Though some
of the landless labourers go to Panchkula S.A.S. Nagar and Chandigarh for working in industries
yet these tricities are far away from the districts of Yamunanagr, Ambala, Kurukshetra and
Karnal. Therefore the share of agricultural labourer is noted high. While in Pathankot tehsil, the
land is less fertile land, large size of land holdings; low agricultural modernization, etc. are
responsible for high share of agricultural laborers.
Table No. 4
Punjab-Haryana plains: Agricultural laborers in 2011

Research Cell: An International Journal of Engineering Sciences ISSN: 2229-6913 Issue April 2018, Vol. 28 27
Research Cell: An International Journal of Engineering Science, Special Issue April 2018, Vol. 28,
UGC Approved Journal (S.No.63019) ISSN: 2229-6913(Print), ISSN: 2320-0332(Online), Web Presence: http://ijoe.vidyapublications.com
© 2018 Vidya Publications.Authors are responsible for any plagiarism issues.
Sr.No. Districts % Share of agricultural workers
1 Gurdaspur 40.02
2 Pathankot 50.41
3 Amritsar 49.39
4 Tarn taran 41.22
5 Kapurthala 43.42
6 Jalandhar 43.76
7 Nawashaher 34.69
8 Hoshiarpur 45.31
9 Rupnagar 32.05
10 S.A.S. Nagar 34.78
11 Ludhiana 41.21
12 Firozpur 46.2
13 Fazilka 59.33
14 Faridkot 50.39
15 Muktsar 56.19
16 Moga 47.35
17 Bathinda 47.35
18 Mansa 46.03
19 Sangrur 36.87
20 Barnala 39.14
21 Patiala 44.06
22 Fatehgarh Sahib 32.59
23 Ambala 52.01
24 Panchkula 32.47
25 Yamunanagar 54.36
26 Kurukshetra 55.49
27 Kaithal 40.09
28 Karnal 54.36
29 Panipat 46.38
30 Sonipat 41.69
31 Rohtak 25.98
32 Jhajjar 28.53
33 Faridabad 48.61
34 Gurgaon 32.6
35 Rewari 21.56
36 Mahendragarh 20.45
37 Bhiwani 26.46
38 Jind 30.71
39 Hisar 34.58
40 Fatehabad 42.57
41 Sirsa 47.23
42 Mewat 34.66
43 Palwal 39.88
Average 41.29
Source: Economic and Statistical organization of Punjab and Haryana
2. Moderate proportion of agricultural laborers (35-50 per cent): It contains 69.77 per
cent of the total occurrences and is a predominant category of the study region. It has one large
compact belt and one patch. The compact belt comprises 26 districts namely Gurdaspur,
28 Poonam Bharti, Dr. Shivjeet Kour
Research Cell: An International Journal of Engineering Science, Special Issue April 2018, Vol. 28,
UGC Approved Journal (S.No.63019) ISSN: 2229-6913(Print), ISSN: 2320-0332(Online), Web Presence: http://ijoe.vidyapublications.com
© 2018 Vidya Publications.Authors are responsible for any plagiarism issues.
Amritsar, Tarn Taran, Faridkot, Firozpur, Hoshiarpur, S.B.S. Nagar, S.A.S.Nagar, Rupnagar,
Fatehgarh Sahib, Kapurthala, Jalandhar, Moga, Ludhiana, Barnala, Bathinda, Sirsa, Mansa,
Sangrur, Patiala, Panchkula, Kaithal, Jind, Panipat, Sonipat and Fatehabad, . The per cent age of
agricultural laborer is high in the districts of Gurdaspur,Tarn Taran, Amritsar, Hoshiarpur,
Kapurthala and Jalandhar because of the existence of industrial centers of Amritsar, Kapurthala
and Jalandhar. In Hoshiarpur district, most of the people are in army and paramilitary forces
which are mostly landless people. While in Ludhiana district, moderate rate is owing to
industrialization because many people engaged in industrial activities and consequently share of
agricultural labourer come down to moderate. Whereas, in Firozpur, Bathinda, Moga, Barnala,
Mansa, Sangrur, Patiala, Kaithal, Fatehabad and Sirsa, Jind districts, the proportion of
cultivators is also of moderate nature which is resulted into moderate proportion of agricultural
laborers. While, in case of Panipat, Sonipat, Faridabad and Palwal, these are industrially
developed and also very close to Delhi. Thus, majority of the landless laborers do works in
factories and other establishments in Delhi which consequently lead to moderate share of
agricultural laborers.
3. Low proportion of agricultural laborer (less than 35 per cent):
It covers 5 districts and contains 11.63 per cent of the total occurrences. This category is
confined to southern parts of the study region and comprises the districts of Bhiwani, Rohtak,
Mahendragarh, Jhajjar and RewarI. Jhajjar and Rohtak are very close to the vicinity of Delhi
which attract people for work in non-agriculture sector and led to low per cent share of
agriculture labor force. But in rest of the districts, namely Bhiwani, Mahendragarh and Rewari
the socio-economic backwardness , far away from the major urban centers, under developed
agriculture, small size of land holdings are responsible for low share of agricultural laborers.
In respect of agricultural laborers, it is found that their share is high (over 50 per cent) in
districts where the size of land holdings is large and farmers hire agricultural laborers for doing
work at their farms. While the proportion of agricultural laborers is low in districts which are
lying near the Delhi, where most of the workers preferred to work in industries and urban centers
where wages are high as compared to agriculture. And secondly there are districts like Jind,
Bhiwani, Rewari and Mahendragarh where owing to socio-economic backwardness and poor
condition of agriculture, farmers prefer to use family labor at their farms in place of hiring
agricultural laborers. But, majority of the districts have moderate share of agricultural workers.
CONCLUSION
It is concluded that areas of high proportion of workers over 38 per cent are found in western
parts of the study region which are agriculturally lagging behind, comparatively having low
density of population and far away from urban and industrialized areas. While, the category of
low share of less than 34 per cent is lying along the eastern parts which are problematic areas
from agricultural point of view. Including the districts of Pathankot, Gurdaspur, Hoshiarpur, SBS

Research Cell: An International Journal of Engineering Sciences ISSN: 2229-6913 Issue April 2018, Vol. 28 29
Research Cell: An International Journal of Engineering Science, Special Issue April 2018, Vol. 28,
UGC Approved Journal (S.No.63019) ISSN: 2229-6913(Print), ISSN: 2320-0332(Online), Web Presence: http://ijoe.vidyapublications.com
© 2018 Vidya Publications.Authors are responsible for any plagiarism issues.
Nagar, Rupnagar, Ambala and Yamunanagar. Except these areas of low category there are some
more districts of this category which are lying around Delhi. From these districts some of the
people have migrated to Delhi for their livelihood and settled down which resulted into low share
of workers. But the moderate category of workers is lying between the categories of low and
high workers which is a predominant one and is industrially and agriculturally highly advanced.
In case of agricultural workers it is deduced that areas which are far away from industrialized
and urbanized areas have high proportion of agricultural workers (over 50 per cent). Whereas,
areas with small land holdings, unfriendly terrain from agricultural point of view lying along the
Shiwalik foothills and other areas are having major urban centers like Ludhiana, Panipat,
Gurgaon, Amritsar, Faridabad, Mohali, and Panchkula, have registered low proportion of
agricultural workers. But areas lying between these two categories of high and low proportion
are having moderate share of agricultural workers because these are having moderate magnitude
of urbanization and industrialization.
In respect of cultivators it is observed that areas with small size of land holdings, agriculturally
lagging behind and near to the major urban centers like Delhi, Gurgaon and Faridabad have
high share of cultivators because laborers prefer to work in industry as compared to agriculture.
While, areas which are far away from the major urban centers and with large size of land
holdings are having low per cent share of cultivators. But areas with urbanization,
industrialization or moderate size of land holdings have moderate proportion of cultivators.
In lieu to agricultural laborers, it is found that their share is high (over 50 per cent) in districts
where the size of land holdings is large and farmers have to hire more agricultural laborers for
doing work at their farms. Their proportion is low in districts namely Rohtak, Jhajjar, Bhiwani,
Mahendragarh and Rewari which are lying near the urban centers like Delhi, Gurgaon and
Faridabad where most of the workers preferred to work in industries and urban centers where
wages are high as compared to agriculture and secondly these districts are lagging behind
socially, economic and agriculturally. And as a result farmers use family labor at their farms in
place of hiring agricultural laborers. But, majority of the districts particularly in the study region
have moderate share of agricultural laborers.
SUGGESTIONS
It is suggested that work force should be compensated by Government like life-insurance,
minimum assured wages for their sustainability.
REFERENCES
[1] Census of India: 2011
[2] Economic and Statistical Organization of Punjab.

30 Poonam Bharti, Dr. Shivjeet Kour
Research Cell: An International Journal of Engineering Science, Special Issue April 2018, Vol. 28,
UGC Approved Journal (S.No.63019) ISSN: 2229-6913(Print), ISSN: 2320-0332(Online), Web Presence: http://ijoe.vidyapublications.com
© 2018 Vidya Publications.Authors are responsible for any plagiarism issues.
[3] Economic and Statistical Organization of Haryana.
[4] Husain, Masjid. “Systematic Agricultural Geography, Rawat Publications, Jaipur and New
Delhi, p. 127, 1997.
[5] Ilbery, Brian W. “Agricultural Geography: a social and economic analysis, published in the
united states by Oxford university press. New York, p.105, 1985
[6] Manigandan, R. and Vetrivel, V,“An Empirical Study of Agricultural Labor in India”,
Journal of Exclusive Management Science, December 2013, Vol.2, No.12, p.1. 2013
[7] Morgan William Basin and Pugh John Charles, “Agricultural Geography” published by
University of London, king’s college, p.47, 1971
[8] Mamoria, C.B, “Agricultural Problems of India”, Kitab Mahal, Thornhill Road, Allahabad,
p.15, 1976
[9] Padhi, Kulamani, “Agricultural Labor in India- A Close Look”, Orissa Review.p.1, 2007
[10] Rawal, Vikas, “Agricultural Labor and Unfreedom: Siri workers in a village in Western
Haryana”, The Marxist, Vol. 20, No.02, p.1, 2004
[11] Singh, Ram Partap, “Spatial Pattern of Occupational Structure in Haryana”, Indian Journal
of Research, Vol.420.p.1, 2015
[12] Symons, Leslie J ”Agricultural Geography” printed in Great Britian by Neill and Co. Ltd,
Edinburgh, p. 84, 1968