Embed Size (px)
Citation preview
Munich Personal RePEc Archive
Push and Pull Factors of Migration: A
Case Study of Brick Kiln Migrant
Workers in Punjab
Kainth, Gursharan Singh
Guru Arjan Dev Institute of Development Studies
January 2010
Online at https://mpra.ub.uni-muenchen.de/30036/
MPRA Paper No. 30036, posted 10 Apr 2011 08:44 UTC
Push and Pull Factors of Migration: A Case Study of Brick Kiln
Migrant Workers in Punjab
Dr Gursharan Singh Kainth is Director Guru Arjan Dev Institute of Development
Studies, 14-Preet Avenue, Majitha Road, PO Naushera, Amritsar-143 008
Migration is a global phenomenon. Uneven economic development, inter-regional disparity and
differences in living standards between socio-economic groups are some of the important reasons
responsible for migration. Avenues of better employment and higher wages serve as pull factors,
where as non-availability of employment opportunities in backward regions, draught and scarcity
conditions are push factors. Migration is the third component of population change, the other
two being mortality and fertility which work in a biological framework whereas migration is
influenced by the wishes of the persons involved. Usually each migratory movement is
deliberately made, though in exceptional cases this may not hold true. Thus migration is a
response of human organisms to economic, social, political and demographic forces in the
environment and an important symptom of social change in society.
The term migration is so broad that it lends itself to various connotations and interpretations
which are due to the differences in the nature, scope or purpose of the study or discussion.
Sociologists have emphasized social and cultural consequences of migration. While geographers
have laid stress on the time and distance significance of migration, economists give importance
to the economic aspect of migration. Dictionaries generally refer to migration as a change in
residence from one place to another. According to the Oxford Advanced Learner’s Dictionary
of current English, to migrate means to “move from one place to another (to live
there).”According to the Webster’s New World Dictionary, it means “move from one place to
another, especially to another country.” or “to move from place to place to harvest seasonal
crops.” According to Demographic Dictionary, “migration is a form of geographical mobility
or spatial mobility between one geographical unit and another, generally involving a change in
residence from place of origin or place of departure to the place of destination or place of
arrival.”
The Inter-State Migrant Workmen (Regulation of Employment and Conditions of Service)
Act, 1979 defines a migrant workman as any person who is recruited by or through a contractor
2
in any state under an agreement or other arrangement for employment in an establishment in
another state whether with or without the knowledge of the principal employer of such
establishment. The present study is concerned with the migrant who has changed his/her place of
residence from a state other than Punjab and is working in brick-kiln industry as worker.
Duration of his/her stay in Punjab has not been taken into consideration.
CAUSES OF MIGRATION
It is interesting to know why some people migrate while others do not. The important factors
which motivate people to move may broadly be classified into five groups discussed below:
Economic Factors
Despite the relevance of non-economic factors most of the studies indicate that migration is
primarily motivated by economic factors. In large number of developing countries, low
agricultural income, agricultural unemployment and underemployment are considered basic
factors pushing the migrants towards prosperous or dynamic areas with greater job opportunities.
Even the pressure of population resulting in a high man-land ratio has been widely recognized as
one of the important reasons of poverty and rural out migration. Thus, almost all studies concur
that most of the migrants (excluding forced and sequential migrants) have moved in search of
better economic opportunities. This is an accepted fact in both internal as well as international
migration. The basic economic factors which motivate migration may be further classified as
‘Push Factors’ and ‘Pull Factors’. In other words people migrate due to compelling
circumstances which pushed them out of the place of origin or they are lured by the attractive
conditions in the new place.
The push factors are those that compel a person, due to different reasons, to leave that place and
go to some other place. For instance, low productivity, unemployment and underdevelopment,
poor economic conditions, lack of opportunities for advancement, exhaustion of natural
resources and natural calamities may compel people to leave their native place in search of better
economic opportunities. In most developing countries, due to population explosion land-man
ratio has declined resulting in significant increase in unemployment and underemployment.
Introduction of capital intensive methods of production into the agricultural sector, and
mechanization of certain processes reduce labour requirements in rural areas. The non-
availability of alternative sources of income (non-agricultural activities) in rural areas is also
important factor for migration. In addition to this, the existence of the joint family system and
3
laws of inheritance, which do not permit the division of property, may also force many young
men to move out to cities in search of jobs. Even sub division of property leads to migration, as
the property become too small to support a family.
The Pull factors refer to those factors which attract the migrants to an area, such as,
opportunities for better employment, higher wages, facilities, better working conditions and
amenities etc. There is generally city ward migration, when rapid growth of industry, commerce
and business takes place. “Migration from the country side to the cities bears a close functional
relation to the process of industrialization, technological advancement and other cultural changes
which characterize the evolution of modern society in almost all parts of the world. Under the
capitalistic model of development, there is a tendency for large proportion of investments to
concentrate in the urban centers which encourage people to move to urban areas in the
expectation of higher paid jobs. In recent years, the high rate of migration of people from India
as well as from other developing countries to U.K., U.S.A., Canada and Middle East is due to the
better employment opportunities, higher wages and the chances of attaining higher standard of
living. Sometimes the people are also attracted to cities in search of better cultural and
entertainment activities. Thus, pull factors operate not only in the rural-urban migration, but also
in other types of domestic as well as international migration.
The question arises: Which factors is more important push or pull? The researchers are divided
on this issue. Some researchers argue that the push factor is stronger than the pull factor as they
feel that it is the rural problems rather than the urban attractions that play a dominating role in
the migration of the population. On the other hand, those who consider the pull factors as more
important emphasize high rates of investment in urban areas leading to more employment and
business opportunities and greater attraction for the urban way of life. There is a third category
of researchers who argue that both push and pull factors are closely interrelated; those who are
pushed into migration are simultaneously pulled by the expectation of finding something better
elsewhere.
Demographic Factors
The differences in the rates of population increase between the different regions of a nation have
been found to be a determinant in the internal migration. Fertility and the natural increase in
population are generally higher in rural areas which drift the rural population towards the city.
Paucity of domestic labour supply promoted immigration to a number of countries like Canada,
4
The United States, New Zealand, Australia and gulf countries etc. Other important demographic
factor in internal migration is marriage. The female migration is largely sequential to marriage,
because it is a Hindu custom to take brides from another village. According to National Sample
Survey, more than 46 per cent migration to urban areas is caused by marriage. The custom of
women returning to her parents to deliver her first child also accounts for significant internal
migration.
Socio-Cultural Factors
Social and cultural factors also play an important role in migration. Sometimes family conflicts,
the quest for independence also cause migration especially, of those in the younger generation.
Improved communication facilities, such as, transportation, impact of the television, the cinema,
the urban oriented education and resultant change in attitudes and values also promote migration.
Political Factors
Sometimes even political factors encourage or discourage migration from region to another. For
instance, in India, the reservation of the jobs for ‘sons of the soil policy’ by the state
governments will certainly discourage the migration from other states. Nair (1978) observed that
14.5 per cent of those who left their native places in Tamil Nadu because of lack of job
opportunities “stated that lack of job opportunities was the result of anti-Brahmanism
perpetuated by the D.M.K. government in Tamil Nadu”. Hence, the political background,
attitudes and individual viewpoint of the people exercise a significant influence on the migration
of the people.
Miscellaneous Factors
In addition, a number of other factors, such as the presence of relatives and friends in urban areas
who mostly provide help, desire to receive education which is available only in urban areas are
factors responsible for migration. Migration is considerably influenced by factors such as the
closeness of cultural contracts, cultural diversity etc. Great vitality, strong self-assertion,
individualistic attitude etc. are personality traits associated with a high propensity to migrate.
LABOUR LEGISLATIONS AND THE MIGRANT WORKERS IN PUNJAB
The government of India has enacted an elaborate protective legislation against the exploitation
of labour. Article 23(1) of constitution prohibits forced labour in India. Labour being a subject in
the concurrent list both the central and the state governments can legislate in the matters
concerning labour. A large number of central and state labour laws are claimed to be
5
implemented by the Punjab government. Though all labour legislations like Minimum Wages
Act, 1948, Employees Provident Fund Act, 1952, Industrial Disputes Act, 1947, Workmen’s
Compensation Act 1923 etc. are also applicable to the migrant workers. But to check the
exploitative system, The Inter-State Migrant Workmen (Regulation of Employment and
Conditions of Service) Act was enacted in 1979 for the protection of the migrant workers.
However, the protection available under the Act has failed to provide any relief to the migrant
workers. Even the National Commission on Rural Labour (1991) observed that the ISMW Act
by and large has remained on paper. At present this Act lies as dead Act in the state. There is no
implementation of this Act at all. Migrant workers do not get minimum wages, they stay in sub
standard huts without adequate toilet, water and cooking facilities. What to talk about other
benefits available under this Act, there is not even a single case of registration of migrant
workers or any establishment employing them.
Apparently, many efforts are required to give justice to the migrant workers and redressed of
their grievances. Much distance is left to be covered for the improvement of working and living
conditions of the migrant workers so that they can live with dignity and freedom.
SIGNIFICANCE OF THE PRESENT STUDY
Recent development has undergone number of changes in the structure of economy. The
old modes of production are being replaced by the new ones. This is more appropriate under the
capitalistic mode of production. Labour becomes a commodity like other commodities as
capitalism develops leading to the change in relationship between the labour and the
management. A planned development process was introduced after independence. As the
resources were limited, therefore, these were diverted to those areas which had more potential
leading to regional imbalances. Under this strategy, some northern states took the benefit by
developing agricultural sector. Due to the gap between demand and supply of labour people
started moving from the backward regions to the prosperous regions like Punjab. This process of
migration has become a permanent feature.
The present study is an attempt to understand the phenomenon of labour migration. It
purports to inquire into pull and push factors of migrant workers working in brick kiln industry
of Punjab. Specifically, the objectives of the study are:-
1. To examine the socio-economic characteristics of migrant workers working in brick kiln
industry.
6
2. To examine the participation of migrant workers in the trade union activities and their level
of awareness about the labour legislations.
3. To identify the characteristics which influence the level of satisfaction of the brick
kiln migrant workers?
4. To suggest suitable recommendations for the protection and welfare of the migrant workers.
THE UNIVERSE AND THE SAMPLE
The universe of the study is brick kiln migrant workers of Punjab. Brick kiln industry
has been selected because the preliminary investigation revealed that the migrant workers
constituted a very high proportion of the workers working in this industry in Punjab.
Further, the study was restricted to Amritsar, Jalandhar and Ludhiana districts of Punjab.
Purposive sampling method has been used to select the sample for the present study.
There are about 2 Lakh workers working in 2500 brick kiln units spread across Punjab.
The workers in the brick kiln industry can be broadly divided into following categories
Patheras, Zalaiwalas and Nakasiwalas. The moulders (or Patheras as they are locally
known) are allotted a piece of land by the owner where the workers have to dug the earth
and then wet it with water to make the mud suitable for moulding process. Generally for
moulding, the whole family is engaged, including young children. Moulders mostly hail
from U.P. and Chhattisgarh. Zalaiwalas manually charge the coal in the kilns and
Nakasiwalas bring out the pucca bricks from the chamber of the brick kiln and place
them manually at a place decided by the owner. Nakasiwalas mostly hail from Rajasthan
and Zalaiwalas from Bihar.
A sample of 200 workers (60, 70 and 70 workers from Amritsar, Jalandhar and Ludhiana
districts respectively were taken. A structured interview schedule was prepared covering
personal data, job characteristics, motivational aspects, participation in union and
awareness about labour legislations.
DATA COLLECTION
The present study is survey based relying mainly on the primary data collected from the
migrant workers with the help of well-drafted pre-tested structured interview schedule.
However, the secondary data have also been used, wherever necessary. The secondary
data were collected from Central Statistical Organization, the Office of Labour
Commissioner Punjab, and Labour Bureau, Chandigarh, various issues of the Statistical
7
Abstracts of Punjab, various issues of Annual Survey of Industries, records maintained by
Punjab Brick Kiln Owners Association, Bricks and Tiles News published by the All India
Brick and Tile Manufacturer’s Federation, records maintained by various trade unions.
METHODOLOGY
Commensurate with the different objectives of the study, various tools of analysis
have been employed. Statistical Package for Social Science (SPSS) version 7.5 for
Windows has been used to perform the statistical analysis. Tabular analysis was carried
out to examine the socio economic profile of migrant workers and to study the perception
of migrant workers on trade unions and labour laws. To ascertain the level of satisfaction
of migrant workers on the basis of selected personal, demographic and job characteristics,
cross tabulation analysis has been used. Cross tabulation is applicable to all types of
categorical variables: one in which the different categories of variable cannot be
quantified, such as marital status, gender, type of occupation etc. and one in which the
different categories are associated with quantifiable number, such as age, income etc. or
imprecisely quantifiable numbers such as income, respondents’ agreement or
disagreement with a particular attitude.
For this purpose, the two levels of satisfaction, namely, high and low were
generated as follows: we first found the weighted response score in respect of seven
statements relating to different attributes of the job satisfaction for each and every
response measured on a five point Likert scale. These weighted response scores were
then aggregated across all the brick kiln respondents in the sample and the average score
thereafter was determined. The calculated average score was 19.70 .The respondents
experiencing score higher than the average were classified as having high level of
satisfaction whereas the ones having score less than or equal to the average were
classified as having low level of satisfaction. In this way, 99 workers fall in the low level
of satisfaction category and 101 workers in the high level of satisfaction category in case
of brick kiln industry.
Reliability of attitude scales constructed was measured by using Cronbachs Alpha. The
estimated value at 0.67 reveals that the scales used for measuring opinion of workers was
found consistent in their measurement.
8
FACTOR ANALYSIS
To identify the factors which influence the inter-state migration process of brick-
kiln workers, Factor Analytic Approach has been used. Designated as the queen of
analytical methods because of its power and elegance, the general purpose of factor
analytic technique is to find a way in condensing (summarizing) the information
contained in a number of original variables into a smaller set of new, composite
dimensions (factors) with a minimum loss of information, that is, to search for and define
the fundamental constructs or dimensions assumed to underlie the original variables. The
suitability of the data for factor analysis can be tested on the basis of following criterion:
� A visual inspection of the correlation data matrix can reveal whether there are
sufficient correlations to justify factor analysis.
� Anti-image correlation matrix shows the negative values of partial correlation among
variables. In order for true factors to exist in the data these values must be small.
� Kaiser-Meyer-Olkin Measure of Sampling Adequacy (KMO) is another measure to
quantify the degree of inter-correlations among the variables and appropriateness of
factor analysis. The index ranges from 0 to 1. Small values for KMO measure
indicate that a factor analysis of variables may not be a good idea, since correlation
between pairs of variables cannot be explained by the other variables. A high value
between 0.5 and 1.0 indicates that the factor analysis is appropriate technique to be
used.
There are two basic models, known as common factor and principal components analysis,
to obtain factor solutions. Selection of the extraction method depends upon the analysts’
objective. Principal Component Analysis is used when the objective is to summaries
most of the original information (variance) in a minimum number of factors for
prediction purposes. In contrast, Common Factor Analysis is used primarily to identify
underlying factors or dimensions reflecting what the variables share in common. In the
present study principal components method of factoring has been used. It is a statistical
technique that linearly transforms an original set of variables into a substantially smaller
set of uncorrelated variables that represents most of the information in the original set of
variables. A small set of uncorrelated variables is much easier to understand and use than
a larger set of correlated variables. The linear combinations of variables are used to
9
account for variation (spread) of each dimension in a multivariate space. The variance of
the factors is called Eigen Values, Characteristic Root or Latent Root. Communality is
the amount of variance an original variable shares with others. Factor loadings are the
correlation between the original variable and the factor. Squared factor loadings indicate
what percentage of the variance in an original variable is explained by a factor.
When the set of variables is large the analyst first extracts the largest and best
combinations of variables and then proceeds to smaller less understandable combinations.
Hence, the number of factors to be extracted becomes an important issue in the absence
of any set criterion. The four possible criteria are: (i) In a Priori Criterion, the analyst
already knows how many factors to extract and accordingly instructs the computer; (ii) In
Latent Root Criterion, only those factors which have latent roots greater than 1 are
considered significant; (iii) In Percentage of Variance Criterion, the cumulative
percentage of variance extracted by successive factors is considered. In social sciences it
is common to consider a solution satisfactory when it accounts for 60 per cent of the total
variance (and sometimes even less); and (iv) In Scree Test Criterion, at least one factor
more than latent root criterion is usually extracted. The later factors extracted in principal
component factor analysis model, contain both common and unique variance – the
proportion of unique variance is much higher in later than in earlier factors. The Scree
Test is used to identify the optimum number of factors that can be extracted before the
amount of unique variance begins to dominate the common variance structure. In the
present study exploratory efforts were made with all of the above methods. Initially,
latent root was used as guideline and then the Scree test was used. In all the attempts
percentage of the explained variance was also taken into consideration. Further an
interpretation and assessment of the structure matrix was made in each case. Thus several
factors solutions with different number of factors were examined before a satisfactory
solution was reached.
Factor Rotation
An important step in factor analysis is the rotation of factors. Loadings are rotated
to make them more interpretable by making the loadings for each factor either large or
small, not in between. For rotation, either Orthogonal or Oblique method can be
employed. In Orthogonal Rotation method, the axes are maintained at 90 degrees so that
10
the resulting factors are uncorrelated. In Oblique Rotation method, the axes are rotated,
without maintaining the 90 degree angle between them. This makes the method more
flexible. However, analytical procedure for oblique rotations is still controversial. Within
orthogonal method, either Varimax or Quatrimax method can be employed. Varimax
method simplifies the columns in a matrix whereas Quatrimax method stresses on
simplifying the rows. In the present study, Orthogonal Rotation along with the Varimax
method of rotation of factors was used in order to have more clarity in factor solution.
Varimax Rotation is probably the most popular Orthogonal Rotation Procedure. The
Varimax criteria maximize the sum of the variances of the squared loadings within each
column of the loading matrix. This tends to produce some high loadings and some
loadings near zero, which is one of the aspects of simple structure .So in view of the
above analysis, this statistical approach has been used to condense the information
collected by using the interview schedule on 15 selected statements to know the
perceptions of the migrant textile and brick-kiln workers on the important aspects related
to pull and push factors of migration. The naming of factors is done by the factor analyst
depending upon its appropriateness for representing the underlying dimensions of a
particular factor.
LIMITATIONS OF THE STUDY
The present study was restricted to the state of Punjab only. The socio-economic
characteristics of workers being different in other parts of the country, the results of the
study can be successfully generalized only if characteristics of workers are similar.
Further the study is based on the perception of workers only and the perception of
management of the organizations and the officials of the labour department might be
different. The workers might be under the influence of the management hence true
responses might not be found.
SOCIO ECONOMIC PROFILE OF MIGRANT WORKERS
The Socio-economic characteristics of the migrants have been thoroughly researched and
debated by the researchers. The general consensus among the researchers is that young people
are more mobile. It makes sense in economic terms since the discounted value of future earnings
would be higher for the younger people. Another important characteristic is that the migrants
tend to be sex-selective, with men dominating the migratory flow. The well-to-do people
11
generally like to move to cities from rural areas together with female members, while in case of
people belonging to lower economic stratum; it becomes difficult to meet the normal expenses of
non-earning females. Furthermore, an individual migrant is usually more educated than the
population in his place of origin, but at the same time the migrants are not always drawn from
the educated lot. A large number of poor and uneducated people leave the rural areas in search of
employment. The only difference is that rich people migrate willingly for better and comfortable
life, while the poor people migrate due to economic hardships. There are many more factors
which describe the profile of the migrants and hence the list is inclusive.
In view of the above an attempt has been made to analyze the personal / demographic and socio-
economic factors relating to the respondents. The origin wise distribution of the migrant workers
reveals that the majority i.e. 45.00 per cent belonged to Uttar Pradesh. The four major sending
out states are Uttar Pradesh, Rajasthan, Chhattisgarh and Bihar. The results indicate that the
brick-kiln industry does not have migrant workers from the states of Himachal Pradesh,
Uttranchal and Nepal. Census of India (1991) too indicated that Uttar Pradesh and Bihar were the
states from where the bulk of the migrant labour came to Punjab. A closer look at the native
places of migrant labourers shows that the majority of them hail from the economically
backward areas of Uttar Pradesh and Bihar i.e., Eastern Uttar Pradesh and North Western Bihar.
Age of the workers is considered an important factor which influences their decision to migrate.
Generally young people (77 per cent) falling in the age group of 20 to 40 are more mobile. This
makes sense in economic terms since the discounted value of the future earnings would be higher
for the young people. They are less encumbered with various family and other social
responsibilities and hence free to move. During the field survey it was observed that child and
female labour was also present in the brick-kiln industry. Furthermore, 91.5 per cent were male
and 8.5 per cent were female. It is worth mentioning, here, that the moulders, migrate along with
their families and females and young children also work to help the male folk. 89.0 per cent of
brick-kiln migrant workers were married. Only 11.0 per cent workers were unmarried. The
higher percentage of married migrant workers may be due to the fact that large numbers of
migrants were from U.P. and Bihar where the people get married at quite young age.
In a country like India religion plays a very important role in all spheres of life. Analysis reveals
the higher share of the Hindu workers among the industrial workers in Punjab because the major
share of work force comes from Hindu majority U.P. and Bihar states. Caste is another
12
important factor which prevails in a country like India. The caste-wise distribution reveals that
the majority (81.5 per cent) of workers were belonging to SC/ST castes. Only 14.0 per cent
belonged to general castes. Apparently, the blue collar jobs are not the prerogative of
backward/scheduled castes only. Rather upper castes are also joining the rank of manual workers
in the industry due to the non-availability of white collar jobs.
Education is another important variable which influences the decision to migrate or not. 60.5 per
cent were illiterate, 26 per cent got education up to 5th
standard, 5.5 per cent reached up to the 8th
standard and 8.0 per cent were matriculate. Apparently, extent of illiteracy was higher among the
brick-kiln workers.
Generally, migrant workers belonged to those families whose size was relatively large. One-
third of respondent families were having up to 4 members 25 per cent, 24 per cent, 11 per cent
were having 5, 6 and 7 members respectively. 8 per cent of the respondents belonged to families
whose size was 8 and above. Thus, migrants still lack awareness about the benefits of the small
size family. Moreover, the family planning programmes have failed to motivate the workers to
adopt two children norm. Greater incidence of poverty could be another cause and effect of large
family size.
The workers were divided into five categories on the basis of monthly wages. 48.0 per cent were
getting up to Rs. 2000, 27.5 per cent workers fell in the income level of Rs. 2001-2500, 21.0 per
cent workers were getting between Rs. 2501-3000 and only 3.50 per cent workers were getting
more than Rs. 3000.Further, most of the workers were getting wages on the basis of piece rate
system. 99.00 per cent brick-kiln workers lived in the accommodation provided by the
employers. Small huts are constructed by the brick-kiln owner for their workers. The roofs are at
such a height that it is very difficult to stand straight in their huts.
Migrant workers in Punjab constitute the major share of the total workforce both in agriculture
and industry. However, it is important to know about their length of stay. Among the brick kiln
workers, 29.50 per cent workers have migrated during the last five years, 25.50 during 6-10
years, 15.50 per cent workers have come to Punjab some 11-15 years ago and 29.50 per cent
workers have migrated more than 15 years ago. Brick-kiln industry provides employment for 7-8
months only in a year. The nature of migration is another important aspect of the migrant
workers. 58.50 per cent of the sampled brick-kiln workers migrated along with their families and
the rest 41.50 per cent migrated alone. In this industry, the largest proportion of the workers are
13
moulders, who mostly migrate along with their families, and the whole family works as one unit
at the brick-kiln.
Employment being the mainstay of the migrants and their respective families, large number of
workers save and remit money to their native place. Three fourth of the migrant workers send
money to their respective villages, further reinforces their links with their villages. Further,
majority of the workers who did not remit are those who have migrated along with their families.
29.50 per cent of brick-kiln migrant workers remitted up to Rs. 500 per month, 20.50 per cent
between Rs. 501 to Rs. 1000 per month, 19.00 per cent between Rs. 1001-1500 and only a small
proportion of 6.00 per cent remitted more than Rs. 1500 per month. The money remitted by the
migrants is mainly used by their families to meet the day to day consumption needs and
ceremonial purposes. Analysis of periodicity of sending money to the native place by the migrant
workers shows that 28.00 per cent of brick-kiln migrant workers sent money to their native place
more than once in a year, another 26.00 per cent sent once in two months and 19.50 per cent sent
once in a month. The large number of brick-kiln workers remitted money by money order/ bank
draft or took money with them at the time of visit. Only 3.00 per cent of brick-kiln workers
depended on this mode. Quite a large number of workers carried money at the time of visit to the
native place because brick-kiln being seasonal industry, workers spent rainy season at their
native places. Moreover, they are paid at the end of the season and during season they are paid to
meet day to day expenses only. 44.50 per cent of brick-kiln workers visited their native place
once in a year whereas 40.00 per cent visited twice in a year. Only 8.50 per cent of workers
visited their native place once in two/three years and 6.00 per cent visited on some important
occasion only.
Analysis of Registration as Voter reveals that a vast majority of the migrant brick-kiln labourers
(89.00 per cent) were not registered as voters in Punjab. The brick-kiln workers as voters were
found in Amritsar district where they had migrated long back and are living in nearby villages.
Lower percentage of voters may be due to seasonal nature of the brick industry and low level of
awareness amongst the workers. 84.00 per cent of brick-kiln workers were not approached by the
authorities for registration. At some places workers alleged that interference by the village
sarpanch led to their non-registration as voters. Again, since brick-kiln workers did not stay here
continuously for longer period, they were not registered as voters in this state. Moreover, some
workers were already registered as voters at their native places.
14
Likewise, only 8.00 per cent of migrant workers possessed ration cards. Staff of the food and
civil supplies department hardly visited any brick-kiln to issue ration cards to the labour working
there. Of 16 brick-kiln workers who possessed ration cards only 10 were getting the supply of
ration. Moreover, the supply of ration in most of the cases was restricted to the supply of
kerosene oil only. The occupational background of the migrant workers reveals that the (67.50
per cent) of the migrant workers were daily wage earner and only 7.50 per cent were self
employed. Other occupations include pursue of education (student), and first time workers
(25.00 per cent). Majority of the workers lived in independent houses (59.50 per cent) and 40.50
per cent of workers shared residence with other workers. A vast majority of the brick-kiln
migrant workers lived in huts hence the question of second room did not arise. Toilet facility was
not available to 97.50 per cent of the workers. Again, separate space for kitchen was not
available to the migrant brick-kiln workers. Brick-kiln workers mainly, lived in small huts made
of mud or bricks. A large majority of the migrant brick-kiln workers (99.00 per cent) lived in the
huts made by the brick-kiln owner and labourers did not pay any rent for the accommodation
This presents a deplorable situation about the living conditions of the migrant workers. Small
huts were constructed by the brick-kiln owner for their workers. The roofs of the huts were at
such a height that it was very difficult to stand in these huts. Most of the huts do not have
electricity supply. Facility of pure drinking water was absent, no sanitation was provided by the
employer. The near by farmers do not allow the workers to use their farms for the morning
routines. Their children play in dirty and unhealthy environment. Sometimes, their huts collapse
due to rain and dust storm resulting in loss of eatable goods and other household articles. The
huts fail to protect the migrant workers during the peak winters and winter rains or against the
scorching heat in summer. Some socio-cultural changes were also reported by small proportion
of the migrant workers. Only 3.50 per cent workers reported change in habits. Earlier they used
to wear dhoti and kurta but now they preferred pyjamma and kameej. Some workers started
consumption of wheat along with rice. 4.50 per cent of migrant workers in Amritsar district
purchased Plot/House. A change in the language was reported by 28.50 per cent of brick-kiln
workers in the sample. Punjabi is an easily understandable language. Therefore, the migrant
workers could understand it and could even speak some words of Punjabi. The change took place
in case of those workers who are staying in Punjab for a long period of time.
WORKER’S PERCEPTION ON TRADE UNIONS:
15
Trade union is a voluntary organization of workers formed to promote and protect their interests
by collective action. They play a significant role in the system of industrial relations. They have
developed as economic, political and social institutions under varying conditions. Therefore,
trade unions have gained recognition as legitimate social organizations which have become an
integral part of the contemporary business and industry in these days. Therefore, we have
attempted to study the unionism among the migrant workers of brick kiln industry, the extent of
participation in union activities and satisfaction about the performance of the unions. The
workers having knowledge about the labour laws are more competent to protect their interests.
Therefore, it is important to test the level of awareness among the workers about the labour
legislations.
Apart from other reasons workers join a trade union basically to secure, security of service, good
pay and proper working conditions. 65.5 per cent of the migrant workers were member of any
trade union. But only 54.25 per cent of the total sampled workers were member of any trade
union whereas 45.75 per cent workers were not member of any trade union. Thus, majority of
brick kiln workers are member of some union. There were four main trade unions operating in
different units under study. CITU was a dominant union in brick kiln industry claiming 55 per
cent. Membership of AITUC and BMS was 24.4 and 20.6 per cent respectively.
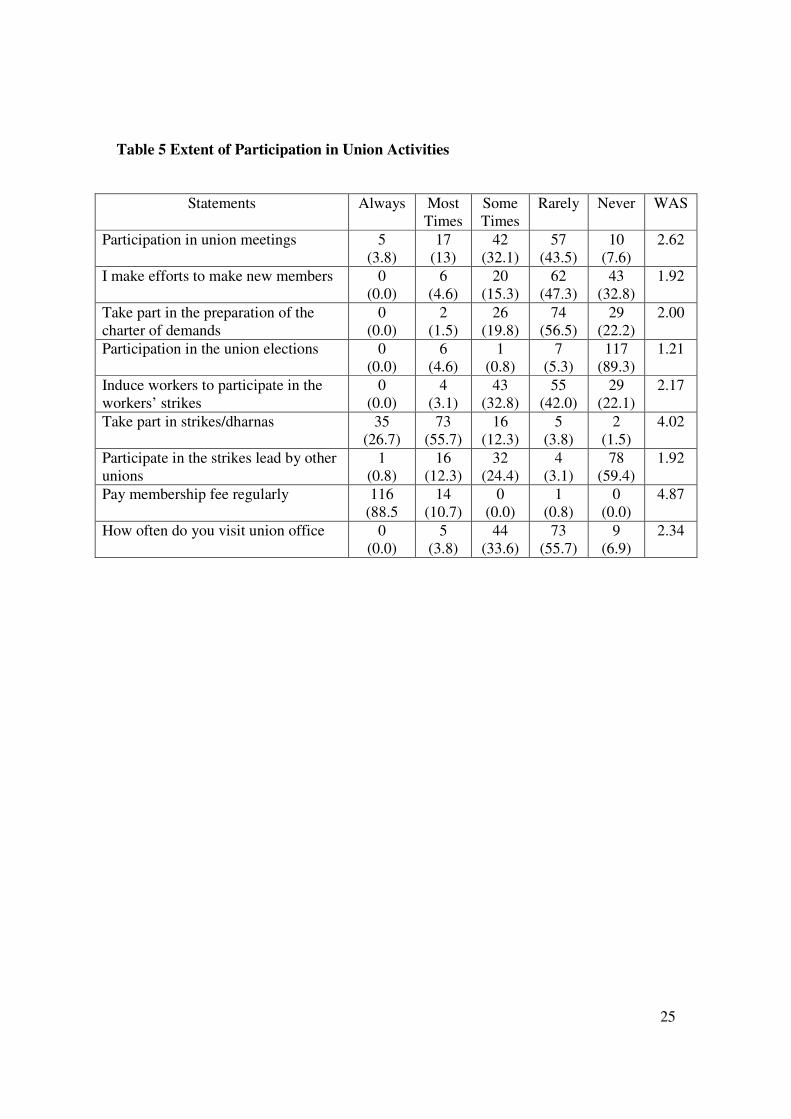
Extent of Participation in Union Activities:
The extent of participation by brick-kiln workers in the trade union activities reveals that only
3.8 per cent of workers participated in the union meetings always whereas, 43.5 per cent
participate in the union meetings rarely. Moreover, the weighted average score of 2.62 indicates
low level of participation in the union meetings. Similarly, large percentage i.e. 47.3 per cent of
workers replied that they rarely made efforts to make new members, while 32.8 per cent never
made any effort to enroll new members. The weighted average score of 1.92 for efforts to make
new members further substantiate this fact. Furthermore, majority of workers (56.5 per cent)
rarely participated in the preparation of the charter of demands. Similarly, a large majority of
workers (89.3 per cent) were found to be never participated in the union elections. The weighted
average score of participation in the union elections was only 1.21 indicating a very low
participation. 32.8 per cent and 42 per cent workers induce sometimes and rarely to other
workers to participate in strikes respectively. 26.7 per cent workers always took part in the
strikes/dharnas and again 55.7 per cent took part most of the times. The weighted average score
16
of 4.02 indicates a high participation in the strikes/dharnas by the workers. But the participation
in the strikes led by other unions was low. 88.5 per cent of workers were paying membership fee
regularly. Again, WAS of 4.87 indicates that members were paying their membership fee
regularly. The data further reveal that majority of the workers (55.7 per cent) visited union office
rarely.
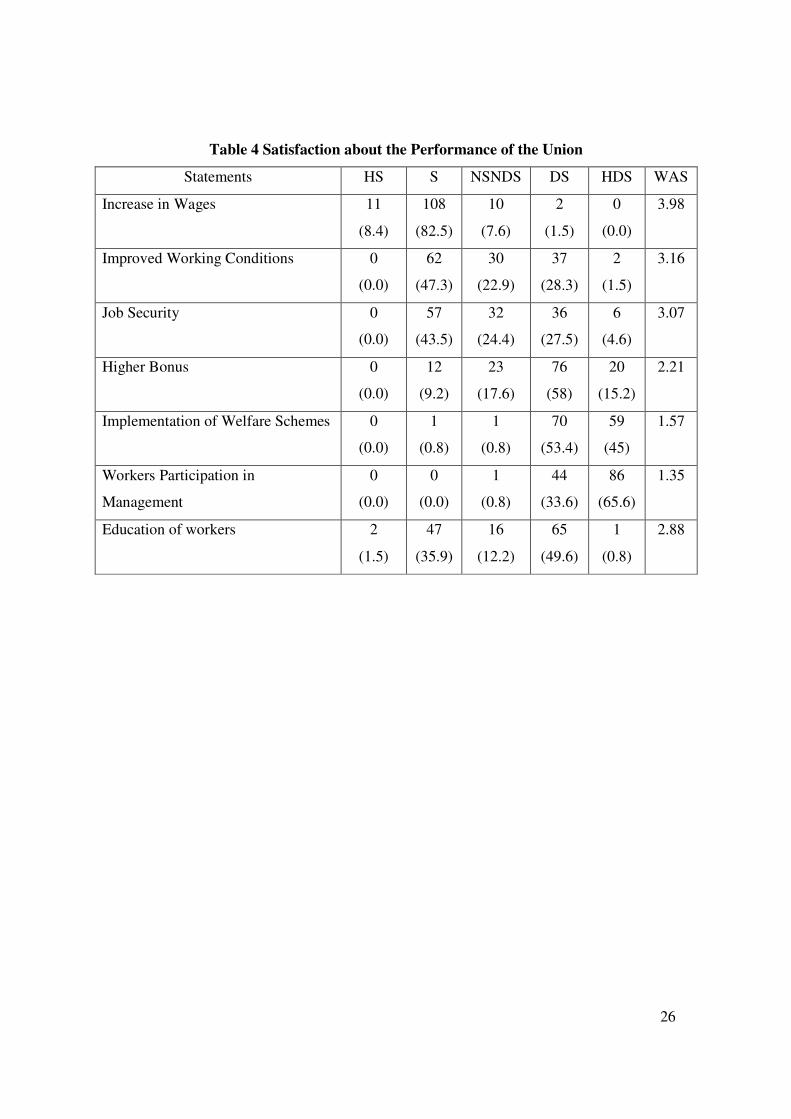
Satisfaction about the Performance of the Unions
The level of satisfaction of brick-kiln workers about the performance of the unions was
examined through Table 1.In case of ‘increase in wages’ a large majority of (82.5 per cent)
workers were satisfied. Again, the weighted average score of 3.98 showed high degree of
satisfaction on the part of workers with regard to increase in wages. In case of ‘improved
working conditions’ by the trade unions for workers 62 (47.3 per cent) were found satisfied, 30
(22.9 per cent) were found neither satisfied nor dissatisfied, 37 (28.3 per cent) were dissatisfied
and 2 (1.5 per cent) were highly dissatisfied. The weighted average score of 3.16 clearly
indicates a high degree of satisfaction on the part of workers. Furthermore, 43.5 per cent of
workers were found satisfied with trade unions’ efforts to provide them job security. But 27.5 per
cent workers were found dissatisfied with the performance of unions on this issue. The weighted
average score of 3.07 shows above average degree of satisfaction on the part of the workers with
regard to job security.
Majority of the workers were dissatisfied with regard to unions’ performance relating to higher
bonus and implementation of welfare schemes. Again, 65.6 per cent workers were found highly
dissatisfied with regard to union’s performance relating to workers participation in management.
The WAS of 1.35 shows a very low level of satisfaction on the part of the workers with regard to
workers participation in management. As per education, 49.6 per cent of workers were found
dissatisfied with unions’ role in this regard. The weighted average score of 2.88 clearly indicates
below average degree of satisfaction on the part of the workers pertaining to trade unions’ role in
the education of workers.
WORKERS’ AWARENESS ABOUT THE LABOUR LAWS
As regards registration under The Inter-State Migrant Workmen Act, 1979 and availing of other
benefits such as displacement allowance, journey allowance, residential accommodation, free
medical facilities and issuance of pass book etc., not even a single worker of either industry was
17
aware of the existence of this act which was specially enacted for the benefit of inter-state
migrant workers. Further the migrant brick-kiln workers were not at all aware of different labour
legislations such as The Workmen’s Compensation Act, 1923, The Trade Unions Act, 1926, The
Industrial Disputes Act, 1947, The Factories Act, 1948, The Minimum Wages Act, 1948 and The
Employee’s State Insurance Act, 1948.
Three fourth of workers were getting wages on piece rate basis. In other words only 52 (26 per
cent) workers were getting fixed wages. Worker was getting wages at normal rate for overtime
work.127 (63.5 per cent) workers worked up to 12 hours a day. Only 18 (9 per cent) workers
worked up to 8 hours a day. 35 (17.5 per cent) workers worked up to 16 hours and more than 16
hours per day. Various facilities such as that canteen, rest rooms, first aid, medical and
transportation facilities were not available to the workers at all. 172 (86 per cent) and 27 (13.5
per cent) workers strongly disagree and disagree respectively with the statement that they were
being discriminated on account of wages in comparison to local workers The weighted average
score of 1.16 for the first statement clearly shows a very high degree of disagreement with the
statement discrimination on account of wages. Similarly, 173 (86.5 per cent) workers strongly
disagree with both the statements, namely, ‘Discrimination on account of promotion’ and
‘Discrimination on account of medical facilities’. Weighted average scores of 1.15 and 1.14 for
statement second and third also show a very high degree of disagreement with these statements.
Moreover, in most of the brick-kilns, local workers were not employed so the question of
discrimination did not arise. However, majority of workers that is 116 (58 per cent) agree that
they were given step motherly treatment at police station / railway station. Weighted average
score of 3.43 indicates agreement with statement among workers. 21 (10.5 per cent) workers
agreed that they were cheated at post office but majority of workers replied negatively in this
regard. 159 (79.5 per cent) workers neither agree nor disagree with the statement ‘not getting
ration as per quota’ because they were not issued ration cards. But, WAS of 3.08 indicates that
workers agreed with the statement that they were not getting ration as per quota.
FACTOR ANALYTIC OF MOTIVATIONS FOR MIGRATION
The uneven development between village and town and between different areas has resulted in
the large scale labour migration from one area to another. This type of migration causes
movement of working force. Coming to reasons for migration, it is interesting to know why
some people migrate while others do not. Despite the relevance of non-economic factors most of
18
the studies indicate that migration is primarily motivated by economic factors, especially labour
migration. Two basic economic factors which motivate migration may be termed as push factors
and pull factors. In other words, it is to see whether people migrate due to compelling
circumstances which push them out of the place of their origin or they are lured by the attractive
conditions in the destination place. For instance, on the one hand, poor economic conditions, low
productivity, unemployment and underemployment, low agricultural income and natural
calamities may compel people to leave their native place in search of better economic
opportunities. On the other hand, opportunities for better employment, higher wages, better
working conditions and amenities etc. may attract people to an area. Researchers have diverse
findings as to which factors is more important push or pull. So, it necessitates having a fresh look
at the major ‘push’ and ‘pull’ factors in labour migration and their comparative significance. To
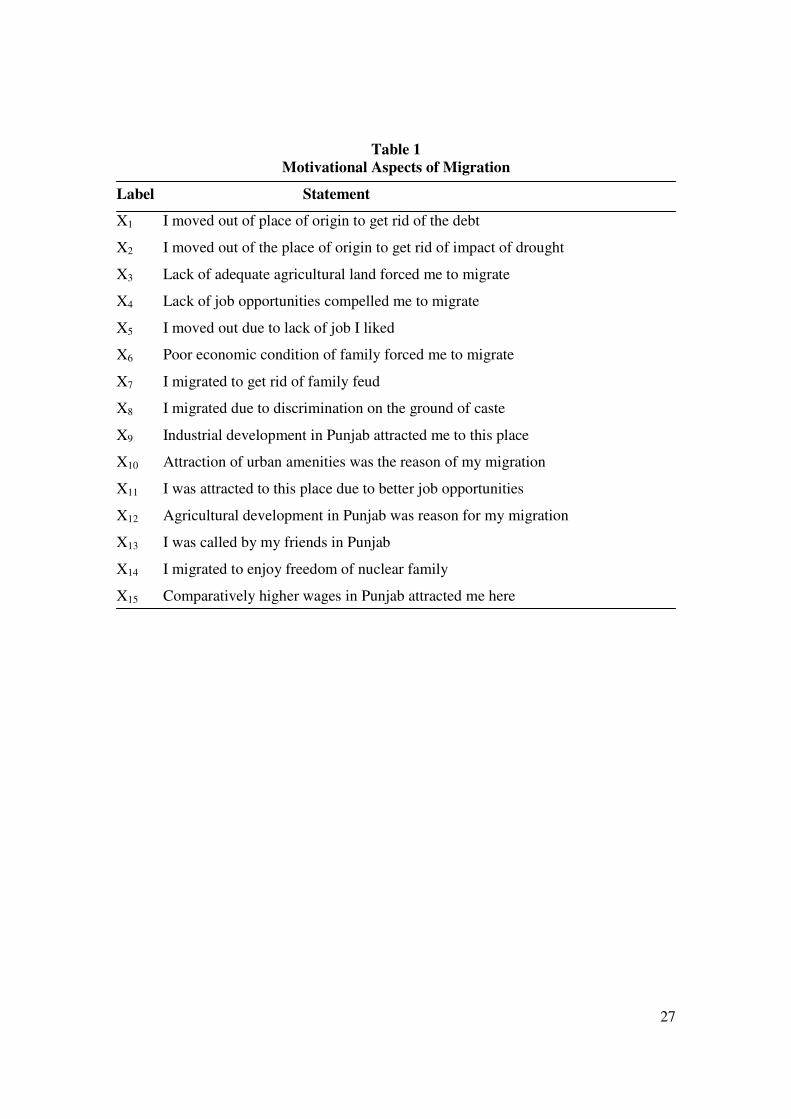
do this the perceptions of brick-kiln migrant workers on a set of fifteen statements about the role
of different push and pull factors in the process of inter-state migration were studied. The list of
these statements is presented in table 6.1.
Suitability of Data for Factor Analysis
In order to test the suitability of data for Principal Component Analysis, the correlation
matrix was computed and enough correlations were found to go ahead with factor analysis.
Further Kaiser-Meyer-Oklin Measure of Sample Adequacy (KMO) was calculated. Overall,
MSA was found to be 0.649 which supports that the sample was good enough for factor analysis.
Anti-image Correlations calculated reveals that partial correlations were low, indicating that true
factors existed in the data. Hence, the data was found fit for the factor analysis.
Extraction Method and Number of Factors Extracted
Principal Component Analysis was employed for extracting factors and the number of factors to
be extracted were finalized on the basis of ‘Latent Root Criterion’ i.e. variables having Eigen
values greater than 1. Six factors were extracted which together accounted for 63.74 per cent of
the variance. Finally, the Principal Component Analysis with Orthogonal Rotation has been used
in the present study. In Orthogonal Rotation, it is assumed that factors operate independently of
each other. Varimax Rotated Factor Analysis which is the most popular method of Orthogonal
Rotation has been used and the results are presented in Table 6.2.
The results were obtained through orthogonal rotations with Varimax and all factor loadings
greater than 0.40 (ignoring signs) were retained. The results of the principal component analysis
19
with Varimax rotation for brick kiln respondents are presented in table 6.2. The results show that
63.74 per cent of the total variance is represented by the information contained in the factor
matrix. The percentage of variance explained by factors I to VI are 20.81, 11.02, 10.04, 7.76,
7.27 and 6.84 respectively. The percentage of total variance is used as an index to determine how
well a particular factor solution accounts for what all the variables together represent. The
communalities have been shown at the far right side of the table 7.2 which show the amount of
variance in a variable that is accounted for by the six factors taken together. The size of the
communality is a useful index for assessing how much variance in a particular variable is
accounted for by the factor solution. Large communalities indicate that a large amount of the
variance in a variable has been extracted by the factor solution. Small communalities show that a
substantial portion of the variance in a variable is not accounted for by the factor solution. For
instance, communality figure of 0.495 for variable X6 indicates that it has less in common with
other variables included in the analysis than variable X5 which has a communality of 0.734.
Naming of Factors
A factor loading represents the correlation between an original variable and its factor.
The signs are interpreted just like any other correlation coefficients. On each factor, ‘like signs’
of factor loadings mean that the variables are positively related and ‘opposite signs’ mean that
the variables are negatively related. One variable X8 (I migrated due to discrimination on the
ground of caste) has loaded on two factors II and V. But on the basis of higher loading, it has
been considered in factor V only. The names of the factors and the loadings are summarized in
Table 6.3.
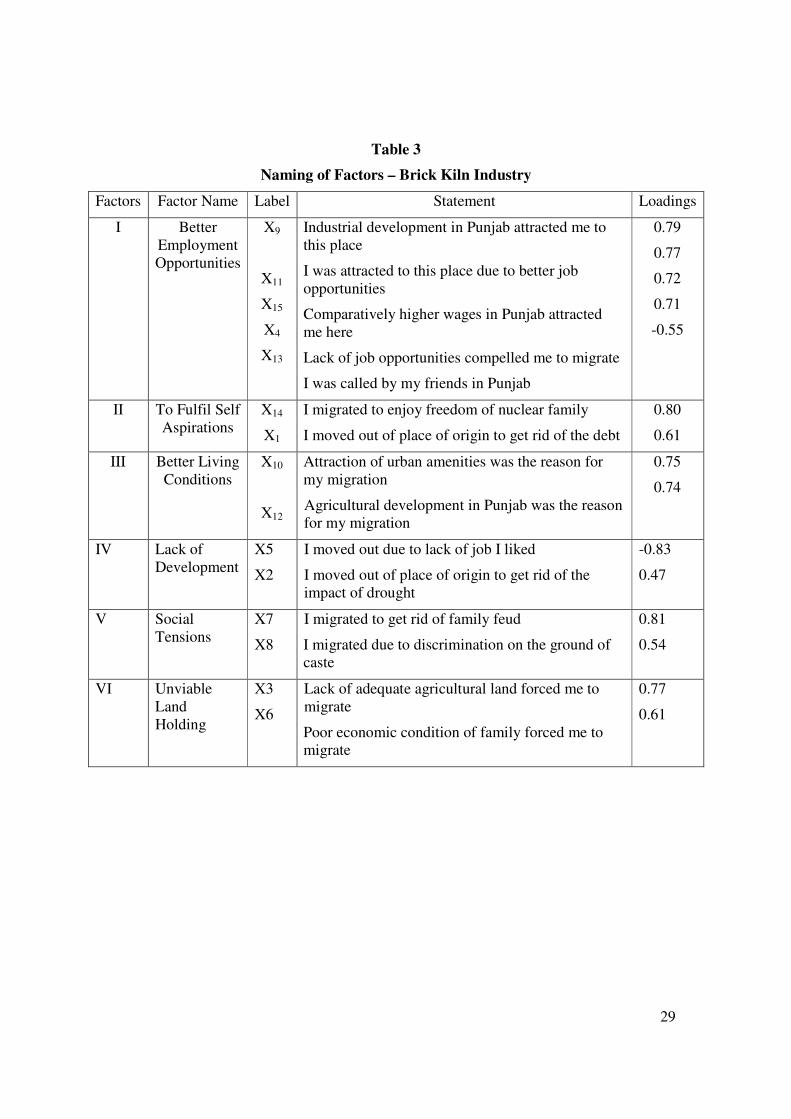
Factor I: Better Employment Opportunities
Better employment opportunities have emerged as significant factor accounting for 20.81 per
cent of the total variance. Five out of fifteen statements are loaded on this factor of which four
are highly correlated. The high positive loading on the first factor of the variables, namely,
industrial development of Punjab, attraction of better job opportunities, comparatively higher
wages in Punjab pull labour to migrate from other states. Again, all except X4 (Lack of job
opportunities compelled me to migrate) are pull statements. The negative loading of the variable
X13 (I was called by my friends in Punjab) indicates that workers did not migrate because their
friends’ call them rather study found that they were mobilized by contractors. Thus, the pull
factors play dominating role in labour migration to Punjab.
20
Factor II: To Fulfill Self Aspirations
Fulfillment of self aspirations has emerged as the second major factor with percentage of
variance equal to 11.02 per cent. The analysis reveals that the migrant labour moved out to enjoy
freedom of nuclear family and to get rid of burden of debt. Therefore, the study found that the
migrant households paid off their debts by remittances from Punjab. Moreover, the huge transfer
of resources from Punjab has a large potential for strengthening the rural economy at the place of
origin.
Factor III: Better Living Conditions
This is the third important factor with percentage of variance equal to 10.04. Two statements
have been loaded on this factor. Both statements are positively correlated with the factor. This
factor highlights that the attraction of urban amenities and agricultural development of Punjab
encourage the migration of labour from other states. The existing studies on labour migration
also revealed that better living conditions had remained an important pull factor to attract labour
from backward areas. Further, it has been widely accepted by various researchers that large scale
migration has been taking place in agricultural and industrial sectors of Punjab. As both these
variables are significantly loaded on this factor, therefore, our study also substantiates this fact.
Factor IV: Lack of Development
Two statements have been loaded on this factor which explains 7.76 per cent of variance . Both
the statements are significantly correlated with this factor. Besides, one statement is positive
while other is negative. It explicates that labour migrate from its native place to get rid of the
impact of drought. The negative loading of the variable X5 indicates that brick kiln workers do
not migrate because of lack of job they desired. Rather, study found that they were ready to do
any type of job keeping in view their lower educational, economic and social status.
Factor V: Social Tensions
Two statements have been loaded on this factor with percentage of variance equal to 7.27. Both
the statements are positive. The study found that large proportion of migrant brick-kiln workers
belong to large size of joint families where family feud was a routine matter. So workers migrate
to get rid of family feud. Further, they also migrate because of the discrimination on the ground
of caste in their areas of origin. Therefore, in addition to the pull factors, the push factors also
contribute in the inter-state migration process.
Factor VI: Unviable Land Holding
21
Two statements have been loaded on this factor with percentage of variance equal to 6.84. Lack
of adequate agricultural land and poor economic condition of family compel labour to migrate.
The implication of this factor is that the migrant brick-kiln workers are landless or land poor
belonging to economically backward class. Further, most of the respondents’ land was barren
due to which they also come in the category of landless workers.
Policy Implications:
Migration is a global phenomenon caused not only by economic factor but many others like
social, political, cultural, environmental, health, education etc. The migration generally takes
place from the area of less economic opportunities and retarded social development towards
developed and fast developing areas. Migration of labour mostly involves movement of working
force because of uneven development between village and town and between different areas.
Migrant labourers in general are younger in age, illiterate, landless or land poor, belonging to
socio-economically backward class. They are generally paid lower wages than the local labour,
their working conditions such as security of job, shelter, medical facilities, insurance and
provident fund etc. are as good as non-existent and work for long and flexible hours under
extremely bad working conditions near slavery. Punjab is among the smallest states of the Indian
Union but it has achieved great heights in many fields like agricultural sector, industrial sector
and so on. To cater the needs of agricultural and the industrial sector large scale migration has
taken place from other states particularly Bihar and Uttar Pradesh. They have made a place for
themselves in case of agricultural and other similar sectors like construction, brick-kiln industry
etc. Very little has been done in the direction of micro level inquiries into the characteristics of
individual migrants and the factors influencing individual’s propensity to migrate. Therefore, the
present study is an attempt to fill up the important gaps and to make a modest contribution to an
understanding of socio-economic conditions of brick-kiln migrant workers.
Majority of the migrant workers were young in age, illiterate or having low level of education
and married male Hindu (89 per cent). Furthermore, women and child labour was also employed
in the brick-kiln industry. 81.5 per cent of migrant brick-kiln workers belonged to SC/ST, large
number of whom came from big families and had not adopted family planning schemes in
general. 86 per cent of workers belonged to Uttar Pradesh, Rajasthan and Chhattisgarh. The
wages of the workers were very low. Majority of workers were provided rooms / huts by the
employers within the premises of the brick-kilns.
22
The majority of the brick-kiln workers migrated along with family. 75 per cent of the migrant
workers remitted money to their native place and those who did not remit migrated along with
their families. Amount remitted was very small and its periodicity was mostly once a month,
once in two months or more than once in a year. Most of the remittances were made either by
money order/bank draft or workers took themselves at the time of visit. Further, almost all
respondents kept their links alive with the place of origin. Majority of the workers were not
registered as voter because they were not approached by the authorities. Furthermore, majority of
the migrant workers were not in possession of ration card and those who possessed ration card
were not getting regular supply of all the items supplied under the public distribution system.
Majority of migrant workers were landless. Those who own land reported it to be of poor quality
and without any assured irrigation facility. The migrant workers lived in one room house not
having toilet and kitchen. The living conditions of the brick-kiln workers were very miserable.
They were living in extremely dusty and unhygienic accommodation without water and
electricity supply arrangements. No worker possessed refrigerator or scooter. Only 5 per cent and
13.5 per cent workers possessed television and radio respectively. 3.5 per cent of the brick kiln
workers reported change in their habits. Earlier they used to wear dhoti and kurta but now they
preferred pyjamma and kameej. Some workers started the consumption of wheat along with rice.
A change in the language was reported by 28.5 per cent migrant workers. Punjabi is easily
understandable language. Therefore, the migrant workers could understand and could even speak
some words of Punjabi. The brick-kiln workers were not at all aware of the Inter-State Migrant
Workmen Act, 1979, and other labour laws. Facilities of canteen, rest rooms, first aid, medical
and transportation were not available to workers. Migrant workers reveal no visible
discrimination on account of wages, promotion and medical facilities.
Factor analysis technique applied to the responses of workers on a battery of 15 pull and push
close ended statements measured on a five point Likert scale extracted six factors which
accounted for 63.74 per cent of variance. A better employment opportunity is the first and most
significant factor with maximum percentage of variance, which motivates the workers to
migrate. Better job opportunities, industrial development and comparatively higher wages in
Punjab attract the brick kiln workers whereas lack of job opportunities at native place compels
them to migrate. Fulfillment of self aspirations’ and ‘higher wages’ with percentage of variance
equal to 11.02 have emerged as the second factors as a push factor .
23
Statistics in regard to labour in general and the migrant labour in particular are not being
collected systematically by the authorities responsible. Department of labour should take steps to
rationalize the collection, compilation, maintenance and dissemination of labour statistics.
Definition of Inter State Migrant Workman should be amended to mean “any person who has
migrated from his home state whether on his own, or by or through a contractor, and has been
temporarily (seasonally) employed in any establishment in another state”. With such a wider
definition of ISM Workmen, a migrant worker, whether or not he has come by or through a
contractor and on the basis of an agreement or otherwise, would be covered under the Act.
Again, the Act should apply to every establishment in which even one or more inter-state
migrant workmen are employed and violation of the Act should be made a cognizable offence.
The third party should be allowed to file complaints. Constitution of joint coordination team
comprising of officers of both originating and recipient state be done to identify the
establishment and for periodical visit to the vulnerable areas for effective implementation of the
Act as well as providing better facilities. The trade unions should be involved to identify the
migrant workmen as well as their establishments. Separate cell should be formed by each state to
look after the problems of the migrant workmen.
The different trade unions functioning in the state should give more emphasis to the cause of the
inter-state migrant workmen involved in the developmental projects of the state. They should
help in ensuring the right wages, timely payment of wages, their welfare including residence,
health and hygiene, medical facilities, electricity and drinking water facilities, providing the
return journey allowance, providing claims in case of fatal accident. In case of injury the trade
unions should take every care to provide assistance in discussion with the agents, contractors,
principal employers and medical officer and labour machinery of the state.
The trade unions in the state of origin should interact with their counterpart trade unions to look
after the migrant workmen working there and to take all possible efforts for their ameliorations
and write back all details of their work, entitlement receipts and living status. Trade unions at the
recipient state should also intimate to their counterpart in the state of origin of the interstate
migrant workmen about any dispute, claims and any sort of accident besides taking all required
action at their end. Non-government organizations (NGOs) can play an important role by making
workers aware of their rights and by ensuring that the legal and socio-economic measures are
complied with.
24
There is a need to improve the educational level of the migrant workers working in the brick-kiln
industry of Punjab. Since a large number of workers belong to adult category, therefore, adult
education could play an important role to make the migrant workers literate. Since a large
number of workers working in the brick-kilns engage their families in the work, therefore,
special arrangements should be made for the education of their children also. The workers should
also be made aware of the family planning programmes. The living and working conditions of
the migrant workers are miserable, therefore, the study recommends that the workers should be
provided proper housing and sanitation facilities. As the workers, particularly, the brick-kiln
workers are prone to many diseases and occupational health hazards like irritation of skin,
backache, asthma and T.B. etc, the study recommends that provisions should be made in the law
governing the brick-kiln industry for compulsory, periodic, medical check-up of workers.
Further, moulders should be provided gloves in order to avoid continuous touch with mud.
Nakasiwalas should be provided protective gear in order to save them from any injury from hot
bricks and use of respiratory masks should be made obligatory for all workers while at work.
As this industry is seasonal industry, the workers should be provided some alternative work
during the off season. Since large number of migrant workers were not having ration cards.
Therefore, the Punjab Food and Civil Supplies Department should issue special ration cards of
different colours to migrant workers under a special drive. It can serve dual purpose of getting
essential goods at subsidized rates and also identity proof for different purposes. Though, there is
a need to review the existing legislation enacted for the migrant labour, even the existing laws
are not being implemented to protect the migrant workers. The workers should be made aware of
their legal rights and labour legislations. The trade unions, non-government organizations and
other social organizations can play an important role to make workers aware of their rights.
Electronic and print media should be generous enough to provide space to this exploited class.
25
Table 5 Extent of Participation in Union Activities
Statements Always Most
Times
Some
Times
Rarely
Never WAS
Participation in union meetings 5
(3.8)
17
(13)
42
(32.1)
57
(43.5)
10
(7.6)
2.62
I make efforts to make new members 0
(0.0)
6
(4.6)
20
(15.3)
62
(47.3)
43
(32.8)
1.92
Take part in the preparation of the
charter of demands
0
(0.0)
2
(1.5)
26
(19.8)
74
(56.5)
29
(22.2)
2.00
Participation in the union elections 0
(0.0)
6
(4.6)
1
(0.8)
7
(5.3)
117
(89.3)
1.21
Induce workers to participate in the
workers’ strikes
0
(0.0)
4
(3.1)
43
(32.8)
55
(42.0)
29
(22.1)
2.17
Take part in strikes/dharnas 35
(26.7)
73
(55.7)
16
(12.3)
5
(3.8)
2
(1.5)
4.02
Participate in the strikes lead by other
unions
1
(0.8)
16
(12.3)
32
(24.4)
4
(3.1)
78
(59.4)
1.92
Pay membership fee regularly 116
(88.5
14
(10.7)
0
(0.0)
1
(0.8)
0
(0.0)
4.87
How often do you visit union office 0
(0.0)
5
(3.8)
44
(33.6)
73
(55.7)
9
(6.9)
2.34
26
Table 4 Satisfaction about the Performance of the Union
Statements HS S NSNDS DS HDS WAS
Increase in Wages 11
(8.4)
108
(82.5)
10
(7.6)
2
(1.5)
0
(0.0)
3.98
Improved Working Conditions 0
(0.0)
62
(47.3)
30
(22.9)
37
(28.3)
2
(1.5)
3.16
Job Security 0
(0.0)
57
(43.5)
32
(24.4)
36
(27.5)
6
(4.6)
3.07
Higher Bonus 0
(0.0)
12
(9.2)
23
(17.6)
76
(58)
20
(15.2)
2.21
Implementation of Welfare Schemes 0
(0.0)
1
(0.8)
1
(0.8)
70
(53.4)
59
(45)
1.57
Workers Participation in
Management
0
(0.0)
0
(0.0)
1
(0.8)
44
(33.6)
86
(65.6)
1.35
Education of workers 2
(1.5)
47
(35.9)
16
(12.2)
65
(49.6)
1
(0.8)
2.88
27
Table 1
Motivational Aspects of Migration
Label Statement
X1 I moved out of place of origin to get rid of the debt
X2 I moved out of the place of origin to get rid of impact of drought
X3 Lack of adequate agricultural land forced me to migrate
X4 Lack of job opportunities compelled me to migrate
X5 I moved out due to lack of job I liked
X6 Poor economic condition of family forced me to migrate
X7 I migrated to get rid of family feud
X8 I migrated due to discrimination on the ground of caste
X9 Industrial development in Punjab attracted me to this place
X10 Attraction of urban amenities was the reason of my migration
X11 I was attracted to this place due to better job opportunities
X12 Agricultural development in Punjab was reason for my migration
X13 I was called by my friends in Punjab
X14 I migrated to enjoy freedom of nuclear family
X15 Comparatively higher wages in Punjab attracted me here
28
Table 2
Rotated Correlation Matrix - Brick Kiln Industry
Factors
Statement
I II III IV V VI
Communalities
X1 0.11 0.61 0.23 -0.21 -0.23 0.36 0.659
X2 0.03 0.36 -0.39 0.47 -0.36 -0.13 0.653
X3 0.11 0.10 -0.19 -0.06 0.14 0.77 0.684
X4 0.71 0.06 -0.17 -0.08 -0.03 -0.01 0.549
X5 0.12 0.05 -0.07 -0.83 0.07 -0.11 0.734
X6 0.05 -0.12 0.13 0.16 -0.24 0.61 0.495
X7 -0.15 0.03 0.02 -0.01 0.81 -0.04 0.687
X8 -0.19 0.44 0.02 0.32 0.54 -0.10 0.635
X9 0.79 0.10 -0.03 -0.26 0.05 0.04 0.704
X10 0.03 0.23 0.75 0.02 0.06 -0.20 0.667
X11 0.77 -0.19 0.10 0.07 0.01 0.10 0.646
X12 0.02 -0.10 0.74 0.01 0.07 0.09 0.576
X13 -0.55 -0.20 -0.13 0.38 0.17 0.07 0.538
X14 0.06 0.80 0.04 0.12 0.12 0.09 0.690
X15 0.72 0.07 0.05 0.23 -0.24 0.08 0.645
Eigen Values 3.122 1.653 1.507 1.164 1.090 1.026 9.562
Percentage of
Variance
20.810 11.019 10.044 7.762 7.270 6.837
Cumulative
Percentage
20.810 31.829 41.873 49.635 56.904 63.742
29
Table 3
Naming of Factors – Brick Kiln Industry
Factors Factor Name Label Statement Loadings
I Better
Employment
Opportunities
X9
X11
X15
X4
X13
Industrial development in Punjab attracted me to
this place
I was attracted to this place due to better job
opportunities
Comparatively higher wages in Punjab attracted
me here
Lack of job opportunities compelled me to migrate
I was called by my friends in Punjab
0.79
0.77
0.72
0.71
-0.55
II To Fulfil Self
Aspirations
X14
X1
I migrated to enjoy freedom of nuclear family
I moved out of place of origin to get rid of the debt
0.80
0.61
III Better Living
Conditions
X10
X12
Attraction of urban amenities was the reason for
my migration
Agricultural development in Punjab was the reason
for my migration
0.75
0.74
IV Lack of
Development
X5
X2
I moved out due to lack of job I liked
I moved out of place of origin to get rid of the
impact of drought
-0.83
0.47
V Social
Tensions
X7
X8
I migrated to get rid of family feud
I migrated due to discrimination on the ground of
caste
0.81
0.54
VI Unviable
Land
Holding
X3
X6
Lack of adequate agricultural land forced me to
migrate
Poor economic condition of family forced me to
migrate
0.77
0.61
30
BIBLIOGRAPHY
BOOKS
Balachandani, K. R. (1980), Labour Welfare, Himalaya Publishing House, Bombay.
Berger, John and Mohr, Jean (1975), A Seventh Man: A Story of A Migrant Worker in
Europe, Penguin Books, Middlesex.
Bernstein, Ira H. et al., (1988), Applied Multivariate Analysis, Springer – Verlag, New
York.
Bhatnagar, Deepak (1985), Labour Welfare and Social Security Legislation in India,
Deep and Deep Publications, New Delhi.
Bhattacharya, V. R. (1970), Social Security Measures in India, Metropolitan Book
Company, Bombay.
Chandavarkar, Raj Narayan (1994), The Origins of Industrial Capitalism in India:
Business Strategies and the Working Class in Bombay (1900-1940),
Cambridge University Press.
Chand Krishan (2002), Migrant Labour and the Trade Union Movement in Punjab: A
Case Study of Sugar Industry, Centre for Research in Rural and
Industrial Development, Chandigarh.
Dunteman, George, H. (1989), Principal Component Analysis, Sage Publications India
Pvt. Ltd., New Delhi.
Grewal, S. S. and Sidhu, M. S. (1979), “A Study on Migrant Agricultural Labour in
Punjab”, Department of Economics and Sociology, Punjab Agricultural
University, Ludhiana.
Joshi, Vidut (1987), Migrant Labour and Related Issues, Oxford and IBH Publishing
Co. Pvt. Ltd.
Mangalam, J.J. (1962), Human Migration: A Guide to Migration Literature in English
1955-1962, (Quoted in Leszek A. Kosinski and R. Mansell Prothero).
Mehta, G. S. (1990), Education, Employment and Earnings, Deep and Deep
Publications, New Delhi.
------------------------ (1991), Socio-Economic Aspects of Migration, Deep and Deep
Publications, New Delhi.
Nair, K. S. (1978), Ethnicity and Urbanisation, Ajantha Publications, New Delhi.
Nargundarkar, Rajendra (2002), Marketing Research: Text and Cases, Tata McGraw
Hill Publishing Co. Ltd., New Delhi.
31
Safa, H. I. and Dutoit, B. M. (1975), Migration and Development¸ Mouton Publishers,
The Hague.
Saxena, R. C. (1987), Labour Problems and Social Welfare, Prakashan Kendra,
Lucknow.
Singh, Manjit (1990), The Political Economy of Unorganised Industry: A Study of the
Labour Process, Sage Publications, New Delhi.
Young, P. V. (1951), Scientific Social Surveys and Research, Asia Publishing House,
Bombay, p. 154.
Zaheeruddin (1985), Labour Welfare Laws and Employment Conditions in India, Deep
and Deep Publications, New Delhi.
JOURNALS
Abbasi, S. R. S. and Sheikh, K. (2000), “Impact of Foreign Employment on the Social
Development of Migrants’ Families Left behind in Pakistan”, Journal of
Rural Development and Administration, Vol. 32, No. 3. pp. 88-101.
Ali, Lyakat (1997), “Unorganised Labour and the Legislative Measures for their
Welfare”, Social Action, Vol. 47, April-June, pp.181-199.
Bharti, Indu (1990) , “Mobilisation of Agricultural Labour: Jehanabad Experience”,
Economic and Political Weekly, Vol. 25, No. 22, pp. 1181-84.
Bhattacharya, Prabir (1998), “The Informal Sector and Rural-to-Urban Migration: Some
Indian Evidence”, Economic and Political Weekly, Vol. 33, No. 21, pp.
1255-1262.
Bhujan, M. C. (1971), “Immigration to Assam Valley: A Geographical Analysis”, The
Journal of North-East Indian Geographical Society, Vol. 3, No.1, pp. 177-
89.
Dasgupta, Biplab (1975), “A Typology of Village Socio-Economic Systems”, Economic
and Political Weekly, Special Number, August, pp. 1395-1414.
Dasgupta, B. and Lashley, R. (1975), “Migration from Villages: An Indian Case Study”,
Economic and Political Weekly, Annual Number.
Duraisamy, P. and Narasimhan, S. (2000), “Migration, Remittances and Family Ties in
Urban Informal Sector”, The Indian Journal of Labour Economics, Vol.
43, No. 1, pp. 111-119.
32
Ghaffari, Hadi and Singh, S. P. (2000), “Pull-Push Determinants of Inter-Provincial
Migration: Iran’s Case Study”, Indian Journal of Economics, Vol. 81, No.
321, pp. 269-275.
Gupta, S. P. and Prajapati, B. L. (1998), “Migration of Agricultural Labourers in
Chattisgarh Region of Madhya Pradesh: A Micro Level Study”, The
Indian Journal of Labour Economics, Vol. 41, No. 4, pp. 707-15.
Gupta, T. R. (1961), “Rural Family Status and Migration: A Study of a Punjab Village”,
The Economic Weekly, Vol. 13, No. 14, pp. 1597-1603.
Iyer, G and Singh, M. (1980), “Impact of Migration Labour on the Rural Economy of
Punjab State”, Man and Development, September.
Jayaraman, T. K. (1979), “Seasonal Migration of Tribal Labour: An Irrigation Project in
Gujarat”, Economic and Political Weekly, Vol. 14, No. 41, pp. 1727-1732.
Joshi, S. and Padasia, V. (1991), “Labour Migration: Process, Causes, Effects and
Remedies”, The Indian Journal of Labour Economics, Vol. 34, No. 4, pp.
325-330.
Kumar, Sudhir (1992), “Migration and Economic Development”, Journal of Social and
Economic Studies, Vol. 9, pp. 115-132.
Kundu, A. (1986), “Migration, Urbanisation and Inter-Regional Inequality: The
Emerging Socio-Political Challange”, Economic and Political Weekly,
Vol. 21, No. 46, pp. 2005-2008.
Mahapatra, Mihir Kumar (1998), “Labour Migration from a Backward Region of Orissa”,
The Indian Journal of Labour Economics, Vol. 41, No. 4, pp. 737-744.
Mehta, G. S. (1996), “Employment Structure and Earnings of Migrant Workers in Urban
Economy”, Manpower Journal, Vol. 31, No. 4, pp. 29-44
Yadava, K. N. S. and Singh S. K. (1998), “Population Diversity and Internal Migration:
Testing the Lee Theory”, Demography India, Vol. 17, No. 1, pp. 43-57.
Yeshwant, T. S. (1962), “Rural Migration – A Case Study in Four Ramanathapuram
Villages”, Agricultural Situation in India, Vil. 17, No. 6.
Zachariah, K. C. (1959), “Migration to Greater Bombay 1941-1951”, The Indian Journal
of Social Work, Vol. 20, No. 3.
GOVERNMENT PUBLICATIONS
Government of India, (1978), Draft Five Year Plan 1978-83, Planning Commission, New
Delhi, Controller of Publications, p. 82.
33
----------------------------- (1983), Report of the Royal Commission on Labour in India
(1931), Agricole Publishing Academy, New Delhi.
---------------------------- (1991), Census of India: 1991, D-Series, Part I, II, III, Migration
Tables – Punjab.
---------------------------- (1991), Report of the Study Group on Migrant Labour, Vol. II,
Part II, National Commission on Rural Labour, Government of India,
Ministry of Labour, New Delhi.
Government of Punjab, Various Unpublished Sources, Office of Labour Commissioner,
Punjab, Chandigarh.
United Nations, (1953), Determinants and Consequences of World Populations Trends,
New York, United Nations, p. 124.
----------------------------, (1984), Population Distribution, Migration and Development,
New York, United Nations, p.17.
World Bank, (1972), Urbanisation: Sector Working Paper, Washington D.C., World
Bank, June, p. 14.