Embed Size (px)
Citation preview
RESEARCH ARTICLE Open Access
A gene expression atlas for kiwifruit(Actinidia chinensis) and network analysis oftranscription factorsLara Brian1, Ben Warren1,2, Peter McAtee1, Jessica Rodrigues1, Niels Nieuwenhuizen1, Asher Pasha3, Karine M. David2,Annette Richardson4, Nicholas J. Provart3, Andrew C. Allan1,2, Erika Varkonyi-Gasic1 and Robert J. Schaffer2,5*
Abstract
Background: Transcriptomic studies combined with a well annotated genome have laid the foundations for newunderstanding of molecular processes. Tools which visualise gene expression patterns have further added to theseresources. The manual annotation of the Actinidia chinensis (kiwifruit) genome has resulted in a high quality set of33,044 genes. Here we investigate gene expression patterns in diverse tissues, visualised in an Electronic FluorescentPictograph (eFP) browser, to study the relationship of transcription factor (TF) expression using network analysis.
Results: Sixty-one samples covering diverse tissues at different developmental time points were selected for RNA-seq analysis and an eFP browser was generated to visualise this dataset. 2839 TFs representing 57 different classeswere identified and named. Network analysis of the TF expression patterns separated TFs into 14 different modules.Two modules consisting of 237 TFs were correlated with floral bud and flower development, a further two modulescontaining 160 TFs were associated with fruit development and maturation. A single module of 480 TFs wasassociated with ethylene-induced fruit ripening. Three “hub” genes correlated with flower and fruit developmentconsisted of a HAF-like gene central to gynoecium development, an ERF and a DOF gene. Maturing and ripeninghub genes included a KNOX gene that was associated with seed maturation, and a GRAS-like TF.
Conclusions: This study provides an insight into the complexity of the transcriptional control of flower and fruitdevelopment, as well as providing a new resource to the plant community. The Actinidia eFP browser is providedin an accessible format that allows researchers to download and work internally.
Keywords: Actinidia, eFP browser, Transcription factors
BackgroundGlobal transcriptomic approaches are a common toolused to obtain a better understanding of gene functionand regulation. The composition of the transcriptome isthe result of a dynamic balance between chromatin state,the activation of gene expression by transcription factors
(TFs) and the speed of transcript degradation. The com-bination of good genomic information and robust genemodels paves the way for systematic and consistent geneand gene family naming. This combined with other gen-omics tools, such as Electronic Fluorescent Pictograph(eFP) browsers [1] to help visualise where a gene isexpressed, allows faster identification of gene function indifferent species. To date, eFP browsers have been suc-cessfully developed in plants such as Arabidopsis [1], to-mato [2], strawberry [3], and pineapple [4].
© The Author(s). 2021 Open Access This article is licensed under a Creative Commons Attribution 4.0 International License,which permits use, sharing, adaptation, distribution and reproduction in any medium or format, as long as you giveappropriate credit to the original author(s) and the source, provide a link to the Creative Commons licence, and indicate ifchanges were made. The images or other third party material in this article are included in the article's Creative Commonslicence, unless indicated otherwise in a credit line to the material. If material is not included in the article's Creative Commonslicence and your intended use is not permitted by statutory regulation or exceeds the permitted use, you will need to obtainpermission directly from the copyright holder. To view a copy of this licence, visit http://creativecommons.org/licenses/by/4.0/.The Creative Commons Public Domain Dedication waiver (http://creativecommons.org/publicdomain/zero/1.0/) applies to thedata made available in this article, unless otherwise stated in a credit line to the data.
* Correspondence: [email protected] of Biological Science, The University of Auckland, Private Bag 92019,Auckland 1146, New Zealand5The New Zealand Institute for Plant and Food Research Ltd (Plant & FoodResearch), 55 Old Mill Road, Motueka 7198, New ZealandFull list of author information is available at the end of the article
Brian et al. BMC Plant Biology (2021) 21:121 https://doi.org/10.1186/s12870-021-02894-x
TFs are one of the largest groups of genes in a gen-ome; in Arabidopsis there are over 1500 TFs described,belonging to a number of different classes representing5% of all genes [5]. In other species TFs represent 3–5%of coding genes, with function often conserved acrossspecies [6]. TFs have been grouped into 57 differentclasses [5] with some classes having multiple types ofDNA binding domains. Each class of TF is representedby a gene family. These gene families vary in size fromspecies to species depending on events such as individ-ual gene and genome duplications, leading to expansionsof certain or most families [6]. In higher plants theMYB, bHLH and Zinc finger classes of TF contain manyhundreds of members [6]. There are numerous examplesdemonstrating the strong evolutionary maintenance ofTF primary protein structure across species, with thehomologous genes having a similar gene function. Thisallows researchers to predict function by homology [7].The MADS-box containing TFs form arguably one of
the best understood classes of TF. Members of theMADS-box gene family, including the well-known floralorgan structure ABCE TFs, determine many aspects ofplant development [8, 9]. Even though the fruiting bod-ies of Angiosperms are homoplasious, with fleshy fruitevolving numerous times within many plant families thefunction of these genes appear conserved [10]. Angio-sperm flower structure and fruiting bodies are remark-ably conserved, with whorls of sepals, petals, stamensand carpels [8]. The MADS protein sequence is alsoconserved with many examples within plants demon-strating similar control mechanisms across many species[7, 11].Kiwifruit are part of the Actinidiaceae which is a basal
family within Ericales [12], and contains the genus Acti-nidia comprising of a number of economically importantfruit species such as Actinidia chinensis var. deliciosa(green kiwifruit), A. chinensis var. chinensis (gold andred kiwifruit) and A. arguta (hardy kiwifruit or kiwiber-ries). The green ‘Hayward’ kiwifruit is hexaploid, while acommercially released yellow fleshed variety A. chinensisvar. chinensis, ‘Hort16A’, and the red fleshed A. chinensisvar. chinensis ‘Hongyang’ are large fruiting diploid geno-types making them ideal for understanding molecularprocesses in Actinidiaceae. More recently a new Pseudo-monas syringae pv. actinidiae (Psa) tolerant tetraploidgold variety, ‘Zesy002’, has replaced ‘Hort16A’ in themarkets. The two diploid cultivars have been used tounderstand the molecular control of many aspects of de-velopment including flowering, fruit ripening, colourand flavour development [13–16]. Genomics tools suchas CRISPR gene editing have been successfully used toedit the floral repressors in ‘Hort16A’ to create a smallfruiting plant that can be used to rapidly test gene func-tion in fruit, further building on their utility [17].
The first draft kiwifruit genome was of A. chinensis‘Hongyang’, published in 2013 [18], paving the way forgenomics in Actinidiaceae. More recently a second A.chinensis genome of a more inbred related genotype,Red5, further improved the construction and import-antly manual annotation of gene models [19]. The man-ual annotation of the kiwifruit genome improved thequality of the published computer predicted genemodels, and provided a quality resource for future genemining. Here we build on these data by identifying TFgenes, analysing their expression over a number of tis-sues and providing an eFP Browser tool to analyse geneexpression.
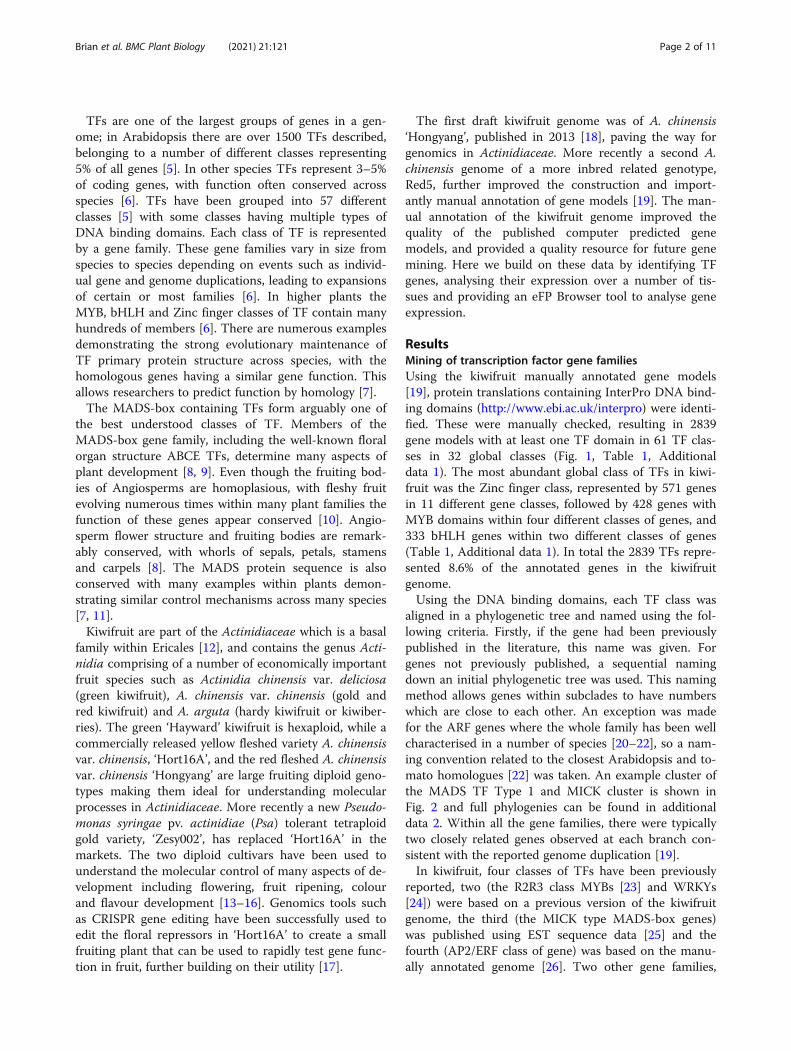
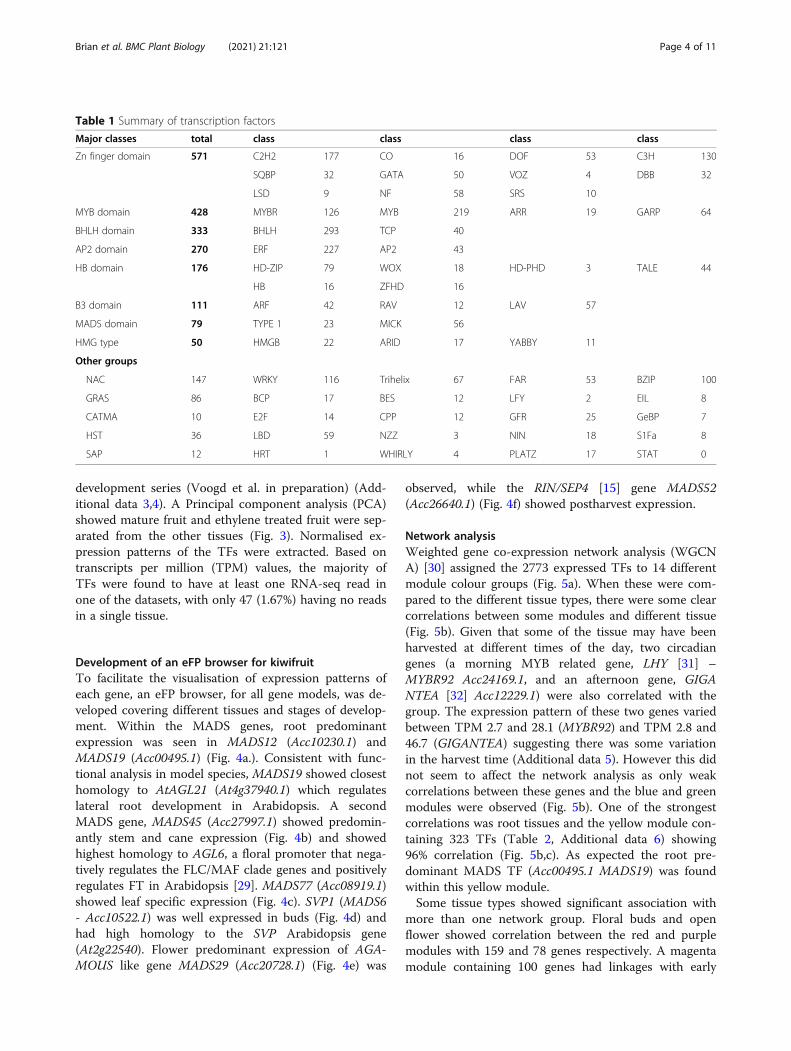
ResultsMining of transcription factor gene familiesUsing the kiwifruit manually annotated gene models[19], protein translations containing InterPro DNA bind-ing domains (http://www.ebi.ac.uk/interpro) were identi-fied. These were manually checked, resulting in 2839gene models with at least one TF domain in 61 TF clas-ses in 32 global classes (Fig. 1, Table 1, Additionaldata 1). The most abundant global class of TFs in kiwi-fruit was the Zinc finger class, represented by 571 genesin 11 different gene classes, followed by 428 genes withMYB domains within four different classes of genes, and333 bHLH genes within two different classes of genes(Table 1, Additional data 1). In total the 2839 TFs repre-sented 8.6% of the annotated genes in the kiwifruitgenome.Using the DNA binding domains, each TF class was
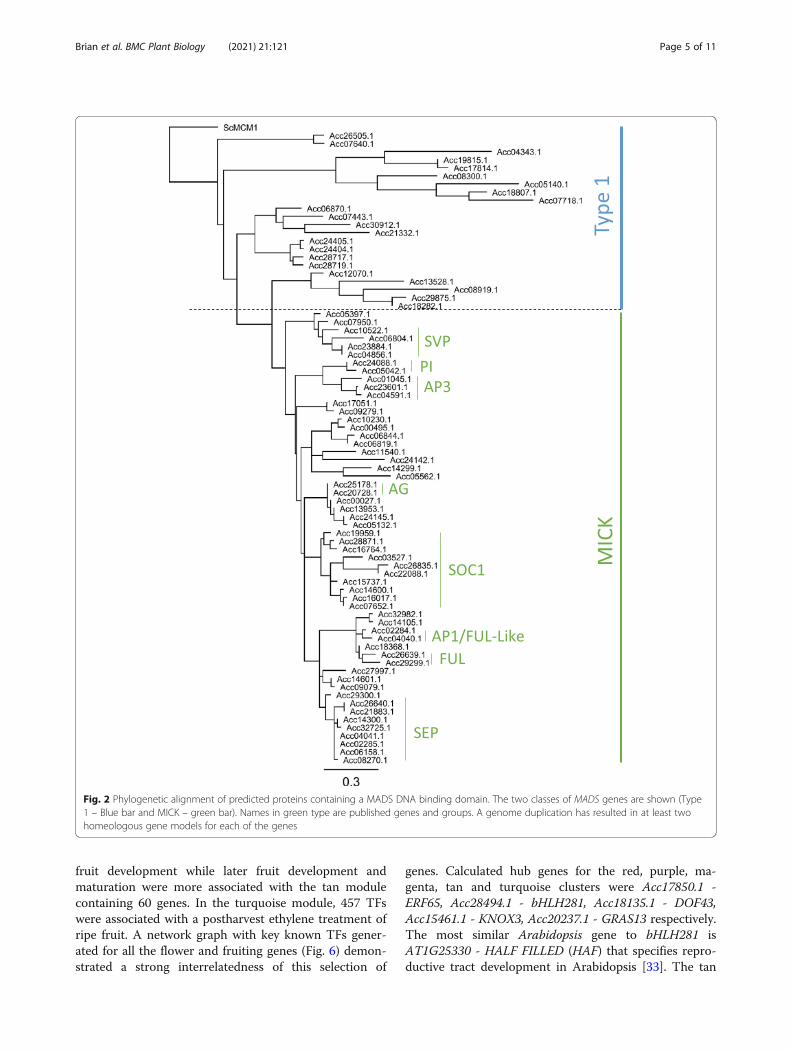
aligned in a phylogenetic tree and named using the fol-lowing criteria. Firstly, if the gene had been previouslypublished in the literature, this name was given. Forgenes not previously published, a sequential namingdown an initial phylogenetic tree was used. This namingmethod allows genes within subclades to have numberswhich are close to each other. An exception was madefor the ARF genes where the whole family has been wellcharacterised in a number of species [20–22], so a nam-ing convention related to the closest Arabidopsis and to-mato homologues [22] was taken. An example cluster ofthe MADS TF Type 1 and MICK cluster is shown inFig. 2 and full phylogenies can be found in additionaldata 2. Within all the gene families, there were typicallytwo closely related genes observed at each branch con-sistent with the reported genome duplication [19].In kiwifruit, four classes of TFs have been previously
reported, two (the R2R3 class MYBs [23] and WRKYs[24]) were based on a previous version of the kiwifruitgenome, the third (the MICK type MADS-box genes)was published using EST sequence data [25] and thefourth (AP2/ERF class of gene) was based on the manu-ally annotated genome [26]. Two other gene families,
Brian et al. BMC Plant Biology (2021) 21:121 Page 2 of 11
the R2R3 MYB class and NAC class of TFs are the sub-ject of separate studies and are reported in more depth(Rodrigues et al. submitted, Nieuwenhuizen et al.submitted).The 96 published WRKY TFs were previously named
based on sequential chromosomal locations. Of these,five did not have an Acc annotated gene model and twomodels (WRKY95 and WRKY96) appear to be splice var-iants. The five were annotated using the Web Apollosoftware and Acc numbers assigned. This study identi-fied an additional 21 WRKY genes and these new geneswere sequentially numbered, bringing the total to 116WRKY genes.A comprehensive analysis of EST sequences and full
length sequence of nine MADS-box genes was reportedby Varkonyi-Gasic et al. [25]. Since this study, four SVPlike genes [27] and eight SOC1 like genes [28] have beenreported. Further mining identified 58 further predictedgene models containing a MADS-box DNA binding do-main. The MADS genes separated into two major clades;the Type 1 and MICK type. Previously the MICK type
MADS-box genes have been shown to be key regulatorsof plant development, especially in floral and fruit devel-opment. Phylogenetic alignment identified sequenceswith high similarity to the well-characterised MICK-MADS genes and identified possible homeologous pairsof: AGAMOUS (AG) like genes, Acc25178.1 (MADS28)and Acc20728.1 (MADS29); PISTILLATA (PI) like genes,Acc24088.1 (MADS11) and Acc05042.1 (MADS12); andAPETALA1 (AP1) like genes, Acc04040.1 (MADS40) andAcc02284.1 (MADS41) (Fig. 2).
Expression analysisTo establish where and when each of the TFs wereexpressed, a transcriptomic approach was taken. Globalgene expression of different tissues and different plantdevelopmental stages of two cultivars of A. chinensis var.chinensis, the gold fruited ‘Hort16A’ and ‘Zesy002’ weremeasured. Sixty-one sets of RNA-seq from root, stem,shoot, leaves, flowers, and early fruit development werecombined with RNA-seq reads from fruit development[15] and postharvest [15] were used and a bud
Fig. 1 Composition of the different classes of the 2839 transcription factors. Size of circles represent the number of genes within each class
Brian et al. BMC Plant Biology (2021) 21:121 Page 3 of 11
development series (Voogd et al. in preparation) (Add-itional data 3,4). A Principal component analysis (PCA)showed mature fruit and ethylene treated fruit were sep-arated from the other tissues (Fig. 3). Normalised ex-pression patterns of the TFs were extracted. Based ontranscripts per million (TPM) values, the majority ofTFs were found to have at least one RNA-seq read inone of the datasets, with only 47 (1.67%) having no readsin a single tissue.
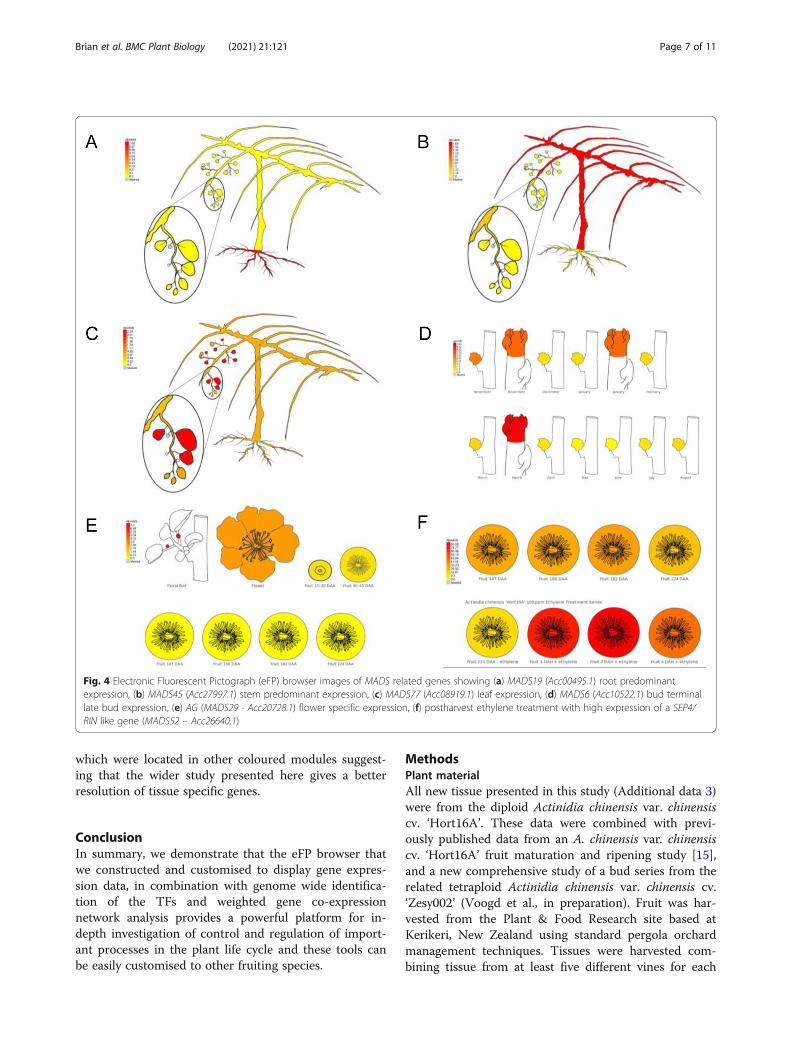
Development of an eFP browser for kiwifruitTo facilitate the visualisation of expression patterns ofeach gene, an eFP browser, for all gene models, was de-veloped covering different tissues and stages of develop-ment. Within the MADS genes, root predominantexpression was seen in MADS12 (Acc10230.1) andMADS19 (Acc00495.1) (Fig. 4a.). Consistent with func-tional analysis in model species, MADS19 showed closesthomology to AtAGL21 (At4g37940.1) which regulateslateral root development in Arabidopsis. A secondMADS gene, MADS45 (Acc27997.1) showed predomin-antly stem and cane expression (Fig. 4b) and showedhighest homology to AGL6, a floral promoter that nega-tively regulates the FLC/MAF clade genes and positivelyregulates FT in Arabidopsis [29]. MADS77 (Acc08919.1)showed leaf specific expression (Fig. 4c). SVP1 (MADS6- Acc10522.1) was well expressed in buds (Fig. 4d) andhad high homology to the SVP Arabidopsis gene(At2g22540). Flower predominant expression of AGA-MOUS like gene MADS29 (Acc20728.1) (Fig. 4e) was
observed, while the RIN/SEP4 [15] gene MADS52(Acc26640.1) (Fig. 4f) showed postharvest expression.
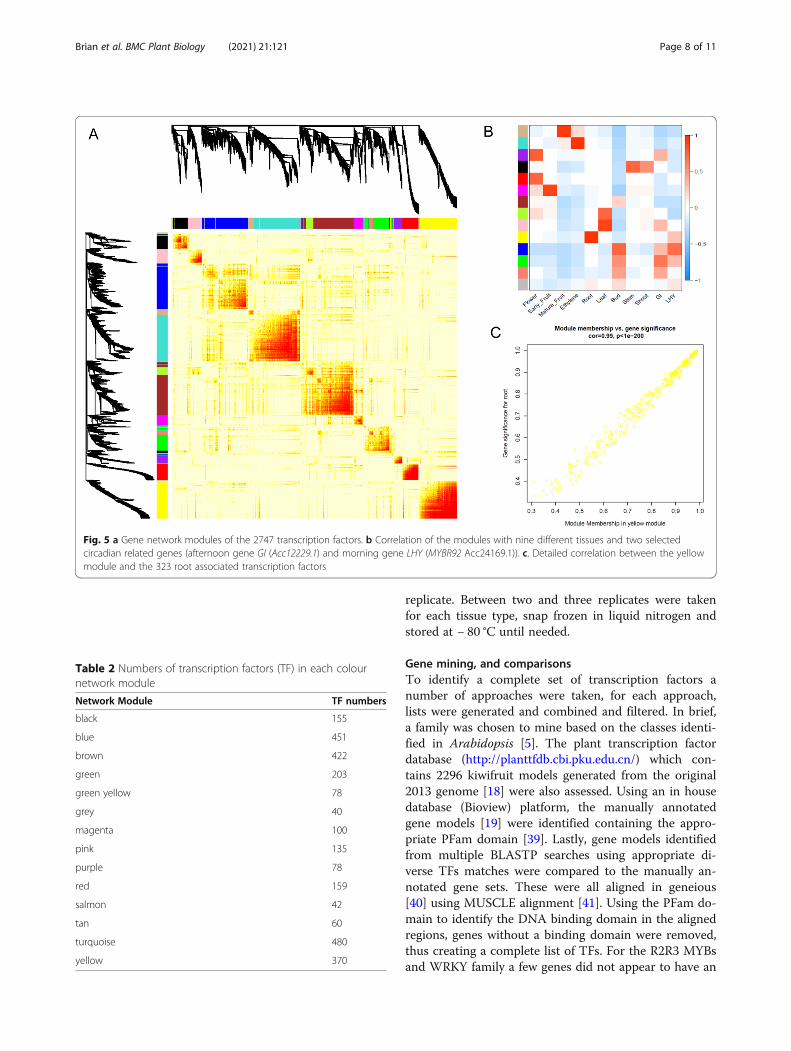
Network analysisWeighted gene co-expression network analysis (WGCNA) [30] assigned the 2773 expressed TFs to 14 differentmodule colour groups (Fig. 5a). When these were com-pared to the different tissue types, there were some clearcorrelations between some modules and different tissue(Fig. 5b). Given that some of the tissue may have beenharvested at different times of the day, two circadiangenes (a morning MYB related gene, LHY [31] –MYBR92 Acc24169.1, and an afternoon gene, GIGANTEA [32] Acc12229.1) were also correlated with thegroup. The expression pattern of these two genes variedbetween TPM 2.7 and 28.1 (MYBR92) and TPM 2.8 and46.7 (GIGANTEA) suggesting there was some variationin the harvest time (Additional data 5). However this didnot seem to affect the network analysis as only weakcorrelations between these genes and the blue and greenmodules were observed (Fig. 5b). One of the strongestcorrelations was root tissues and the yellow module con-taining 323 TFs (Table 2, Additional data 6) showing96% correlation (Fig. 5b,c). As expected the root pre-dominant MADS TF (Acc00495.1 MADS19) was foundwithin this yellow module.Some tissue types showed significant association with
more than one network group. Floral buds and openflower showed correlation between the red and purplemodules with 159 and 78 genes respectively. A magentamodule containing 100 genes had linkages with early
Table 1 Summary of transcription factors
Major classes total class class class class
Zn finger domain 571 C2H2 177 CO 16 DOF 53 C3H 130
SQBP 32 GATA 50 VOZ 4 DBB 32
LSD 9 NF 58 SRS 10
MYB domain 428 MYBR 126 MYB 219 ARR 19 GARP 64
BHLH domain 333 BHLH 293 TCP 40
AP2 domain 270 ERF 227 AP2 43
HB domain 176 HD-ZIP 79 WOX 18 HD-PHD 3 TALE 44
HB 16 ZFHD 16
B3 domain 111 ARF 42 RAV 12 LAV 57
MADS domain 79 TYPE 1 23 MICK 56
HMG type 50 HMGB 22 ARID 17 YABBY 11
Other groups
NAC 147 WRKY 116 Trihelix 67 FAR 53 BZIP 100
GRAS 86 BCP 17 BES 12 LFY 2 EIL 8
CATMA 10 E2F 14 CPP 12 GFR 25 GeBP 7
HST 36 LBD 59 NZZ 3 NIN 18 S1Fa 8
SAP 12 HRT 1 WHIRLY 4 PLATZ 17 STAT 0
Brian et al. BMC Plant Biology (2021) 21:121 Page 4 of 11
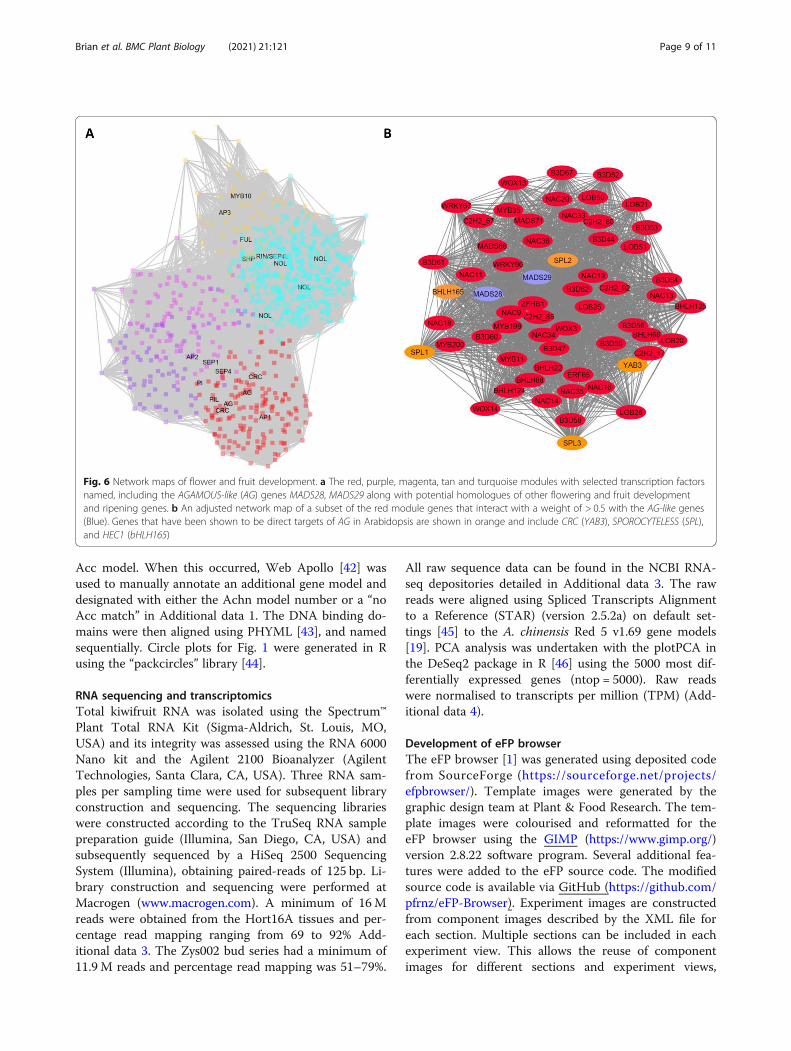
fruit development while later fruit development andmaturation were more associated with the tan modulecontaining 60 genes. In the turquoise module, 457 TFswere associated with a postharvest ethylene treatment ofripe fruit. A network graph with key known TFs gener-ated for all the flower and fruiting genes (Fig. 6) demon-strated a strong interrelatedness of this selection of
genes. Calculated hub genes for the red, purple, ma-genta, tan and turquoise clusters were Acc17850.1 -ERF65, Acc28494.1 - bHLH281, Acc18135.1 - DOF43,Acc15461.1 - KNOX3, Acc20237.1 - GRAS13 respectively.The most similar Arabidopsis gene to bHLH281 isAT1G25330 - HALF FILLED (HAF) that specifies repro-ductive tract development in Arabidopsis [33]. The tan
Fig. 2 Phylogenetic alignment of predicted proteins containing a MADS DNA binding domain. The two classes of MADS genes are shown (Type1 – Blue bar and MICK – green bar). Names in green type are published genes and groups. A genome duplication has resulted in at least twohomeologous gene models for each of the genes
Brian et al. BMC Plant Biology (2021) 21:121 Page 5 of 11

hub gene KNOX3 is similar to AtKNAT7 which has beenproposed to work with AtPAP1 (the homologue ofwhich, Acc00493.1 - MYB10/75, is also found in the tancluster) to develop the seed coat [34].
DiscussionBy combining gene mining and expression analysis ofthe TF families from kiwifruit we have constructed agene network for different tissues at different develop-mental stages during the plant life cycle. Through a closeexamination of the flower and fruit networks which wereassociated with the red, purple, magenta, tan and tur-quoise modules (Fig. 6a), a number of MADS-box TFswith close homology to those characterised in other spe-cies were found. In the red module there were 10 MICKMADS-box genes including the previously publishedAGAMOUS (AG) gene MADS29 (Acc20728.1) and itshomeologue MADS28 (Acc25178.1), a PISTILLATA-likegene, MADS11 (Acc24088.1), and two SEP-like genes,while the purple module contained five MICK MADSgenes including a second PISTILLATA-like gene,MADS12 (Acc05042.1). The ethylene treated fruit associ-ated with the turquoise module contained three MICKMADS-like genes including the previously publishedRIN/SEP4-like gene (MADS52 - Acc26640.1) [15].Other classes of well characterised TFs were examined,
including the known floral determinacy genes describedin a recent review [35]. By examining the closest kiwi-fruit homologues and module membership, it was pos-sible to identify potential key genes such as the APETALLA2-like gene AP2L11 (Acc06022.1), CRABS CLAW(CRC) YAB3 (Acc19364.1) and YAB4 (Acc06415.1), andINNER NO OUTER (INO) genes YAB1 (Acc08170.1 andYAB2 (Acc06179.1). The three kiwifruit NOZZLE classes
of SPOREOCYTLESS genes associated with ovule devel-opment were all located in the red module: SPL1(Acc13721.1), SPL2 (Acc19456.1) and SPL3 (Acc21678.1).Also the B3 class LAV genes had a clade expansion withB3D47 (Acc13067.1), B3D48 (Acc30137.1), B3D49(Acc30138.1), B3D50 (Acc30139.1), B3D51 (Acc13066.1),B3D52 (Acc06689.1), B3D53 (Acc21264.1), B3D55(Acc31957.1) and B3D56 (Acc11738.1) all found in thered module. Additionally the SHINY SHN and SHNLERF genes (Acc12549.1 and Acc17850.1) associated withcuticular wax formation were identified. While these keygenes were identified in the red module, it should benoted that, not all the best homologues to the genesidentified in this review were present, indeed a largenumber were found in other coloured modules.As the AG genes in other organisms have been shown
to be the key carpel identity genes, the connectivity ofthe AG homologues MADS28 and MADS29 was exam-ined further. Fifty-nine genes with a high (> 0.50 weight)association with the AG genes were identified andmapped (Fig. 6b). A network map of this subset shows astrong level of interdependency of these genes. Withinthis sub-network, genes that have been shown to be adirect target of AG in Arabidopsis were identified (Fig. 6bOrange). These include the aforementioned SPL, CRCand a HEC2 like bHLH (bHLH65) genes.Within the fruit ripening ethylene associated turquoise
module there were a considerable number (29) of NACTFs identified, including the previously described NORlike genes (NAC1, NAC2, NAC3) [36], as well as sevenof the eight EIN3-like genes. This module also included45 ERF genes [26], as well as DOF4 [37, 38]. A previousstudies of fruit ripening analysis [37] described 10 TFsassociated with ripening (Additional data 1), most of
Fig. 3 The first two principal components from the top 5000 most differentially expressed genes in a global transcriptomics study of differenttissues. The different tissues are depicted by different colours
Brian et al. BMC Plant Biology (2021) 21:121 Page 6 of 11
which were located in other coloured modules suggest-ing that the wider study presented here gives a betterresolution of tissue specific genes.
ConclusionIn summary, we demonstrate that the eFP browser thatwe constructed and customised to display gene expres-sion data, in combination with genome wide identifica-tion of the TFs and weighted gene co-expressionnetwork analysis provides a powerful platform for in-depth investigation of control and regulation of import-ant processes in the plant life cycle and these tools canbe easily customised to other fruiting species.
MethodsPlant materialAll new tissue presented in this study (Additional data 3)were from the diploid Actinidia chinensis var. chinensiscv. ‘Hort16A’. These data were combined with previ-ously published data from an A. chinensis var. chinensiscv. ‘Hort16A’ fruit maturation and ripening study [15],and a new comprehensive study of a bud series from therelated tetraploid Actinidia chinensis var. chinensis cv.‘Zesy002’ (Voogd et al., in preparation). Fruit was har-vested from the Plant & Food Research site based atKerikeri, New Zealand using standard pergola orchardmanagement techniques. Tissues were harvested com-bining tissue from at least five different vines for each
Fig. 4 Electronic Fluorescent Pictograph (eFP) browser images of MADS related genes showing (a) MADS19 (Acc00495.1) root predominantexpression, (b) MADS45 (Acc27997.1) stem predominant expression, (c) MADS77 (Acc08919.1) leaf expression, (d) MADS6 (Acc10522.1) bud terminallate bud expression, (e) AG (MADS29 - Acc20728.1) flower specific expression, (f) postharvest ethylene treatment with high expression of a SEP4/RIN like gene (MADS52 – Acc26640.1)
Brian et al. BMC Plant Biology (2021) 21:121 Page 7 of 11
replicate. Between two and three replicates were takenfor each tissue type, snap frozen in liquid nitrogen andstored at − 80 °C until needed.
Gene mining, and comparisonsTo identify a complete set of transcription factors anumber of approaches were taken, for each approach,lists were generated and combined and filtered. In brief,a family was chosen to mine based on the classes identi-fied in Arabidopsis [5]. The plant transcription factordatabase (http://planttfdb.cbi.pku.edu.cn/) which con-tains 2296 kiwifruit models generated from the original2013 genome [18] were also assessed. Using an in housedatabase (Bioview) platform, the manually annotatedgene models [19] were identified containing the appro-priate PFam domain [39]. Lastly, gene models identifiedfrom multiple BLASTP searches using appropriate di-verse TFs matches were compared to the manually an-notated gene sets. These were all aligned in geneious[40] using MUSCLE alignment [41]. Using the PFam do-main to identify the DNA binding domain in the alignedregions, genes without a binding domain were removed,thus creating a complete list of TFs. For the R2R3 MYBsand WRKY family a few genes did not appear to have an
Fig. 5 a Gene network modules of the 2747 transcription factors. b Correlation of the modules with nine different tissues and two selectedcircadian related genes (afternoon gene GI (Acc12229.1) and morning gene LHY (MYBR92 Acc24169.1)). c. Detailed correlation between the yellowmodule and the 323 root associated transcription factors
Table 2 Numbers of transcription factors (TF) in each colournetwork module
Network Module TF numbers
black 155
blue 451
brown 422
green 203
green yellow 78
grey 40
magenta 100
pink 135
purple 78
red 159
salmon 42
tan 60
turquoise 480
yellow 370
Brian et al. BMC Plant Biology (2021) 21:121 Page 8 of 11
Acc model. When this occurred, Web Apollo [42] wasused to manually annotate an additional gene model anddesignated with either the Achn model number or a “noAcc match” in Additional data 1. The DNA binding do-mains were then aligned using PHYML [43], and namedsequentially. Circle plots for Fig. 1 were generated in Rusing the “packcircles” library [44].
RNA sequencing and transcriptomicsTotal kiwifruit RNA was isolated using the Spectrum™Plant Total RNA Kit (Sigma-Aldrich, St. Louis, MO,USA) and its integrity was assessed using the RNA 6000Nano kit and the Agilent 2100 Bioanalyzer (AgilentTechnologies, Santa Clara, CA, USA). Three RNA sam-ples per sampling time were used for subsequent libraryconstruction and sequencing. The sequencing librarieswere constructed according to the TruSeq RNA samplepreparation guide (Illumina, San Diego, CA, USA) andsubsequently sequenced by a HiSeq 2500 SequencingSystem (Illumina), obtaining paired-reads of 125 bp. Li-brary construction and sequencing were performed atMacrogen (www.macrogen.com). A minimum of 16Mreads were obtained from the Hort16A tissues and per-centage read mapping ranging from 69 to 92% Add-itional data 3. The Zys002 bud series had a minimum of11.9M reads and percentage read mapping was 51–79%.
All raw sequence data can be found in the NCBI RNA-seq depositories detailed in Additional data 3. The rawreads were aligned using Spliced Transcripts Alignmentto a Reference (STAR) (version 2.5.2a) on default set-tings [45] to the A. chinensis Red 5 v1.69 gene models[19]. PCA analysis was undertaken with the plotPCA inthe DeSeq2 package in R [46] using the 5000 most dif-ferentially expressed genes (ntop = 5000). Raw readswere normalised to transcripts per million (TPM) (Add-itional data 4).
Development of eFP browserThe eFP browser [1] was generated using deposited codefrom SourceForge (https://sourceforge.net/projects/efpbrowser/). Template images were generated by thegraphic design team at Plant & Food Research. The tem-plate images were colourised and reformatted for theeFP browser using the GIMP (https://www.gimp.org/)version 2.8.22 software program. Several additional fea-tures were added to the eFP source code. The modifiedsource code is available via GitHub (https://github.com/pfrnz/eFP-Browser). Experiment images are constructedfrom component images described by the XML file foreach section. Multiple sections can be included in eachexperiment view. This allows the reuse of componentimages for different sections and experiment views,
Fig. 6 Network maps of flower and fruit development. a The red, purple, magenta, tan and turquoise modules with selected transcription factorsnamed, including the AGAMOUS-like (AG) genes MADS28, MADS29 along with potential homologues of other flowering and fruit developmentand ripening genes. b An adjusted network map of a subset of the red module genes that interact with a weight of > 0.5 with the AG-like genes(Blue). Genes that have been shown to be direct targets of AG in Arabidopsis are shown in orange and include CRC (YAB3), SPOROCYTELESS (SPL),and HEC1 (bHLH165)
Brian et al. BMC Plant Biology (2021) 21:121 Page 9 of 11
greatly reducing the effort required to add new experi-ment views. Auto-completion of gene ID input on theinterface was implemented with JavaScript and PHP,referencing the existing ID look-up SQL table. The eFPbrowser was containerised using Docker. The Dockerfilebuilds a Docker container which incorporates the soft-ware requirements, and eFP Browser source code andexperiment images. A second Docker container was usedfor the SQL database of read numbers expression data.A Docker-Compose file is included to run the eFPBrowser and SQL containers. The Actinidia eFP browserwas set up on the Bio-Analytic Resource for Plant Biol-ogy server at bar.utoronto.ca and is available at http://bar.utoronto.ca/efp_actinidia/cgi-bin/efpWeb.cgi
WGCNA network analysisRNA-seq data for gene models associated with transcrip-tion factors were extracted and transcription factors thatwere not expressed (based on no read alignments) inany of the samples were removed from the analysis.Weighted gene co-expression network analysis (WGCNA) [30] v 1.68 was undertaken in the R environmentv3.5.1. In the WGCNA environment the soft power wascalculated and set to six. The minimum module size wasset to 30 and the merge cut height set to 0.25. Hubgenes for each colour environment were calculated using“chooseTopHubInEachModule”. Network data wereexported into Cytoscape v3.7.1 for visualisation.
Supplementary InformationThe online version contains supplementary material available at https://doi.org/10.1186/s12870-021-02894-x.
Additional file 1: Additional data 1. Table of transcription factors,with corresponding colour module assignments and connectivity.
Additional file 2: Additional data 2. Phylogenetic alignments of DNAbinding sites for Transcription factor classes with over nine genes.
Additional file 3: Additional data 3. Details of the RNA-seq data usedin this study.
Additional file 4: Additional data 4. Table of TPM for the RNA-seqdata.
Additional file 5 : Additional data 5. Analysis of circadian geneexpression.
Additional file 6: Additional data 6. Numbers of transcription factorclasses within each colour module.
AbbreviationseFP: Electronic Fluorescent Pictograph; TF: Transcription factor;WGCNA: Weighted gene co-expression network analysis
AcknowledgementsWe would like to thank Tony Corbett for graphics associated with the eFPbrowser, Peggy Kashuba and Phil Martin for helping with tissue harvesting,the Field Research Network for maintenance of the kiwifruit plants, and Dr.Richard Espley and Dr. Sarah Moss for critically reading this manuscript.
Authors’ contributionsAR harvested and advised on tissues for this experiment, LB undertook theRNA-seq preparation and with PM and BW, the RNA-seq data processing. BW
created the Actinidia eFP browser, and NJP, and AP installed it on the BARserver. NN, KD, JR, AA and RS mined the TF gene families and undertookphylogenetic alignment. EV, AA and RS supervised LB and BW and concep-tualised the study. RS undertook the network analysis and wrote the manu-script. All authors read and edited the manuscript. The author(s) read andapproved the final manuscript.
FundingWork from this publication was funded by MBIE: Turbo Breeding and theKiwifruit Royalties investment Fund. The funding body played no role in thedesign, collection, analysis or interpretation of the data in this manuscript.
Availability of data and materialsAll RNA-seq data can be found in NCBI bioproject PRJNA691387 studySRP301347, accession numbers SRR13413552: SRR13413581 (details in Add-itional Data 3).The Actinidia eFP browser can be found at http://bar.utoronto.ca/efp_actinidia/cgi-bin/efpWeb.cgi
Ethics approval and consent to participateNot applicable.
Consent for publicationNot applicable.
Competing interestsThe authors declare no competing interests.
Author details1The New Zealand Institute for Plant and Food Research Ltd (Plant & FoodResearch), Private Bag 92169, Auckland 1146, New Zealand. 2School ofBiological Science, The University of Auckland, Private Bag 92019, Auckland1146, New Zealand. 3Department of Cell & Systems Biology / Centre for theAnalysis of Genome Evolution and Function, University of Toronto, 25Willcocks St, Toronto, ON M5S 3B2, Canada. 4The New Zealand Institute forPlant and Food Research Ltd (Plant & Food Research), 121 Keri Downs Road,Kerikeri 0294, New Zealand. 5The New Zealand Institute for Plant and FoodResearch Ltd (Plant & Food Research), 55 Old Mill Road, Motueka 7198, NewZealand.
Received: 13 October 2020 Accepted: 18 February 2021
References1. Winter D, Vinegar B, Nahal H, Ammar R, Wilson GV, Provart NJ. An
“electronic fluorescent pictograph” browser for exploring and analyzinglarge-scale biological data sets. Plos One. 2007;2(8):e718.
2. Fernandez-Pozo N, Zheng Y, Snyder SI, Nicolas P, Shinozaki Y, Fei Z, CatalaC, Giovannoni JJ, Rose JKC, Mueller LA. The tomato expression atlas.Bioinformatics. 2017;33(15):2397–8.
3. Hawkins C, Caruana J, Li J, Zawora C, Darwish O, Wu J, Alkharouf N, Liu Z.An eFP browser for visualizing strawberry fruit and flower transcriptomes.Horticulture Res. 2017;4:17029.
4. Mao Q, Chen C, Xie T, Luan A, Liu C, He Y. Comprehensive tissue-specifictranscriptome profiling of pineapple (Ananas comosus) and building an eFP-browser for further study. PeerJ. 2018;6:e6028.
5. Riechmann JL, Heard J, Martin G, Reuber L, Jiang C-Z, Keddie J, Adam L,Pineda O, Ratcliffe OJ, Samaha RR, et al. Arabidopsis transcription factors:genome-wide comparative analysis among eukaryotes. Science. 2000;290(5499):2105–10.
6. Lehti-Shiu MD, Panchy N, Wang P, Uygun S, Shiu S-H. Diversity, expansion,and evolutionary novelty of plant DNA-binding transcription factor families.Biochim Biophys Acta. 2017;1860(1):3–20.
7. Zhao T, Holmer R, de Bruijn S, Angenent GC, van den Burg HA, Schranz ME.Phylogenomic Synteny network analysis of MADS-box transcription factorgenes reveals lineage-specific transpositions, ancient tandem duplications,and Deep Positional Conservation. Plant Cell. 2017;29(6):1278–92.
8. Coen ES, Meyerowitz EM. The war of the whorls: genetic interactionscontrolling flower development. Nature. 1991;353(6339):31–7.
Brian et al. BMC Plant Biology (2021) 21:121 Page 10 of 11
9. Ditta G, Pinyopich A, Robles P, Pelaz S, Yanofsky MF. The SEP4 gene ofArabidopsis thaliana functions in floral organ and meristem identity. CurrBiol. 2004;14(21):1935–40.
10. Knapp S. Tobacco to tomatoes: a phylogenetic perspective on fruit diversityin the Solanaceae. J Exp Bot. 2002;53(377):2001–22.
11. Becker A, Theißen G. The major clades of MADS-box genes and their role inthe development and evolution of flowering plants. Mol Phylogenet Evol.2003;29(3):464–89.
12. Ferguson AR. Kiwifruit: a botanical review. Hortic Rev. 1984;6:1–64.13. Richardson AC, Boldingh HL, McAtee PA, Gunaseelan K, Luo Z, Atkinson RG,
David KM, Burdon JN, Schaffer RJ. Fruit development of the diploid kiwifruit,Actinidia chinensis ‘Hort16A’. BMC Plant Biol. 2011;11(1):182.
14. Atkinson RG, Gunaseelan K, Wang MY, Luo L, Wang T, Norling CL, JohnstonSL, Maddumage R, Schröder R, Schaffer RJ. Dissecting the role of climactericethylene in kiwifruit (Actinidia chinensis) ripening using a 1-AMINOCYCLYPROPANE-1-CARBOXYLIC ACID OXIDASE knockdown line. J ExpBot. 2011;62(11):3821–35.
15. McAtee PA, Richardson AC, Nieuwenhuizen NJ, Gunaseelan K, Hoong L,Chen X, Atkinson RG, Burdon JN, David KM, Schaffer RJ. The hybrid non-ethylene and ethylene ripening response in kiwifruit (Actinidia chinensis) isassociated with differential regulation of MADS-box transcription factors.BMC Plant Biol. 2015;15(1):304.
16. Ampomah-Dwamena C, Thrimawithana AH, Dejnoprat S, Lewis D, Espley RV,Allan AC. A kiwifruit (Actinidia deliciosa) R2R3-MYB transcription factormodulates chlorophyll and carotenoid accumulation. New Phytol. 2019;221(1):309–25.
17. Varkonyi-Gasic E, Wang T, Voogd C, Jeon S, Drummond RSM, Gleave AP,Allan AC. Mutagenesis of kiwifruit CENTRORADIALIS-like genes transforms aclimbing woody perennial with long juvenility and axillary flowering into acompact plant with rapid terminal flowering. Plant Biotechnol J. 2019;17(5):869–80.
18. Huang S, Ding J, Deng D, Tang W, Sun H, Liu D, Zhang L, Niu X, Zhang X,Meng M, et al. Draft genome of the kiwifruit Actinidia chinensis. NatCommun. 2013;4(1):2640.
19. Pilkington SM, Crowhurst R, Hilario E, Nardozza S, Fraser L, Peng Y,Gunaseelan K, Simpson R, Tahir J, Deroles SC, et al. A manually annotatedActinidia chinensis var. chinensis (kiwifruit) genome highlights the challengesassociated with draft genomes and gene prediction in plants. BMCGenomics. 2018;19(1):257.
20. Wu J, Wang F, Cheng L, Kong F, Peng Z, Liu S, Yu X, Lu G. Identification,isolation and expression analysis of auxin response factor (ARF) genes inSolanum lycopersicum. Plant Cell Rep. 2011;30(11):2059.
21. Guilfoyle TJ, Hagen G. Auxin response factors. Curr Opin Plant Biol. 2007;10(5):453–60.
22. Zouine M, Fu Y, Chateigner-Boutin A-L, Mila I, Frasse P, Wang H, Audran C,Roustan J-P, Bouzayen M. Characterization of the tomato ARF gene familyuncovers a multi-levels post-transcriptional regulation including alternativesplicing. Plos One. 2014;9(1):e84203.
23. Li W, Ding Z, Ruan M, Yu X, Peng M, Liu Y. Kiwifruit R2R3-MYB transcriptionfactors and contribution of the novel AcMYB75 to red kiwifruit anthocyaninbiosynthesis. Sci Rep. 2017;7(1):16861.
24. Jing Z, Liu Z. Genome-wide identification of WRKY transcription factors inkiwifruit (Actinidia spp.) and analysis of WRKY expression in responses tobiotic and abiotic stresses. Genes Genomics. 2018;40(4):429–46.
25. Varkonyi-Gasic E, Moss SM, Voogd C, Wu R, Lough RH, Wang Y-Y, HellensRP. Identification and characterization of flowering genes in kiwifruit:sequence conservation and role in kiwifruit flower development. BMC PlantBiol. 2011;11(1):72.
26. Gunaseelan K, McAtee PA, Nardozza S, Pidakala P, Wang R, David K, BurdonJ, Schaffer RJ. Copy number variants in kiwifruit ETHYLENE RESPONSEFACTOR/APETALA2 (ERF/AP2)-like genes show divergence in fruit ripeningassociated cold and ethylene responses in C-REPEAT/DRE BINDING FACTOR-like genes. Plos One. 2019;14(5):e0216120.
27. Wu R-M, Walton EF, Richardson AC, Wood M, Hellens RP, Varkonyi-Gasic E.Conservation and divergence of four kiwifruit SVP-like MADS-box genessuggest distinct roles in kiwifruit bud dormancy and flowering. J Exp Bot.2011;63(2):797–807.
28. Voogd C, Wang T, Varkonyi-Gasic E. Functional and expression analyses ofkiwifruit SOC1-like genes suggest that they may not have a role in thetransition to flowering but may affect the duration of dormancy. J Exp Bot.2015;66(15):4699–710.
29. Yoo SK, Wu X, Lee JS, Ahn JH. AGAMOUS-LIKE 6 is a floral promoter thatnegatively regulates the FLC/MAF clade genes and positively regulates FT inArabidopsis. Plant J. 2011;65(1):62–76.
30. Langfelder P, Horvath S. WGCNA: an R package for weighted correlationnetwork analysis. BMC Bioinformatics. 2008;9(1):559.
31. Schaffer R, Ramsay N, Samach A, Corden S, Putterill J, Carré IA, Coupland G.The late elongated hypocotyl mutation of Arabidopsis disrupts circadianrhythms and the photoperiodic control of flowering. Cell. 1998;93(7):1219–29.
32. Fowler S, Lee K, Onouchi H, Samach A, Richardson K, Morris B, Coupland G,Putterill J. GIGANTEA: a circadian clock-controlled gene that regulatesphotoperiodic flowering in Arabidopsis and encodes a protein with severalpossible membrane-spanning domains. EMBO J. 1999;18(17):4679–88.
33. Crawford BCW, Yanofsky MF. HALF FILLED promotes reproductive tractdevelopment and fertilization efficiency in Arabidopsis thaliana.Development. 2011;138(14):2999–3009.
34. Bhargava A, Ahad A, Wang S, Mansfield SD, Haughn GW, Douglas CJ, EllisBE. The interacting MYB75 and KNAT7 transcription factors modulatesecondary cell wall deposition both in stems and seed coat in Arabidopsis.Planta. 2013;237(5):1199–211.
35. Pfannebecker KC, Lange M, Rupp O, Becker A. Seed plant-specific genelineages involved in carpel development. Mol Biol Evol. 2017;34(4):925–42.
36. Nieuwenhuizen NJ, Chen X, Wang MY, Matich AJ, Perez RL, Allan AC, GreenSA, Atkinson RG. Natural variation in monoterpene synthesis in kiwifruit:transcriptional regulation of terpene synthases by NAC and ETHYLENE-INSENSITIVE3-like transcription factors. Plant Physiol. 2015;167(4):1243–58.
37. A-D Zhang, Wang W-Q, Tong Y, Li M-J, Grierson D, Ferguson I, Chen K-S, YinX-R. Transcriptome analysis identifies a zinc finger protein regulating starchdegradation in kiwifruit. Plant Physiol. 2018;178(2):850–63.
38. Zhang A, Zhang Q, Li J, Gong H, Fan X, Yang Y, Liu X, Yin X. Transcriptomeco-expression network analysis identifies key genes and regulators ofripening kiwifruit ester biosynthesis. BMC Plant Biol. 2020;20(1):103.
39. Finn RD, Bateman A, Clements J, Coggill P, Eberhardt RY, Eddy SR, Heger A,Hetherington K, Holm L, Mistry J, et al. Pfam: the protein families database.Nucleic Acids Res. 2013;42(D1):D222–30.
40. Kearse M, Moir R, Wilson A, Stones-Havas S, Cheung M, Sturrock S, Buxton S,Cooper A, Markowitz S, Duran C, et al. Geneious basic: an integrated andextendable desktop software platform for the organization and analysis ofsequence data. Bioinformatics. 2012;28(12):1647–9.
41. Edgar RC. MUSCLE: multiple sequence alignment with high accuracy andhigh throughput. Nucleic Acids Res. 2004;32(5):1792–7.
42. Lee E, Helt GA, Reese JT, Munoz-Torres MC, Childers CP, Buels RM, Stein L,Holmes IH, Elsik CG, Lewis SE. Web Apollo: a web-based genomicannotation editing platform. Genome Biol. 2013;14(8):R93.
43. Guindon S, Delsuc F, Dufayard J-F, Gascuel O. Estimating maximumlikelihood phylogenies with PhyML. In: Posada D, editor. Bioinformatics forDNA sequence analysis. Totowa: Humana Press; 2009. p. 113–37.
44. Bedward M, Eppstein D, Menzel P. packcircles: circle packing. Rpackages2018.
45. Dobin A, Davis CA, Schlesinger F, Drenkow J, Zaleski C, Jha S, Batut P,Chaisson M, Gingeras TR. STAR: ultrafast universal RNA-seq aligner.Bioinformatics. 2012;29(1):15–21.
46. Love MI, Huber W, Anders S. Moderated estimation of fold change anddispersion for RNA-seq data with DESeq2. Genome Biol. 2014;15(12):550.
Publisher’s NoteSpringer Nature remains neutral with regard to jurisdictional claims inpublished maps and institutional affiliations.
Brian et al. BMC Plant Biology (2021) 21:121 Page 11 of 11