Embed Size (px)
Citation preview
2016 KIWIFRUIT
BOOK
A resource for New Zealand secondary school teachers
and growers new to the kiwifruit industry
New Zealand Kiwifruit Book 2016 - 1
FOREWORD Welcome to the second edition of the Kiwifruit Book. This book is intended as an open access, up to date resource for secondary school teachers and new growers. It covers what was thought to be relevant to teachers in 2016 from the kiwifruit industry structure to the methods kiwifruit growers use to protect their orchards from frost.
The development of this kiwifruit book started through a query made by Rick Jochem, an Ag/Hort teacher from Palmerston North Boys High School, asking if New Zealand Kiwifruit Growers Incorporated (NZKGI) would consider supporting the development of a kiwifruit workbook for use in secondary schools. Rick expressed concern at the limited availability of kiwifruit industry information available online. NZKGI agreed to support Rick and utilised funding received from a grower through the Acorn Foundation, together with a number of industry resources, to pull together relevant information for the first iteration of the book.
The second edition of the Kiwifruit Book has taken the bones of the first edition and built on them to include the latest industry research and development. Additions to the 2016 Kiwifruit Book include:
• An overview on orchard accounts written by Mayston Partners Ltd.
• An in-depth look at sustainable soil management in New Zealand written by the Agribusiness Group
• Research results from a recent study conducted by Zespri on the nutritional benefits of kiwifruit
• An overview of how the kiwifruit industry bounced back after the devastating blow of Psa- written by Kiwifruit Vine Health
• New regulations regarding Taste Zespri and the de-commercialisation of G9 written by kiwifruit grower Dermott Malley
• An overview of sprays written by kiwifruit grower Simon Cook
• Updated statistics and information from the 2015-16 financial year
New Zealand Kiwifruit Book 2016 - 2
CONTRIBUTORS
NZKGI would like to sincerely thank all those that have invested their time into the development of this kiwifruit book. The information you have provided in this research has been of huge value and could not have taken place without your support. In particular, those who have been instrumental to the Kiwifruit Book include:
Acorn Foundation, Bay of Plenty Kate Longman, NZKGI Renee Fritchley, NZKGI Rick Jochem, Palmerston North Boys High School Liarna Fraser, Kiwifruit Grower Sophie Headley, Zespri Communications Jayson Benge, The AgriBusiness Group Jayne Chamberlain, Orchard Productivity Centre (OPC) Shane Max, Zespri Orchard Productivity Centre (OPC) Chrissy Stokes, Zespri Orchard Productivity Centre (OPC) Catherine Richardson, Zespri Simon Cook, Kiwifruit Grower Dermott Malley, Kiwifruit Grower Lara Harrison, KVH David Courtney, Zespri Lyn Parlane, Priority One Terry Collett, Ministry of Education Tim Mayston, Mayston Partners Ltd. Helen McKoy, Bethlehem College Helen van der Werff, Primary ITO If you would like more information on featured topics in this book or can contribute to the next edition, please contact New Zealand Kiwifruit Growers Incorporated on 0800 232 505.
New Zealand Kiwifruit Book 2016 - 3
CONTENTS Table of Figures ...................................................................................................................................................... 5
Table of Images ....................................................................................................................................................... 6
Terms and Definitions ............................................................................................................................................. 8
Chapter 1: Industry Overview ................................................................................................................................. 9
1.1 The Kiwifruit Industry’s History in Brief........................................................................................................ 9
1.2 Current Industry Structure ......................................................................................................................... 13
1.2.1 Key Organisations ............................................................................................................................... 13
1.2.2 Single Point of Entry ............................................................................................................................ 15
1.3 Operating Environment .............................................................................................................................. 17
1.3.1 Competitive Position Globally ............................................................................................................. 17
1.3.2 Environmental Sustainability .............................................................................................................. 20
1.3.3 Sustainable Nutrient Management ..................................................................................................... 23
Chapter 2: Zespri’s Role in the Industry................................................................................................................ 31
2.1 Brand and Marketing.................................................................................................................................. 31
2.1.1 Health Marketing ................................................................................................................................ 33
2.1.2 Developing New Markets .................................................................................................................... 39
2.2 Quality ........................................................................................................................................................ 40
2.3 In-Market Distribution ................................................................................................................................ 46
2.4 Integrated Supply System .......................................................................................................................... 47
2.5 Category Management ............................................................................................................................... 48
2.6 Leaders in Innovation ................................................................................................................................. 49
Chapter 3: Orchard Development ....................................................................................................................... 53
3.1 Support Structures ..................................................................................................................................... 53
3.2 Shelter ........................................................................................................................................................ 54
3.3 Irrigation ..................................................................................................................................................... 56
3.4 Frost Protection .......................................................................................................................................... 57
3.4.1 Methods of Frost Protection ............................................................................................................... 58
3.5 Rootstocks and Grafting ............................................................................................................................. 59
3.6 Stringing ..................................................................................................................................................... 60
Chapter 4: On Orchard Management Practices.................................................................................................... 62
4.1 New Zealand Kiwifruit Growth Cycle .......................................................................................................... 62
4.2 Vine Management – Pruning ...................................................................................................................... 64
4.2.1 Winter Pruning .................................................................................................................................... 64
4.2 2 Summer Pruning ................................................................................................................................. 65
4.2.3 Zero- Leaf Pruning and Tip Squeezing ................................................................................................. 66
New Zealand Kiwifruit Book 2016 - 4
4.3 Budbreak .................................................................................................................................................... 66
4.4 Pollination .................................................................................................................................................. 67
4.5 Thinning ...................................................................................................................................................... 69
4.6 Pest and Disease Control ............................................................................................................................ 70
4.6.1 Pseudomonas Syringae PV. Actinidiae, (Psa-V) ................................................................................... 72
4.6.2 Industry Response to PSA-V ................................................................................................................ 74
4.7 Girdling ....................................................................................................................................................... 76
4.8 Root Pruning ............................................................................................................................................... 77
Chapter 5: Harvest and Postharvest Practices...................................................................................................... 79
5.1 Harvest ....................................................................................................................................................... 80
5.1.1 Timing ................................................................................................................................................. 80
5.1.2 Kiwistart Premium .............................................................................................................................. 81
5.1.3 Time Payments .................................................................................................................................... 81
5.2 Postharvest ................................................................................................................................................. 81
5.2.1 Packing ................................................................................................................................................ 82
5.2.2 Packaging ............................................................................................................................................ 82
5.2.3 Labelling .............................................................................................................................................. 82
5.2.4 Coolstorage ......................................................................................................................................... 83
5.2.5 Shipping .............................................................................................................................................. 83
6. Orchard Accounts ............................................................................................................................................. 85
Appendix ............................................................................................................................................................... 89
References ............................................................................................................................................................ 93
New Zealand Kiwifruit Book 2016 - 5
TABLE OF FIGURES Figure 1: Regional production of kiwifruit in New Zealand .................................................................................. 18
Figure 2: Number of hectares of kiwifruit produced in each region. ................................................................... 18
Figure 3: Picture of fruit stand representing the competition New Zealand faces in the market place. ............. 19
Figure 4: Cost of production: New Zealand verses Chile in USD per Kilogram. .................................................... 19
Figure 5: New Zealand verses Chilean returns in USD per kilo; 2009-2013.......................................................... 20
Figure 6: Comparison of volume and value share of the global kiwifruit export market. .................................... 20
Figure 7- Soil nitrogen cycle for a plant-based system. ........................................................................................ 24
Figure 8: Zespri’s Long Term Strategy. ................................................................................................................. 31
Figure 9: Project Healthy 2007 – Consumer survey understanding why consumers buy Zespri Kiwifruit. .......... 33
Figure 10: The three health communications pillars within the Zespri health strategy. ...................................... 34
Figure 11: Nutrient adequacy score of kiwifruit. .................................................................................................. 35
Figure 12: Fruit fibre content comparison graph. ................................................................................................ 36
Figure 13: Fruit vitamin C content comparison graph. ......................................................................................... 36
Figure 14: Fruit folic acid content comparison graph. .......................................................................................... 37
Figure 15: Fruit potassium content comparison graph. ....................................................................................... 38
Figure 16- Fruit vitamin E content comparison graph .......................................................................................... 39
Figure 17: Forecast volume growth by category, forecast supply volumes to 2026. ........................................... 39
Figure 18: Sales volume by market 2015. ............................................................................................................. 39
Figure 19: Market size preference for fruit by cultivar in 2016. ........................................................................... 40
Figure 20: Minimum Taste Standard by Cultivar. ................................................................................................. 42
Figure 21: Fruit sample cultivar, 2016. ................................................................................................................. 43
Figure 22: Growing superior dry matter in Zespri Kiwifruit (Zespri, OPC). ........................................................... 45
Figure 23: The Zespri System. ............................................................................................................................... 47
Figure 24: An example of different types of kiwifruit cultivars planted in Te Puke. ............................................ 50
Figure 25: Zespri Gold. .......................................................................................................................................... 50
Figure 26: Zespri and Plant & Food Research ‘Breeding Pipeline’. ....................................................................... 51
Figure 27: Picture displaying Zespri’s current commercial cultivars. From left to right: Organic Green, Green, Sungold, and Sweet Green. .................................................................................................................................. 51
Figure 28: The New Zealand kiwifruit growing cycle showing the vine growth stage and orchard management practices on a seasonal basis. ............................................................................................................................... 62
Figure 29: On- orchard kiwifruit production steps and key management actions. .............................................. 63
Figure 30: Shoot types. ......................................................................................................................................... 64
Figure 31: Which fruit is king fruit and which is lateral? ...................................................................................... 70
Figure 32- Media release from Todd Muller, May 2016. ...................................................................................... 74
Figure 33: Flow chart outlines all the process and controls that fruit goes through before it is exported. ......... 79
Figure 34: (left) Zespri Green Organic Green Kiwifruit label which is then removed if required (i.e. fumigation) to reveal the standard |Green Kiwifruit label (right). .......................................................................................... 83
Figure 35: Table showing Orchard Gate Return for a full year ............................................................................. 86
Figure 36: An example of an orchardist’s budget showing expenses, incomes and profitability. ........................ 88
Figure 37: General industry statistics, production by size over eight previous seasons. ..................................... 89
Figure 38: Key figures from Zespri’s Annual Results 2015-16. ............................................................................. 89
Figure 39: Production area and trays supplied of kiwifruit varieties by region over the past four seasons. ...... 91
Figure 40: Zespri top 10 historic markets by volume sold (trays) for both green and gold varieties. .................. 92
Figure 41: Kiwifruit by domestic and export prices, and export quantity June 2006 – October 2013 – Statistics New Zealand. ........................................................................................................................................................ 92
New Zealand Kiwifruit Book 2016 - 6
TABLE OF IMAGES Image 1: Birds eye view of kiwifruit and avocado orchards in the Bay of Plenty (Bevan Jelly, NZ Avocado) ....... 17
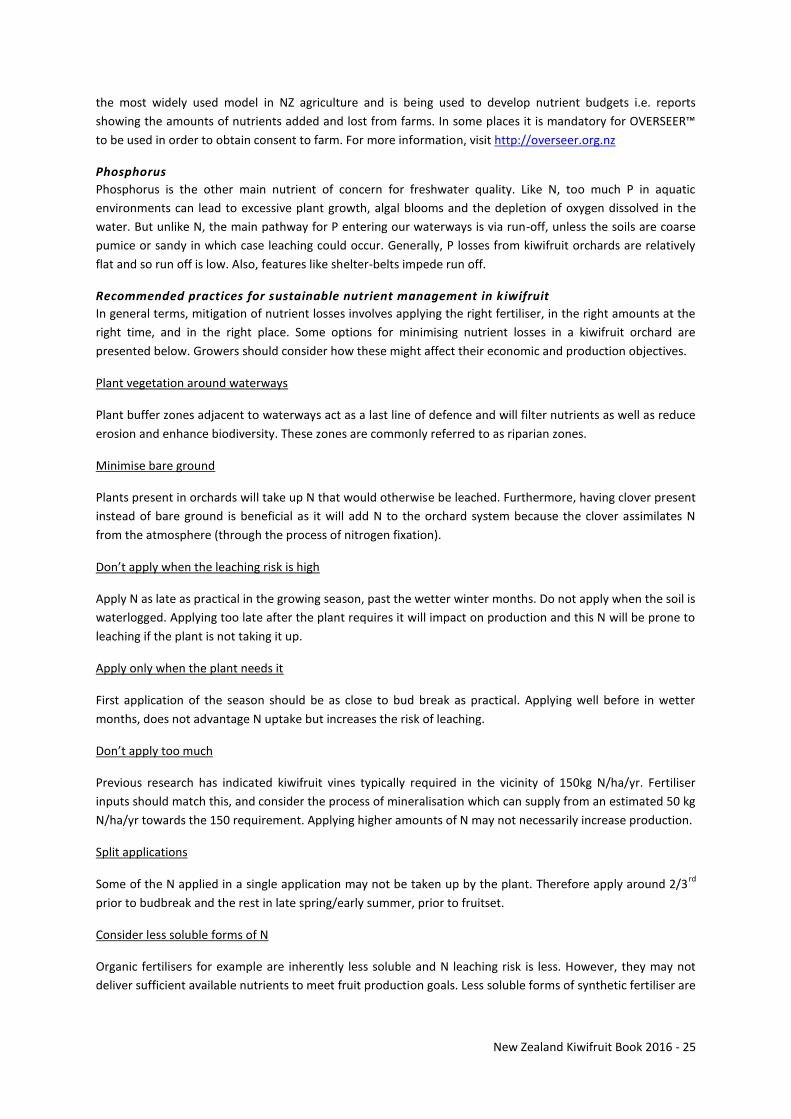
Image 2: (left) Leaf speckling. Image 3: (right) Leaf burn at the leaf margin........................................................ 28
Image 4: (left) Bronzing of the upper leaf surface. Image 5: (right) Brown staining of leaf veins. ....................... 28
Image 6: Young kiwifruit vine growing on pergola system (Shane Max, Zespri OPC) .......................................... 53
Image 7: (left) Grafted kiwifruit stumps with pergola structures and wires in place ready for trainning (Shane Max, Zespri OPC). Image 8: (right) Kiwifruit growing on a pergola system. ......................................................... 54
Image 9: (left) T-Bar grown kiwifruit vines. Image 10: (right) T- Bar to Pergola conversion kiwifruit vines (Shane Max, Zespri OPC) .................................................................................................................................................. 54
Image 11: Trees planted for natural shelter (Shane Max, Zespri OPC). Image 12: (right) Internal shelter helps to keep temperatures up reduce wind and improve the growth of developing vines (Shane Max, Zespri OPC)..... 55
Image 13: The erection of hail netting over an orchard. In this instance the structure also has enclosed sides. 56
Image 14: (left) Perimeter artificial shelter (Shane Max) Image 15 : (right) internal artificial wind breaks have removed the need for natural shelter and so increasing the productive area (Shane Max, Zespri OPC) ............ 56
Image 16: Sprinkler used for irrigation (Shane Max, Zespri OPC)......................................................................... 57
Image 17: (left) Severely frost damaged kiwifruit leaves (Shane Max) Image 18: (right) Ice on kiwifruit (Shane Max) ...................................................................................................................................................................... 57
Image 19: (left) "Frost pot" Burner used to heat orchard area Image 20: (right) Sprinklers used for frost protection (Shane Max, Zespri OPC) ..................................................................................................................... 58
Image 21: (left) Windmill Used for Frost protection (Shane Max) Image 22: (right) helicopters used for frost protection ............................................................................................................................................................. 59
Image 23: Overhead shelter (Shane Max) ............................................................................................................ 59
Image 24: (left) Kiwifruit vines growing up strings. Image 25: (right) Kiwifruit block step up for growing up strings (Shane Max, Zespri OPC) ........................................................................................................................... 61
Image 26: Pergola kiwifruit block set up for growing up strings (Shane Max). .................................................... 61
Image 27: An even spread of high quality winter buds (Shane Max, Zespri OPC) ................................................ 65
Image 28: (left) Grass growing beneath an well- maintained open light canopy (Shane Max, Zespri OPC)Image 29 :(right) poorly maintained with low light levels have led to shading and leaf drop (Shane Max, Zespri OPC) 65
Image 30: (left) Re growths and tangles in gold kiwifruit (Shane Max, Zespri OPC). Image 31 :( right) A non-terminated cane is shown on the left and a terminated can on the right (Shane Max, Zespri OPC) ................... 66
Image 32: (left) Male kiwifruit flowers. Image 33: (right) Female kiwifruit flowers. ............................................ 67
Image 34: Spraying dormant kiwifruit vines (Shane Max Zespri OPC) ................................................................. 70
Image 35: (left) Female Cicada (Shane Max, Zespri OPC) ..................................................................................... 71
Image 36: (left) Passion vine hopper (PVH) (Shane Max, Zespri OPC) Image 37: (right) PVH eggs in kiwifruit wood (Shane Max, Zespri OPC). ........................................................................................................................... 71
Image 38: (left) close up of scale (Shane Max, Zespri OPC) Image 39: (right) Scale on gold Kiwifruit (Shane Max, Zespri OPC) ........................................................................................................................................................... 71
Image 40: Scierotina infected kiwifruit (Shane Max, Zespri OPC). Image 41: (right) Armillaria infected kiwifruit trunk (Shane Max, Zespri OPC) ............................................................................................................................. 72
Image 42: (left) Typical feeding damage to young fruit by leafroller caterpillars (Shane Max, Zespri OPC). Image 43: (right) Fully-grown caterpillar of a) brown- headed leafroller and b) black-lyre leafroller ............................ 72
Image 44: (left) Psa-V magnified 6000 times (KVH). Image 45: (right) Psa-V is rod shaped with flagella (KVH/ Plant and Food Research) ..................................................................................................................................... 73
Image 46: (left) leaf spotting symptom of Psa-V (KVH). Image 47: (right) Exudate (ooze) coming from a Kiwifruit plant is another symptom of Psa-V (KVH) ............................................................................................................ 73
Image 48: (left) severe girdle- cut through both the phloem and xylem. Pen shows where girdle should have finished. (Shane Max, Zespri OPC). Image 49 (right) Correct girdle (Shane Max, Zespri OPC). ............................ 77
Image 50: (left) three healed girdles (Shane Max). Image: 51(right) chain used for girdling (Shane Max, Zespri OPC). ..................................................................................................................................................................... 77
New Zealand Kiwifruit Book 2016 - 7
Image 52: Girdling knife ........................................................................................................................................ 77
Image 53: Root Pruning is done with a large blade attached to the back of a tractor that drives slowly down the rows and cuts down into the soil. ......................................................................................................................... 78
Image 54: Ripper attached to the back of a tractor, used to help improve soil drainage (Shane Max). .............. 78
Image 55: Picking fruit into picking bags during harvest and emptying into bins for transport to the packhouse. .............................................................................................................................................................................. 81
Image 56: (left) Kiwifruit passing over grading tables in the packhouse. Image 57: (right) Kiwifruit on the sizer where they are weighted and sent to the packing lane where that size is being packed. ................................... 82
Image 58: Zespri kiwifruit exported to South Korea in loose modular bulk pack and re-packaged in smaller retail packs (Mark Gardiner Nov 2014). ............................................................................................................... 82
Image 59: Vessel leaving Tauranga port ............................................................................................................... 84
New Zealand Kiwifruit Book 2016 - 8
TERMS AND DEFINITIONS
Bio-Stimulants Include diverse formulations of compounds, substances and micro-organisms that are applied to plants or soils to improve crop vigour, yields, quality and tolerance of stresses.
Black seeds The number of mature black seeds in a fruit. It is used as a measure of maturity.
Botrytis A pathogenic fungus that can attack many different types of plants.
CA Controlled Atmosphere storage slows down the opening process and sends the fruit into hibernation meaning fruit can be kept for longer.
Cupric Ion Of or pertaining to copper, especially copper in its highest valence.
Dioecious Kiwifruit is dioecious, having separate male and female plants.
Dry Matter Calculated as the ratio of dry to fresh weight. Using the following equation: Dry matter (DM) = Dry Weight ÷ Fresh Weight. Here fresh weight is the total fruit weight, including water and the dry weight contents that have been removed after the water has been removed.
FOBS Free on board (FOB) is a trade term requiring the seller to deliver goods on board a vessel designated by the buyer. The seller fulfils its obligations to deliver when the goods have passed over the ship's rail.
Gold3 This cultivar was commercialised by Zespri in 2010 and is otherwise known as Zespri SunGold.
Gold9 This cultivar was commercialised by Zespri in 2010 and is otherwise known as Zespri Charm. However G9 is no longer on the market due to faults with its physical appearance.
Green14 - This cultivar was commercialised by Zespri in 2010 and is otherwise known as Sweet Green.
Hort16A The variety otherwise known as Zespri Gold.
Hybrid Cooperative
Is an organisational structure where growers are accountable through holding a share of the business, share in its profits, and must equally share its burdens.
KISP The Kiwifruit Industry Strategy Project is a sustainable and long-term plan developed by Kiwifruit Industry representatives to maximise the wealth of New Zealand kiwifruit growers.
Leaf Chlorosis Chlorosis is a condition in which leaves produce insufficient chlorophyll. As chlorophyll is responsible for the green colour of leaves, chlorotic leaves are pale, yellow, or yellow-white.
MTS Minimum Taste Standard is a Zespri initiative used to optimise the taste standard of crops so all Zespri® Kiwifruit are recognised and valued by customers as being consistent in taste.
Non-Terminating Shoots/ Terminating Shoots
Two types of shoots are produced. Terminating shoots are short, 3-6 leaved shoots, which frequently form flower buds the following year. Non-terminating shoots may grow 10-15 feet in a season, producing smaller leaves along long internodes, with the distal portion of the shoot often coiling on contact with other shoots or solid objects. Non-terminating shoots perform the function of tendrils, which are absent in kiwifruit.
Phloem Phloem is one of the two types of transport tissue in vascular plants; Xylem being the other. Phloem is a transport tissue in vascular plants which conducts sugars and other metabolic products downwards from the leaves.
Phytotoxicity Is a toxic effect by a compound on plant growth. Such damage may be caused by a wide variety of compounds, including trace metals, salinity, pesticides, phytotoxins or allelochemicals.
PLU Price Look Up numbers are identification numbers affixed to produce in grocery stores and supermarkets to make check-out and inventory control easier, faster, and more accurate.
SPE Single Point of Entry is the use of one exporter over multiple exporters for example Zespri holds the SPE for the NZ kiwifruit industry.
TE Tray Equivalent.
TZG Taste Zespri Grade mechanism for calculating the quality of taste in Zespri Kiwifruit.
Xylem Xylem is one of the two types of transport tissue in vascular plants; phloem being the other. The basic function of xylem is to transport water from roots to shoot and leaves, but it also transports some nutrients.
Zespri Zespri International Limited is the world’s largest marketer of kiwifruit, selling kiwifruit in 56 countries and managing 30 percent of the global volume.
Zespri Crop Protection Standard
The Zespri Crop Protection Standard tells growers which Agrochemical Compounds may be applied to fruit which will be marketed by Zespri. These standards ensure fruit meets the legal requirements in each country where Zespri fruit is sold.
New Zealand Kiwifruit Book 2016 - 9
CHAPTER 1: INDUSTRY OVERVIEW This chapter is separated into three parts as follows:
The kiwifruit industry’s history in brief (Section 1.1)
The current structure of the kiwifruit industry (Section 1.2)
A brief overview of the operating environment and strategy (Section 1.3)
1.1 THE KIWIFRUIT INDUSTRY’S HISTORY IN BRIEF
This section briefly takes the reader through the history of the kiwifruit industry and aims to describe the major historical events that shaped the kiwifruit industry into what it is today. The section is divided as follows:
The beginnings
1960s
1980s
1990s
The early 2000s The beginnings Kiwifruit seeds were brought into New Zealand from China in 1904. At the time, kiwifruit was known by its Chinese name Yang Tao and English names Chinese Gooseberry and Monkey Peach. In 1927, New Zealander Hayward Wright bred a cultivar of kiwifruit known as ‘Hayward’. By the 1960’s, ‘Hayward’ became the standard cultivar of exported kiwifruit around the world and now makes up 90% of the world production of kiwifruit (Anon., 2010).
1960s The kiwifruit industry in New Zealand is youthful in comparison to many other primary industries. Its real commercial beginnings sit in the 1960s. The first industry body the Kiwifruit Export Promotion Committee was formed in 1970. This led to the New Zealand Kiwifruit Authority (NZKA), which in its initial form, dates back to October 1977. Its structure was very different to what exists today. Its role was to license exporters, such as Turners and Growers, the New Zealand Fruitgrowers’ Federation and Auckland Export and at its peak had up to seven exporters licensed. As well as licensing, the NZKA co-ordinated packaging and had authority over export grade standards and promotion, but it had no control over sales and marketing activities. 1980s From the mid-1980s, the volume of kiwifruit started to increase significantly. In 1981 for example, 22,000 tonnes of kiwifruit were exported. By 1897, that had risen to 203,000 tonnes. Over the same period the return to growers per tray had dropped from $7.84 in 1981 to $3.00 in 1987 (pre-packing charges which were around $2.00 a tray). This resulted in 91 percent of growers making a loss from their kiwifruit operations. A dramatic rise in the New Zealand dollar (NZD) in 1987, followed by inflation reducing policies by the Reserve Bank of New Zealand (RBNZ) led to interest rates reaching their peak at 20.5% in June 1987 (RBNZ, 2012). Over-production along with the high NZD made the price of New Zealand kiwifruit expensive in overseas markets and therefore reduced demand. This combined with kiwifruit land values falling led to an equity crisis for many growers. This was the turning point that started the debate about the advantages of having one exporter (known today as Single Point of Entry) over multiple exporters. In 1987, as a result of heated debate on the topic, the NZKA engaged a consultant’s report. A referendum was then held in September 1988. The industry’s set target was to get 80% grower support for the SPE. The fall in export prices and the undercutting between the seven kiwifruit exporters were key arguments in favour of the creation of the SPE. In the end, 84% of growers supported the creation of the Kiwifruit Marketing Board with statutory powers to buy all kiwifruit that was to be exported. The New Zealand Kiwifruit Marketing Board (NZKMB) came into being and its first season of operation was 1989/90. This ended the multi-exporter regime and replaced it with the single desk marketing structure that the kiwifruit industry has today. This foresight
New Zealand Kiwifruit Book 2016 - 10
has allowed New Zealand kiwifruit growers to develop their industry into a global business with concerted investment in branding, marketing, quality, and research and development. 1990s
The 1992/93 season was a disaster for the New Zealand kiwifruit industry. New Zealand and international
kiwifruit volumes continued to grow and problems came to a peak during this season as a result of various
factors such as bad management and governance. The NZKMB got into serious difficulty. Growers were over-
paid and massive debt was the result. The NZKMB with strong grower support reacted decisively, and the debt
was paid off over the ensuing 18 months.
As a result of what had occurred, the industry put in place a three-stage review that incorporated major
structural change.
1. New Zealand Kiwifruit Growers Incorporated became operational in July 1994.
2. Marketing and branding was reviewed and the recommendation that resulted led to the creation of
the Zespri brand, which was launched in the 1996/97 season, and the creation of Zespri as a separate
marketing and sales organisation.
3. Corporatisation, collaborative marketing and the industry’s operational structures were looked at and
a report presented to NZKGI. A referendum was held and the structure of the industry altered (in
1996/97) to include: Zespri as a marketing company, an NZKGI Forum, and NZKMB (which remained in
existence.) (New legislation was not required to make these changes.)
The positive results of the three-stage review included the formation of the Zespri business, the establishment
of collaborative marketing, and a more efficient on-shore operational structure. The three-stage review also
incorporated 12-month supply, new varieties and plant breeding. It was in 1997 that Zespri Gold was launched
on a commercial basis. It was the first time there was an alternate successful variety to the Hayward.
Furthermore, the three stage review formed the basis of today’s kiwifruit industry, and the way in which it
operates.
The late 1990s provided some challenges courtesy of the National Government which, at the time, did not
favour producer boards – the NZKMB was one of these – and was keen for deregulation to occur. Negotiations
with the National Government saw the kiwifruit industry win some battles and lose some. The fact the
kiwifruit industry had recently created a new structure following its own review stood it in good stead.
Corporatisation was a key talking point. A recommendation of the three-stage review was that the kiwifruit
industry would become a corporatised business with a production-based share-holding concept. This was not
approved by Government. A co-operative company was not an option; a standard corporate was. This remains
the case today. What Government did concede, however, was that the industry’s single desk status could
remain. The ensuing Labour Government put to bed any discussion over deregulating the kiwifruit industry.
The early 2000s
April 1, 2000 saw the launch of the Zespri Group Ltd – Zespri was officially corporatised. All growers at that
time become shareholders in the Zespri Group Ltd, with the number of shares relevant to tray production. This
was but a moment in time when alignment existed between production and shareholding as growers who
have since left the kiwifruit industry were able to retain their shares and there is no restriction on
shareholding.
The following year saw turmoil within the Apple and Pear Board, which was taken over and subsequently
deregulated. The kiwifruit industry structure was different in that only growers could have shares.
In 2001 a change to kiwifruit legislation occurred. A voting cap was introduced to ensure growers retained
control of the industry. The maximum number of votes a grower could have was based on production and
hence a direct link between production and voting rights was established.

New Zealand Kiwifruit Book 2016 - 11
No significant further review of the Kiwifruit Industry has been held until the Kiwifruit Industry Strategy Project
(KISP) that was launched in October 2013. The Kiwifruit Industry Strategy Project (KISP) was established to
jointly develop a strategy to maximise the industry’s ability to achieve the New Zealand kiwifruit industry’s
long-term market, strategic and financial performance for the benefit of New Zealand kiwifruit growers in a
changing global market with the wide support of key industry stakeholders.
A group of people were appointed by the Industry Advisory Council (IAC) as a cross-representative group of the
three corners of the industry structure – growers, post-harvest and Zespri. The project began by establishing a
broadly agreed set of principles that framed industry discussion and decision-making when agreeing to a long-
term strategy for the New Zealand kiwifruit industry. These principles included:
KISP Framework
The New Zealand kiwifruit industry must act responsibly and ethically on all economic, sustainability,
environmental, social and regulatory issues to the benefit of New Zealand kiwifruit growers and the wider New
Zealand community.
Single Point of Entry (SPE)
The Single Point of Entry is retained and enhanced to maximise its performance for New Zealand kiwifruit
growers.
Industry Governance
Given the increasingly competitive international market, Zespri governance must meet world-best practice
standards so that it delivers on its Purpose (Principle 5).
Effective leadership and governance of all industry structures must be supported by effective New Zealand
kiwifruit grower control, representation and consultation.
Zespri Ownership
New Zealand kiwifruit growers must own and control Zespri, and be the main beneficiaries of Zespri
performance*.
*In considering submissions on Zespri ownership, the Group will consider all aspects of ownership, including
alignment with production.
Marketing
Zespri’s purpose is to be “best in class” international branded kiwifruit sales and marketing organisation in
order to ensure a sustainable New Zealand kiwifruit industry that maximises New Zealand kiwifruit grower
returns.
Zespri-branded kiwifruit is the best available kiwifruit around the world 12 months of the year for the overall
benefit of New Zealand kiwifruit growers. **
The New Zealand kiwifruit industry must have a process to evaluate and implement genuine innovative
commercial and marketing ideas, including collaborative marketing, that are aligned to Zespri’s global
marketing strategy and for the long-term benefit of New Zealand kiwifruit growers.
**The Group will consider the implications of the industry strategy to non-New Zealand supply businesses and
consider how the risks and rewards from the activity are captured by Zespri and how the profits are used.
Supply Chain Effectiveness
The New Zealand kiwifruit industry must have an efficient, competitive and responsive onshore post-harvest
sector that is aligned with the industry strategy, offering grower choice that is integrated into an efficient
global supply chain. The New Zealand kiwifruit industry must have a world-class global supply chain from
orchard to consumer.
New Zealand Kiwifruit Book 2016 - 12
Zespri’s payment system for New Zealand-grown kiwifruit must reflect commercial signals based on in-market
returns.
Innovation
To maximise the New Zealand kiwifruit industry’s global competitive advantage the New Zealand kiwifruit
industry must continue to develop and implement a world-class and sustainable R&D programme.
As an integral part of the SPE, the New Zealand kiwifruit industry must have the ability to develop, own,
licence, control and maximise the value generated from the world’s leading portfolio of kiwifruit Plant Variety
Right varieties.
Funding
Zespri is funded and remunerated appropriately to ensure it can deliver the full scope of its responsibilities.
Working groups were established to consider each of the key principles and an output paper was established
for each group. The industry was then consulted on the recommendations for these working groups in a
document called Stage 2: Industry Vision Document. Meetings were held in all kiwifruit growing regions to
discuss the proposals and industry members were invited to make submissions. In December 2014, following
the consideration of submissions, a revised set of proposals was published for further consultation. A
referendum of growers on the proposal was held in early 2015 to determine support for the KISP proposals.
The project has gained the mandate from growers to implement KISP’s proposals in a referendum held in
March 2015. New Zealand kiwifruit growers turned out in record numbers to vote, delivering a very solid
mandate for the future ownership, control and structure of the industry through the Kiwifruit Industry Strategy
Project process.
Two thirds of New Zealand growers voted during the Kiwifruit Industry Strategy Project referendum, and of
these, 91% supported the ten propositions. The key results in the referendum were:
98% of growers supporting the industry’s Single Point of Entry structure
92% of growers supporting the implementation of a cap on Zespri share-holding
91% of growers supporting a change to how Zespri is funded to maximise returns to New Zealand
growers
94% of growers supporting changes to their industry representation to ensure they determine grower
equity decisions about grower payments
Following the referendum, the KISP group asked the Ministry for Primary Industries to revise the Kiwifruit
Regulations to allow implementation of the KISP recommendations. MPI issued a public consultation paper in
early 2016 and revision of the Kiwifruit Regulations was announced in August 2016. The next steps are for the
Kiwifruit Regulations to be formally revised and following publication, the industry can move towards
implementation.
As the changes are implemented the Kiwifruit Book will be updated. Further information on the KISP process
can be found on the KISP website www.kisp.co.nz
New Zealand Kiwifruit Book 2016 - 13
1.2 CURRENT INDUSTRY STRUCTURE
This section focusses on the key organisations (1.2.1) in the kiwifruit industry and its Single Point of Entry (SPE)
structure (1.2.2).
1.2.1 KEY ORGANISATIONS The following key organisations are described in this section:
Kiwifruit New Zealand (KNZ)
Zespri International Limited
New Zealand Kiwifruit Growers Incorporated (NZKGI)
Kiwifruit Vine Health (KVH)
Plant & Food Research (P&FR)
Postharvest Operators
Supply Entity Groups
Kiwifruit New Zealand
The majority of the New Zealand kiwifruit sector is focussed on the export of fresh fruit. The export of New
Zealand kiwifruit is regulated through the Kiwifruit Export Regulations 1999. These regulations permit a single
marketer to export and market the majority of New Zealand grown kiwifruit outside of Australasia. This
position is called the ‘Single Point of Entry’ (SPE). The Kiwifruit Export Regulations are enacted by Kiwifruit New
Zealand (KNZ). KNZ is the kiwifruit industry’s regulator and gives Zespri the mandate to be the vehicle of the
SPE. KNZ also have the mandate to allow other exporters to trade New Zealand grown kiwifruit outside of
Australasia and do so on a case by case basis. This is dependent on the value those exporters can derive for
growers over and above what is achieved by Zespri.
Zespri International Limited
Zespri is technically a limited liability company, owned by past and present New Zealand kiwifruit growers,
which in addition to its role as the single desk marketer also provides logistics services and research and
development management for the kiwifruit industry.
New Zealand Kiwifruit Growers Incorporated
New Zealand kiwifruit growers are represented by an organisation called New Zealand Kiwifruit Growers Incorporated (NZKGI). NZKGI is levy funded and its purpose is to protect the political and commercial interests of New Zealand Kiwifruit Growers. Key roles include but are not limited to: safeguarding the Single Point of Entry; grower well-being and welfare; consulting with growers on industry initiatives; reporting on Zespri performance; driving for greater supply chain efficiencies; driving for the best possible market outcomes; grower advocate with government and stakeholders. The bottom line is that New Zealand Kiwifruit Growers Incorporated aims to increase growers returns.
Kiwifruit Vine Health (KVH)
KVH is a grower-driven, pan-industry, levy funded organisation that was established in 2010 to lead the response to the Psa incursion and since 2012 has been responsible for managing wider biosecurity on behalf of the kiwifruit industry. A key research and development objective for KVH is to jointly lead (with Zespri), a world class research and development programme called the Breeding Programme that continually seeks to identify ways to best manage Psa-V (Anon., 2015 ).
Plant & Food Research
Plant & Food Research is a science company that is a New Zealand government owned Crown Research institute. Approximately 100 of the 900 people employed by Plant & Food Research supply 60% of the kiwifruit industry’s research. Kiwifruit has a broad research programme which covers new cultivar development, supply
New Zealand Kiwifruit Book 2016 - 14
chain and consumer value add. Plant & Food Research have a site in Te Puke that is home to the largest kiwifruit breeding population outside of China.
Postharvest operators
Growers do not supply their fruit directly to Zespri. Growers select a postharvest operator, who can be a co-operative or company, to manage their fruit from harvest. The postharvest operator is or is aligned with a Zespri Registered Supplier, who is paid by Zespri to supply the fruit to the port.
There are approximately 53 packing facilities and 85+ coolstores used in the kiwifruit industry and 18 Zespri Registered Suppliers.
The major postharvest operators of kiwifruit in New Zealand are:
EastPack Limited
Seeka Kiwifruit Industries Limited
Apata Group Limited
DMS Progrowers Limited
Trevelyan’s Pack and Cool Limited
Hume Pack-N-Cool Limited
Opotiki Packing and Coolstorage Limited (OPAC)
Aongatete Coolstores Limited
Auckland Pack and Cool (APAC), Mount Pack and Cool (MPAC)
Many operators also pack and cool avocados.
Supply Entities
There are different forms of a Supply Entity, but typically is that the Supply Entity is a Limited Liability Company (or Trust) that growers contract with to supply their fruit. The Supply Entity then negotiates with an aligned post-harvest facility for the provision of packing, cooling, inventory management, financial management and other services. The Supply Entity can be the party that signs a Supply Agreement with Zespri, though in some instances there is another virtual company in-between.
Also, typically, the grower (being the owner of the fruit at harvest) remains the principal through to the point of ownership transfer at FOBS to Zespri. This means that the Supply Entity (and Supplier if there is another intermediary) acts as an agent for the grower. It could be argued that, therefore, each grower, in effect, is the contracting party with Zespri. However, the significance is that there is a direct relationship from a grower, through their Supply Entity to Zespri via the Supply Agreement.
Examples of Supply Entitity Groups include:
Eastpack Entity Trust
Seeka Grower Council
Trevelyan’s Growers Limited
Apata Suppliers Entity Limited
Aongatete Growers Trust
New Zealand Kiwifruit Book 2016 - 15
1.2.2 SINGLE POINT OF ENTRY “98% of growers, in a referendum conducted in 2015, voted to keep the Single Point of Entry (65% of growers who produced 80% of the exported kiwifruit volume voted)”.
The Single Point of Entry (SPE) structure is the use of one exporter over multiple exporters and Zespri holds the SPE for New Zealand’s kiwifruit industry. This marketing structure held by Zespri is in place as it helps producers deliver scale in the market place. Quality, category management and customer relationships are the essence of the SPE structure in market. What it means is that Zespri can choose a few motivated distributors to serve each market, making kiwifruit a significant priority and an essential part of their business. If many distributors were utilised, kiwifruit would be a small part of their business and their livelihood and profit would not be so dependent on selling kiwifruit. This gives Zespri market power in the key markets and the ability to sell kiwifruit at premium prices. There are other advantages:
Promotional spend in the market that creates market demand.
The integrated supply chain which delivers efficiencies and speed to successfully launch new varieties.
Viable returns to growers in difficult financial times.
An iconic international brand that allows Zespri to differentiate its product; the Zespri brand is a globally recognised brand that symbolises quality, vitality and freshness.
In market presence. Zespri has offshore offices to market and promote its product.
Coordinated innovation.
The largest new cultivar breeding programme in the world.
Maintenance of quality that delivers Zespri a premium price over its competitors.
Confidence for growers to invest in the industry.
Benefits of Scale
All of these advantages are achieved because the SPE structure allows the NZ kiwifruit industry to achieve scale. Scale is identified as the key factor for achieving growth in Horticulture NZ’s Growing a New Future strategy. Horticulture NZ growth target is for horticulture to increase industry revenue to $10 billion by 2020. Today the revenue is a little over $5 billion. Horticulture NZ’s strategy was developed following extensive industry consultation and research. It identified that the most successful horticulture businesses in this country are the ones that bring growers together, with collaborative sharing of knowledge, costs, marketing and research. But the key point in the strategy is to reach this $10 billion target you need scale. With scale comes the ability to invest in research, capturing intellectual property, to develop markets and to develop branding. Through the SPE structure the NZ kiwifruit industry achieves scale.
Benefits from Zespri’s Structure
Zespri is what is called a “hybrid co-operative”. Zespri is a corporate company that has shareholders and independent accountability. The corporate pays returns to growers less sales commission, marketing costs and supply chain costs. Shareholding is voluntary, although restricted to growers, and dividends paid have given good returns to shareholders since the company was formed. One of the biggest advantages however, is the disciplines the industry model imposes on Zespri, which are healthy for the stakeholders within kiwifruit industry. These obligations are set out in the Regulations.
Benefits from Investment
Zespri has been set up with the right to export under the Regulations with the purpose of focusing on the interests of kiwifruit growers. The company earns commission only from kiwifruit and looks after kiwifruit markets and growers as the reason for its existence. Zespri in turn, invests in research and development of new varieties, on orchard practices, and supply chain procedures to improve our competitiveness and ultimately grower returns. Large sums of money are spent each year on innovation, and kiwifruit’s SPE structure provides a valuable mechanism to coordinate the sharing of this information within the industry.
New Zealand Kiwifruit Book 2016 - 16
Benefits from Branded Premium Product
Kiwifruit’s SPE structure has allowed Zespri to grow its market share in our key markets and allowed Zespri to develop the Zespri brand. One result is that Zespri is the largest marketer of kiwifruit in the world. The most important result is that Zespri branded kiwifruit is no longer a commodity product. It is a premium product that earns returns that are higher than its competitors. This is the most important benefit of the SPE to the NZ grower.
Benefits from the Commercialisation of New Varieties
Kiwifruit’s SPE allowed Zespri to commercialise different Gold kiwifruit cultivars in record time developing markets making top returns for growers. As other new varieties are developed kiwifruit’s SPE structure and strong distribution channels will similarly allow for effective and timely commercialisation and market development.
Benefits from Consistent Quality
Another important marketing advantage that comes from kiwifruit’s SPE structure is the delivery of consistent quality to customers. Only an integrated and cohesive industry can achieve this. Customers and consumers alike will pay a high price for quality and they will repurchase that premium product because they know they will get the same eating experience. There is no doubt that consistent quality underpins kiwifruit’s SPE structure.
Benefits from Customer Service
The markets are becoming more sophisticated and customers are putting more pressure on the industry. Zespri deals with large offshore customers that want to deal with a company that has a strong brand and can deliver the quality and quantity retailers are looking for. Customers want a choice and retailers want to keep their shelves stocked 12 months of the year at the best prices. To face these challenges growers need clear communication from the markets so that the market needs can be met. New Zealand’s SPE structure allows these market signals to flow back to growers in an accurate and timely manner.
Benefits from Sustainability
A challenge that New Zealand Kiwifruit Growers face in the international marketplace relates to sustainability of the industry; issues such as responsible employment practices, carbon footprint, food miles, surplus fruit, and strong grower support for environmentally sound practices are some of the important issues to customers. The New Zealand kiwifruit industry must stand as a unified and cohesive industry to face these challenges and maintain the high quality standards that earn the premiums in the market and avoid New Zealand kiwifruit from becoming a commodity product. Kiwifruit’s SPE structure allows Zespri to effectively respond to these challenges.
Benefits from Competitive Return
Kiwifruit’s SPE provides essential advantages in challenging years when grower returns are under extreme
pressure. It is not hard to imagine what returns would be like if other competing marketers had all marketed
the increased volume of fruit to the highest paying markets. The bottom line is that to retain the SPE structure
Zespri need to deliver competitive returns to the grower to maintain their support for kiwifruit’s SPE.
New Zealand Kiwifruit Book 2016 - 17
1.3 OPERATING ENVIRONMENT
This section gives an overview of the environment the kiwifruit industry operates in covering the following
topics:
Competitive position globally
Tariffs
Other market access barriers
Impact of exchange rates
Social and cultural factors
Biosecurity
Environmental sustainability
1.3.1 COMPETITIVE POSITION GLOBALLY
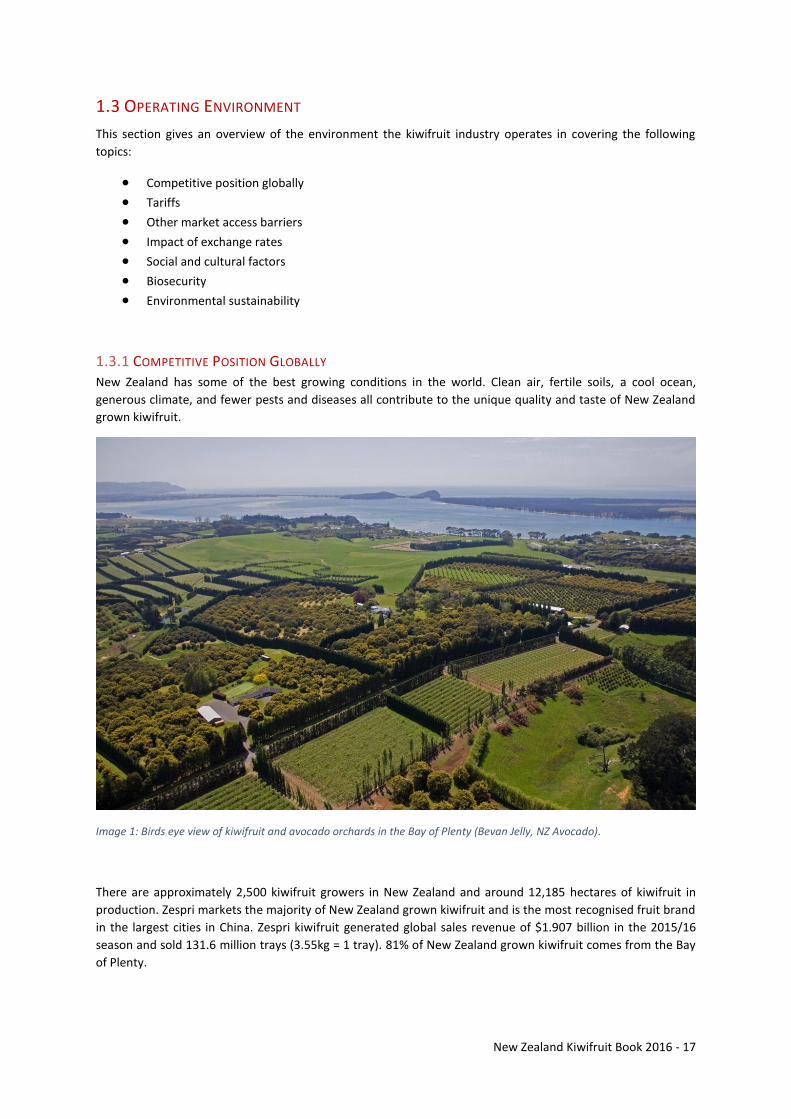
New Zealand has some of the best growing conditions in the world. Clean air, fertile soils, a cool ocean,
generous climate, and fewer pests and diseases all contribute to the unique quality and taste of New Zealand
grown kiwifruit.
Image 1: Birds eye view of kiwifruit and avocado orchards in the Bay of Plenty (Bevan Jelly, NZ Avocado).
There are approximately 2,500 kiwifruit growers in New Zealand and around 12,185 hectares of kiwifruit in
production. Zespri markets the majority of New Zealand grown kiwifruit and is the most recognised fruit brand
in the largest cities in China. Zespri kiwifruit generated global sales revenue of $1.907 billion in the 2015/16
season and sold 131.6 million trays (3.55kg = 1 tray). 81% of New Zealand grown kiwifruit comes from the Bay
of Plenty.
New Zealand Kiwifruit Book 2016 - 18
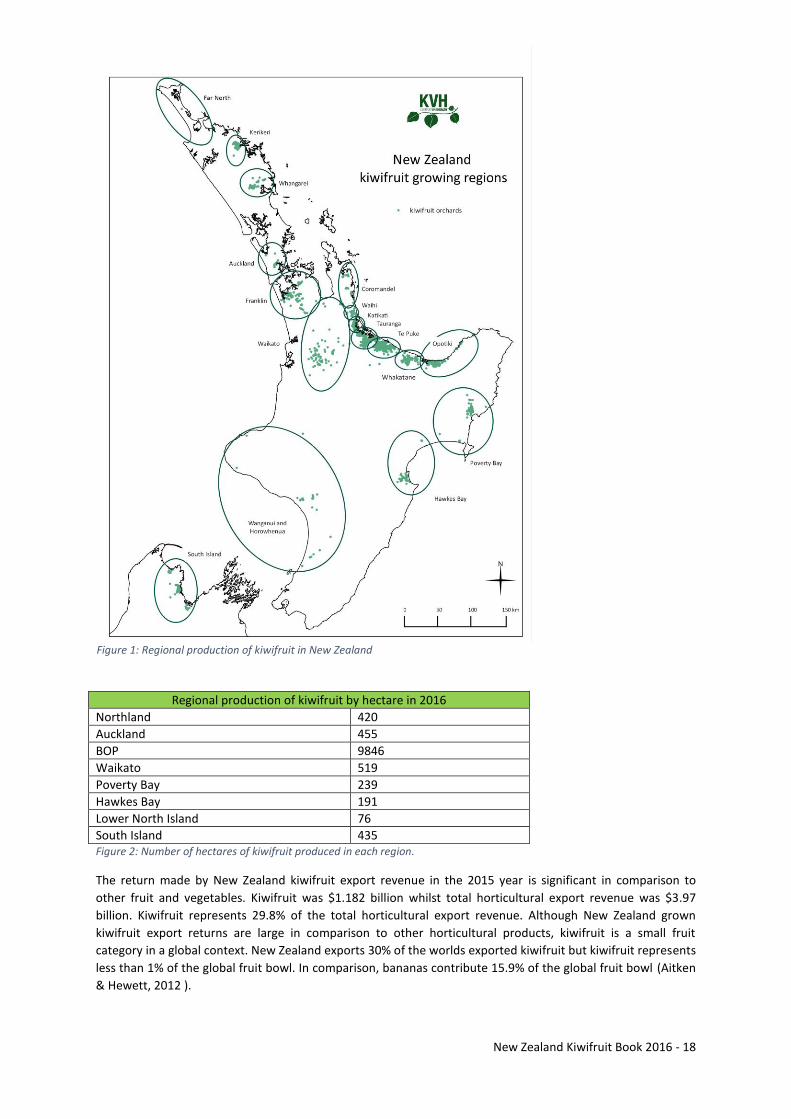
Regional production of kiwifruit by hectare in 2016
Northland 420
Auckland 455
BOP 9846
Waikato 519
Poverty Bay 239
Hawkes Bay 191
Lower North Island 76
South Island 435 Figure 2: Number of hectares of kiwifruit produced in each region.
The return made by New Zealand kiwifruit export revenue in the 2015 year is significant in comparison to
other fruit and vegetables. Kiwifruit was $1.182 billion whilst total horticultural export revenue was $3.97
billion. Kiwifruit represents 29.8% of the total horticultural export revenue. Although New Zealand grown
kiwifruit export returns are large in comparison to other horticultural products, kiwifruit is a small fruit
category in a global context. New Zealand exports 30% of the worlds exported kiwifruit but kiwifruit represents
less than 1% of the global fruit bowl. In comparison, bananas contribute 15.9% of the global fruit bowl (Aitken
& Hewett, 2012 ).
Figure 1: Regional production of kiwifruit in New Zealand
New Zealand Kiwifruit Book 2016 - 19
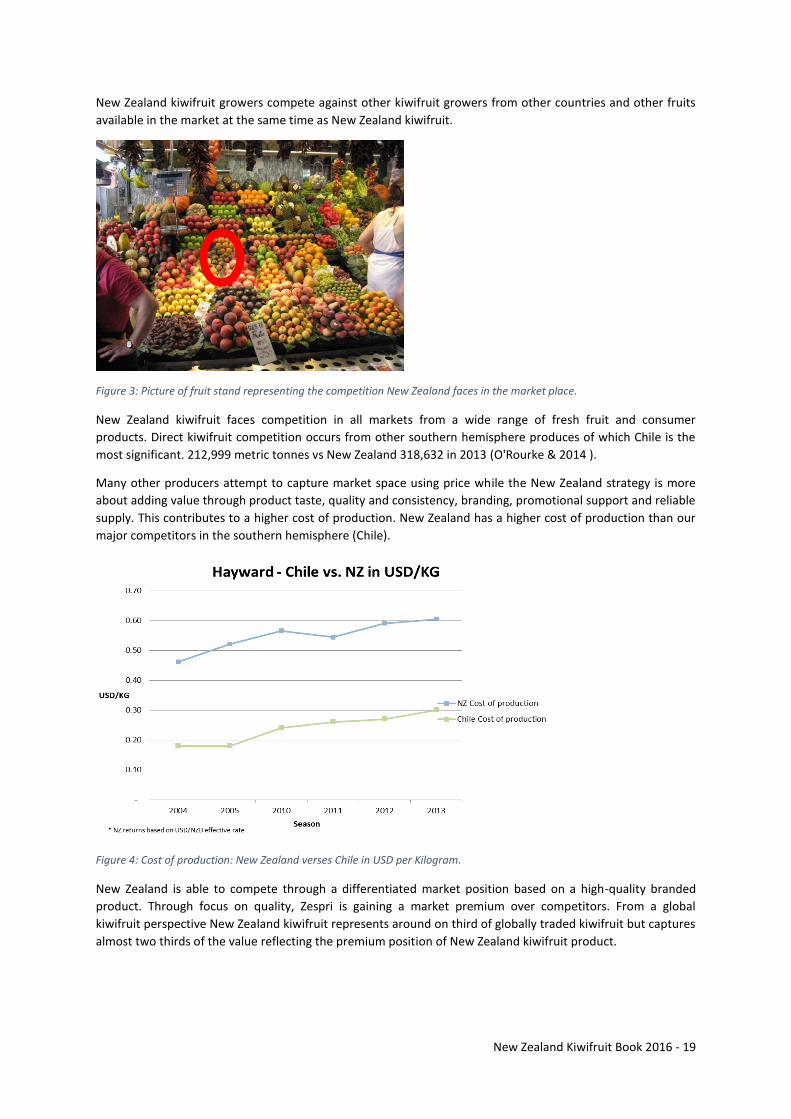
New Zealand kiwifruit growers compete against other kiwifruit growers from other countries and other fruits
available in the market at the same time as New Zealand kiwifruit.
Figure 3: Picture of fruit stand representing the competition New Zealand faces in the market place.
New Zealand kiwifruit faces competition in all markets from a wide range of fresh fruit and consumer
products. Direct kiwifruit competition occurs from other southern hemisphere produces of which Chile is the
most significant. 212,999 metric tonnes vs New Zealand 318,632 in 2013 (O'Rourke & 2014 ).
Many other producers attempt to capture market space using price while the New Zealand strategy is more
about adding value through product taste, quality and consistency, branding, promotional support and reliable
supply. This contributes to a higher cost of production. New Zealand has a higher cost of production than our
major competitors in the southern hemisphere (Chile).
Figure 4: Cost of production: New Zealand verses Chile in USD per Kilogram.
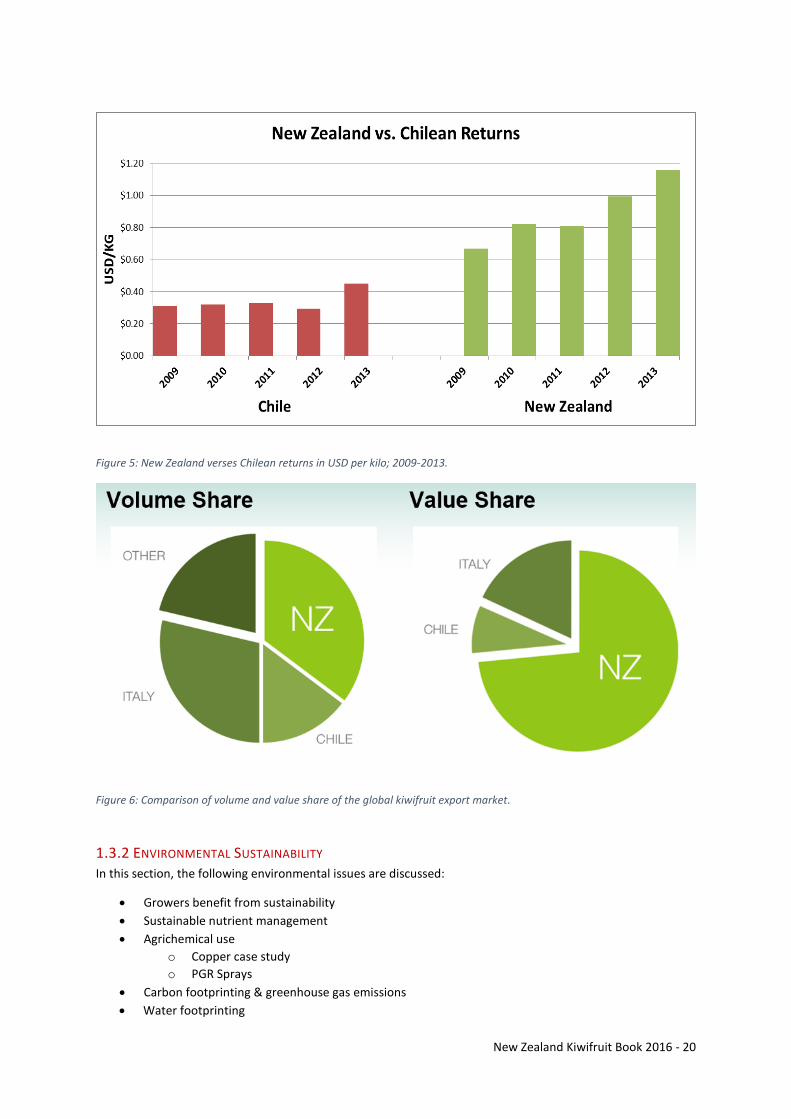
New Zealand is able to compete through a differentiated market position based on a high-quality branded
product. Through focus on quality, Zespri is gaining a market premium over competitors. From a global
kiwifruit perspective New Zealand kiwifruit represents around on third of globally traded kiwifruit but captures
almost two thirds of the value reflecting the premium position of New Zealand kiwifruit product.
New Zealand Kiwifruit Book 2016 - 20
Figure 5: New Zealand verses Chilean returns in USD per kilo; 2009-2013.
Figure 6: Comparison of volume and value share of the global kiwifruit export market.
1.3.2 ENVIRONMENTAL SUSTAINABILITY In this section, the following environmental issues are discussed:
Growers benefit from sustainability
Sustainable nutrient management
Agrichemical use
o Copper case study
o PGR Sprays
Carbon footprinting & greenhouse gas emissions
Water footprinting
New Zealand Kiwifruit Book 2016 - 21
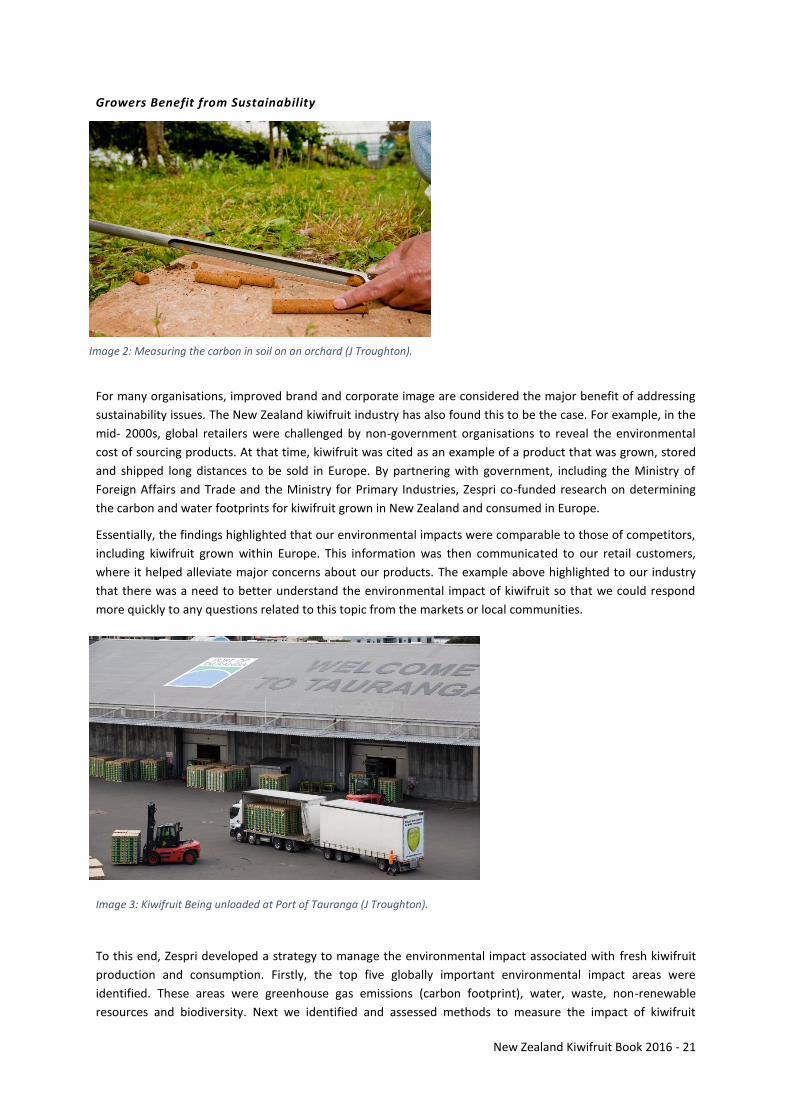
Growers Benefit from Sustainability
For many organisations, improved brand and corporate image are considered the major benefit of addressing
sustainability issues. The New Zealand kiwifruit industry has also found this to be the case. For example, in the
mid- 2000s, global retailers were challenged by non-government organisations to reveal the environmental
cost of sourcing products. At that time, kiwifruit was cited as an example of a product that was grown, stored
and shipped long distances to be sold in Europe. By partnering with government, including the Ministry of
Foreign Affairs and Trade and the Ministry for Primary Industries, Zespri co-funded research on determining
the carbon and water footprints for kiwifruit grown in New Zealand and consumed in Europe.
Essentially, the findings highlighted that our environmental impacts were comparable to those of competitors,
including kiwifruit grown within Europe. This information was then communicated to our retail customers,
where it helped alleviate major concerns about our products. The example above highlighted to our industry
that there was a need to better understand the environmental impact of kiwifruit so that we could respond
more quickly to any questions related to this topic from the markets or local communities.
To this end, Zespri developed a strategy to manage the environmental impact associated with fresh kiwifruit
production and consumption. Firstly, the top five globally important environmental impact areas were
identified. These areas were greenhouse gas emissions (carbon footprint), water, waste, non-renewable
resources and biodiversity. Next we identified and assessed methods to measure the impact of kiwifruit
Image 2: Measuring the carbon in soil on an orchard (J Troughton).
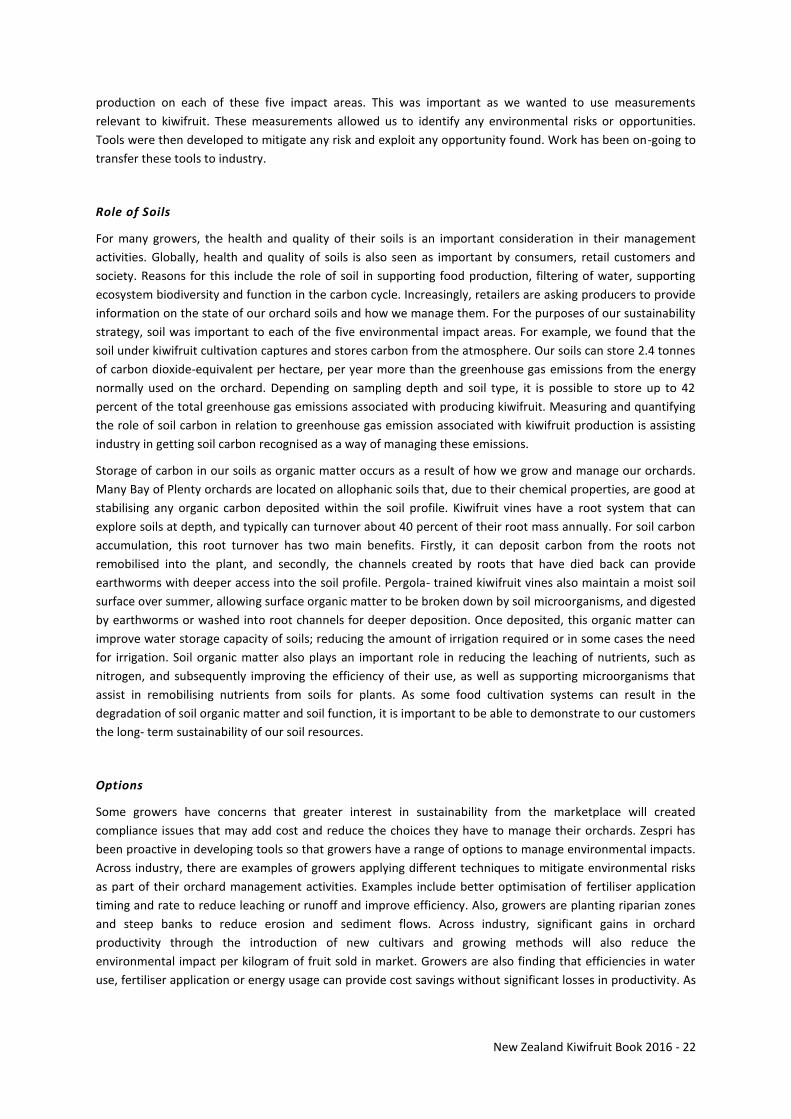
Image 3: Kiwifruit Being unloaded at Port of Tauranga (J Troughton).
New Zealand Kiwifruit Book 2016 - 22
production on each of these five impact areas. This was important as we wanted to use measurements
relevant to kiwifruit. These measurements allowed us to identify any environmental risks or opportunities.
Tools were then developed to mitigate any risk and exploit any opportunity found. Work has been on-going to
transfer these tools to industry.
Role of Soils
For many growers, the health and quality of their soils is an important consideration in their management
activities. Globally, health and quality of soils is also seen as important by consumers, retail customers and
society. Reasons for this include the role of soil in supporting food production, filtering of water, supporting
ecosystem biodiversity and function in the carbon cycle. Increasingly, retailers are asking producers to provide
information on the state of our orchard soils and how we manage them. For the purposes of our sustainability
strategy, soil was important to each of the five environmental impact areas. For example, we found that the
soil under kiwifruit cultivation captures and stores carbon from the atmosphere. Our soils can store 2.4 tonnes
of carbon dioxide-equivalent per hectare, per year more than the greenhouse gas emissions from the energy
normally used on the orchard. Depending on sampling depth and soil type, it is possible to store up to 42
percent of the total greenhouse gas emissions associated with producing kiwifruit. Measuring and quantifying
the role of soil carbon in relation to greenhouse gas emission associated with kiwifruit production is assisting
industry in getting soil carbon recognised as a way of managing these emissions.
Storage of carbon in our soils as organic matter occurs as a result of how we grow and manage our orchards.
Many Bay of Plenty orchards are located on allophanic soils that, due to their chemical properties, are good at
stabilising any organic carbon deposited within the soil profile. Kiwifruit vines have a root system that can
explore soils at depth, and typically can turnover about 40 percent of their root mass annually. For soil carbon
accumulation, this root turnover has two main benefits. Firstly, it can deposit carbon from the roots not
remobilised into the plant, and secondly, the channels created by roots that have died back can provide
earthworms with deeper access into the soil profile. Pergola- trained kiwifruit vines also maintain a moist soil
surface over summer, allowing surface organic matter to be broken down by soil microorganisms, and digested
by earthworms or washed into root channels for deeper deposition. Once deposited, this organic matter can
improve water storage capacity of soils; reducing the amount of irrigation required or in some cases the need
for irrigation. Soil organic matter also plays an important role in reducing the leaching of nutrients, such as
nitrogen, and subsequently improving the efficiency of their use, as well as supporting microorganisms that
assist in remobilising nutrients from soils for plants. As some food cultivation systems can result in the
degradation of soil organic matter and soil function, it is important to be able to demonstrate to our customers
the long- term sustainability of our soil resources.
Options
Some growers have concerns that greater interest in sustainability from the marketplace will created
compliance issues that may add cost and reduce the choices they have to manage their orchards. Zespri has
been proactive in developing tools so that growers have a range of options to manage environmental impacts.
Across industry, there are examples of growers applying different techniques to mitigate environmental risks
as part of their orchard management activities. Examples include better optimisation of fertiliser application
timing and rate to reduce leaching or runoff and improve efficiency. Also, growers are planting riparian zones
and steep banks to reduce erosion and sediment flows. Across industry, significant gains in orchard
productivity through the introduction of new cultivars and growing methods will also reduce the
environmental impact per kilogram of fruit sold in market. Growers are also finding that efficiencies in water
use, fertiliser application or energy usage can provide cost savings without significant losses in productivity. As
New Zealand Kiwifruit Book 2016 - 23
New Zealand kiwifruit growers share their knowledge and experiences on techniques to reduce environmental
impacts, the options available to all growers will continue to increase.
Environmental Impact Measurements
Prior to the introduction of Psa, Zespri worked with a range of public and private research organisations to
quantify the environmental impact for kiwifruit production. At that time, the carbon footprint for Hayward
kiwifruit grown in New Zealand and consumed in Europe was 1.61kg CO2-eq/kg of fruit. About 44 percent of
the greenhouse gas emissions were associated with shipping. The water footprint was calculated to be 458L
H2O/kg of fruit for the same fruit grown. However, when we consider the water falling on an orchard during a
year versus the amount required by the crop, we find that the environment gains by 150L H2O/ kg of fruit. The
amount of non-renewable fossil fuel required for this fruit was 0.3L/ kg fruit. Similarly, the amount of waste
kiwifruit produced in this situation was estimated to be 0.19kg waste kiwifruit per kg of kiwifruit consumed.
With regard to waste fruit, it is estimated that about 0.35kg waste fruit per kg of fruit consumed is typical for
many export fruit crops.
For biodiversity, it has been estimated that approximately 6.6% of the land title associated with a kiwifruit
orchard provides ecological refuge. In summary, growers have an increasing range of tools to assist in reducing
reputational risks to the Zespri brand and the industry as a whole in relation to the environmental impact of
New Zealand kiwifruit production and consumption.
(Mowat, 2015)
1.3.3 SUSTAINABLE NUTRIENT MANAGEMENT Declining freshwater quality and availability has become a global concern. So much so that some of Zespri
International’s customers like Walmart and Marks & Spencer are sensitive to water-related issues and have
requested information on how water is used in the kiwifruit supply chain. Although by world standards, New
Zealand has clean and abundant freshwater, freshwater quality in some of New Zealand’s rural and urban
areas has degraded and is coming under increased pressure as land use intensifies. A major reason for this
degradation is the loss of nutrients (e.g. from urine and fertilisers) from farms into waterways.
What is Sustainable Nutrient Management?
When the term ‘sustainable nutrient management’ is used, it is often in relation to maintaining or improving
freshwater quality. The most prevalent problem is eutrophication which is the nutrient enrichment of
freshwater bodies leading to the growth of unwanted aquatic plants like algae and rooted plants. High levels of
nutrients can also be harmful to animals including humans. Agriculture is a significant contributor to this
process, particularly in New Zealand, where this sector dominates the landscape.
Nitrogen (N) and Phosphorus (P) are presently the main nutrients of concern and must be carefully managed
as the input of these into a water body can significantly affect its quality. Consequently, there is growing social
and regulatory pressure to mitigate the impacts of these. Understanding the N and P cycles, and how these
can move from land and into water bodies is key to managing these nutrients effectively.
Leaching- What is it and how does it occur?
Leaching refers to the loss of nutrients and other chemicals through the soil with water as it drains through.
Climate, soil characteristics, irrigation, and fertiliser practices are the main factors that contribute to leaching
from kiwifruit orchards. For example an orchard with a free draining soil where soluble Nitrogen is applied
prior to a major drainage event (e.g. heavy downpour) will leach a significant amount of N.
New Zealand Kiwifruit Book 2016 - 24
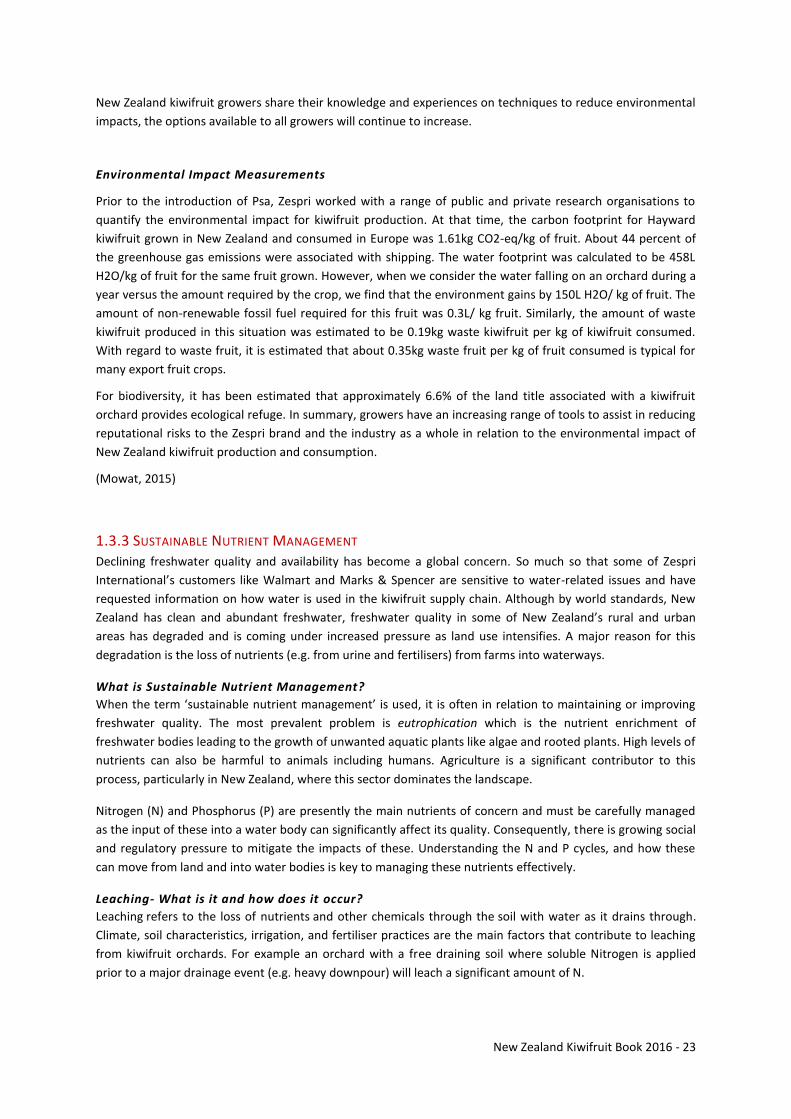
Nitrogen (N) is the main nutrient risk for kiwifruit production on freshwater quality. Simply put, N applied to or
already present in the soil is converted to nitrates (NO3-), which are readily leached with water as it drains
down through the soil profile. Although N is usually available in the soil for plant uptake initially in the form of
ammonium, which leaches much less, this is converted to nitrate through the microbial process of nitrification
(see Figure 7).
Figure 7- Soil nitrogen cycle for a plant-based system.
How much N is applied to kiwifruit orchards and how much is leached?
Typically kiwifruit orchardists apply 100-150kg N/ha/yr (Nitrogen/per hectare/per year). On conventional
orchards, soluble fertilisers like calcium ammonium nitrate (CAN; 27% N) are commonly applied while on
organic orchards, relatively insoluble inputs like composts are often used, at 5-10 tonnes/ha. The associated N
losses from kiwifruit orchards are modelled to be typically less than 20kg NO3-N/ha/yr on average (for
orchards in the Bay of Plenty where most orchards are located). Such losses are low relative to those from
other land uses. For example, losses from some Dairy farms in NZ have been reported to be as high as 80kg
NO3-N/ha/yr. Only one study of note has measured N losses from kiwifruit orchards however the results were
highly variable. Further direct measurement is being undertaken to clarify N losses from kiwifruit orchards.
As far as ecological and human health concerns are framed, it’s the concentration of nitrate-nitrogen (mg N/L,
or parts per million) in water that is important, not the loading (kg N/ha/yr). High concentrations of nitrate in
drinking water can pose a health risk for certain people, particularly bottle-fed babies who drink formula made
with the water. For this reason, the Ministry of Health has a Maximum Acceptable Level (MAV) of 11.3 mg/L
(or parts per million) for nitrate-nitrogen. Measured and modelled values for kiwifruit on average have been
found to be below this.
Why model and not measure nutrient losses?
Directly measuring nutrient losses from farms is not practical and is expensive. Therefore, models are often
used to estimate losses although the values obtained are likely to be less accurate. In kiwifruit, two models
called OVERSEER™ and SPASMO have been used as these have dedicated kiwifruit components. OVERSEER™ is
New Zealand Kiwifruit Book 2016 - 25
the most widely used model in NZ agriculture and is being used to develop nutrient budgets i.e. reports
showing the amounts of nutrients added and lost from farms. In some places it is mandatory for OVERSEER™
to be used in order to obtain consent to farm. For more information, visit http://overseer.org.nz
Phosphorus
Phosphorus is the other main nutrient of concern for freshwater quality. Like N, too much P in aquatic
environments can lead to excessive plant growth, algal blooms and the depletion of oxygen dissolved in the
water. But unlike N, the main pathway for P entering our waterways is via run-off, unless the soils are coarse
pumice or sandy in which case leaching could occur. Generally, P losses from kiwifruit orchards are relatively
flat and so run off is low. Also, features like shelter-belts impede run off.
Recommended practices for sustainable nutrient management in k iwifruit
In general terms, mitigation of nutrient losses involves applying the right fertiliser, in the right amounts at the
right time, and in the right place. Some options for minimising nutrient losses in a kiwifruit orchard are
presented below. Growers should consider how these might affect their economic and production objectives.
Plant vegetation around waterways
Plant buffer zones adjacent to waterways act as a last line of defence and will filter nutrients as well as reduce
erosion and enhance biodiversity. These zones are commonly referred to as riparian zones.
Minimise bare ground
Plants present in orchards will take up N that would otherwise be leached. Furthermore, having clover present
instead of bare ground is beneficial as it will add N to the orchard system because the clover assimilates N
from the atmosphere (through the process of nitrogen fixation).
Don’t apply when the leaching risk is high
Apply N as late as practical in the growing season, past the wetter winter months. Do not apply when the soil is
waterlogged. Applying too late after the plant requires it will impact on production and this N will be prone to
leaching if the plant is not taking it up.
Apply only when the plant needs it
First application of the season should be as close to bud break as practical. Applying well before in wetter
months, does not advantage N uptake but increases the risk of leaching.
Don’t apply too much
Previous research has indicated kiwifruit vines typically required in the vicinity of 150kg N/ha/yr. Fertiliser
inputs should match this, and consider the process of mineralisation which can supply from an estimated 50 kg
N/ha/yr towards the 150 requirement. Applying higher amounts of N may not necessarily increase production.
Split applications
Some of the N applied in a single application may not be taken up by the plant. Therefore apply around 2/3rd
prior to budbreak and the rest in late spring/early summer, prior to fruitset.
Consider less soluble forms of N
Organic fertilisers for example are inherently less soluble and N leaching risk is less. However, they may not
deliver sufficient available nutrients to meet fruit production goals. Less soluble forms of synthetic fertiliser are
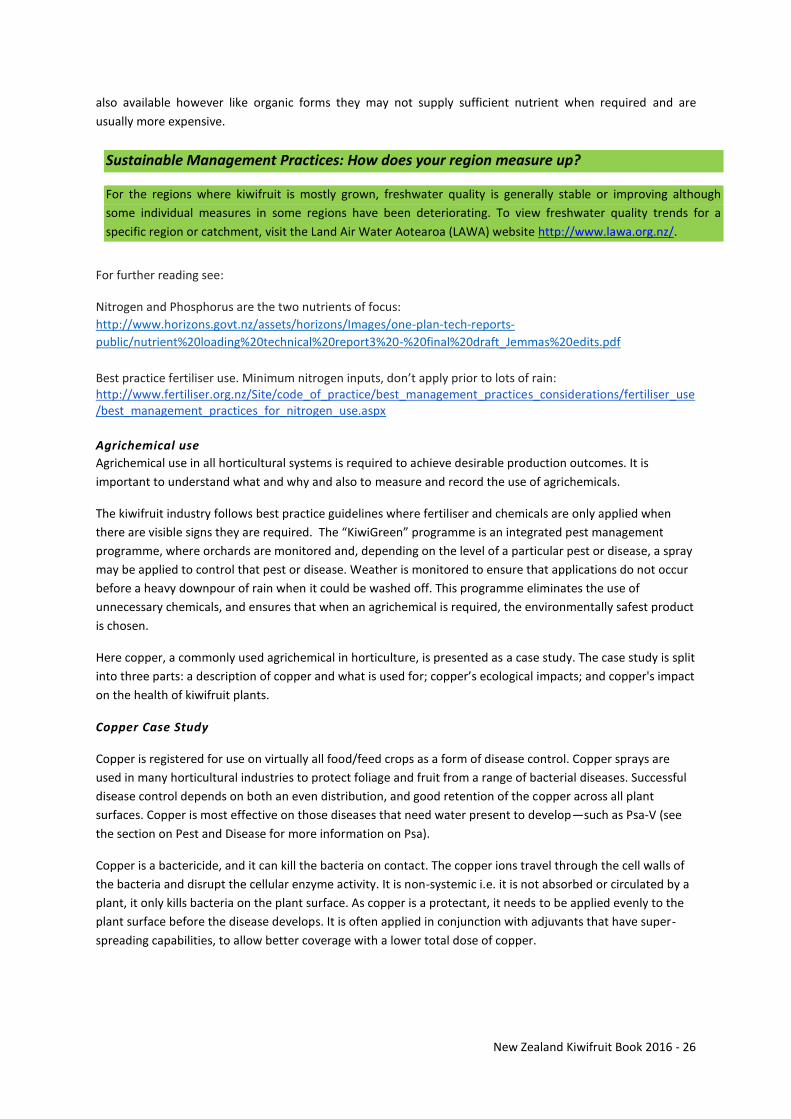
New Zealand Kiwifruit Book 2016 - 26
also available however like organic forms they may not supply sufficient nutrient when required and are
usually more expensive.
For further reading see:
Nitrogen and Phosphorus are the two nutrients of focus:
http://www.horizons.govt.nz/assets/horizons/Images/one-plan-tech-reports-
public/nutrient%20loading%20technical%20report3%20-%20final%20draft_Jemmas%20edits.pdf
Best practice fertiliser use. Minimum nitrogen inputs, don’t apply prior to lots of rain: http://www.fertiliser.org.nz/Site/code_of_practice/best_management_practices_considerations/fertiliser_use/best_management_practices_for_nitrogen_use.aspx
Agrichemical use
Agrichemical use in all horticultural systems is required to achieve desirable production outcomes. It is
important to understand what and why and also to measure and record the use of agrichemicals.
The kiwifruit industry follows best practice guidelines where fertiliser and chemicals are only applied when
there are visible signs they are required. The “KiwiGreen” programme is an integrated pest management
programme, where orchards are monitored and, depending on the level of a particular pest or disease, a spray
may be applied to control that pest or disease. Weather is monitored to ensure that applications do not occur
before a heavy downpour of rain when it could be washed off. This programme eliminates the use of
unnecessary chemicals, and ensures that when an agrichemical is required, the environmentally safest product
is chosen.
Here copper, a commonly used agrichemical in horticulture, is presented as a case study. The case study is split
into three parts: a description of copper and what is used for; copper’s ecological impacts; and copper's impact
on the health of kiwifruit plants.
Copper Case Study
Copper is registered for use on virtually all food/feed crops as a form of disease control. Copper sprays are
used in many horticultural industries to protect foliage and fruit from a range of bacterial diseases. Successful
disease control depends on both an even distribution, and good retention of the copper across all plant
surfaces. Copper is most effective on those diseases that need water present to develop—such as Psa-V (see
the section on Pest and Disease for more information on Psa).
Copper is a bactericide, and it can kill the bacteria on contact. The copper ions travel through the cell walls of
the bacteria and disrupt the cellular enzyme activity. It is non-systemic i.e. it is not absorbed or circulated by a
plant, it only kills bacteria on the plant surface. As copper is a protectant, it needs to be applied evenly to the
plant surface before the disease develops. It is often applied in conjunction with adjuvants that have super-
spreading capabilities, to allow better coverage with a lower total dose of copper.
Sustainable Management Practices: How does your region measure up?
For the regions where kiwifruit is mostly grown, freshwater quality is generally stable or improving although
some individual measures in some regions have been deteriorating. To view freshwater quality trends for a
specific region or catchment, visit the Land Air Water Aotearoa (LAWA) website http://www.lawa.org.nz/.
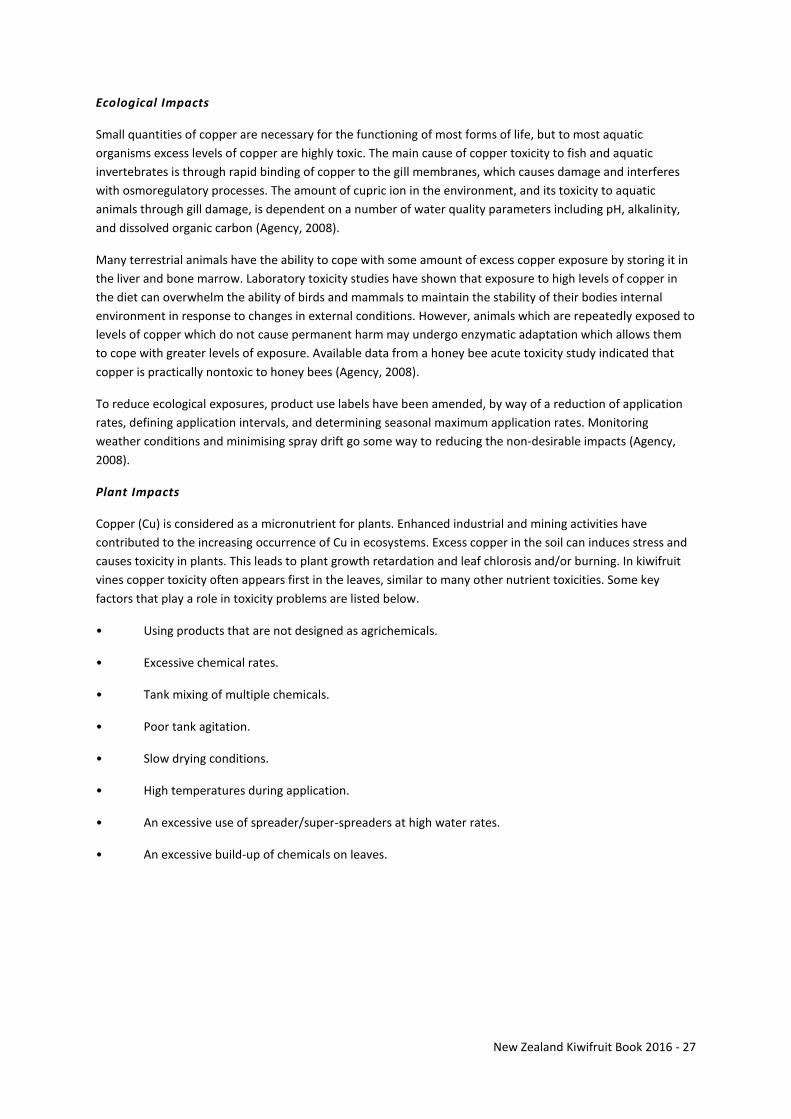
New Zealand Kiwifruit Book 2016 - 27
Ecological Impacts
Small quantities of copper are necessary for the functioning of most forms of life, but to most aquatic
organisms excess levels of copper are highly toxic. The main cause of copper toxicity to fish and aquatic
invertebrates is through rapid binding of copper to the gill membranes, which causes damage and interferes
with osmoregulatory processes. The amount of cupric ion in the environment, and its toxicity to aquatic
animals through gill damage, is dependent on a number of water quality parameters including pH, alkalinity,
and dissolved organic carbon (Agency, 2008).
Many terrestrial animals have the ability to cope with some amount of excess copper exposure by storing it in
the liver and bone marrow. Laboratory toxicity studies have shown that exposure to high levels of copper in
the diet can overwhelm the ability of birds and mammals to maintain the stability of their bodies internal
environment in response to changes in external conditions. However, animals which are repeatedly exposed to
levels of copper which do not cause permanent harm may undergo enzymatic adaptation which allows them
to cope with greater levels of exposure. Available data from a honey bee acute toxicity study indicated that
copper is practically nontoxic to honey bees (Agency, 2008).
To reduce ecological exposures, product use labels have been amended, by way of a reduction of application
rates, defining application intervals, and determining seasonal maximum application rates. Monitoring
weather conditions and minimising spray drift go some way to reducing the non-desirable impacts (Agency,
2008).
Plant Impacts
Copper (Cu) is considered as a micronutrient for plants. Enhanced industrial and mining activities have
contributed to the increasing occurrence of Cu in ecosystems. Excess copper in the soil can induces stress and
causes toxicity in plants. This leads to plant growth retardation and leaf chlorosis and/or burning. In kiwifruit
vines copper toxicity often appears first in the leaves, similar to many other nutrient toxicities. Some key
factors that play a role in toxicity problems are listed below.
• Using products that are not designed as agrichemicals.
• Excessive chemical rates.
• Tank mixing of multiple chemicals.
• Poor tank agitation.
• Slow drying conditions.
• High temperatures during application.
• An excessive use of spreader/super-spreaders at high water rates.
• An excessive build-up of chemicals on leaves.
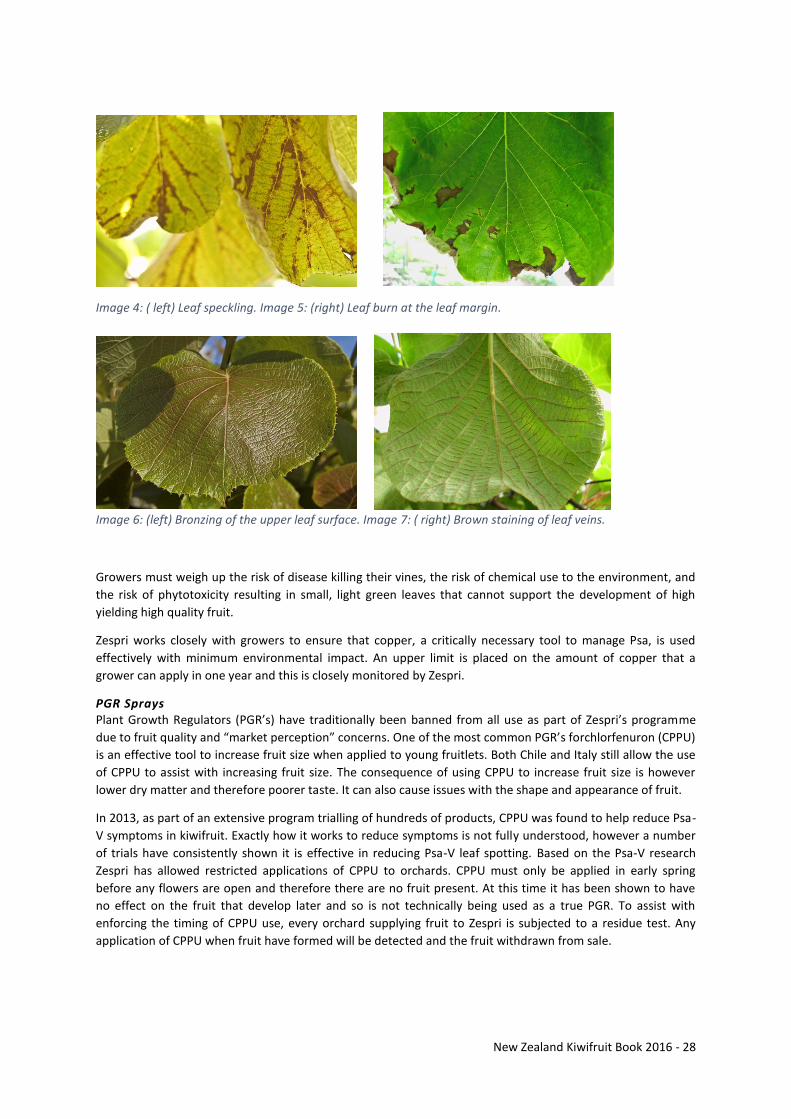
New Zealand Kiwifruit Book 2016 - 28
Image 4: ( left) Leaf speckling. Image 5: (right) Leaf burn at the leaf margin.
Image 6: (left) Bronzing of the upper leaf surface. Image 7: ( right) Brown staining of leaf veins.
Growers must weigh up the risk of disease killing their vines, the risk of chemical use to the environment, and
the risk of phytotoxicity resulting in small, light green leaves that cannot support the development of high
yielding high quality fruit.
Zespri works closely with growers to ensure that copper, a critically necessary tool to manage Psa, is used
effectively with minimum environmental impact. An upper limit is placed on the amount of copper that a
grower can apply in one year and this is closely monitored by Zespri.
PGR Sprays Plant Growth Regulators (PGR’s) have traditionally been banned from all use as part of Zespri’s programme
due to fruit quality and “market perception” concerns. One of the most common PGR’s forchlorfenuron (CPPU)
is an effective tool to increase fruit size when applied to young fruitlets. Both Chile and Italy still allow the use
of CPPU to assist with increasing fruit size. The consequence of using CPPU to increase fruit size is however
lower dry matter and therefore poorer taste. It can also cause issues with the shape and appearance of fruit.
In 2013, as part of an extensive program trialling of hundreds of products, CPPU was found to help reduce Psa-
V symptoms in kiwifruit. Exactly how it works to reduce symptoms is not fully understood, however a number
of trials have consistently shown it is effective in reducing Psa-V leaf spotting. Based on the Psa-V research
Zespri has allowed restricted applications of CPPU to orchards. CPPU must only be applied in early spring
before any flowers are open and therefore there are no fruit present. At this time it has been shown to have
no effect on the fruit that develop later and so is not technically being used as a true PGR. To assist with
enforcing the timing of CPPU use, every orchard supplying fruit to Zespri is subjected to a residue test. Any
application of CPPU when fruit have formed will be detected and the fruit withdrawn from sale.
New Zealand Kiwifruit Book 2016 - 29
Bactericides
Following the outbreak of the kiwifruit bacterial infection Psa-V, a number of products were tested for their
effectiveness in controlling the bacteria and some are now registered with ACVM to control Psa-V in kiwifruit.
An effective compound found was the bactericide Streptomycin. Streptomycin has a history of being used to
control fire blight in the apple industry and as such was already approved for use in Horticulture in New
Zealand in the form of a horticultural spray called KeyStrepto. The kiwifruit industry undertakes a
comprehensive resistance management programme for the allowed Psa-V control products, and bacterial
resistance was identified for streptomycin in April 2015. In response to market and customer feedback and
also as part of a strategy to deal with antimicrobial resistance, streptomycin was removed from the allowed list
of Psa-V control products for the 2016-17 season.
A second bactericide Kasugamycin (which has been used overseas in horticulture) has also been found to be
highly effective. The primary advantage of Kasugamycin is that it has no human health or animal application
and therefore any potential consequence of resistance developing from its use is relatively minor.
With food safety being the number one priority of Zespri, extensive resistance monitoring and residue testing
programmes along with strict application procedures are in place to ensure that no trace of Streptomycin or
Kasugamycin would ever be found in kiwifruit. The testing and procedures also ensured that no traces made
their way via bees used for pollination into honey.
Organic Kiwifruit
Zespri Organic kiwifruit is grown to the strictest organic standards and is certified by Bio-Gro, New Zealand’s
organic protocol organisation. Consumers are becoming increasingly concerned about how their food is
produced and the associated impacts of getting fruit to market. Some consumers look for options that are
more environmentally friendly. Global demand for organic produce continues to grow strongly with growth
rates ranging from 8 to 12 percent per annum based on the traditional markets of Europe and North America.
There are 537 hectares of organic kiwifruit grown in New Zealand as at July 2016. Organically grown kiwifruit
generally has lower average yields than conventionally grown kiwifruit. Zespri aims to sell organic kiwifruit at a
premium to non-organically grown kiwifruit. The majority of the fruit produced by organic growers is sent to
Europe and North America. Organic demand is emerging in Asia and is aligned to the trend toward safe,
healthy food – yet still, this market remains a small niche.
A study undertaken by The Agriculture Research Group on Sustainability (ARGOS) indicates that the
environment of kiwifruit orchards is good regardless of whether they are organic or conventional, but that
there are some differences between organic and conventional systems that could affect fruit production and
quality.
Carbon Footprinting
“Carbon footprint is the overall amount of greenhouse gas emissions, consisting primarily of carbon dioxide,
associated with an organisation, event or production. It is one of the most common measures of the effect of
an individual, community, industry, or country on the environment. An increase in greenhouse gas emissions,
and therefore in carbon footprint, is the primary event associated with climate change that has led to global
warming”(Source:http://www.livestrong.com/article/183436-the-importance-of-reducing-a-carbon-footprint/)
Some businesses are interested in carbon footprinting as it allows them to identify efficiencies and in doing so
save money. Globally the aim is to reduce greenhouse gasses.
New Zealand Kiwifruit Book 2016 - 30
Check the links below;
http://www.landcareresearch.co.nz/science/living/sustainable-business/carbon-footprinting/zespri
Water Footprinting
The water footprint is an indicator of freshwater use that looks at both direct and indirect water use of a
consumer or producer. The water footprint of an individual, community or business is defined as the total
volume of freshwater used to produce the goods and services consumed by the individual or community or
produced by the business. Water use is measured in terms of water volumes consumed (evaporated or
incorporated into a product) and/or polluted per unit of time. A water footprint can be calculated for a
particular product, for any well-defined group of consumers (for example, an individual, family, village, city,
province, state or nation) or producers (for example, a public organization, private enterprise or economic
sector). The water footprint is a geographically explicit indicator, showing not only volumes of water use and
pollution, but also the locations (Source: http://www.waterfootprint.org).
This is becoming just as important as greenhouse gas emissions and could become even more important in the
future as we don’t have an infinite supply of water and the world is fast using it up. This is not so much of an
issue in New Zealand yet but it is for our customers who are aware of this issue and sensitive to it.
http://www.landcareresearch.co.nz/science/living/sustainable-business/carbon-footprinting/water-
footprinting
http://www.scoop.co.nz/stories/BU1107/S00014/zespri-quantifies-kiwifruit-water-footprint.htm
https://www.zespri.com/companyinformation/newsroom/kiwifruit-water
http://www.radionz.co.nz/news/national/78946/single-kiwifruit-needs-42-litres-of-water,-study-shows
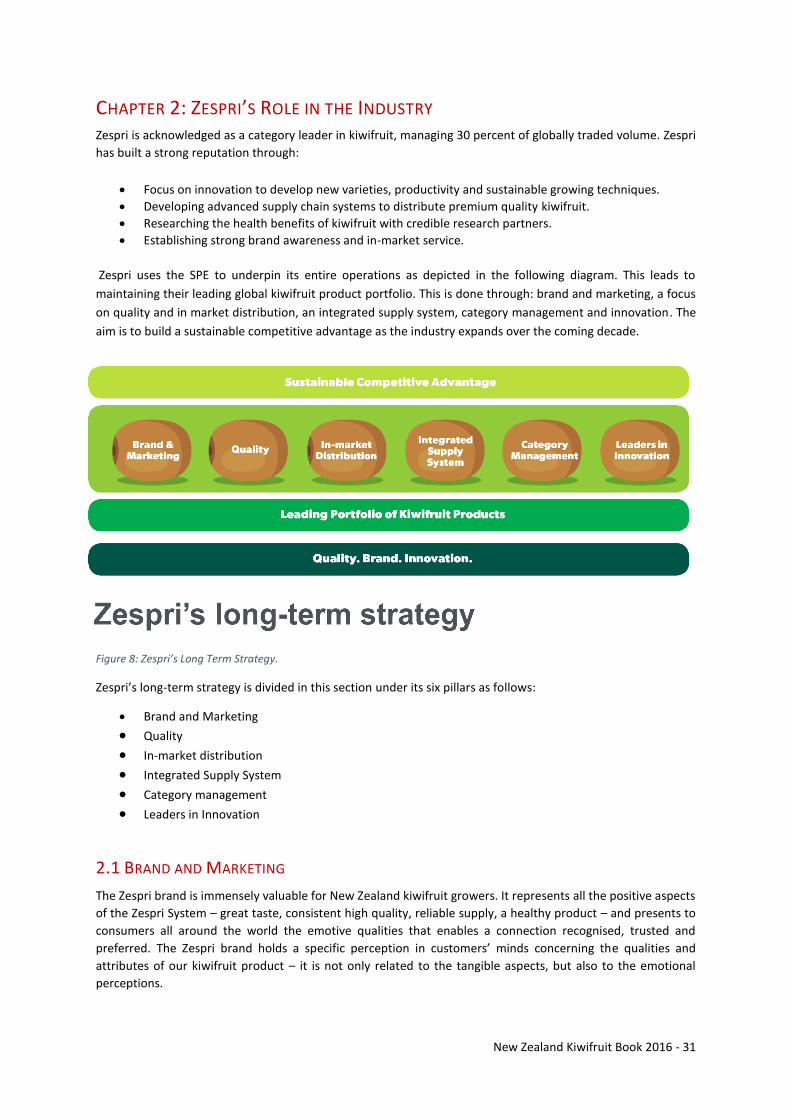
New Zealand Kiwifruit Book 2016 - 31
CHAPTER 2: ZESPRI’S ROLE IN THE INDUSTRY Zespri is acknowledged as a category leader in kiwifruit, managing 30 percent of globally traded volume. Zespri
has built a strong reputation through:
Focus on innovation to develop new varieties, productivity and sustainable growing techniques.
Developing advanced supply chain systems to distribute premium quality kiwifruit.
Researching the health benefits of kiwifruit with credible research partners.
Establishing strong brand awareness and in-market service.
Zespri uses the SPE to underpin its entire operations as depicted in the following diagram. This leads to
maintaining their leading global kiwifruit product portfolio. This is done through: brand and marketing, a focus
on quality and in market distribution, an integrated supply system, category management and innovation. The
aim is to build a sustainable competitive advantage as the industry expands over the coming decade.
Figure 8: Zespri’s Long Term Strategy.
Zespri’s long-term strategy is divided in this section under its six pillars as follows:
Brand and Marketing
Quality
In-market distribution
Integrated Supply System
Category management
Leaders in Innovation
2.1 BRAND AND MARKETING
The Zespri brand is immensely valuable for New Zealand kiwifruit growers. It represents all the positive aspects
of the Zespri System – great taste, consistent high quality, reliable supply, a healthy product – and presents to
consumers all around the world the emotive qualities that enables a connection recognised, trusted and
preferred. The Zespri brand holds a specific perception in customers’ minds concerning the qualities and
attributes of our kiwifruit product – it is not only related to the tangible aspects, but also to the emotional
perceptions.
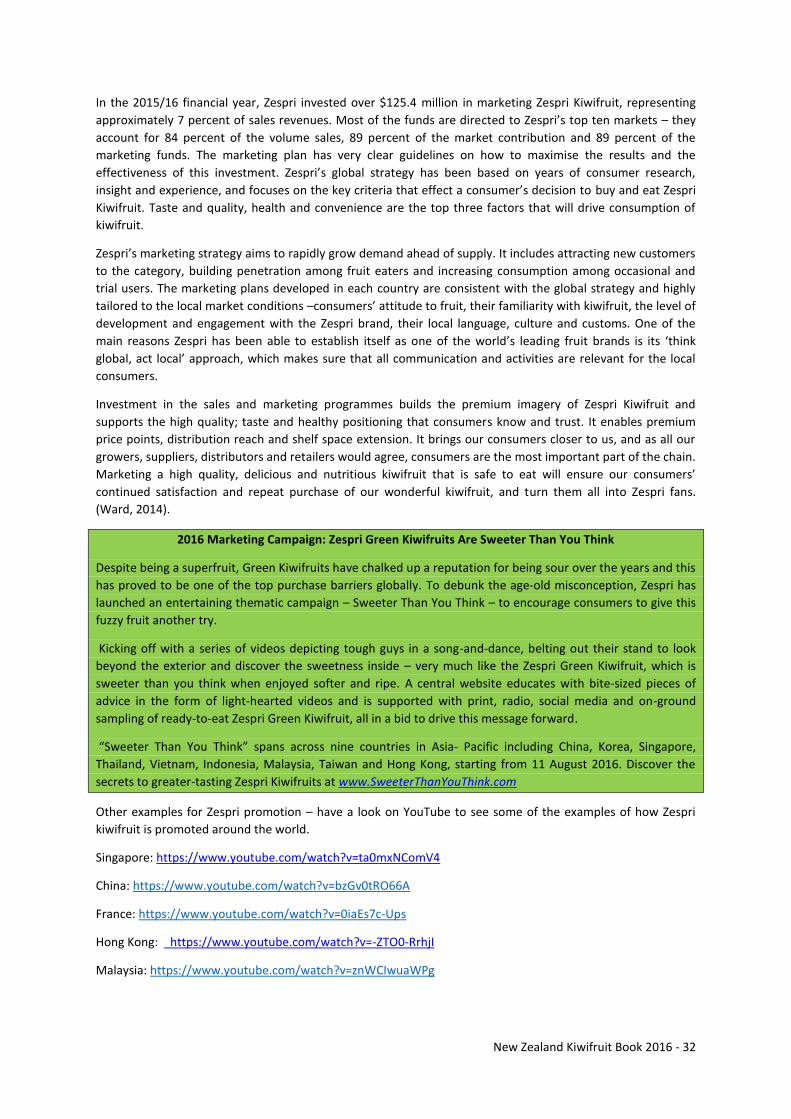
New Zealand Kiwifruit Book 2016 - 32
In the 2015/16 financial year, Zespri invested over $125.4 million in marketing Zespri Kiwifruit, representing
approximately 7 percent of sales revenues. Most of the funds are directed to Zespri’s top ten markets – they
account for 84 percent of the volume sales, 89 percent of the market contribution and 89 percent of the
marketing funds. The marketing plan has very clear guidelines on how to maximise the results and the
effectiveness of this investment. Zespri’s global strategy has been based on years of consumer research,
insight and experience, and focuses on the key criteria that effect a consumer’s decision to buy and eat Zespri
Kiwifruit. Taste and quality, health and convenience are the top three factors that will drive consumption of
kiwifruit.
Zespri’s marketing strategy aims to rapidly grow demand ahead of supply. It includes attracting new customers
to the category, building penetration among fruit eaters and increasing consumption among occasional and
trial users. The marketing plans developed in each country are consistent with the global strategy and highly
tailored to the local market conditions –consumers’ attitude to fruit, their familiarity with kiwifruit, the level of
development and engagement with the Zespri brand, their local language, culture and customs. One of the
main reasons Zespri has been able to establish itself as one of the world’s leading fruit brands is its ‘think
global, act local’ approach, which makes sure that all communication and activities are relevant for the local
consumers.
Investment in the sales and marketing programmes builds the premium imagery of Zespri Kiwifruit and
supports the high quality; taste and healthy positioning that consumers know and trust. It enables premium
price points, distribution reach and shelf space extension. It brings our consumers closer to us, and as all our
growers, suppliers, distributors and retailers would agree, consumers are the most important part of the chain.
Marketing a high quality, delicious and nutritious kiwifruit that is safe to eat will ensure our consumers’
continued satisfaction and repeat purchase of our wonderful kiwifruit, and turn them all into Zespri fans.
(Ward, 2014).
2016 Marketing Campaign: Zespri Green Kiwifruits Are Sweeter Than You Think
Despite being a superfruit, Green Kiwifruits have chalked up a reputation for being sour over the years and this
has proved to be one of the top purchase barriers globally. To debunk the age-old misconception, Zespri has
launched an entertaining thematic campaign – Sweeter Than You Think – to encourage consumers to give this
fuzzy fruit another try.
Kicking off with a series of videos depicting tough guys in a song-and-dance, belting out their stand to look
beyond the exterior and discover the sweetness inside – very much like the Zespri Green Kiwifruit, which is
sweeter than you think when enjoyed softer and ripe. A central website educates with bite-sized pieces of
advice in the form of light-hearted videos and is supported with print, radio, social media and on-ground
sampling of ready-to-eat Zespri Green Kiwifruit, all in a bid to drive this message forward.
“Sweeter Than You Think” spans across nine countries in Asia- Pacific including China, Korea, Singapore,
Thailand, Vietnam, Indonesia, Malaysia, Taiwan and Hong Kong, starting from 11 August 2016. Discover the
secrets to greater-tasting Zespri Kiwifruits at www.SweeterThanYouThink.com
Other examples for Zespri promotion – have a look on YouTube to see some of the examples of how Zespri
kiwifruit is promoted around the world.
Singapore: https://www.youtube.com/watch?v=ta0mxNComV4
China: https://www.youtube.com/watch?v=bzGv0tRO66A
France: https://www.youtube.com/watch?v=0iaEs7c-Ups
Hong Kong: https://www.youtube.com/watch?v=-ZTO0-RrhjI
Malaysia: https://www.youtube.com/watch?v=znWCIwuaWPg
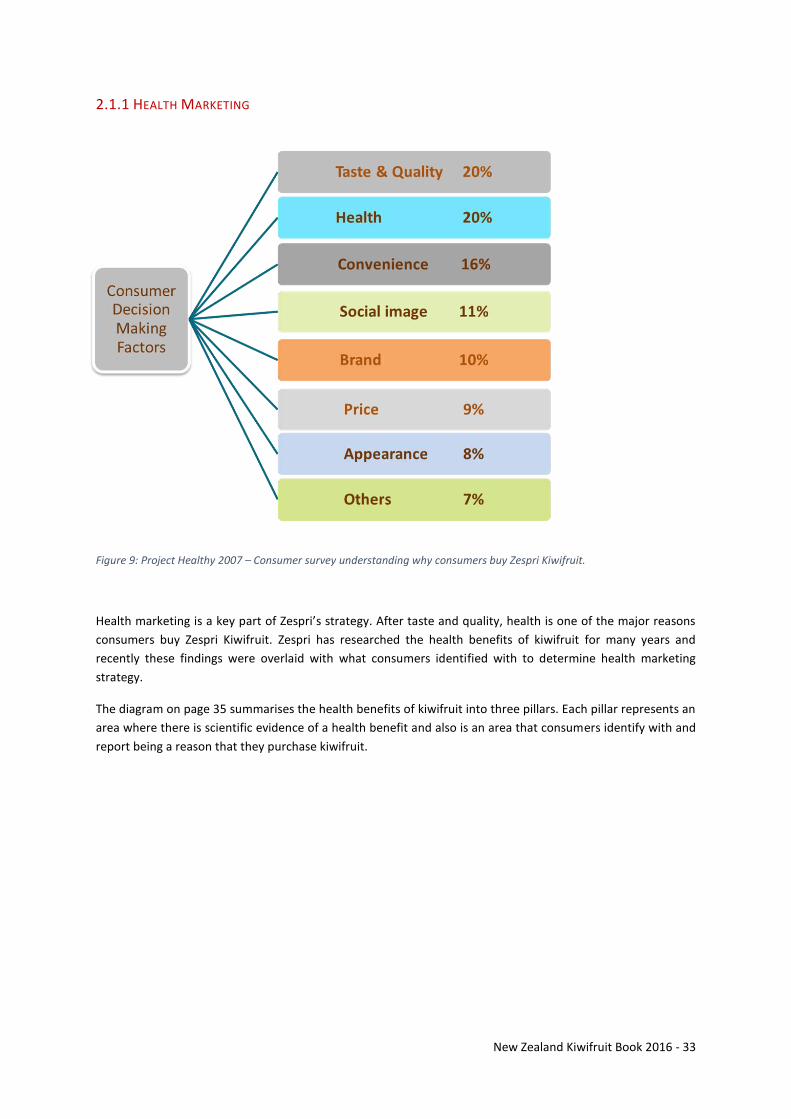
New Zealand Kiwifruit Book 2016 - 33
2.1.1 HEALTH MARKETING
Figure 9: Project Healthy 2007 – Consumer survey understanding why consumers buy Zespri Kiwifruit.
Health marketing is a key part of Zespri’s strategy. After taste and quality, health is one of the major reasons
consumers buy Zespri Kiwifruit. Zespri has researched the health benefits of kiwifruit for many years and
recently these findings were overlaid with what consumers identified with to determine health marketing
strategy.
The diagram on page 35 summarises the health benefits of kiwifruit into three pillars. Each pillar represents an
area where there is scientific evidence of a health benefit and also is an area that consumers identify with and
report being a reason that they purchase kiwifruit.
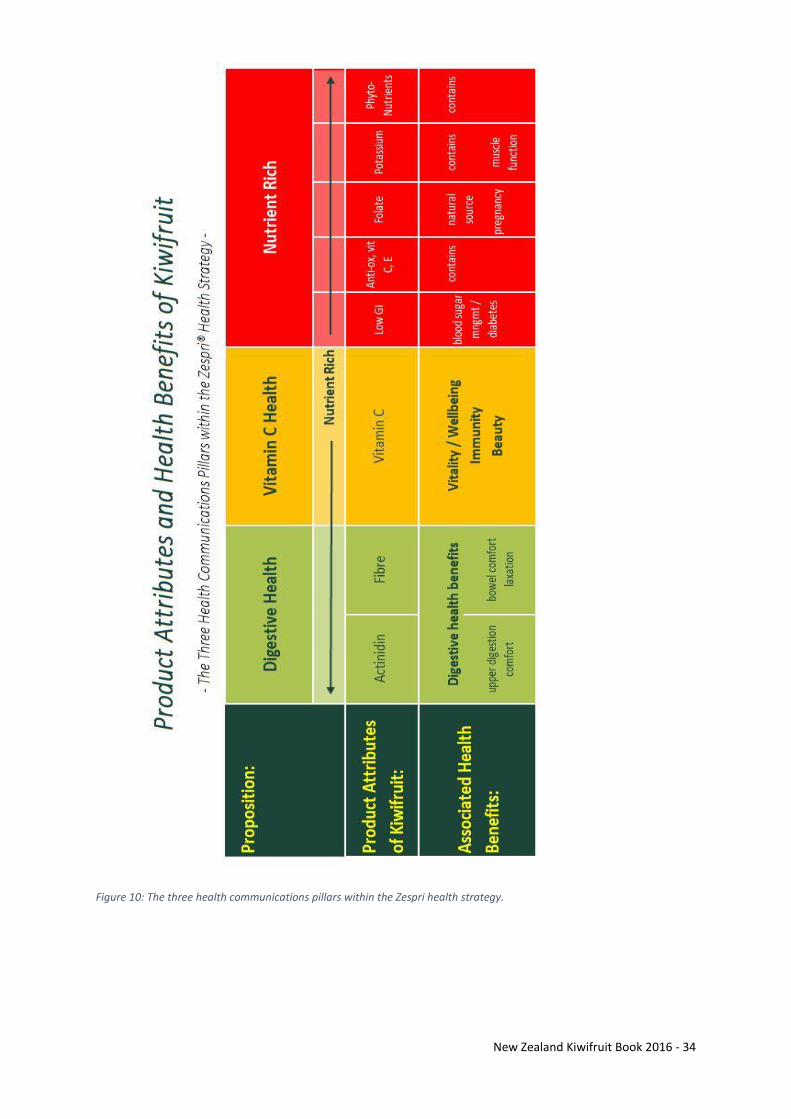
New Zealand Kiwifruit Book 2016 - 34
Figure 10: The three health communications pillars within the Zespri health strategy.
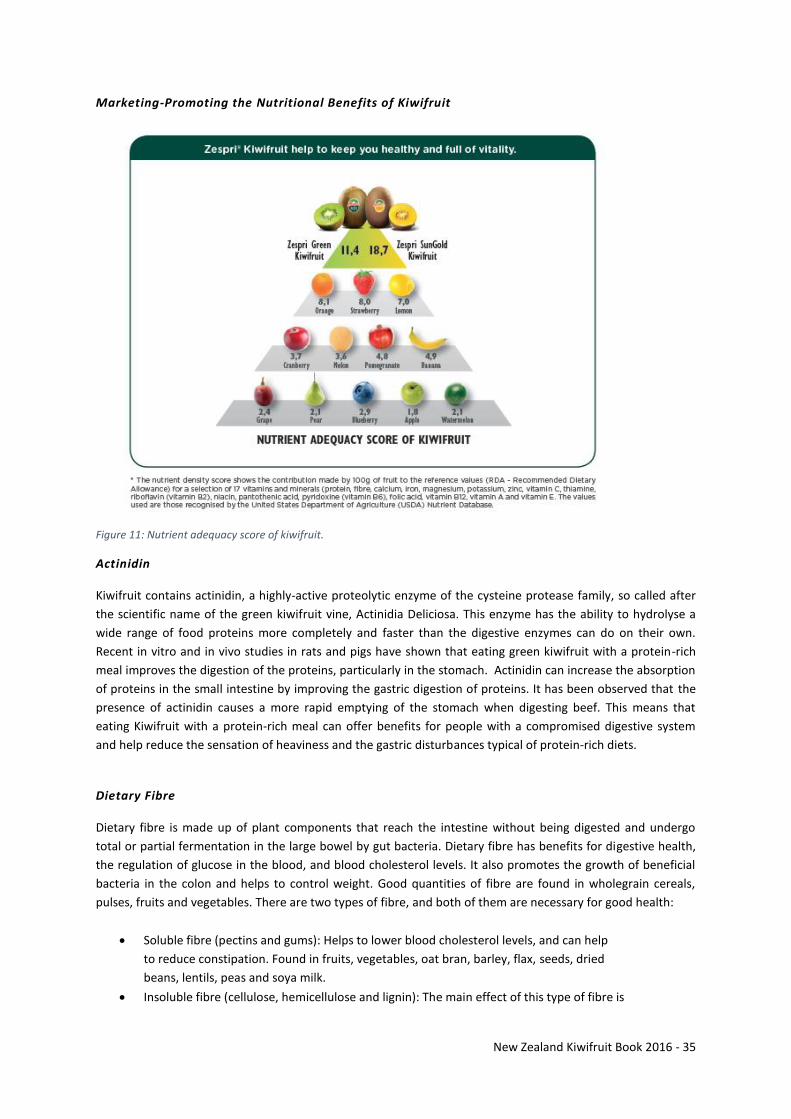
New Zealand Kiwifruit Book 2016 - 35
Marketing-Promoting the Nutritional Benefits of Kiwifruit
Figure 11: Nutrient adequacy score of kiwifruit.
Actinidin
Kiwifruit contains actinidin, a highly-active proteolytic enzyme of the cysteine protease family, so called after
the scientific name of the green kiwifruit vine, Actinidia Deliciosa. This enzyme has the ability to hydrolyse a
wide range of food proteins more completely and faster than the digestive enzymes can do on their own.
Recent in vitro and in vivo studies in rats and pigs have shown that eating green kiwifruit with a protein-rich
meal improves the digestion of the proteins, particularly in the stomach. Actinidin can increase the absorption
of proteins in the small intestine by improving the gastric digestion of proteins. It has been observed that the
presence of actinidin causes a more rapid emptying of the stomach when digesting beef. This means that
eating Kiwifruit with a protein-rich meal can offer benefits for people with a compromised digestive system
and help reduce the sensation of heaviness and the gastric disturbances typical of protein-rich diets.
Dietary Fibre
Dietary fibre is made up of plant components that reach the intestine without being digested and undergo
total or partial fermentation in the large bowel by gut bacteria. Dietary fibre has benefits for digestive health,
the regulation of glucose in the blood, and blood cholesterol levels. It also promotes the growth of beneficial
bacteria in the colon and helps to control weight. Good quantities of fibre are found in wholegrain cereals,
pulses, fruits and vegetables. There are two types of fibre, and both of them are necessary for good health:
Soluble fibre (pectins and gums): Helps to lower blood cholesterol levels, and can help
to reduce constipation. Found in fruits, vegetables, oat bran, barley, flax, seeds, dried
beans, lentils, peas and soya milk.
Insoluble fibre (cellulose, hemicellulose and lignin): The main effect of this type of fibre is
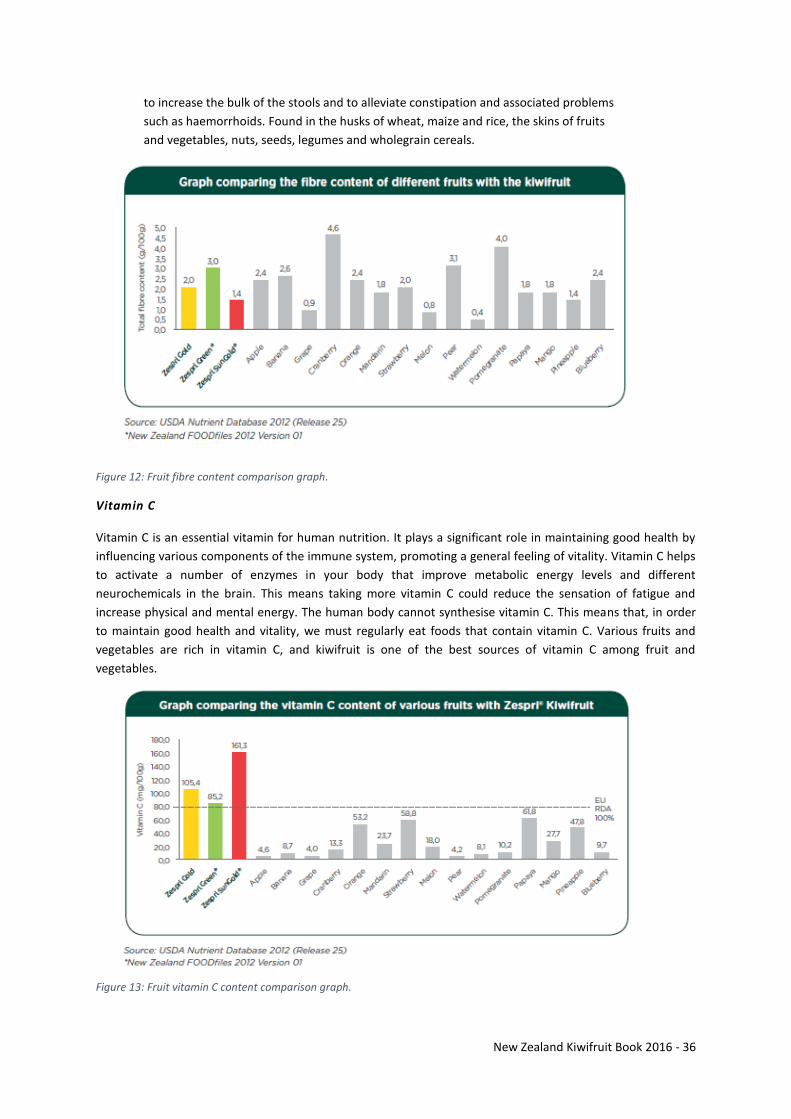
New Zealand Kiwifruit Book 2016 - 36
to increase the bulk of the stools and to alleviate constipation and associated problems
such as haemorrhoids. Found in the husks of wheat, maize and rice, the skins of fruits
and vegetables, nuts, seeds, legumes and wholegrain cereals.
Figure 12: Fruit fibre content comparison graph.
Vitamin C
Vitamin C is an essential vitamin for human nutrition. It plays a significant role in maintaining good health by
influencing various components of the immune system, promoting a general feeling of vitality. Vitamin C helps
to activate a number of enzymes in your body that improve metabolic energy levels and different
neurochemicals in the brain. This means taking more vitamin C could reduce the sensation of fatigue and
increase physical and mental energy. The human body cannot synthesise vitamin C. This means that, in order
to maintain good health and vitality, we must regularly eat foods that contain vitamin C. Various fruits and
vegetables are rich in vitamin C, and kiwifruit is one of the best sources of vitamin C among fruit and
vegetables.
Figure 13: Fruit vitamin C content comparison graph.
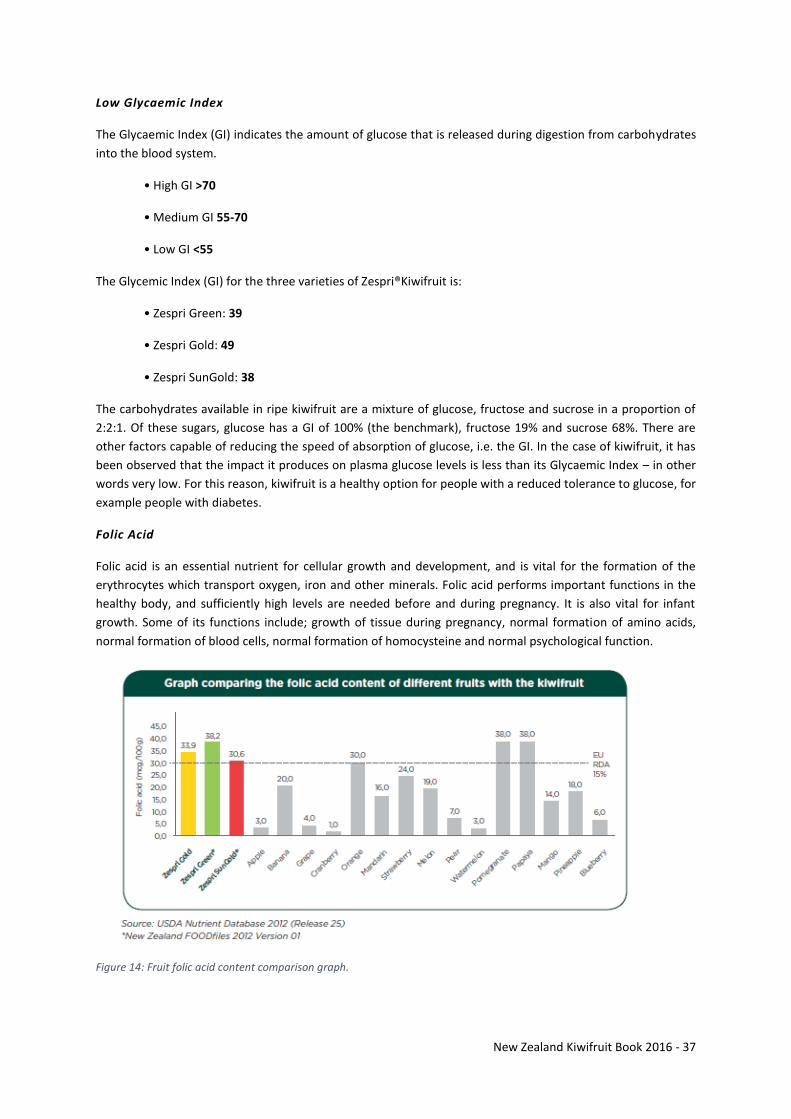
New Zealand Kiwifruit Book 2016 - 37
Low Glycaemic Index
The Glycaemic Index (GI) indicates the amount of glucose that is released during digestion from carbohydrates
into the blood system.
• High GI >70
• Medium GI 55-70
• Low GI <55
The Glycemic Index (GI) for the three varieties of Zespri®Kiwifruit is:
• Zespri Green: 39
• Zespri Gold: 49
• Zespri SunGold: 38
The carbohydrates available in ripe kiwifruit are a mixture of glucose, fructose and sucrose in a proportion of
2:2:1. Of these sugars, glucose has a GI of 100% (the benchmark), fructose 19% and sucrose 68%. There are
other factors capable of reducing the speed of absorption of glucose, i.e. the GI. In the case of kiwifruit, it has
been observed that the impact it produces on plasma glucose levels is less than its Glycaemic Index – in other
words very low. For this reason, kiwifruit is a healthy option for people with a reduced tolerance to glucose, for
example people with diabetes.
Folic Acid
Folic acid is an essential nutrient for cellular growth and development, and is vital for the formation of the
erythrocytes which transport oxygen, iron and other minerals. Folic acid performs important functions in the
healthy body, and sufficiently high levels are needed before and during pregnancy. It is also vital for infant
growth. Some of its functions include; growth of tissue during pregnancy, normal formation of amino acids,
normal formation of blood cells, normal formation of homocysteine and normal psychological function.
Figure 14: Fruit folic acid content comparison graph.
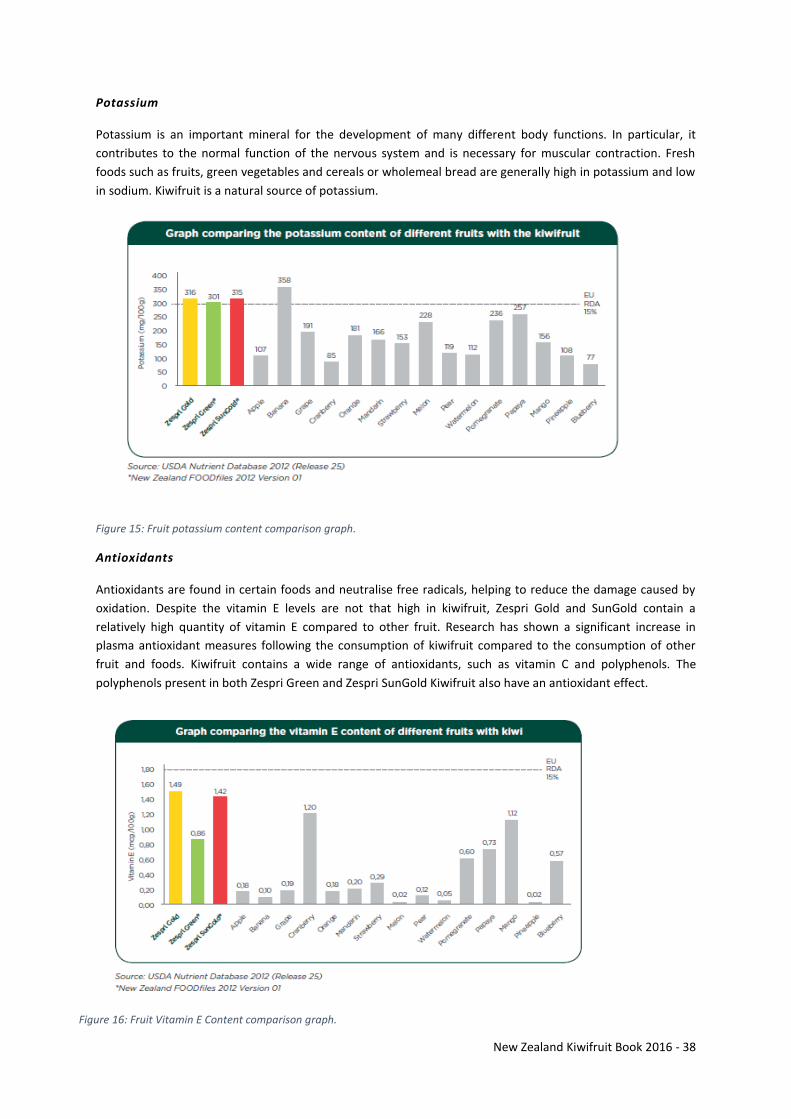
New Zealand Kiwifruit Book 2016 - 38
Potassium
Potassium is an important mineral for the development of many different body functions. In particular, it
contributes to the normal function of the nervous system and is necessary for muscular contraction. Fresh
foods such as fruits, green vegetables and cereals or wholemeal bread are generally high in potassium and low
in sodium. Kiwifruit is a natural source of potassium.
Figure 15: Fruit potassium content comparison graph.
Antioxidants
Antioxidants are found in certain foods and neutralise free radicals, helping to reduce the damage caused by
oxidation. Despite the vitamin E levels are not that high in kiwifruit, Zespri Gold and SunGold contain a
relatively high quantity of vitamin E compared to other fruit. Research has shown a significant increase in
plasma antioxidant measures following the consumption of kiwifruit compared to the consumption of other
fruit and foods. Kiwifruit contains a wide range of antioxidants, such as vitamin C and polyphenols. The
polyphenols present in both Zespri Green and Zespri SunGold Kiwifruit also have an antioxidant effect.
Figure 16: Fruit Vitamin E Content comparison graph.
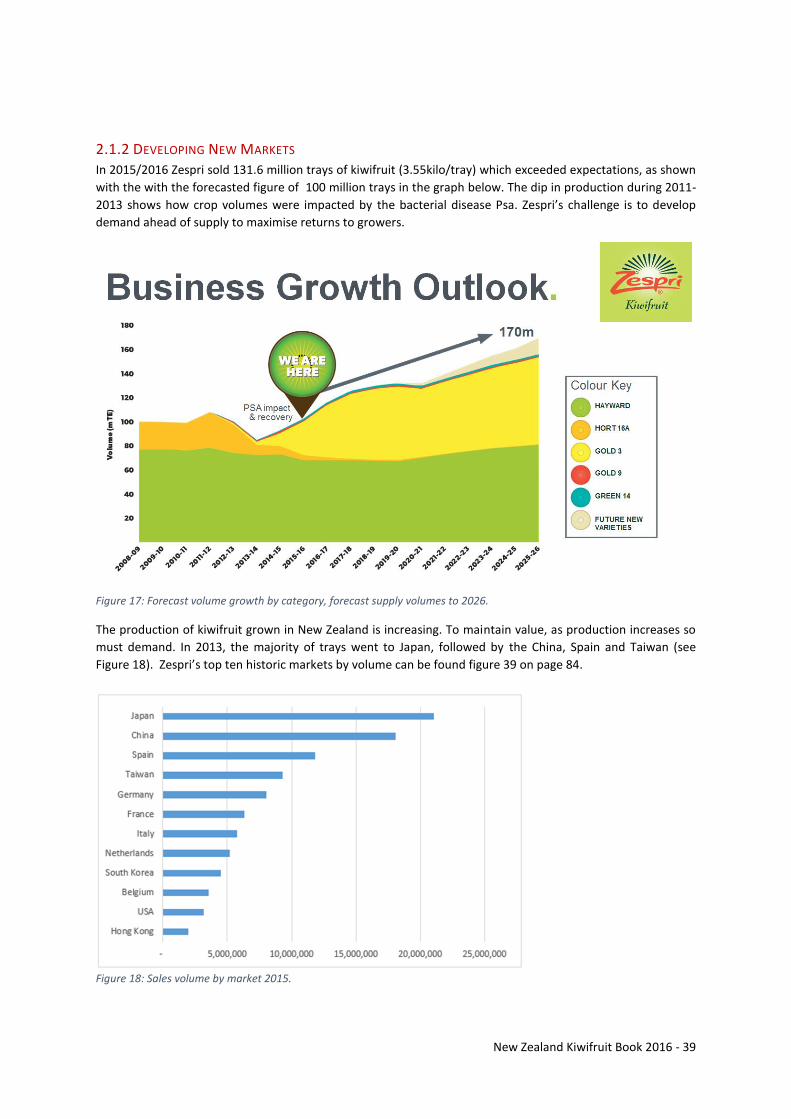
New Zealand Kiwifruit Book 2016 - 39
2.1.2 DEVELOPING NEW MARKETS In 2015/2016 Zespri sold 131.6 million trays of kiwifruit (3.55kilo/tray) which exceeded expectations, as shown
with the with the forecasted figure of 100 million trays in the graph below. The dip in production during 2011-
2013 shows how crop volumes were impacted by the bacterial disease Psa. Zespri’s challenge is to develop
demand ahead of supply to maximise returns to growers.
Figure 17: Forecast volume growth by category, forecast supply volumes to 2026.
The production of kiwifruit grown in New Zealand is increasing. To maintain value, as production increases so
must demand. In 2013, the majority of trays went to Japan, followed by the China, Spain and Taiwan (see
Figure 18). Zespri’s top ten historic markets by volume can be found figure 39 on page 84.
Figure 18: Sales volume by market 2015.
Figure 16- Fruit vitamin E content comparison graph
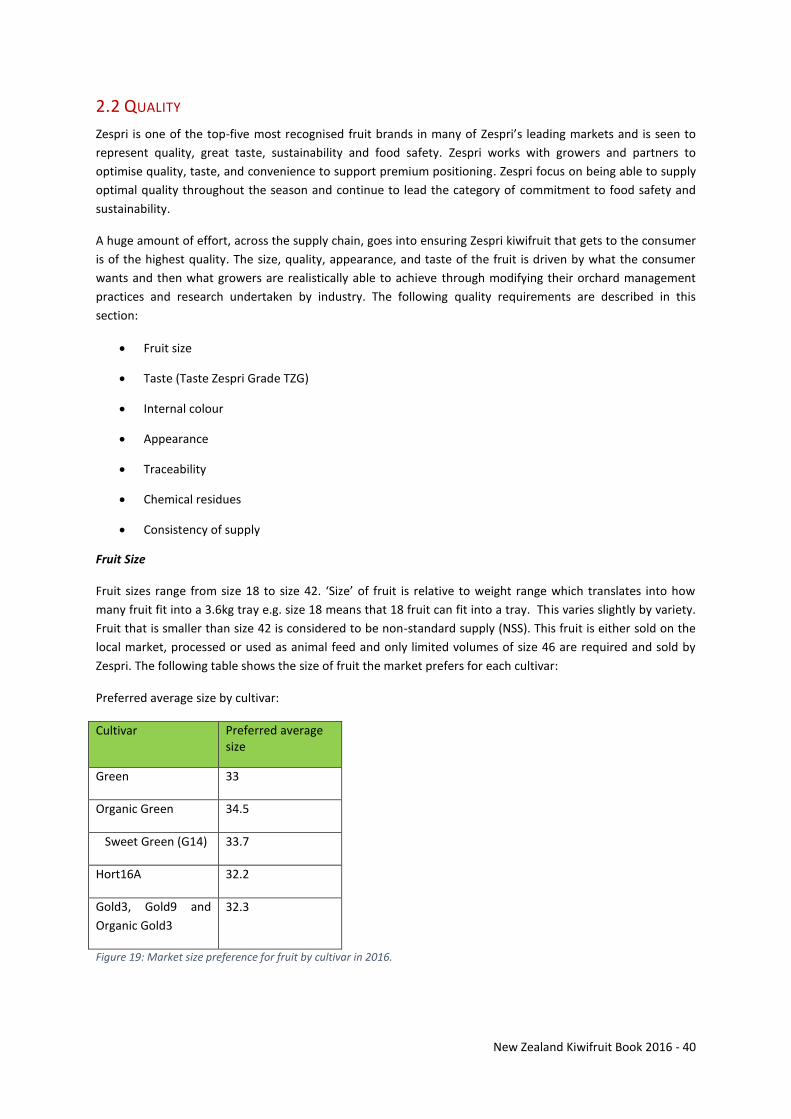
New Zealand Kiwifruit Book 2016 - 40
2.2 QUALITY
Zespri is one of the top-five most recognised fruit brands in many of Zespri’s leading markets and is seen to
represent quality, great taste, sustainability and food safety. Zespri works with growers and partners to
optimise quality, taste, and convenience to support premium positioning. Zespri focus on being able to supply
optimal quality throughout the season and continue to lead the category of commitment to food safety and
sustainability.
A huge amount of effort, across the supply chain, goes into ensuring Zespri kiwifruit that gets to the consumer
is of the highest quality. The size, quality, appearance, and taste of the fruit is driven by what the consumer
wants and then what growers are realistically able to achieve through modifying their orchard management
practices and research undertaken by industry. The following quality requirements are described in this
section:
Fruit size
Taste (Taste Zespri Grade TZG)
Internal colour
Appearance
Traceability
Chemical residues
Consistency of supply
Fruit Size
Fruit sizes range from size 18 to size 42. ‘Size’ of fruit is relative to weight range which translates into how
many fruit fit into a 3.6kg tray e.g. size 18 means that 18 fruit can fit into a tray. This varies slightly by variety.
Fruit that is smaller than size 42 is considered to be non-standard supply (NSS). This fruit is either sold on the
local market, processed or used as animal feed and only limited volumes of size 46 are required and sold by
Zespri. The following table shows the size of fruit the market prefers for each cultivar:
Preferred average size by cultivar:
Cultivar Preferred average size
Green 33
Organic Green 34.5
Sweet Green (G14) 33.7
Hort16A 32.2
Gold3, Gold9 and
Organic Gold3
32.3
Figure 19: Market size preference for fruit by cultivar in 2016.
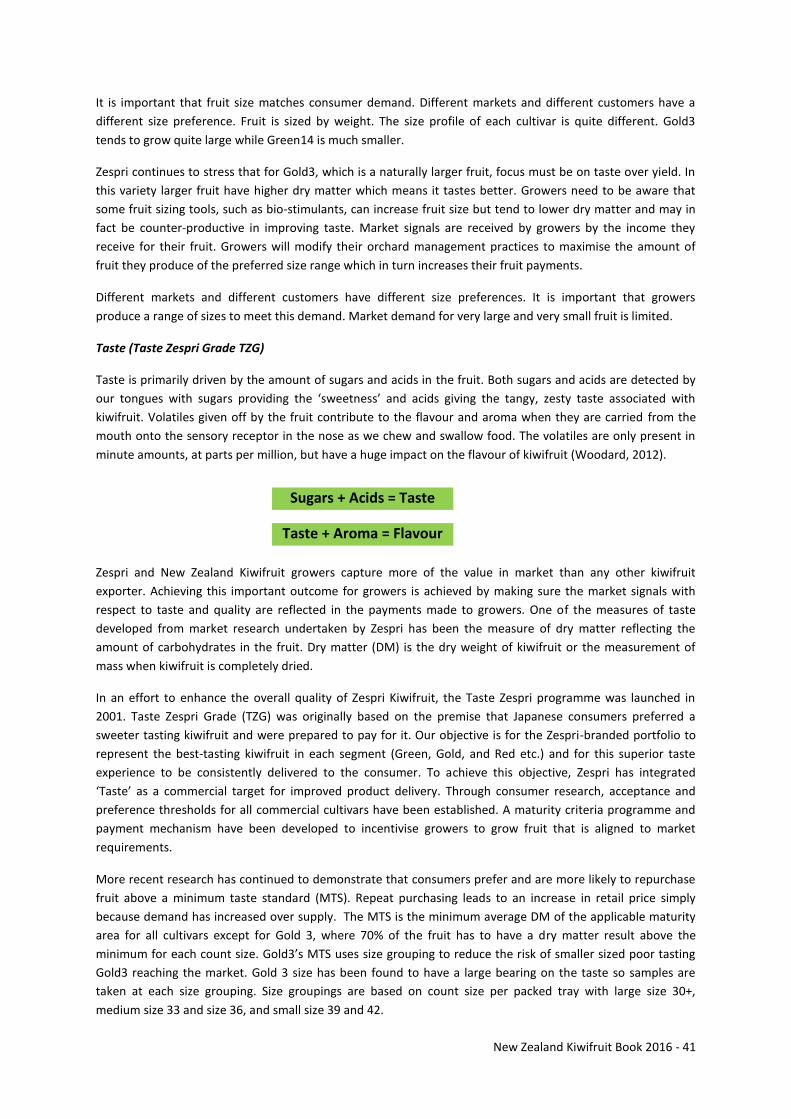
New Zealand Kiwifruit Book 2016 - 41
It is important that fruit size matches consumer demand. Different markets and different customers have a
different size preference. Fruit is sized by weight. The size profile of each cultivar is quite different. Gold3
tends to grow quite large while Green14 is much smaller.
Zespri continues to stress that for Gold3, which is a naturally larger fruit, focus must be on taste over yield. In
this variety larger fruit have higher dry matter which means it tastes better. Growers need to be aware that
some fruit sizing tools, such as bio-stimulants, can increase fruit size but tend to lower dry matter and may in
fact be counter-productive in improving taste. Market signals are received by growers by the income they
receive for their fruit. Growers will modify their orchard management practices to maximise the amount of
fruit they produce of the preferred size range which in turn increases their fruit payments.
Different markets and different customers have different size preferences. It is important that growers
produce a range of sizes to meet this demand. Market demand for very large and very small fruit is limited.
Taste (Taste Zespri Grade TZG)
Taste is primarily driven by the amount of sugars and acids in the fruit. Both sugars and acids are detected by
our tongues with sugars providing the ‘sweetness’ and acids giving the tangy, zesty taste associated with
kiwifruit. Volatiles given off by the fruit contribute to the flavour and aroma when they are carried from the
mouth onto the sensory receptor in the nose as we chew and swallow food. The volatiles are only present in
minute amounts, at parts per million, but have a huge impact on the flavour of kiwifruit (Woodard, 2012).
Zespri and New Zealand Kiwifruit growers capture more of the value in market than any other kiwifruit
exporter. Achieving this important outcome for growers is achieved by making sure the market signals with
respect to taste and quality are reflected in the payments made to growers. One of the measures of taste
developed from market research undertaken by Zespri has been the measure of dry matter reflecting the
amount of carbohydrates in the fruit. Dry matter (DM) is the dry weight of kiwifruit or the measurement of
mass when kiwifruit is completely dried.
In an effort to enhance the overall quality of Zespri Kiwifruit, the Taste Zespri programme was launched in
2001. Taste Zespri Grade (TZG) was originally based on the premise that Japanese consumers preferred a
sweeter tasting kiwifruit and were prepared to pay for it. Our objective is for the Zespri-branded portfolio to
represent the best-tasting kiwifruit in each segment (Green, Gold, and Red etc.) and for this superior taste
experience to be consistently delivered to the consumer. To achieve this objective, Zespri has integrated
‘Taste’ as a commercial target for improved product delivery. Through consumer research, acceptance and
preference thresholds for all commercial cultivars have been established. A maturity criteria programme and
payment mechanism have been developed to incentivise growers to grow fruit that is aligned to market
requirements.
More recent research has continued to demonstrate that consumers prefer and are more likely to repurchase
fruit above a minimum taste standard (MTS). Repeat purchasing leads to an increase in retail price simply
because demand has increased over supply. The MTS is the minimum average DM of the applicable maturity
area for all cultivars except for Gold 3, where 70% of the fruit has to have a dry matter result above the
minimum for each count size. Gold3’s MTS uses size grouping to reduce the risk of smaller sized poor tasting
Gold3 reaching the market. Gold 3 size has been found to have a large bearing on the taste so samples are
taken at each size grouping. Size groupings are based on count size per packed tray with large size 30+,
medium size 33 and size 36, and small size 39 and 42.
Sugars + Acids = Taste
Taste + Aroma = Flavour
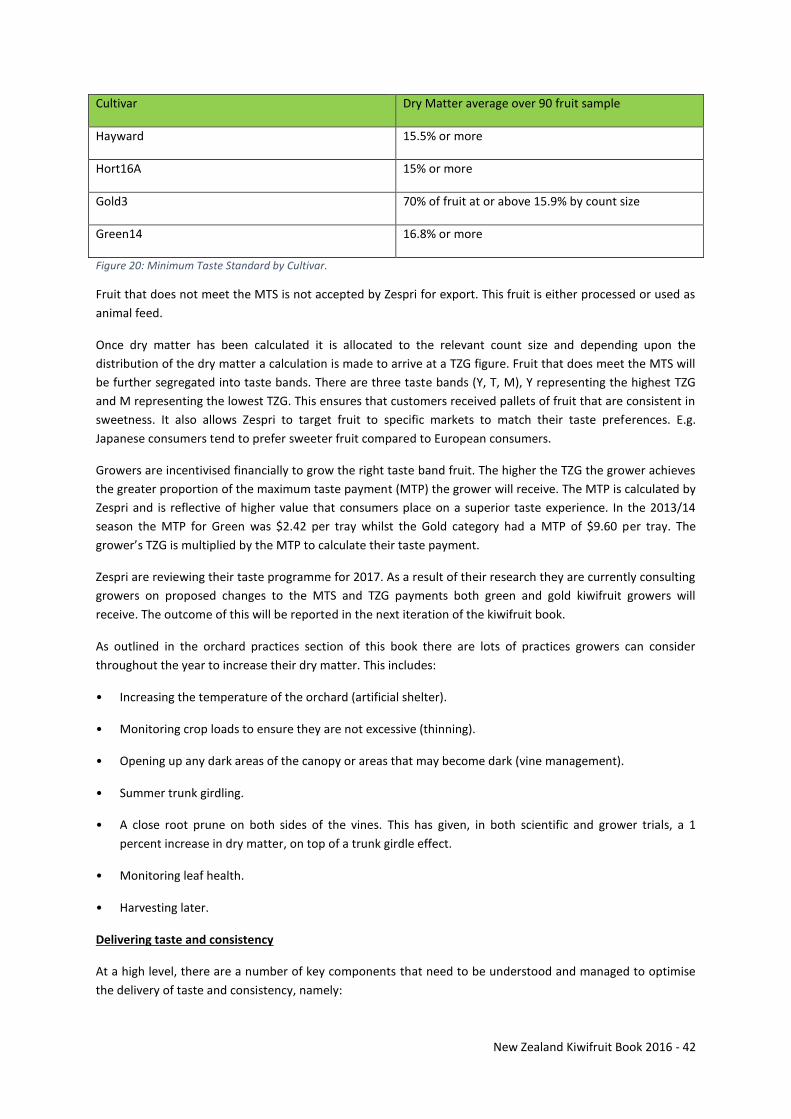
New Zealand Kiwifruit Book 2016 - 42
Cultivar Dry Matter average over 90 fruit sample
Hayward 15.5% or more
Hort16A 15% or more
Gold3 70% of fruit at or above 15.9% by count size
Green14 16.8% or more
Figure 20: Minimum Taste Standard by Cultivar.
Fruit that does not meet the MTS is not accepted by Zespri for export. This fruit is either processed or used as
animal feed.
Once dry matter has been calculated it is allocated to the relevant count size and depending upon the
distribution of the dry matter a calculation is made to arrive at a TZG figure. Fruit that does meet the MTS will
be further segregated into taste bands. There are three taste bands (Y, T, M), Y representing the highest TZG
and M representing the lowest TZG. This ensures that customers received pallets of fruit that are consistent in
sweetness. It also allows Zespri to target fruit to specific markets to match their taste preferences. E.g.
Japanese consumers tend to prefer sweeter fruit compared to European consumers.
Growers are incentivised financially to grow the right taste band fruit. The higher the TZG the grower achieves
the greater proportion of the maximum taste payment (MTP) the grower will receive. The MTP is calculated by
Zespri and is reflective of higher value that consumers place on a superior taste experience. In the 2013/14
season the MTP for Green was $2.42 per tray whilst the Gold category had a MTP of $9.60 per tray. The
grower’s TZG is multiplied by the MTP to calculate their taste payment.
Zespri are reviewing their taste programme for 2017. As a result of their research they are currently consulting
growers on proposed changes to the MTS and TZG payments both green and gold kiwifruit growers will
receive. The outcome of this will be reported in the next iteration of the kiwifruit book.
As outlined in the orchard practices section of this book there are lots of practices growers can consider
throughout the year to increase their dry matter. This includes:
• Increasing the temperature of the orchard (artificial shelter).
• Monitoring crop loads to ensure they are not excessive (thinning).
• Opening up any dark areas of the canopy or areas that may become dark (vine management).
• Summer trunk girdling.
• A close root prune on both sides of the vines. This has given, in both scientific and grower trials, a 1
percent increase in dry matter, on top of a trunk girdle effect.
• Monitoring leaf health.
• Harvesting later.
Delivering taste and consistency
At a high level, there are a number of key components that need to be understood and managed to optimise
the delivery of taste and consistency, namely:
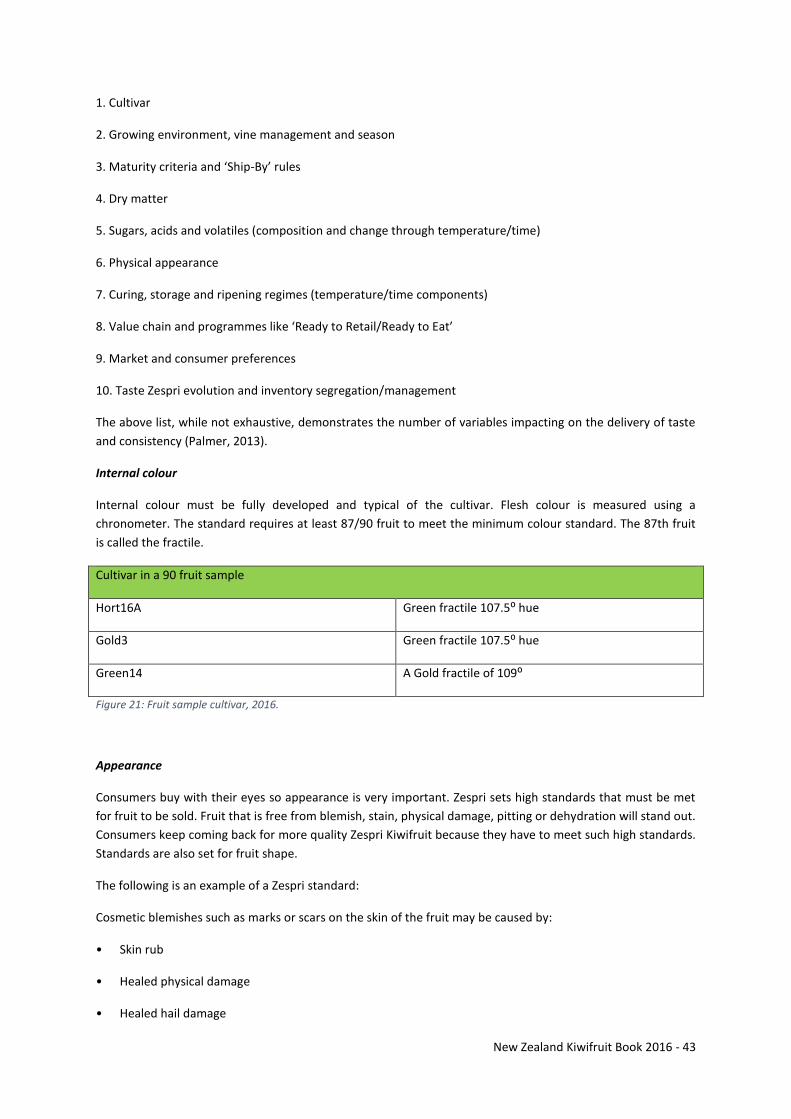
New Zealand Kiwifruit Book 2016 - 43
1. Cultivar
2. Growing environment, vine management and season
3. Maturity criteria and ‘Ship-By’ rules
4. Dry matter
5. Sugars, acids and volatiles (composition and change through temperature/time)
6. Physical appearance
7. Curing, storage and ripening regimes (temperature/time components)
8. Value chain and programmes like ‘Ready to Retail/Ready to Eat’
9. Market and consumer preferences
10. Taste Zespri evolution and inventory segregation/management
The above list, while not exhaustive, demonstrates the number of variables impacting on the delivery of taste
and consistency (Palmer, 2013).
Internal colour
Internal colour must be fully developed and typical of the cultivar. Flesh colour is measured using a
chronometer. The standard requires at least 87/90 fruit to meet the minimum colour standard. The 87th fruit
is called the fractile.
Cultivar in a 90 fruit sample
Hort16A Green fractile 107.5⁰ hue
Gold3 Green fractile 107.5⁰ hue
Green14 A Gold fractile of 109⁰
Figure 21: Fruit sample cultivar, 2016.
Appearance
Consumers buy with their eyes so appearance is very important. Zespri sets high standards that must be met
for fruit to be sold. Fruit that is free from blemish, stain, physical damage, pitting or dehydration will stand out.
Consumers keep coming back for more quality Zespri Kiwifruit because they have to meet such high standards.
Standards are also set for fruit shape.
The following is an example of a Zespri standard:
Cosmetic blemishes such as marks or scars on the skin of the fruit may be caused by:
• Skin rub
• Healed physical damage
• Healed hail damage
New Zealand Kiwifruit Book 2016 - 44
• Healed insect damage/cosmetic pests
• Fungal damage
• Skin burn
• Chimera mark
There are allowances for some blemishes in the Zespri Grade Standards Manual as follows:
In all classes blemishes which merge with the colour of the skin are acceptable.
CLASS I - Acceptable blemishes are:
• Superficial
• Light in colour provided they do not affect the general appearance of the fruit.
• Total one square centimetre or less in area.
CLASS Family Kiwi™ - Acceptable blemishes are:
• Blemishes which contrast with the colour of the skin and total two cm squared or less in area are
acceptable.
Unacceptable in all classes are:
• Black marks
• Significantly deep or raised blemishes.
• Cosmetic pests which are less than 1millimetre in diameter but total one centimetre squared or greater in
area.
These are depicted on page 45 in a poster that Zespri Orchard Productivity Centre has developed for growers.
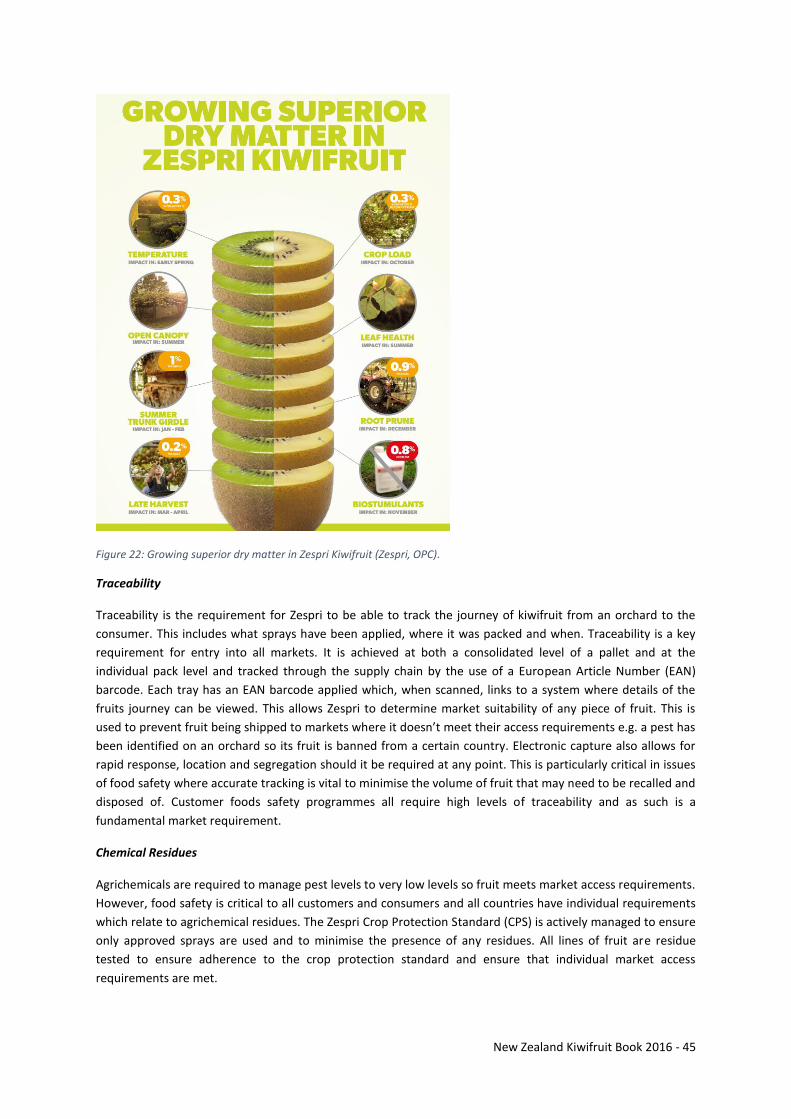
New Zealand Kiwifruit Book 2016 - 45
Figure 22: Growing superior dry matter in Zespri Kiwifruit (Zespri, OPC).
Traceability
Traceability is the requirement for Zespri to be able to track the journey of kiwifruit from an orchard to the
consumer. This includes what sprays have been applied, where it was packed and when. Traceability is a key
requirement for entry into all markets. It is achieved at both a consolidated level of a pallet and at the
individual pack level and tracked through the supply chain by the use of a European Article Number (EAN)
barcode. Each tray has an EAN barcode applied which, when scanned, links to a system where details of the
fruits journey can be viewed. This allows Zespri to determine market suitability of any piece of fruit. This is
used to prevent fruit being shipped to markets where it doesn’t meet their access requirements e.g. a pest has
been identified on an orchard so its fruit is banned from a certain country. Electronic capture also allows for
rapid response, location and segregation should it be required at any point. This is particularly critical in issues
of food safety where accurate tracking is vital to minimise the volume of fruit that may need to be recalled and
disposed of. Customer foods safety programmes all require high levels of traceability and as such is a
fundamental market requirement.
Chemical Residues
Agrichemicals are required to manage pest levels to very low levels so fruit meets market access requirements.
However, food safety is critical to all customers and consumers and all countries have individual requirements
which relate to agrichemical residues. The Zespri Crop Protection Standard (CPS) is actively managed to ensure
only approved sprays are used and to minimise the presence of any residues. All lines of fruit are residue
tested to ensure adherence to the crop protection standard and ensure that individual market access
requirements are met.
New Zealand Kiwifruit Book 2016 - 46
Consistency of Supply
Customers require consistent supply of consistent product to be able to provide consumers with a reliable
source of high quality and high taste kiwifruit 12 months of the year. Capturing and keeping shelf space full is
key to the customer relationship and maximises the value to all parties while reducing the New Zealand
grower’s risk of competitor replacement. Market planning and shipping programmes all attempt to keep
supply available for as long as possible. During the early part of the season when supply is limited markets are
only started when there is sufficient fruit to allow for continued supply.
Having a product with a long, reliable storage life greatly assists being able to provide consumers with a good
eating experience over a long selling season. Sales to customers may continue 6-7 months from harvest and
final retail sales can extend for another month after that. For both New Zealand growers and for in-market
customers having practically all the volume consolidated through one seller in Zespri provides a mechanism to
give a high level of assurance of consistent supply.
2.3 IN-MARKET DISTRIBUTION
Zespri sell into more than 50 markets worldwide and work with distribution customers and partners, who buy
fruit from Zespri and get the product into wholesale markets and onto the supermarket shelves. From the
wharf, the fruit goes into dedicated coolstore distribution centres and on to thousands of wholesale and retail
outlets. Zespri serve distribution and retail customers with the optimal balance of Green, Gold and Organic
products.
Zespri is dedicated to its customers and is focused on consistently providing excellent product and excellent
service. The Zespri System, the integrated production and distribution system used to deliver the world’s best
kiwifruit to consumers worldwide, is one of the foundation blocks of the Zespri Brand. It is the culmination of
many years of scientific, technical and practical developments and an uncompromised commitment to
continual improvement.
The Zespri System recognises that quality has many components, but they all rely on a combination of Best
Practice, excellent product and documented assurance to provide customer confidence. It has been developed
in recognition of customers’ needs for a comprehensive assurance that fruit has been grown and handled
safely with:
A strong focus on good agricultural practice.
Environmental and economic sustainability including the efficient use of natural resources.
Integrated Pest Management.
Orchard to retail traceability.
A socially responsible approach to workers and the communities it supports, practices that maximise fruit quality, taste and storage potential of the fruit.
Leading edge Good Manufacturing Practice throughout the postharvest and distribution sectors of the industry.
An understanding of current and future market and customer needs.
World class Quality Management systems.
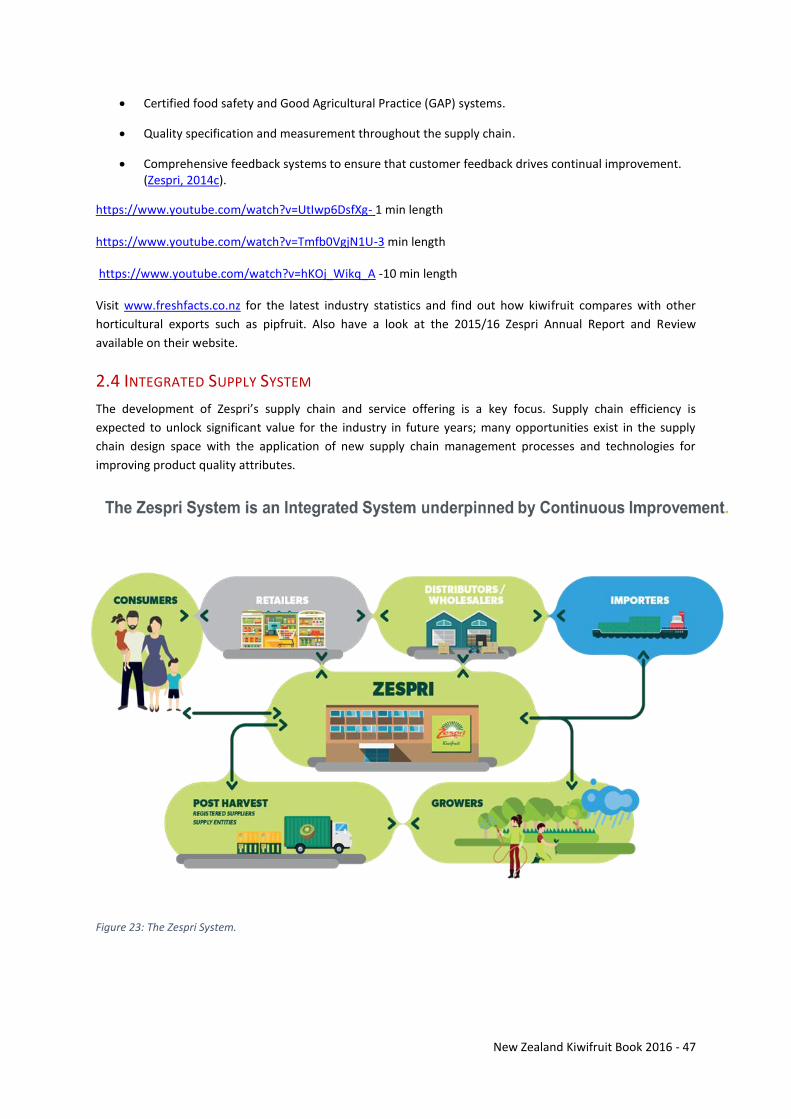
New Zealand Kiwifruit Book 2016 - 47
Certified food safety and Good Agricultural Practice (GAP) systems.
Quality specification and measurement throughout the supply chain.
Comprehensive feedback systems to ensure that customer feedback drives continual improvement. (Zespri, 2014c).
https://www.youtube.com/watch?v=UtIwp6DsfXg- 1 min length
https://www.youtube.com/watch?v=Tmfb0VgjN1U-3 min length
https://www.youtube.com/watch?v=hKOj_Wikq_A -10 min length
Visit www.freshfacts.co.nz for the latest industry statistics and find out how kiwifruit compares with other
horticultural exports such as pipfruit. Also have a look at the 2015/16 Zespri Annual Report and Review
available on their website.
2.4 INTEGRATED SUPPLY SYSTEM
The development of Zespri’s supply chain and service offering is a key focus. Supply chain efficiency is
expected to unlock significant value for the industry in future years; many opportunities exist in the supply
chain design space with the application of new supply chain management processes and technologies for
improving product quality attributes.
Figure 23: The Zespri System.
New Zealand Kiwifruit Book 2016 - 48
2.5 CATEGORY MANAGEMENT
Zespri Global Supply business is a source of Zespri’s competitive advantage and a key part of Zespri’s “category
management” work stream. Non-New Zealand supply is poised for strong growth in the five year planning
horizon, driven predominately by Gold3 recovery in Italy, and ability to procure Zespri Green from Italy to
meet rising global demand.
The strategic focus of ZGS is to consolidate non-NZ supply as a fundamental pillar of Zespri’s competitive
strength, underpinning its position as a leader in the global fruit industry. Zespri’s aim is to unlock value in the
business by leveraging the brand, intellectual property and supply chain expertise.
Zespri currently sources non NZ supply from Italy, France, Japan, and South Korea and is assessing the
capability to supply a premium quality kiwifruit grown in China, and developing supply partnerships to
underpin a sustainable long-term business.
12 Month Supply
12 month supply refers to the procurement and marketing of Northern Hemisphere or early Southern
Hemisphere kiwifruit (when New Zealand fruit is not available in market) to complement the sale of New
Zealand kiwifruit.
12 month supply is an important part of Zespri’s business strategy and a key source of Zespri’s competitive
advantage. Specifically it strengthens Zespri’s New Zealand kiwifruit business by continually building the brand
and strengthening global relationships.
The benefits of Zespri offering 12 month supply in a market are:
1. To partner with our distributors in kiwifruit 12 months of the year and demonstrate consistent quality
and standards, irrespective of origin, to support their strategic objectives and add value to their
businesses.
2. To maintain shelf space 12 months of the year – ideally to be the kiwifruit category manager, by
offering confirmed volumes and quality for the full year, as opposed to seasonal competitors from
other countries who cannot provide such reliability. This allows more flexibility for volumes of New
Zealand kiwifruit to be placed in the best position to maximise returns.
3. To maintain brand presence 12 months of the year such that when New Zealand kiwifruit comes into
markets, it is not fighting for shelf space with earlier seasonal produce or seeking to displace other
produce that is available 12 months of the year.
4. To grow branded products over 12 months rather than just in the New Zealand supply window. This
is critical from a category growth perspective, i.e., apples, tomatoes, and bananas are all available 12
months of the year.
5. In growing regions, having a local presence enables Zespri to better manage the pressures placed on
distributors and retailers to support local product, by supporting the domestic kiwifruit community,
which in most cases are not competitive to Zespri’s New Zealand supply windows; further this enables
Zespri to maintain the quality standards for the category as a whole in that market.
In addition there are other benefits to the New Zealand grower as well outside of the market benefits, such as:
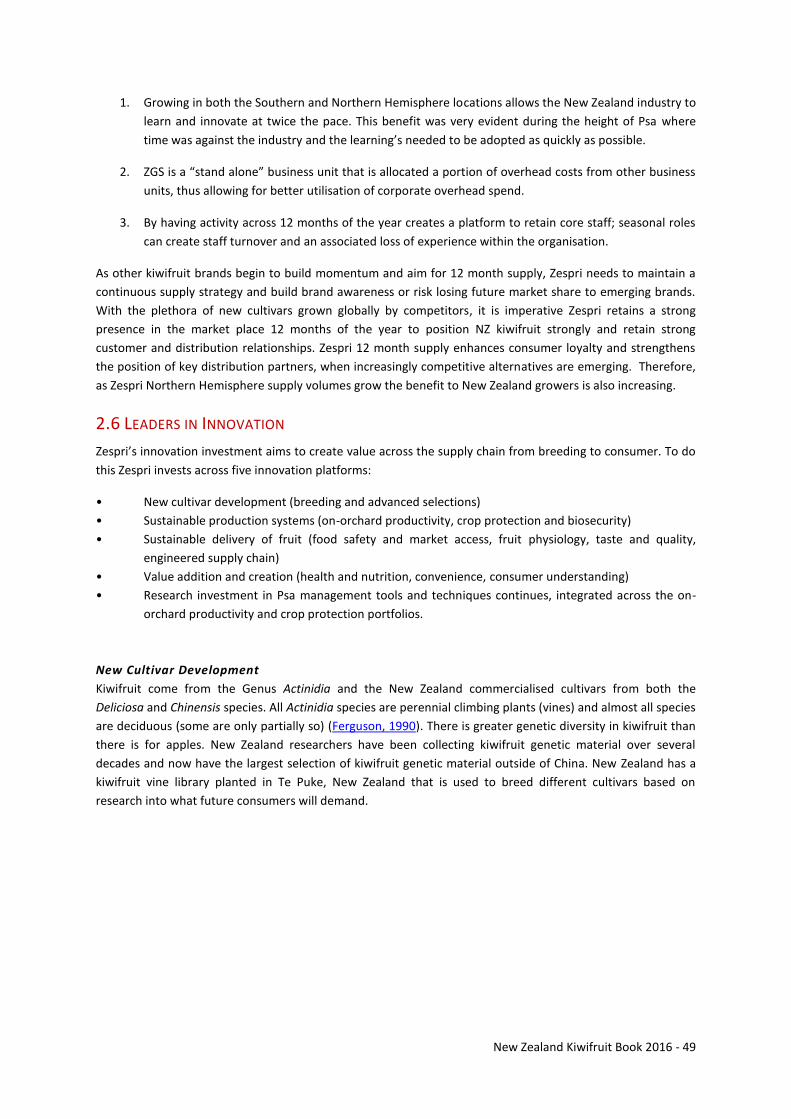
New Zealand Kiwifruit Book 2016 - 49
1. Growing in both the Southern and Northern Hemisphere locations allows the New Zealand industry to
learn and innovate at twice the pace. This benefit was very evident during the height of Psa where
time was against the industry and the learning’s needed to be adopted as quickly as possible.
2. ZGS is a “stand alone” business unit that is allocated a portion of overhead costs from other business
units, thus allowing for better utilisation of corporate overhead spend.
3. By having activity across 12 months of the year creates a platform to retain core staff; seasonal roles
can create staff turnover and an associated loss of experience within the organisation.
As other kiwifruit brands begin to build momentum and aim for 12 month supply, Zespri needs to maintain a
continuous supply strategy and build brand awareness or risk losing future market share to emerging brands.
With the plethora of new cultivars grown globally by competitors, it is imperative Zespri retains a strong
presence in the market place 12 months of the year to position NZ kiwifruit strongly and retain strong
customer and distribution relationships. Zespri 12 month supply enhances consumer loyalty and strengthens
the position of key distribution partners, when increasingly competitive alternatives are emerging. Therefore,
as Zespri Northern Hemisphere supply volumes grow the benefit to New Zealand growers is also increasing.
2.6 LEADERS IN INNOVATION
Zespri’s innovation investment aims to create value across the supply chain from breeding to consumer. To do
this Zespri invests across five innovation platforms:
• New cultivar development (breeding and advanced selections)
• Sustainable production systems (on-orchard productivity, crop protection and biosecurity)
• Sustainable delivery of fruit (food safety and market access, fruit physiology, taste and quality,
engineered supply chain)
• Value addition and creation (health and nutrition, convenience, consumer understanding)
• Research investment in Psa management tools and techniques continues, integrated across the on-
orchard productivity and crop protection portfolios.
New Cultivar Development
Kiwifruit come from the Genus Actinidia and the New Zealand commercialised cultivars from both the
Deliciosa and Chinensis species. All Actinidia species are perennial climbing plants (vines) and almost all species
are deciduous (some are only partially so) (Ferguson, 1990). There is greater genetic diversity in kiwifruit than
there is for apples. New Zealand researchers have been collecting kiwifruit genetic material over several
decades and now have the largest selection of kiwifruit genetic material outside of China. New Zealand has a
kiwifruit vine library planted in Te Puke, New Zealand that is used to breed different cultivars based on
research into what future consumers will demand.
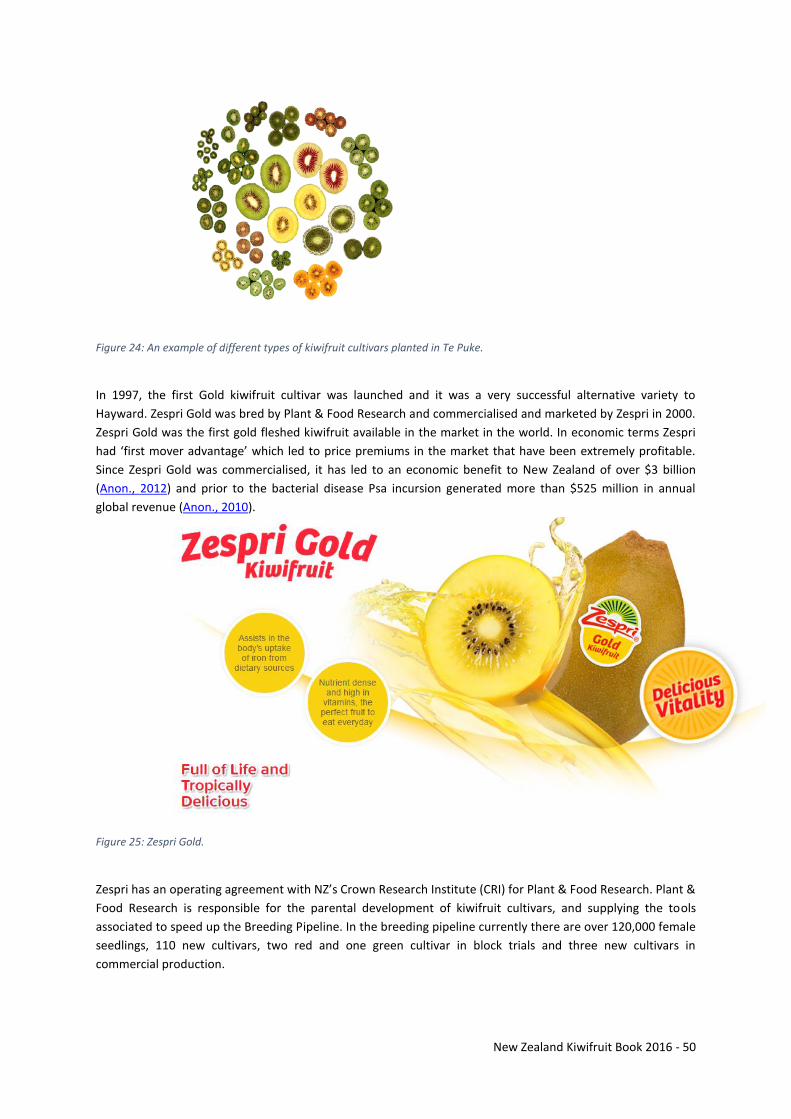
New Zealand Kiwifruit Book 2016 - 50
Figure 24: An example of different types of kiwifruit cultivars planted in Te Puke.
In 1997, the first Gold kiwifruit cultivar was launched and it was a very successful alternative variety to
Hayward. Zespri Gold was bred by Plant & Food Research and commercialised and marketed by Zespri in 2000.
Zespri Gold was the first gold fleshed kiwifruit available in the market in the world. In economic terms Zespri
had ‘first mover advantage’ which led to price premiums in the market that have been extremely profitable.
Since Zespri Gold was commercialised, it has led to an economic benefit to New Zealand of over $3 billion
(Anon., 2012) and prior to the bacterial disease Psa incursion generated more than $525 million in annual
global revenue (Anon., 2010).
Figure 25: Zespri Gold.
Zespri has an operating agreement with NZ’s Crown Research Institute (CRI) for Plant & Food Research. Plant &
Food Research is responsible for the parental development of kiwifruit cultivars, and supplying the tools
associated to speed up the Breeding Pipeline. In the breeding pipeline currently there are over 120,000 female
seedlings, 110 new cultivars, two red and one green cultivar in block trials and three new cultivars in
commercial production.
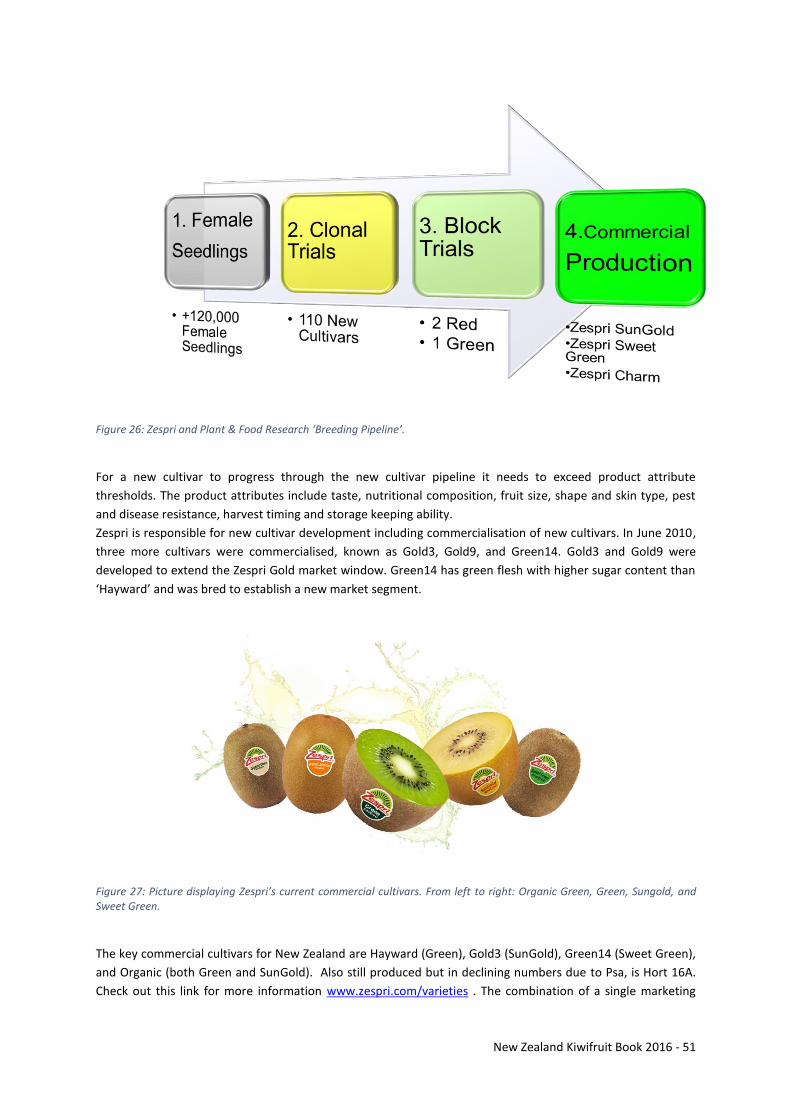
New Zealand Kiwifruit Book 2016 - 51
Figure 26: Zespri and Plant & Food Research ‘Breeding Pipeline’.
For a new cultivar to progress through the new cultivar pipeline it needs to exceed product attribute
thresholds. The product attributes include taste, nutritional composition, fruit size, shape and skin type, pest
and disease resistance, harvest timing and storage keeping ability.
Zespri is responsible for new cultivar development including commercialisation of new cultivars. In June 2010,
three more cultivars were commercialised, known as Gold3, Gold9, and Green14. Gold3 and Gold9 were
developed to extend the Zespri Gold market window. Green14 has green flesh with higher sugar content than
‘Hayward’ and was bred to establish a new market segment.
Figure 27: Picture displaying Zespri’s current commercial cultivars. From left to right: Organic Green, Green, Sungold, and Sweet Green.
The key commercial cultivars for New Zealand are Hayward (Green), Gold3 (SunGold), Green14 (Sweet Green),
and Organic (both Green and SunGold). Also still produced but in declining numbers due to Psa, is Hort 16A.
Check out this link for more information www.zespri.com/varieties . The combination of a single marketing
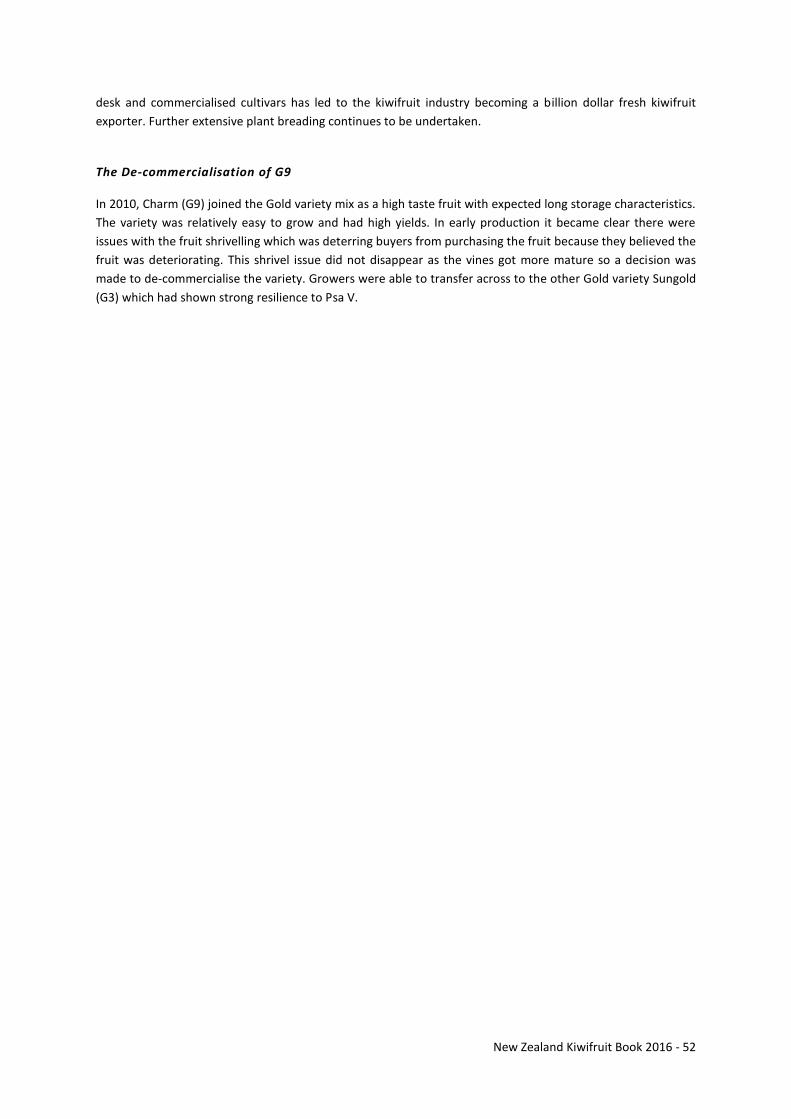
New Zealand Kiwifruit Book 2016 - 52
desk and commercialised cultivars has led to the kiwifruit industry becoming a billion dollar fresh kiwifruit
exporter. Further extensive plant breading continues to be undertaken.
The De-commercialisation of G9
In 2010, Charm (G9) joined the Gold variety mix as a high taste fruit with expected long storage characteristics.
The variety was relatively easy to grow and had high yields. In early production it became clear there were
issues with the fruit shrivelling which was deterring buyers from purchasing the fruit because they believed the
fruit was deteriorating. This shrivel issue did not disappear as the vines got more mature so a decision was
made to de-commercialise the variety. Growers were able to transfer across to the other Gold variety Sungold
(G3) which had shown strong resilience to Psa V.
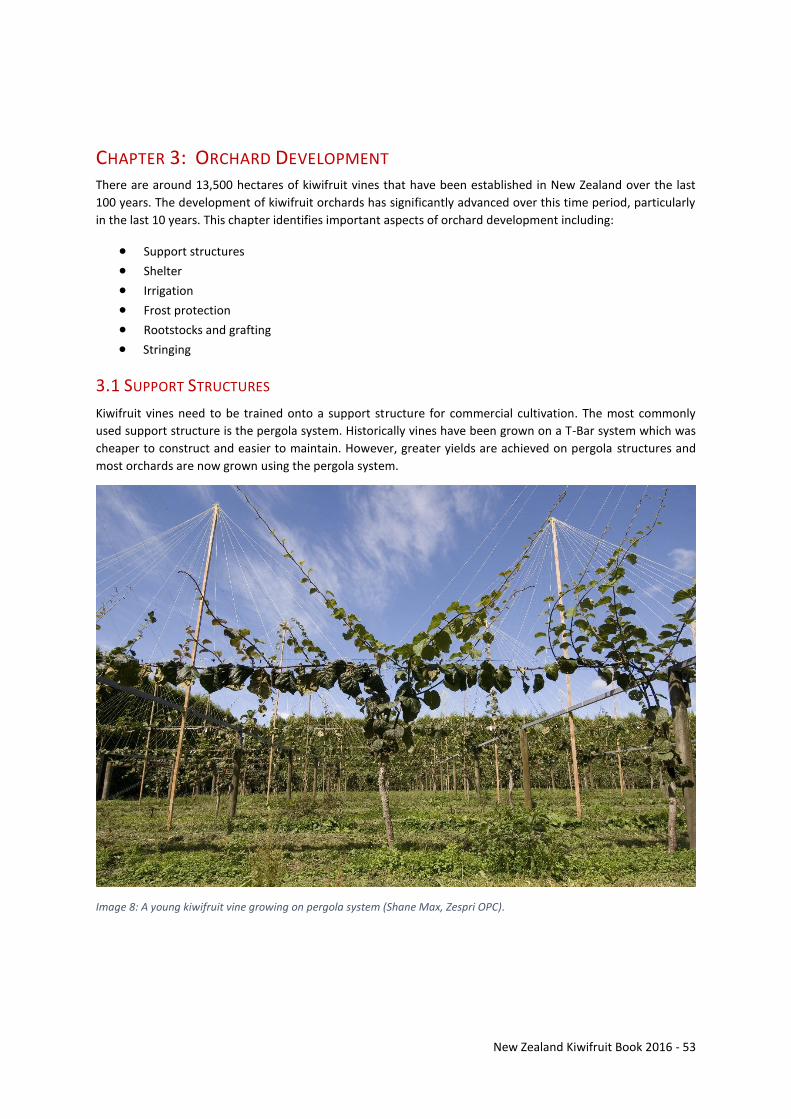
New Zealand Kiwifruit Book 2016 - 53
CHAPTER 3: ORCHARD DEVELOPMENT There are around 13,500 hectares of kiwifruit vines that have been established in New Zealand over the last
100 years. The development of kiwifruit orchards has significantly advanced over this time period, particularly
in the last 10 years. This chapter identifies important aspects of orchard development including:
Support structures
Shelter
Irrigation
Frost protection
Rootstocks and grafting
Stringing
3.1 SUPPORT STRUCTURES
Kiwifruit vines need to be trained onto a support structure for commercial cultivation. The most commonly
used support structure is the pergola system. Historically vines have been grown on a T-Bar system which was
cheaper to construct and easier to maintain. However, greater yields are achieved on pergola structures and
most orchards are now grown using the pergola system.
Image 8: A young kiwifruit vine growing on pergola system (Shane Max, Zespri OPC).
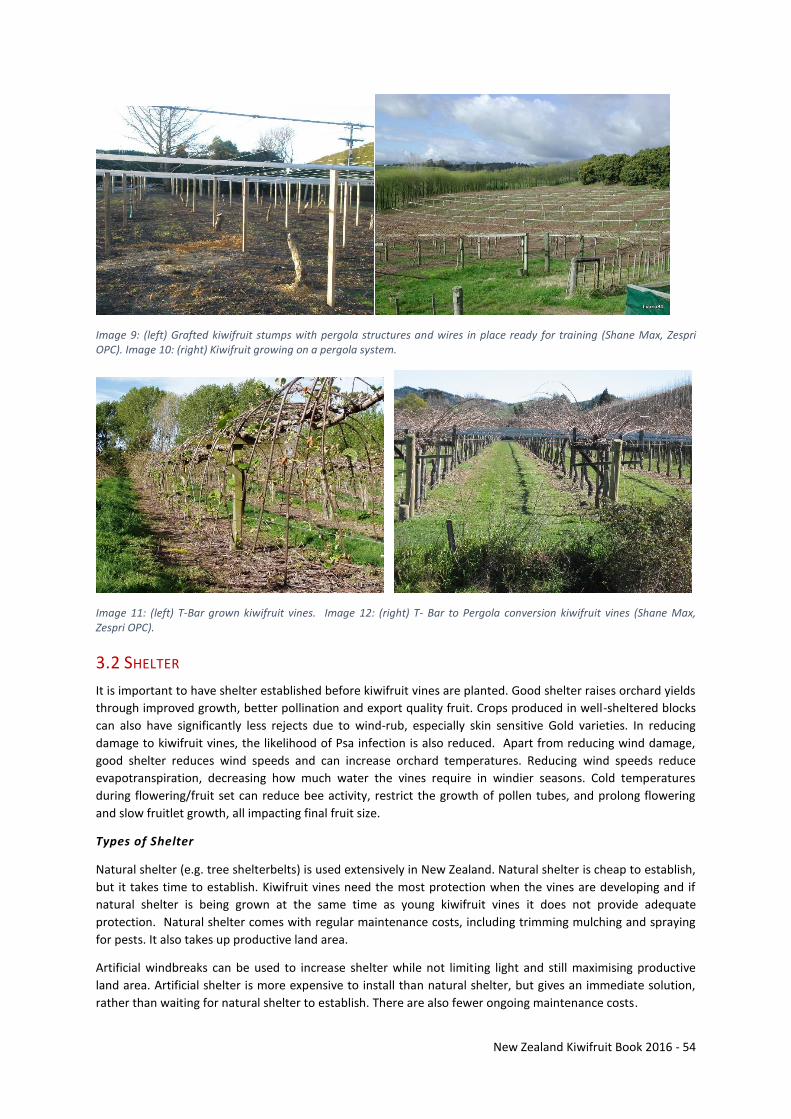
New Zealand Kiwifruit Book 2016 - 54
Image 9: (left) Grafted kiwifruit stumps with pergola structures and wires in place ready for training (Shane Max, Zespri OPC). Image 10: (right) Kiwifruit growing on a pergola system.
Image 11: (left) T-Bar grown kiwifruit vines. Image 12: (right) T- Bar to Pergola conversion kiwifruit vines (Shane Max, Zespri OPC).
3.2 SHELTER
It is important to have shelter established before kiwifruit vines are planted. Good shelter raises orchard yields
through improved growth, better pollination and export quality fruit. Crops produced in well-sheltered blocks
can also have significantly less rejects due to wind-rub, especially skin sensitive Gold varieties. In reducing
damage to kiwifruit vines, the likelihood of Psa infection is also reduced. Apart from reducing wind damage,
good shelter reduces wind speeds and can increase orchard temperatures. Reducing wind speeds reduce
evapotranspiration, decreasing how much water the vines require in windier seasons. Cold temperatures
during flowering/fruit set can reduce bee activity, restrict the growth of pollen tubes, and prolong flowering
and slow fruitlet growth, all impacting final fruit size.
Types of Shelter
Natural shelter (e.g. tree shelterbelts) is used extensively in New Zealand. Natural shelter is cheap to establish,
but it takes time to establish. Kiwifruit vines need the most protection when the vines are developing and if
natural shelter is being grown at the same time as young kiwifruit vines it does not provide adequate
protection. Natural shelter comes with regular maintenance costs, including trimming mulching and spraying
for pests. It also takes up productive land area.
Artificial windbreaks can be used to increase shelter while not limiting light and still maximising productive
land area. Artificial shelter is more expensive to install than natural shelter, but gives an immediate solution,
rather than waiting for natural shelter to establish. There are also fewer ongoing maintenance costs.
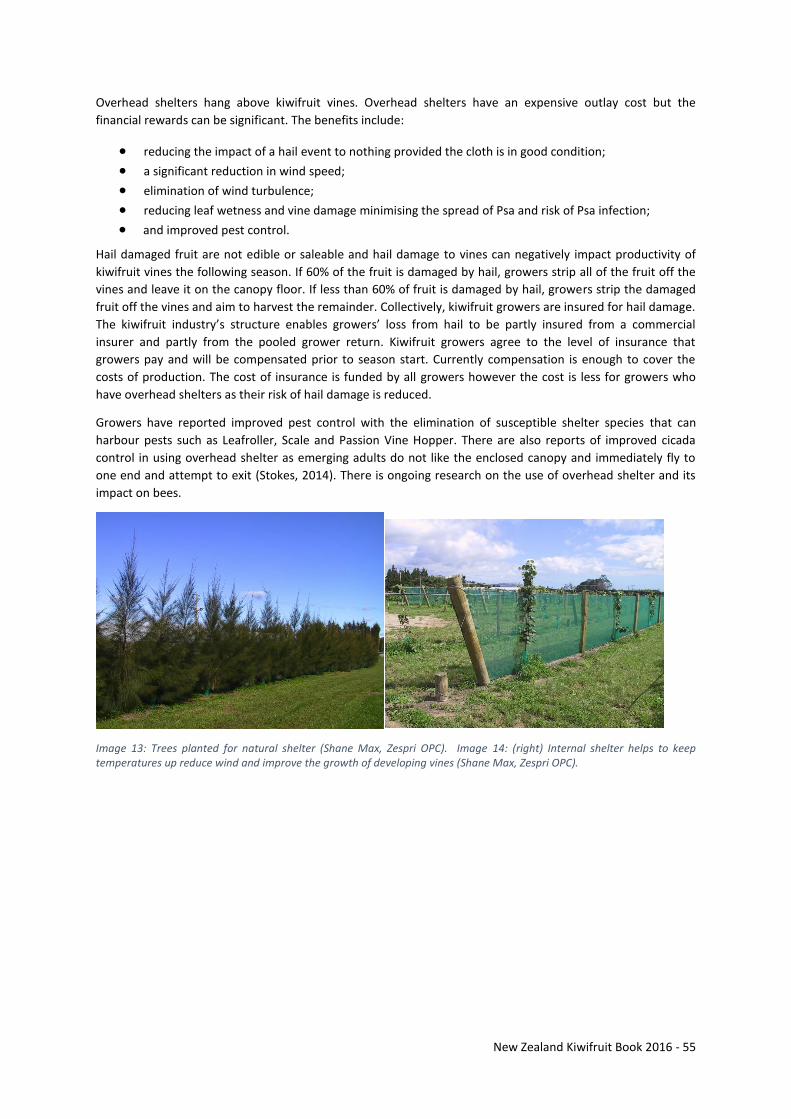
New Zealand Kiwifruit Book 2016 - 55
Overhead shelters hang above kiwifruit vines. Overhead shelters have an expensive outlay cost but the
financial rewards can be significant. The benefits include:
reducing the impact of a hail event to nothing provided the cloth is in good condition;
a significant reduction in wind speed;
elimination of wind turbulence;
reducing leaf wetness and vine damage minimising the spread of Psa and risk of Psa infection;
and improved pest control.
Hail damaged fruit are not edible or saleable and hail damage to vines can negatively impact productivity of
kiwifruit vines the following season. If 60% of the fruit is damaged by hail, growers strip all of the fruit off the
vines and leave it on the canopy floor. If less than 60% of fruit is damaged by hail, growers strip the damaged
fruit off the vines and aim to harvest the remainder. Collectively, kiwifruit growers are insured for hail damage.
The kiwifruit industry’s structure enables growers’ loss from hail to be partly insured from a commercial
insurer and partly from the pooled grower return. Kiwifruit growers agree to the level of insurance that
growers pay and will be compensated prior to season start. Currently compensation is enough to cover the
costs of production. The cost of insurance is funded by all growers however the cost is less for growers who
have overhead shelters as their risk of hail damage is reduced.
Growers have reported improved pest control with the elimination of susceptible shelter species that can
harbour pests such as Leafroller, Scale and Passion Vine Hopper. There are also reports of improved cicada
control in using overhead shelter as emerging adults do not like the enclosed canopy and immediately fly to
one end and attempt to exit (Stokes, 2014). There is ongoing research on the use of overhead shelter and its
impact on bees.
Image 13: Trees planted for natural shelter (Shane Max, Zespri OPC). Image 14: (right) Internal shelter helps to keep temperatures up reduce wind and improve the growth of developing vines (Shane Max, Zespri OPC).
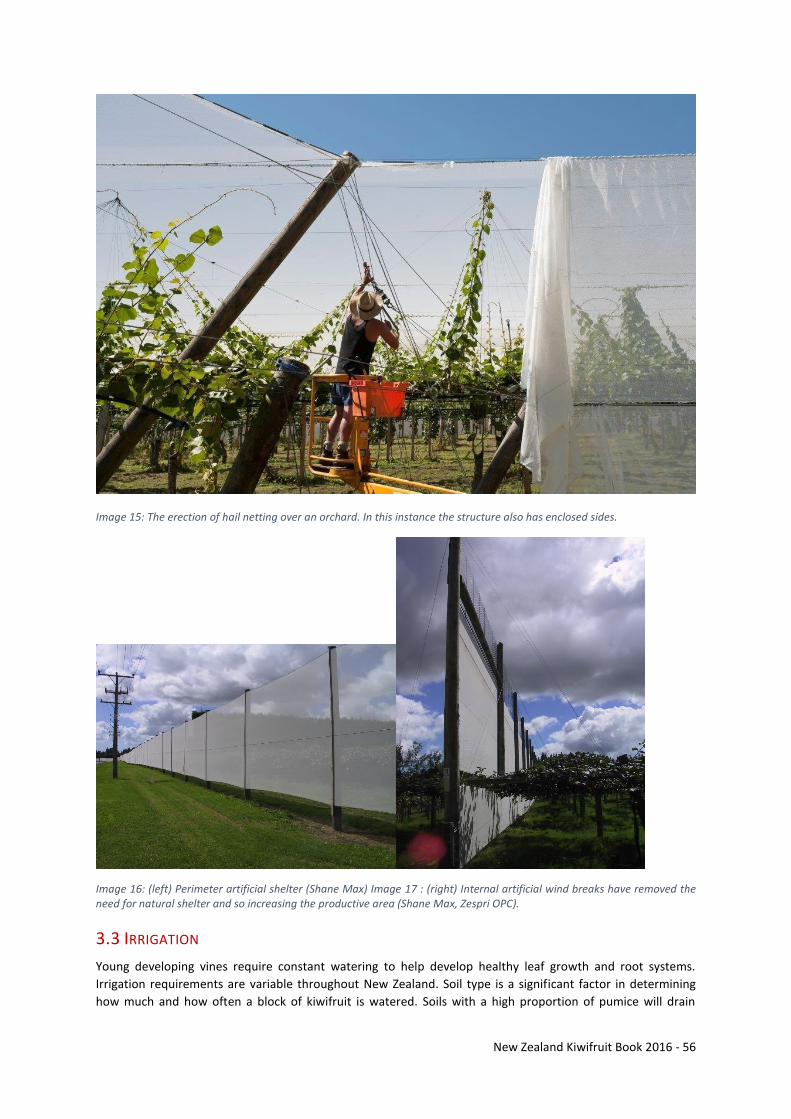
New Zealand Kiwifruit Book 2016 - 56
Image 15: The erection of hail netting over an orchard. In this instance the structure also has enclosed sides.
Image 16: (left) Perimeter artificial shelter (Shane Max) Image 17 : (right) Internal artificial wind breaks have removed the need for natural shelter and so increasing the productive area (Shane Max, Zespri OPC).
3.3 IRRIGATION
Young developing vines require constant watering to help develop healthy leaf growth and root systems.
Irrigation requirements are variable throughout New Zealand. Soil type is a significant factor in determining
how much and how often a block of kiwifruit is watered. Soils with a high proportion of pumice will drain
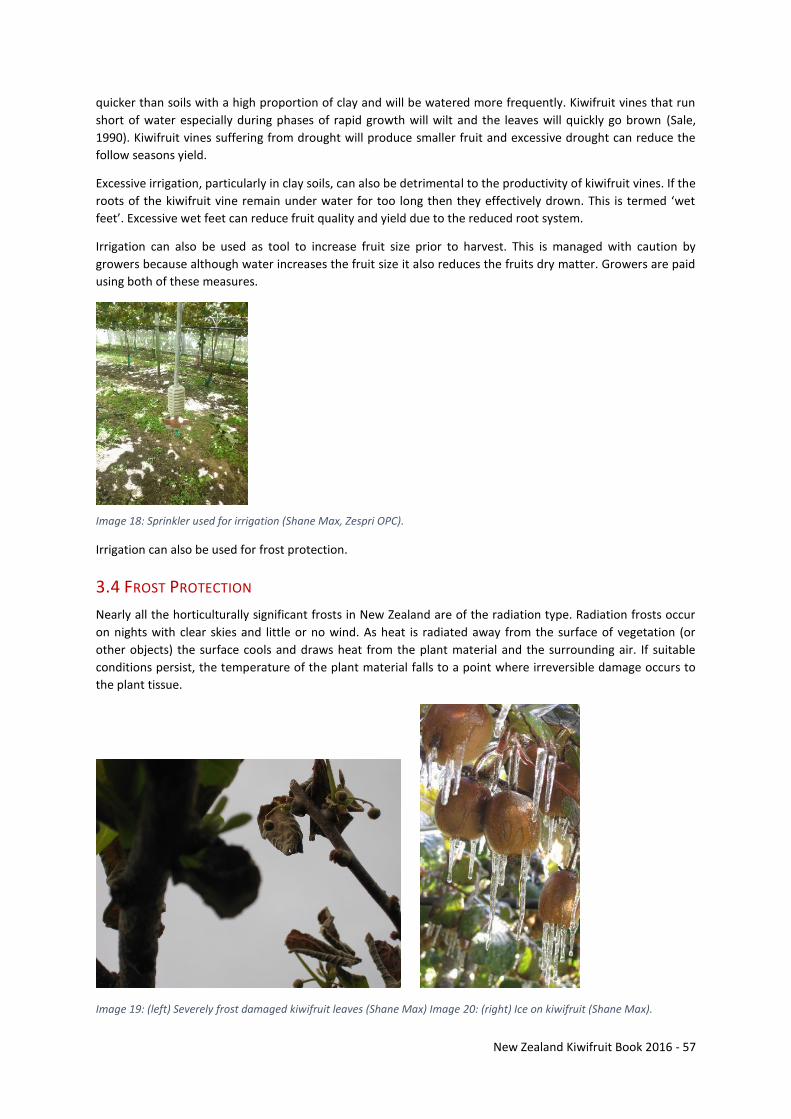
New Zealand Kiwifruit Book 2016 - 57
quicker than soils with a high proportion of clay and will be watered more frequently. Kiwifruit vines that run
short of water especially during phases of rapid growth will wilt and the leaves will quickly go brown (Sale,
1990). Kiwifruit vines suffering from drought will produce smaller fruit and excessive drought can reduce the
follow seasons yield.
Excessive irrigation, particularly in clay soils, can also be detrimental to the productivity of kiwifruit vines. If the
roots of the kiwifruit vine remain under water for too long then they effectively drown. This is termed ‘wet
feet’. Excessive wet feet can reduce fruit quality and yield due to the reduced root system.
Irrigation can also be used as tool to increase fruit size prior to harvest. This is managed with caution by
growers because although water increases the fruit size it also reduces the fruits dry matter. Growers are paid
using both of these measures.
Image 18: Sprinkler used for irrigation (Shane Max, Zespri OPC).
Irrigation can also be used for frost protection.
3.4 FROST PROTECTION
Nearly all the horticulturally significant frosts in New Zealand are of the radiation type. Radiation frosts occur
on nights with clear skies and little or no wind. As heat is radiated away from the surface of vegetation (or
other objects) the surface cools and draws heat from the plant material and the surrounding air. If suitable
conditions persist, the temperature of the plant material falls to a point where irreversible damage occurs to
the plant tissue.
Image 19: (left) Severely frost damaged kiwifruit leaves (Shane Max) Image 20: (right) Ice on kiwifruit (Shane Max).
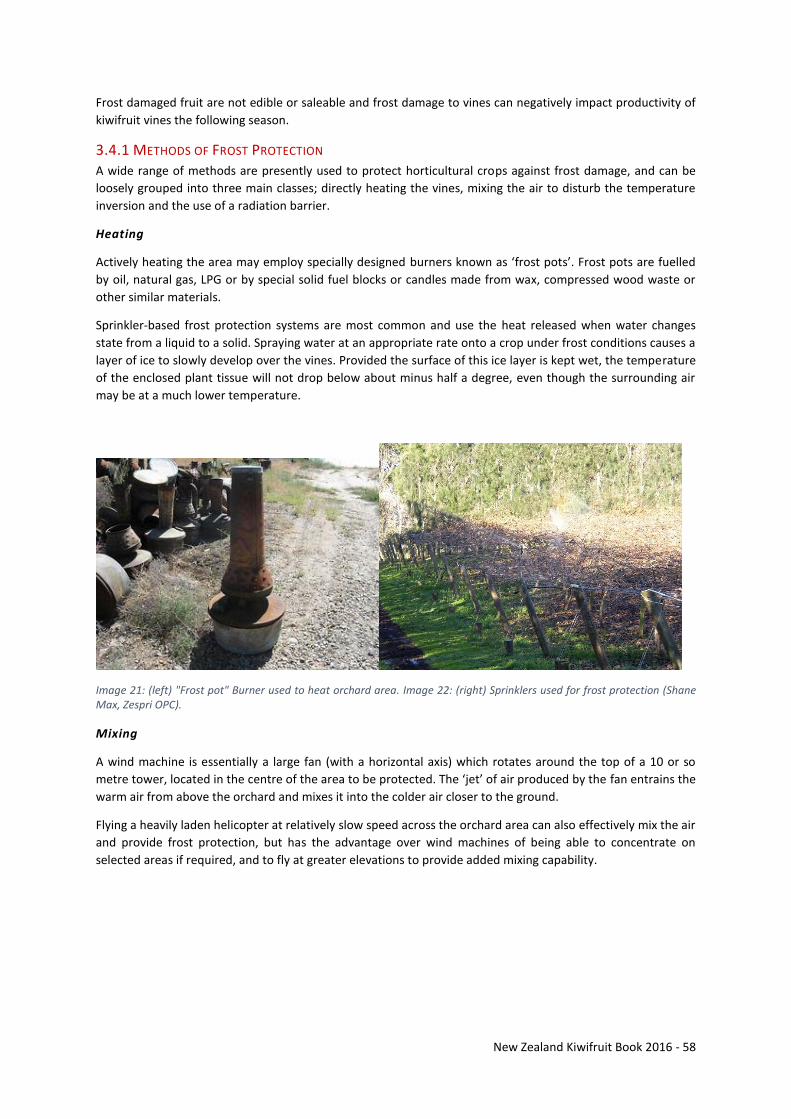
New Zealand Kiwifruit Book 2016 - 58
Frost damaged fruit are not edible or saleable and frost damage to vines can negatively impact productivity of
kiwifruit vines the following season.
3.4.1 METHODS OF FROST PROTECTION A wide range of methods are presently used to protect horticultural crops against frost damage, and can be
loosely grouped into three main classes; directly heating the vines, mixing the air to disturb the temperature
inversion and the use of a radiation barrier.
Heating
Actively heating the area may employ specially designed burners known as ‘frost pots’. Frost pots are fuelled
by oil, natural gas, LPG or by special solid fuel blocks or candles made from wax, compressed wood waste or
other similar materials.
Sprinkler-based frost protection systems are most common and use the heat released when water changes
state from a liquid to a solid. Spraying water at an appropriate rate onto a crop under frost conditions causes a
layer of ice to slowly develop over the vines. Provided the surface of this ice layer is kept wet, the temperature
of the enclosed plant tissue will not drop below about minus half a degree, even though the surrounding air
may be at a much lower temperature.
Image 21: (left) "Frost pot" Burner used to heat orchard area. Image 22: (right) Sprinklers used for frost protection (Shane Max, Zespri OPC).
Mixing
A wind machine is essentially a large fan (with a horizontal axis) which rotates around the top of a 10 or so
metre tower, located in the centre of the area to be protected. The ‘jet’ of air produced by the fan entrains the
warm air from above the orchard and mixes it into the colder air closer to the ground.
Flying a heavily laden helicopter at relatively slow speed across the orchard area can also effectively mix the air
and provide frost protection, but has the advantage over wind machines of being able to concentrate on
selected areas if required, and to fly at greater elevations to provide added mixing capability.
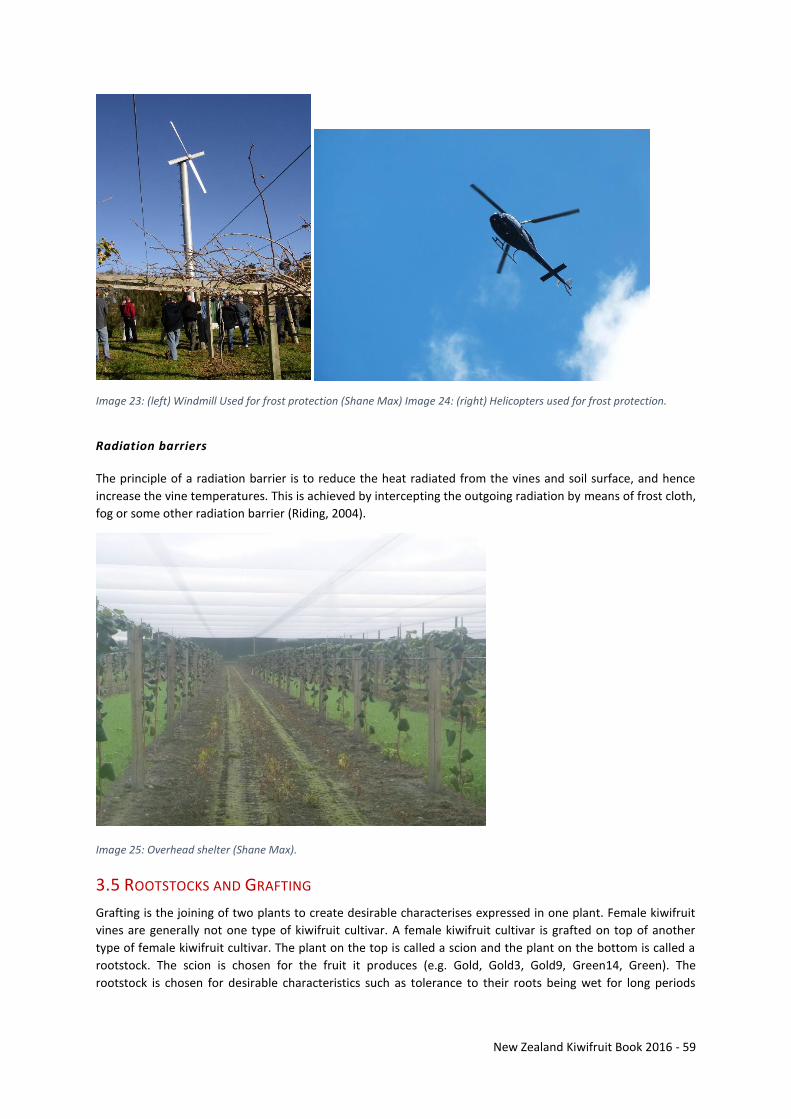
New Zealand Kiwifruit Book 2016 - 59
Image 23: (left) Windmill Used for frost protection (Shane Max) Image 24: (right) Helicopters used for frost protection.
Radiation barriers The principle of a radiation barrier is to reduce the heat radiated from the vines and soil surface, and hence
increase the vine temperatures. This is achieved by intercepting the outgoing radiation by means of frost cloth,
fog or some other radiation barrier (Riding, 2004).
Image 25: Overhead shelter (Shane Max).
3.5 ROOTSTOCKS AND GRAFTING
Grafting is the joining of two plants to create desirable characterises expressed in one plant. Female kiwifruit
vines are generally not one type of kiwifruit cultivar. A female kiwifruit cultivar is grafted on top of another
type of female kiwifruit cultivar. The plant on the top is called a scion and the plant on the bottom is called a
rootstock. The scion is chosen for the fruit it produces (e.g. Gold, Gold3, Gold9, Green14, Green). The
rootstock is chosen for desirable characteristics such as tolerance to their roots being wet for long periods
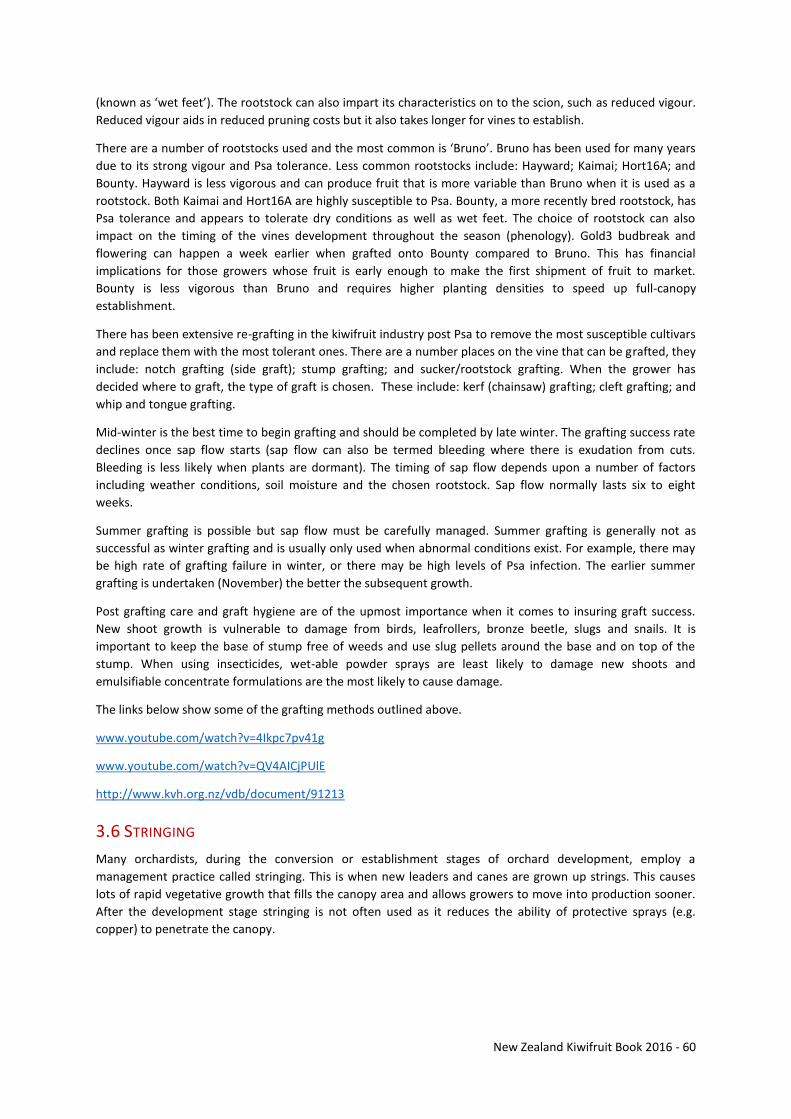
New Zealand Kiwifruit Book 2016 - 60
(known as ‘wet feet’). The rootstock can also impart its characteristics on to the scion, such as reduced vigour.
Reduced vigour aids in reduced pruning costs but it also takes longer for vines to establish.
There are a number of rootstocks used and the most common is ‘Bruno’. Bruno has been used for many years
due to its strong vigour and Psa tolerance. Less common rootstocks include: Hayward; Kaimai; Hort16A; and
Bounty. Hayward is less vigorous and can produce fruit that is more variable than Bruno when it is used as a
rootstock. Both Kaimai and Hort16A are highly susceptible to Psa. Bounty, a more recently bred rootstock, has
Psa tolerance and appears to tolerate dry conditions as well as wet feet. The choice of rootstock can also
impact on the timing of the vines development throughout the season (phenology). Gold3 budbreak and
flowering can happen a week earlier when grafted onto Bounty compared to Bruno. This has financial
implications for those growers whose fruit is early enough to make the first shipment of fruit to market.
Bounty is less vigorous than Bruno and requires higher planting densities to speed up full-canopy
establishment.
There has been extensive re-grafting in the kiwifruit industry post Psa to remove the most susceptible cultivars
and replace them with the most tolerant ones. There are a number places on the vine that can be grafted, they
include: notch grafting (side graft); stump grafting; and sucker/rootstock grafting. When the grower has
decided where to graft, the type of graft is chosen. These include: kerf (chainsaw) grafting; cleft grafting; and
whip and tongue grafting.
Mid-winter is the best time to begin grafting and should be completed by late winter. The grafting success rate
declines once sap flow starts (sap flow can also be termed bleeding where there is exudation from cuts.
Bleeding is less likely when plants are dormant). The timing of sap flow depends upon a number of factors
including weather conditions, soil moisture and the chosen rootstock. Sap flow normally lasts six to eight
weeks.
Summer grafting is possible but sap flow must be carefully managed. Summer grafting is generally not as
successful as winter grafting and is usually only used when abnormal conditions exist. For example, there may
be high rate of grafting failure in winter, or there may be high levels of Psa infection. The earlier summer
grafting is undertaken (November) the better the subsequent growth.
Post grafting care and graft hygiene are of the upmost importance when it comes to insuring graft success.
New shoot growth is vulnerable to damage from birds, leafrollers, bronze beetle, slugs and snails. It is
important to keep the base of stump free of weeds and use slug pellets around the base and on top of the
stump. When using insecticides, wet-able powder sprays are least likely to damage new shoots and
emulsifiable concentrate formulations are the most likely to cause damage.
The links below show some of the grafting methods outlined above.
www.youtube.com/watch?v=4Ikpc7pv41g
www.youtube.com/watch?v=QV4AICjPUlE
http://www.kvh.org.nz/vdb/document/91213
3.6 STRINGING
Many orchardists, during the conversion or establishment stages of orchard development, employ a
management practice called stringing. This is when new leaders and canes are grown up strings. This causes
lots of rapid vegetative growth that fills the canopy area and allows growers to move into production sooner.
After the development stage stringing is not often used as it reduces the ability of protective sprays (e.g.
copper) to penetrate the canopy.
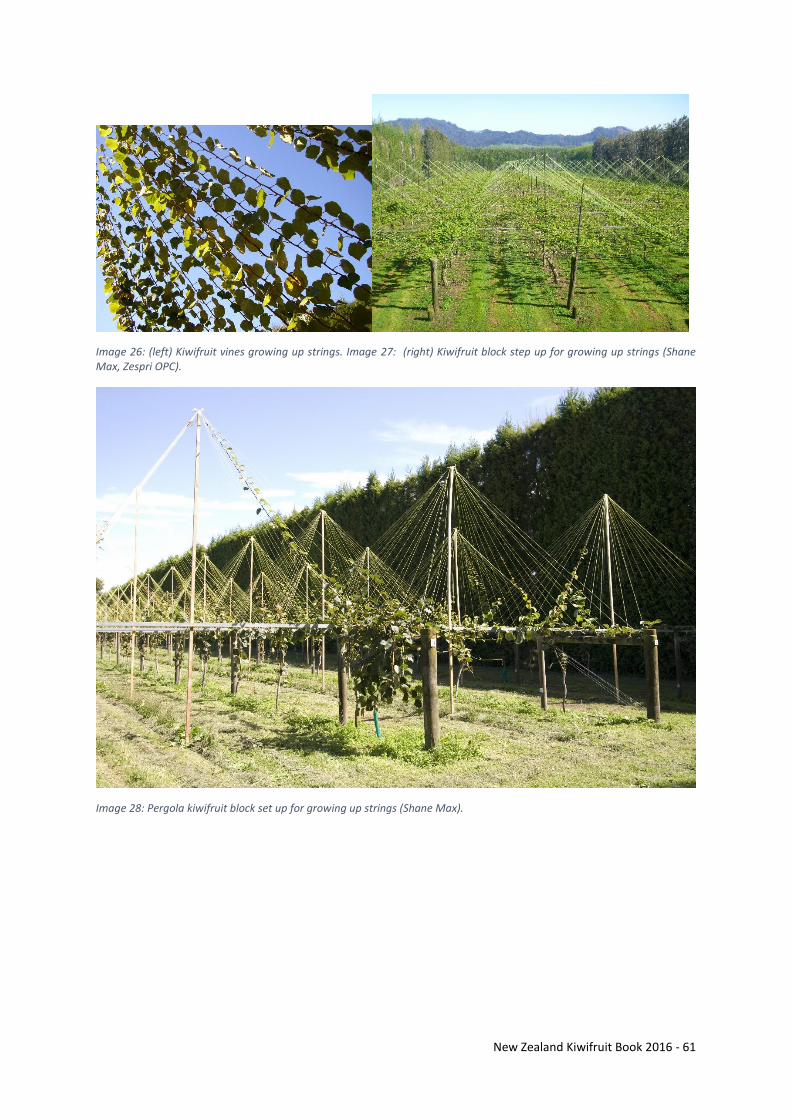
New Zealand Kiwifruit Book 2016 - 61
Image 26: (left) Kiwifruit vines growing up strings. Image 27: (right) Kiwifruit block step up for growing up strings (Shane Max, Zespri OPC).
Image 28: Pergola kiwifruit block set up for growing up strings (Shane Max).
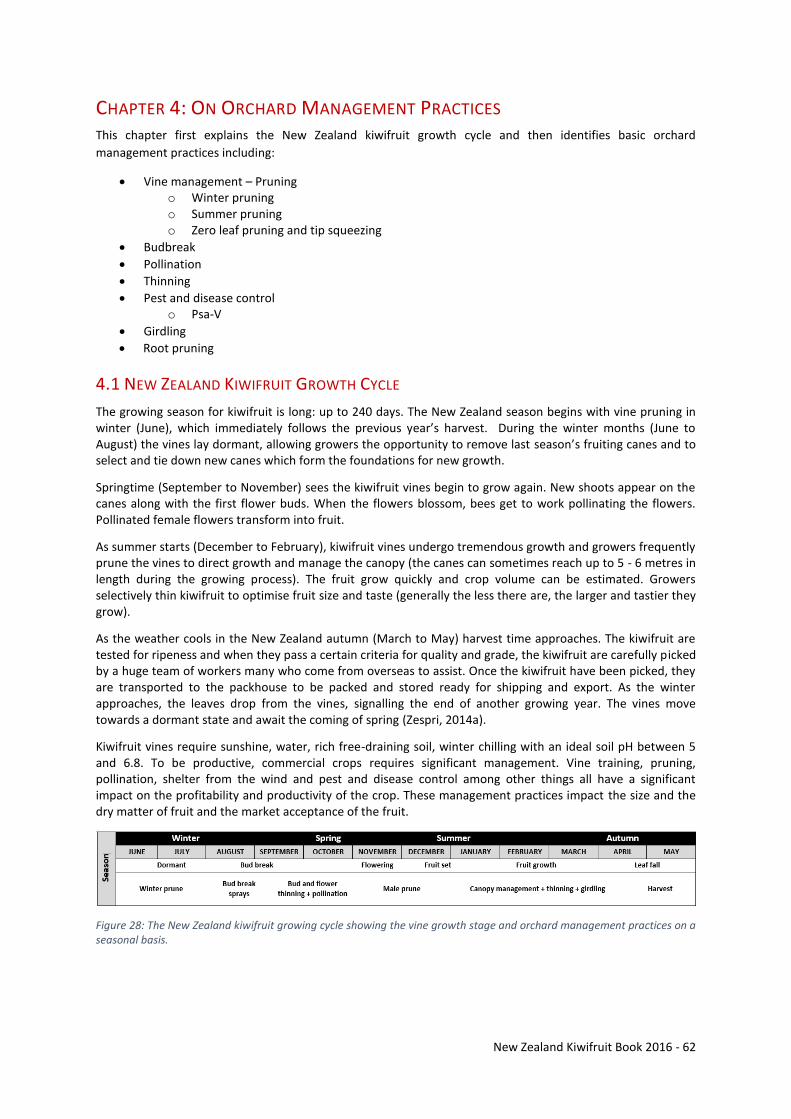
New Zealand Kiwifruit Book 2016 - 62
CHAPTER 4: ON ORCHARD MANAGEMENT PRACTICES This chapter first explains the New Zealand kiwifruit growth cycle and then identifies basic orchard
management practices including:
Vine management – Pruning o Winter pruning o Summer pruning o Zero leaf pruning and tip squeezing
Budbreak
Pollination
Thinning
Pest and disease control o Psa-V
Girdling
Root pruning
4.1 NEW ZEALAND KIWIFRUIT GROWTH CYCLE
The growing season for kiwifruit is long: up to 240 days. The New Zealand season begins with vine pruning in winter (June), which immediately follows the previous year’s harvest. During the winter months (June to August) the vines lay dormant, allowing growers the opportunity to remove last season’s fruiting canes and to select and tie down new canes which form the foundations for new growth.
Springtime (September to November) sees the kiwifruit vines begin to grow again. New shoots appear on the canes along with the first flower buds. When the flowers blossom, bees get to work pollinating the flowers. Pollinated female flowers transform into fruit.
As summer starts (December to February), kiwifruit vines undergo tremendous growth and growers frequently prune the vines to direct growth and manage the canopy (the canes can sometimes reach up to 5 - 6 metres in length during the growing process). The fruit grow quickly and crop volume can be estimated. Growers selectively thin kiwifruit to optimise fruit size and taste (generally the less there are, the larger and tastier they grow).
As the weather cools in the New Zealand autumn (March to May) harvest time approaches. The kiwifruit are tested for ripeness and when they pass a certain criteria for quality and grade, the kiwifruit are carefully picked by a huge team of workers many who come from overseas to assist. Once the kiwifruit have been picked, they are transported to the packhouse to be packed and stored ready for shipping and export. As the winter approaches, the leaves drop from the vines, signalling the end of another growing year. The vines move towards a dormant state and await the coming of spring (Zespri, 2014a).
Kiwifruit vines require sunshine, water, rich free-draining soil, winter chilling with an ideal soil pH between 5 and 6.8. To be productive, commercial crops requires significant management. Vine training, pruning, pollination, shelter from the wind and pest and disease control among other things all have a significant impact on the profitability and productivity of the crop. These management practices impact the size and the dry matter of fruit and the market acceptance of the fruit.
Figure 28: The New Zealand kiwifruit growing cycle showing the vine growth stage and orchard management practices on a seasonal basis.
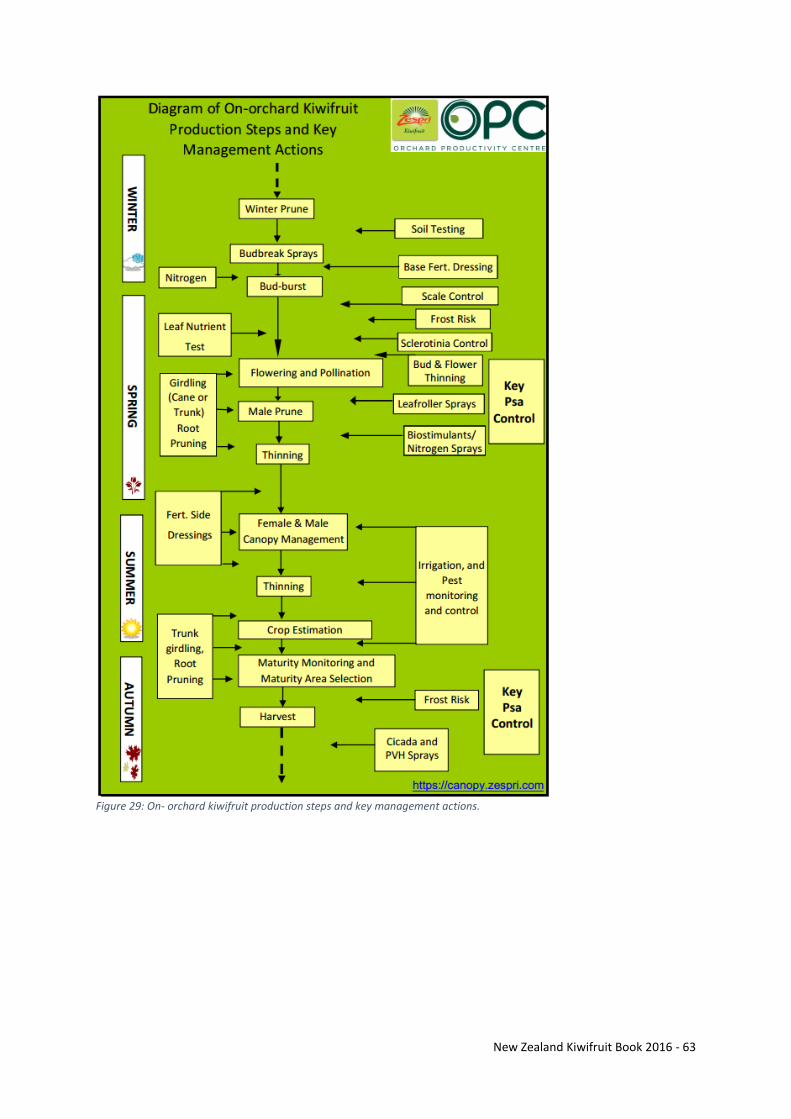
New Zealand Kiwifruit Book 2016 - 63
Figure 29: On- orchard kiwifruit production steps and key management actions.
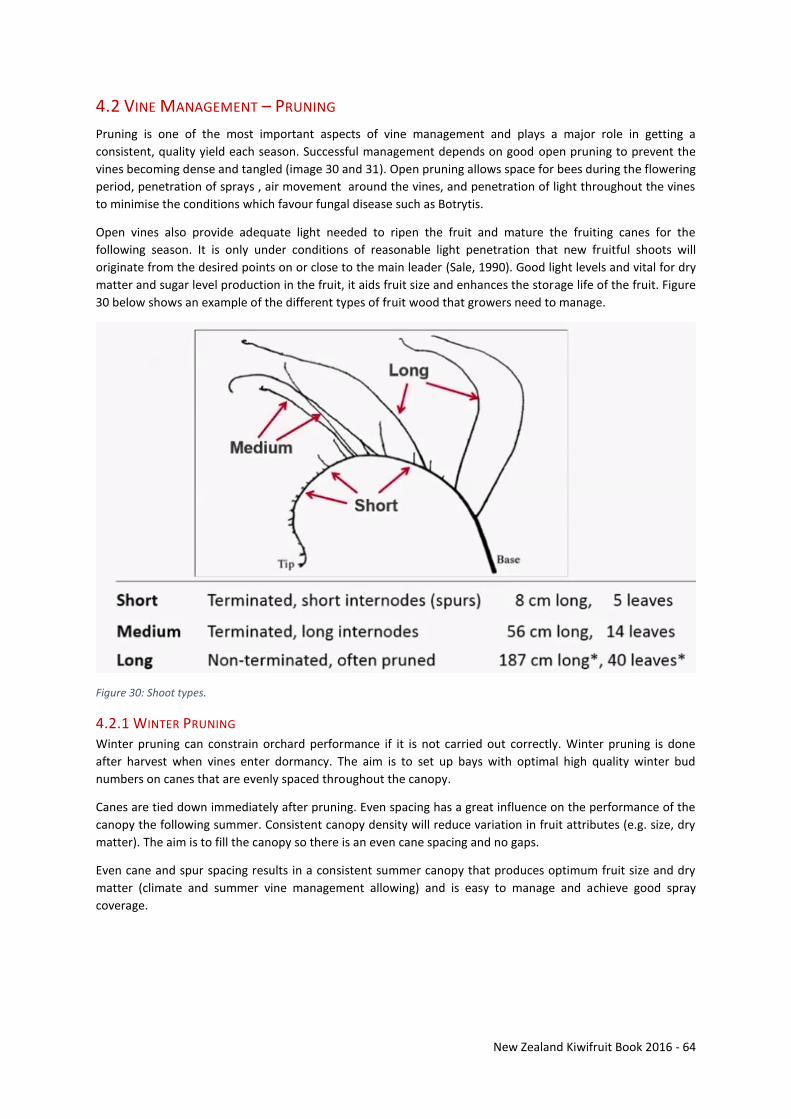
New Zealand Kiwifruit Book 2016 - 64
4.2 VINE MANAGEMENT – PRUNING
Pruning is one of the most important aspects of vine management and plays a major role in getting a
consistent, quality yield each season. Successful management depends on good open pruning to prevent the
vines becoming dense and tangled (image 30 and 31). Open pruning allows space for bees during the flowering
period, penetration of sprays , air movement around the vines, and penetration of light throughout the vines
to minimise the conditions which favour fungal disease such as Botrytis.
Open vines also provide adequate light needed to ripen the fruit and mature the fruiting canes for the
following season. It is only under conditions of reasonable light penetration that new fruitful shoots will
originate from the desired points on or close to the main leader (Sale, 1990). Good light levels and vital for dry
matter and sugar level production in the fruit, it aids fruit size and enhances the storage life of the fruit. Figure
30 below shows an example of the different types of fruit wood that growers need to manage.
Figure 30: Shoot types.
4.2.1 WINTER PRUNING Winter pruning can constrain orchard performance if it is not carried out correctly. Winter pruning is done
after harvest when vines enter dormancy. The aim is to set up bays with optimal high quality winter bud
numbers on canes that are evenly spaced throughout the canopy.
Canes are tied down immediately after pruning. Even spacing has a great influence on the performance of the
canopy the following summer. Consistent canopy density will reduce variation in fruit attributes (e.g. size, dry
matter). The aim is to fill the canopy so there is an even cane spacing and no gaps.
Even cane and spur spacing results in a consistent summer canopy that produces optimum fruit size and dry
matter (climate and summer vine management allowing) and is easy to manage and achieve good spray
coverage.
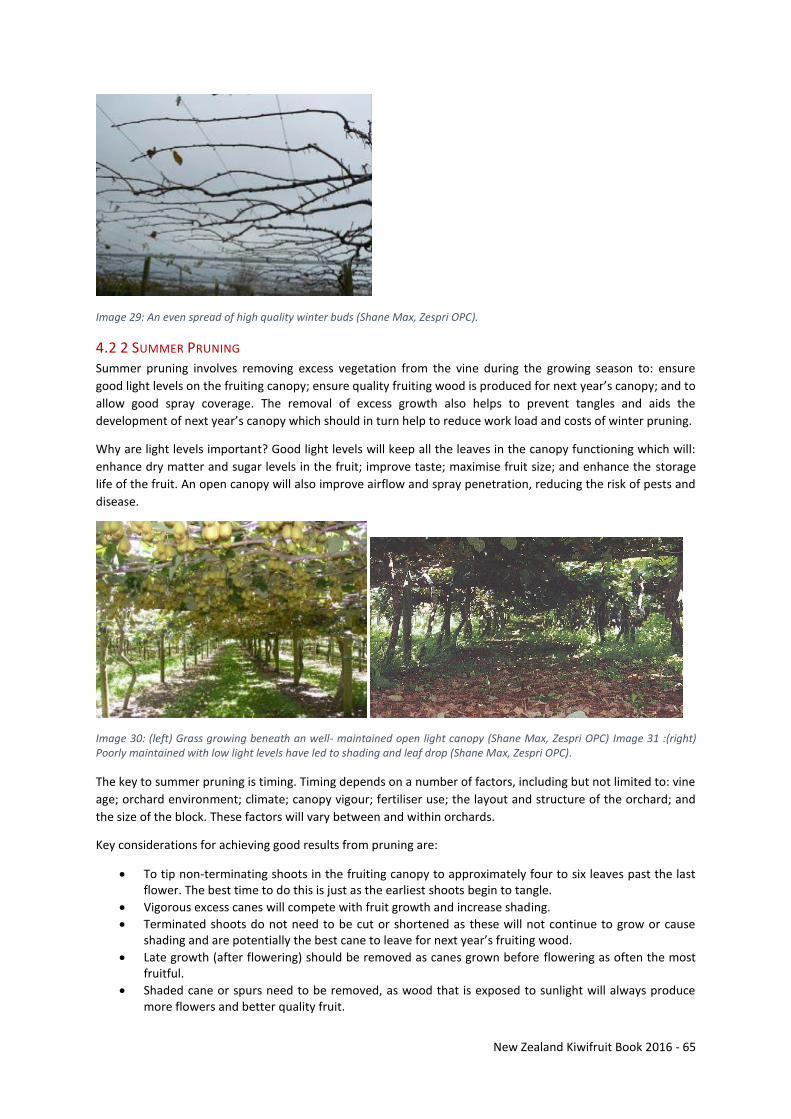
New Zealand Kiwifruit Book 2016 - 65
Image 29: An even spread of high quality winter buds (Shane Max, Zespri OPC).
4.2 2 SUMMER PRUNING Summer pruning involves removing excess vegetation from the vine during the growing season to: ensure
good light levels on the fruiting canopy; ensure quality fruiting wood is produced for next year’s canopy; and to
allow good spray coverage. The removal of excess growth also helps to prevent tangles and aids the
development of next year’s canopy which should in turn help to reduce work load and costs of winter pruning.
Why are light levels important? Good light levels will keep all the leaves in the canopy functioning which will:
enhance dry matter and sugar levels in the fruit; improve taste; maximise fruit size; and enhance the storage
life of the fruit. An open canopy will also improve airflow and spray penetration, reducing the risk of pests and
disease.
Image 30: (left) Grass growing beneath an well- maintained open light canopy (Shane Max, Zespri OPC) Image 31 :(right) Poorly maintained with low light levels have led to shading and leaf drop (Shane Max, Zespri OPC).
The key to summer pruning is timing. Timing depends on a number of factors, including but not limited to: vine
age; orchard environment; climate; canopy vigour; fertiliser use; the layout and structure of the orchard; and
the size of the block. These factors will vary between and within orchards.
Key considerations for achieving good results from pruning are:
To tip non-terminating shoots in the fruiting canopy to approximately four to six leaves past the last flower. The best time to do this is just as the earliest shoots begin to tangle.
Vigorous excess canes will compete with fruit growth and increase shading.
Terminated shoots do not need to be cut or shortened as these will not continue to grow or cause shading and are potentially the best cane to leave for next year’s fruiting wood.
Late growth (after flowering) should be removed as canes grown before flowering as often the most fruitful.
Shaded cane or spurs need to be removed, as wood that is exposed to sunlight will always produce more flowers and better quality fruit.
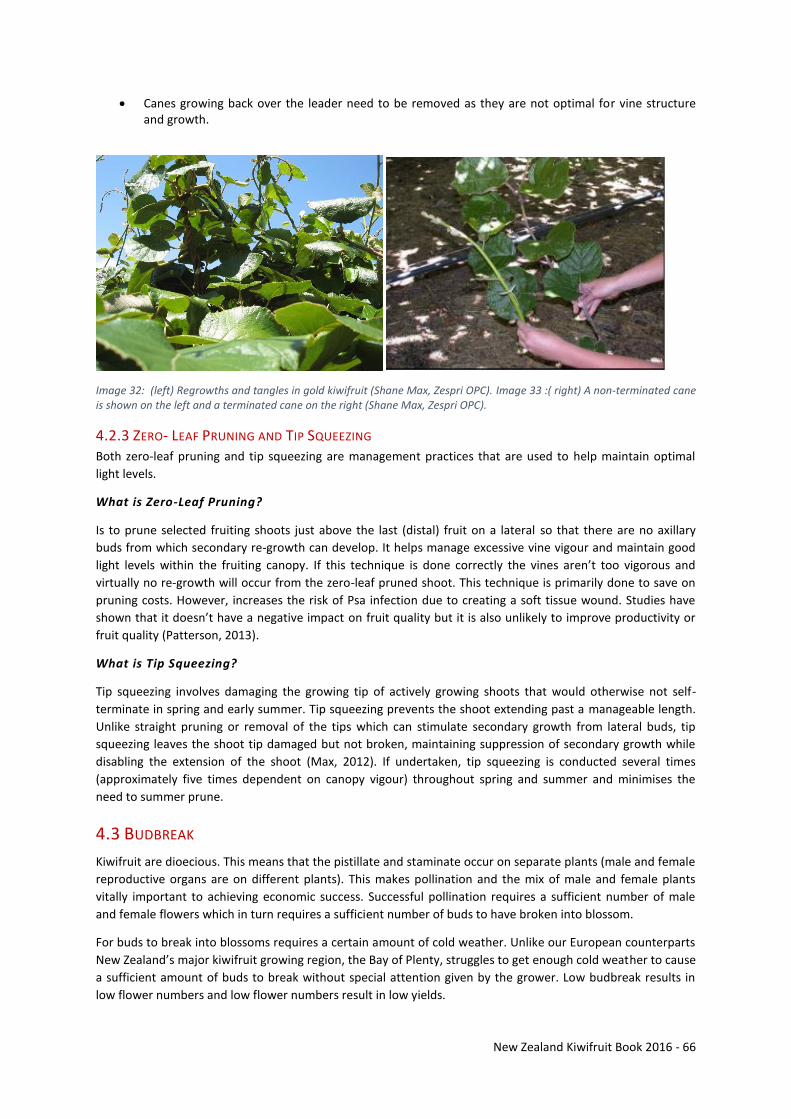
New Zealand Kiwifruit Book 2016 - 66
Canes growing back over the leader need to be removed as they are not optimal for vine structure and growth.
Image 32: (left) Regrowths and tangles in gold kiwifruit (Shane Max, Zespri OPC). Image 33 :( right) A non-terminated cane is shown on the left and a terminated cane on the right (Shane Max, Zespri OPC).
4.2.3 ZERO- LEAF PRUNING AND TIP SQUEEZING Both zero-leaf pruning and tip squeezing are management practices that are used to help maintain optimal
light levels.
What is Zero-Leaf Pruning?
Is to prune selected fruiting shoots just above the last (distal) fruit on a lateral so that there are no axillary
buds from which secondary re-growth can develop. It helps manage excessive vine vigour and maintain good
light levels within the fruiting canopy. If this technique is done correctly the vines aren’t too vigorous and
virtually no re-growth will occur from the zero-leaf pruned shoot. This technique is primarily done to save on
pruning costs. However, increases the risk of Psa infection due to creating a soft tissue wound. Studies have
shown that it doesn’t have a negative impact on fruit quality but it is also unlikely to improve productivity or
fruit quality (Patterson, 2013).
What is Tip Squeezing?
Tip squeezing involves damaging the growing tip of actively growing shoots that would otherwise not self-
terminate in spring and early summer. Tip squeezing prevents the shoot extending past a manageable length.
Unlike straight pruning or removal of the tips which can stimulate secondary growth from lateral buds, tip
squeezing leaves the shoot tip damaged but not broken, maintaining suppression of secondary growth while
disabling the extension of the shoot (Max, 2012). If undertaken, tip squeezing is conducted several times
(approximately five times dependent on canopy vigour) throughout spring and summer and minimises the
need to summer prune.
4.3 BUDBREAK
Kiwifruit are dioecious. This means that the pistillate and staminate occur on separate plants (male and female
reproductive organs are on different plants). This makes pollination and the mix of male and female plants
vitally important to achieving economic success. Successful pollination requires a sufficient number of male
and female flowers which in turn requires a sufficient number of buds to have broken into blossom.
For buds to break into blossoms requires a certain amount of cold weather. Unlike our European counterparts
New Zealand’s major kiwifruit growing region, the Bay of Plenty, struggles to get enough cold weather to cause
a sufficient amount of buds to break without special attention given by the grower. Low budbreak results in
low flower numbers and low flower numbers result in low yields.
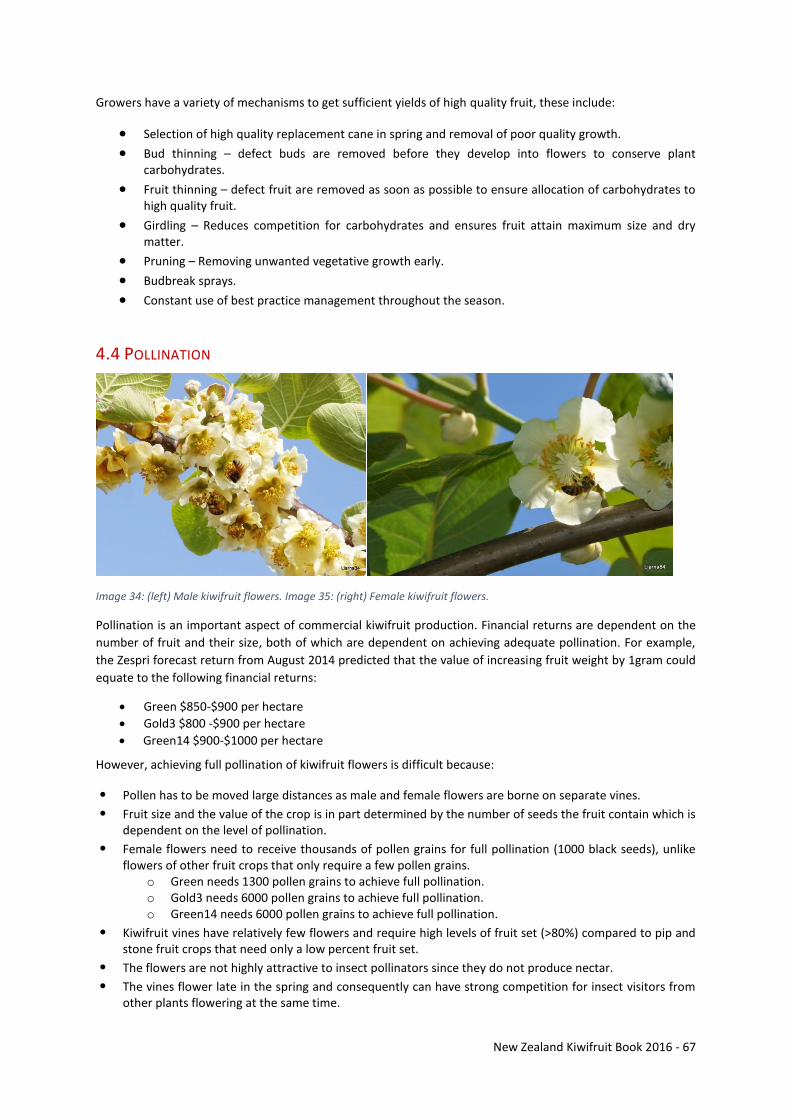
New Zealand Kiwifruit Book 2016 - 67
Growers have a variety of mechanisms to get sufficient yields of high quality fruit, these include:
Selection of high quality replacement cane in spring and removal of poor quality growth.
Bud thinning – defect buds are removed before they develop into flowers to conserve plant carbohydrates.
Fruit thinning – defect fruit are removed as soon as possible to ensure allocation of carbohydrates to high quality fruit.
Girdling – Reduces competition for carbohydrates and ensures fruit attain maximum size and dry matter.
Pruning – Removing unwanted vegetative growth early.
Budbreak sprays.
Constant use of best practice management throughout the season.
4.4 POLLINATION
Image 34: (left) Male kiwifruit flowers. Image 35: (right) Female kiwifruit flowers.
Pollination is an important aspect of commercial kiwifruit production. Financial returns are dependent on the
number of fruit and their size, both of which are dependent on achieving adequate pollination. For example,
the Zespri forecast return from August 2014 predicted that the value of increasing fruit weight by 1gram could
equate to the following financial returns:
Green $850-$900 per hectare
Gold3 $800 -$900 per hectare
Green14 $900-$1000 per hectare
However, achieving full pollination of kiwifruit flowers is difficult because:
• Pollen has to be moved large distances as male and female flowers are borne on separate vines.
• Fruit size and the value of the crop is in part determined by the number of seeds the fruit contain which is dependent on the level of pollination.
• Female flowers need to receive thousands of pollen grains for full pollination (1000 black seeds), unlike flowers of other fruit crops that only require a few pollen grains.
o Green needs 1300 pollen grains to achieve full pollination. o Gold3 needs 6000 pollen grains to achieve full pollination. o Green14 needs 6000 pollen grains to achieve full pollination.
• Kiwifruit vines have relatively few flowers and require high levels of fruit set (>80%) compared to pip and stone fruit crops that need only a low percent fruit set.
• The flowers are not highly attractive to insect pollinators since they do not produce nectar.
• The vines flower late in the spring and consequently can have strong competition for insect visitors from other plants flowering at the same time.
New Zealand Kiwifruit Book 2016 - 68
• Kiwifruit vines were introduced into New Zealand from China so they are without the insect pollinators with which they co-evolved.
• The crop needs high shelter belts to protect the vines from wind damage which reduces pollination by wind.
• In New Zealand vines are grown close to the ground instead of up forest trees, (their natural habit) further reducing the level of wind pollination (Goodwin, 2000).
For these reasons the pollination of kiwifruit needs to be managed to a much greater extent than most other
crops. This has resulted in the development of a pollination system for kiwifruit that is more sophisticated than
that is used for almost any other crop in the world. The costs associated with pollination are also greater than
for almost all other crops in New Zealand. Flowering and pollination occurs in spring but the timing varies by
region, altitude and variety. The majority of kiwifruit orchards are pollinated by bees. To prevent bees from
searching to find nectar, bee keepers and/or growers who are managing the bees, feed the bees a mixture of
sugar and water at dawn and dusk. Bees feed on the sugar and water mix as a substitute for nectar and can
spend more time searching for kiwifruit pollen which increases bee movements and visits between male and
female kiwifruit flowers.
Growers also supplement beehives by applying additional pollen to kiwifruit vines through means other than
bees. This activity is called ‘artificial pollination’. Growers can elect to have the flowers on their male vines
picked and processed to be used for artificial pollination. There are also growers whose business is to grow
male kiwifruit vines for their flowers for use in the artificial pollination of female vines. It is important to
acknowledge that all cultivars of male kiwifruit vines are not always compatible with all cultivars of female
kiwifruit vines. Known male kiwifruit vine cultivars used in New Zealand include: Chieftan; Matua; King; M56;
M33; M91; Toumuri; Russell; Baker; Bruce; Sparkler and Meteor.
There are a number of key things that growers consider when deciding to use artificial pollination. Stigma
receptivity, bee activity, the use of overhead shelter, the rate of pollen to apply per hectare and the costs
involved both pollen and labour. A major consideration is whether the extra cost of artificially applying pollen
will attribute to financial returns.
There are a large number of pollination devices that growers can use to apply pollen and are categorised into
three broad groups:
Contact application – similar to hand pollination
Wet application – spraying pollen onto the flowers
Dry application – blowing the pollen on
Pollination under hail netting Zespri has been working with Plant & Food Research from early 2015, to better understand why hail netting is having detrimental effect on standard honey bee hives and to look for ways to overcome this issue. Research to date has shown that overhead nets impede the bees’ ability to locate the suns position and also suggests that a typical honey bee hive may not be the most suitable for pollinating under hail netting. Zespri and Plant & Food Research are running research and extension activities to establish methods for pollinating covered Gold3 kiwifruit which do not impact honey bee health. The three-year project will starts in spring 2016 and aims to better understand how hail nets impede bee behaviour, foraging and health, and develop beehive management guidelines for enclosed environments. Alternative approaches for pollinating covered Gold3 in the absence of honey bees will also be established, building on existing knowledge to develop new methods/ technology. Zespri had a stand at the National Apiculture conference in June to launch the concept of a new 'Hailnet Hive Standard'. Feedback from beekeepers was positive so Zespri is testing the concept of using smaller hives (five frame nucs) which are fed pollen supplements at a rate of 20 hives/ha in a trial in 2016.
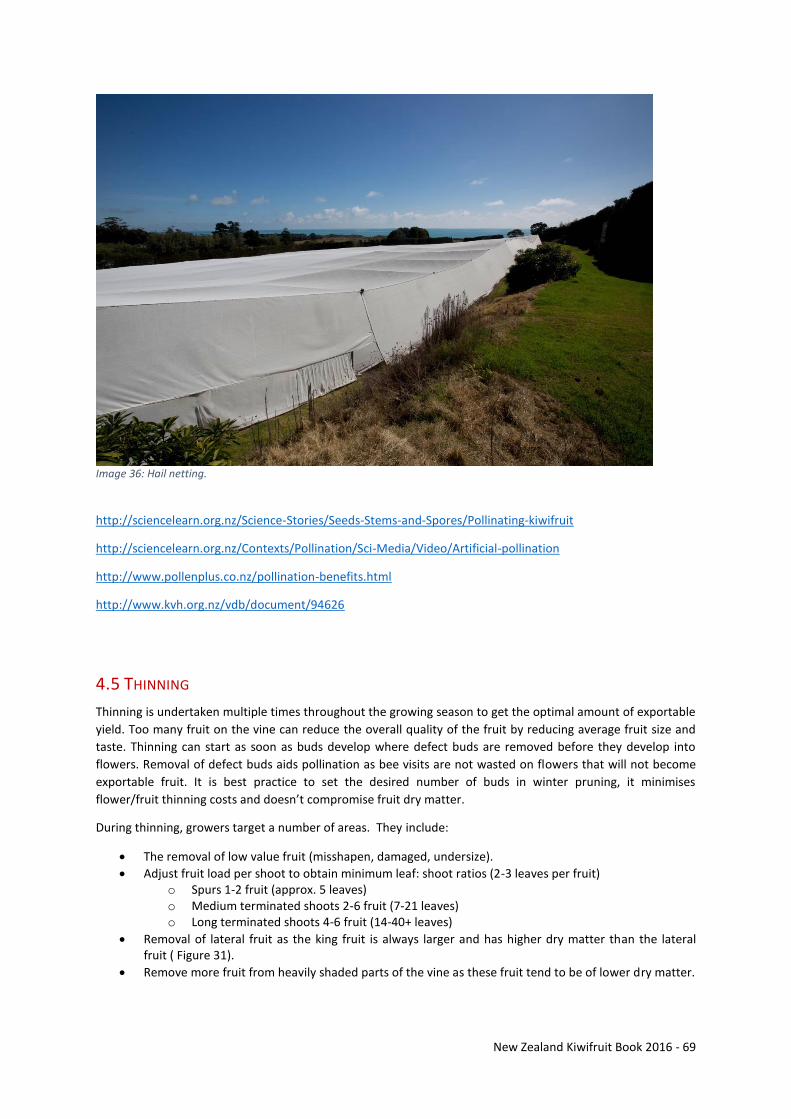
New Zealand Kiwifruit Book 2016 - 69
Image 36: Hail netting.
http://sciencelearn.org.nz/Science-Stories/Seeds-Stems-and-Spores/Pollinating-kiwifruit
http://sciencelearn.org.nz/Contexts/Pollination/Sci-Media/Video/Artificial-pollination
http://www.pollenplus.co.nz/pollination-benefits.html
http://www.kvh.org.nz/vdb/document/94626
4.5 THINNING
Thinning is undertaken multiple times throughout the growing season to get the optimal amount of exportable
yield. Too many fruit on the vine can reduce the overall quality of the fruit by reducing average fruit size and
taste. Thinning can start as soon as buds develop where defect buds are removed before they develop into
flowers. Removal of defect buds aids pollination as bee visits are not wasted on flowers that will not become
exportable fruit. It is best practice to set the desired number of buds in winter pruning, it minimises
flower/fruit thinning costs and doesn’t compromise fruit dry matter.
During thinning, growers target a number of areas. They include:
The removal of low value fruit (misshapen, damaged, undersize).
Adjust fruit load per shoot to obtain minimum leaf: shoot ratios (2-3 leaves per fruit) o Spurs 1-2 fruit (approx. 5 leaves) o Medium terminated shoots 2-6 fruit (7-21 leaves) o Long terminated shoots 4-6 fruit (14-40+ leaves)
Removal of lateral fruit as the king fruit is always larger and has higher dry matter than the lateral fruit ( Figure 31).
Remove more fruit from heavily shaded parts of the vine as these fruit tend to be of lower dry matter.
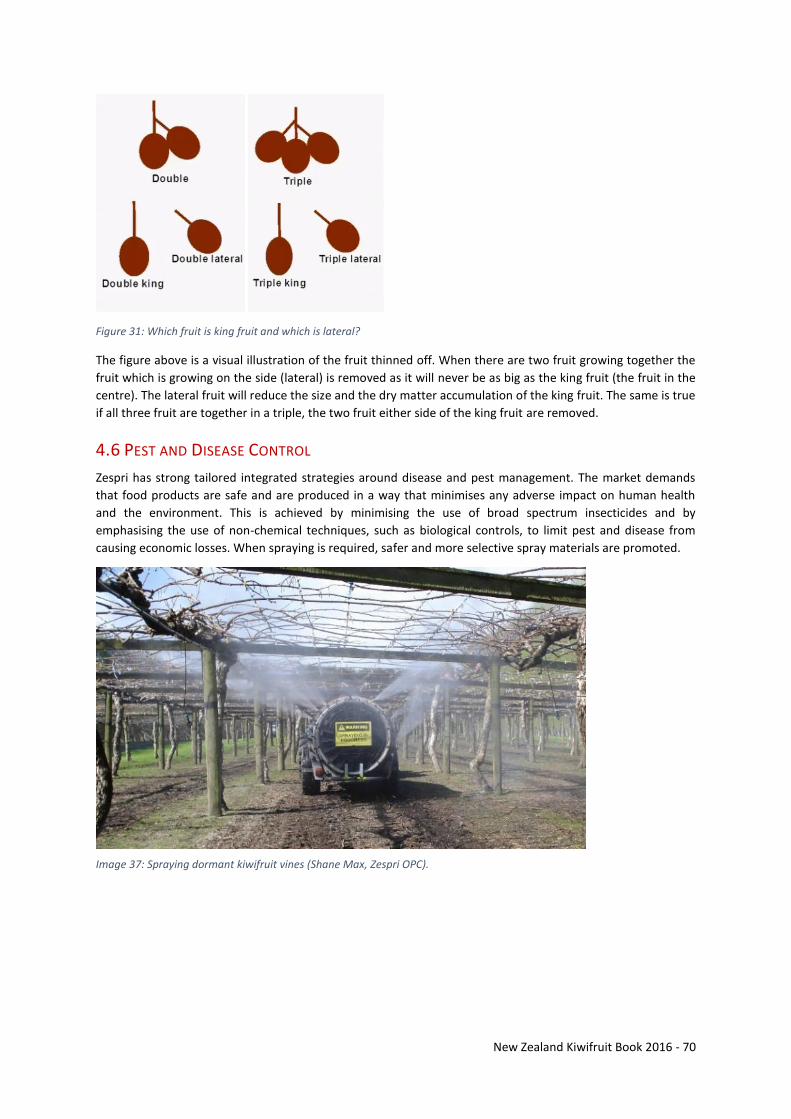
New Zealand Kiwifruit Book 2016 - 70
Figure 31: Which fruit is king fruit and which is lateral?
The figure above is a visual illustration of the fruit thinned off. When there are two fruit growing together the
fruit which is growing on the side (lateral) is removed as it will never be as big as the king fruit (the fruit in the
centre). The lateral fruit will reduce the size and the dry matter accumulation of the king fruit. The same is true
if all three fruit are together in a triple, the two fruit either side of the king fruit are removed.
4.6 PEST AND DISEASE CONTROL
Zespri has strong tailored integrated strategies around disease and pest management. The market demands
that food products are safe and are produced in a way that minimises any adverse impact on human health
and the environment. This is achieved by minimising the use of broad spectrum insecticides and by
emphasising the use of non-chemical techniques, such as biological controls, to limit pest and disease from
causing economic losses. When spraying is required, safer and more selective spray materials are promoted.
Image 37: Spraying dormant kiwifruit vines (Shane Max, Zespri OPC).
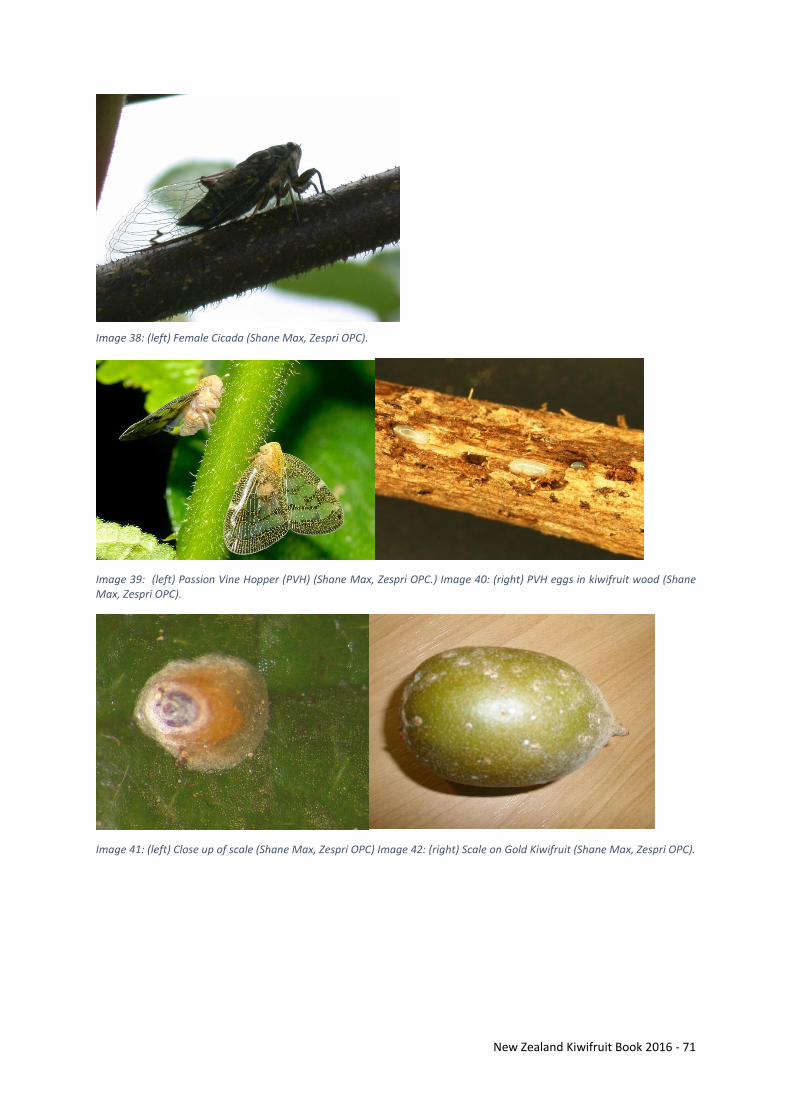
New Zealand Kiwifruit Book 2016 - 71
Image 38: (left) Female Cicada (Shane Max, Zespri OPC).
Image 39: (left) Passion Vine Hopper (PVH) (Shane Max, Zespri OPC.) Image 40: (right) PVH eggs in kiwifruit wood (Shane Max, Zespri OPC).
Image 41: (left) Close up of scale (Shane Max, Zespri OPC) Image 42: (right) Scale on Gold Kiwifruit (Shane Max, Zespri OPC).
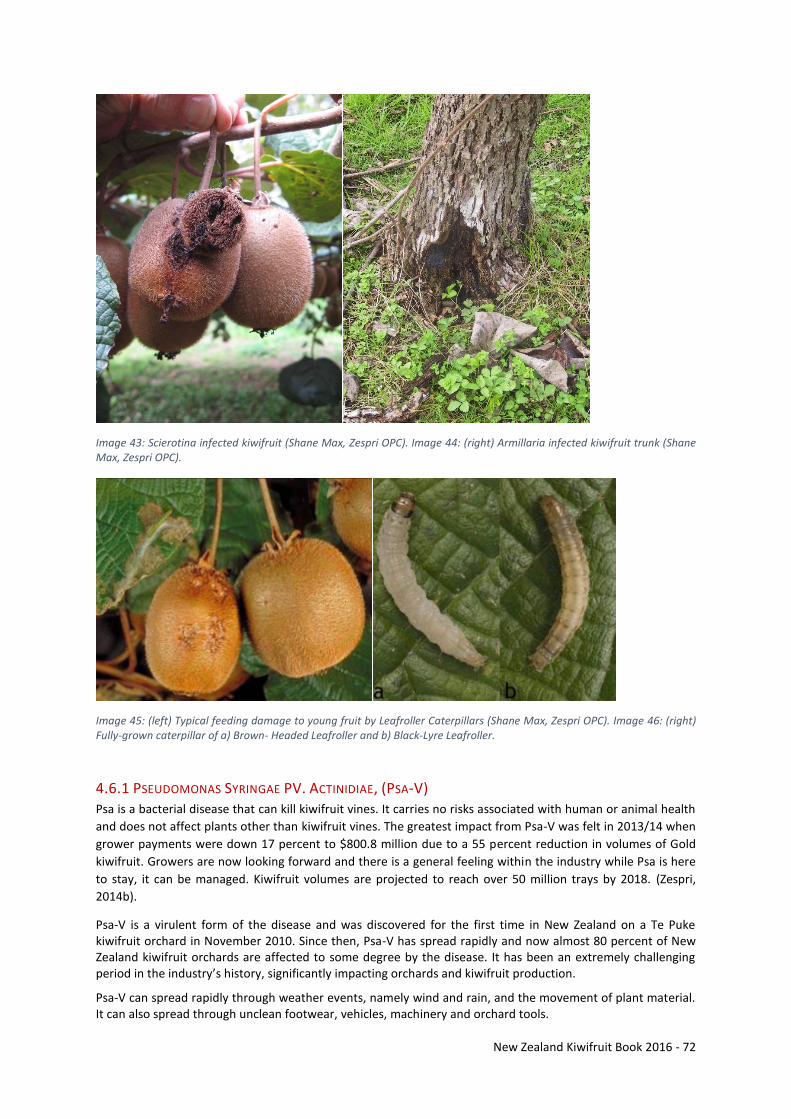
New Zealand Kiwifruit Book 2016 - 72
Image 43: Scierotina infected kiwifruit (Shane Max, Zespri OPC). Image 44: (right) Armillaria infected kiwifruit trunk (Shane Max, Zespri OPC).
Image 45: (left) Typical feeding damage to young fruit by Leafroller Caterpillars (Shane Max, Zespri OPC). Image 46: (right) Fully-grown caterpillar of a) Brown- Headed Leafroller and b) Black-Lyre Leafroller.
4.6.1 PSEUDOMONAS SYRINGAE PV. ACTINIDIAE, (PSA-V) Psa is a bacterial disease that can kill kiwifruit vines. It carries no risks associated with human or animal health
and does not affect plants other than kiwifruit vines. The greatest impact from Psa-V was felt in 2013/14 when
grower payments were down 17 percent to $800.8 million due to a 55 percent reduction in volumes of Gold
kiwifruit. Growers are now looking forward and there is a general feeling within the industry while Psa is here
to stay, it can be managed. Kiwifruit volumes are projected to reach over 50 million trays by 2018. (Zespri,
2014b).
Psa-V is a virulent form of the disease and was discovered for the first time in New Zealand on a Te Puke kiwifruit orchard in November 2010. Since then, Psa-V has spread rapidly and now almost 80 percent of New Zealand kiwifruit orchards are affected to some degree by the disease. It has been an extremely challenging period in the industry’s history, significantly impacting orchards and kiwifruit production.
Psa-V can spread rapidly through weather events, namely wind and rain, and the movement of plant material. It can also spread through unclean footwear, vehicles, machinery and orchard tools.
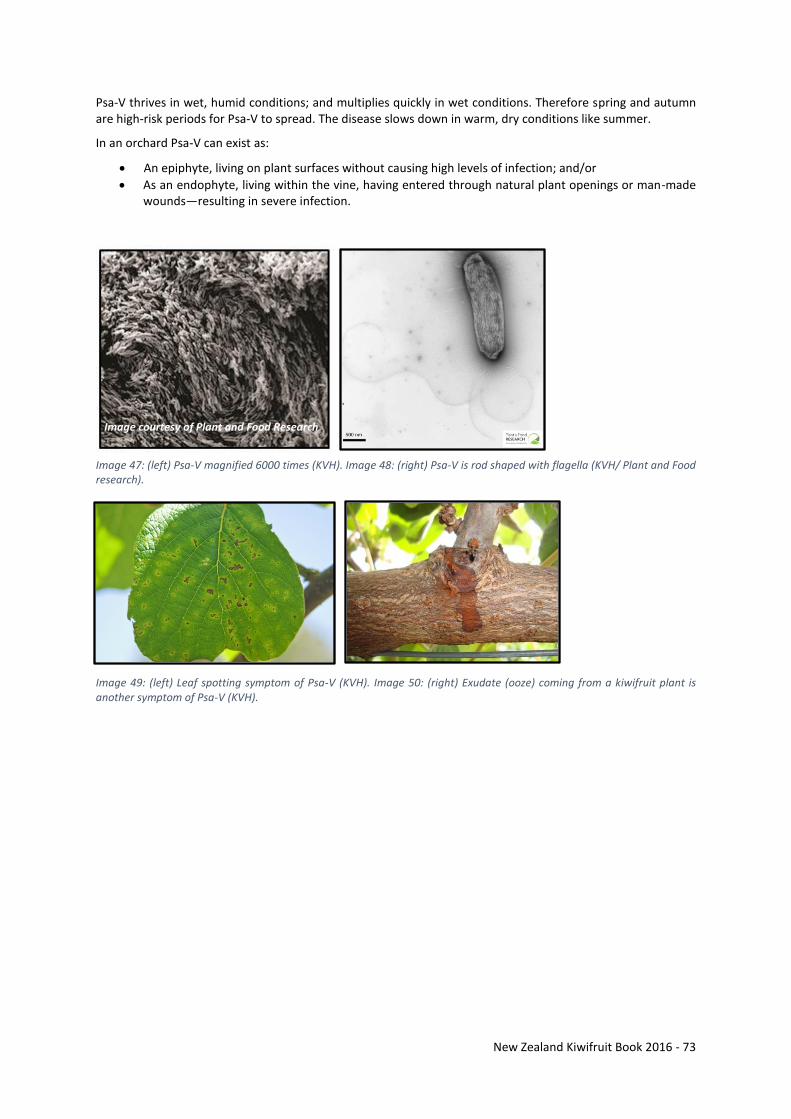
New Zealand Kiwifruit Book 2016 - 73
Psa-V thrives in wet, humid conditions; and multiplies quickly in wet conditions. Therefore spring and autumn are high-risk periods for Psa-V to spread. The disease slows down in warm, dry conditions like summer.
In an orchard Psa-V can exist as:
An epiphyte, living on plant surfaces without causing high levels of infection; and/or
As an endophyte, living within the vine, having entered through natural plant openings or man-made wounds—resulting in severe infection.
Image 47: (left) Psa-V magnified 6000 times (KVH). Image 48: (right) Psa-V is rod shaped with flagella (KVH/ Plant and Food research).
Image 49: (left) Leaf spotting symptom of Psa-V (KVH). Image 50: (right) Exudate (ooze) coming from a kiwifruit plant is another symptom of Psa-V (KVH).
Image courtesy of Plant and Food Research
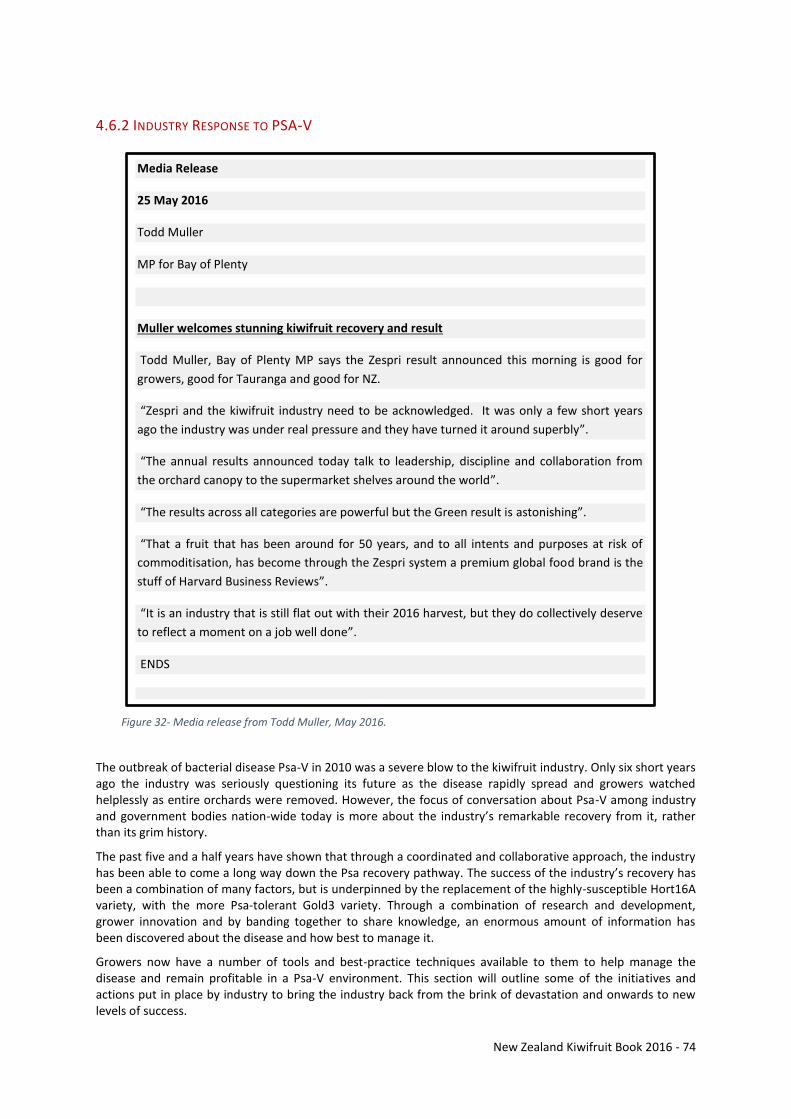
New Zealand Kiwifruit Book 2016 - 74
4.6.2 INDUSTRY RESPONSE TO PSA-V
The outbreak of bacterial disease Psa-V in 2010 was a severe blow to the kiwifruit industry. Only six short years ago the industry was seriously questioning its future as the disease rapidly spread and growers watched helplessly as entire orchards were removed. However, the focus of conversation about Psa-V among industry and government bodies nation-wide today is more about the industry’s remarkable recovery from it, rather than its grim history.
The past five and a half years have shown that through a coordinated and collaborative approach, the industry has been able to come a long way down the Psa recovery pathway. The success of the industry’s recovery has been a combination of many factors, but is underpinned by the replacement of the highly-susceptible Hort16A variety, with the more Psa-tolerant Gold3 variety. Through a combination of research and development, grower innovation and by banding together to share knowledge, an enormous amount of information has been discovered about the disease and how best to manage it.
Growers now have a number of tools and best-practice techniques available to them to help manage the disease and remain profitable in a Psa-V environment. This section will outline some of the initiatives and actions put in place by industry to bring the industry back from the brink of devastation and onwards to new levels of success.
Media Release
25 May 2016
Todd Muller
MP for Bay of Plenty
Muller welcomes stunning kiwifruit recovery and result
Todd Muller, Bay of Plenty MP says the Zespri result announced this morning is good for
growers, good for Tauranga and good for NZ.
“Zespri and the kiwifruit industry need to be acknowledged. It was only a few short years
ago the industry was under real pressure and they have turned it around superbly”.
“The annual results announced today talk to leadership, discipline and collaboration from
the orchard canopy to the supermarket shelves around the world”.
“The results across all categories are powerful but the Green result is astonishing”.
“That a fruit that has been around for 50 years, and to all intents and purposes at risk of
commoditisation, has become through the Zespri system a premium global food brand is the
stuff of Harvard Business Reviews”.
“It is an industry that is still flat out with their 2016 harvest, but they do collectively deserve
to reflect a moment on a job well done”.
ENDS
Figure 32- Media release from Todd Muller, May 2016.
New Zealand Kiwifruit Book 2016 - 75
The Establishment of Kiwifruit Vine Health (KVH) See page 13 for an overview on KVH. For more information, go to www.kvh.org.nz.
Innovation - the development of Psa tolerant cultivars Plant & Food Research is the sole research provider to the New Zealand Kiwifruit Research Consortium, jointly funded by the Ministry of Business, Innovation and Employment (MBIE) and Zespri. Together they are developing new cultivars of superior quality that command a market premium, with a focus on taste, novelty and convenience. Additionally, new cultivars are bred with tolerance to diseases, including Psa-V.
The industry quickly established that Hort16A no longer had a commercial future in the New Zealand kiwifruit industry due to its high susceptibility to Psa-V. As a result, New Zealand growers have grafted across to new, more-tolerant varieties (mainly Gold3) and very little of Hort16A remains in New Zealand. However, all varieties, including Gold3, require proactive management by growers to allow them to successfully grow in a Psa environment. Here is a video outlining the new kiwifruit cultivars which are Psa-V tolerant:
http://www.plantandfood.co.nz/page/news/video-index/video/breeding-psa-resistant-kiwifruit/
Research and Development Programme KVH, in conjunction with Zespri Innovation, leads a global research and development (R&D) programme into Psa-V. The programme was established in early 2011 and has enlisted the best scientific minds globally to provide solutions for Psa-V.The Innovation team partners with around 20 global researchers to provide the best available expertise to the New Zealand kiwifruit industry. An annual budget of $2 million is allocated to the Psa programme.
For more information about the R&D programme go to: www.kvh.org.nz/psa_RD
Product Testing Programme The KVH/Zespri product testing programme was developed to identify, rigorously test and get permission from ACVM to use suitable products to help manage and control the spread of Psa-V. To date, more than 300 products have been tested for efficacy against Psa-V in the KVH/Zespri product testing programme. The KVH Recommended Product List is available for growers and includes products with proven Psa-V efficacy and ACVM registration.
For more information about the Product Testing Programme go to: www.kvh.org.nz/producttesting.
For more information about the KVH Recommended Product List go to: www.kvh.org.nz/spray_information.
National Psa-V Pest Management Plan (NPMP) The NPMP was established in May 2013 to help reduce the spread and impacts of Psa-V. Under the NPMP there are now industry rules governing disease management (including a year round spray programme), monitoring, movement controls and the development of plans. These rules are outlined in a set of KVH Protocols available on the KVH website at: www.kvh.org.nz/protocols_movement_controls.
Kiwifruit Plant Certification Scheme (KPCS) Long term growth and success of the kiwifruit industry requires biosecurity risks (including Psa-V) to be managed right across the supply chain – this includes kiwifruit nurseries. Over the last two years KVH has introduced the KPCS to reduce the risk of pests and diseases being spread through the movement of nursery plants. By joining the KPCS, kiwifruit nurseries demonstrate they are managing biosecurity risks, have been independently audited, visually inspected for target organisms and returned a non-detected result for a very comprehensive testing regime for Psa-V.
On 1 October 2016 the KPCS becomes mandatory, meaning only KPCS-certified nursery plants may be bought, sold or moved between properties. However, growers may still produce plants on their own property for use on that property; and produce up to 1000 plant for movement between their own properties within the same Psa region. For more information about the KPCS go to: www.kvh.org.nz/kpcs
Orchard Biosecurity Border biosecurity starts at the orchard gate. Growers are now aware that any equipment, vehicle or person entering their orchard could potentially introduce and/or spread Psa-V, not to mention other pests or diseases. Growers should have robust hygiene practices in place to protect their orchard; and anyone entering orchards should be aware of these measures.
New Zealand Kiwifruit Book 2016 - 76
Grower Support and Wellbeing A large focus during the worst of the Psa incursion was on providing support to people who needed it through community services and workshops available around the regions; and providing information to help people recognise stress and anxiety in their friends, families and colleagues and by providing key contacts for help if they needed it. As a result, growers and the industry have come through the Psa-V crisis with sturdy resilience and the industry’s future pathway is looking more positive than ever. A significant support network remains in place and is available for growers dealing with anxiety and depression associated with industry and crisis events.
Kiwifruit grower, Ian Greaves, has recently addressed several primary industry functions about coping with stress during difficult times, drawing on kiwifruit growers’ experience with Psa-V. Here, Ian talks to Federated Farmers following the downturn of the dairy industry: https://www.youtube.com/watch?v=KOSGzxgRgDM
4.7 GIRDLING
Trunk girdling of kiwifruit is used to increase dry matter, increase fruit weight, and increase the number of
flowers the following season. The process works by isolating roots, in the period when the girdle is open, so
that they cannot compete with the fruit for the carbohydrates produced by the leaves.
Kiwifruit growers often apply a girdle during both spring and summer of the same season. The summer girdle
allows the fruit to attain a higher dry matter and return bloom and in spring a greater fruit size. Recent
research has also indicated that pre-flowering girdling may be a useful tool in preventing bud rot (a bacterial
disease causing the flowers to die) and subsequent crop losses in Hayward (Green).
Trunk girdles are easy to apply, with the use of a tool or a girdling chain. The tool is a double bladed knife
which cuts and removes a thin slice of bark from the circumference of a stem and the chain is a blunt chainsaw
chain with a handle at each end that is pulled back and forth to remove the wood.
Technique is important, if the girdle is too shallow and has not gone through the phloem the root system will
still be able to compete with the fruit. If the girdle is too vigorous and cuts through the xylem it will disable the
supply of water and nutrients to the canopy. The girdles will also be slower to heal and vines will be at greater
risk of disease infection.
The key is to remove all of the phloem down to the xylem around the entire stem. It can be easy to spot a
girdle that has not removed all of the phloem connections – when phloem tissue is cut it turns very quickly
from white to brown as the cells oxidise. If there is a fresh girdle where a part of the truck is girdled too
shallow the phloem tissue would be brown and the rest of the girdle would stay white indicating that it had
correctly reached the xylem. The xylem goes brown much more slowly.
Using a tool it can take two to three days to girdle a hectare of mature vines, although this depends on how
thick and rough the bark is. The chain is a lot faster but it comes with higher risk of xylem damage and Psa
expression. It is recommended that the chain is not used on young vines and cultivars that are more sensitive
to Psa.
The cost can range from approximately $100 to $300/ha but the benefits in increased fruit weight, dry matter,
and return bloom can be very significant. Increase in gross orchard income of $2000/ha, $11000/ha are easily
achievable for Hayward and Gold3 orchards respectively, this is clearly dependent on fruit prices and level of
response. This potential additional gross income comes about from increase in fruit size (more fruit in higher
paying larger counts) increased yield (more trays as larger fruit mean fewer fruit are required to fill a tray) and
an increase in fruit dry matter. At 2014/2015 prices, a one percent lift in dry matter is worth $400 and $1600
per 1000 trays for Green and Gold varieties respectively. Growers may also receive additional payments for
being early in the season. It most situations, it would likely that the cost to apply a truck girdle would more
than be covered by the potential financial gains. (OPC, 2014).
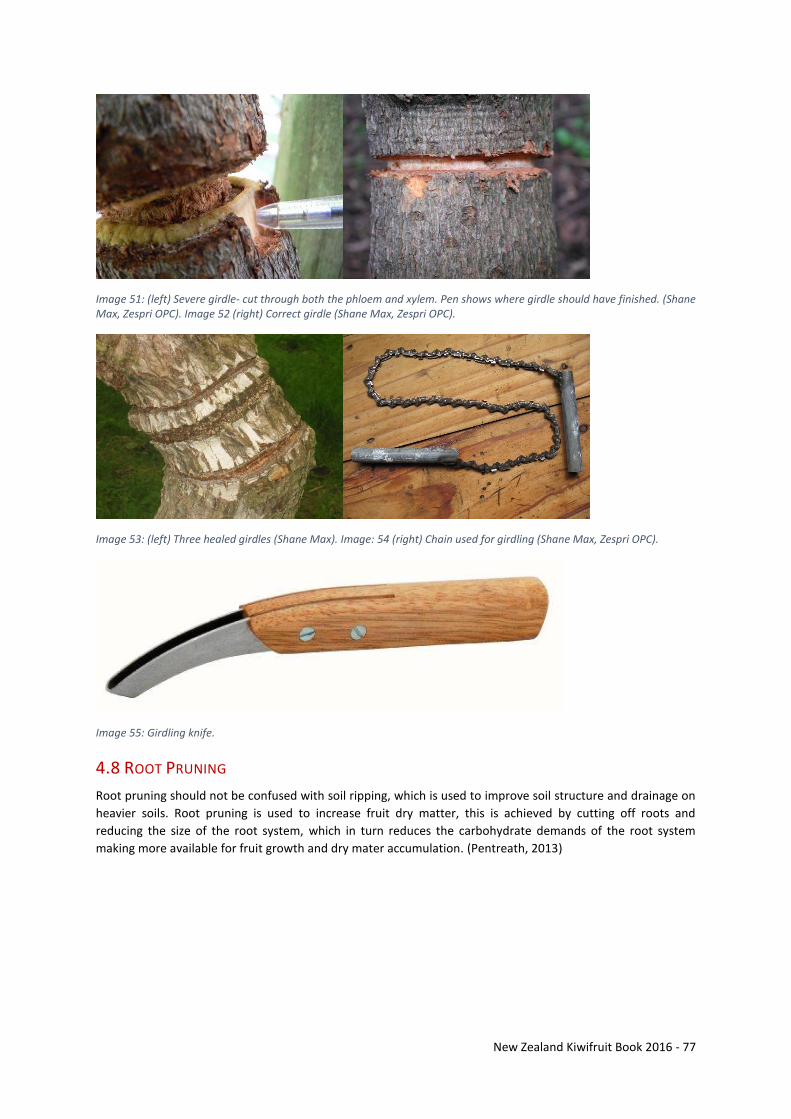
New Zealand Kiwifruit Book 2016 - 77
Image 51: (left) Severe girdle- cut through both the phloem and xylem. Pen shows where girdle should have finished. (Shane Max, Zespri OPC). Image 52 (right) Correct girdle (Shane Max, Zespri OPC).
Image 53: (left) Three healed girdles (Shane Max). Image: 54 (right) Chain used for girdling (Shane Max, Zespri OPC).
Image 55: Girdling knife.
4.8 ROOT PRUNING
Root pruning should not be confused with soil ripping, which is used to improve soil structure and drainage on
heavier soils. Root pruning is used to increase fruit dry matter, this is achieved by cutting off roots and
reducing the size of the root system, which in turn reduces the carbohydrate demands of the root system
making more available for fruit growth and dry mater accumulation. (Pentreath, 2013)
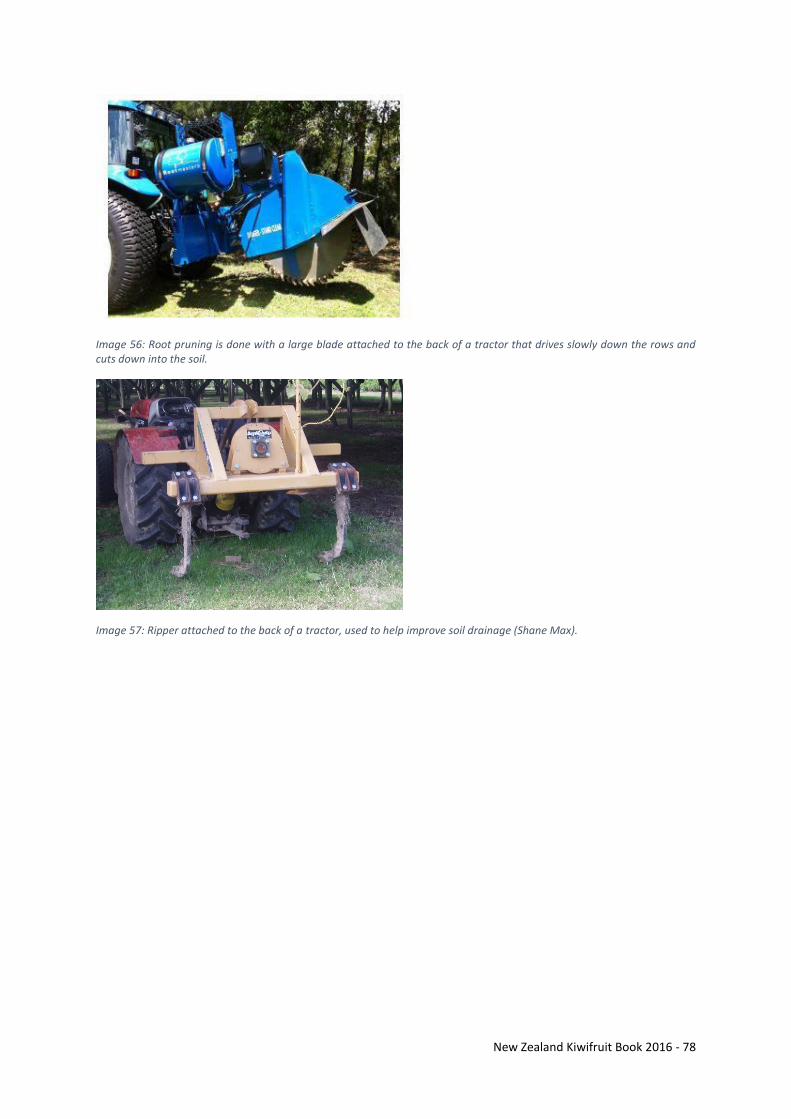
New Zealand Kiwifruit Book 2016 - 78
Image 56: Root pruning is done with a large blade attached to the back of a tractor that drives slowly down the rows and cuts down into the soil.
Image 57: Ripper attached to the back of a tractor, used to help improve soil drainage (Shane Max).
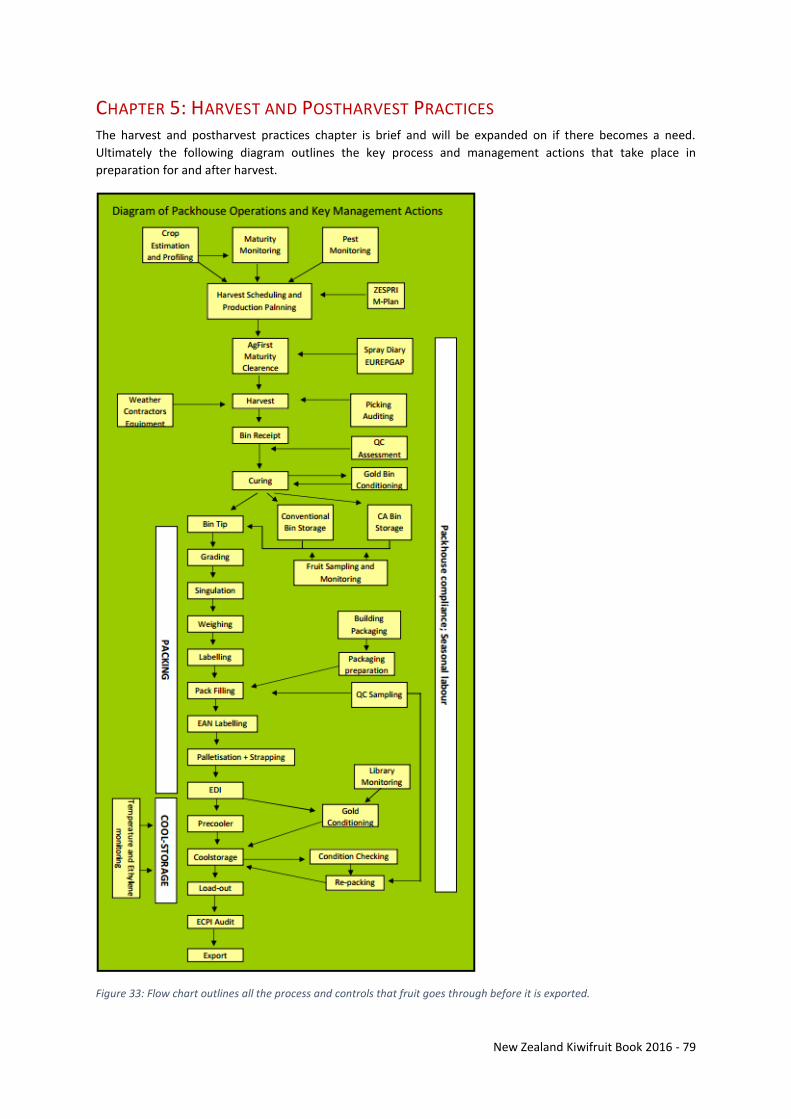
New Zealand Kiwifruit Book 2016 - 79
CHAPTER 5: HARVEST AND POSTHARVEST PRACTICES The harvest and postharvest practices chapter is brief and will be expanded on if there becomes a need.
Ultimately the following diagram outlines the key process and management actions that take place in
preparation for and after harvest.
Figure 33: Flow chart outlines all the process and controls that fruit goes through before it is exported.
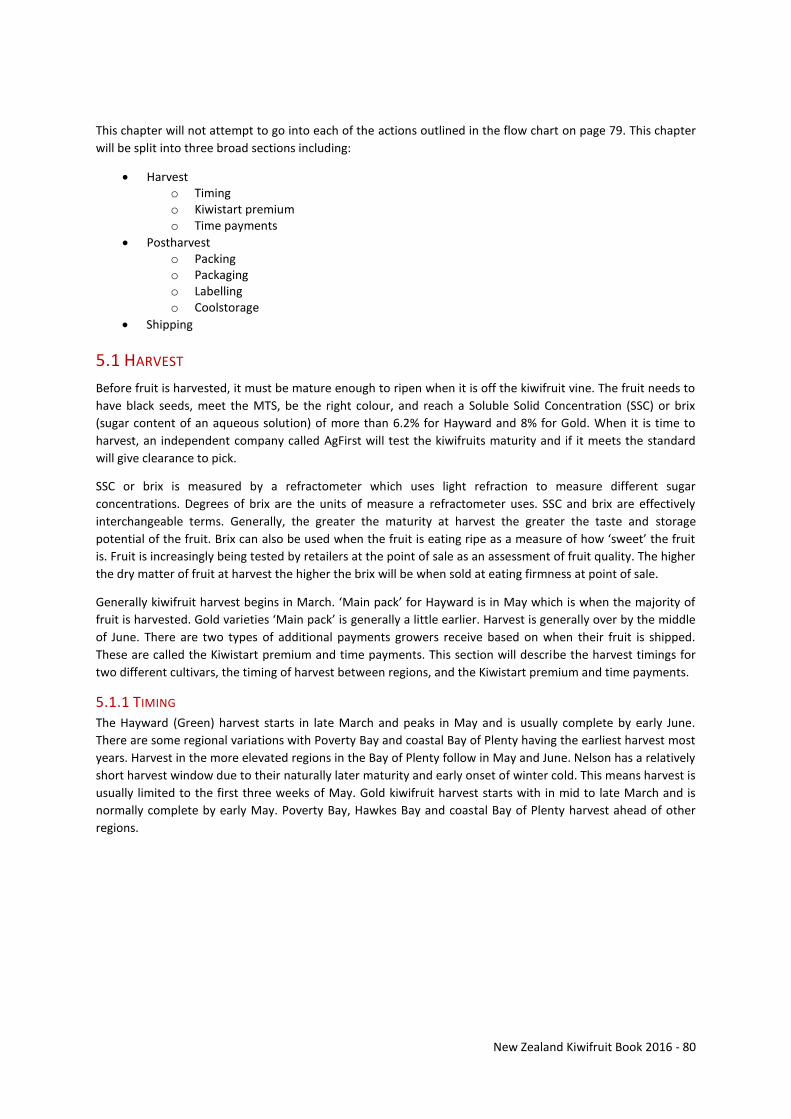
New Zealand Kiwifruit Book 2016 - 80
This chapter will not attempt to go into each of the actions outlined in the flow chart on page 79. This chapter
will be split into three broad sections including:
Harvest o Timing o Kiwistart premium o Time payments
Postharvest o Packing o Packaging o Labelling o Coolstorage
Shipping
5.1 HARVEST
Before fruit is harvested, it must be mature enough to ripen when it is off the kiwifruit vine. The fruit needs to
have black seeds, meet the MTS, be the right colour, and reach a Soluble Solid Concentration (SSC) or brix
(sugar content of an aqueous solution) of more than 6.2% for Hayward and 8% for Gold. When it is time to
harvest, an independent company called AgFirst will test the kiwifruits maturity and if it meets the standard
will give clearance to pick.
SSC or brix is measured by a refractometer which uses light refraction to measure different sugar
concentrations. Degrees of brix are the units of measure a refractometer uses. SSC and brix are effectively
interchangeable terms. Generally, the greater the maturity at harvest the greater the taste and storage
potential of the fruit. Brix can also be used when the fruit is eating ripe as a measure of how ‘sweet’ the fruit
is. Fruit is increasingly being tested by retailers at the point of sale as an assessment of fruit quality. The higher
the dry matter of fruit at harvest the higher the brix will be when sold at eating firmness at point of sale.
Generally kiwifruit harvest begins in March. ‘Main pack’ for Hayward is in May which is when the majority of
fruit is harvested. Gold varieties ‘Main pack’ is generally a little earlier. Harvest is generally over by the middle
of June. There are two types of additional payments growers receive based on when their fruit is shipped.
These are called the Kiwistart premium and time payments. This section will describe the harvest timings for
two different cultivars, the timing of harvest between regions, and the Kiwistart premium and time payments.
5.1.1 TIMING The Hayward (Green) harvest starts in late March and peaks in May and is usually complete by early June.
There are some regional variations with Poverty Bay and coastal Bay of Plenty having the earliest harvest most
years. Harvest in the more elevated regions in the Bay of Plenty follow in May and June. Nelson has a relatively
short harvest window due to their naturally later maturity and early onset of winter cold. This means harvest is
usually limited to the first three weeks of May. Gold kiwifruit harvest starts with in mid to late March and is
normally complete by early May. Poverty Bay, Hawkes Bay and coastal Bay of Plenty harvest ahead of other
regions.
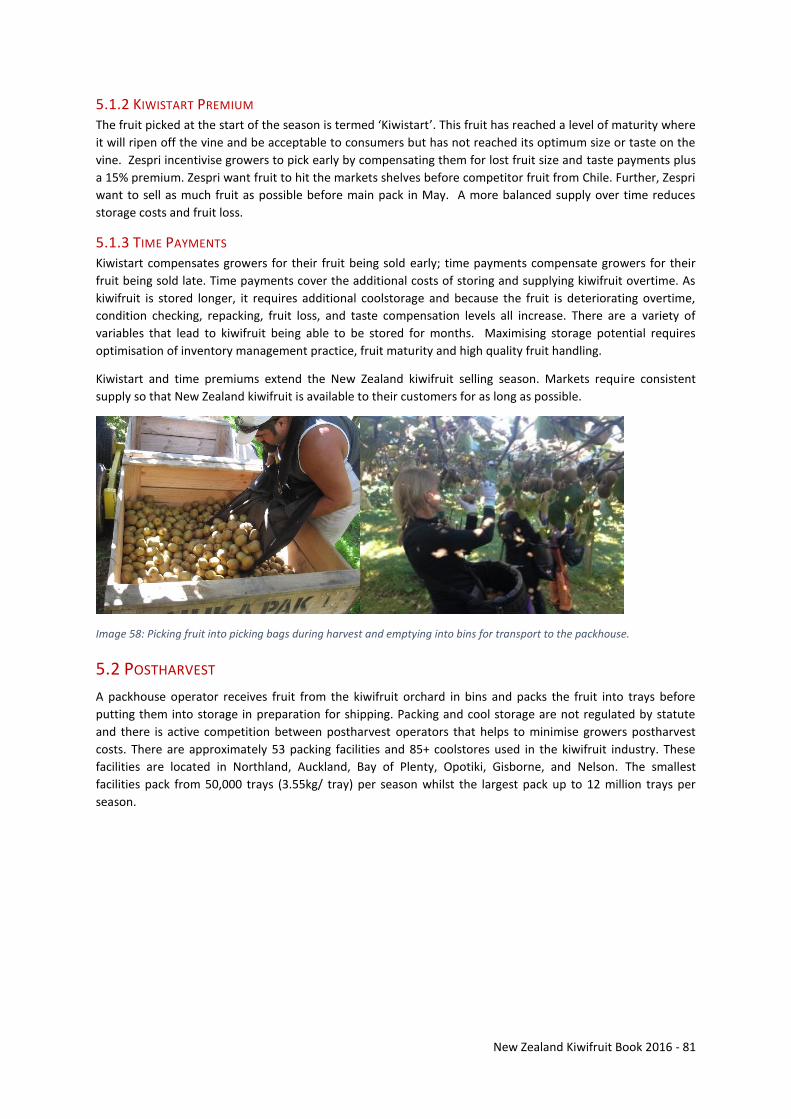
New Zealand Kiwifruit Book 2016 - 81
5.1.2 KIWISTART PREMIUM The fruit picked at the start of the season is termed ‘Kiwistart’. This fruit has reached a level of maturity where
it will ripen off the vine and be acceptable to consumers but has not reached its optimum size or taste on the
vine. Zespri incentivise growers to pick early by compensating them for lost fruit size and taste payments plus
a 15% premium. Zespri want fruit to hit the markets shelves before competitor fruit from Chile. Further, Zespri
want to sell as much fruit as possible before main pack in May. A more balanced supply over time reduces
storage costs and fruit loss.
5.1.3 TIME PAYMENTS Kiwistart compensates growers for their fruit being sold early; time payments compensate growers for their
fruit being sold late. Time payments cover the additional costs of storing and supplying kiwifruit overtime. As
kiwifruit is stored longer, it requires additional coolstorage and because the fruit is deteriorating overtime,
condition checking, repacking, fruit loss, and taste compensation levels all increase. There are a variety of
variables that lead to kiwifruit being able to be stored for months. Maximising storage potential requires
optimisation of inventory management practice, fruit maturity and high quality fruit handling.
Kiwistart and time premiums extend the New Zealand kiwifruit selling season. Markets require consistent
supply so that New Zealand kiwifruit is available to their customers for as long as possible.
Image 58: Picking fruit into picking bags during harvest and emptying into bins for transport to the packhouse.
5.2 POSTHARVEST
A packhouse operator receives fruit from the kiwifruit orchard in bins and packs the fruit into trays before
putting them into storage in preparation for shipping. Packing and cool storage are not regulated by statute
and there is active competition between postharvest operators that helps to minimise growers postharvest
costs. There are approximately 53 packing facilities and 85+ coolstores used in the kiwifruit industry. These
facilities are located in Northland, Auckland, Bay of Plenty, Opotiki, Gisborne, and Nelson. The smallest
facilities pack from 50,000 trays (3.55kg/ tray) per season whilst the largest pack up to 12 million trays per
season.
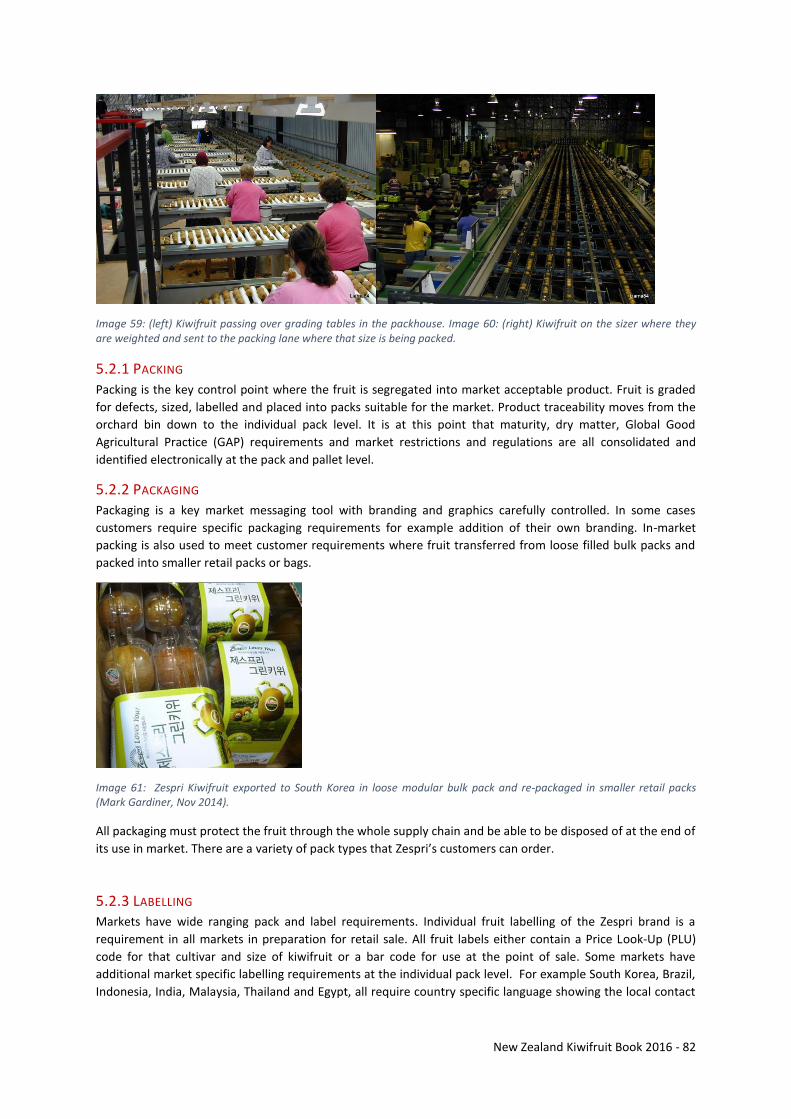
New Zealand Kiwifruit Book 2016 - 82
Image 59: (left) Kiwifruit passing over grading tables in the packhouse. Image 60: (right) Kiwifruit on the sizer where they are weighted and sent to the packing lane where that size is being packed.
5.2.1 PACKING
Packing is the key control point where the fruit is segregated into market acceptable product. Fruit is graded
for defects, sized, labelled and placed into packs suitable for the market. Product traceability moves from the
orchard bin down to the individual pack level. It is at this point that maturity, dry matter, Global Good
Agricultural Practice (GAP) requirements and market restrictions and regulations are all consolidated and
identified electronically at the pack and pallet level.
5.2.2 PACKAGING Packaging is a key market messaging tool with branding and graphics carefully controlled. In some cases
customers require specific packaging requirements for example addition of their own branding. In-market
packing is also used to meet customer requirements where fruit transferred from loose filled bulk packs and
packed into smaller retail packs or bags.
Image 61: Zespri Kiwifruit exported to South Korea in loose modular bulk pack and re-packaged in smaller retail packs (Mark Gardiner, Nov 2014).
All packaging must protect the fruit through the whole supply chain and be able to be disposed of at the end of
its use in market. There are a variety of pack types that Zespri’s customers can order.
5.2.3 LABELLING Markets have wide ranging pack and label requirements. Individual fruit labelling of the Zespri brand is a
requirement in all markets in preparation for retail sale. All fruit labels either contain a Price Look-Up (PLU)
code for that cultivar and size of kiwifruit or a bar code for use at the point of sale. Some markets have
additional market specific labelling requirements at the individual pack level. For example South Korea, Brazil,
Indonesia, India, Malaysia, Thailand and Egypt, all require country specific language showing the local contact
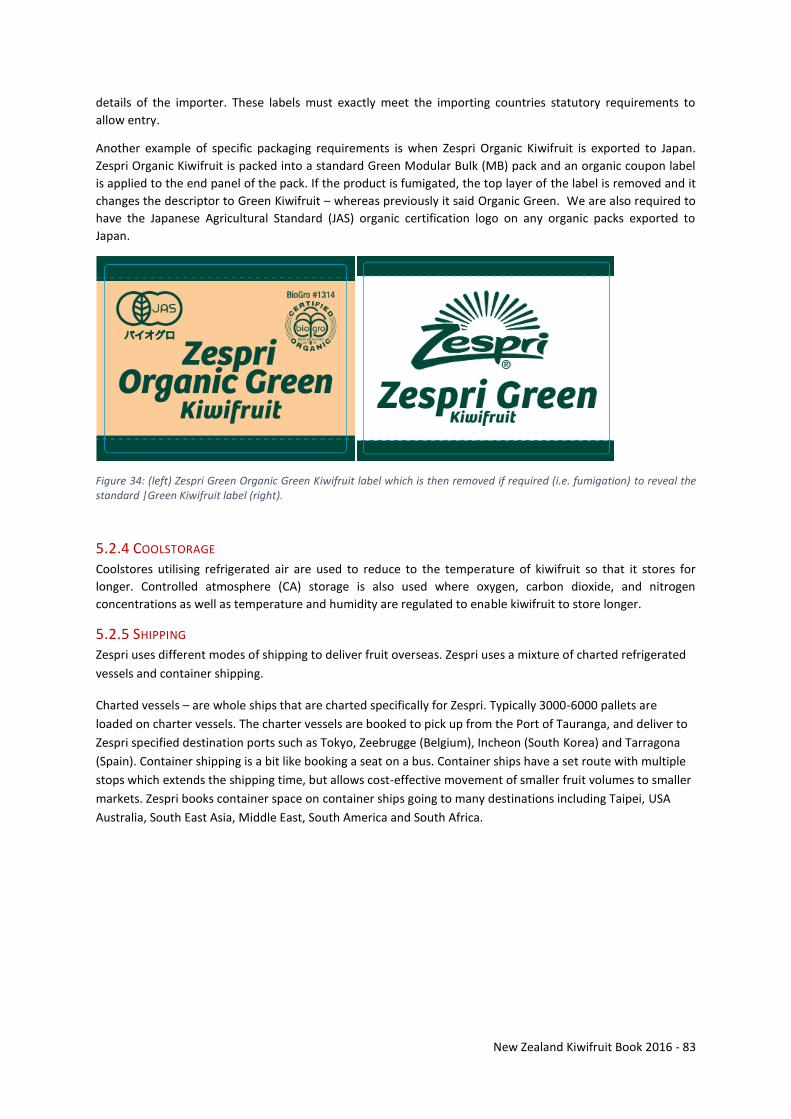
New Zealand Kiwifruit Book 2016 - 83
details of the importer. These labels must exactly meet the importing countries statutory requirements to
allow entry.
Another example of specific packaging requirements is when Zespri Organic Kiwifruit is exported to Japan.
Zespri Organic Kiwifruit is packed into a standard Green Modular Bulk (MB) pack and an organic coupon label
is applied to the end panel of the pack. If the product is fumigated, the top layer of the label is removed and it
changes the descriptor to Green Kiwifruit – whereas previously it said Organic Green. We are also required to
have the Japanese Agricultural Standard (JAS) organic certification logo on any organic packs exported to
Japan.
Figure 34: (left) Zespri Green Organic Green Kiwifruit label which is then removed if required (i.e. fumigation) to reveal the standard |Green Kiwifruit label (right).
5.2.4 COOLSTORAGE Coolstores utilising refrigerated air are used to reduce to the temperature of kiwifruit so that it stores for
longer. Controlled atmosphere (CA) storage is also used where oxygen, carbon dioxide, and nitrogen
concentrations as well as temperature and humidity are regulated to enable kiwifruit to store longer.
5.2.5 SHIPPING Zespri uses different modes of shipping to deliver fruit overseas. Zespri uses a mixture of charted refrigerated
vessels and container shipping.
Charted vessels – are whole ships that are charted specifically for Zespri. Typically 3000-6000 pallets are
loaded on charter vessels. The charter vessels are booked to pick up from the Port of Tauranga, and deliver to
Zespri specified destination ports such as Tokyo, Zeebrugge (Belgium), Incheon (South Korea) and Tarragona
(Spain). Container shipping is a bit like booking a seat on a bus. Container ships have a set route with multiple
stops which extends the shipping time, but allows cost-effective movement of smaller fruit volumes to smaller
markets. Zespri books container space on container ships going to many destinations including Taipei, USA
Australia, South East Asia, Middle East, South America and South Africa.
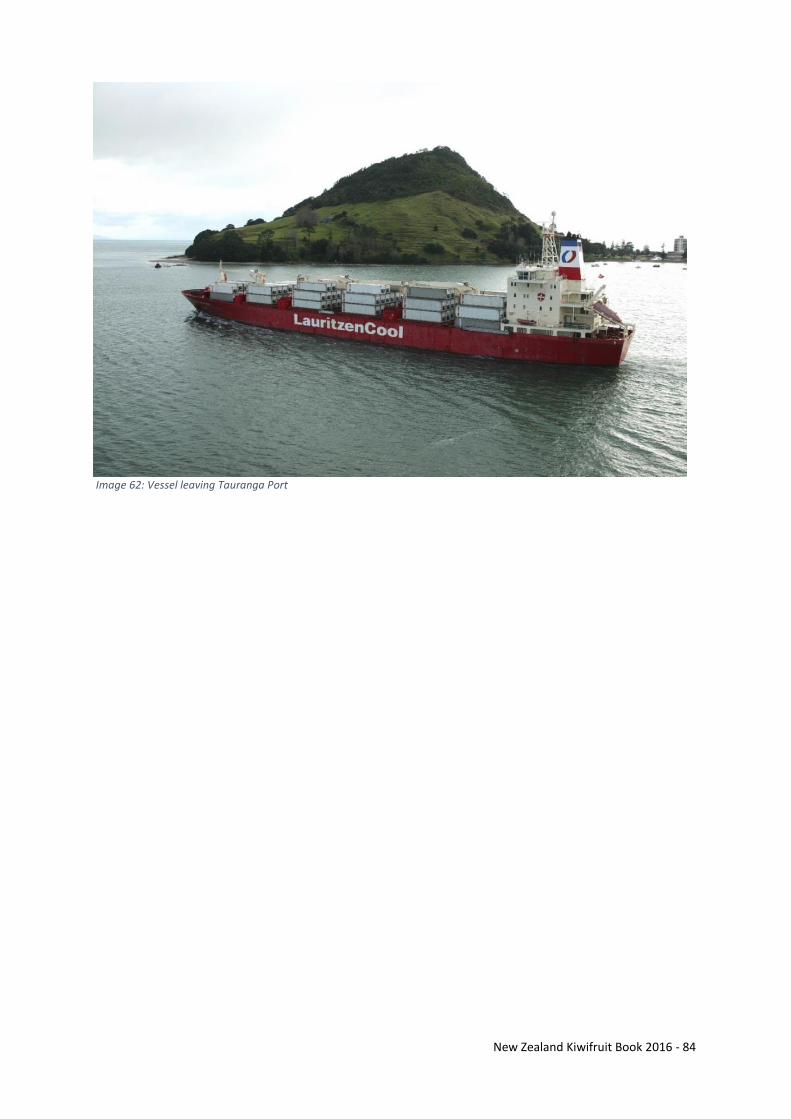
New Zealand Kiwifruit Book 2016 - 84
Image 62: Vessel leaving Tauranga Port
New Zealand Kiwifruit Book 2016 - 85
6. ORCHARD ACCOUNTS Monitoring of Kiwifruit Orchard Profitability
The monitoring of profitability is an important review of the financial performance of an orchard. There are
numerous orcharding activities that give rise to both income and costs on an orchard and growers give much
time and thought into delivering the successful production of their crops. Monitoring and review of the
financial performance of an orchard should be viewed as the financial result of that time. It is this result that
demonstrates financial success and the meeting of grower expectation or not.
In this section, there are four key areas that will be covered:
1. Seasonal Timing of Orchard Income and Costs
2. The Concept of Orchard Gate Return
3. Orchard Financial Reporting
4. Collection of Financial Data
1. Seasonal Timing of Orchard Income and Costs
The orcharding cash cycle of setting up an orchard in preparation for harvest and receiving the final income for
that same harvest is spread over twenty-four months. The kiwifruit orcharding year begins with winter pruning
around July and continues through to harvest. Harvest is typically conducted during the months of April and
May. Throughout this growing period numerous orcharding costs are incurred as the new crop is setup and
tendered (such as pruning, pollination, fertiliser etc.). Following harvest and the successful submit of fruit into
Zespri inventory; Net Income is returned to the grower. Final Net Income is not received by the grower until
June of the year following harvest.
2. The Concept of Orchard Gate Return
Net Income received by a grower is referred to as Orchard Gate Return or OGR. In simple terms, Zespri receive
money (gross income) from export customers. This is then distributed through to Registered Suppliers, and
onto growers. The reason Orchard Gate Return is referred to as a Net Income is because the gross income
received by Zespri is offset by various costs and incentives including postharvest costs such as packaging and
logistics.
These costs and incentives are outlined in the contractual arrangement a grower has with their post-harvest
partner and in the Supply Agreement signed by Registered Suppliers and Zespri. The preferred format for
growers aimed at illustrating Orchard Gate Return for a full year is below. It is noteworthy to mention that
Orchard Gate Return is not the complete measurement of orchard performance as it does not take into
consideration orcharding costs such as pruning, pollination, fertiliser etc. Therefore, Orchard Gate Return is
not the final formulation of orchard profitability.
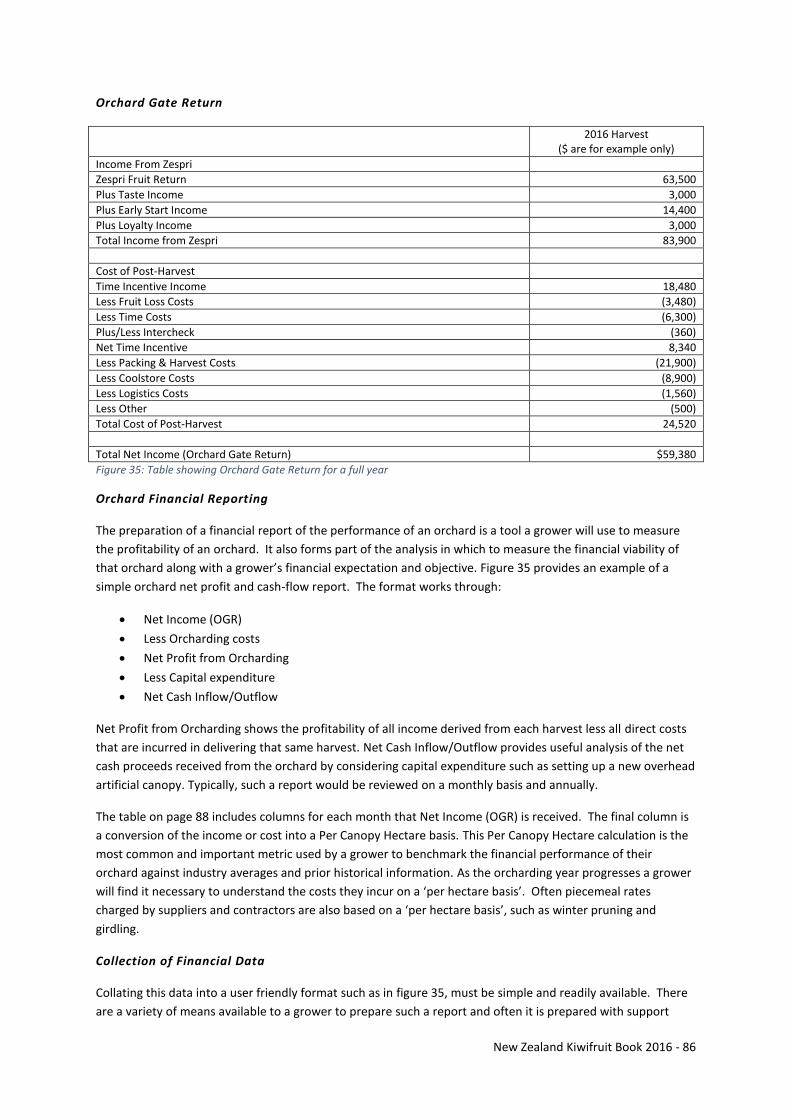
New Zealand Kiwifruit Book 2016 - 86
Orchard Gate Return
2016 Harvest ($ are for example only)
Income From Zespri
Zespri Fruit Return 63,500
Plus Taste Income 3,000
Plus Early Start Income 14,400
Plus Loyalty Income 3,000
Total Income from Zespri 83,900
Cost of Post-Harvest
Time Incentive Income 18,480
Less Fruit Loss Costs (3,480)
Less Time Costs (6,300)
Plus/Less Intercheck (360)
Net Time Incentive 8,340
Less Packing & Harvest Costs (21,900)
Less Coolstore Costs (8,900)
Less Logistics Costs (1,560)
Less Other (500)
Total Cost of Post-Harvest 24,520
Total Net Income (Orchard Gate Return) $59,380
Figure 35: Table showing Orchard Gate Return for a full year
Orchard Financial Reporting
The preparation of a financial report of the performance of an orchard is a tool a grower will use to measure
the profitability of an orchard. It also forms part of the analysis in which to measure the financial viability of
that orchard along with a grower’s financial expectation and objective. Figure 35 provides an example of a
simple orchard net profit and cash-flow report. The format works through:
Net Income (OGR)
Less Orcharding costs
Net Profit from Orcharding
Less Capital expenditure
Net Cash Inflow/Outflow
Net Profit from Orcharding shows the profitability of all income derived from each harvest less all direct costs
that are incurred in delivering that same harvest. Net Cash Inflow/Outflow provides useful analysis of the net
cash proceeds received from the orchard by considering capital expenditure such as setting up a new overhead
artificial canopy. Typically, such a report would be reviewed on a monthly basis and annually.
The table on page 88 includes columns for each month that Net Income (OGR) is received. The final column is
a conversion of the income or cost into a Per Canopy Hectare basis. This Per Canopy Hectare calculation is the
most common and important metric used by a grower to benchmark the financial performance of their
orchard against industry averages and prior historical information. As the orcharding year progresses a grower
will find it necessary to understand the costs they incur on a ‘per hectare basis’. Often piecemeal rates
charged by suppliers and contractors are also based on a ‘per hectare basis’, such as winter pruning and
girdling.
Collection of Financial Data
Collating this data into a user friendly format such as in figure 35, must be simple and readily available. There
are a variety of means available to a grower to prepare such a report and often it is prepared with support
New Zealand Kiwifruit Book 2016 - 87
from the growers Chartered Accountant. Financial reporting has come a long way in recent years and apart
from simple spreadsheets, there are a number of web based financial software tools available to growers to
draw financial information from such as Xero.
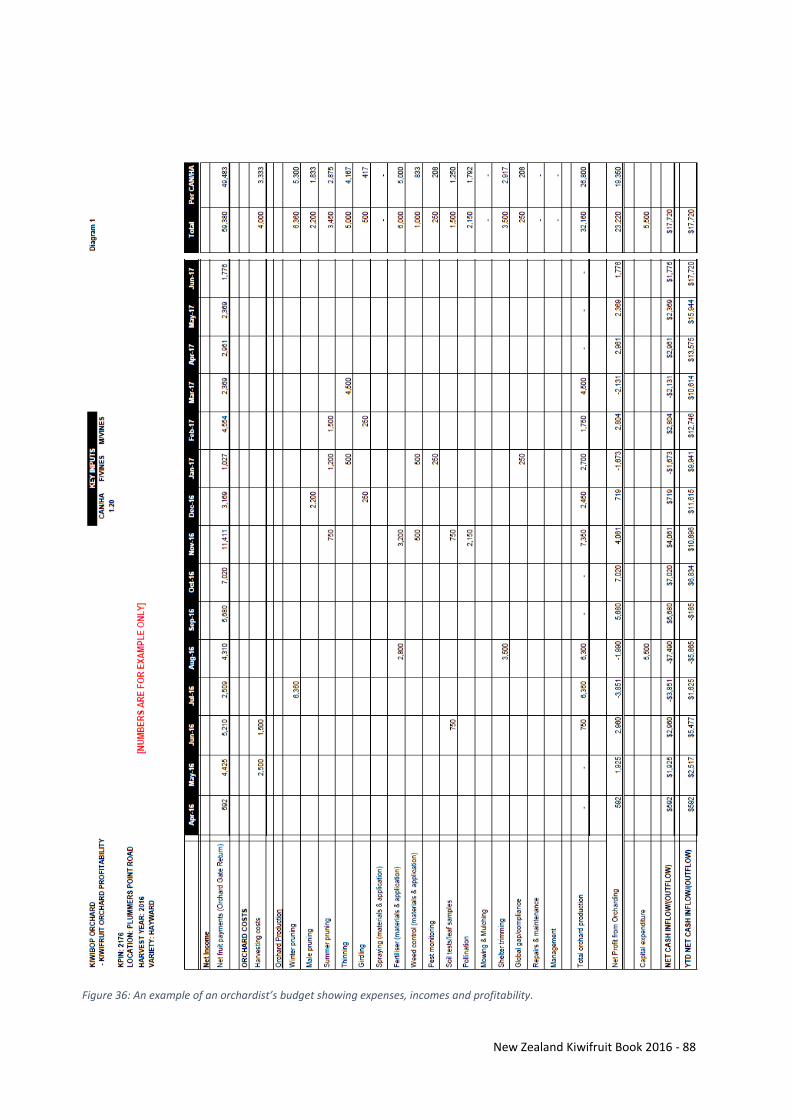
New Zealand Kiwifruit Book 2016 - 88
Figure 36: An example of an orchardist’s budget showing expenses, incomes and profitability.
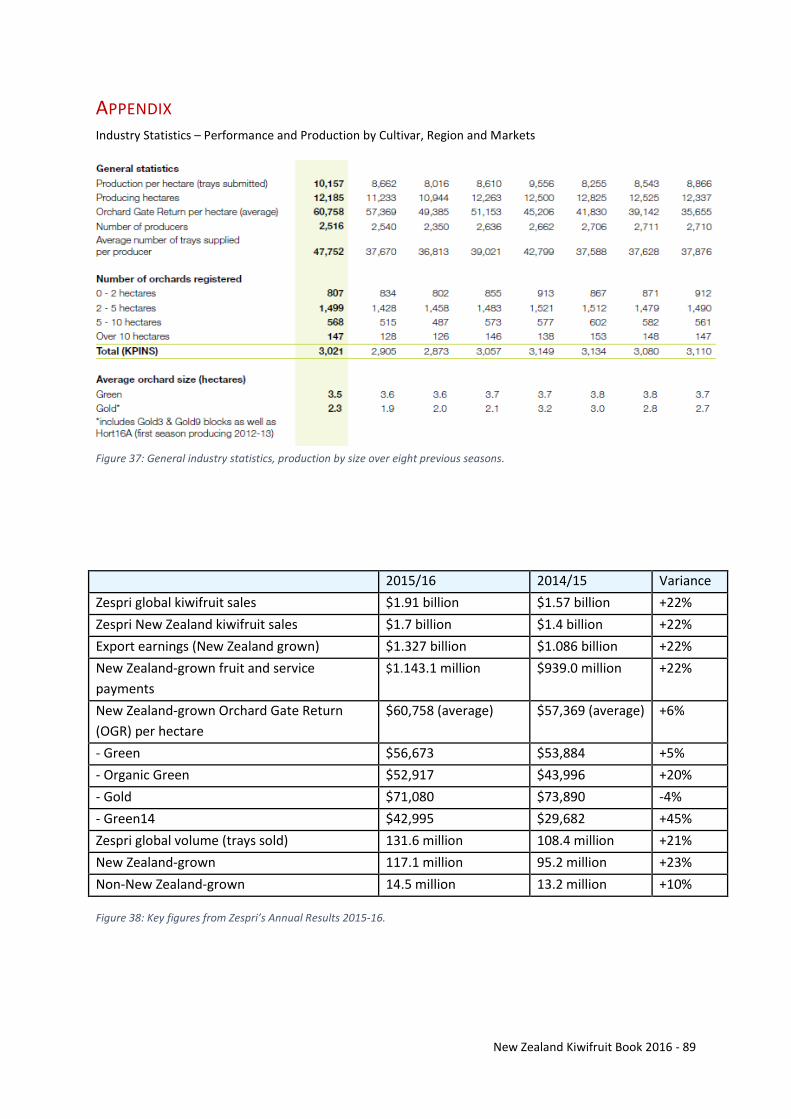
New Zealand Kiwifruit Book 2016 - 89
APPENDIX Industry Statistics – Performance and Production by Cultivar, Region and Markets
Figure 37: General industry statistics, production by size over eight previous seasons.
Figure 38: Key figures from Zespri’s Annual Results 2015-16.
2015/16 2014/15 Variance
Zespri global kiwifruit sales $1.91 billion $1.57 billion +22%
Zespri New Zealand kiwifruit sales $1.7 billion $1.4 billion +22%
Export earnings (New Zealand grown) $1.327 billion $1.086 billion +22%
New Zealand-grown fruit and service
payments
$1.143.1 million $939.0 million +22%
New Zealand-grown Orchard Gate Return
(OGR) per hectare
$60,758 (average) $57,369 (average) +6%
- Green $56,673 $53,884 +5%
- Organic Green $52,917 $43,996 +20%
- Gold $71,080 $73,890 -4%
- Green14 $42,995 $29,682 +45%
Zespri global volume (trays sold) 131.6 million 108.4 million +21%
New Zealand-grown 117.1 million 95.2 million +23%
Non-New Zealand-grown 14.5 million 13.2 million +10%
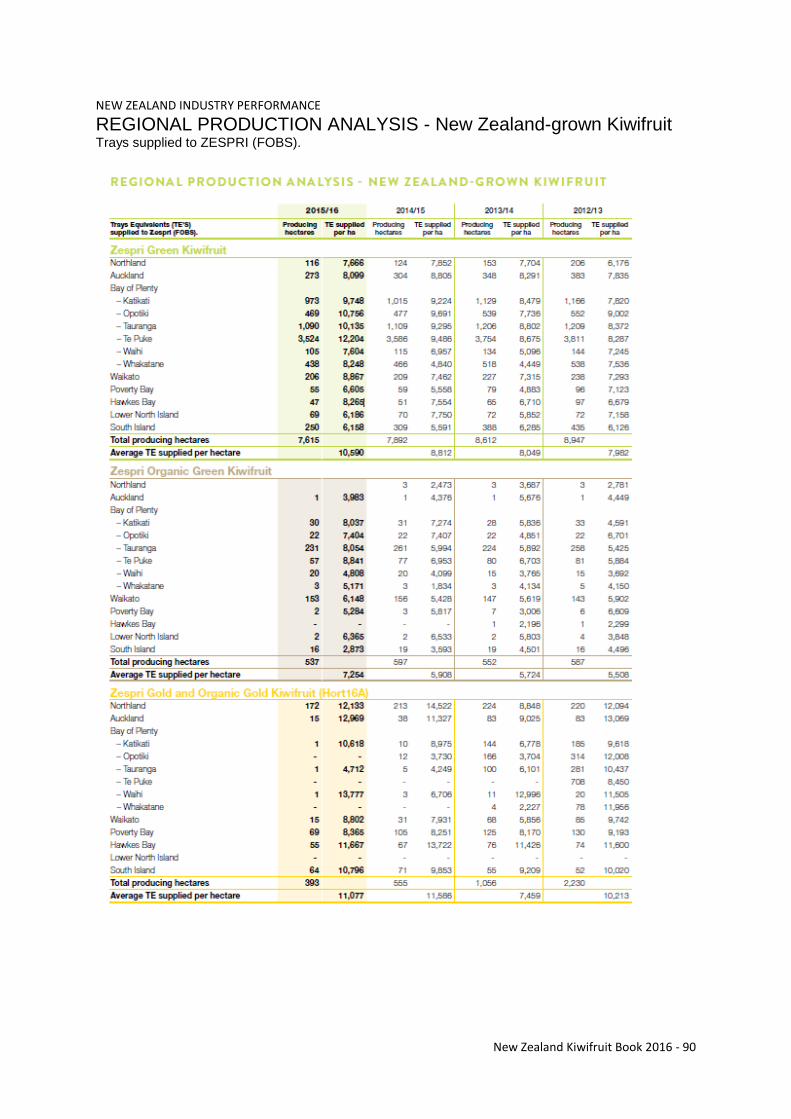
New Zealand Kiwifruit Book 2016 - 90
NEW ZEALAND INDUSTRY PERFORMANCE REGIONAL PRODUCTION ANALYSIS - New Zealand-grown Kiwifruit
Trays supplied to ZESPRI (FOBS).
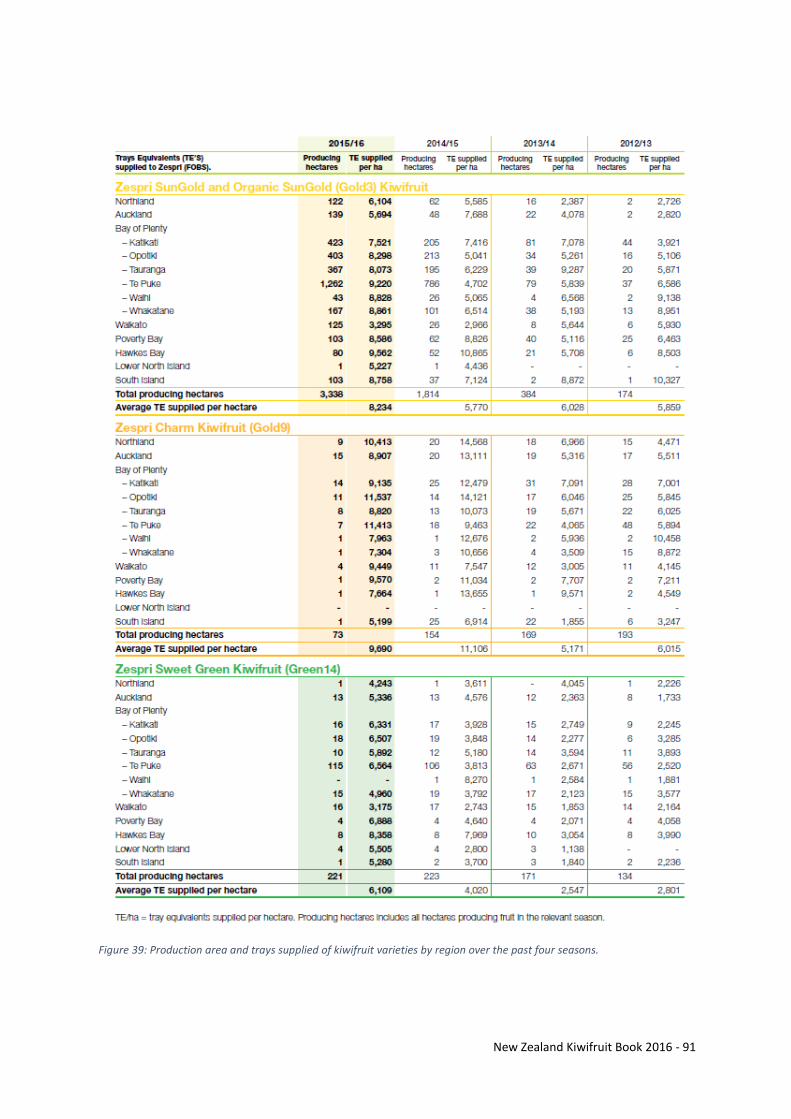
New Zealand Kiwifruit Book 2016 - 91
Figure 39: Production area and trays supplied of kiwifruit varieties by region over the past four seasons.
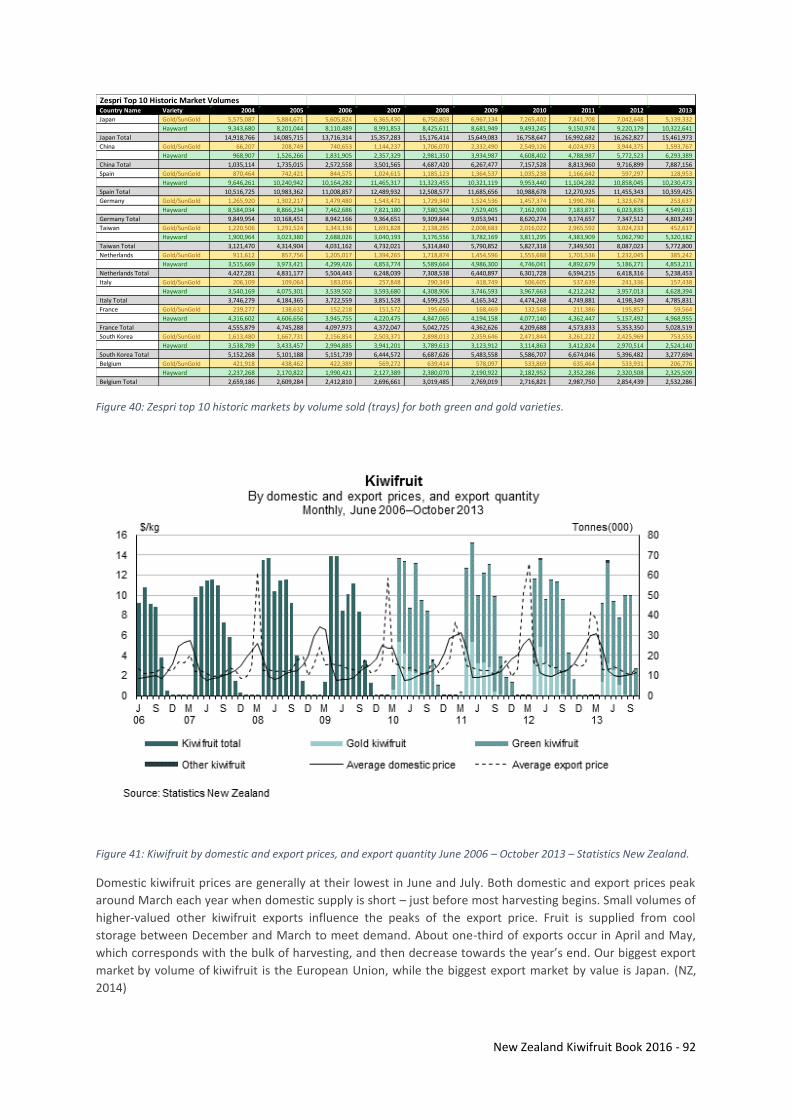
New Zealand Kiwifruit Book 2016 - 92
Figure 40: Zespri top 10 historic markets by volume sold (trays) for both green and gold varieties.
Figure 41: Kiwifruit by domestic and export prices, and export quantity June 2006 – October 2013 – Statistics New Zealand.
Domestic kiwifruit prices are generally at their lowest in June and July. Both domestic and export prices peak
around March each year when domestic supply is short – just before most harvesting begins. Small volumes of
higher-valued other kiwifruit exports influence the peaks of the export price. Fruit is supplied from cool
storage between December and March to meet demand. About one-third of exports occur in April and May,
which corresponds with the bulk of harvesting, and then decrease towards the year’s end. Our biggest export
market by volume of kiwifruit is the European Union, while the biggest export market by value is Japan. (NZ,
2014)
Zespri Top 10 Historic Market VolumesCountry Name Variety 2004 2005 2006 2007 2008 2009 2010 2011 2012 2013
Japan Gold/SunGold 5,575,087 5,884,671 5,605,824 6,365,430 6,750,803 6,967,134 7,265,402 7,841,708 7,042,648 5,139,332
Hayward 9,343,680 8,201,044 8,110,489 8,991,853 8,425,611 8,681,949 9,493,245 9,150,974 9,220,179 10,322,641
Japan Total 14,918,766 14,085,715 13,716,314 15,357,283 15,176,414 15,649,083 16,758,647 16,992,682 16,262,827 15,461,973
China Gold/SunGold 66,207 208,749 740,653 1,144,237 1,706,070 2,332,490 2,549,126 4,024,973 3,944,375 1,593,767
Hayward 968,907 1,526,266 1,831,905 2,357,329 2,981,350 3,934,987 4,608,402 4,788,987 5,772,523 6,293,389
China Total 1,035,114 1,735,015 2,572,558 3,501,565 4,687,420 6,267,477 7,157,528 8,813,960 9,716,899 7,887,156
Spain Gold/SunGold 870,464 742,421 844,575 1,024,615 1,185,123 1,364,537 1,035,238 1,166,642 597,297 128,953
Hayward 9,646,261 10,240,942 10,164,282 11,465,317 11,323,455 10,321,119 9,953,440 11,104,282 10,858,045 10,230,473
Spain Total 10,516,725 10,983,362 11,008,857 12,489,932 12,508,577 11,685,656 10,988,678 12,270,925 11,455,343 10,359,425
Germany Gold/SunGold 1,265,920 1,302,217 1,479,480 1,543,471 1,729,340 1,524,536 1,457,374 1,990,786 1,323,678 253,637
Hayward 8,584,034 8,866,234 7,462,686 7,821,180 7,580,504 7,529,405 7,162,900 7,183,871 6,023,835 4,549,613
Germany Total 9,849,954 10,168,451 8,942,166 9,364,651 9,309,844 9,053,941 8,620,274 9,174,657 7,347,512 4,803,249
Taiwan Gold/SunGold 1,220,506 1,291,524 1,343,136 1,691,828 2,138,285 2,008,683 2,016,022 2,965,592 3,024,233 452,617
Hayward 1,900,964 3,023,380 2,688,026 3,040,193 3,176,556 3,782,169 3,811,295 4,383,909 5,062,790 5,320,182
Taiwan Total 3,121,470 4,314,904 4,031,162 4,732,021 5,314,840 5,790,852 5,827,318 7,349,501 8,087,023 5,772,800
Netherlands Gold/SunGold 911,612 857,756 1,205,017 1,394,265 1,718,874 1,454,596 1,555,688 1,701,536 1,232,045 385,242
Hayward 3,515,669 3,973,421 4,299,426 4,853,774 5,589,664 4,986,300 4,746,041 4,892,679 5,186,271 4,853,211
Netherlands Total 4,427,281 4,831,177 5,504,443 6,248,039 7,308,538 6,440,897 6,301,728 6,594,215 6,418,316 5,238,453
Italy Gold/SunGold 206,109 109,064 183,056 257,848 290,349 418,749 506,605 537,639 241,336 157,438
Hayward 3,540,169 4,075,301 3,539,502 3,593,680 4,308,906 3,746,593 3,967,663 4,212,242 3,957,013 4,628,394
Italy Total 3,746,279 4,184,365 3,722,559 3,851,528 4,599,255 4,165,342 4,474,268 4,749,881 4,198,349 4,785,831
France Gold/SunGold 239,277 138,632 152,218 151,572 195,660 168,469 132,548 211,386 195,857 59,564
Hayward 4,316,602 4,606,656 3,945,755 4,220,475 4,847,065 4,194,158 4,077,140 4,362,447 5,157,492 4,968,955
France Total 4,555,879 4,745,288 4,097,973 4,372,047 5,042,725 4,362,626 4,209,688 4,573,833 5,353,350 5,028,519
South Korea Gold/SunGold 1,613,480 1,667,731 2,156,854 2,503,371 2,898,013 2,359,646 2,471,844 3,261,222 2,425,969 753,555
Hayward 3,538,789 3,433,457 2,994,885 3,941,201 3,789,613 3,123,912 3,114,863 3,412,824 2,970,514 2,524,140
South Korea Total 5,152,268 5,101,188 5,151,739 6,444,572 6,687,626 5,483,558 5,586,707 6,674,046 5,396,482 3,277,694
Belgium Gold/SunGold 421,918 438,462 422,389 569,272 639,414 578,097 533,869 635,464 533,931 206,776
Hayward 2,237,268 2,170,822 1,990,421 2,127,389 2,380,070 2,190,922 2,182,952 2,352,286 2,320,508 2,325,509
Belgium Total 2,659,186 2,609,284 2,412,810 2,696,661 3,019,485 2,769,019 2,716,821 2,987,750 2,854,439 2,532,286
New Zealand Kiwifruit Book 2016 - 93
REFERENCES Agency, United States Environmental Protection. (2008). Copper Facts: US Environmental Protection Agency. Aitken, A. G. , & Hewett, E. W. (2012 ). New Zealand Horticulture 2012 (Vol. Fresh Facts 14 pp. 19): Plant & Food Research
and Horticulture New Zealand, Auckland, New Zealand http://www.plantandfood.co.nz/file/annual-report-2010-Anon. (2010). Discover, Innovate, Grow Keeping the kiwi flying
discover.pdf: Plant & Food Research Anon. (2012). Kiwifruit breeder honoured for $3 billion contribution Scoop Business Independent News
http://www.kvh.org.nz/about_kvhAnon. (2015 ). About KVH from Benge, J. (2015). Sustainable nutrient management. NZ Kiwifruit Journal. September/October. Benge, J. & Clothier, B. (2016). Freshwater quality and eco-verification of kiwifruit orchard practices. Ferguson, AR. (1990). The genus Actinidia. Kiwifruit: science and management. Auckland, Ray Richards in association with
New Zealand Society for Horticultural Science, 15-35. Goodwin, RM. (2000). Zespri Innovation Kiwifruit Pollination Manual: Zespri Innovation Company Limited & The
Horticulture and Food Research Institute of New Zealand Limited. Max, S., Woodward, T., Currie, M., & Blattmann, P. (2012). KiwiTech Bulletin No. N49 Tip Squeezing. Mowat, A. (2015). Growers benefit from sustainability New Zealand Kiwifruit Journal(229), 17-19 NZ, Statistics. (2014). Fresh fruit and vegetable prices - our global connection. O'Rourke, D., & (2014 ). World Kiwifruit Review 2014 Edition Pullman Belrose. OPC, Zespri. (2014). KiwiTech Bulletin No. N36 Trunk Girdling. Palmer, M. (2013). The Importance of Taste. New Zealand Kiwifruit Journal, 29-30. Patterson, K., Blattmann, P., Currie, M., & Max, S. (2013). KiwiTech Bulletin No. N50 Zero-Leaf Pruning. Pentreath, B. P. (2013). KiwiTech Bulletin No. 95 Soil Ripping and Root Pruning. RBNZ. (2012). Reserve Bank of New Zealand Riding, I. W. (2004). Frost Protection Systems - Their Use and Limitations. New Zealand Kiwifruit Journal. Sale, P.R., Lyford P.B. . (1990). Cultural, management and harvesting practices for kiwifruit in New Zealand. Kiwifruit:
science and management. Auckland, Ray Richards in association with New Zealand Society for Horticultural Science, 267.
Stokes, C. (2014). How much is lack of good shelter costing you? New Zealand Kiwifruit Journal. Ward, C. (2014). Return on your marketing investment. New Zealand Kiwifruit Journal. Woodard, T. (2012). KiwiTech Bulletin No. N45 Taste, Dry Matter & Brix. Zespri. (2014a). Growing Zespri Kiwifruit: Zespri. Zespri. (2016b). Zespri Kiwifruit Annual Report 2015/2016. Mount Maunganui. Zespri. (2014c). Zespri Orchard Production System. Mount Maunganui: Zespri Group Ltd.