Embed Size (px)
Citation preview

Institute for Thermal Turbomaschinery and Machine Dynamics
Graz University of TechnologyErzherzog-Johann-University
A Further Step Towards a Graz Cycle Power Plant for CO2 Capture
Presentation at the ASME Turbo Expo 2005
Reno-Tahoe, Nevada, USA, June 6 - 9, 2005
Wolfgang Sanz, Herbert Jericha, Florian Luckel, Emil Göttlich and Franz HeitmeirInstitute for Thermal Turbomachinery and Machine Dynamics
Graz University of TechnologyAustria

Background
• Kyoto Protocol demands the reduction of greenhouse gases, mainly CO2
• In EU: strong pressure on utilities and companies to reduce CO2 emissions
• In 2005: emission allowances to about 10 000 companies within the EU covering about 46 % of the overall EU CO2 emissions
• As emission allowances become scarce: CO2 emissions generate costs (estimated between 12 and 25 $/ton CO2 by 2010 and even more by 2015)

Possible New Technologies
Therefore search for economical solutionsfor the capture of CO2 from power plants:
• Fossil fuel pre-combustion decarbonization to produce pure hydrogen or hydrogen enriched fuel for a power cycle (e.g. steam reforming of methane)
• Power cycles with post-combustion CO2 capture (membrane separation, chemical separation, ...)
• Chemical looping combustion: separate oxidation and reduction reactions for natural gas combustion leading to a CO2/H2O exhaust gas
• Oxy-fuel power generation: Internal combustion with pure oxygen and CO2/H2O as working fluid enabling CO2 separation by condensation

Pros and Cons of Oxy-Fuel Combustion
• Combustion with nearly pure oxygen leads to anexhaust gas consisting largely of CO2 and H2O
+ CO2 can be easily separated by condensation, noneed for very penalizing scrubbing
+ Very low NOx generation (only nitrogen from fuel)
+ Flexibility regarding fuel: natural gas, syngas from coal or biomass gasification, ...
- New equipment required
- Additional high costs of oxygen production
+ New cycles are possible with efficiencies higher than current air-based combined cycles (Graz Cycle,Matiant cycle, Water cycle,...)

History of the Graz Cycle
• 1985: presentation of a power cycle without any emission (CIMAC Oslo)• H2/O2 internally fired steam cycle, as integration of top Brayton
cycle with steam and bottom Rankine cycle • efficiency 6 % - points higher than state-of-the art CC plants
• 1995: Graz cycle adopted for the combustion of fossil fuels like methane (CH4) (CIMAC Interlaken & ASME Cogen Wien)• cycle fluid is a mixture of H2O and CO2• thermal cycle efficiency: 64 %
• 2000: thermodynamically optimized cycle for all kinds of fossil fuel gases (VDI Essen)
• 2002/2003: conceptual layout of prototype Graz Cycle power plant: detailed design of components (ASME Amsterdam, VDI Leverkusen, ASME Atlanta)
• 2004: presentation of S-Graz Cycle with nearly 70% thermal efficiency and 57 % net efficiency for syngas firing (ASME Vienna)

High Steam Content Graz Cycle (S-GC)
H2O
CO2CO2
C3/C4
Cond. P.water
Feed Pump180 bar565°C
HPTDeaerator
HTT High Temperature Turbine
HRSG Heat Recovery Steam Gen.
LPT Low Pressure Turbine
C3/C4 CO2 Compressors
C1/C2 Cycle Fluid Compressors
HPT High Pressure Turbine
0.04 bar
LPT Condenser
C1/C2
600°C
Cycle Fluid
77 % H2O23 % CO2
Fuel(methane)
O2Combustor
steam
40 bar
HTT1400°C
HRSG
1bar573°C

T-s Diagram of S-Graz Cycle
CombustorHT Turbine
HP Turbine
LP TurbineH2O saturation line
IntercooledCompression
Condenser

Power Balance ASME 2004
• Electrical cycle efficiency for methane firing:
Efficiency: 67.6 %
• Oxygen production (0.15 - 0.3): 0.25 kWh/kg (8 MW)Oxygen compression (1 to 40 bar, inter-cooled):0.125 kWh/kg (4 MW)
Efficiency: 56.8 %
• Compression of separated CO2 for liquefaction (1 to 100 bar, inter-cooled): 0.075 kWh/kg (3.7 MW)Efficiency: 55.3 %
-> Interest by a possible end-user: technical and economical evaluation of S - Graz Cycle

Conservative Assumptions I
2004 assumptions Conservative assumptions
Fuel methane natural gas
Combustion pressure 40 bar, no pressure loss 40 bar, 4 % pressure loss
Combustion chamber heat loss
not considered 0.25 %
Combustion temperature 1400 °C 1400 °C
Oxygen excess 0 % 3 % of stoichiometricamount
Turbine efficiency 92 % for all turbines HTT: 90.3 % HPT: 90 %LPT: 88 %
Compressor efficiency 88 % for all compressors
working fluid: 88 % O2: 85 %CO2: 78 % – 85 %
Pump efficiency 98 % 70 %
Cooling steam mass flow 11.4 % of HTT inlet mass
13.7 % of HTT inlet mass

Conservative Assumptions II
Heat exchanger pressure loss
not considered 3 %
HRSG pressure loss 5 bar 28 bar
HRSG minimum temperature difference
ECO: 5 KSH: 8.6 K
ECO: 5 KSH: 25 K
Condenser exit temperature
18 °C 18 °C
Condenser pressure 0.06 bar 0.0413 bar
Fuel temperature 250 °C 150 °C
Mechanical efficiency 99 % 99.6 %
Generator / Transformer efficiency
98.5 % / 100 % 98.5 % / 99.65 %
Auxilliary losses not considered 0.35 %
Oxygen production 900 kJ/kg 900 kJ/kg
Oxygen compression 1 – 40 bar: 400 kJ/kg 2.38 – 42 bar: 325 kJ/kg
CO2 compression 1 to 100 bar
245 kJ/kg 350 kJ/kg

Power Balance
64.6Electrical cycle efficiency [%]
66.5Thermal cycle efficiency [%]
143.4Total heat input [MW]
95.3Net shaft power [MW]
47.1 Total compression power [MW]
142.4Total turbine power [MW]
119.4HTT power [MW]
20052004
127.6
67.6
70.1
143.4
100.5
50.2
150.7

Additional Losses and Expenses (S-GC)
• Oxygen production: 0.25 kWh/kg = 900 kJ/kg (10.0 MW)Oxygen compression (2.38 to 42 bar, inter-cooled):325 kJ/kg (3.6 MW)
Efficiency: 54.8 %
• Compression of separated CO2 for liquefaction (1 to 100 bar, 8 % steam content): 350 kJ/kg (3.2 MW)
Efficiency: 52.6 %
2004 assumptions:Respective efficiencies: 56.8 % / 55.3 %

Turbomachinery Arrangement S-Graz Cycle
• Different turbomachinery arrangement with 2 shafts
• First shaft: balance of compessor and turbine power
• Second shaft drives generator
• Turbo set with 3 different speeds23 000 rpm: HTT first stage + HPT + C2 WF-compressor12 000 rpm: HTT 2nd-4th stage + C1 WF-compressor + C4 CO2-compr.3 000 rpm: LPT + C4 CO2-compressor
• First layout for 100 MW plant: reasonable turbomachinery dimensions
3 000 rpm 12 000 rpm 23 000 rpm 3 000 rpm12 000 rpm

Modifications
Possible modifications in order to improve efficiency:
• replacement of the single-pressure HRSG by a dual-pressure HRSG
• condensation of the cycle working fluid at 1 bar and re-vaporization of the separated water
• heat supply to the deaerator by the cooling heat of the CO2 compression intercooler

Dual-Pressure HRSG
Goal: reduced heat transfer losses by smaller temperature differences
• HTT cooling steam at 40 bar and 15 bar offers possibility of a second pressure level at either
- 40 bar (44 % of total HRSG mass flow) or- 15 bar (15 % of total HRSG mass flow)
0
100
200
300
400
500
600
700
0 25,000 50,000 75,000
Q_trans [kW]
Tem
pera
ture
[°C
]
Exhaust GasDual Pressure HRSG 180/40 barDual Pressure HRSG 180/15 bar
Single Pressure HRSG 180 bar
• Result:reduced HPT steam mass flow andhigher LPT inlet temperature -> decrease in efficiency

Condensation/Re-Vaporization at 1 bar - I
Cooling water temperature: 10°C -> pressure: 0.045 bar• Steam/CO2 mixture is expanded in LPT to condenser pressure• After separation CO2 is re-compressed to atmosphere• Difficulties:
CO2CO2
C3/C4
0.04 bar
LPT Condenser
water
1 bar
0.48
0.5
0.52
0.54
0.56
0.58
0.6
0.62
0.64
0.66
0 0.05 0.1 0.15 0.2 0.25 0.3 0.35
Condenser pressure [bar]
Net
eff
icie
ncy
Electrical EfficiencyNet Efficiency
1. Condenser is very expensive (high volume flow, inert gas)
3. Loss due to different expansion/compression efficiencies
2. Difficulty in keeping vacuum condition (high inert gas content): high influence on net efficiency

Condensation/Re-Vaporization at 1 bar - II
Alternative 1: Condensation at 1 bar and re-vaporization
Steam0.025 bar
LPT Condenser
Water
CO2Working fluid from HRSG, 1 bar
Feed water to HRSG
Condenser
EvaporatorWater, 0.3-0.6 bar
Throttle
• Avoidance of difficult condenser at vacuum condition• Avoidance of C3+C4 CO2 compressors• Additional condensation/re-vaporization unit at 1 bar

Condensation/Re-Vaporization at 1 bar - III
Alternative 1: Condensation at 1 bar and re-vaporization
• Lower vaporization pressure allows higher super-heating• Best results for a dual pressure vaporization

Condensation/Re-Vaporization at 1 bar – Var. 1
• Optimum for dual pressure vaporization at 0.55/0.3 bar• Losses: 0.18 bar for HP and 0.08 bar for LP• Net efficiency remains the same with 52.6 % • Perspective of cost savings and efficiency improvement
40
60
80
100
120
140
160
180
200
0 10000 20000 30000 40000 50000 60000 70000
Q_trans [kW]
Tem
pera
ture
[°C
]
exhaust gaswater

Condensation/Re-Vaporization at 1 bar - V
Alternative 2: Condensation at 1 bar and heat use in a bottoming steam cycle
• More flexibility • Easier start-up• Easier water make-up
• Use of intercooler heat from CO2 compression to 100 bar allows higher vaporization pressure of 0.7 bar

Use of heat of CO2 intercoolers
Graz Cycle is penalized with effort for CO2 compression to 100 bar for transport or further use
• CO2 compression needs several stages with intercooling
• Heat from intercoolers can be utilized in the process
• Water deaeration using intercooler heat instead extraction in front of LPT can increase cycle efficiency by + 0.8 %-points
Working fluid from HRSG
Heat from CO2compression intercoolers
LPT
Deaerator
Feed water to HRSG

Economic Analysis S-GC - I
Component Scaleparameter
Specificcosts
Reference Plant [13]
Investment costs Electric power $/kWel 414
S-Graz Cycle Plant
Investment costs Electric power $/kWel 414
Air separation unit [14] O2 mass flow $/(kg O2/s) 1 500 000
Other costs (Piping,CO2-Recirc.) [14]
CO2 mass flow $/(kg CO2/s) 100 000
CO2-Compressionsystem [14]
CO2 mass flow $/(kg CO2/s) 450 000
• yearly operating hours: 6500 hrs/yr
• capital charge rate: 15%/yr
• natural gas is supplied at 1.3 ¢/kWhth
Investment costs
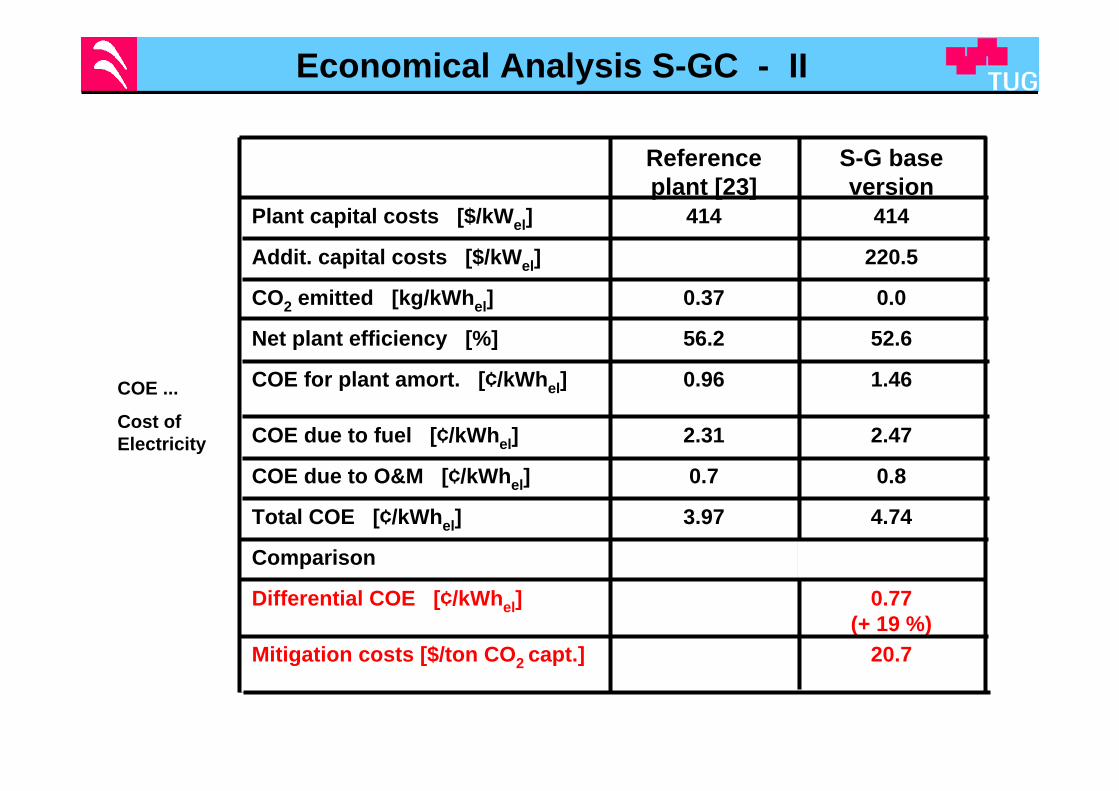
Economical Analysis S-GC - II
COE ...
Cost ofElectricity
Reference plant [23]
S-G base version
Plant capital costs [$/kWel] 414 414
Addit. capital costs [$/kWel] 220.5
CO2 emitted [kg/kWhel] 0.37 0.0
Net plant efficiency [%] 56.2 52.6
COE for plant amort. [¢/kWhel] 0.96 1.46
COE due to fuel [¢/kWhel] 2.31 2.47
COE due to O&M [¢/kWhel] 0.7 0.8
Total COE [¢/kWhel] 3.97 4.74
Comparison
Differential COE [¢/kWhel] 0.77(+ 19 %)
Mitigation costs [$/ton CO2 capt.] 20.7

Capital Costs: 13.6 $/ton
Fuel Costs: 4.4 $/ton
O&M:2.7 $/ton
Economical Analysis S-GC - III
Composition of Mitigation Costs
Total: 20.7 $/ton CO2
Decisive Influence of Capital Costs

Influence of Capital Costs S-GC
Large uncertainty in cost estimation:
53 % additional capital costs for air supply and CO2 compression[Göttlicher] is favorable
-10
0
10
20
30
40
50
60
100 150 200 250 300
Capital Cost Ratio between S-GC and Ref. Plant [%]
Miti
gatio
n C
osts
[$/t
CO
2]
Range of ASU costs
e.g.: ASU: cost estimates differ between 170 and 400 $/kW_el

Conclusions
• Based on the very favorable data of the High-Steam-Content S-Graz Cylce for syngas firing, it is evaluated for natural gas firing
• Thermodynamic layout with conservative component efficiencies results in a cycle efficiency of 64.6 % and a net efficiency of 52.6 % (O2 supply and CO2 compression)
• Possible modifications to improve cycle are investigated: a condenser/evaporator unit at 1 bar promises simpler arrangement and lower costs at the same efficiency
• Economic comparison with reference plant show the strong influence of capital costs on CO2 mitigation costs
• Mitigation costs of 20 $/ton CO2 are only possible for favorable additional investment costs


![Graz Cycle asme2010 endversionThe Graz Cycle system, an oxy-fuel cycle with internal combustion of fossil fuels with pure oxygen, was first presented by Jericha et al. in 1995 [4]](https://img.pdfslide.us/doc/110x75/5fdc419359aa0a5a6d2b963c/graz-cycle-asme2010-the-graz-cycle-system-an-oxy-fuel-cycle-with-internal-combustion.jpg)