Embed Size (px)
Citation preview

A FEASIBILITY STUDY OF LAUNCHING CAR WASH
BUSINESS IN BANGKOK
By
Warun Jirachaisingh
SIU PS: SOM-MBA-2006-07

A FEASIBILITY STUDY OF LAUNCHING CAR WASH
BUSINESS IN BANGKOK
A Project Presented
By
Warun Jirachaisingh
Master of Business Administration in Management
School of Management
Shinawatra University
June 2007
Copyright of Shinawatra University

i
Acknowledgments
Many people have greatly supported and provide enormous assistance to the
completion of my project study. I would like to faithfully acknowledge my advisor,
Dr. Chanchai Bunchapatanasakda. This study would not be able to be successfully
completed without Dr. Chanchai’s ultimate kindness for his supervision and valuable
advices. His experiences, expertise, professional guidance, and encouragement and
any necessary inspirations received from him had brought me out to the confidences
and strong attempt and willingness to commit myself to the research.
I would like to express my thankful faithfulness to all MBA professors for
teaching me in all courses and for additional useful and supportive advices and
recommendations and suggestions, especially Dr. Pacapol Anurit, who gave very
useful suggestions on proposal defense presentation day.
I would like to deliver my honest gratitude to Shinawatra University for its
granted educational scholarship and good experiences, and all of the university staffs
for providing all possible conveniences and good coordinative management and
assistances during I have spent for whole academic years in university. Furthermore, I
would like to state my sincere impressions to all colleagues, who had given me a very
truly strong friendship, encouragement and shared experiences and activities
throughout the times we have spent on studies.
Finally, I was utterly grateful to my family, Mr. Visith, Mrs. Prannarai, and
Mr. Wanich Jirachaisingh, my parents and my younger brother who had continuously
and fully always and encouraged me in every time and everything whenever needed.
ii
Abstract
The purpose of this study was to identify the direction of market opportunity
for car wash business in Bangkok and provide database and information for
entrepreneurs who are interested in this business can make a decision on investing in
launching car wash business based on customers’ need not just financially but also in
other aspects of management as well. The study investigated the significance of the
relationship between demographic factors, marketing mix factors and factors that
influence decision making on using car wash service in Bangkok. We employed
descriptive statistics to analyze demographic data and One-Way ANOVA methods
was used to test the hypotheses.
The findings indicated that 86.8 percent of the respondents are regularly using
car wash service. Their most convenient time is in the evenings during the weekends.
Majority of them select the service with service charge 100 to 200 baht per time. They
prefer to subscribe to the car wash service membership less than 2,000 baht. Top three
priorities when they are choosing to be membership with car wash service operators
were location, reliability and cleanness. The groups also stated that quality of the
wash, safety, scratch protection, and satisfaction with the works are very important
decision making factors that they concern when using car wash service. Finally, the
group recommended that car wash service should charge the reasonable price, have
good and friendly employees and do not waste the customers’ time. It should have a
delivery service and have guarantee policies not only the quality of the wash matters
but also the safety and properties inside the car. It should have additional services
such as the waiting room, coffee club, bookstore, beauty shop for customers to use
when they are waiting for their cars cleaned.
Regarding financial analysis, we found that the investment will be returned
within 3 years and IRR (Internal rate of return) for this project is 17.54% based on the
assumption that the initial investment is estimated at 1,500,000 baht.
Keywords:
Car washes, Car wash industry – Bangkok, Customer satisfaction,
Quality guarantee policy
iii
Table of Contents
Title Page
Acknowledgments i
Abstract ii
Table of Contents iii
List of Figures v
List of Tables vi
Chapter 1 Introduction
1.1 Research Background 1
1.2 Research Objectives 2
1.3 Scope of Research 2
1.4 Research Significance 2
1.5 Conceptual Framework 3
1.6 Hypotheses 3
1.7 Definitions of Terms 4
Chapter 2 Literature Review
2.1 Marketing Mix 5
2.2 Service Marketing 13
2.3 Consumer Buying Decision Processes 14
2.3.1 The consumer decision process model 15
2.3.2 Variables that shape the decision process 17
2.4 Previous Researches 19
Chapter 3 Research Methodology
3.1 Introduction 25
3.2 Population and Sample Size 25
3.3 Data Collecting Method 26
3.4 Research Design 26
3.5 Data Collecting Procedure 27
iv
3.6 Data Analysis 28
Chapter 4 Research Findings and Analysis
4.1 Demographic Characteristics of Respondents 29
4.2 Using Car Wash Service Behavior Pattern of Respondents 33
4.3 Decision Making on Using Car Wash Service in Bangkok 45
4.4 Testing of the Hypothesis 46
4.5 Financial Analysis 68
4.5.1 Revenues forecast 68
4.5.2 Unit cost 68
4.5.3 Break-even analysis 70
4.5.4 Income forecast 70
4.5.5 Cash flow forecast 71
4.5.6 Revenues forecast, income forecast,
And cash flow forecast from the fifth year on 72
4.6 Cash Management 73
4.7 Human Resources Management 74
4.8 SWOT Analysis 75
4.9 BCG Matrix 76
Chapter 5 Conclusions and Recommendations
5.1 Conclusions 79
5.2 Recommendations 80
References 82
Appendices
Appendix A Questionnaire (English) 85
Appendix B Questionnaire (Thai) 91
Biography 97

v
List of Figures
Title Page
Figure 2.1 Model of Buyer Behavior 6
Figure 2.2 The Four Ps Components of the Marketing Stimulus 7
Figure 2.3 How Consumers Make Decisions for Goods and Services 17
Figure 4 BCG Matrix 7
vi
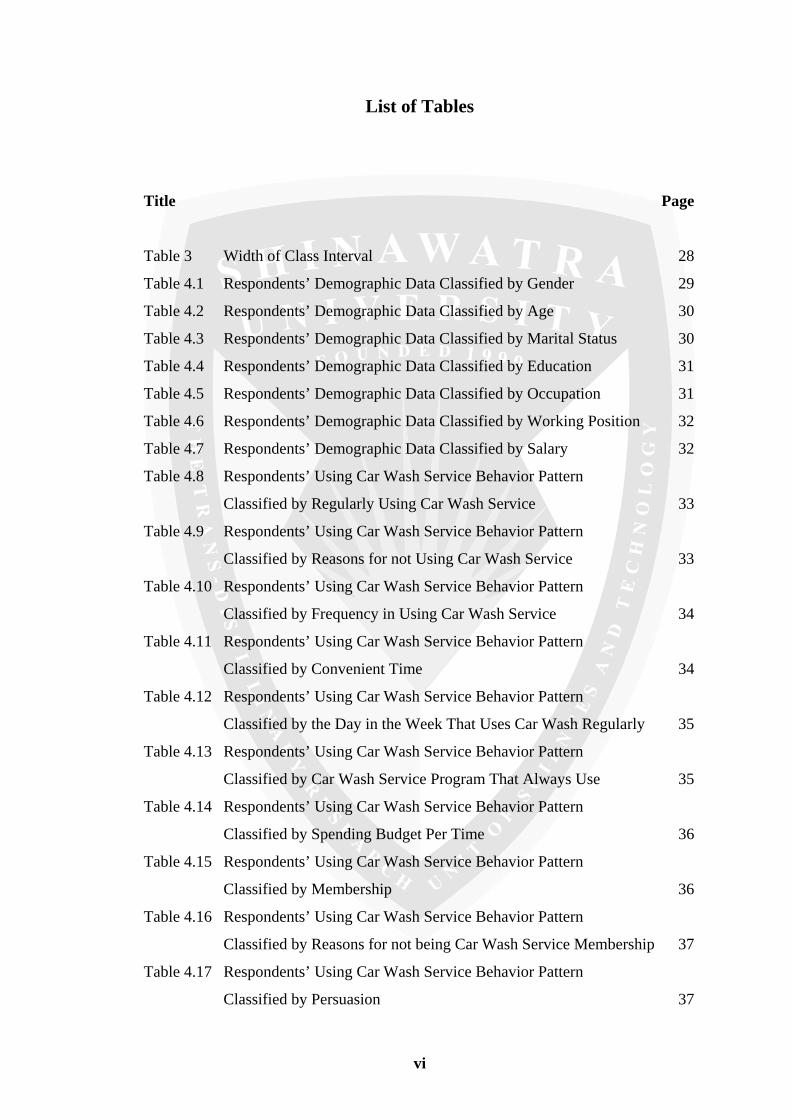
List of Tables
Title Page
Table 3 Width of Class Interval 28
Table 4.1 Respondents’ Demographic Data Classified by Gender 29
Table 4.2 Respondents’ Demographic Data Classified by Age 30
Table 4.3 Respondents’ Demographic Data Classified by Marital Status 30
Table 4.4 Respondents’ Demographic Data Classified by Education 31
Table 4.5 Respondents’ Demographic Data Classified by Occupation 31
Table 4.6 Respondents’ Demographic Data Classified by Working Position 32
Table 4.7 Respondents’ Demographic Data Classified by Salary 32
Table 4.8 Respondents’ Using Car Wash Service Behavior Pattern
Classified by Regularly Using Car Wash Service 33
Table 4.9 Respondents’ Using Car Wash Service Behavior Pattern
Classified by Reasons for not Using Car Wash Service 33
Table 4.10 Respondents’ Using Car Wash Service Behavior Pattern
Classified by Frequency in Using Car Wash Service 34
Table 4.11 Respondents’ Using Car Wash Service Behavior Pattern
Classified by Convenient Time 34
Table 4.12 Respondents’ Using Car Wash Service Behavior Pattern
Classified by the Day in the Week That Uses Car Wash Regularly 35
Table 4.13 Respondents’ Using Car Wash Service Behavior Pattern
Classified by Car Wash Service Program That Always Use 35
Table 4.14 Respondents’ Using Car Wash Service Behavior Pattern
Classified by Spending Budget Per Time 36
Table 4.15 Respondents’ Using Car Wash Service Behavior Pattern
Classified by Membership 36
Table 4.16 Respondents’ Using Car Wash Service Behavior Pattern
Classified by Reasons for not being Car Wash Service Membership 37
Table 4.17 Respondents’ Using Car Wash Service Behavior Pattern
Classified by Persuasion 37
vii
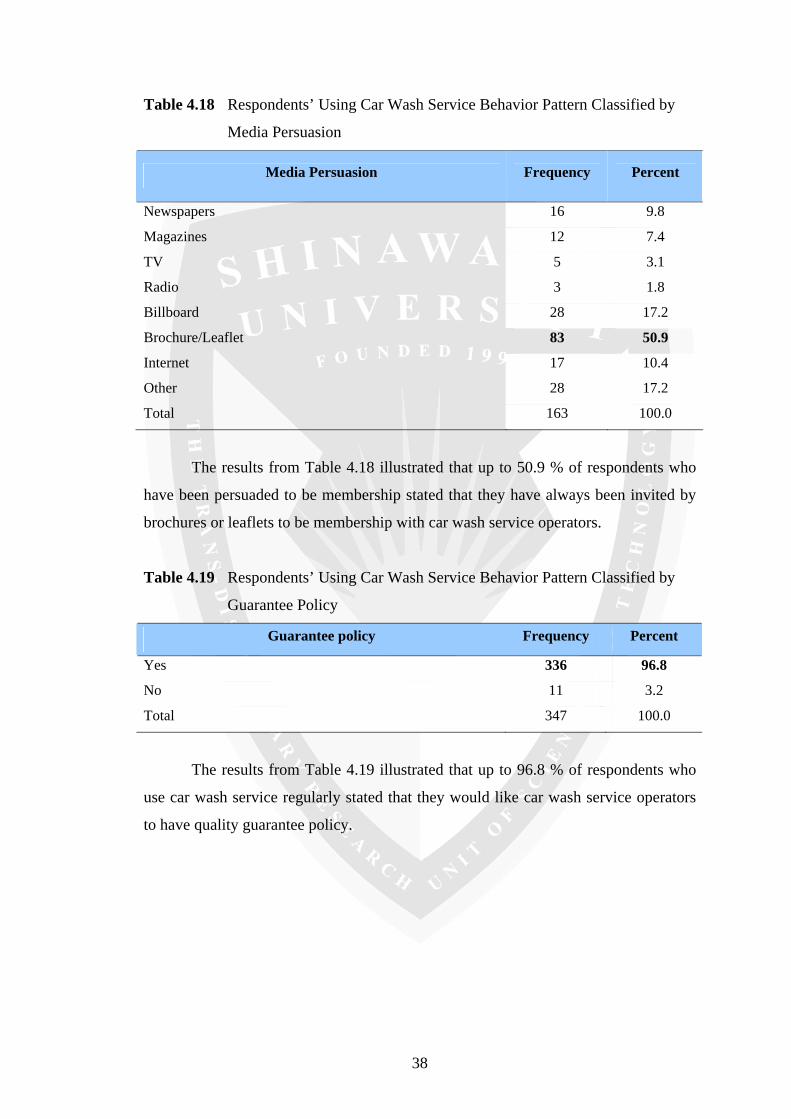
Table 4.18 Respondents’ Using Car Wash Service Behavior Pattern
Classified by Media Persuasion 38
Table 4.19 Respondents’ Using Car Wash Service Behavior Pattern
Classified by Guarantee Policy 38
Table 4.20 Respondents’ Using Car Wash Service Behavior Pattern
Classified by Guarantee is better or not 39
Table 4.21 Respondents’ Using Car Wash Service Behavior Pattern
Classified by Yearly Member 39
Table 4.22 Respondents’ Using Car Wash Service Behavior Pattern
Classified by Regularly Car Wash Service Place 40
Table 4.23 Respondents’ Using Car Wash Service Behavior Pattern
Classified by Rationales for becoming a Member 40
Table 4.24 Respondents’ Using Car Wash Service Behavior Pattern
Classified by Rationales for becoming a Member for
People who have been Membership already 41
Table 4.25 Respondents’ Using Car Wash Service Behavior Pattern
Classified by Rationales for becoming a Member for
People who have not been Membership yet 42
Table 4.26 Respondents’ Using Car Wash Service Behavior Pattern
Classified by Expectation from Using Car Wash Service 43
Table 4.27 Respondents’ Using Car Wash Service Behavior Pattern
Classified by Additional Services That Car Wash
Service Place might think of 43
Table 4.28 Decision Making on Using Car Wash Service in
Bangkok of Respondents 45
Table 4.29 Relationship between Gender and Marketing Mix Factors 47
Table 4.30 Relationship between Age and Marketing Mix Factors 48
Table 4.31 Relationship between Marital Status and Marketing Mix Factors 49
Table 4.32 Relationship between Educational Background
and Marketing Mix Factors 50
Table 4.33 Relationship between Occupation and Marketing Mix Factors 51
Table 4.34 Relationship between Working Position and Marketing Mix Factors 52
Table 4.35 Relationship between Salary and Marketing Mix Factors 53
Table 4.36 Relationship between Gender and Decision Making Factors 54
viii
Table 4.37 Relationship between Age and Decision Making Factors 55
Table 4.38 Relationship between Marital Status and Decision Making Factors 56
Table 4.39 Relationship between Educational Background
and Decision Making Factors 57
Table 4.40 Relationship between Occupation and Decision Making Factors 58
Table 4.41 Relationship between Working Position and Decision Making Factors 59
Table 4.42 Relationship between Salary and Decision Making Factors 60
Table 4.43 Relationship between Car Wash Service Program that always used
and Decision Making Factors 61
Table 4.44 Relationship between Price and Decision Making Factors 62
Table 4.45 Relationship between Membership and Decision Making Factors 63
Table 4.46 Relationship between Guarantee Policy and Decision Making Factors 64
Table 4.47 Relationship between Guarantee is better or not
and Decision Making Factors 65
Table 4.48 Relationship between Yearly Member and Decision Making Factors 66
Table 4.49 Relationship between regularly place and Decision Making Factors 67
Table 4.50 Revenues Forecast from 2008 to 2012 68
Table 4.51 Total Washing Unit Cost 69
Table 4.52 Total Waxing Unit Cost 69
Table 4.53 Income Forecast from 2008 to 2012 71
Table 4.54 Cash Flow Forecast from 2008 to 2012 71
Table 4.55 Revenues Forecast from 2013 to 2017 72
Table 4.56 Income Forecast from 2013 to 2017 72
Table 4.57 Cash Flow Forecast from 2013 to 2017 73
Table 4.58 Number of Employees in each Department 74
Table 4.59 Number of Employees in each Department after Expansion 74

1
Chapter 1
Introduction
1.1 Research Background
At present, Bangkok is one of the most dynamic communities in the world
which approximately 6 million people are living in (“Number of population,” 2006)
and most of them are middle incomes group of people (According to National
Housing Authority, average salary of people who are living in Bangkok in 2004 is
28,135 baht) who have more purchasing power and want entertaining services and
relaxation at the same time.
In the meantime, car has become a part of their lives as well as a fifth factor
for these groups of people who have needs and wants continuously as the number of
personal car registered in Bangkok has increased from 1,526,417 in 2004 to
1,691,544 and 1,867,902 in 2005 and 2006 respectively (“Number of personal car,”
2007).
The great automobile has made the aftermarket what it is today, and along
with the times and technology advancements that came tumbling along with it,
business in this field has become far more competitive. The automobile aftermarket
such as car wash and repair business hasn’t stopped shifting and changing, right along
with the dynamic of the automobile. With such a rapidly-changing market, this
industry does not lend itself to business as usual. Those within it must keep up with
all the changes and advancements. They must stay attuned to their target market, try
to convince and retain most customers in order not to shift to others.
Nowadays, it seems that there are no entrepreneurs can satisfy and completely
dominate car wash business in Thailand seriously. Therefore, this research focused on
a feasibility study of launching car wash business in Bangkok which the researcher
believed that it will be useful for entrepreneurs who are interested in this business.

2
1.2 Research Objectives
To conduct the feasibility study of launching car wash business in Bangkok
1) To identify the direction of market opportunity for car wash business in
Bangkok
2) To provide database and information for entrepreneurs who are interested
in this business can make a decision on investing in launching car wash
business based on customers’ need
To become successful in an extremely fierce competition in the capitalism
market, entrepreneurs must have outstanding and well-defined strategies and
visionary management style. This research article will mainly focus on the
suggestions that will lead entrepreneurs to success not just financially but also in other
aspects of management as well.
1.3 Scope of Research
This research will focus on people who live in business districts, Bangkok
only, not including suburban area because the researcher believes these groups of
people are targeted and potential customers that might use car wash service.
1.4 Research Significance
Firstly, researchers can achieve and gain more knowledge about factors that
are likely to influence decision making on car wash service in Bangkok
Secondly, the information about demographic factors and marketing mix factor
that influence decision making on car wash service in Bangkok is useful for car wash
operators to access market situation, attract customers and plan effectively marketing
strategy.
Thirdly, the results of this research will benefit for companies, investors or
entrepreneurs who are interested in establishing car wash business in Bangkok.
Finally, findings from this study could be a reference for further study in the
same field of car wash and selected business. The further study could use information
from this study for other research such as the impact of car wash franchise on one stop
service, the expansion plan to operate new car wash systems and etc.
3
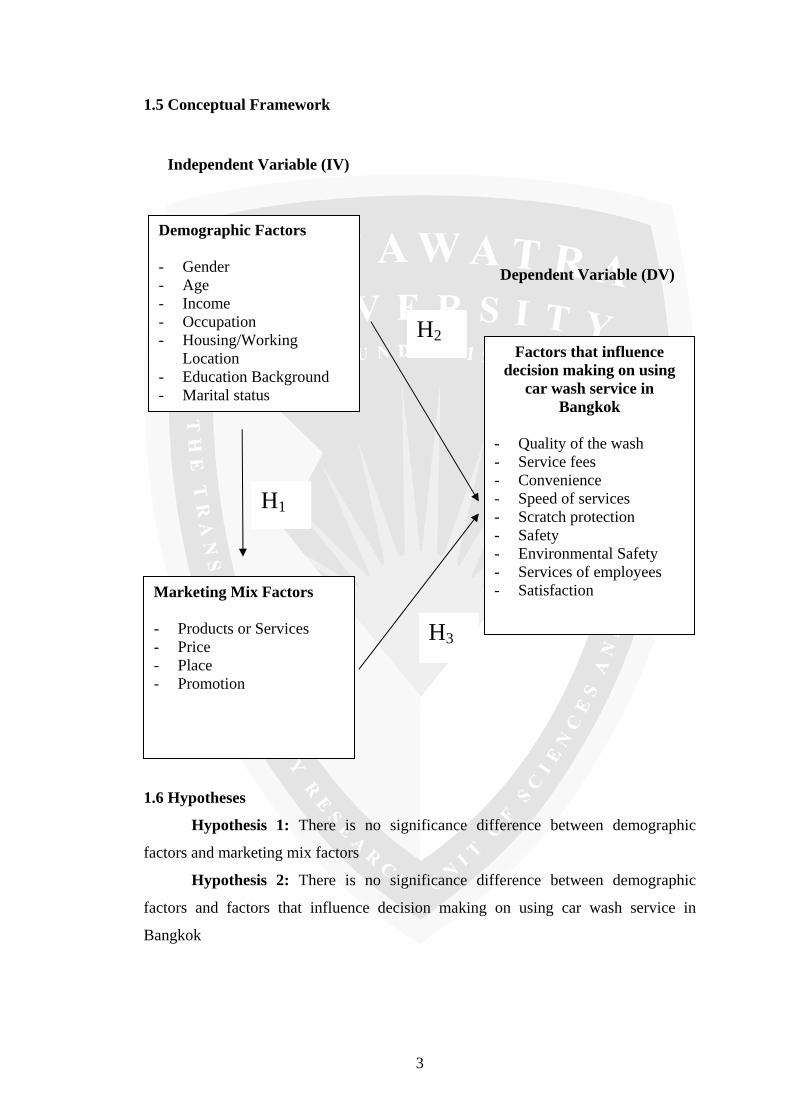
1.5 Conceptual Framework
Independent Variable (IV)
Dependent Variable (DV)
1.6 Hypotheses
Hypothesis 1: There is no significance difference between demographic
factors and marketing mix factors
Hypothesis 2: There is no significance difference between demographic
factors and factors that influence decision making on using car wash service in
Bangkok
H1
H2
Demographic Factors - Gender - Age - Income - Occupation - Housing/Working
Location - Education Background - Marital status
Factors that influence decision making on using
car wash service in Bangkok
- Quality of the wash - Service fees - Convenience - Speed of services - Scratch protection - Safety - Environmental Safety - Services of employees - Satisfaction
Marketing Mix Factors - Products or Services - Price - Place - Promotion
H3

4
Hypothesis 3: There is no significance difference between marketing mix
factors and factors that influence decision making on using car wash service in
Bangkok
1.7 Definitions of Terms
Self-Service Wash: A wash where the customer performs all the labor.
Generally, the customer drives into a bay and washes the car by means of a high
pressure hose and a foaming brush (“Car wash glossary,” n.d.).
Full-Service Wash: A conveyorized or tunnel wash that provides a complete
wash, vacuuming and drying, usually by hand (“Car wash glossary,” n.d.).
Exterior Wash: Carwash service that includes only a cleaning of the outside
of the car. Often this refers to an unattended wash, where no detailing services are
offered (“Car wash glossary,” n.d.).
Wash Material: Industry term for cloth used for cleaning in a friction wash
(“Car wash glossary,” n.d.).
Water Hardness: Soluble metal salts, (principally those of calcium and
magnesium, and sometimes iron and manganese) that when present in water in
sufficient amounts create cleaning problems. These metal salts remain on a vehicle
after the water evaporates leaving white spots (“Car wash glossary,” n.d.).

5
Chapter 2
Literature Review
This chapter consists of the point of view of Concept Framework why the
researcher thinks to run the car wash business and what is the origin of Car wash.
Moreover, the researcher takes the important Marketing Theory to apply the
opportunity to run business for maximize success. Concepts, theories, and previous
researches relating to the present study including:
1) Marketing Mix
2) Service Marketing
3) Consumer buying decision processes
4) Previous researches
2.1 Marketing Mix
McCarthy (1996) mentioned that marketing mix is the external factor that
influence on buyers’ purchasing decision. It consists of a set of controllable tactical
marketing tools such as product, price, place and promotion that the firm uses to
produce the response it wants in the target market. Zikmund (1996) stated that
marketing stimulus is the specific combination of interrelated and independent
marketing activities in which an organization engages to meet the objective. The basic
elements of the marketing stimulus are product, place, price, and promotion, which
also called controllable variables of marketing.
Kotler (2000) stated that on the left, marketing stimuli consist of 4Ps, Product,
Price, Place, and Promotion. Other stimuli include major forces and events in the
buyer’s environment- economic, technological, political and cultural. All stimuli enter
the buyer’s black box, where they are turned into a set of observable buyer response
shown on the right-product choice, brand choice, dealer choice, purchase timing and
purchase amount. Model of buyer behavior is shown in figure 2.1:

6
Figure 2.1 Model of Buyer Behavior
Source: Kotler (2000)
The marketer must understand how the stimuli are changed into responses
inside the consumer’s black box. The black box has two parts. First, the buyer’s
characteristics influence how he or she perceives and reacts to the stimuli. Second, the
buyer’s decision process itself affects outcomes.
Kotler (1997) suggested marketing stimulus is product, price, place and
promotion-components involved with the model of buyer behavior-influence on the
buyer’s consciousness, which related to buyer’s purchase decision. Kotler (2000) also
mentioned that marketing mix is the set of marketing tools that the firm uses to pursue
its marketing objectives in the target market. It is the communication of these
elements that meets customer needs and provides customer value; the particular
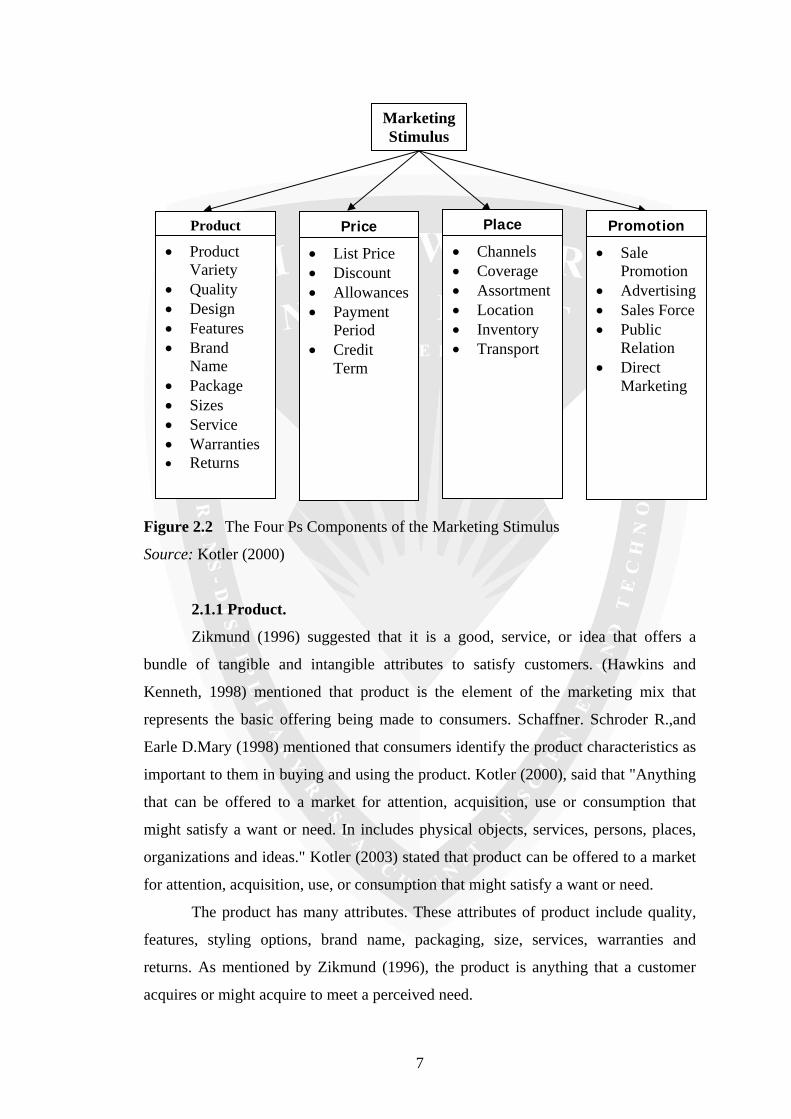
marketing variables under study are shown in Figure 2.2
- Product - Price - Place - Promotion
- Economic - Technological - Political - Cultural
Marketing Stimulus
Other Stimulus
- Problem recognition - Information search - Evaluation of alternatives - Purchase Decision - Postpurchase behavior
- Cultural - Social - Personal - Psychological
Buyer Decision Process
Buyer’s Characteristic
- Product choice - Brand choice - Dealer choice - Purchase timing - Purchase amount
Buyer’s Decision
7
Figure 2.2 The Four Ps Components of the Marketing Stimulus
Source: Kotler (2000)
2.1.1 Product.
Zikmund (1996) suggested that it is a good, service, or idea that offers a
bundle of tangible and intangible attributes to satisfy customers. (Hawkins and
Kenneth, 1998) mentioned that product is the element of the marketing mix that
represents the basic offering being made to consumers. Schaffner. Schroder R.,and
Earle D.Mary (1998) mentioned that consumers identify the product characteristics as
important to them in buying and using the product. Kotler (2000), said that "Anything
that can be offered to a market for attention, acquisition, use or consumption that
might satisfy a want or need. In includes physical objects, services, persons, places,
organizations and ideas." Kotler (2003) stated that product can be offered to a market
for attention, acquisition, use, or consumption that might satisfy a want or need.
The product has many attributes. These attributes of product include quality,
features, styling options, brand name, packaging, size, services, warranties and
returns. As mentioned by Zikmund (1996), the product is anything that a customer
acquires or might acquire to meet a perceived need.
Marketing Stimulus
Promotion
• Sale Promotion
• Advertising• Sales Force• Public
Relation • Direct
Marketing
Product
• Product Variety
• Quality • Design • Features • Brand
Name • Package • Sizes • Service • Warranties • Returns
Place
• Channels • Coverage • Assortment• Location • Inventory • Transport
• List Price • Discount • Allowances• Payment
Period • Credit
Term
Price
8
Product Varieties: Kotler (2003) mentioned that product variety is the
assortment breadth or the number of the product lines provided by seller. Normally
customer prefers a grater assortment because more choice provides and increases the
chance of finding what they need.
Quality: McCarthy (1996) mentioned that it is a product’s ability to satisfy a
consumer’s need or requirements. Kotler (2003) stated that product quality is the
ability of a product to perform its functions; it includes the product’s overall
durability, reliability, precision, ease of operation and repair; and other valued
attributes.
Design: As mentioned by Kotler (2003) the design is the heart of the product,
good design contributes to the product’s usefulness as well as its looks.
Feature: Kotler (2003) mentioned that product can be offered with variations
of each product in the mix in terms of colors, size, or models offered within each
product line. These features are competitive tool for differentiating the company’s
product from competitors’ products.
Brand: A name, term, sign, symbol, design, or combination of these, intended
to identify the goods, or services of one seller or group of sellers and differentiate
them from those competitor is called brand, mentioned by Kotler (2003)
Packaging: Chee and Harris (1993) stated that packaging can influence
consumer’s attitude toward the product. For the consumer goods, the packaging must
give the product competitive edge. The customer’s first exposure to the product is
package. Berkowitz (1994) mentioned that packaging is a component of the product
refers to any container in which it is offered for sale and on which information is
communicated. Kotler (2003) argued that packaging of designing and producing the
container or wrapper for a product. Innovative packaging can give a company an
advantage over competitors.
Size: The Company can introduce additional package sizes to the market
under the same brand name for line extensions (Kotler, 2003).
Product Support Services: Mentioned by Kotler (2003), the product support
service is the augment actual products such as Internet and modern technology. The
product support services will be focused on service industries. No less important are
product-bases industries that must provide a service bundle. All manufacturers of
equipment have to provide product support services to the customers and can charge
for it.
9
Warranties and Return: Chee and Harris (1993) stated that the important
factor of many products is the warranty. The manufacturers or service provider will
replace or refund or refund the product’s purchase’s price, if it is proves defective
during a specified time period. McCarthy (1996) stated that it is what the seller
promises about its product. Kotler (2003) also mentioned that the Company can sell
the product or service by adding warranty and return for supporting the consumer in
order to making a buying decision. Seller provides free maintenance and repair
service for specified period of time at a specified contract price.
2.1.2 Price.
Zikmund (1996) stated that price is amount of money or other consideration
that is something of value given in exchange for a product. (Hawkins and Kenneth,
1998) mentioned that price refers to the perceived value of goods and service
measured in some medium of exchange. Price refers to the cost of acquiring the
products / services in the eyes of customers. The different perception in products /
service quality leads to different identifying price. Consumers are often prepared to
pay a premium price for something that fits their needs better than the product they
currently use. E. Jerome McCarthy (1999) mentioned that price is amount of money
that is charged for something of value.
Kotler (1999) said "The amount of money charged for a product or service, or
the sum of the values that consumers exchange for the benefits of having or using the
product or service." Kotler (2000) mentioned that price refers to the perceived value
of goods and service measured in some medium of exchange. Hawkins et.al (2001)
stated that price is the amount of money one must pay to obtain the right to use the
product.
List price: Hawkins and Kenneth (1998) The price of the product that the
sellers are willing to sell to the consumers. When setting prices, the marketer needs to
in line with what the customer is prepared to pay or reasonably expects to pay; this
bears no relation to the firm’s costs in manufacturing the product. Food price is also a
factor that influences consumer income. McCarthy (1999) stated that list prices are
the prices final customers or users are normally asked to pay for products.
10
Discount: McCarthy (1999) stated that it is a reduction from the list price
given by a seller to buyers who either give up some marketing function or provide the
function themselves. It is a price reduction to buyers who pay their bill promptly.
Kotler (2003) also mention that price is a straight reduction in price on purchases
during a stated period of time.
Allowance: Berkowitz (1994) mentioned that allowance is the reductions from
list or quoted price to buyers for performing some activity. Kotler (2003) stated that
allowance is the promotional money paid by manufacturers to retailers in return for an
agreement to feature the manufacturer’s products in some way.
Payment Period: It is the duration that the consumers who are retailers or
wholesalers have to pay money for the product to the seller according to the
agreement of parties such as weekly, monthly, quarterly and etc. It’s mostly used in
B2B business. As Kotler (2003) argued that the customers mostly prefer longer
payment period with lower monthly payment for purchasing the product.
Credit Term: The term of credit can also affect the total cost of credit
transaction in B2B business. Kotler (2003) mention that it is one of the sale conditions
for buying products. Credit is a trust or promise to buy now and pay later under
designated terms for goods or services (Source from Equifax learning Center)
2.1.3 Place.
Zikmund (1996) suggested that place is an element of the marketing mix
involving all aspects of getting products to the consumer in the right location at the
right time. Kotler (1997) mentioned that place is another key marketing-stimuli tool
and stands for the various activities the company undertakes to make the product
accessibility and variable to get the target customer. Kotler (1999) said that all the
company activities that make the product or service available to target customers.
Kotler (2000) also stated that place includes the various activities the company
undertakes to make the product accessible and available to target customer.
Distribution Channels: Zikmund (1996) mentioned that it is the complete
sequence of marketing organization involved in bringing a product from the producer
to the consumer. The channel of distribution often includes such intermediaries as
wholesalers and retailers. McCarthy (1996), it is any series of firm or individual who
participate in the flow of products from producer to final user or consumers. Kotler

11
(2003) mentioned that a set of independent organizations involved in the process of
marketing a product or service available for use or consumption by the consumer or
business user.
Coverage: To cover the market, the companies have to decide on the number
of intermediaries. The exclusive distribution will limit the number of the
intermediaries, but selective distribution will use more than a few and less than all of
the intermediaries, where as intensive distribution will placing goods as many as
possible. (Kotler, 2003)
Assortment: Kotler (2003) also mentioned that place assortment is the
arrangement method by classifying and arranging the products into group according
to the size, taste, and etc at that place. The customer can find the product easily by
good place assortment.
Locations: As mentioned by Kotler (2003) Location is the critical factors in
retailing success and key to its ability to attract customers.
Inventory: McCarthy (1996) stated that inventory is amount of goods being
stored. The Company should balance the level of inventory with the customer order-
fulfillment standard by doing Justin time (JIT). Sales people would like the company
to carry enough stock to fill all customer orders immediately. (Kotler, 2003)
Transport: McCarthy (1996) mentioned that transporting is the marketing
function of moving goods. Marketers need to concern transportation. It is the process
in shipping goods to the warehouses, dealers, and customers. Kotler (2003) stated that
transportation affects the pricing in shipping products to the consumers. On-time
delivery performance and the condition of goods when they arrive can affect the
customer satisfaction.
2.1.4 Promotion.
Zikmund (1996) state that it is all form of marketing communication or the
means by which marketers talk to existing customers and potential buyers. Promotion
may convey a message about the organization, a product, or some other element of the
marketing mix. Shimp (1997) mentioned that sales promotion consists of all
marketing activities that attempt to stimulate quick buyer action or immediate sales of
a product. Promotion is about communicating with the consumer and about
persuading people to try our products and is often very much concerned with attitude
change. Because attitudes are learned, promotional activities can offer new

12
information to the consumer. Although the consumer’s knowledge of the product is
based on experience can be vicarious rather than personal. Kotler (1999) said that
activities that communicate the product or service and its merits to target customers
and persuade them to buy.
Sales promotion: McCarthy (1996) stated that sales promotion is activities
that stimulate interest, trial, purchase, by final customer or others in the channel which
can involve use of coupon, point-of-purchase material, samples, signs, catalogs,
novelties, or circulars. It is short-term incentives to encourage purchase or sale of a
product or service. Kotler (2000) mentioned that sales promotion consists of a diverse
collection of incentive tools, mostly short term, designed to stimulate quicker and/or
greater purchase of particular products/services by consumers or the trade companies
use sales promotion tools to draw a stronger and quicker buyer response, Sales
promotion can be use for short-run effects such as to dramatize product offers and
boost sagging sales.
Advertising: Any paid form of non-personal presentation and promotion of
ideas, goods or service by an identified sponsor. Pelsmacker et.al (2001) defined
advertising as non-personal mass communication using mass media such as TV,
radio, newspapers, magazines, billboard and etc) the content of which is determined
and paid by a clearly identified sender-the company.
Personal Selling: McCarthy (1996) stated that personal selling involves direct
spoken communication between seller and potential customer. It’s usually happens
face-to-face or telephone in sometime at expensive cost. Kotler (2000) mentioned that
personal selling is face-to-face interaction with one or more prospective purchases for
the purpose of making presentations, answering questions, and procuring orders.
Pelsmacker et al. (2001) stated that personal selling is the oral presentation and/or
demonstration of one or more salespersons aimed at selling the product or service or a
company. It is a personal contact between a company representative and a prospect or
client.
Public relations: It is used for public purpose. Kotler (2000) stated that public
relations are a variety of programs designed to promote or protect company’s image
or its individual products. Kotler (2003) also mentioned that public relation is the way
to build good relations with the company’s various publics by obtaining favorable
13
publicity, building up a good corporation image, and handling or heading off
unfavorable rumors, stories and events.
Direct Marketing: It is non-public and non-store selling. As mentioned by
Kotler (2003), direct marketing is a direct communications with carefully targeted
individual consumers to obtain an immediate response and cultivate lasting customer
relationships by using telephone, e-mail, Internet, and other tools to communicate
directly with specific consumers. The table 2.1 shows the operational components of
the independent or influencing variables.
2.2 Service Marketing
Service Marketing is marketing based on relationship and value. It may be
used to market a service or a product. Marketing a service-base business is different
from marketing a product-base business. There are several major differences,
including:
1) The buyer purchases are intangible
2) The service may be based on the reputation of a single person
3) It's more difficult to compare the quality of similar services
4) The buyer cannot return the service
5) Service Marketing mix adds 3 more p's, i.e. people, physical environment,
and process.
When one markets a service business, one must keep in mind that reputation,
value, delivery of "Managing the evidence" refers to the act of informing customers
that the service encounter has been performed successfully. It is best done in subtle
ways like providing examples or descriptions of good and poor service that can be
used as a basis of comparison. The underlying rationale is that a customer might not
appreciate the full worth of the service if they do not have a good benchmark for
comparisons.
However, it is worth remembering that many of the concepts, as well as many
of the specific techniques, will work equally well whether they are directed at
products or services. In particular, developing a marketing strategy is much the same
for products and services, in that it involves selecting target markets and formulating a
marketing mix. Thus, Theodore Levitt suggested that "instead of talking of 'goods'
and of 'services', it is better to talk of 'tangibles' and 'intangibles'. Levitt also went on
to suggest that marketing a physical product is often more concerned with intangible
14
aspects (frequently the `product service' elements of the total package) than with its
physical properties. Charles Revson made a famous comment regarding the business
of Revlon Inc.: `In the factory we make cosmetics. In the store we sell hope.'
Arguably, service industry marketing merely approaches the problems from the
opposite end of the same spectrum.
2.3 Consumer Buying Decision Processes
Buyer decision processes are the decision making processes undertaken by
consumers in regards to a potential market transaction before, during, and after the
purchase of a product or service.
More generally, decision making is the cognitive process of selecting a course
of action from among multiple alternatives. Common examples include shopping,
deciding what to eat. Decision making is said to be a psychological construct. This
means that although we can never "see" a decision, we can infer from observable
behavior that a decision has been made. Therefore we conclude that a psychological
event that we call "decision making" has occurred. It is a construction that imputes
commitment to action. That is, based on observable actions, we assume that people
have made a commitment to effect the action.
In general there are three ways of analysing consumer buying decisions. They
are:
• Economic models: These models are largely quantitative and are based on
the assumptions of rationality and near perfect knowledge. The consumer
is seen to maximize their utility. See consumer theory. Game theory can
also be used in some circumstances.
• Psychological models: These models concentrate on psychological and
cognitive processes such as motivation and need reduction. They are
qualitative rather than quantitative and build on sociological factors like
cultural influences and family influences.
• Consumer behavior models: These are practical models used by marketers.
They typically blend both economic and psychological models.
15
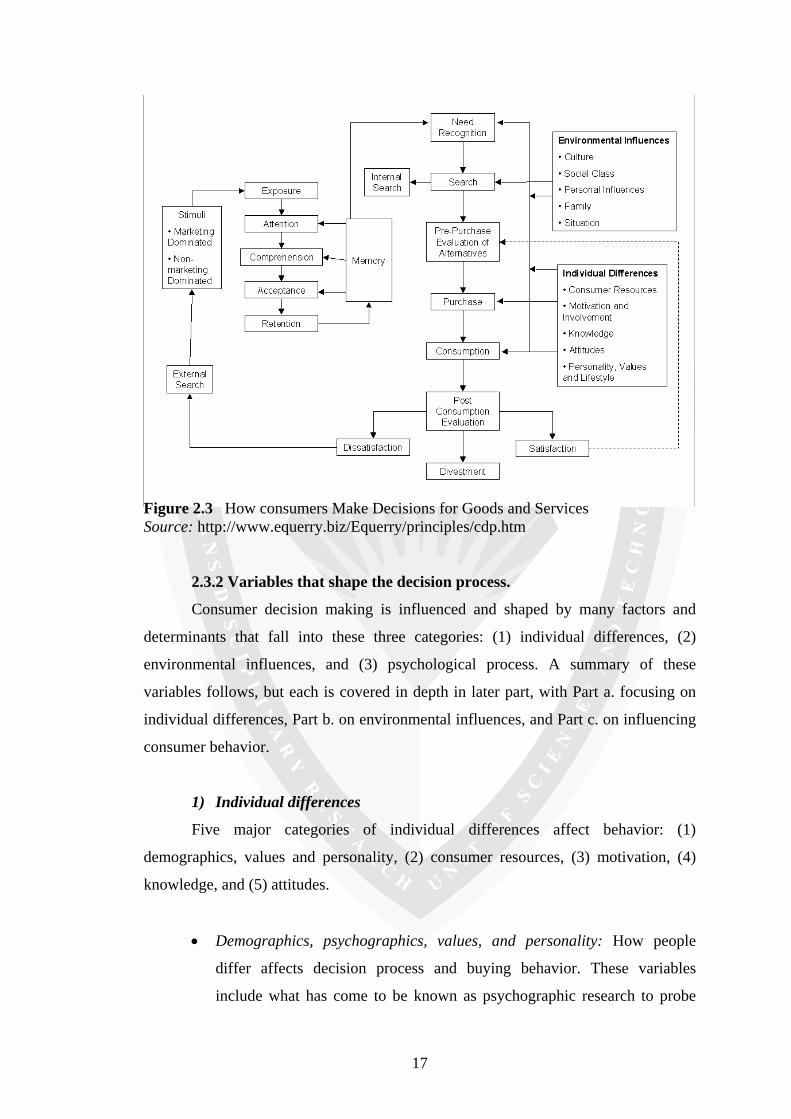
2.3.1 The consumer decision process model.
This model breaks down the consumer decision process into seven basic
decisions that have to be taken during the purchase process:-
• Need Recognition
• Search for Information
• Pre-purchase Evaluation of Alternatives
• Purchase and Consumption
• Post-Consumption Evaluation
• Divestment
In themselves each of these decisions are almost self explanatory and we can
easily identify with them and relate them to our own purchase experiences. However,
when we come to generalize this model we need to consider the factors that influence
each of the stages in the process.
1) Need recognition
This is influenced by three factors:
• Environmental Influences
• Individual Differences and
• Memory
So clearly this initial stage is strongly influenced by the specific situation, the
individual and their past experience, however this can be influenced by marketing
activity, if for example past experience of purchasing a product has been positive,
perhaps a strong, positive image of a product or brand has been made in the buyers
memory and the purchase environment has been made conducive to a specific
purchase.
2) Search For Information
Again this can be more complex, firstly the search process is both an internal
and an external process. If the purchase situation is a familiar one, the purchaser’s
memory might satisfactorily provide the information needed. The level of information
required to the involvement, experience and level of perceived risk - so even if there
has been a significant degree of past experience if there is a high degree of
involvement or risk the purchase will require an external search for information.

16
3) Pre-purchase evaluation of alternatives
Once the information is brought together the purchaser will make their
decision - this is the result of their individual characteristics. This might be a simple
process or a complex process, a logical or an emotional purchase or the result of a
simplification. Where complex information requires processing often a heuristic or
simple rational is used. This might be to base the purchase on a single feature or
benefit that will be used as a surrogate for quality or low risk, or the choice reduced to
one of brand.
4) Purchase and Consumption
These are highly individual aspects - but in some purchases they are extremely
important, particularly in the way they influence future purchase behavior. For
example services such as they are actually produced at the time of consumption.
5) Post-consumption evaluation
After consumption the purchaser will both consciously or unconsciously
evaluate and decide if the result of purchase process was satisfaction or
dissatisfaction. This feeds back into the future purchase behavior either stimulating a
more complex behavior in the future due to an increased level of perceived risk or as a
simplification of the behavior as the purchaser will have learnt by a positive
reinforcement.
6) Divestment
Finally a consumer will need to consider how they will divest themselves of
the purchase. The resale value of high ticket items is an important factor in the
purchase decision. Increasingly ecological factors also effect purchase decisions - will
the item be recycled?
As with all models of human behavior this model provides a framework for
analysis that can influence marketing decisions or explain problems that might arise in
the purchase process. Models are far less in predicting what will happen, how
consumers will react.
17
Figure 2.3 How consumers Make Decisions for Goods and Services Source: http://www.equerry.biz/Equerry/principles/cdp.htm
2.3.2 Variables that shape the decision process.
Consumer decision making is influenced and shaped by many factors and
determinants that fall into these three categories: (1) individual differences, (2)
environmental influences, and (3) psychological process. A summary of these
variables follows, but each is covered in depth in later part, with Part a. focusing on
individual differences, Part b. on environmental influences, and Part c. on influencing
consumer behavior.
1) Individual differences
Five major categories of individual differences affect behavior: (1)
demographics, values and personality, (2) consumer resources, (3) motivation, (4)
knowledge, and (5) attitudes.
• Demographics, psychographics, values, and personality: How people
differ affects decision process and buying behavior. These variables
include what has come to be known as psychographic research to probe
18
into those individual traits, values, beliefs, and preferred behavior patterns
that correlate with behavior in market segments.
• Consumer resources: Each person brings three primary resources into
every decision-making situation: (1) time, (2) money, and (3) information
reception and processing capability of each, thus requiring some careful
allocation.
• Motivation: Psychologists and marketers alike have conducted a wide
variety of studies to determine what takes place when goal-directed
behavior is energized and activated.
• Knowledge: It encompasses a vast array of items such as the availability
and characteristics of products and services; where and when to buy; and
how to use products. One main goal of advertising and selling is to provide
relevant knowledge and information to consumers so as to assist them with
decision making, especially in extended problem solving.
• Attitude: Behavior is strongly influenced by attitudes toward a given brand
or product. Attitudes are simply an overall evaluation of an alternative role
on future choice and are difficult to change.
2) Environmental influences
Consumers live in a complex environment. In addition to individual variables,
their decision process behavior is influenced by environmental factors, including (1)
culture, (2) social class, (3) family, (4) personal influence, and (5) situation.
• Culture: Culture, as used in the study of consumer behavior, refers to the
values, ideas, artifacts, and other meaningful symbols that help individuals
communicate, interpret, and evaluate as members of society.
• Social class: Social classes are divisions within society that comprise
individuals sharing similar values, interests, and behaviors.
• Family: Since the field of consumer research was founded, the family has
been a focus of research. The family is the primary decision-making unit,
with a complex and varying pattern of roles and functions.
• Personal influences: As consumers, our behavior are often affected by
those with whom we closely associate. Consumer often respond to

19
perceived pressure to conform to the norms and expectations provided by
others – seeking and talking their counsel on buying choices, observing
what others are doing as information about consumption choices, and
comparing their decisions to those of others.
• Situation: Behavior change as situation change. Sometimes these changes
are erratic and unpredictable, such as a job layoff, and at other times, they
can be predicted by research. Situation is treated as a research variable in
its own right.
3) Psychological process influencing consumer behavior
Finally, those who wish to understand and influence consumer behavior must
have a practical grasp of three basic psychological processes: (1) information
processing, (2) learning, and (3) attitude and behavior change.
2.4 Previous Researches
International Carwash Association identified and detailed variables that
influence costs and profitability in doing car wash business. They indicated that there
were plenty of details for entrepreneurs to pay attention to, including what type of car
wash machine to install, whether to purchase or lease that equipment, how many
washes a month to aim for, and how to set prices to ensure profit without driving
away valuable customers. They investigated that one of many factors that make
business succeed for any site is the number of vehicles it washes on a yearly basis.
According to their study in 2002, the average number of vehicles washed at
respondents' car washes of all types in Chicago, USA was 84,586. They found that
self-service sites had the highest average number of washes, 92,093; conveyor sites
placed second with an average 82,019; and in-bay automatics ranked third, with an
average 54,184 washes. They also found that annual revenues of operators differed
dramatically, depending on equipment type. Operators in the conveyor segment
reported the highest annual average operating income per site: $1.7 million while the
second and the third were self-service operators, who reported average operating
income of $314,029 and in-bay automatic operators with the average of $208,038
only. ICA recorded wide divergences by wash segment. The average wash price for
all conveyor operations was $8.43 while in-bay automatic operations, the average
minimum was $4.53; the average maximum, $8. At self-service operations, the
20
average price of a wash was $1.71; in the sub-segment of self-service operations with
a secondary business, however, the average price was a bit more: $2.39 and it also
noted that self-service prices were highest on average in suburban areas at self-serves
with secondary businesses (as cited in Bennett, 2004).
Vaubel indicated that price hikes at car washes may be driven by a mix of
factors or by a single factor that's having a huge impact on costs such as water rates
and water quality. He also found that altering pricing structure by reducing the
number of wash offerings can bolster the margins. He insisted that even though the
company's wash businesses might lose some customers who were resistant to the
change, it didn’t have a negative effect on the overall business (as cited in Bennett,
2004).
Vercollone indicated that the quality of the car washes has been a boon for the
convenience store and petroleum industry. New technology in brushes, conveyors and
chemicals has lifted the entire industry to the point where it should be deciding just
how much of a margin to make on a wash and not what kind of a discount to offer to
attract business. He also found that customers get their cars washed when their car is
dirty. So, the best strategy is to go after them with the best wash possible and insisted
that you can not create a very stable foundation to grow the business if you're
counting on building sales with an inferior wash, offering discounts and couponing.
He found out that for most Americans, their car is the most expensive purchase they'll
ever make besides a house, so they want to take good care of it. The wash has to
emphasize quality-that is ultimately what earns their trust and brings them back.
Willkomm also agreed with Vercollone and indicated that the quality has to be there
first and foremost. He also convinced that price isn't even in the top three
considerations when it comes to choosing a wash, but it's not just the one-time
customer looks after. It's getting them again and again where you see real profits.
Willkomm insisted that offering a quality package takes teamwork, but it also requires
a lot of homework to make sure you have the support to satisfy your customers. "At
the end of the day, it's your name on the sign and that's all customers are going to
remember when they leave the store. Make sure they always walk away satisfied" (as
cited in Lofstock, 2007).
Gregorie indicated that advances in technology made it possible for car wash
operators to get vehicles cleaner, to boost customer services and increase throughput,
reduce labor and operating costs, and charge consumers more. However, he found out
21
that these same advances also prompted more competitors to enter the car wash
business, including private investors and hypermarket retailers. Dollhopf and
Campbell also agreed with Gregorie as Dollhopf stated that some hypermarket chains
wanted to offer a discounted car wash and others wanted to provide their customers
with one-stop convenience while Campbell noted that hypermarkets started to dabble
in car washes because advancing technology made the business easier and more
profitable (as cited in Warren, 2005).
Cole stated that some car wash staff concerned how customers feel about the
company's services and its long-term role in the community. They looked for every
opportunity to demonstrate concern for customers. He also noted some lessons from
the car-wash chain that might apply to other businesses as well in the following (as
cited in Johnston, 1994):
• Pay attention to the details. Just as the hospitality industry wants travelers
to feel pampered, the car wash service operators want customers to view
the car-wash service as a positive experience. The first clues to this service
philosophy: flower beds decorate the entrance to the wash, neatly groomed
employees greet customers courteously, and car owners receive little treats
such as peanuts as they enter the cleaning tunnel. Inside, the cars are
cleaned by an equipment system that is configured for the most effective
treatment possible. Meanwhile, any kids on board may be delighted to see
cartoon characters like Garfield or Bart Simpson mounted on poles inside
the tunnel. These familiar characters are intended to calm kids who are
frightened when the washing machine descends on their family car -- and
thus allow their parents to relax. Once drivers emerge from the wash, they
can go to a waiting room and get free coffee if they want the insides of
their cars cleaned. Some customers -- depending on the make of their car
and the level of service they've chosen -- have their wheels cleaned with a
toothbrush. Others can go to the "satisfaction center," a final service
checkpoint, for any extra attention they feel the car needs. The goal is to
make sure customers feel well taken care of when they drive out of the lot.
• Know the customer. The marketing and service programs rely heavily on
the tracking of customers' buying habits. The company should use a
22
computer database to track the frequency of these customers' visits and the
services purchased. Each time a member visits, an employee scans a bar-
code sticker that's located on the vehicle's window and logs information
into the database. Behind the scenes, the company analyzes the vehicle
histories, along with other sales and profit data, to track buying habits and
identify sales opportunities. To punch up its relatively slow business in the
evening hours, for example, the company could introduce a "night wash"
special with a $1 savings and doubled its volume. And if a review of the
data shows that certain club members haven't been to the store for a while,
the company sends out a "We miss you letter" to invite them back.
Employees could use the histories to suggest service upgrades. If a
customer usually gets a regular wash, for example, a sales advisor might
recommend an undercarriage wash if the car has been coated by heavily
salted roads. However, the company should caution employees to suggest
only those services appropriate to the vehicle and the customer. The point-
of-sale histories help guide the sales advisor to the customer's buying
preferences.
• Mine new prospects. The company should always look for new prospects,
using both mass-market means (such as radio jingles) and more targeted
approaches to draw them in. New car buyers are obvious prospects, so it
will be useful if the company can work with local car dealers to distribute
30-day passes for free washes to their customers. To reach new home
buyers, another target group, it can use an outside service to generate
names from property-transfer records, and then sends them coupons for its
services.
• Fix the problems. If a customer believes the car wash has damaged his or
her car in any way, the manager can spend up to $150 in labor or
merchandise to fix the problem, no questions asked. Even if the company
is not at fault, it didn't want customers driving away with a sour memory.
When one customer's tire began to leak, for example, an employee spotted
it, helped the customer change the tire and got the leaky one repaired.
After a problem is fixed, the company should send the customer "a little
warm fuzzy" of flowers, cookies or candy. It also backs up its work with
23
guarantees. Customers who purchase the basic wash can get a rewash if
they're not satisfied, while club members are entitled to some added
protection. In exchange for these customers' loyalty and investment, the
company can offer them a free replacement wash if it rains or snows
within 24 hours after they've left the lot. With some of the more expensive
treatments, customers are guaranteed a clean car for three days. If the
driver goes through a puddle or parks under a flock of pigeons, the
company will wash the car again for free. This guarantee is particularly
important. The benefit of such guarantees helps a company stay
competitive by acknowledging that a bad service experience eats away at a
customer's good will. Of course, this forces a company to determine what
services it can afford to guarantee and to improve operations so that
mistakes are the exception. But the cost of fulfilling guarantees should be
viewed as a marketing investment and a second chance to make a good
impression, not as a loss.
• Monitor customer satisfaction. The company could use a variety of
feedback mechanisms to evaluate the quality of their service at each
location. These include comment cards available to all customers and
special reports which the managers personally ask some drivers to fill out
each month. In addition, it can add a new service questionnaire for
customers getting the insides of their cars cleaned. This feedback
mechanism allows the company to make sure its inside-cleaning service is
as detailed as customers expect. These forms give enough feedback to rate
overall customer satisfaction and calculate it on an index ranging to 100.
To supplement its own research, the company also employs an outside
firm to send people through the car wash and generate professional
"shoppers reports" on their experiences.
• Use training and incentives to ensure good service. If you want high-
quality service, then get the message across with your hiring, training and
pay practices. The company might try to set itself apart from competitors
by hiring well-groomed employees, for example. Once hired, employees
go through various training modules in a classroom setting -- an unusual
practice in the car-wash business -- to make sure service will be consistent

24
from location to location. New employees also must meet the approval of
their coworkers, since the staff at each location is viewed as a team with its
own sales and expense goals to meet. Indeed, up to half of employees' pay
is tied to such goals; the incentive-pay proportion for each individual
varies according to the sales and management content of his or her job.
(Managers' incentive pay is more heavily weighted toward incentives than
that of employees who vacuum the cars.) The teams also compete for
contest awards, based on specific sales goals and their satisfaction ratings
from customer feedback mechanisms. Finally, several employees from
each location join an improvement team that meets regularly to discuss
new ways to enhance customer service.
• Demonstrate respect for the community. One of the subtler ways the
company can impress customers is by being a good neighbor. In these days
of environmental awareness, it should reclaims\ some of the water used
and treats the dirt that's eliminated for recycling as fill. The company
should donate money from a portion of its sales over a three-day period to
nearby homeless shelters that uses the cash to buy winter clothes for its
young clients.
25
Chapter 3
Research Methodology
3.1 Introduction
In order to examine factors that influence decision making on car wash service
in Bangkok, a study is designed to be a survey research using constructed survey
questionnaire to collect data from the car owners who are currently own a car and live
in Bangkok, Thailand. The purpose of this study is to identify the demographic factors
and marketing mix factors on factors that influence decision making on using car
wash service in Bangkok. The researcher analyzes data variables using percentage,
frequency, mean, standard deviation, and One-way ANOVA to test hypotheses and
answer research questions. In addition, this study will employ SWOT Analysis and
BCG Matrix to analyze the market overview and competitive situation of the current
business and its environments.
3.2 Population and Sample Size
Population of this study are car owners who are currently own a car and live in
Bangkok. According to data of Department of Land Transport, there are 1,867,902 in
number of personal car registered in the end of 2006 (DLT,2007).
The target group of this study are the car owners who currently own a car and
live in Bangkok. The sample group participated in this study will be calculated by
using YAMANE equation (Yamane, 1967) as follows;
n = N / 1+ N(e)2
Remark: n = Sample size
N = 1,867,902
E = Significant level (0.05)
From equation, the sample size can be calculated as follows;
n = 1,867,902 / 1+ 1,867,902 (0.05)2
= 399.91
26
Therefore, the sample size for this study will be 400 samples of the car owners
who are currently own a car and live in Bangkok.
3.3 Data Collecting Method
The researcher used questionnaires and interview as the instrument to survey
opinions about marketing mix factors; products or services, price, place and
promotion and factors that have importance on using car wash services; quality of the
wash, service fees, convenience, speed of services, scratch protection, safety,
environmental safety, services of employees and satisfaction. The questionnaires are
distributed to the car owners who are currently own a car and live in Bangkok. The
researcher conducts the questionnaire by himself and one assistant during January
2007.
3.4 Research Design
Due to this study will be survey research, the questionnaire will be employed
as data collecting method to obtain data from 400 samples of the car owners who are
currently own a car and live in Bangkok. The questionnaire will be distributed to
respondents for a face-to-face interview by field workers in January 2007.
Part 1 Questionnaire will be contained about demographic data of
respondent namely gender, age, income, occupation, education
background and marital status.
Part 2 Questionnaire will be contained about using car wash service
behavior such as using car wash service frequencies, car wash
service program selected, spending budget, membership, media
persuasion, and additional services expected.
Part 3 Questionnaire will be contained about decision making on
using car wash service in Bangkok.
Furthermore, the researcher will apply summated rating method of Renis
Likert in questionnaire development process because this method is simple to
administer (Zikmund, 2003). With the Likert scale, respondents will indicate their
information that are asked by the researcher by checking how much important they
think with carefully constructed statements. Respondents will choose from five
alternatives which are very important, important, moderately important, slightly
important, and not important at all. To measure the information value, the researcher

27
will assign scores or weights to the alternative responses such as 5,4,3,2,1 will be
assigned to the answers. In positive statements, very important will be weighted of the
highest value, 5, but in negative items the weights will be reversed and not important
at all will be assigned the weights of 1.
3.5 Data Collecting Procedure
This study the researcher is planning to complete within 5 months by
following arrangement:
• Proposal writing; the researcher will write the research proposal to present
the project committee in November 2006.
• Proposal or topic defensive presentation; the researcher will present
project proposal to committee by using Powerpoint program and
elaborating topic background, objectives of study, and etc. within 2 weeks
of December 2006.
• Literature review and building data collecting instrument; after proposal
approved the researcher will review and write about involved theories, past
researches then the researcher will construct data collecting instrument,
questionnaire, according to reviewed literature ad also pre-testing
questionnaire by December 2006.
• Data collection; in January 2007, after questionnaire has relied the
research will collect data by distributing questionnaire to the car owners
who are currently own a car and live in Bangkok. This process will be
conducted by the researcher and one assistant.
• Data analysis; Completion of collected data will be brought to analyze by
using SPSS for windows software according to statistical methods and
then analyzed data output will be wrote in the chapter of research result by
February 2007.
• Final research writing and oral examination or project defense; the
researcher will conclude all sound results and write on the final chapter
including make both recommendations for future research and related
professionals in March 2007.
28
3.6 Data Analysis
The researcher analyzes data variables using SPSS program to compute for the
results. The outputs of the program have been presented in Chapter five and the result
of respondents would be presented as follows;
• Descriptive statistics will be used with demographic variables. The
researcher will take collected data to analyze by using Frequency,
Percentage, Central tendency (the mean, the median, and the mode),
Standard deviation, and then present the results in form of tabulation.
• Inferential statistics will be used to compare relationship between data
variables at significant level 0.05., and testing hypotheses by using One-
way ANOVA.
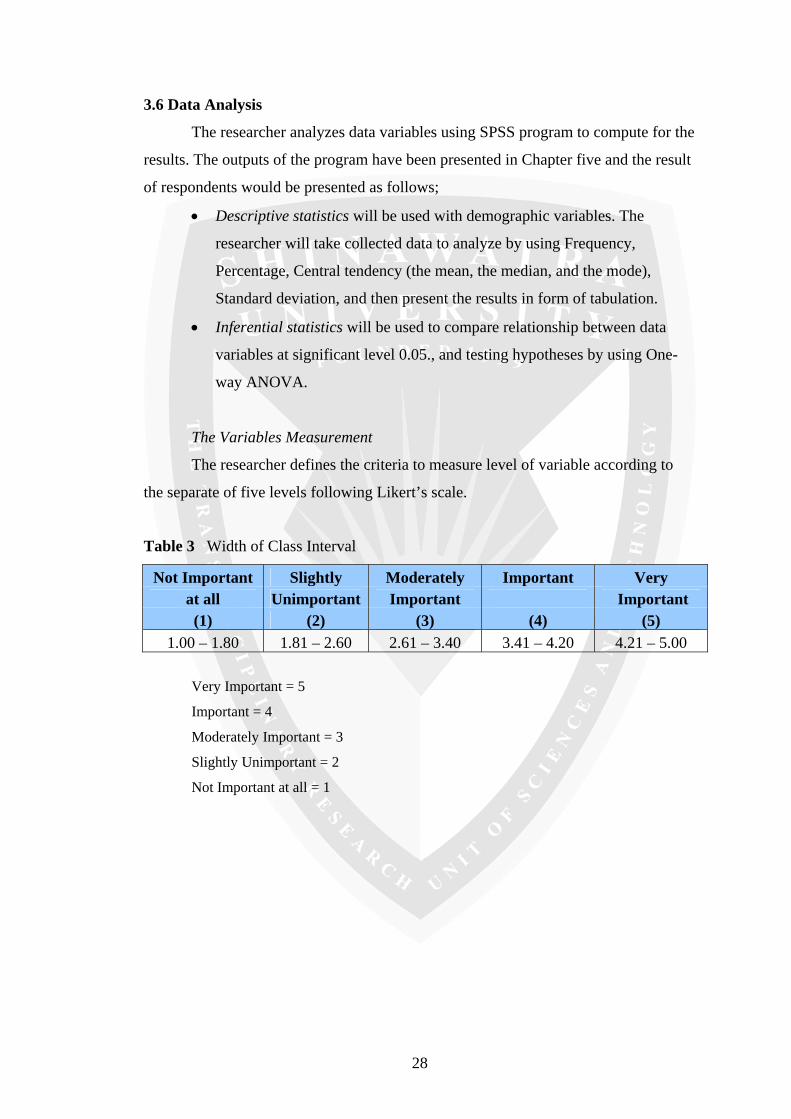
The Variables Measurement
The researcher defines the criteria to measure level of variable according to
the separate of five levels following Likert’s scale.
Table 3 Width of Class Interval
Not Important Slightly Moderately Important Very at all Unimportant Important Important (1) (2) (3) (4) (5)
1.00 – 1.80 1.81 – 2.60 2.61 – 3.40 3.41 – 4.20 4.21 – 5.00
Very Important = 5
Important = 4
Moderately Important = 3
Slightly Unimportant = 2
Not Important at all = 1
29
Chapter 4
Research Findings and Analysis
This chapter presents the data analyzed based on the 400 questionnaires. The
obtained data were input in computer and used software SPSS version 13.0 to
compute for the results. The results were classified into four sections including
demographic data of respondents, using car wash service behavior pattern, decision
making on using car wash service in Bangkok, and hypothesis testing results. In the
last of this chapter, the researcher will discuss about financial analysis, people
management and competitive analysis that the researcher believes that it might be
useful for entrepreneurs who are interested in this business.
4.1 Demographic Characteristics of Respondents
Base on part 1 of the questionnaire, the personal information of the sampling
group of the study is demographic characteristics as summarized in the following
figures.
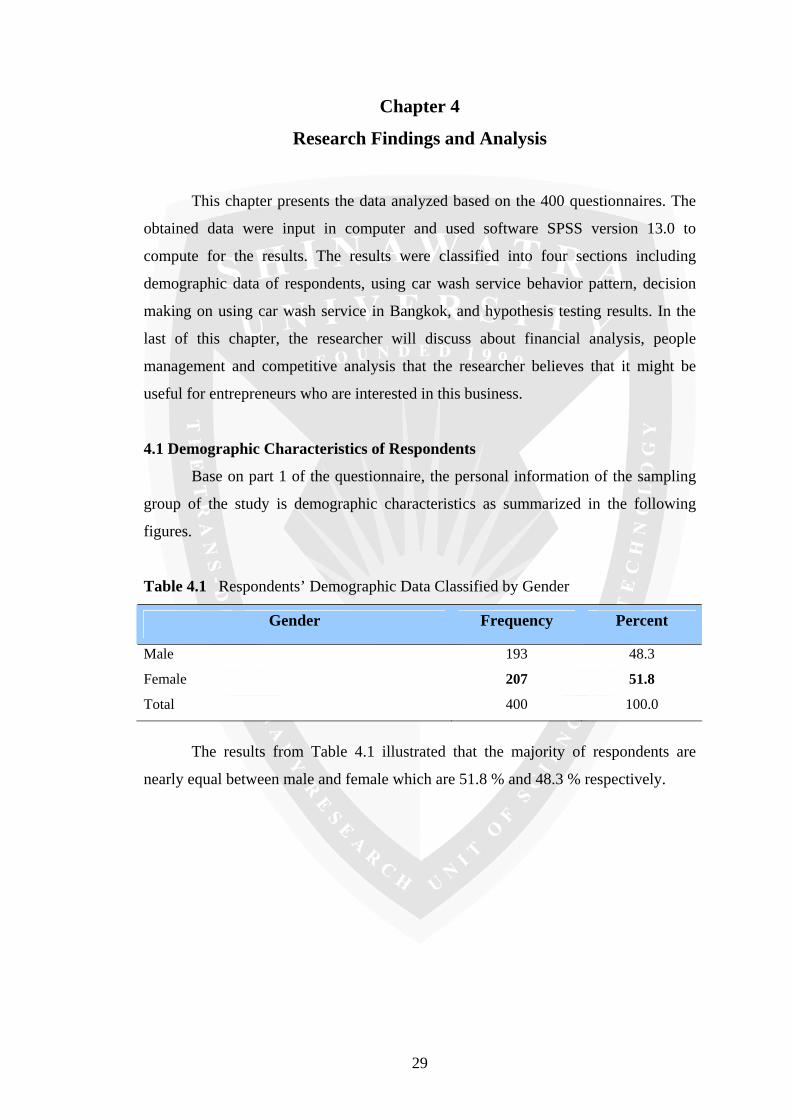
Table 4.1 Respondents’ Demographic Data Classified by Gender
Gender Frequency Percent
Male 193 48.3
Female 207 51.8
Total 400 100.0
The results from Table 4.1 illustrated that the majority of respondents are
nearly equal between male and female which are 51.8 % and 48.3 % respectively.
30
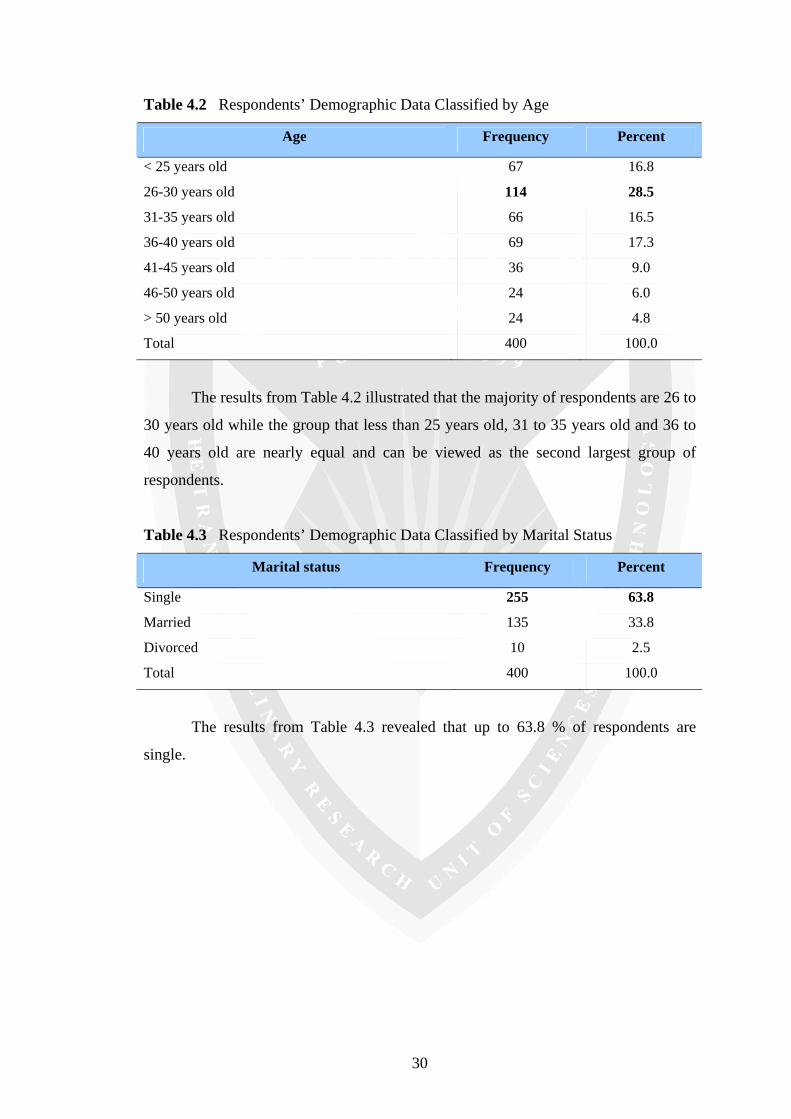
Table 4.2 Respondents’ Demographic Data Classified by Age
Age Frequency Percent
< 25 years old 67 16.8
26-30 years old 114 28.5
31-35 years old 66 16.5
36-40 years old 69 17.3
41-45 years old 36 9.0
46-50 years old 24 6.0
> 50 years old 24 4.8
Total 400 100.0
The results from Table 4.2 illustrated that the majority of respondents are 26 to
30 years old while the group that less than 25 years old, 31 to 35 years old and 36 to
40 years old are nearly equal and can be viewed as the second largest group of
respondents.
Table 4.3 Respondents’ Demographic Data Classified by Marital Status
Marital status Frequency Percent
Single 255 63.8
Married 135 33.8
Divorced 10 2.5
Total 400 100.0
The results from Table 4.3 revealed that up to 63.8 % of respondents are
single.

31
Table 4.4 Respondents’ Demographic Data Classified by Education
Education Frequency Percent
Less than Bachelor Degree 78 19.5
Bachelor Degree 246 61.5
Master Degree 71 17.8
More than Master Degree 5 1.3
Total 400 100.0
The results from Table 4.4 showed that the majority of respondents have a
bachelor degree.
Table 4.5 Respondents’ Demographic Data Classified by Occupation
Occupation Frequency Percent
Governmental Officer 18 4.5
Private Employees 298 74.5
State Enterprise Employees 10 2.5
Entrepreneurs 38 9.5
Soldiers/Police 1 0.3
Housewife 5 1.3
Retired 1 0.3
Other 29 7.3
Total 400 100.0
The results from Table 4.5 showed that the majority of respondents are
working in private companies.

32
Table 4.6 Respondents’ Demographic Data Classified by Working Position
Working position Frequency Percent
Other 70 17.5
President 7 1.8
Director 22 5.5
Manager 72 18.0
Officer 229 57.3
Total 400 100.0
The results from Table 4.6 revealed that the majority of respondents are
working in the officer level.
Table 4.7 Respondents’ Demographic Data Classified by Salary
Salary Frequency Percent
Other 4 1.0
< 15,000 baht 113 28.3
15,001-25,000 baht 116 29.0
25,001-40,000 baht 82 20.5
40,001-50,000 baht 28 7.0
50,001-80,000 baht 41 10.3
80,001-100,000 baht 13 3.3
100,001-150,000 baht 2 0.5
150,001-300,000 baht 1 0.3
Total 400 100.0
The results from Table 4.7 revealed that the majority of respondents earn
monthly incomes between 15,001 to 25,000 baht.
The results from Table 4.1 to 4.7 illustrated that the majority of respondents
are nearly equal between male and female. These groups of people are 26-30 years
old, single and hold bachelor degree level. Most of them work in private company and
their working positions are officers level generally, and earn incomes between 15,001
to 25,000 baht.
33
4.2 Using Car Wash Service Behavior Pattern of Respondents
Base on part 2 of the questionnaire, the using car wash service behavior
pattern of the sampling group of the study is using car wash service frequencies, car
wash service program selected, spending budget, membership, media persuasion, and
additional services expected as summarized in the following figures.
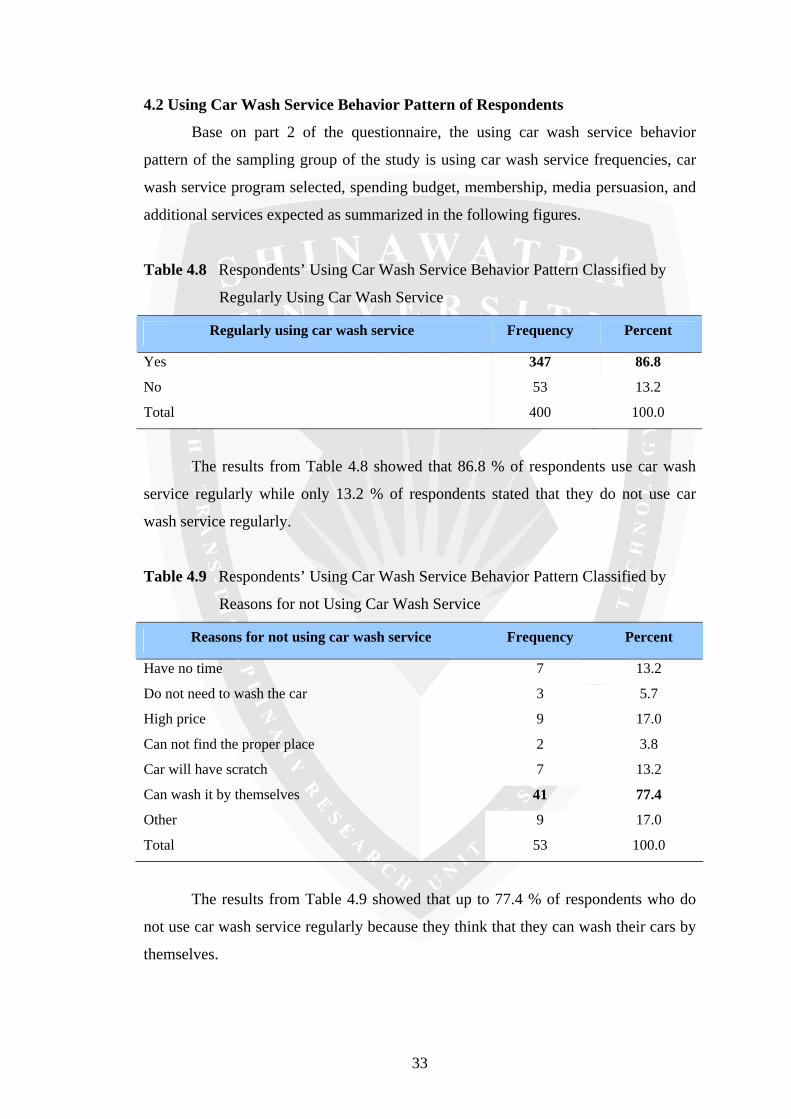
Table 4.8 Respondents’ Using Car Wash Service Behavior Pattern Classified by
Regularly Using Car Wash Service
Regularly using car wash service Frequency Percent
Yes 347 86.8
No 53 13.2
Total 400 100.0
The results from Table 4.8 showed that 86.8 % of respondents use car wash
service regularly while only 13.2 % of respondents stated that they do not use car
wash service regularly.
Table 4.9 Respondents’ Using Car Wash Service Behavior Pattern Classified by
Reasons for not Using Car Wash Service
Reasons for not using car wash service Frequency Percent
Have no time 7 13.2
Do not need to wash the car 3 5.7
High price 9 17.0
Can not find the proper place 2 3.8
Car will have scratch 7 13.2
Can wash it by themselves 41 77.4
Other 9 17.0
Total 53 100.0
The results from Table 4.9 showed that up to 77.4 % of respondents who do
not use car wash service regularly because they think that they can wash their cars by
themselves.

34
Table 4.10 Respondents’ Using Car Wash Service Behavior Pattern Classified by
Frequency in Using Car Wash Service
Frequency in using car wash service Frequency Percent
Everyday 1 0.3
More than once a week 10 2.9
Once a week 73 21.0
2 weeks 91 26.2
Once a month 112 32.3
2-3 month 36 10.4
4-6 month 12 3.5
Longer than 6 month 12 3.5
Total 347 100.0
The results from Table 4.10 illustrated that most of respondents who use car
wash service regularly always use the service once a month.
Table 4.11 Respondents’ Using Car Wash Service Behavior Pattern Classified by
Convenient Time
Convenient time Frequency Percent
6.00-9.00 22 6.3
9.01-12.00 60 17.3
12.01-15.00 70 20.2
15.01-18.00 119 34.3
18.01-22.00 76 21.9
Total 347 100.0
The results from Table 4.11 illustrated that most of respondents who use car
wash service regularly often use the service between 3pm to 6 pm.
35
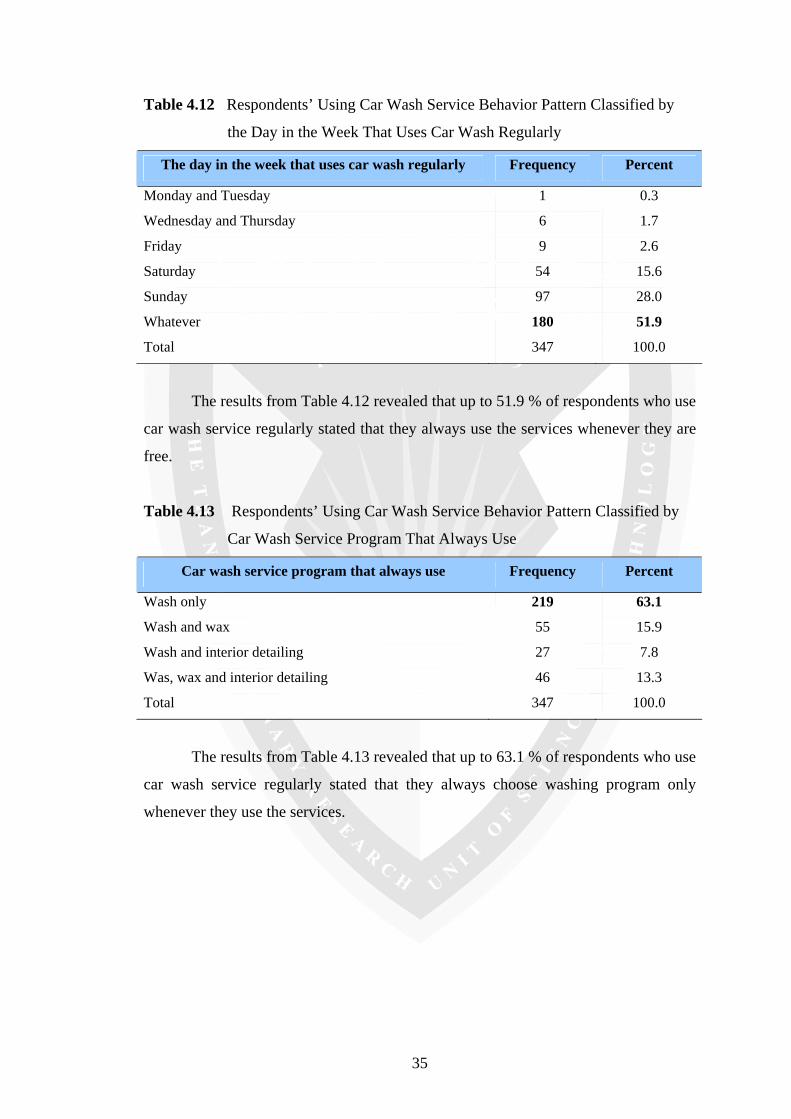
Table 4.12 Respondents’ Using Car Wash Service Behavior Pattern Classified by
the Day in the Week That Uses Car Wash Regularly
The day in the week that uses car wash regularly Frequency Percent
Monday and Tuesday 1 0.3
Wednesday and Thursday 6 1.7
Friday 9 2.6
Saturday 54 15.6
Sunday 97 28.0
Whatever 180 51.9
Total 347 100.0
The results from Table 4.12 revealed that up to 51.9 % of respondents who use
car wash service regularly stated that they always use the services whenever they are
free.
Table 4.13 Respondents’ Using Car Wash Service Behavior Pattern Classified by
Car Wash Service Program That Always Use
Car wash service program that always use Frequency Percent
Wash only 219 63.1
Wash and wax 55 15.9
Wash and interior detailing 27 7.8
Was, wax and interior detailing 46 13.3
Total 347 100.0
The results from Table 4.13 revealed that up to 63.1 % of respondents who use
car wash service regularly stated that they always choose washing program only
whenever they use the services.

36
Table 4.14 Respondents’ Using Car Wash Service Behavior Pattern Classified by
Spending Budget Per Time
Spending budget per time Frequency Percent
< 100 baht 112 32.3
101-200 baht 160 46.1
201-300 baht 48 13.8
301-500 baht 22 6.3
501-1,000 baht 4 1.2
2,001-2,500 baht 1 0.3
Total 347 100.0
The results from Table 4.14 revealed that 46.1 % of respondents who use car
wash service regularly stated that they are willing to pay 100 to 200 baht once they
use the service.
Table 4.15 Respondents’ Using Car Wash Service Behavior Pattern Classified by
Membership
Membership Frequency Percent
Yes 37 10.7
No 310 89.3
Total 347 100.0
The results from Table 4.15 revealed that up to 89.3 % of respondents who use
car wash service regularly stated that they are not member of any car wash service
operators.
37
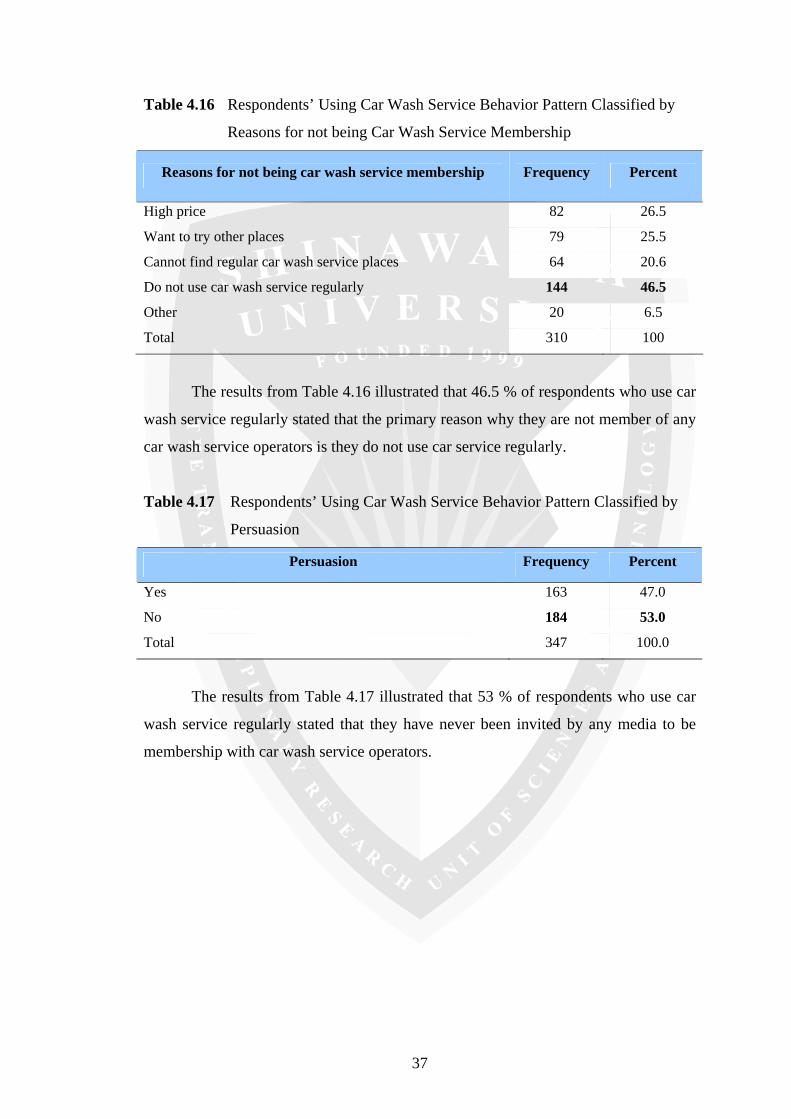
Table 4.16 Respondents’ Using Car Wash Service Behavior Pattern Classified by
Reasons for not being Car Wash Service Membership
Reasons for not being car wash service membership Frequency Percent
High price 82 26.5
Want to try other places 79 25.5
Cannot find regular car wash service places 64 20.6
Do not use car wash service regularly 144 46.5
Other 20 6.5
Total 310 100
The results from Table 4.16 illustrated that 46.5 % of respondents who use car
wash service regularly stated that the primary reason why they are not member of any
car wash service operators is they do not use car service regularly.
Table 4.17 Respondents’ Using Car Wash Service Behavior Pattern Classified by
Persuasion
Persuasion Frequency Percent
Yes 163 47.0
No 184 53.0
Total 347 100.0
The results from Table 4.17 illustrated that 53 % of respondents who use car
wash service regularly stated that they have never been invited by any media to be
membership with car wash service operators.
38
Table 4.18 Respondents’ Using Car Wash Service Behavior Pattern Classified by
Media Persuasion
Media Persuasion Frequency Percent
Newspapers 16 9.8
Magazines 12 7.4
TV 5 3.1
Radio 3 1.8
Billboard 28 17.2
Brochure/Leaflet 83 50.9
Internet 17 10.4
Other 28 17.2
Total 163 100.0
The results from Table 4.18 illustrated that up to 50.9 % of respondents who
have been persuaded to be membership stated that they have always been invited by
brochures or leaflets to be membership with car wash service operators.
Table 4.19 Respondents’ Using Car Wash Service Behavior Pattern Classified by
Guarantee Policy
Guarantee policy Frequency Percent
Yes 336 96.8
No 11 3.2
Total 347 100.0
The results from Table 4.19 illustrated that up to 96.8 % of respondents who
use car wash service regularly stated that they would like car wash service operators
to have quality guarantee policy.
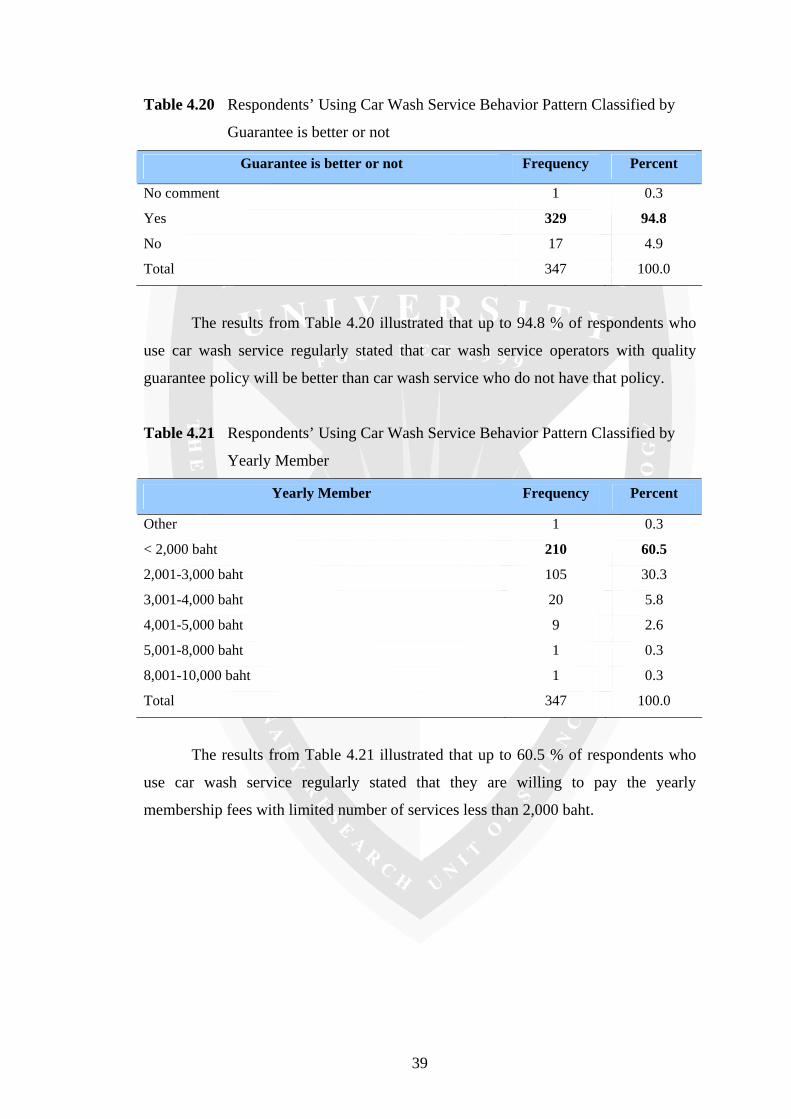
39
Table 4.20 Respondents’ Using Car Wash Service Behavior Pattern Classified by
Guarantee is better or not
Guarantee is better or not Frequency Percent
No comment 1 0.3
Yes 329 94.8
No 17 4.9
Total 347 100.0
The results from Table 4.20 illustrated that up to 94.8 % of respondents who
use car wash service regularly stated that car wash service operators with quality
guarantee policy will be better than car wash service who do not have that policy.
Table 4.21 Respondents’ Using Car Wash Service Behavior Pattern Classified by
Yearly Member
Yearly Member Frequency Percent
Other 1 0.3
< 2,000 baht 210 60.5
2,001-3,000 baht 105 30.3
3,001-4,000 baht 20 5.8
4,001-5,000 baht 9 2.6
5,001-8,000 baht 1 0.3
8,001-10,000 baht 1 0.3
Total 347 100.0
The results from Table 4.21 illustrated that up to 60.5 % of respondents who
use car wash service regularly stated that they are willing to pay the yearly
membership fees with limited number of services less than 2,000 baht.

40
Table 4.22 Respondents’ Using Car Wash Service Behavior Pattern Classified by
Regularly Car Wash Service Place
Regularly car wash service place Frequency Percent
No comment or do not have regular places 203 58.5
Gas Station 108 31.1
Department Store 16 4.6
Stand alone car wash service 20 5.8
Total 347 100.0
The results from Table 4.22 revealed that 31.1 % of respondents who use car
wash service regularly stated that they regularly use the service at gas station or
pump.
Table 4.23 Respondents’ Using Car Wash Service Behavior Pattern Classified by
Rationales for becoming a Member
Rationales for becoming a
member
N SE Mode SD
Location 347 0.11 1 2.13
Service fees 347 0.1 2 1.88
Reliability 347 0.12 3 2.25
Word of mount 347 0.14 7 2.60
Products 347 0.13 7 2.41
Advertising 347 0.13 9 2.35
Promotion 347 0.14 8 2.52
Cleanness 347 0.12 3 2.17
Credit or debit 347 0.14 10 2.62
Employees 347 0.13 4 2.35
The results from Table 4.23 revealed that most of respondents who use car
wash service regularly stated that they always give their first priority when they are
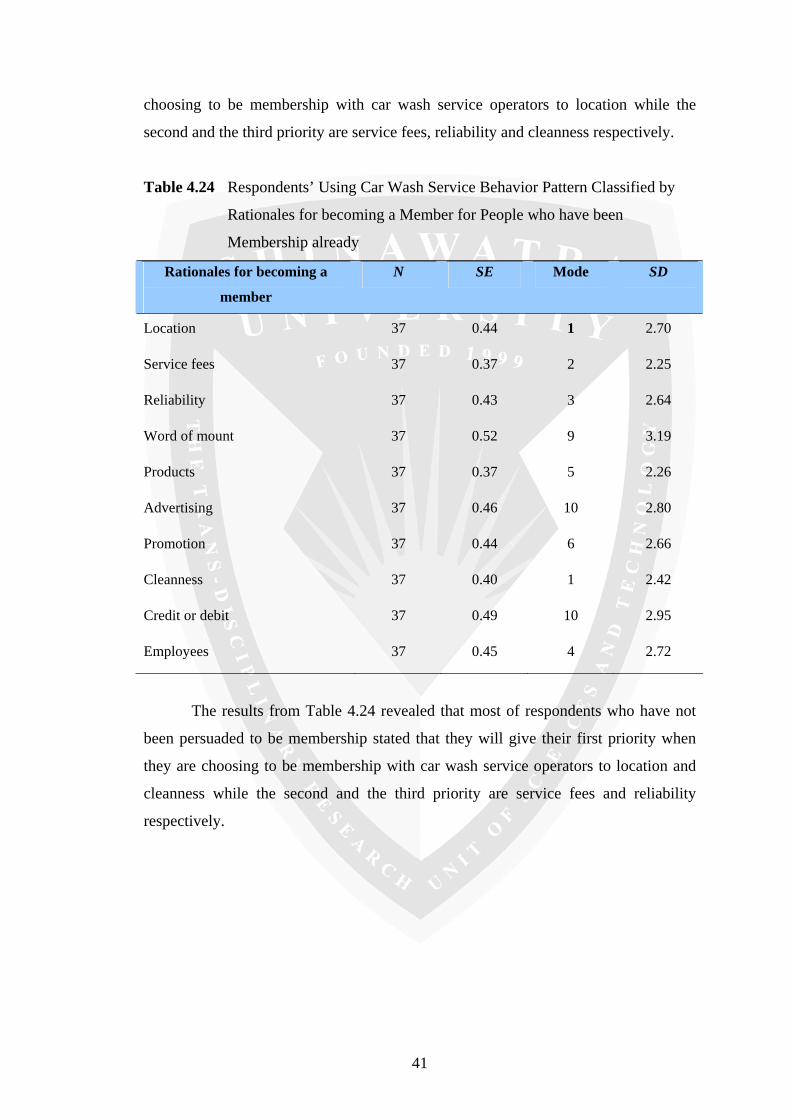
41
choosing to be membership with car wash service operators to location while the
second and the third priority are service fees, reliability and cleanness respectively.
Table 4.24 Respondents’ Using Car Wash Service Behavior Pattern Classified by
Rationales for becoming a Member for People who have been
Membership already
Rationales for becoming a
member
N SE Mode SD
Location 37 0.44 1 2.70
Service fees 37 0.37 2 2.25
Reliability 37 0.43 3 2.64
Word of mount 37 0.52 9 3.19
Products 37 0.37 5 2.26
Advertising 37 0.46 10 2.80
Promotion 37 0.44 6 2.66
Cleanness 37 0.40 1 2.42
Credit or debit 37 0.49 10 2.95
Employees 37 0.45 4 2.72
The results from Table 4.24 revealed that most of respondents who have not
been persuaded to be membership stated that they will give their first priority when
they are choosing to be membership with car wash service operators to location and
cleanness while the second and the third priority are service fees and reliability
respectively.
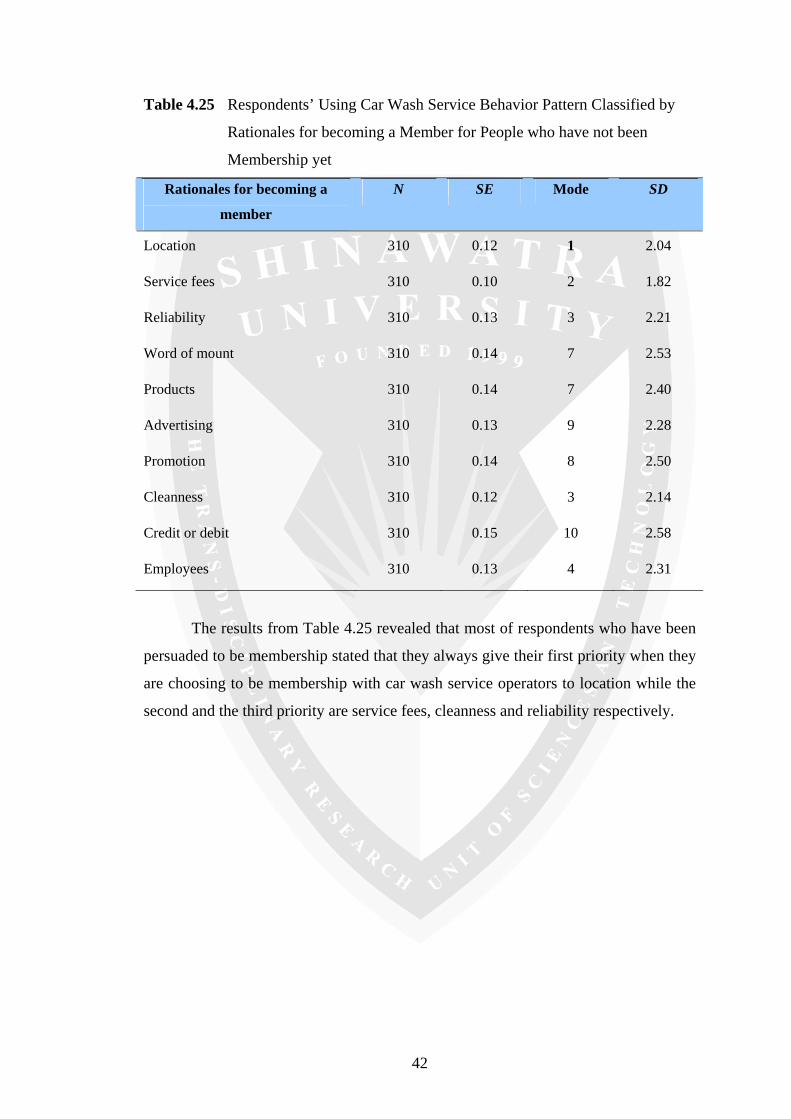
42
Table 4.25 Respondents’ Using Car Wash Service Behavior Pattern Classified by
Rationales for becoming a Member for People who have not been
Membership yet
Rationales for becoming a
member
N SE Mode SD
Location 310 0.12 1 2.04
Service fees 310 0.10 2 1.82
Reliability 310 0.13 3 2.21
Word of mount 310 0.14 7 2.53
Products 310 0.14 7 2.40
Advertising 310 0.13 9 2.28
Promotion 310 0.14 8 2.50
Cleanness 310 0.12 3 2.14
Credit or debit 310 0.15 10 2.58
Employees 310 0.13 4 2.31
The results from Table 4.25 revealed that most of respondents who have been
persuaded to be membership stated that they always give their first priority when they
are choosing to be membership with car wash service operators to location while the
second and the third priority are service fees, cleanness and reliability respectively.

43
Table 4.26 Respondents’ Using Car Wash Service Behavior Pattern Classified by
Expectation from Using Car Wash Service
Expectation from using car wash service Frequency Percent
Advice from employees 277 79.8
Proper time range 144 415
Atmosphere 146 42.1
Selling car care products 61 17.6
Additional services 147 42.4
Other 10 2.9
Total 347 100.0
The results from Table 4.26 revealed that up to 79.8 % of respondents who use
car wash service regularly stated that they would like to receive good advice from
employees.
Table 4.27 Respondents’ Using Car Wash Service Behavior Pattern Classified by
Additional Services That Car Wash Service Place might think of
Additional services Frequency Percent
Gas Station 166 47.8
Waiting room 265 76.4
High speed Internet 101 29.1
Convenience Store 171 49.3
Fast food 105 30.3
Dry clean 11 3.2
ATM 113 32.6
Balance a wheel 97 28.0
Transfer lubricants 116 33.4
Other 12 3.5
Total 347 100.0
The results from Table 4.27 revealed that up to 76.4 % of respondents who use
car wash service regularly stated that they would like car wash service operators to
have a waiting room for them when they use the services.
44
The results from Table 4.8 to Table 4.27 illustrated that up to 86.8 percent of
respondents are regularly using car wash service because of their convenience and
limited of time that is very important for modern living world. The sample groups
usually wash their cars once a month. Their most convenient time for using car wash
service is between 3 pm and 6 pm and they will use the service whenever they are
free. However, the most preferred day to use the service is weekends. Most of them
will use car wash service by selecting washing program only which they are willing to
pay 100 to 200 baht per one time that they use the service. Only 13.2 percent of
respondents stated that they do not regularly use the car wash service because they
can wash their cars by themselves.
Up to 89.3 percent of the respondents who regularly use car wash service are
not member of any car wash service operators primarily because they do not use car
wash service regularly and they think that car wash service places charge them high
service fees. Furthermore, they want to try other places to find the most appropriate
car wash service places for them. 53 percent of these group stated that they are never
persuaded by any media to be membership with car wash service operators. On the
other hand, 47 percent of people who regularly use car wash service have been invited
primarily by brochures or leaflets, billboards and internet respectively while the
minority groups of people still confused with the media and said that they have been
introduced to be membership by their friends and employees at the point of sales.
Only 3.2 percent of these groups did not agree on the quality guarantee policy of car
wash service places. However, up to 96.8 percent of them agreed that car wash
service operators should have quality guarantee scheme in order to guarantee
dissatisfied results. In addition, up to 94.8 percent of these groups of people agreed
that car wash service operators with the quality guarantee policy are better than
operators who do not have this policy. However, the minorities did not agree with this
statement because they feel that if it has the quality guarantee policy, operators will
wash their cars cleanly for only the short period and cannot remain the same standard
every time they use the service. Furthermore, some feel that if it has this policy,
operators will charge the higher service fees and they have to pay more for the
service.
The membership fees levels that people who regularly use car wash service are
willing to pay per year with limited number of services is lesser than 2,000 baht. They
always give their first priority when they are choosing to be membership with car
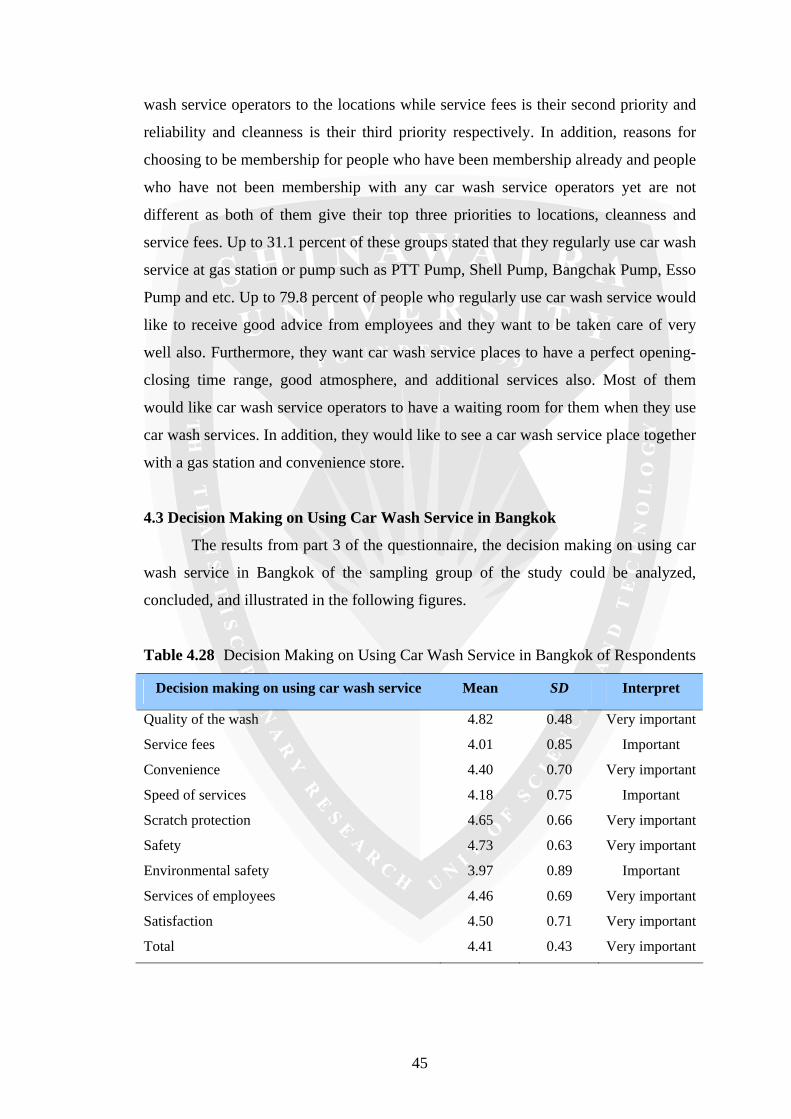
45
wash service operators to the locations while service fees is their second priority and
reliability and cleanness is their third priority respectively. In addition, reasons for
choosing to be membership for people who have been membership already and people
who have not been membership with any car wash service operators yet are not
different as both of them give their top three priorities to locations, cleanness and
service fees. Up to 31.1 percent of these groups stated that they regularly use car wash
service at gas station or pump such as PTT Pump, Shell Pump, Bangchak Pump, Esso
Pump and etc. Up to 79.8 percent of people who regularly use car wash service would
like to receive good advice from employees and they want to be taken care of very
well also. Furthermore, they want car wash service places to have a perfect opening-
closing time range, good atmosphere, and additional services also. Most of them
would like car wash service operators to have a waiting room for them when they use
car wash services. In addition, they would like to see a car wash service place together
with a gas station and convenience store.
4.3 Decision Making on Using Car Wash Service in Bangkok
The results from part 3 of the questionnaire, the decision making on using car
wash service in Bangkok of the sampling group of the study could be analyzed,
concluded, and illustrated in the following figures.
Table 4.28 Decision Making on Using Car Wash Service in Bangkok of Respondents
Decision making on using car wash service Mean SD Interpret
Quality of the wash 4.82 0.48 Very important
Service fees 4.01 0.85 Important
Convenience 4.40 0.70 Very important
Speed of services 4.18 0.75 Important
Scratch protection 4.65 0.66 Very important
Safety 4.73 0.63 Very important
Environmental safety 3.97 0.89 Important
Services of employees 4.46 0.69 Very important
Satisfaction 4.50 0.71 Very important
Total 4.41 0.43 Very important
46
Overall results from Table 14.4 conclude that respondents think that all factors
are very important for decision making on using car wash service in Bangkok (mean
4.41). When consider by factor, we could summarize that quality of the wash (mean
4.82) is very important for decision making on using car wash service. Moreover,
safety (mean 4.73), scratch protection (mean 4.65), and satisfaction with the works
(mean 4.50), service of employees (mean 4.46), convenience to use the car wash
service (mean 4.40) are very important factor also. In the meanwhile, speed of service
(mean 4.18), service fees (mean 4.01), and environmental safety (mean 3.97) are
considered as important factor for decision making on using car wash service.
4.4 Testing of the Hypothesis
We employed One-way ANOVA statistics to test the hypothesis by testing
differences between two groups of data variables as follow:
1) Hypothesis 1
There is no significance difference between demographic factors and
marketing mix factors

47
• Sub-Hypothesis 1.1: There is no significance difference between respondent’s
gender and marketing mix factors
Ho: There is no significance difference between respondent’s gender and
marketing mix factors
Table 4.29 Relationship between Gender and Marketing Mix Factors
Gender Sum of Squares df Mean Square F Sig.
Program that always use Between Groups 2.864 1 2.864 2.480 0.116 Within Groups 398.318 345 1.155 Total 401.182 346 Spending budget per time Between Groups 1.062 1 1.062 1.189 0.276 Within Groups 307.912 345 0.892 Total 308.974 346 Membership Between Groups 0.003 1 0.003 0.032 0.859 Within Groups 33.052 345 0.096 Total 33.055 346 Persuasion Between Groups 0.293 1 0.293 1.175 0.279 Within Groups 86.139 345 0.250 Total 86.432 346 Guarantee Between Groups 0.091 1 0.091 2.964 0.086 Within Groups 10.561 345 0.031 Total 10.651 346 Guarantee is better or not Between Groups 0.024 1 0.024 0.479 0.490 Within Groups 17.238 345 0.050 Total 17.262 346 Yearly Member Between Groups 0.010 1 0.010 0.016 0.899 Within Groups 214.618 345 0.622 Total 214.628 346 Your regular car wash service place Between Groups 0.353 1 0.353 0.515 0.473 Within Groups 236.373 345 0.685 Total 236.726 346
Table 4.29 illustrated that gender and all marketing mix factors Sig. is more
than 0.05. Therefore, we accepted null hypothesis and concluded that gender is not a
key factor affected marketing mix factors.
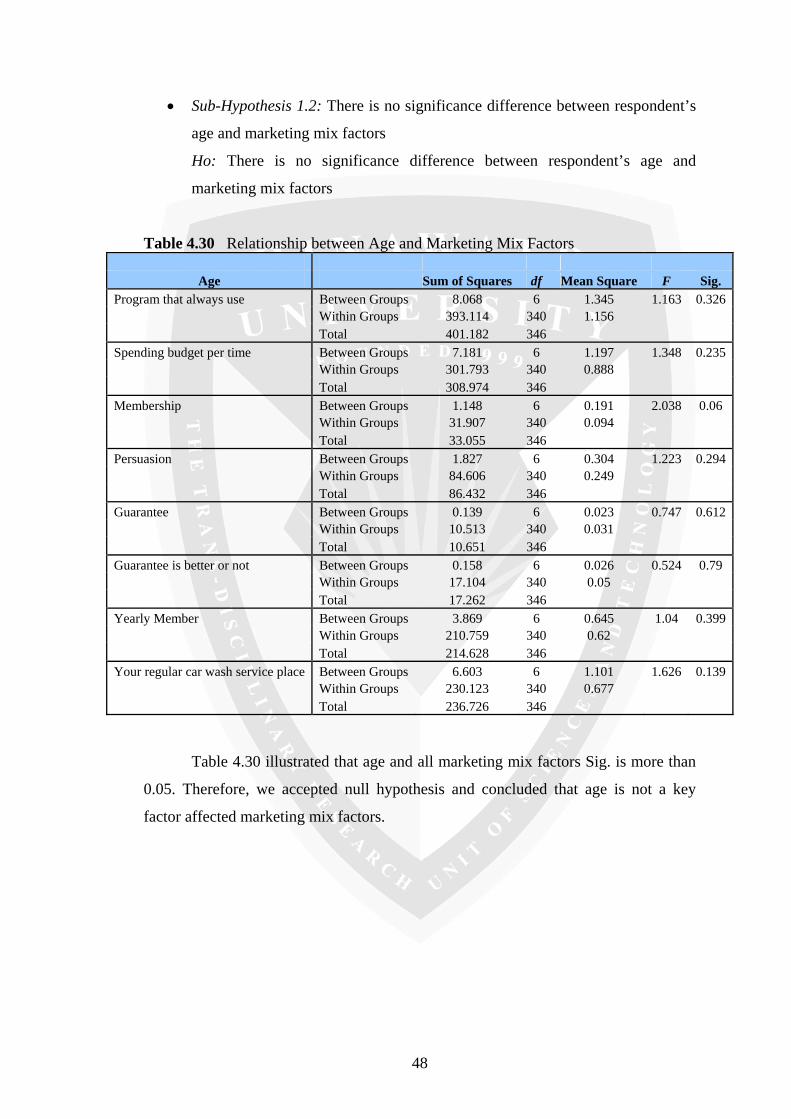
48
• Sub-Hypothesis 1.2: There is no significance difference between respondent’s
age and marketing mix factors
Ho: There is no significance difference between respondent’s age and
marketing mix factors
Table 4.30 Relationship between Age and Marketing Mix Factors
Age Sum of Squares df Mean Square F Sig. Program that always use Between Groups 8.068 6 1.345 1.163 0.326 Within Groups 393.114 340 1.156 Total 401.182 346 Spending budget per time Between Groups 7.181 6 1.197 1.348 0.235 Within Groups 301.793 340 0.888 Total 308.974 346 Membership Between Groups 1.148 6 0.191 2.038 0.06 Within Groups 31.907 340 0.094 Total 33.055 346 Persuasion Between Groups 1.827 6 0.304 1.223 0.294 Within Groups 84.606 340 0.249 Total 86.432 346 Guarantee Between Groups 0.139 6 0.023 0.747 0.612 Within Groups 10.513 340 0.031 Total 10.651 346 Guarantee is better or not Between Groups 0.158 6 0.026 0.524 0.79 Within Groups 17.104 340 0.05 Total 17.262 346 Yearly Member Between Groups 3.869 6 0.645 1.04 0.399 Within Groups 210.759 340 0.62 Total 214.628 346 Your regular car wash service place Between Groups 6.603 6 1.101 1.626 0.139 Within Groups 230.123 340 0.677 Total 236.726 346
Table 4.30 illustrated that age and all marketing mix factors Sig. is more than
0.05. Therefore, we accepted null hypothesis and concluded that age is not a key
factor affected marketing mix factors.
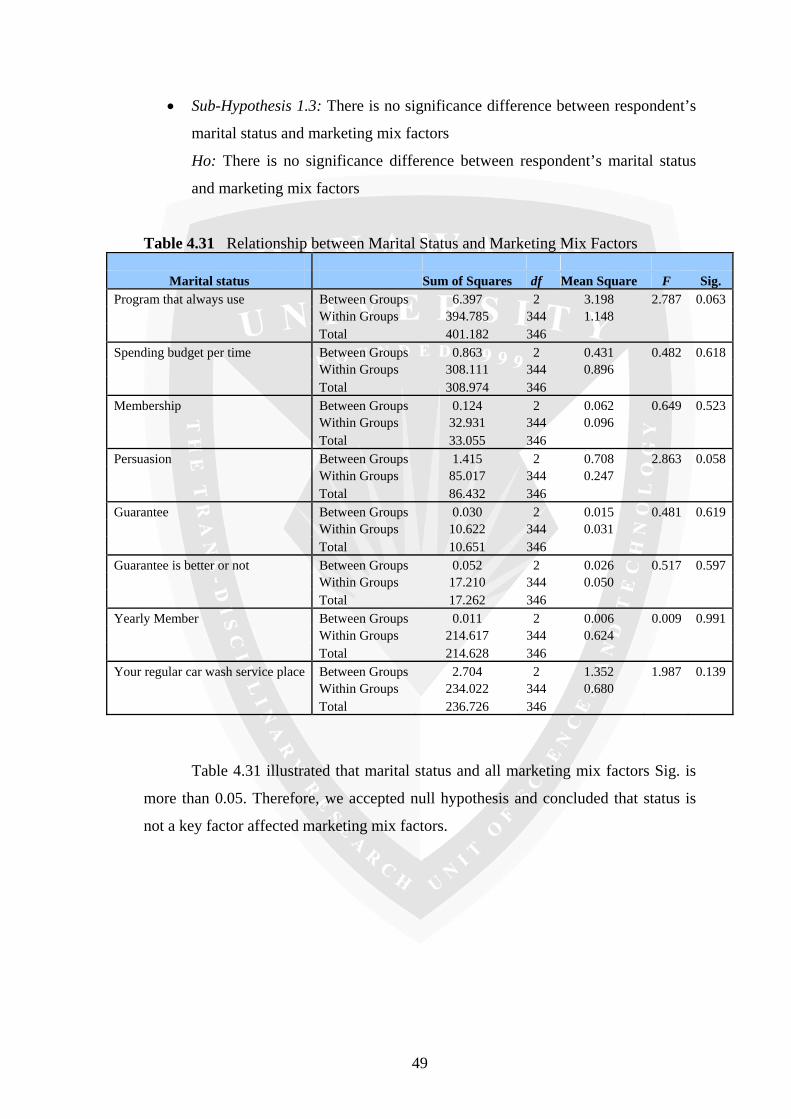
49
• Sub-Hypothesis 1.3: There is no significance difference between respondent’s
marital status and marketing mix factors
Ho: There is no significance difference between respondent’s marital status
and marketing mix factors
Table 4.31 Relationship between Marital Status and Marketing Mix Factors
Marital status Sum of Squares df Mean Square F Sig. Program that always use Between Groups 6.397 2 3.198 2.787 0.063 Within Groups 394.785 344 1.148 Total 401.182 346 Spending budget per time Between Groups 0.863 2 0.431 0.482 0.618 Within Groups 308.111 344 0.896 Total 308.974 346 Membership Between Groups 0.124 2 0.062 0.649 0.523 Within Groups 32.931 344 0.096 Total 33.055 346 Persuasion Between Groups 1.415 2 0.708 2.863 0.058 Within Groups 85.017 344 0.247 Total 86.432 346 Guarantee Between Groups 0.030 2 0.015 0.481 0.619 Within Groups 10.622 344 0.031 Total 10.651 346 Guarantee is better or not Between Groups 0.052 2 0.026 0.517 0.597 Within Groups 17.210 344 0.050 Total 17.262 346 Yearly Member Between Groups 0.011 2 0.006 0.009 0.991 Within Groups 214.617 344 0.624 Total 214.628 346 Your regular car wash service place Between Groups 2.704 2 1.352 1.987 0.139 Within Groups 234.022 344 0.680 Total 236.726 346
Table 4.31 illustrated that marital status and all marketing mix factors Sig. is
more than 0.05. Therefore, we accepted null hypothesis and concluded that status is
not a key factor affected marketing mix factors.
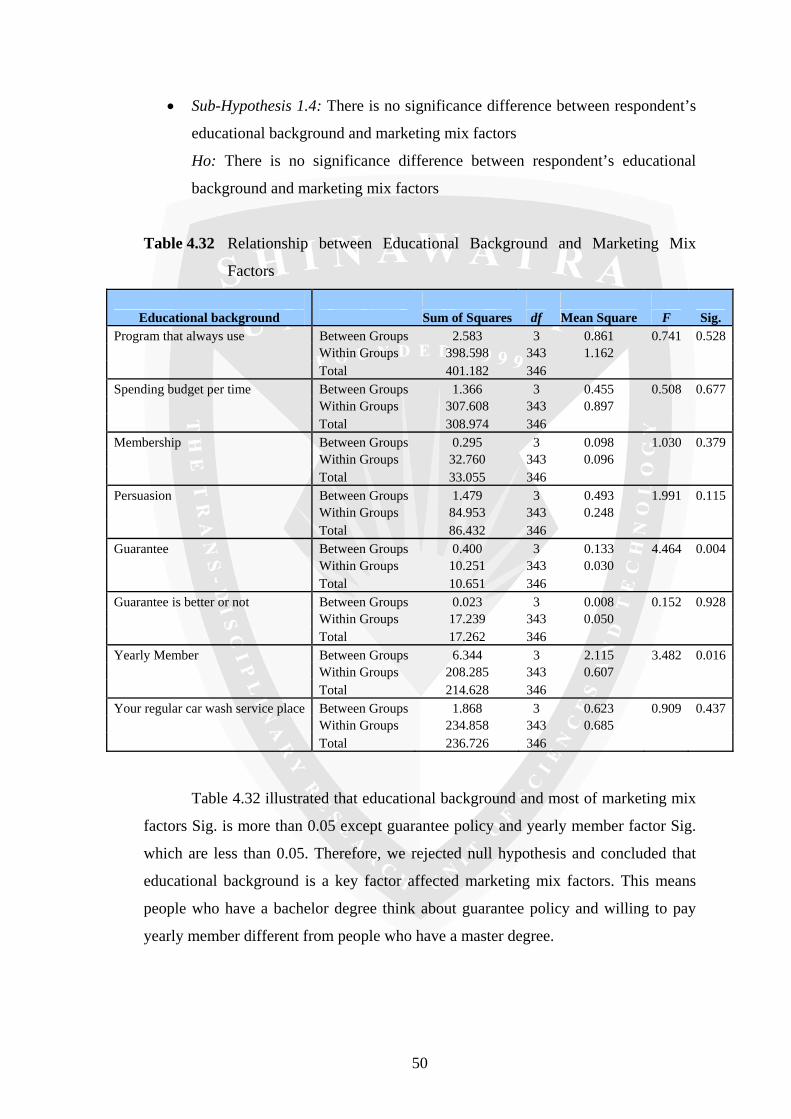
50
• Sub-Hypothesis 1.4: There is no significance difference between respondent’s
educational background and marketing mix factors
Ho: There is no significance difference between respondent’s educational
background and marketing mix factors
Table 4.32 Relationship between Educational Background and Marketing Mix
Factors
Educational background Sum of Squares df Mean Square F Sig.
Program that always use Between Groups 2.583 3 0.861 0.741 0.528 Within Groups 398.598 343 1.162 Total 401.182 346 Spending budget per time Between Groups 1.366 3 0.455 0.508 0.677 Within Groups 307.608 343 0.897 Total 308.974 346 Membership Between Groups 0.295 3 0.098 1.030 0.379 Within Groups 32.760 343 0.096 Total 33.055 346 Persuasion Between Groups 1.479 3 0.493 1.991 0.115 Within Groups 84.953 343 0.248 Total 86.432 346 Guarantee Between Groups 0.400 3 0.133 4.464 0.004 Within Groups 10.251 343 0.030 Total 10.651 346 Guarantee is better or not Between Groups 0.023 3 0.008 0.152 0.928 Within Groups 17.239 343 0.050 Total 17.262 346 Yearly Member Between Groups 6.344 3 2.115 3.482 0.016 Within Groups 208.285 343 0.607 Total 214.628 346 Your regular car wash service place Between Groups 1.868 3 0.623 0.909 0.437 Within Groups 234.858 343 0.685 Total 236.726 346
Table 4.32 illustrated that educational background and most of marketing mix
factors Sig. is more than 0.05 except guarantee policy and yearly member factor Sig.
which are less than 0.05. Therefore, we rejected null hypothesis and concluded that
educational background is a key factor affected marketing mix factors. This means
people who have a bachelor degree think about guarantee policy and willing to pay
yearly member different from people who have a master degree.
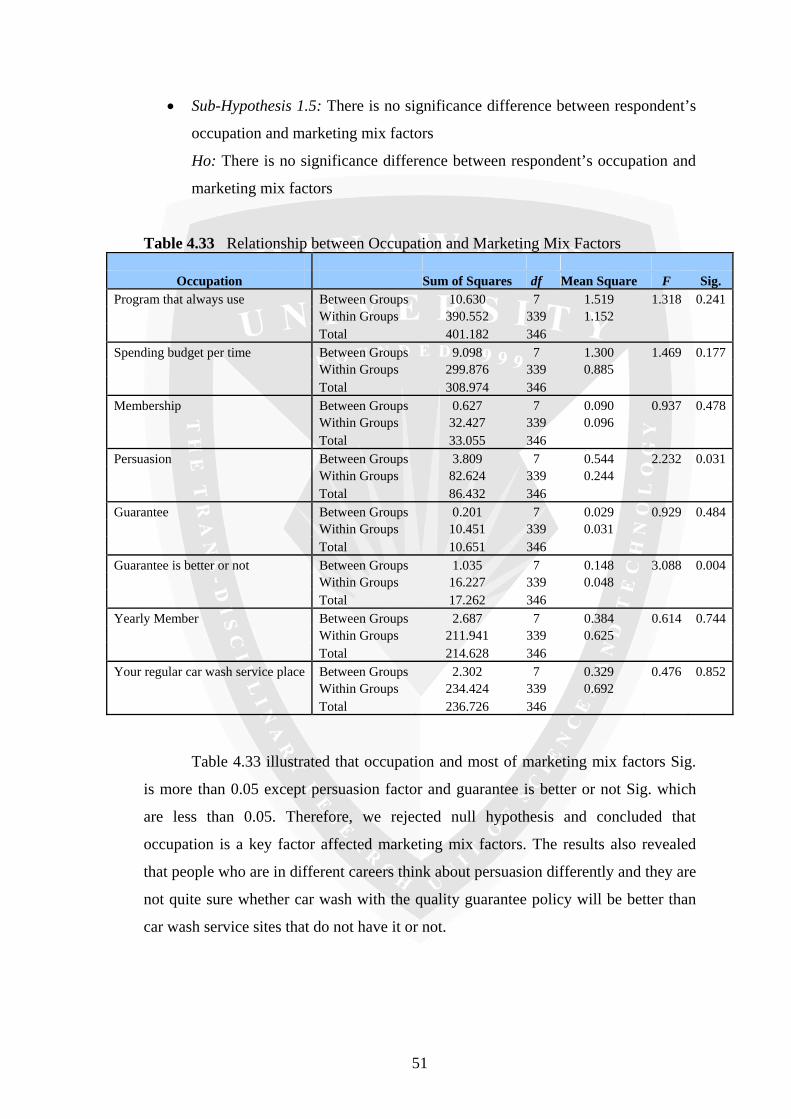
51
• Sub-Hypothesis 1.5: There is no significance difference between respondent’s
occupation and marketing mix factors
Ho: There is no significance difference between respondent’s occupation and
marketing mix factors
Table 4.33 Relationship between Occupation and Marketing Mix Factors
Occupation Sum of Squares df Mean Square F Sig. Program that always use Between Groups 10.630 7 1.519 1.318 0.241 Within Groups 390.552 339 1.152 Total 401.182 346 Spending budget per time Between Groups 9.098 7 1.300 1.469 0.177 Within Groups 299.876 339 0.885 Total 308.974 346 Membership Between Groups 0.627 7 0.090 0.937 0.478 Within Groups 32.427 339 0.096 Total 33.055 346 Persuasion Between Groups 3.809 7 0.544 2.232 0.031 Within Groups 82.624 339 0.244 Total 86.432 346 Guarantee Between Groups 0.201 7 0.029 0.929 0.484 Within Groups 10.451 339 0.031 Total 10.651 346 Guarantee is better or not Between Groups 1.035 7 0.148 3.088 0.004 Within Groups 16.227 339 0.048 Total 17.262 346 Yearly Member Between Groups 2.687 7 0.384 0.614 0.744 Within Groups 211.941 339 0.625 Total 214.628 346 Your regular car wash service place Between Groups 2.302 7 0.329 0.476 0.852 Within Groups 234.424 339 0.692 Total 236.726 346
Table 4.33 illustrated that occupation and most of marketing mix factors Sig.
is more than 0.05 except persuasion factor and guarantee is better or not Sig. which
are less than 0.05. Therefore, we rejected null hypothesis and concluded that
occupation is a key factor affected marketing mix factors. The results also revealed
that people who are in different careers think about persuasion differently and they are
not quite sure whether car wash with the quality guarantee policy will be better than
car wash service sites that do not have it or not.

52
• Sub-Hypothesis 1.6: There is no significance difference between respondent’s
working position and marketing mix factors
Ho: There is no significance difference between respondent’s working
position and marketing mix factors
Table 4.34 Relationship between Working Position and Marketing Mix Factors
Position Sum of Squares df Mean Square F Sig.
Program that always use Between Groups 4.749 4 1.187 1.024 0.395 Within Groups 396.432 342 1.159 Total 401.182 346 Spending budget per time Between Groups 5.343 4 1.336 1.505 0.200 Within Groups 303.631 342 0.888 Total 308.974 346 Membership Between Groups 1.611 4 0.403 4.380 0.002 Within Groups 31.444 342 0.092 Total 33.055 346 Persuasion Between Groups 0.383 4 0.096 0.381 0.822 Within Groups 86.049 342 0.252 Total 86.432 346 Guarantee Between Groups 0.133 4 0.033 1.082 0.365 Within Groups 10.518 342 0.031 Total 10.651 346 Guarantee is better or not Between Groups 0.151 4 0.038 0.754 0.556 Within Groups 17.111 342 0.050 Total 17.262 346 Yearly Member Between Groups 10.615 4 2.654 4.449 0.002 Within Groups 204.013 342 0.597 Total 214.628 346 Your regular car wash service place Between Groups 4.032 4 1.008 1.482 0.207 Within Groups 232.694 342 0.680 Total 236.726 346
Table 4.34 illustrated that working position and most of marketing mix factors
Sig. is more than 0.05 except membership and yearly member factor Sig. which are
less than 0.05. Therefore, we rejected null hypothesis and concluded that position is a
key factor affected marketing mix factors. The results also revealed that people who
are in different working positions think about membership and willing to pay yearly
member differently.

53
• Sub-Hypothesis 1.7: There is no significance difference between respondent’s
salary and marketing mix factors
Ho: There is no significance difference between respondent’s salary and
marketing mix factors
Table 4.35 Relationship between Salary and Marketing Mix Factors
Salary Sum of Squares df Mean Square F Sig.
Program that always use Between Groups 6.539 8 0.817 0.700 0.692 Within Groups 394.643 338 1.168 Total 401.182 346 Spending budget per time Between Groups 7.792 8 0.974 1.093 0.367 Within Groups 301.183 338 0.891 Total 308.974 346 Membership Between Groups 1.617 8 0.202 2.173 0.029 Within Groups 31.438 338 0.093 Total 33.055 346 Persuasion Between Groups 2.010 8 0.251 1.006 0.431 Within Groups 84.422 338 0.250 Total 86.432 346 Guarantee Between Groups 0.060 8 0.007 0.239 0.983 Within Groups 10.591 338 0.031 Total 10.651 346 Guarantee is better or not Between Groups 0.426 8 0.053 1.068 0.385 Within Groups 16.837 338 0.050 Total 17.262 346 Yearly Member Between Groups 10.267 8 1.283 2.123 0.033 Within Groups 204.361 338 0.605 Total 214.628 346 Your regular car wash service place Between Groups 8.529 8 1.066 1.579 0.130 Within Groups 228.197 338 0.675 Total 236.726 346
Table 4.35 illustrated that salary and most of marketing mix factors Sig. is
more than 0.05 except membership and yearly member factor Sig. which are less than
0.05. Therefore, we rejected null hypothesis and concluded that salary is a key factor
affected marketing mix factors. The results also revealed that people who earn
different monthly income think about membership and willing to pay yearly member
differently.
The results from Sub-Hypothesis 1.1 to Sub-Hypothesis 1.7 illustrated that
educational background, occupation, working position and salary are key factors
affected marketing factors.
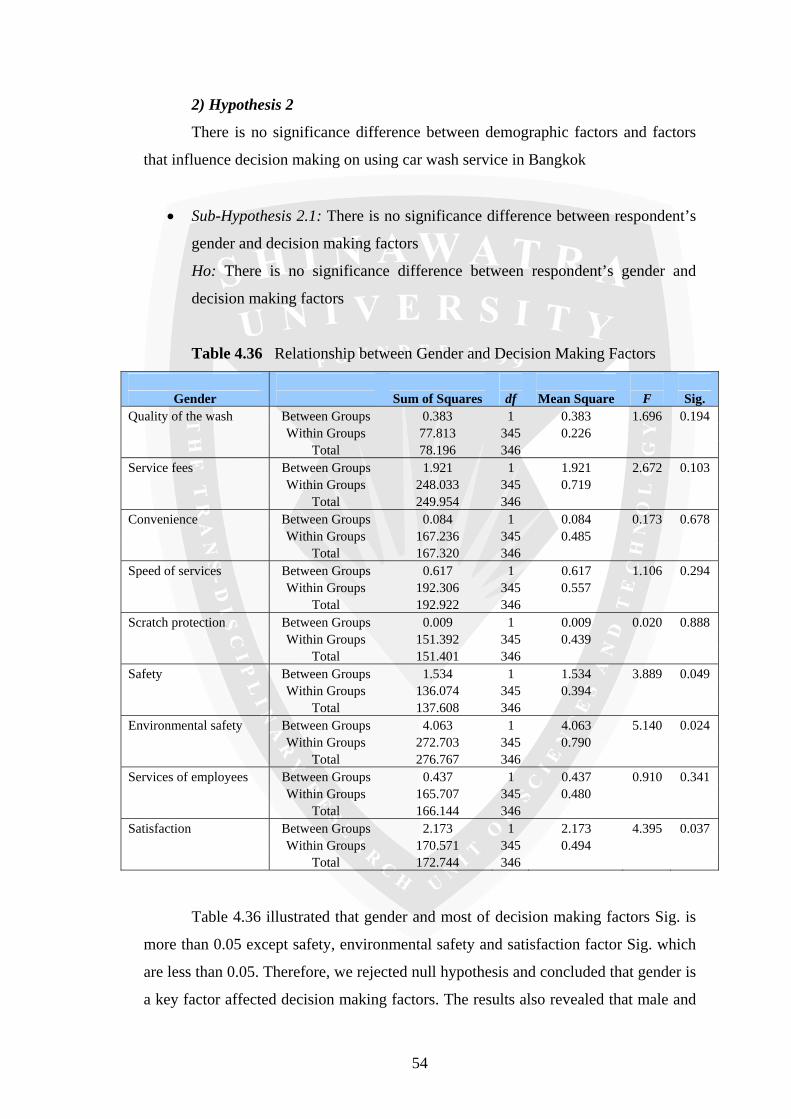
54
2) Hypothesis 2
There is no significance difference between demographic factors and factors
that influence decision making on using car wash service in Bangkok
• Sub-Hypothesis 2.1: There is no significance difference between respondent’s
gender and decision making factors
Ho: There is no significance difference between respondent’s gender and
decision making factors
Table 4.36 Relationship between Gender and Decision Making Factors
Gender Sum of Squares df Mean Square F Sig.
Quality of the wash Between Groups 0.383 1 0.383 1.696 0.194 Within Groups 77.813 345 0.226 Total 78.196 346 Service fees Between Groups 1.921 1 1.921 2.672 0.103 Within Groups 248.033 345 0.719 Total 249.954 346 Convenience Between Groups 0.084 1 0.084 0.173 0.678 Within Groups 167.236 345 0.485 Total 167.320 346 Speed of services Between Groups 0.617 1 0.617 1.106 0.294 Within Groups 192.306 345 0.557 Total 192.922 346 Scratch protection Between Groups 0.009 1 0.009 0.020 0.888 Within Groups 151.392 345 0.439 Total 151.401 346 Safety Between Groups 1.534 1 1.534 3.889 0.049 Within Groups 136.074 345 0.394 Total 137.608 346 Environmental safety Between Groups 4.063 1 4.063 5.140 0.024 Within Groups 272.703 345 0.790 Total 276.767 346 Services of employees Between Groups 0.437 1 0.437 0.910 0.341 Within Groups 165.707 345 0.480 Total 166.144 346 Satisfaction Between Groups 2.173 1 2.173 4.395 0.037 Within Groups 170.571 345 0.494 Total 172.744 346
Table 4.36 illustrated that gender and most of decision making factors Sig. is
more than 0.05 except safety, environmental safety and satisfaction factor Sig. which
are less than 0.05. Therefore, we rejected null hypothesis and concluded that gender is
a key factor affected decision making factors. The results also revealed that male and
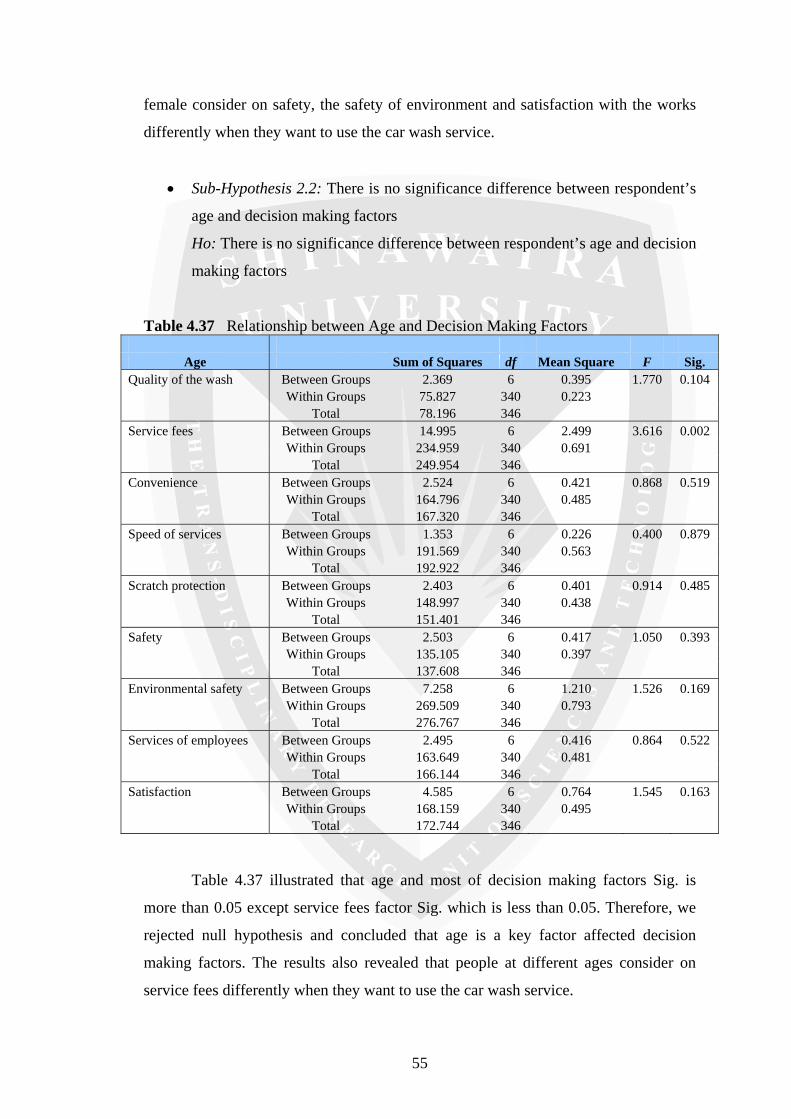
55
female consider on safety, the safety of environment and satisfaction with the works
differently when they want to use the car wash service.
• Sub-Hypothesis 2.2: There is no significance difference between respondent’s
age and decision making factors
Ho: There is no significance difference between respondent’s age and decision
making factors
Table 4.37 Relationship between Age and Decision Making Factors
Age Sum of Squares df Mean Square F Sig. Quality of the wash Between Groups 2.369 6 0.395 1.770 0.104 Within Groups 75.827 340 0.223 Total 78.196 346 Service fees Between Groups 14.995 6 2.499 3.616 0.002 Within Groups 234.959 340 0.691 Total 249.954 346 Convenience Between Groups 2.524 6 0.421 0.868 0.519 Within Groups 164.796 340 0.485 Total 167.320 346 Speed of services Between Groups 1.353 6 0.226 0.400 0.879 Within Groups 191.569 340 0.563 Total 192.922 346 Scratch protection Between Groups 2.403 6 0.401 0.914 0.485 Within Groups 148.997 340 0.438 Total 151.401 346 Safety Between Groups 2.503 6 0.417 1.050 0.393 Within Groups 135.105 340 0.397 Total 137.608 346 Environmental safety Between Groups 7.258 6 1.210 1.526 0.169 Within Groups 269.509 340 0.793 Total 276.767 346 Services of employees Between Groups 2.495 6 0.416 0.864 0.522 Within Groups 163.649 340 0.481 Total 166.144 346 Satisfaction Between Groups 4.585 6 0.764 1.545 0.163 Within Groups 168.159 340 0.495 Total 172.744 346
Table 4.37 illustrated that age and most of decision making factors Sig. is
more than 0.05 except service fees factor Sig. which is less than 0.05. Therefore, we
rejected null hypothesis and concluded that age is a key factor affected decision
making factors. The results also revealed that people at different ages consider on
service fees differently when they want to use the car wash service.

56
• Sub-Hypothesis 2.3: There is no significance difference between respondent’s
marital status and decision making factors
Ho: There is no significance difference between respondent’s marital status
and decision making factors
Table 4.38 Relationship between Marital Status and Decision Making Factors
Marital Status Sum of Squares df Mean Square F Sig. Quality of the wash Between Groups 0.585 2 0.293 1.297 0.275 Within Groups 77.611 344 0.226 Total 78.196 346 Service fees Between Groups 10.463 2 5.231 7.514 0.001 Within Groups 239.491 344 0.696 Total 249.954 346 Convenience Between Groups 0.118 2 0.059 0.122 0.885 Within Groups 167.201 344 0.486 Total 167.320 346 Speed of services Between Groups 0.675 2 0.337 0.604 0.547 Within Groups 192.247 344 0.559 Total 192.922 346 Scratch protection Between Groups 0.628 2 0.314 0.716 0.489 Within Groups 150.773 344 0.438 Total 151.401 346 Safety Between Groups 8.615 2 4.308 11.488 0.000 Within Groups 128.993 344 0.375 Total 137.608 346 Environmental safety Between Groups 0.883 2 0.441 0.550 0.577 Within Groups 275.884 344 0.802 Total 276.767 346 Services of employees Between Groups 0.327 2 0.164 0.340 0.712 Within Groups 165.817 344 0.482 Total 166.144 346 Satisfaction Between Groups 1.961 2 0.981 1.975 0.140 Within Groups 170.782 344 0.496 Total 172.744 346
Table 4.38 illustrated that marital status and most of decision making factors
Sig. is more than 0.05 except service fees and safety factor Sig. which are less than
0.05. Therefore, we rejected null hypothesis and concluded that marital status is a key
factor affected decision making factors. The results also revealed that people who are
single consider on service fees and safety differently when they want to use the car
wash service from people who are married or divorced.
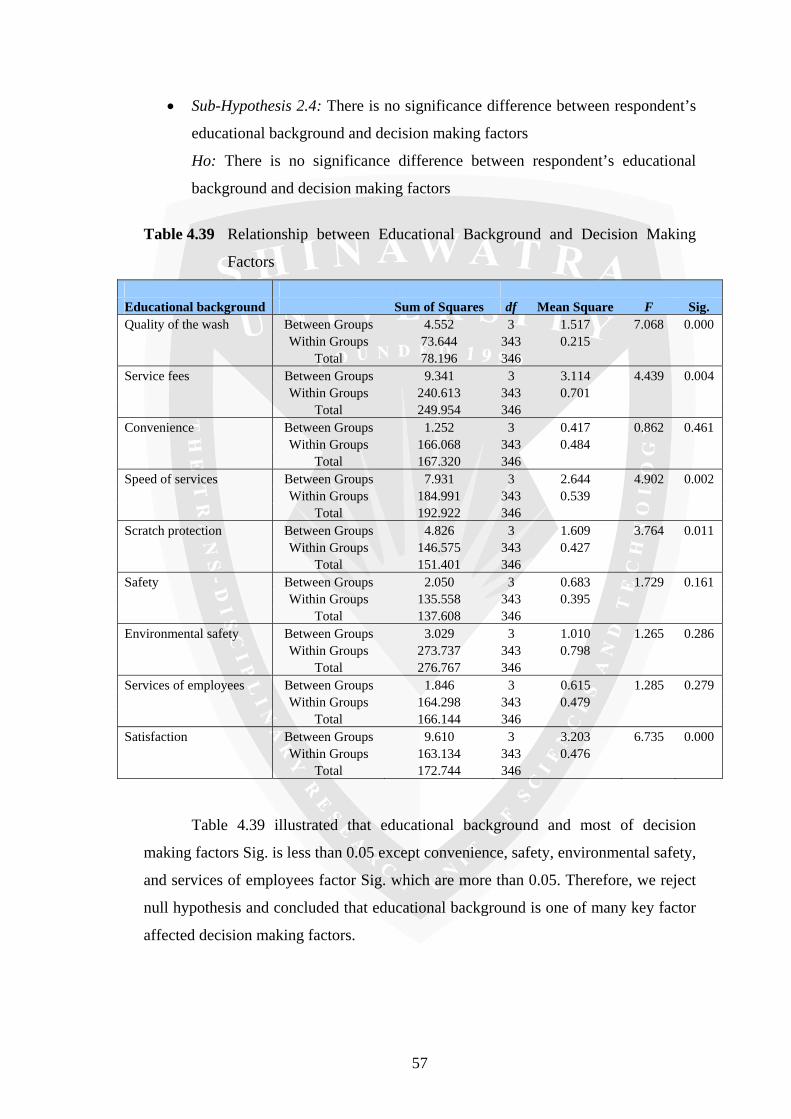
57
• Sub-Hypothesis 2.4: There is no significance difference between respondent’s
educational background and decision making factors
Ho: There is no significance difference between respondent’s educational
background and decision making factors
Table 4.39 Relationship between Educational Background and Decision Making
Factors
Educational background Sum of Squares df Mean Square F Sig. Quality of the wash Between Groups 4.552 3 1.517 7.068 0.000 Within Groups 73.644 343 0.215 Total 78.196 346 Service fees Between Groups 9.341 3 3.114 4.439 0.004 Within Groups 240.613 343 0.701 Total 249.954 346 Convenience Between Groups 1.252 3 0.417 0.862 0.461 Within Groups 166.068 343 0.484 Total 167.320 346 Speed of services Between Groups 7.931 3 2.644 4.902 0.002 Within Groups 184.991 343 0.539 Total 192.922 346 Scratch protection Between Groups 4.826 3 1.609 3.764 0.011 Within Groups 146.575 343 0.427 Total 151.401 346 Safety Between Groups 2.050 3 0.683 1.729 0.161 Within Groups 135.558 343 0.395 Total 137.608 346 Environmental safety Between Groups 3.029 3 1.010 1.265 0.286 Within Groups 273.737 343 0.798 Total 276.767 346 Services of employees Between Groups 1.846 3 0.615 1.285 0.279 Within Groups 164.298 343 0.479 Total 166.144 346 Satisfaction Between Groups 9.610 3 3.203 6.735 0.000 Within Groups 163.134 343 0.476 Total 172.744 346
Table 4.39 illustrated that educational background and most of decision
making factors Sig. is less than 0.05 except convenience, safety, environmental safety,
and services of employees factor Sig. which are more than 0.05. Therefore, we reject
null hypothesis and concluded that educational background is one of many key factor
affected decision making factors.
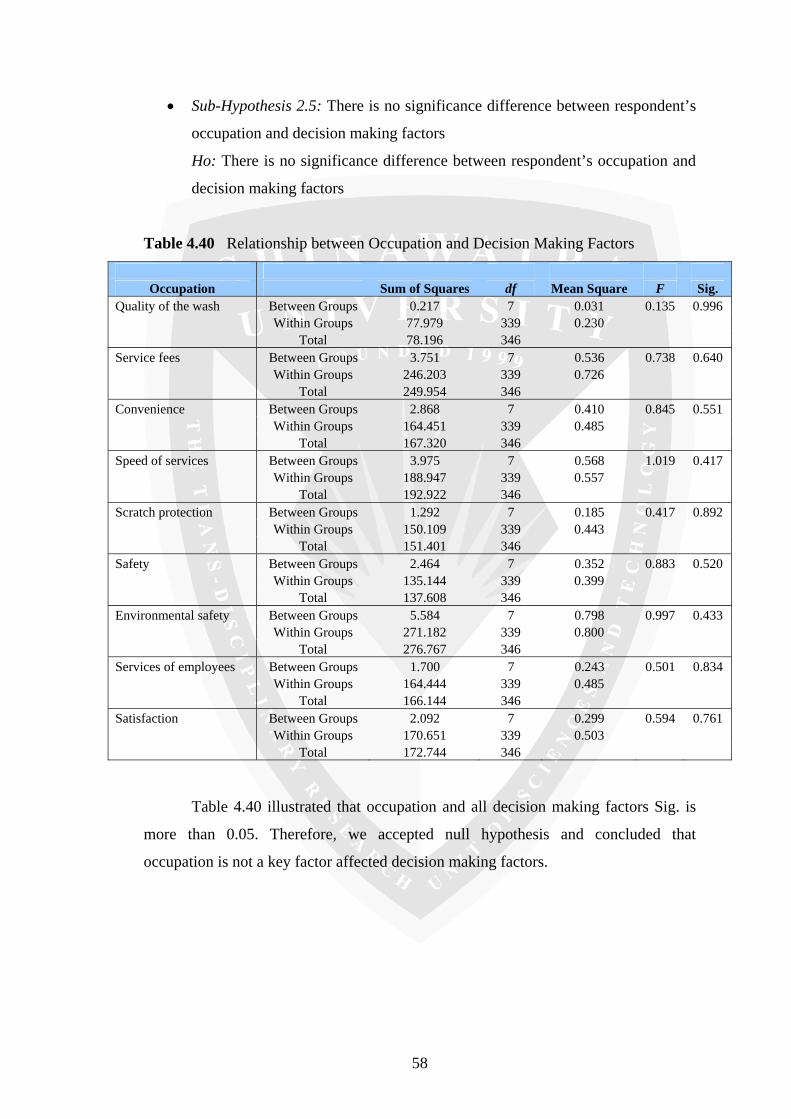
58
• Sub-Hypothesis 2.5: There is no significance difference between respondent’s
occupation and decision making factors
Ho: There is no significance difference between respondent’s occupation and
decision making factors
Table 4.40 Relationship between Occupation and Decision Making Factors
Occupation Sum of Squares df Mean Square F Sig.
Quality of the wash Between Groups 0.217 7 0.031 0.135 0.996 Within Groups 77.979 339 0.230 Total 78.196 346 Service fees Between Groups 3.751 7 0.536 0.738 0.640 Within Groups 246.203 339 0.726 Total 249.954 346 Convenience Between Groups 2.868 7 0.410 0.845 0.551 Within Groups 164.451 339 0.485 Total 167.320 346 Speed of services Between Groups 3.975 7 0.568 1.019 0.417 Within Groups 188.947 339 0.557 Total 192.922 346 Scratch protection Between Groups 1.292 7 0.185 0.417 0.892 Within Groups 150.109 339 0.443 Total 151.401 346 Safety Between Groups 2.464 7 0.352 0.883 0.520 Within Groups 135.144 339 0.399 Total 137.608 346 Environmental safety Between Groups 5.584 7 0.798 0.997 0.433 Within Groups 271.182 339 0.800 Total 276.767 346 Services of employees Between Groups 1.700 7 0.243 0.501 0.834 Within Groups 164.444 339 0.485 Total 166.144 346 Satisfaction Between Groups 2.092 7 0.299 0.594 0.761 Within Groups 170.651 339 0.503 Total 172.744 346
Table 4.40 illustrated that occupation and all decision making factors Sig. is
more than 0.05. Therefore, we accepted null hypothesis and concluded that
occupation is not a key factor affected decision making factors.

59
• Sub-Hypothesis 2.6: There is no significance difference between respondent’s
working position and decision making factors
Ho: There is no significance difference between respondent’s working
position and decision making factors
Table 4.41 Relationship between Working Position and Decision Making Factors
Working position Sum of Squares df Mean Square F Sig. Quality of the wash Between Groups 0.855 4 0.214 0.945 0.438 Within Groups 77.341 342 0.226 Total 78.196 346 Service fees Between Groups 1.352 4 0.338 0.465 0.761 Within Groups 248.602 342 0.727 Total 249.954 346 Convenience Between Groups 2.148 4 0.537 1.112 0.351 Within Groups 165.172 342 0.483 Total 167.320 346 Speed of services Between Groups 1.325 4 0.331 0.591 0.669 Within Groups 191.597 342 0.560 Total 192.922 346 Scratch protection Between Groups 1.772 4 0.443 1.013 0.401 Within Groups 149.628 342 0.438 Total 151.401 346 Safety Between Groups 1.196 4 0.299 0.749 0.559 Within Groups 136.412 342 0.399 Total 137.608 346 Environmental safety Between Groups 5.823 4 1.456 1.838 0.121 Within Groups 270.943 342 0.792 Total 276.767 346 Services of employees Between Groups 0.941 4 0.235 0.487 0.745 Within Groups 165.203 342 0.483 Total 166.144 346 Satisfaction Between Groups 0.239 4 0.060 0.118 0.976 Within Groups 172.505 342 0.504 Total 172.744 346
Table 4.41 illustrated that working position and all decision making factors
Sig. is more than 0.05. Therefore, we accepted null hypothesis and concluded that
position is not a key factor affected decision making factors.

60
• Sub-Hypothesis 2.7: There is no significance difference between respondent’s
salary and decision making factors
Ho: There is no significance difference between respondent’s salary and
decision making factors
Table 4.42 Relationship between Salary and Decision Making Factors
Salary Sum of Squares df Mean Square F Sig. Quality of the wash Between Groups 0.855 4 0.214 0.945 0.438 Within Groups 77.341 342 0.226 Total 78.196 346 Service fees Between Groups 1.352 4 0.338 0.465 0.761 Within Groups 248.602 342 0.727 Total 249.954 346 Convenience Between Groups 2.148 4 0.537 1.112 0.351 Within Groups 165.172 342 0.483 Total 167.320 346 Speed of services Between Groups 1.325 4 0.331 0.591 0.669 Within Groups 191.597 342 0.560 Total 192.922 346 Scratch protection Between Groups 1.772 4 0.443 1.013 0.401 Within Groups 149.628 342 0.438 Total 151.401 346 Safety Between Groups 1.196 4 0.299 0.749 0.559 Within Groups 136.412 342 0.399 Total 137.608 346 Environmental safety Between Groups 5.823 4 1.456 1.838 0.121 Within Groups 270.943 342 0.792 Total 276.767 346 Services of employees Between Groups 0.941 4 0.235 0.487 0.745 Within Groups 165.203 342 0.483 Total 166.144 346 Satisfaction Between Groups 0.239 4 0.060 0.118 0.976 Within Groups 172.505 342 0.504 Total 172.744 346
Table 4.42 illustrated that salary and all decision making factors Sig. is more
than 0.05. Therefore, we accepted null hypothesis and concluded that salary is not a
key factor affected decision making factors.
The results from Sub-Hypothesis 2.1 to Sub-Hypothesis 2.7 illustrated that
gender, age, marital status, and educational background are key factors affected
decision making factors.

61
3) Hypothesis 3
There is no significance difference between marketing mix factors and factors
that influence decision making on using car wash service in Bangkok
• Sub-Hypothesis 3.1: There is no significance difference between car wash
service program that always used and decision making factors
Ho: There is no significance difference between car wash service program that
always used and decision making factors
Table 4.43 Relationship between Car Wash Service Program that always used and
Decision Making Factors
Program Sum of Squares df Mean Square F Sig.
Quality of the wash Between Groups 0.712 3 0.237 1.051 0.370 Within Groups 77.484 343 0.226 Total 78.196 346 Service fees Between Groups 7.881 3 2.627 3.722 0.012 Within Groups 242.072 343 0.706 Total 249.954 346 Convenience Between Groups 3.960 3 1.320 2.771 0.042 Within Groups 163.360 343 0.476 Total 167.320 346 Speed of services Between Groups 2.995 3 0.998 1.803 0.146 Within Groups 189.928 343 0.554 Total 192.922 346 Scratch protection Between Groups 1.871 3 0.624 1.431 0.234 Within Groups 149.530 343 0.436 Total 151.401 346 Safety Between Groups 1.199 3 0.400 1.005 0.391 Within Groups 136.409 343 0.398 Total 137.608 346 Environmental safety Between Groups 0.784 3 0.261 0.325 0.807 Within Groups 275.982 343 0.805 Total 276.767 346 Services of employees Between Groups 1.495 3 0.498 1.038 0.376 Within Groups 164.649 343 0.480 Total 166.144 346 Satisfaction Between Groups 0.206 3 0.069 0.136 0.938 Within Groups 172.538 343 0.503 Total 172.744 346
Table 4.43 illustrated that program that always used and most of decision
making factors Sig. is more than 0.05 except service fees and convenience factor Sig.
which are less than 0.05. Therefore, we rejected null hypothesis and concluded that
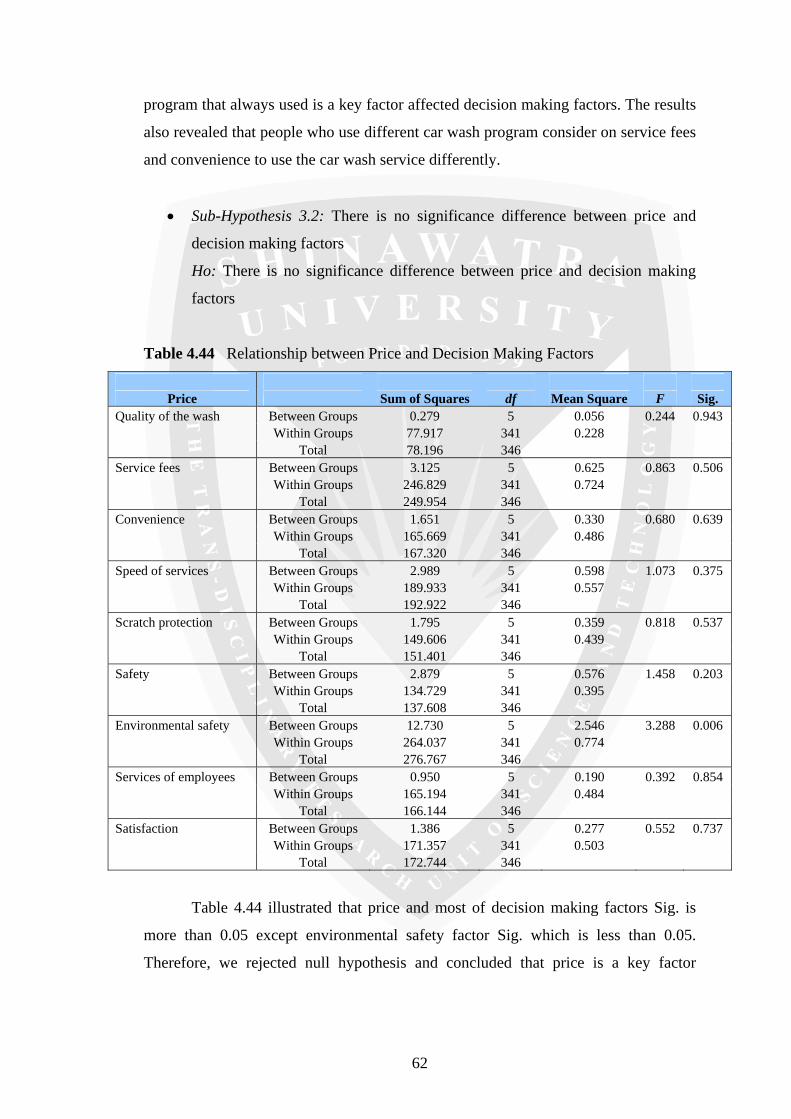
62
program that always used is a key factor affected decision making factors. The results
also revealed that people who use different car wash program consider on service fees
and convenience to use the car wash service differently.
• Sub-Hypothesis 3.2: There is no significance difference between price and
decision making factors
Ho: There is no significance difference between price and decision making
factors
Table 4.44 Relationship between Price and Decision Making Factors
Price Sum of Squares df Mean Square F Sig.
Quality of the wash Between Groups 0.279 5 0.056 0.244 0.943 Within Groups 77.917 341 0.228 Total 78.196 346 Service fees Between Groups 3.125 5 0.625 0.863 0.506 Within Groups 246.829 341 0.724 Total 249.954 346 Convenience Between Groups 1.651 5 0.330 0.680 0.639 Within Groups 165.669 341 0.486 Total 167.320 346 Speed of services Between Groups 2.989 5 0.598 1.073 0.375 Within Groups 189.933 341 0.557 Total 192.922 346 Scratch protection Between Groups 1.795 5 0.359 0.818 0.537 Within Groups 149.606 341 0.439 Total 151.401 346 Safety Between Groups 2.879 5 0.576 1.458 0.203 Within Groups 134.729 341 0.395 Total 137.608 346 Environmental safety Between Groups 12.730 5 2.546 3.288 0.006 Within Groups 264.037 341 0.774 Total 276.767 346 Services of employees Between Groups 0.950 5 0.190 0.392 0.854 Within Groups 165.194 341 0.484 Total 166.144 346 Satisfaction Between Groups 1.386 5 0.277 0.552 0.737 Within Groups 171.357 341 0.503 Total 172.744 346
Table 4.44 illustrated that price and most of decision making factors Sig. is
more than 0.05 except environmental safety factor Sig. which is less than 0.05.
Therefore, we rejected null hypothesis and concluded that price is a key factor
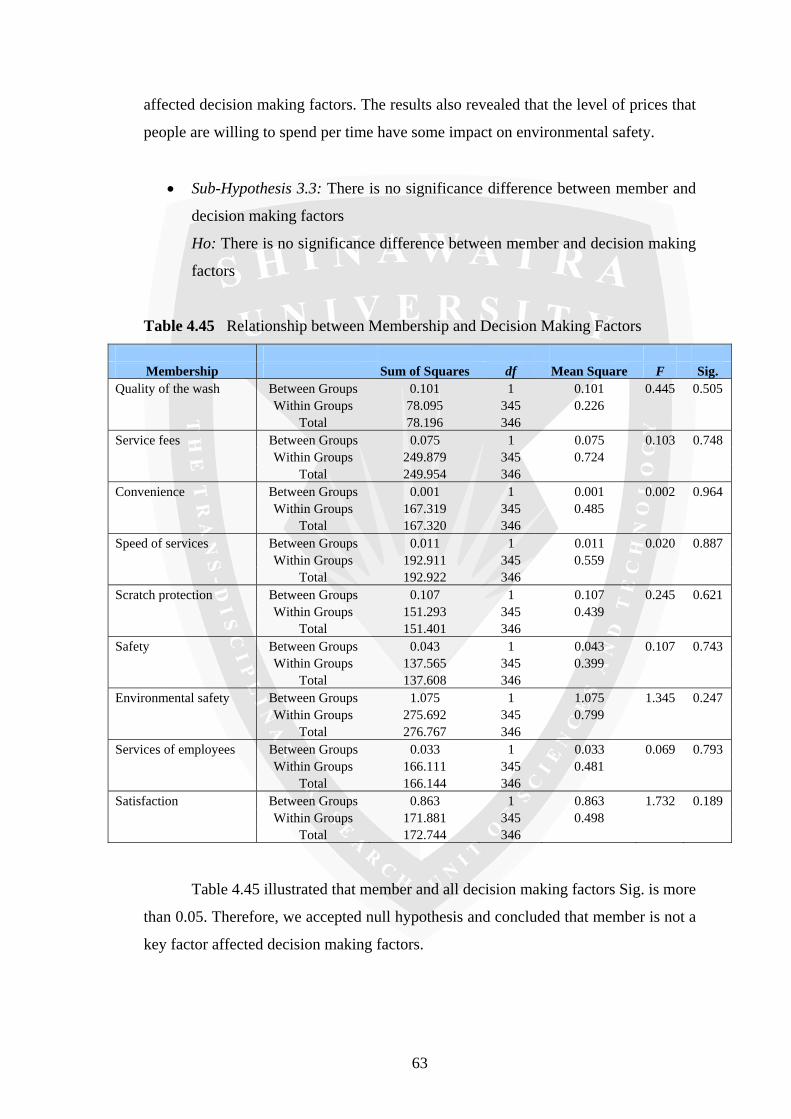
63
affected decision making factors. The results also revealed that the level of prices that
people are willing to spend per time have some impact on environmental safety.
• Sub-Hypothesis 3.3: There is no significance difference between member and
decision making factors
Ho: There is no significance difference between member and decision making
factors
Table 4.45 Relationship between Membership and Decision Making Factors
Membership Sum of Squares df Mean Square F Sig.
Quality of the wash Between Groups 0.101 1 0.101 0.445 0.505 Within Groups 78.095 345 0.226 Total 78.196 346 Service fees Between Groups 0.075 1 0.075 0.103 0.748 Within Groups 249.879 345 0.724 Total 249.954 346 Convenience Between Groups 0.001 1 0.001 0.002 0.964 Within Groups 167.319 345 0.485 Total 167.320 346 Speed of services Between Groups 0.011 1 0.011 0.020 0.887 Within Groups 192.911 345 0.559 Total 192.922 346 Scratch protection Between Groups 0.107 1 0.107 0.245 0.621 Within Groups 151.293 345 0.439 Total 151.401 346 Safety Between Groups 0.043 1 0.043 0.107 0.743 Within Groups 137.565 345 0.399 Total 137.608 346 Environmental safety Between Groups 1.075 1 1.075 1.345 0.247 Within Groups 275.692 345 0.799 Total 276.767 346 Services of employees Between Groups 0.033 1 0.033 0.069 0.793 Within Groups 166.111 345 0.481 Total 166.144 346 Satisfaction Between Groups 0.863 1 0.863 1.732 0.189 Within Groups 171.881 345 0.498 Total 172.744 346
Table 4.45 illustrated that member and all decision making factors Sig. is more
than 0.05. Therefore, we accepted null hypothesis and concluded that member is not a
key factor affected decision making factors.

64
• Sub-Hypothesis 3.4: There is no significance difference between guarantee
policy and decision making factors
Ho: There is no significance difference between guarantee policy and decision
making factors
Table 4.46 Relationship between Guarantee Policy and Decision Making Factors
Guarantee policy Sum of Squares df Mean Square F Sig. Quality of the wash Between Groups 0.089 1 0.089 0.391 0.532 Within Groups 78.107 345 0.226 Total 78.196 346 Service fees Between Groups 0.329 1 0.329 0.455 0.500 Within Groups 249.624 345 0.724 Total 249.954 346 Convenience Between Groups 1.981 1 1.981 4.134 0.043 Within Groups 165.339 345 0.479 Total 167.320 346 Speed of services Between Groups 0.389 1 0.389 0.696 0.405 Within Groups 192.534 345 0.558 Total 192.922 346 Scratch protection Between Groups 0.114 1 0.114 0.259 0.611 Within Groups 151.287 345 0.439 Total 151.401 346 Safety Between Groups 0.345 1 0.345 0.867 0.353 Within Groups 137.263 345 0.398 Total 137.608 346 Environmental safety Between Groups 1.724 1 1.724 2.163 0.142 Within Groups 275.042 345 0.797 Total 276.767 346 Services of employees Between Groups 0.822 1 0.822 1.716 0.191 Within Groups 165.322 345 0.479 Total 166.144 346 Satisfaction Between Groups 0.019 1 0.019 0.038 0.845 Within Groups 172.724 345 0.501 Total 172.744 346
Table 4.46 illustrated that guarantee and most of decision making factors Sig.
is more than 0.05 except convenience safety factor Sig. which is less than 0.05.
Therefore, we rejected null hypothesis and concluded that guarantee is a key factor
affected decision making factors. The results also revealed that quality guarantee
policy have some impact on convenience to use the service.
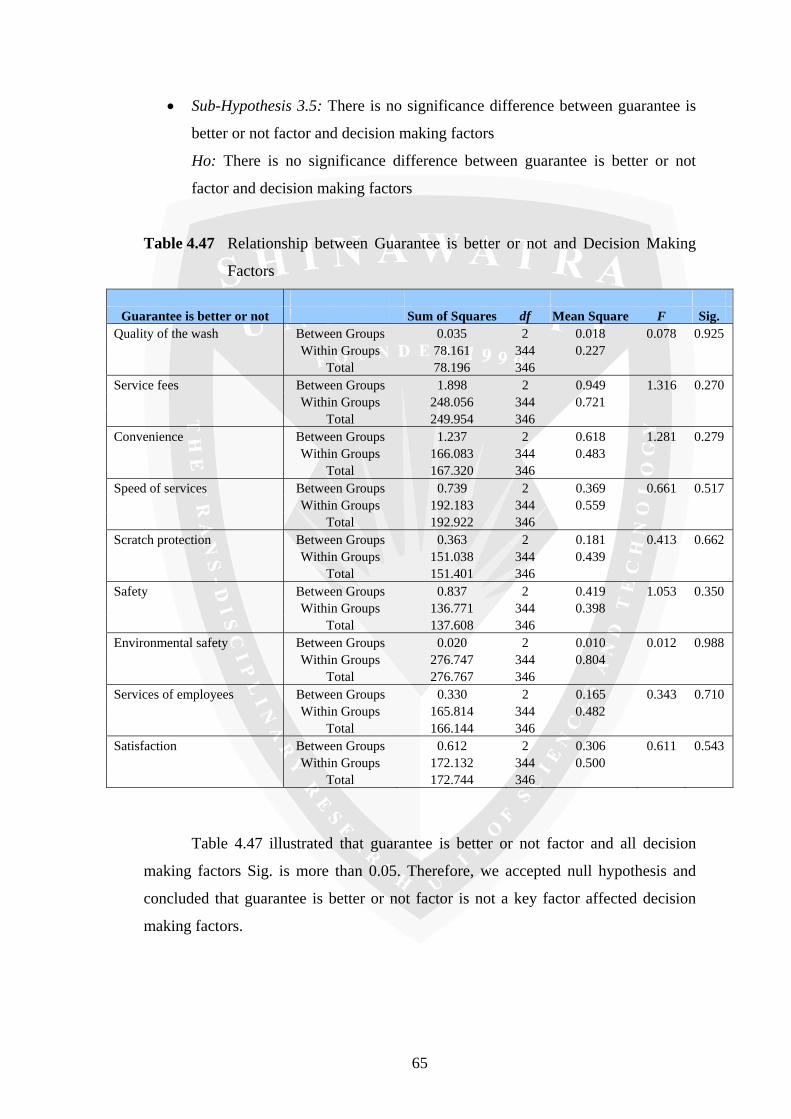
65
• Sub-Hypothesis 3.5: There is no significance difference between guarantee is
better or not factor and decision making factors
Ho: There is no significance difference between guarantee is better or not
factor and decision making factors
Table 4.47 Relationship between Guarantee is better or not and Decision Making
Factors
Guarantee is better or not Sum of Squares df Mean Square F Sig.
Quality of the wash Between Groups 0.035 2 0.018 0.078 0.925 Within Groups 78.161 344 0.227 Total 78.196 346 Service fees Between Groups 1.898 2 0.949 1.316 0.270 Within Groups 248.056 344 0.721 Total 249.954 346 Convenience Between Groups 1.237 2 0.618 1.281 0.279 Within Groups 166.083 344 0.483 Total 167.320 346 Speed of services Between Groups 0.739 2 0.369 0.661 0.517 Within Groups 192.183 344 0.559 Total 192.922 346 Scratch protection Between Groups 0.363 2 0.181 0.413 0.662 Within Groups 151.038 344 0.439 Total 151.401 346 Safety Between Groups 0.837 2 0.419 1.053 0.350 Within Groups 136.771 344 0.398 Total 137.608 346 Environmental safety Between Groups 0.020 2 0.010 0.012 0.988 Within Groups 276.747 344 0.804 Total 276.767 346 Services of employees Between Groups 0.330 2 0.165 0.343 0.710 Within Groups 165.814 344 0.482 Total 166.144 346 Satisfaction Between Groups 0.612 2 0.306 0.611 0.543 Within Groups 172.132 344 0.500 Total 172.744 346
Table 4.47 illustrated that guarantee is better or not factor and all decision
making factors Sig. is more than 0.05. Therefore, we accepted null hypothesis and
concluded that guarantee is better or not factor is not a key factor affected decision
making factors.

66
• Sub-Hypothesis 3.6.: There is no significance difference between yearly
member factor and decision making factors
Ho: There is no significance difference between yearly member factor and
decision making factors
Table 4.48 Relationship between Yearly Member and Decision Making Factors
Yearly member Sum of Squares df Mean Square F Sig.
Quality of the wash Between Groups 0.975 6 0.162 0.715 0.638 Within Groups 77.221 340 0.227 Total 78.196 346 Service fees Between Groups 4.642 6 0.774 1.072 0.379 Within Groups 245.312 340 0.722 Total 249.954 346 Convenience Between Groups 2.048 6 0.341 0.702 0.648 Within Groups 165.271 340 0.486 Total 167.320 346 Speed of services Between Groups 4.229 6 0.705 1.270 0.271 Within Groups 188.694 340 0.555 Total 192.922 346 Scratch protection Between Groups 1.919 6 0.320 0.727 0.628 Within Groups 149.482 340 0.440 Total 151.401 346 Safety Between Groups 1.767 6 0.294 0.737 0.620 Within Groups 135.841 340 0.400 Total 137.608 346 Environmental safety Between Groups 4.592 6 0.765 0.956 0.455 Within Groups 272.175 340 0.801 Total 276.767 346 Services of employees Between Groups 6.965 6 1.161 2.479 0.023 Within Groups 159.179 340 0.468 Total 166.144 346 Satisfaction Between Groups 1.712 6 0.285 0.567 0.756 Within Groups 171.032 340 0.503 Total 172.744 346
Table 4.48 illustrated that yearly member and most of decision making factors
Sig. is more than 0.05 except services of employees factor Sig. which is less than
0.05. Therefore, we rejected null hypothesis and concluded that yearly member is a
key factor affected decision making factors. The results also revealed that levels of
yearly member service fees have some impact on services of employees.
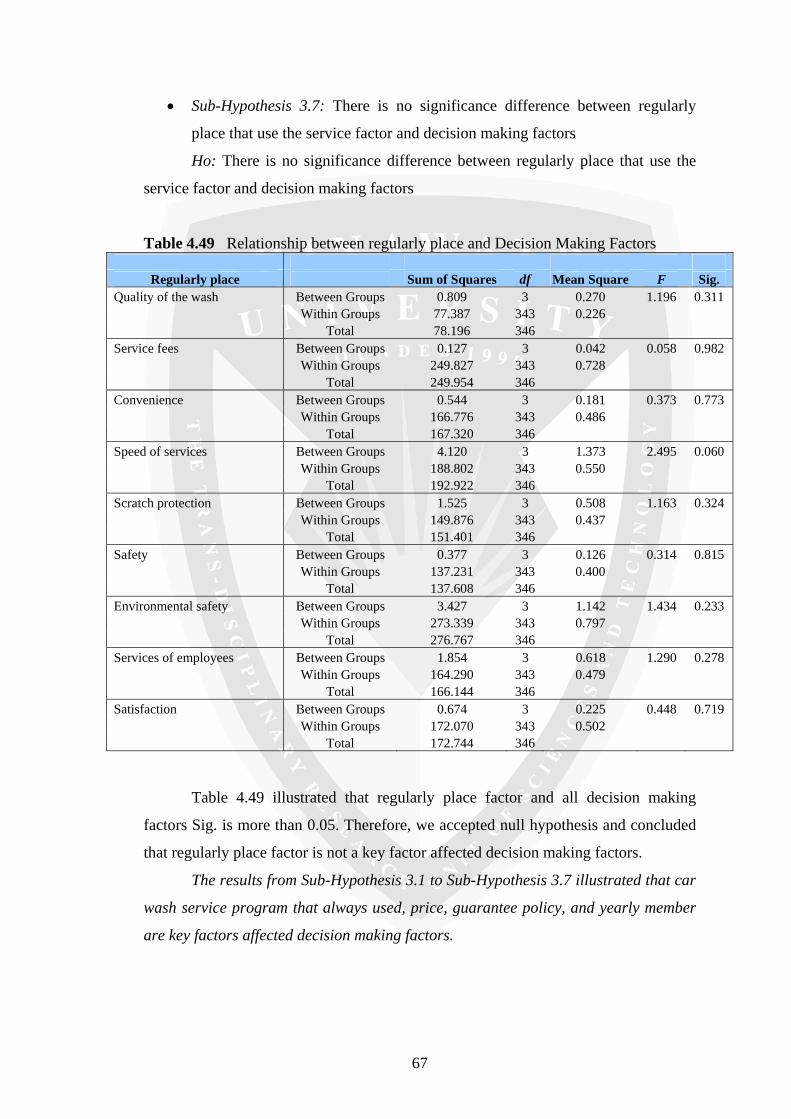
67
• Sub-Hypothesis 3.7: There is no significance difference between regularly
place that use the service factor and decision making factors
Ho: There is no significance difference between regularly place that use the
service factor and decision making factors
Table 4.49 Relationship between regularly place and Decision Making Factors
Regularly place Sum of Squares df Mean Square F Sig. Quality of the wash Between Groups 0.809 3 0.270 1.196 0.311 Within Groups 77.387 343 0.226 Total 78.196 346 Service fees Between Groups 0.127 3 0.042 0.058 0.982 Within Groups 249.827 343 0.728 Total 249.954 346 Convenience Between Groups 0.544 3 0.181 0.373 0.773 Within Groups 166.776 343 0.486 Total 167.320 346 Speed of services Between Groups 4.120 3 1.373 2.495 0.060 Within Groups 188.802 343 0.550 Total 192.922 346 Scratch protection Between Groups 1.525 3 0.508 1.163 0.324 Within Groups 149.876 343 0.437 Total 151.401 346 Safety Between Groups 0.377 3 0.126 0.314 0.815 Within Groups 137.231 343 0.400 Total 137.608 346 Environmental safety Between Groups 3.427 3 1.142 1.434 0.233 Within Groups 273.339 343 0.797 Total 276.767 346 Services of employees Between Groups 1.854 3 0.618 1.290 0.278 Within Groups 164.290 343 0.479 Total 166.144 346 Satisfaction Between Groups 0.674 3 0.225 0.448 0.719 Within Groups 172.070 343 0.502 Total 172.744 346
Table 4.49 illustrated that regularly place factor and all decision making
factors Sig. is more than 0.05. Therefore, we accepted null hypothesis and concluded
that regularly place factor is not a key factor affected decision making factors.
The results from Sub-Hypothesis 3.1 to Sub-Hypothesis 3.7 illustrated that car
wash service program that always used, price, guarantee policy, and yearly member
are key factors affected decision making factors.

68
4.5 Financial Analysis
4.5.1 Revenues forecast.
Assuming that car owners use our services 1,860 minutes per day and the
average service fee is 165 baht/car. The revenues per day are 13,252.50 baht which
equal to 397,575 baht in monthly income. Therefore, yearly revenue would be
4,770,900 baht. The forecasts show in the table below comprises of pessimistic
growth estimation, normal growth estimation, and optimistic growth estimation.
Table 4.50 Revenues Forecast from 2008 to 2012 Revenues Forecast (Baht)
Year 2008F 2009F 2010F 2011F 2012F Revenues (Pessimistic) 4,770,900 4,627,773 4,488,940 4,354,272 4,223,643 Revenues 4,770,900 5,009,445 5,259,917 5,522,913 5,799,059 Revenues (Optimistic) 4,770,900 5,104,863 5,462,203 5,844,558 6,253,677
Pessimistic growth = growth rate of –3 percent per year
Normal growth = growth rate of 5 percent per year
Optimistic growth = growth rate of 7 percent per year
4.5.2 Unit cost.
1) Washing (Around 20 minutes)
The cost of washing per car can be estimated roughly as the following figure
shows.
• Labor Cost (2 persons for washing 1 car)
1 person = 6,000 baht/month
2 persons = 12,000 baht/month
= 400 baht/day
= 50 baht/hr. (works 8 hour/day)
= 0.83 baht/min.
Washing 1 car (20 mins.) = 16.6 baht/20 min.
• Shampoo Foam Cost (Bodywork Shampoo Conditioner from Autoglym Brand)
Shampoo foam 30 litre = 1,500 baht
Shampoo foam = 1.25 baht/car (1 Litre for 40 cars)

69
Table 4.51 Total Washing Unit Cost
Washing Component Cost (Baht) Labor cost (20 mins.) 16.6
Shampoo Foam 1.25 Water (30 Litre) 0.6
Electric (1200W for 20 mins.) 3.75 Total 22.2
Source: Auto Care Clinic Co., Ltd.
2) Waxing (Around 1 hour)
The cost of waxing per car can be estimated roughly as the following figure
shows.
• Labor Cost (2 persons for waxing 1 car)
Waxing 1 car (1 hour) = 49.8 baht/60 min.
• Solution Cost (Extra Gloss Protection from Autoglym Brand)
Solution 100 ML per car = 118 baht (1.18 baht/ML)
Table 4.52 Total Waxing Unit Cost
Waxing Component Cost (Baht) Labor cost (1 hr.) 49.8
Solution 118 Water (15 Litre) 0.3
Electric (1200W for 1 hr.) 11.25 Total 179.35
Source: Auto Care Clinic Co., Ltd.
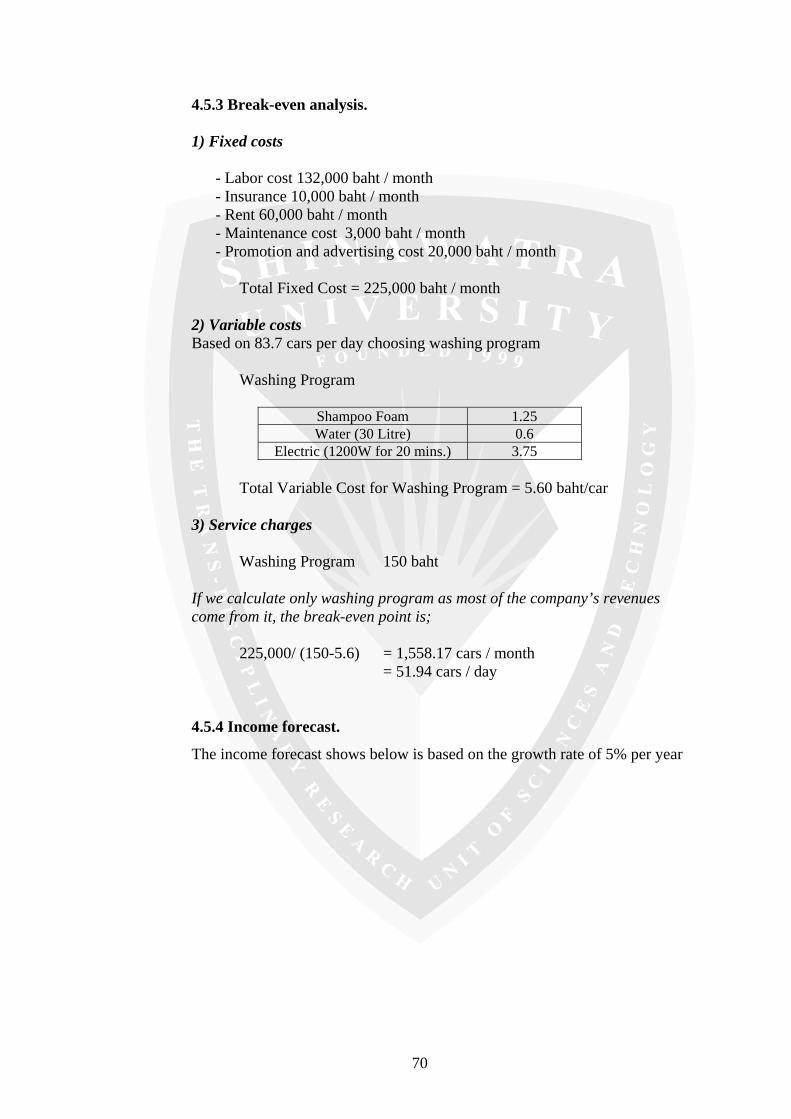
70
4.5.3 Break-even analysis.
1) Fixed costs
- Labor cost 132,000 baht / month - Insurance 10,000 baht / month - Rent 60,000 baht / month - Maintenance cost 3,000 baht / month - Promotion and advertising cost 20,000 baht / month
Total Fixed Cost = 225,000 baht / month
2) Variable costs Based on 83.7 cars per day choosing washing program
Washing Program
Shampoo Foam 1.25 Water (30 Litre) 0.6
Electric (1200W for 20 mins.) 3.75
Total Variable Cost for Washing Program = 5.60 baht/car
3) Service charges
Washing Program 150 baht
If we calculate only washing program as most of the company’s revenues come from it, the break-even point is;
225,000/ (150-5.6) = 1,558.17 cars / month
= 51.94 cars / day
4.5.4 Income forecast.
The income forecast shows below is based on the growth rate of 5% per year
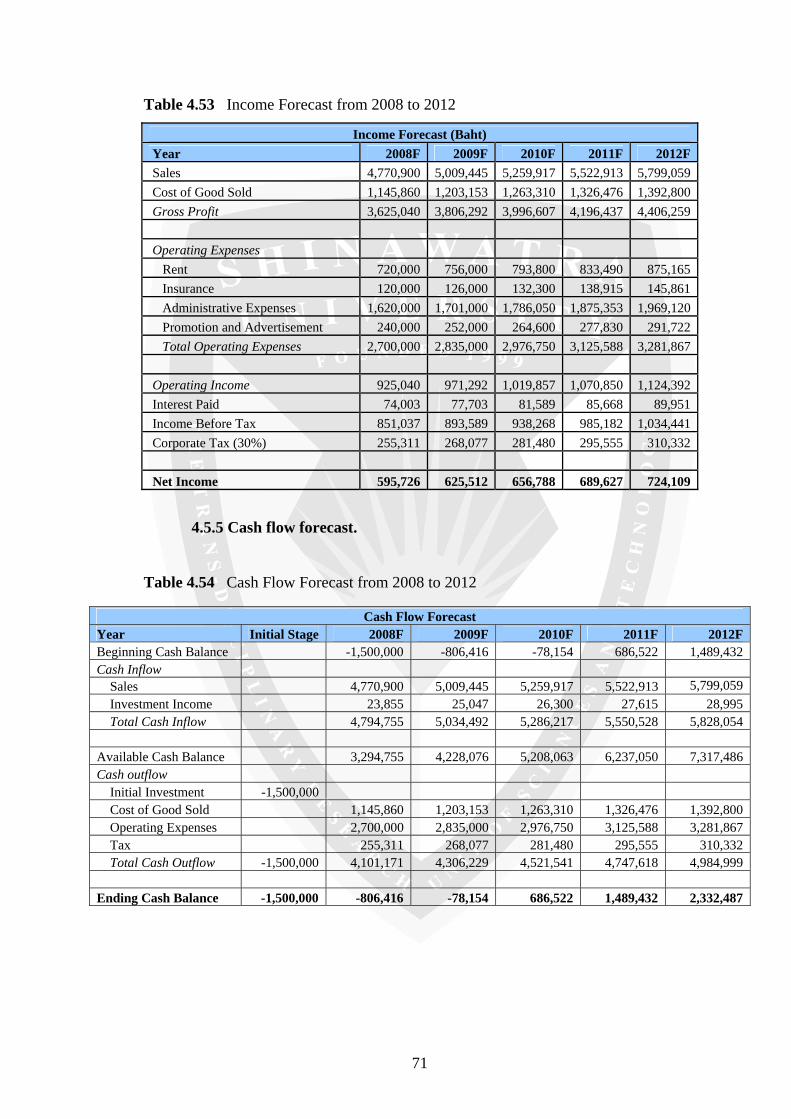
71
Table 4.53 Income Forecast from 2008 to 2012
Income Forecast (Baht) Year 2008F 2009F 2010F 2011F 2012F Sales 4,770,900 5,009,445 5,259,917 5,522,913 5,799,059 Cost of Good Sold 1,145,860 1,203,153 1,263,310 1,326,476 1,392,800 Gross Profit 3,625,040 3,806,292 3,996,607 4,196,437 4,406,259 Operating Expenses Rent 720,000 756,000 793,800 833,490 875,165 Insurance 120,000 126,000 132,300 138,915 145,861 Administrative Expenses 1,620,000 1,701,000 1,786,050 1,875,353 1,969,120 Promotion and Advertisement 240,000 252,000 264,600 277,830 291,722 Total Operating Expenses 2,700,000 2,835,000 2,976,750 3,125,588 3,281,867 Operating Income 925,040 971,292 1,019,857 1,070,850 1,124,392 Interest Paid 74,003 77,703 81,589 85,668 89,951 Income Before Tax 851,037 893,589 938,268 985,182 1,034,441 Corporate Tax (30%) 255,311 268,077 281,480 295,555 310,332 Net Income 595,726 625,512 656,788 689,627 724,109
4.5.5 Cash flow forecast.
Table 4.54 Cash Flow Forecast from 2008 to 2012
Cash Flow Forecast Year Initial Stage 2008F 2009F 2010F 2011F 2012F Beginning Cash Balance -1,500,000 -806,416 -78,154 686,522 1,489,432 Cash Inflow Sales 4,770,900 5,009,445 5,259,917 5,522,913 5,799,059 Investment Income 23,855 25,047 26,300 27,615 28,995 Total Cash Inflow 4,794,755 5,034,492 5,286,217 5,550,528 5,828,054 Available Cash Balance 3,294,755 4,228,076 5,208,063 6,237,050 7,317,486 Cash outflow Initial Investment -1,500,000 Cost of Good Sold 1,145,860 1,203,153 1,263,310 1,326,476 1,392,800 Operating Expenses 2,700,000 2,835,000 2,976,750 3,125,588 3,281,867 Tax 255,311 268,077 281,480 295,555 310,332 Total Cash Outflow -1,500,000 4,101,171 4,306,229 4,521,541 4,747,618 4,984,999 Ending Cash Balance -1,500,000 -806,416 -78,154 686,522 1,489,432 2,332,487
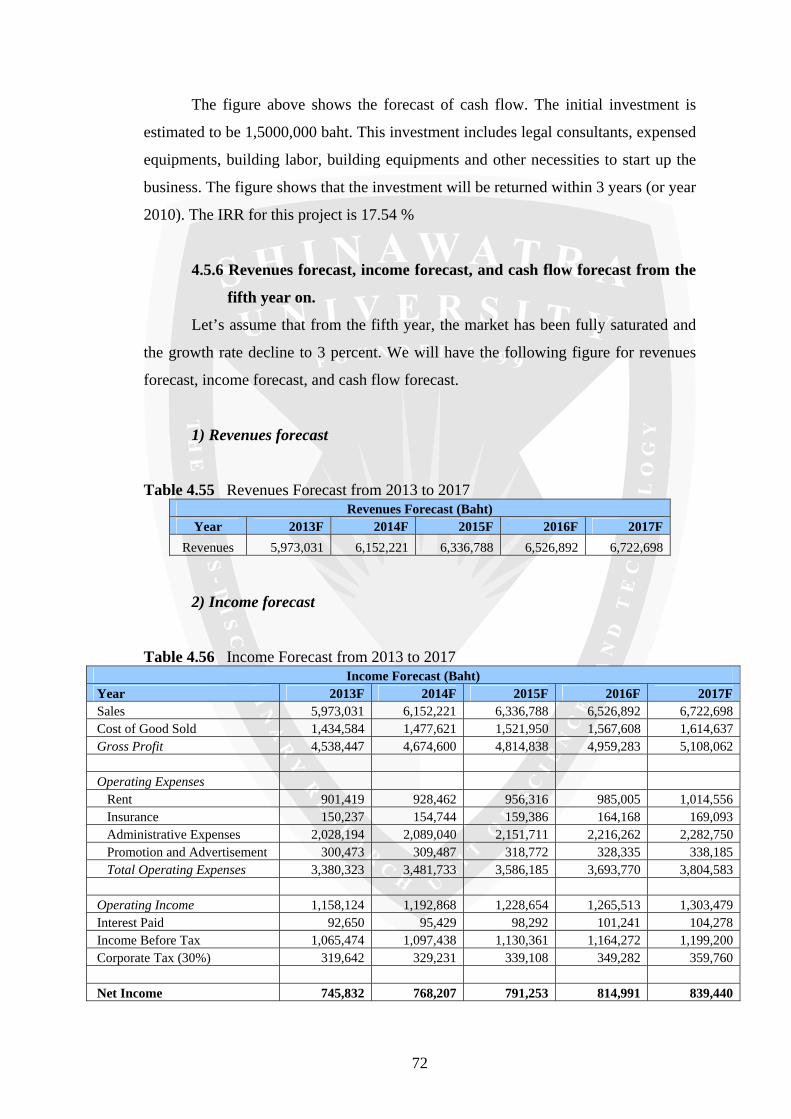
72
The figure above shows the forecast of cash flow. The initial investment is
estimated to be 1,5000,000 baht. This investment includes legal consultants, expensed
equipments, building labor, building equipments and other necessities to start up the
business. The figure shows that the investment will be returned within 3 years (or year
2010). The IRR for this project is 17.54 %
4.5.6 Revenues forecast, income forecast, and cash flow forecast from the
fifth year on.
Let’s assume that from the fifth year, the market has been fully saturated and
the growth rate decline to 3 percent. We will have the following figure for revenues
forecast, income forecast, and cash flow forecast.
1) Revenues forecast
Table 4.55 Revenues Forecast from 2013 to 2017 Revenues Forecast (Baht)
Year 2013F 2014F 2015F 2016F 2017F Revenues 5,973,031 6,152,221 6,336,788 6,526,892 6,722,698
2) Income forecast
Table 4.56 Income Forecast from 2013 to 2017 Income Forecast (Baht)
Year 2013F 2014F 2015F 2016F 2017F Sales 5,973,031 6,152,221 6,336,788 6,526,892 6,722,698 Cost of Good Sold 1,434,584 1,477,621 1,521,950 1,567,608 1,614,637 Gross Profit 4,538,447 4,674,600 4,814,838 4,959,283 5,108,062 Operating Expenses Rent 901,419 928,462 956,316 985,005 1,014,556 Insurance 150,237 154,744 159,386 164,168 169,093 Administrative Expenses 2,028,194 2,089,040 2,151,711 2,216,262 2,282,750 Promotion and Advertisement 300,473 309,487 318,772 328,335 338,185 Total Operating Expenses 3,380,323 3,481,733 3,586,185 3,693,770 3,804,583 Operating Income 1,158,124 1,192,868 1,228,654 1,265,513 1,303,479 Interest Paid 92,650 95,429 98,292 101,241 104,278 Income Before Tax 1,065,474 1,097,438 1,130,361 1,164,272 1,199,200 Corporate Tax (30%) 319,642 329,231 339,108 349,282 359,760 Net Income 745,832 768,207 791,253 814,991 839,440
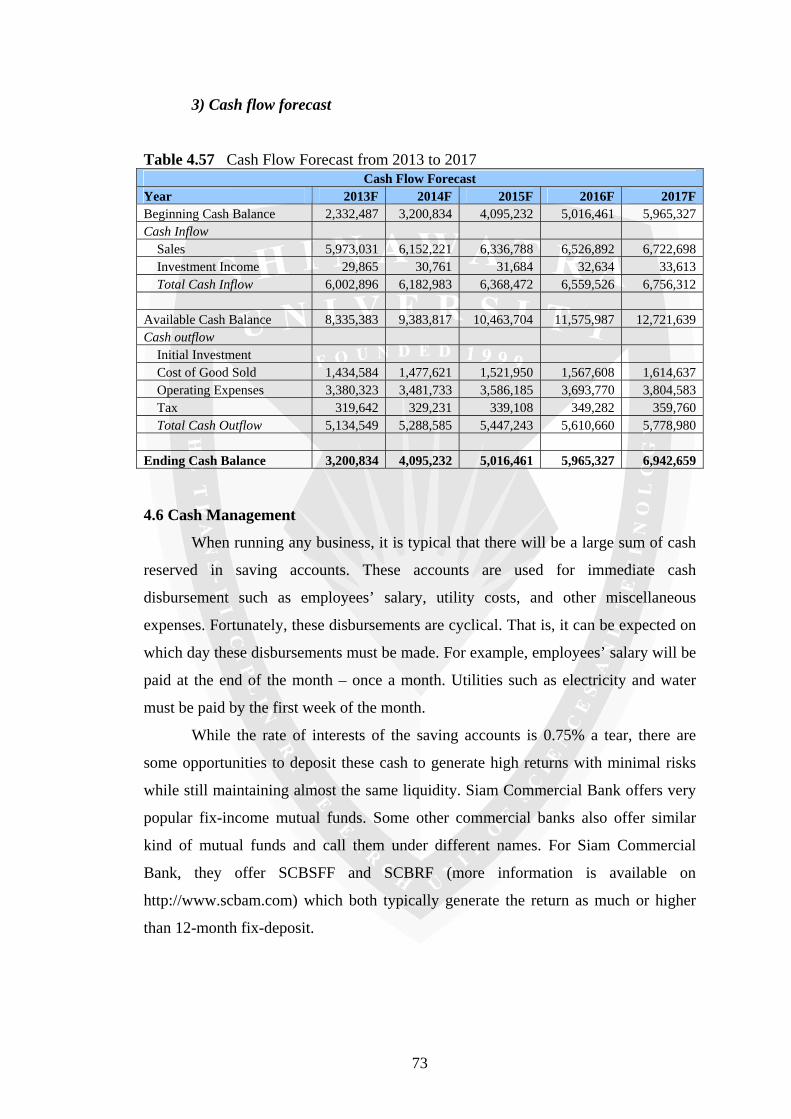
73
3) Cash flow forecast
Table 4.57 Cash Flow Forecast from 2013 to 2017 Cash Flow Forecast
Year 2013F 2014F 2015F 2016F 2017F Beginning Cash Balance 2,332,487 3,200,834 4,095,232 5,016,461 5,965,327 Cash Inflow Sales 5,973,031 6,152,221 6,336,788 6,526,892 6,722,698 Investment Income 29,865 30,761 31,684 32,634 33,613 Total Cash Inflow 6,002,896 6,182,983 6,368,472 6,559,526 6,756,312 Available Cash Balance 8,335,383 9,383,817 10,463,704 11,575,987 12,721,639 Cash outflow Initial Investment Cost of Good Sold 1,434,584 1,477,621 1,521,950 1,567,608 1,614,637 Operating Expenses 3,380,323 3,481,733 3,586,185 3,693,770 3,804,583 Tax 319,642 329,231 339,108 349,282 359,760 Total Cash Outflow 5,134,549 5,288,585 5,447,243 5,610,660 5,778,980 Ending Cash Balance 3,200,834 4,095,232 5,016,461 5,965,327 6,942,659 4.6 Cash Management
When running any business, it is typical that there will be a large sum of cash
reserved in saving accounts. These accounts are used for immediate cash
disbursement such as employees’ salary, utility costs, and other miscellaneous
expenses. Fortunately, these disbursements are cyclical. That is, it can be expected on
which day these disbursements must be made. For example, employees’ salary will be
paid at the end of the month – once a month. Utilities such as electricity and water
must be paid by the first week of the month.
While the rate of interests of the saving accounts is 0.75% a tear, there are
some opportunities to deposit these cash to generate high returns with minimal risks
while still maintaining almost the same liquidity. Siam Commercial Bank offers very
popular fix-income mutual funds. Some other commercial banks also offer similar
kind of mutual funds and call them under different names. For Siam Commercial
Bank, they offer SCBSFF and SCBRF (more information is available on
http://www.scbam.com) which both typically generate the return as much or higher
than 12-month fix-deposit.
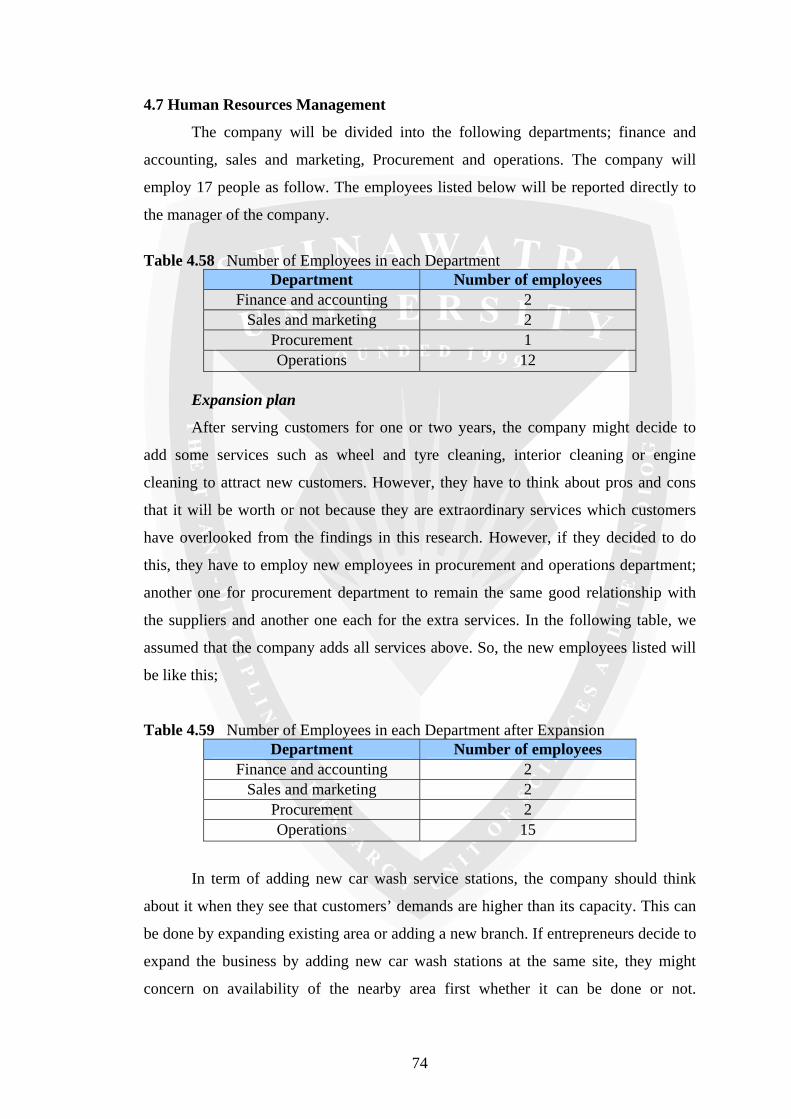
74
4.7 Human Resources Management
The company will be divided into the following departments; finance and
accounting, sales and marketing, Procurement and operations. The company will
employ 17 people as follow. The employees listed below will be reported directly to
the manager of the company.
Table 4.58 Number of Employees in each Department
Department Number of employees Finance and accounting 2
Sales and marketing 2 Procurement 1 Operations 12
Expansion plan
After serving customers for one or two years, the company might decide to
add some services such as wheel and tyre cleaning, interior cleaning or engine
cleaning to attract new customers. However, they have to think about pros and cons
that it will be worth or not because they are extraordinary services which customers
have overlooked from the findings in this research. However, if they decided to do
this, they have to employ new employees in procurement and operations department;
another one for procurement department to remain the same good relationship with
the suppliers and another one each for the extra services. In the following table, we
assumed that the company adds all services above. So, the new employees listed will
be like this;
Table 4.59 Number of Employees in each Department after Expansion Department Number of employees
Finance and accounting 2 Sales and marketing 2
Procurement 2 Operations 15
In term of adding new car wash service stations, the company should think
about it when they see that customers’ demands are higher than its capacity. This can
be done by expanding existing area or adding a new branch. If entrepreneurs decide to
expand the business by adding new car wash stations at the same site, they might
concern on availability of the nearby area first whether it can be done or not.
75
However, the researcher believe that adding some new branch at other areas will be
more appropriate to this kind of business because we will get more customers at that
areas and we can serve our existing customers very well also.
4.8 SWOT Analysis
SWOT is an abbreviation of Strengths, Weaknesses, Opportunities, and
threats. It is a great tool for auditing the overall strategic position of the current
business and its environments.
1) Strengths
• The company has the know-how. As more competitors are getting into the
market, it will be possible for the company to adjust the strategic
marketing to create differentiation very quickly.
• The company is very proficient in car wash services and brand of the
products that company used is highly respected in over forty countries and
proudly hold many important endorsements for exceptional performance
and dependable quality.
• Existing strong connections with suppliers will result in a lower cost of
supplies and cost of management. The suppliers may be credited for a
slight longer term and just-in-time policy may be utilized based on the
connection we have.
2) Weaknesses
• The start-up capital of this business is not very large. If some big
companies found out that the business unit worth the investment and
becomes our competitors directly, it would be difficult to compete with
them.
• The company is a new comer. Customers may not be confident with us.
76
3) Opportunities
• With the widely respected brand of the products company used, the
company can adjust and create more varieties based on the original
services to expand to different market segments which the company can
utilize them as a key differentiation.
• The business sector that company served is expanding continuously as the
number of personal car registered is increasing everyday.
4) Threats
• New entrants can compete with the company easily and they might take
market share away form us.
• The company’s revenues will be decreased a little bit when it comes to
rainy season as customers tend to wash their cars less often.
• Existing competitors such as CAR WE LOVE, which provides carwash
service in Central, Future, Robinson Department store, car wash service
operators in gas station such as Shell , PTT, Caltex and Jet might expand
their current business into other department stores and gas stations
respectively, making our revenues decreased.
• Premium car care products companies such as Autoglym and Meguiars
might establish their own franchising system for car wash service in
Thailand, making people who are reliable with their world class products
likely to be loyalty with them more than the company’s products. This
might affect the company’s market share to be decreased.
4.9 BCG Matrix
The BOSTON matrix is a chart that had been created by Bruce Henderson for
the Boston Consulting Group in 1970 to help corporations with analyzing their
business units or product lines. This helps the company allocate resources and is used
as an analytical tool in brand marketing, product management, strategic management
and portfolio-analysis.
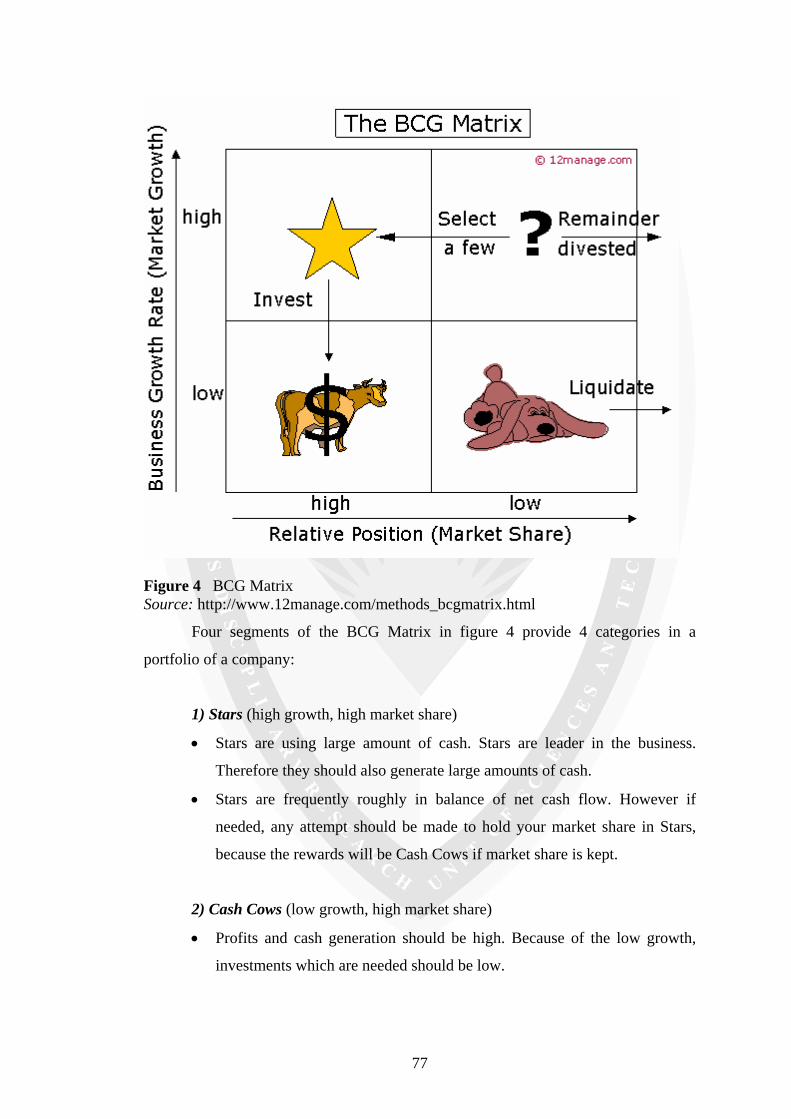
77
Figure 4 BCG Matrix Source: http://www.12manage.com/methods_bcgmatrix.html
Four segments of the BCG Matrix in figure 4 provide 4 categories in a
portfolio of a company:
1) Stars (high growth, high market share)
• Stars are using large amount of cash. Stars are leader in the business.
Therefore they should also generate large amounts of cash.
• Stars are frequently roughly in balance of net cash flow. However if
needed, any attempt should be made to hold your market share in Stars,
because the rewards will be Cash Cows if market share is kept.
2) Cash Cows (low growth, high market share)
• Profits and cash generation should be high. Because of the low growth,
investments which are needed should be low.

78
• Cash Cows are often the stars of yesterday and they are the foundation of a
company.
3) Question Marks (high growth, low market share)
• Question Marks have the worst cash characteristics of all. They have high
demands and generate low returns because of their low market share.
• If the market share remains unchanged, Question Marks will simply
absorb great amounts of cash.
• Either invest heavily, sell off, or invest nothing and generate any cash that
you can. Increase market share or deliver cash.
4) Dogs (low growth, low market share)
• Avoid and minimize the number of Dogs in a company.
• Wash out for expensive rescue plans.
• Dogs must deliver cash, otherwise they must be liquidated.
At present, car wash business in Bangkok can be viewed as Cash Cows in
BCG Matrix as the business is in a mature or slow industry. However, even though
the growth rate of business is low, its market share is still high as the number of
personal car registered is increasing everyday as well as the changing in consumer
behavior that shifted from washing their cars by themselves in the past to using car
wash services currently. Furthermore, modern people who live in Bangkok today tend
to have no time because of living in dynamic community. Therefore, it will be good
opportunities for entrepreneurs who are interested in this business because it can
generate high profits and cash compared to the money that is invested.

79
Chapter 5
Conclusions and Recommendations
As stated in Chapter one that the present study intends to survey the market
demand on using car wash service in Bangkok. The results are used to be base
information for forecasting of customers’ demand and consumption behavior in the
financial and marketing analysis as presented in this chapter. There are two parts in
this chapter including conclusion and recommendations for future study.
5.1 Conclusions
Structured survey questionnaires were distributed to the car owners who live
in Bangkok Metropolitan area for a face-to-face interview. The descriptive statistics
for data analysis are frequency, percentage, means and standard deviation and One-
way ANOVA is applied for hypothesis testing. The samples are 400 people who are
currently own a car and live in Bangkok.
The results of the study illustrated that the majority of respondents are nearly
equal between male and female, age between 26-30 years old, single and hold
bachelor degree level. Most of them work in private company and their positions are
officers generally, and earn incomes between 15,001 to 25,000 baht.
The findings about using car wash service behavior stated that up to 86.8
percent of respondents are regularly using car wash service and usually wash their
cars once a month. Their most convenient time for using car wash service is between
15.00 pm and 18.00 pm and they will use the service whenever they are free.
However, the most preferred day to use the service is weekends. Most of them will
use car wash service by selecting washing program only which they are willing to pay
100 to 200 baht per one time that they use the service. Only 13.2 percent of
respondents stated that they do not regularly use the car wash service because they
can wash their cars by themselves.
Up to 89.3 percent of the respondents who regularly use car wash service are
not member of any car wash service operators primarily because they do not use car
wash service regularly and they think that car wash service places charge them high
service fees. Furthermore, they want to try other places to find the most appropriate
car wash service places for them. 47 percent of people who regularly use car wash

80
service have been invited primarily by brochures or leaflets, billboards and internet.
Up to 96.8 percent of them agreed that car wash service operators should have quality
guarantee scheme in order to guarantee dissatisfied results. In addition, up to 94.8
percent of these groups of people agreed that car wash service operators with the
quality guarantee policy are better than operators who do not have this policy.
The membership fees levels that people who regularly use car wash service are
willing to pay per year with limited number of services is lesser than 2,000 baht. They
always give their top three priorities when they are choosing to be membership with
car wash service operators to the locations, reliability and cleanness. Up to 31.1
percent of these groups stated that they regularly use car wash service at gas station or
pump. Most of people who regularly use car wash service would like to receive good
advice from employees and they want to be taken care of very well also. Furthermore,
they want car wash service places to have a perfect opening-closing time range, good
atmosphere, and additional services also. Most of them would like to have a waiting
room when they use car wash services followed by seeing a car wash service place
together with a gas station and convenience store.
Quality of the wash, safety, scratch protection, and satisfaction with the works
are very important decision making factors that the sample groups concern on using
car wash service. Furthermore, service of employees, convenience to use the car wash
service, speed of service, service fees, and environmental safety are important factors
that respondents also consider when they use the service. Therefore, entrepreneurs
who are interested in this business should not overlook these factors when they set up
the car wash service sites.
5.2 Recommendations
1) Car wash service should charge the reasonable price, have good and
friendly employees and do not waste the customers’ time.
2) Car wash service should have a delivery service. It should have a pick-up
service at the customers’ place in order to attract customers who have no
time. Furthermore, it will be a perfect service for people who go to car
wash service sites and it turned out that the sites cannot serve their
demands because of full capacity.
3) Car wash service should be very careful about the copy of car key because
some customers chose not to use the service as they do not trust with
81
employees. They are afraid that employees would take their car key and
make a copy of it.
4) Car wash service should have guarantee policies not only the quality of the
wash matters but also the safety and properties inside the car.
5) Car wash service should have additional services such as the waiting room,
coffee club, bookstore, beauty shop for customers to use when they are
waiting for their cars cleaned.
6) Car wash service should be available after work for people who are
unavailable at the day time.
7) Workers who wash the car should have the uniform dresses in order to
have not only a good image for the company but also orderliness from the
point of view of customers.
Recommendation for further study, the future study should continue on quality
of the wash factor, safety factor, satisfaction with the works factor, service of
employees factor, and convenience to use the car wash service factor to cover all
important decision making factor and to help in planning the marketing strategies. In
case of entrepreneurs who have already own the car wash sites, the owners should
evaluate the consumer satisfaction every year in order to find the strengths and
weaknesses of the car wash service in order to improve quality and to receive greater
customer satisfaction.
82
References
Auto Care Clinic Co., Ltd. (2007). Unit Cost.
Average salary of Thai people. (n.d.). Retrieved January 8, 2007, from
http://www.nhanet.or.th
Barney, J. B. (1997). Gaining and sustaining competitive advantage.
Addison-Wesley Publishing Company, Reading Mass.
BCG Matrix. (n.d.). Retrieved February 15, 2007, from
http://www.12manage.com/methods_bcgmatrix.html
Bennett, S. (2004). Lathering up a profit. National Petroleum News, 96(9). Retrieved
February 10, 2007, from ABI/INFORM database.
Berkowitz, K. H. R. (1994). Marketing (4th ed.).
Blackwell, R., Miniard, P., Engel, J., & Harcourt. (2001). How consumers make
decisions for goods and services. Retrieved January 10, 2007, from
http://www.equerry.biz/Equerry/principles/cdp.htm
Car wash glossary. (n.d.). Retrieved January, 2007, from http://www.hillandfoss.com
Chee & Harris. (1993). Marketing a global perspective. Pitman Publishing.
Darian, J. C., & Cohen, J. (1995). Segmentating by consumer time shortage.
Journal of Consumer Marketing, 12(1), 32-44.
Engel, J. F., Blackwell, R. D., & Mininard, P. W. (2000). ConsumerBehavior
(9th ed.). Forth Worth: Dryden Press.
Gilbert, D. H. (2002). Marketing connecting with customer (2nd ed.). NJ: Prentice
Hall International.
Hanna, N., & Wozniak, R (2000). Consumer behavior: An applied approach. Upper
Saddle River, NJ: Prentice Hall.
Hawkins, dl I., Best, R. J., & Coney, K. A. (1998). Consumer behavior:
Building marketing strategy (7th ed.). Boston: McGraw Hill.
Hawkins, dl I., Best, R. J., & Coney, K. A. (2001). Consumer behavior:
Building marketing strategy (9th ed.). Boston: McGraw Hill.
International Carwash Association. (2004). Cost of doing car wash business.
Retrieved January, 2007, from http://www.carcarecentral.com
Jagdish, N. S., Mittal, & Newman. (1999). Consumer behavior and beyond.

83
Johnston, J. (1994). Waxing customer service and cars. Management review, 83(7).
Retrieved February 10, 2007, from ABI/INFORM database.
Kotler, P. (1997). Marketing management: Analysis, planning, implementation
and control (9th ed.). NJ: Prentice Hall International.
Kotler, P. (2000). Marketing management.
The United States of America: Prentice-Hall.
Kotler, P. (2003). Marketing management: An asian perspective (3rd ed.).
Singapore: Prentice Hall
Lofstock, J. (2007). Making the most at the car wash. Convenience Store Decisions,
18(3). Retrieved February 10, 2007, from ABI/INFORM database.
McCarthy, E. J. (1996). Basic marketing: A managerial approach (12th ed.).
Homewood, IL: Irwin.
McCarthy, E. J. (1999). Basic marketing: A global managerial approach.
Homewood, IL: Irwin.
McDaniel, C., & Gates, R. (1999). Contemporary marketing research (4th ed.).
Cincinnati, Ohio: South-Western College Publishing.
Number of personal car registered in Bangkok. (2007). Retrieved January 8, 2007,
from http:// www.dlt.go.th/statistics_web/statistics.html
Number of population in Thailand. (2006). Retrieved January 8, 2007, from
http://www.nso.go.th
Palmer, A. (2001). Principles of services marketing (3rd ed.).
Singapore: McGraw- Hill.
Pelsmacker et al. (2001). Marketing communications. Harlow: Financial Times
/Prentice Hall
Peter, J. P., & Olson, J. (2002). Consumer behavior and marketing strategy
(6th ed.). Boston: Irwin: McGraw-Hill.
Porter, E. M. (1998). On competition Harvard Business School Press.
Schiffman, L. G., & Kanuk, L. L. (2006). Consumer behavior (9th ed.). NJ: Pearson
Prentice Hall.
Shimp A. T. (1997). Advertising, promotion, and supplemental aspects of
intergrated marketing communications (4th ed.). Fort Worth: DryPress.
Vandermerwe, S., & Rada, J. (1988). Servicitization of business: Adding value by
adding services. European Management Journal, 6(4).

84
Warren, M. (2005). Car washing goes high-tech. National Petroleum News, 97(4).
Retrieved February 10, 2007, from ABI/INFORM database.
Yamane, T. (1967). Statistics, an introductory analysis (2nd ed.).
New York: Harper and Row.
Zikmund, W. G. (1996). Marketing (5th ed.). St. Paul, MN: West.
Zikmund, W. G. (2000). Business research methods (6th ed.). USA: Harcourt.
Zikmund, W. G. (2003). Essentials of marketing research. USA: Thompson South-
Western.

85
Appendix A
Questionnaire (English)
Shinawatra University Questionnaires
A FEASIBILITY STUDY OF LAUNCHING CAR WASH BUSINESS IN BANGKOK
This survey questionnaire is a part of MBA program Shinawatra University Your information will be very useful in the study. Thank you for your fulfill in these
questionnaires
Mr. Warun Jirachahisingh
MBA (Master of Business Administration)
Shinawatra University
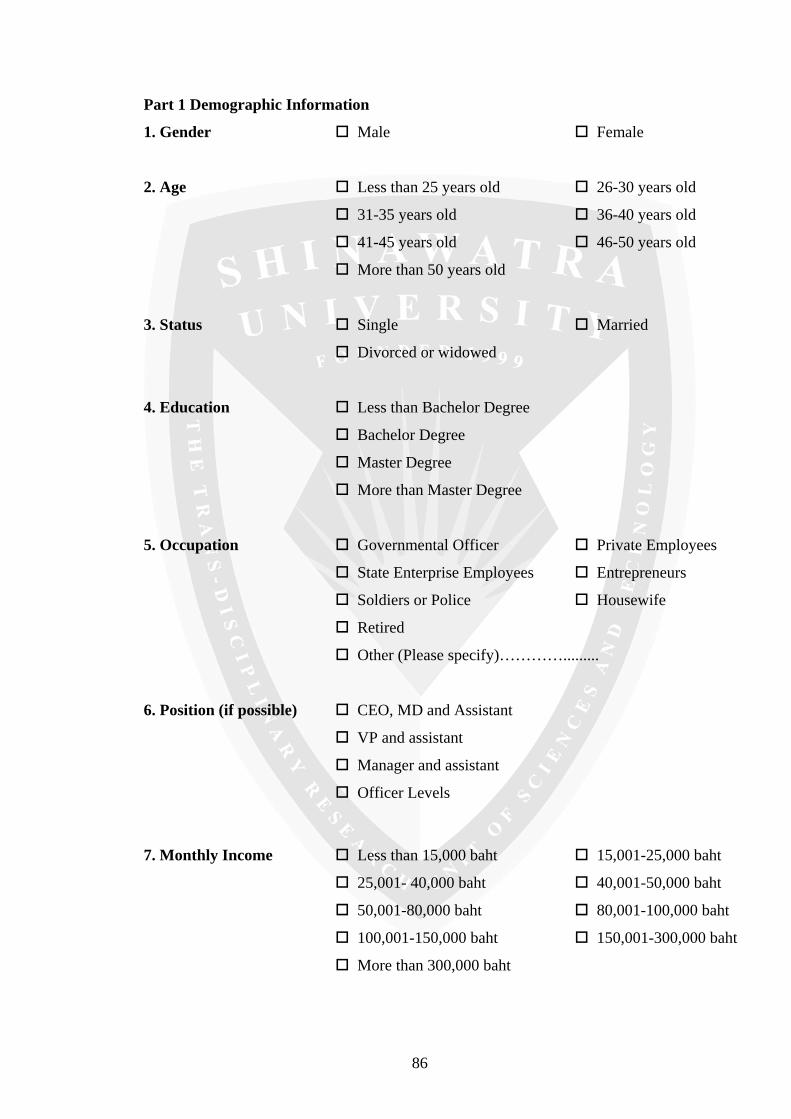
86
Part 1 Demographic Information
1. Gender Male Female
2. Age Less than 25 years old 26-30 years old
31-35 years old 36-40 years old
41-45 years old 46-50 years old
More than 50 years old
3. Status Single Married
Divorced or widowed
4. Education Less than Bachelor Degree
Bachelor Degree
Master Degree
More than Master Degree
5. Occupation Governmental Officer Private Employees
State Enterprise Employees Entrepreneurs
Soldiers or Police Housewife
Retired
Other (Please specify)………….........
6. Position (if possible) CEO, MD and Assistant
VP and assistant
Manager and assistant
Officer Levels
7. Monthly Income Less than 15,000 baht 15,001-25,000 baht
25,001- 40,000 baht 40,001-50,000 baht
50,001-80,000 baht 80,001-100,000 baht
100,001-150,000 baht 150,001-300,000 baht
More than 300,000 baht

87
Part 2
8. Are you regularly using car wash service?
Yes (Skip question 9) No (Answer question 9 and stop)
9. Reasons for not using car wash service (Can choose more than 1 choice)
Do not have time to use the service
Unnecessary to clean the car
High price and expensive
Cannot find the appropriate car wash service place
Afraid that car will have scratches
Can clean their cars by themselves
Other (Please specify)………….........
10. How often do you use the car wash service?
Everyday More than once a week
Once a week Within 2 weeks
Once a month 2-3 months per time
4-6 months per time Longer than 6 months
11. Which period of time do you use car wash service most often?
6 am – 9 am 9 am – 12 am
12 am – 3 pm 3 pm – 6 pm
6 pm – 10 pm
12. Which day do you use car wash service most often?
Monday and Tuesday Wednesday and Thursday
Friday Saturday
Sunday Whatever
13. Which program do you always choose when you use car wash service?
Wash Only (Wash and vacuum)
Wash and Wax
Wash and Interior detailing
Wash, Wax and Interior detailing
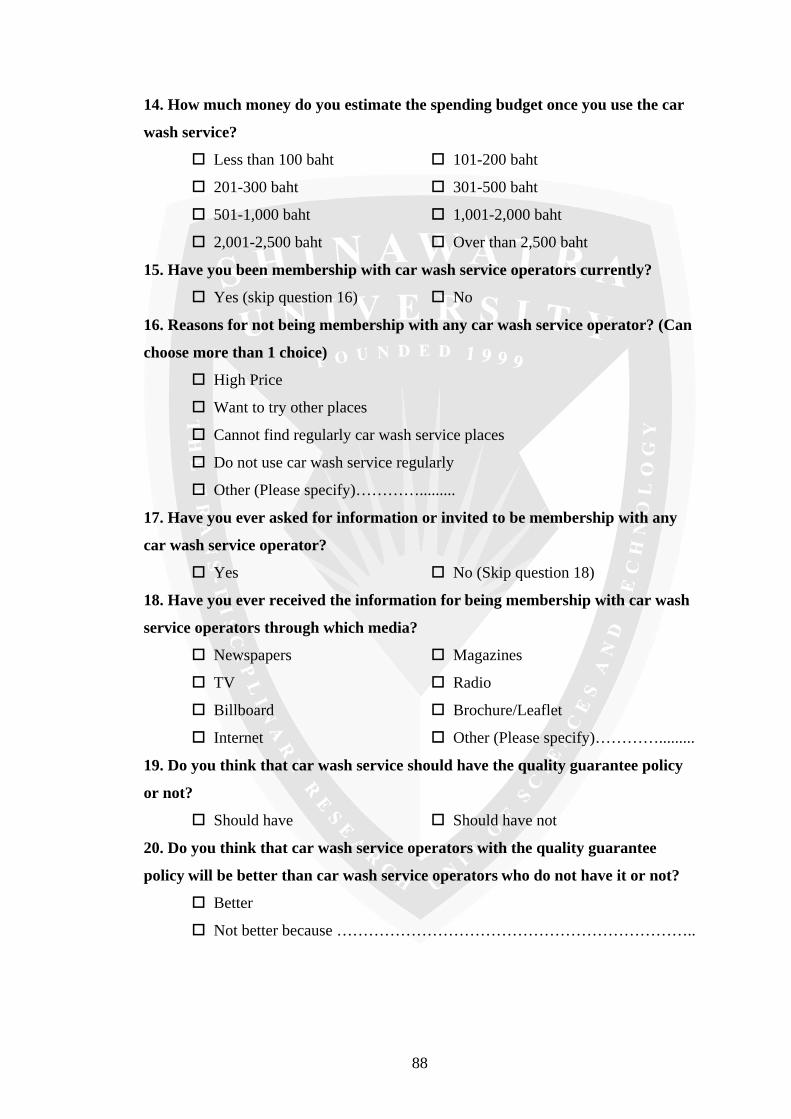
88
14. How much money do you estimate the spending budget once you use the car
wash service?
Less than 100 baht 101-200 baht
201-300 baht 301-500 baht
501-1,000 baht 1,001-2,000 baht
2,001-2,500 baht Over than 2,500 baht
15. Have you been membership with car wash service operators currently?
Yes (skip question 16) No
16. Reasons for not being membership with any car wash service operator? (Can
choose more than 1 choice)
High Price
Want to try other places
Cannot find regularly car wash service places
Do not use car wash service regularly
Other (Please specify)………….........
17. Have you ever asked for information or invited to be membership with any
car wash service operator?
Yes No (Skip question 18)
18. Have you ever received the information for being membership with car wash
service operators through which media?
Newspapers Magazines
TV Radio
Billboard Brochure/Leaflet
Internet Other (Please specify)………….........
19. Do you think that car wash service should have the quality guarantee policy
or not?
Should have Should have not
20. Do you think that car wash service operators with the quality guarantee
policy will be better than car wash service operators who do not have it or not?
Better
Not better because …………………………………………………………..
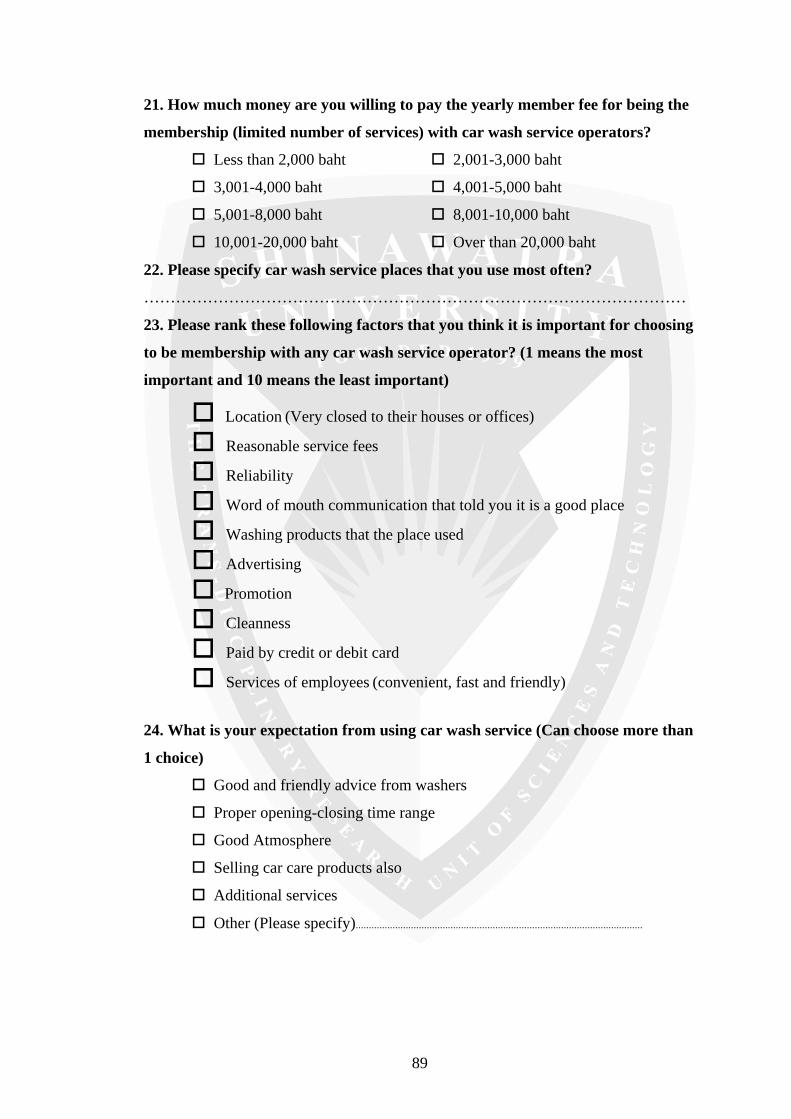
89
21. How much money are you willing to pay the yearly member fee for being the
membership (limited number of services) with car wash service operators?
Less than 2,000 baht 2,001-3,000 baht
3,001-4,000 baht 4,001-5,000 baht
5,001-8,000 baht 8,001-10,000 baht
10,001-20,000 baht Over than 20,000 baht
22. Please specify car wash service places that you use most often?
…………………………………………………………………………………………
23. Please rank these following factors that you think it is important for choosing
to be membership with any car wash service operator? (1 means the most
important and 10 means the least important)
Location (Very closed to their houses or offices)
Reasonable service fees
Reliability
Word of mouth communication that told you it is a good place
Washing products that the place used
Advertising
Promotion
Cleanness
Paid by credit or debit card
Services of employees (convenient, fast and friendly)
24. What is your expectation from using car wash service (Can choose more than
1 choice)
Good and friendly advice from washers
Proper opening-closing time range
Good Atmosphere
Selling car care products also
Additional services
Other (Please specify).............................................................................................................
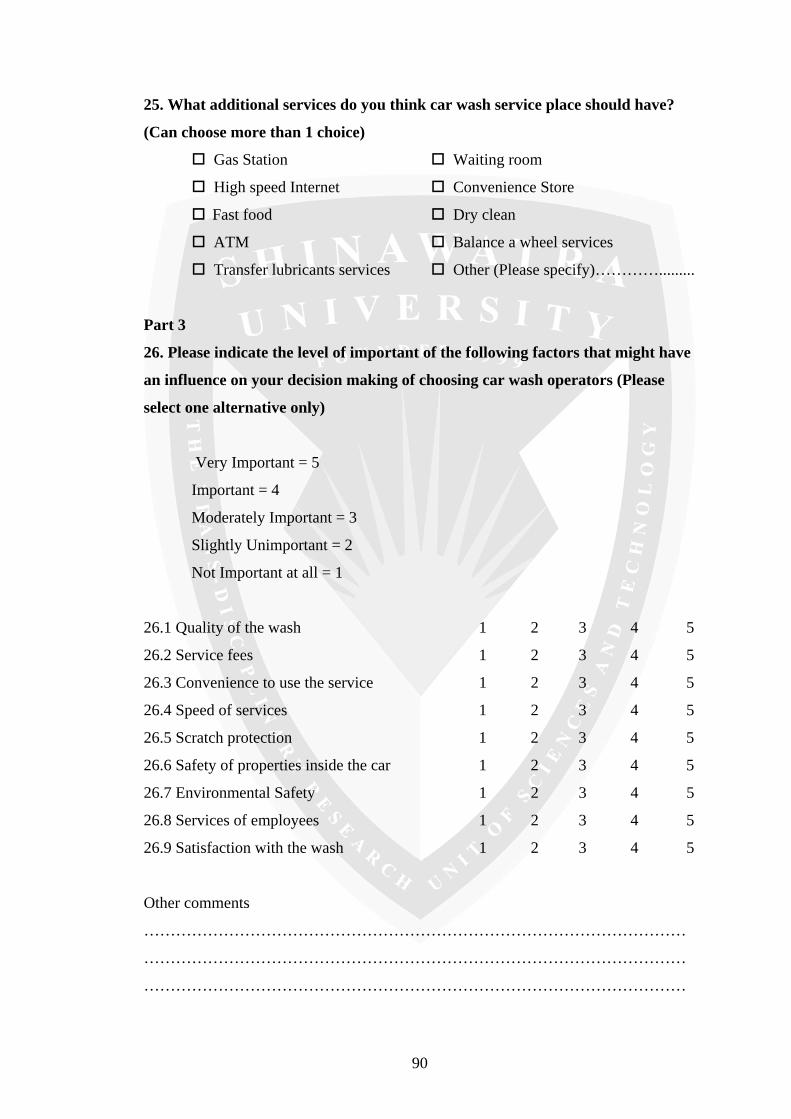
90
25. What additional services do you think car wash service place should have?
(Can choose more than 1 choice)
Gas Station Waiting room
High speed Internet Convenience Store
Fast food Dry clean
ATM Balance a wheel services
Transfer lubricants services Other (Please specify)………….........
Part 3
26. Please indicate the level of important of the following factors that might have
an influence on your decision making of choosing car wash operators (Please
select one alternative only)
Very Important = 5
Important = 4
Moderately Important = 3
Slightly Unimportant = 2
Not Important at all = 1
26.1 Quality of the wash 1 2 3 4 5
26.2 Service fees 1 2 3 4 5
26.3 Convenience to use the service 1 2 3 4 5
26.4 Speed of services 1 2 3 4 5
26.5 Scratch protection 1 2 3 4 5
26.6 Safety of properties inside the car 1 2 3 4 5
26.7 Environmental Safety 1 2 3 4 5
26.8 Services of employees 1 2 3 4 5
26.9 Satisfaction with the wash 1 2 3 4 5
Other comments
…………………………………………………………………………………………
…………………………………………………………………………………………
…………………………………………………………………………………………

91
Appendix B
Questionnaire (Thai)
มหาวิทยาลัยชินวัตร แบบสอบถาม
เร่ือง การศึกษาความตองการของตลาดสําหรับธุรกิจการใหบริการการทําความสะอาดรถยนต
แบบสอบถามนี้เปนสวนหนึ่งของหลักสูตรบริหารธุรกิจมหาบัณฑิต มหาวิทยาลัยชินวัตร ขอมูลของทานมีประโยชนและคุณคาอยางยิ่งในการศึกษาวิจัย จึงขอขอบพระคุณทุกทานเปน
อยางสูงที่ใหความรวมมือในการตอบแบบสอบถามนี้
นาย วรุณ จิรไชยสิงห นักศึกษาหลักสูตรบริหารธุรกิจมหาบัณฑิต (MBA) มหาวิทยาลัยชินวัตร
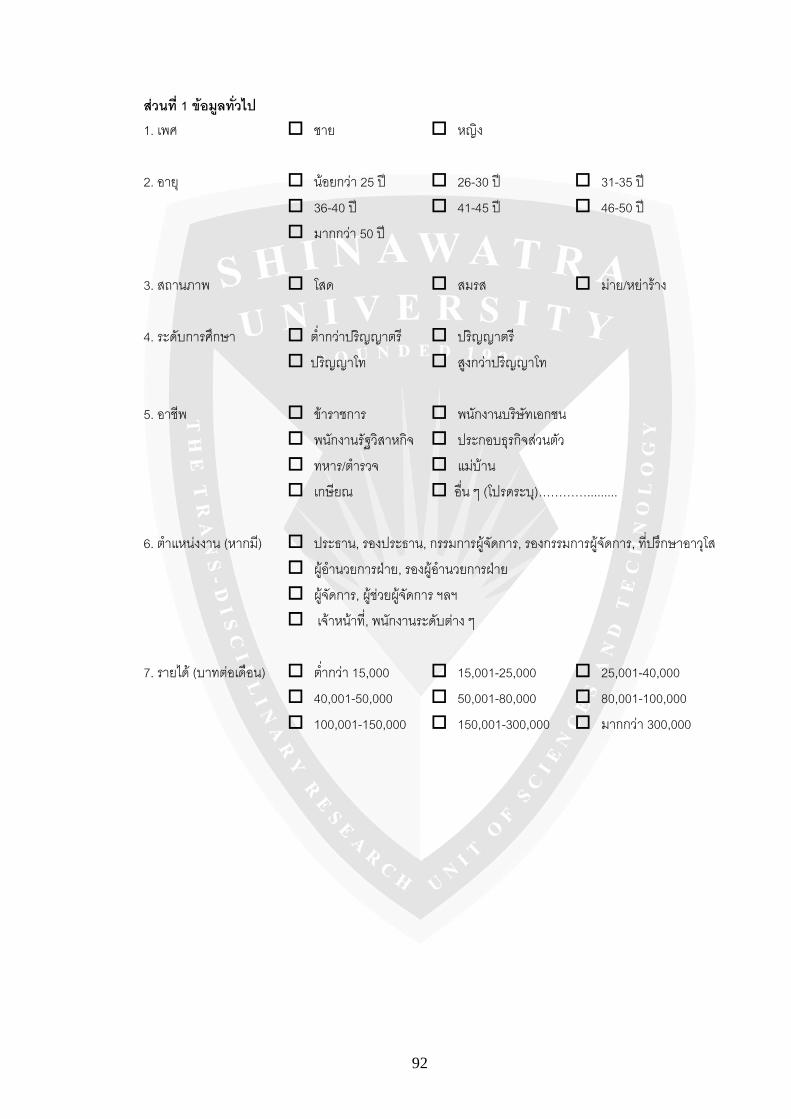
92
สวนที่ 1 ขอมูลทั่วไป 1. เพศ ชาย หญิง
2. อายุ นอยกวา 25 ป 26-30 ป 31-35 ป
36-40 ป 41-45 ป 46-50 ป
มากกวา 50 ป
3. สถานภาพ โสด สมรส มาย/หยาราง
4. ระดับการศึกษา ต่ํากวาปริญญาตรี ปริญญาตรี
ปริญญาโท สูงกวาปริญญาโท
5. อาชีพ ขาราชการ พนักงานบริษัทเอกชน
พนักงานรัฐวิสาหกิจ ประกอบธุรกิจสวนตัว
ทหาร/ตํารวจ แมบาน
เกษียณ อื่น ๆ (โปรดระบุ)………….........
6. ตําแหนงงาน (หากมี) ประธาน, รองประธาน, กรรมการผูจัดการ, รองกรรมการผูจัดการ, ที่ปรึกษาอาวุโส
ผูอํานวยการฝาย, รองผูอํานวยการฝาย
ผูจัดการ, ผูชวยผูจัดการ ฯลฯ
เจาหนาที่, พนักงานระดับตาง ๆ
7. รายได (บาทตอเดือน) ต่ํากวา 15,000 15,001-25,000 25,001-40,000
40,001-50,000 50,001-80,000 80,001-100,000
100,001-150,000 150,001-300,000 มากกวา 300,000
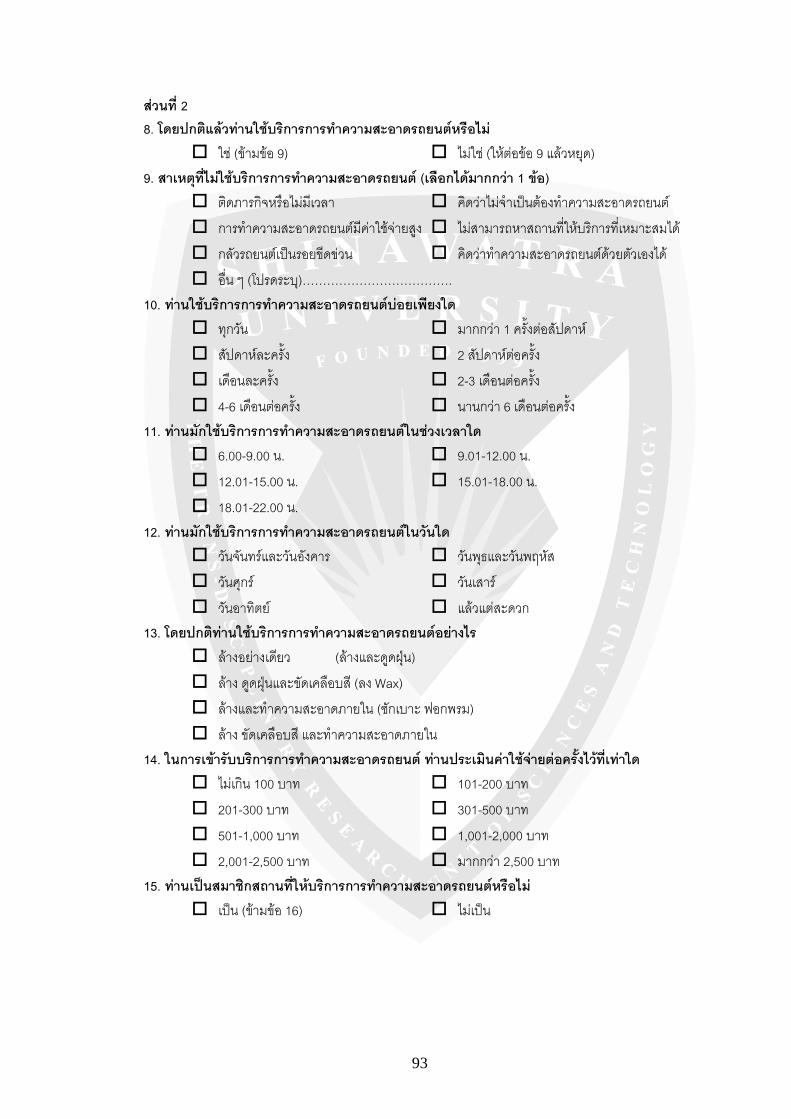
93
สวนที่ 2 8. โดยปกติแลวทานใชบริการการทําความสะอาดรถยนตหรือไม
ใช (ขามขอ 9) ไมใช (ใหตอขอ 9 แลวหยุด) 9. สาเหตุที่ไมใชบริการการทาํความสะอาดรถยนต (เลือกไดมากกวา 1 ขอ)
ติดภารกิจหรือไมมีเวลา คิดวาไมจําเปนตองทําความสะอาดรถยนต
การทําความสะอาดรถยนตมีคาใชจายสูง ไมสามารถหาสถานที่ใหบริการที่เหมาะสมได
กลัวรถยนตเปนรอยขีดขวน คิดวาทําความสะอาดรถยนตดวยตัวเองได
อื่น ๆ (โปรดระบุ)………………………………. 10. ทานใชบริการการทําความสะอาดรถยนตบอยเพียงใด
ทุกวัน มากกวา 1 ครั้งตอสัปดาห
สัปดาหละครั้ง 2 สัปดาหตอครั้ง
เดือนละครั้ง 2-3 เดือนตอครั้ง
4-6 เดือนตอครั้ง นานกวา 6 เดือนตอครั้ง 11. ทานมักใชบริการการทําความสะอาดรถยนตในชวงเวลาใด
6.00-9.00 น. 9.01-12.00 น.
12.01-15.00 น. 15.01-18.00 น.
18.01-22.00 น. 12. ทานมักใชบริการการทําความสะอาดรถยนตในวันใด
วันจันทรและวันอังคาร วันพุธและวันพฤหัส
วันศุกร วันเสาร
วันอาทิตย แลวแตสะดวก 13. โดยปกติทานใชบริการการทําความสะอาดรถยนตอยางไร
ลางอยางเดยีว (ลางและดูดฝุน)
ลาง ดูดฝุนและขัดเคลือบสี (ลง Wax)
ลางและทําความสะอาดภายใน (ซักเบาะ ฟอกพรม)
ลาง ขัดเคลือบสี และทําความสะอาดภายใน 14. ในการเขารับบริการการทําความสะอาดรถยนต ทานประเมินคาใชจายตอครั้งไวที่เทาใด
ไมเกิน 100 บาท 101-200 บาท
201-300 บาท 301-500 บาท
501-1,000 บาท 1,001-2,000 บาท
2,001-2,500 บาท มากกวา 2,500 บาท 15. ทานเปนสมาชิกสถานที่ใหบริการการทาํความสะอาดรถยนตหรือไม
เปน (ขามขอ 16) ไมเปน
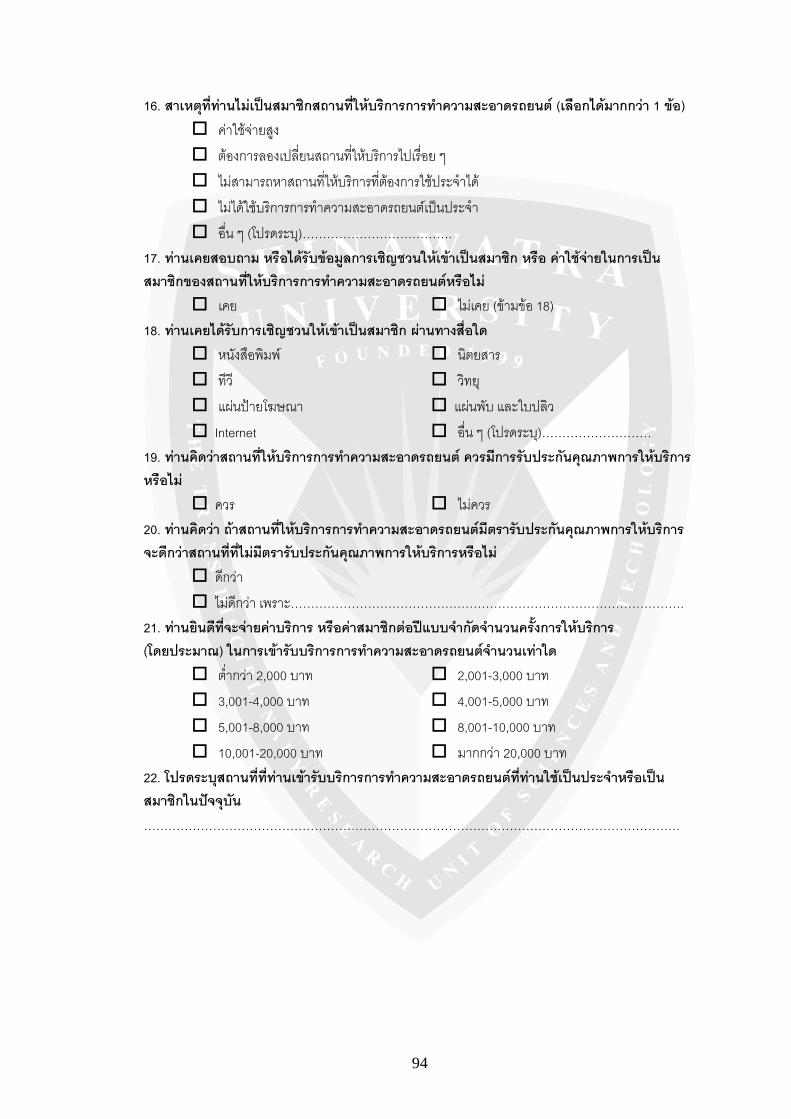
94
16. สาเหตุที่ทานไมเปนสมาชิกสถานที่ใหบริการการทําความสะอาดรถยนต (เลือกไดมากกวา 1 ขอ) คาใชจายสูง
ตองการลองเปลี่ยนสถานที่ใหบริการไปเรื่อย ๆ
ไมสามารถหาสถานที่ใหบริการที่ตองการใชประจําได
ไมไดใชบริการการทําความสะอาดรถยนตเปนประจํา
อื่น ๆ (โปรดระบุ)………………………………. 17. ทานเคยสอบถาม หรือไดรับขอมูลการเชิญชวนใหเขาเปนสมาชิก หรือ คาใชจายในการเปนสมาชิกของสถานที่ใหบริการการทําความสะอาดรถยนตหรือไม
เคย ไมเคย (ขามขอ 18) 18. ทานเคยไดรับการเชิญชวนใหเขาเปนสมาชิก ผานทางสื่อใด
หนังสือพิมพ นิตยสาร
ทีวี วิทยุ
แผนปายโฆษณา แผนพับ และใบปลิว
Internet อื่น ๆ (โปรดระบุ)……………………… 19. ทานคิดวาสถานที่ใหบริการการทําความสะอาดรถยนต ควรมีการรับประกันคุณภาพการใหบริการหรือไม
ควร ไมควร 20. ทานคิดวา ถาสถานที่ใหบริการการทําความสะอาดรถยนตมีตรารับประกันคุณภาพการใหบริการ จะดีกวาสถานที่ที่ไมมีตรารับประกันคุณภาพการใหบริการหรือไม
ดีกวา
ไมดีกวา เพราะ……………………………………………………………………………………. 21. ทานยินดีทีจ่ะจายคาบริการ หรือคาสมาชิกตอปแบบจํากัดจํานวนครัง้การใหบริการ (โดยประมาณ) ในการเขารับบริการการทําความสะอาดรถยนตจํานวนเทาใด
ต่ํากวา 2,000 บาท 2,001-3,000 บาท
3,001-4,000 บาท 4,001-5,000 บาท
5,001-8,000 บาท 8,001-10,000 บาท
10,001-20,000 บาท มากกวา 20,000 บาท 22. โปรดระบุสถานที่ที่ทานเขารับบริการการทําความสะอาดรถยนตที่ทานใชเปนประจําหรือเปนสมาชิกในปจจุบัน ……………………………………………………………………………………………………………………
95
23. ปจจัยที่เปนสาเหตุใหทานเลือกเปนสมาชิกกับสถานที่ใหบริการการทําความสะอาดรถยนต (โปรดเรียงลําดับความสําคัญจากมากไปนอย โดยที่ 1 แสดงถึงความสําคัญมากที่สุด และ 10 แสดงถึงความสําคัญนอยที่สุด)
สถานที่ต้ัง (ใกลบาน,ใกลที่ทํางาน)
ราคาคาบริการเหมาะสม
ความนาเชื่อถือของสถานที่ใหบริการนั้น
มีคนรูจักหรือเพื่อนใชบริการ แลวบอกตอวาดี
ผลิตภัณฑที่สถานที่ใหบริการนั้นใช
โฆษณาของสถานที่ใหบริการนั้น
โปรโมชั่นของสถานที่ใหบริการนั้น
ผลงานการทําความสะอาดรถยนต การจายคาบริการดวยบัตรเครดิต/เดบิต หรือการผอนชําระคาบริการเปนงวด ๆ ได
การใหบริการของพนักงาน (สะดวก, รวดเร็ว, เปนกันเอง) 24. อะไรคือสิ่งที่ทานคาดหวังจากการใชบริการการทําความสะอาดรถยนต (เลือกไดมากกวา 1 ขอ)
มีพนักงานใหคําแนะนําการทําความสะอาดและการดูแลรถยนตอยางถูกตองและเปนกันเอง เวลาเปดปดการใหบริการของสถานที่ใหบริการการทําความสะอาดรถยนตเหมาะสม บรรยากาศโดยรอบ/โดยรวมของสถานที่ มีการจําหนายผลิตภัณฑที่ใชในการดูแลรักษารถยนต มีการใหบริการอื่น ๆ ที่นาสนใจรวมอยูในสถานที่เดียวกัน อื่น ๆ (โปรดระบุ)………………………………………… 25. ทานคิดวาทานตองการบริการใดเพิ่มเติมในการใชบริการ ณ สถานที่ใหบริการการทําความสะอาดรถยนต (เลือกไดมากกวา 1 ขอ)
สถานีบริการน้ํามัน หองรับรองลูกคาระหวางรอการทําความสะอาด บริการ Internet ความเร็วสูง รานสินคาสะดวกซื้อ รานอาหารจานดวน รานซักแหง บริการตู ATM ศูนยบริการชวงลาง ต้ังศูนย ถวงลอ ศูนยบริการเปลี่ยนถายน้ํามันเครื่อง อื่น ๆ (โปรดระบ)ุ………………………

96
สวนที่ 3 26. ปจจัยตาง ๆ ตอไปนี้มีอิทธิพลตอการเลือกสถานที่ใหบริการการทําความสะอาดรถยนตของทานมากนอยเพียงไร (โปรดเลือกเพียงหมายเลขเดียวตอหนึ่งขอยอย)
นอยที่สุด ปานกลาง มากที่สุด
26.1 คุณภาพในการทําความสะอาด 1 2 3 4 5
26.2 อัตราคาบริการในการความสะอาด 1 2 3 4 5
26.3 ความสะดวกในการมารับบริการ 1 2 3 4 5
26.4 ความรวดเร็วในการทําความสะอาด 1 2 3 4 5
26.5 การปองกันรอยขีดขวนขณะทําความสะอาด 1 2 3 4 5
26.6 ความปลอดภัยตอทรัพยสินในรถยนต 1 2 3 4 5
26.7 การปองกันอันตรายที่เกิดขึ้นตอส่ิงแวดลอม 1 2 3 4 5
26.8 การใหบริการของพนักงาน 1 2 3 4 5
26.9 ความพึงพอใจในงานกับราคาที่จายไป 1 2 3 4 5
ขอคิดเห็นเพิ่มเติม
…………………………………………………………………………………………………………………………………………
…………………………………………………………………………………………………………………………………………
…………………………………………………………………………………………………………………………………………
97
Biography
Name: Mr. Warun Jirachaisingh
Date of Bath: June 8, 1983
Place of Birth: Bangkok, Thailand
Institutions Attended:
2000-2004 Chulalongkorn University, Thailand,
Bachelor of Engineering (Industrial Engineering)
2005 Master of Business Administration in Management (MBA)
Shinawatra University, Bangkok, Thailand
Home Address: 217 Phaholyothin Rd. Samsennai Phayathai
Bangkok 10400
Telephone: +6622700744 or, +66818018406
E-Mail: [email protected]