Embed Size (px)
Citation preview

A determination of the sulfur isotopic signatureof an ore-forming fluid from the Sierrita
porphyry copper deposit Pima County, Arizona
Item Type text; Thesis-Reproduction (electronic)
Authors Turner, Kent
Publisher The University of Arizona.
Rights Copyright © is held by the author. Digital access to this materialis made possible by the University Libraries, University of Arizona.Further transmission, reproduction or presentation (such aspublic display or performance) of protected items is prohibitedexcept with permission of the author.
Download date 09/07/2018 13:09:00
Link to Item http://hdl.handle.net/10150/557959

A DETERMINATION OF THE SULFUR ISOTOPIC SIGNATURE
OF AN ORE-FORMING FLUID FROM THE
SIERRITA PORPHYRY COPPER DEPOSIT
PIMA COUNTY, ARIZONA
by
Kent Turner, Jr.
A Thesis Submitted to the Faculty of the
DEPARTMENT OF GEOSCIENCES
In partial Fulfillment of the Requirements For the Degree of
MASTER OF SCIENCE
In the Graduate College
The University of Arizona
1 9 8 3

Call No. B IN D IN G INSTRUCTIONS INTERLIBRARY INSTRUCTIONS
E9791 Author: T u rn e r, K.1983262 Title:
COLOR: M.S.
Special Instructions - Bindery or Repair
5/25 /84
Dept.
RUSH__________________PERMABIND____________PAMPHLET_____________GIFT___________________POCKET FOR M AP______COVERS
Front_______Both
REFERENCE____________Other_________________
1-279
Call No. B IN D IN G INSTRUCTIONS INTERLIBRARY INSTRUCTIONS
E9791 Author: Turner, K.19832 6 2 Title:
COLOR: M.S.
Special Instructions - Bindery or Repair
5 /2 5 /8 4
Dept.
RUSH__________________PERMABIND____________PAMPHLET______________GIFT___________________POCKET FOR M AP______COVERS
Front_______Both
REFERENCE____________Other-----------------------------
L-279

STATEMENT BY AUTHOR
This thesis has been submitted in partial fulfillment of requirements for an advanced degree at the University of Arizona and is deposited in the University Library to be made available to borrowers under rules of the Library.
Brief quotations from this thesis are allowable without special permission, provided that accurate acknowledgment of source is made. Requests for permission for extended quotation from or reproduction of this manuscript in whole or in part may be granted by the head of the major department or the Dean of the Graduate College when in his judgment the proposed use of the material is in the interests of scholarship. In all other instances, however, permissionmust be obtained from the author.
SIGNED:
APPROVAL BY THESIS DIRECTOR
This thesis has been approved on the date shown below:
Professor of Geosciences'7

TABLE OF CONTENTSPage
LIST OF ILLUSTRATIONS.............................. iv
LIST OF TABLES..................................... v
ABSTRACT........................................... vi
1. INTRODUCTION AND BACKGROUND........................ 1Introduction............... ..................... 1Theory of Sulfur Isotopy in
Hydrothermal Environments............. ....... 4Geology of the Sierrita Deposit................. 11
2. ANALYTICAL METHODS................................. 15Sample Description............................... 15Fluid Inclusion Analyses......................... 19Mineral Compositions............................. 24Sulfur Isotope Analyses.......................... 31
3. CALCULATION OF SOLUTION COMPOSITION............... 34Oxygen Fugacity.................................. 35Activities of Na+ and K*"........................ 39Solution pH........ 46Activities of H2S0 , S0|“and Ca^+ .......... 50
4. RESULTS AND DISCUSSION............................. 53Distribution of Aqueous Sulfur................ 53Sulfur Isotopic Composition of theHydrothermal Solution.......................... 58
Non-Systematic Isotopic Disequilibrium.......... 61Deposition of minerals from isotopicallydistinct solutions............................... 62Errors in the isotopic enrichment factors....... 67Systematic isotopic disequilibrium.............. 68Discussion................................. 69
5. SUMMARY AND CONCLUSIONS............................ 78
6. APPENDIX A......................................... 81
7. LIST OF SYMBOLS AND ABBREVIATIONS................. 89
8. LIST OF REFERENCES................................. 90

LIST OF ILLUSTRATIONS
1. Location of the Slerrlta porphyry copper deposit..... 3
2. General geology of the Slerrlta open pit............. 13
3. Fluid inclusion homogenization temperatures fromthe vein studied...................................... 23
4. KAlSigOg - NaAlSi^Og - CaAlgSigOg ternary plot of vein selvage feldspar compositions as determinedby SEMQ analyses........ 26
5. Equilibrium alkali feldspar solves compositions as afunction of temperature............. 28
6. Compositions of vein and wall rock epidotes asdetermined by SEMQ analyses.......................... 29
7. Activity - composition relationships of epidote andclinozoisite in the epidote solid solution series.... 40
8. Activity - composition relationships of alkalifeldspars ........................................... 44
9. Molar predominance diagram for aqueous sulfurspecies; fg^ vs. pH................................... 57
10. values typical of various generalized sulfurresevoirs ........................................... 71
Figure Page
iv

LIST OF TABLES
Table Page
1 Average mineralogic compositions of the threemain intrusive units in the Sierrita open pit........ 14
2. Summary of: original wall rock mineralogy, vein- filling mineralogy and wall rock alteration adjacentto the vein........................................... 17
3. Mineralogy and fluid inclusion data determined byPreece and Bean (1982) for a set of veins from the biotite quartz diorite at Sierrita................... 20
4. Measured 6^ S values, as determined by mass spectrometric analyses, of the mixed sulfide powderand anhydrite samples................................. 32
5. Equilibrium constants for reactions in the text...... 37
6. A summary of the physical and chemical parametersdetermined for the vein studied...................... 54
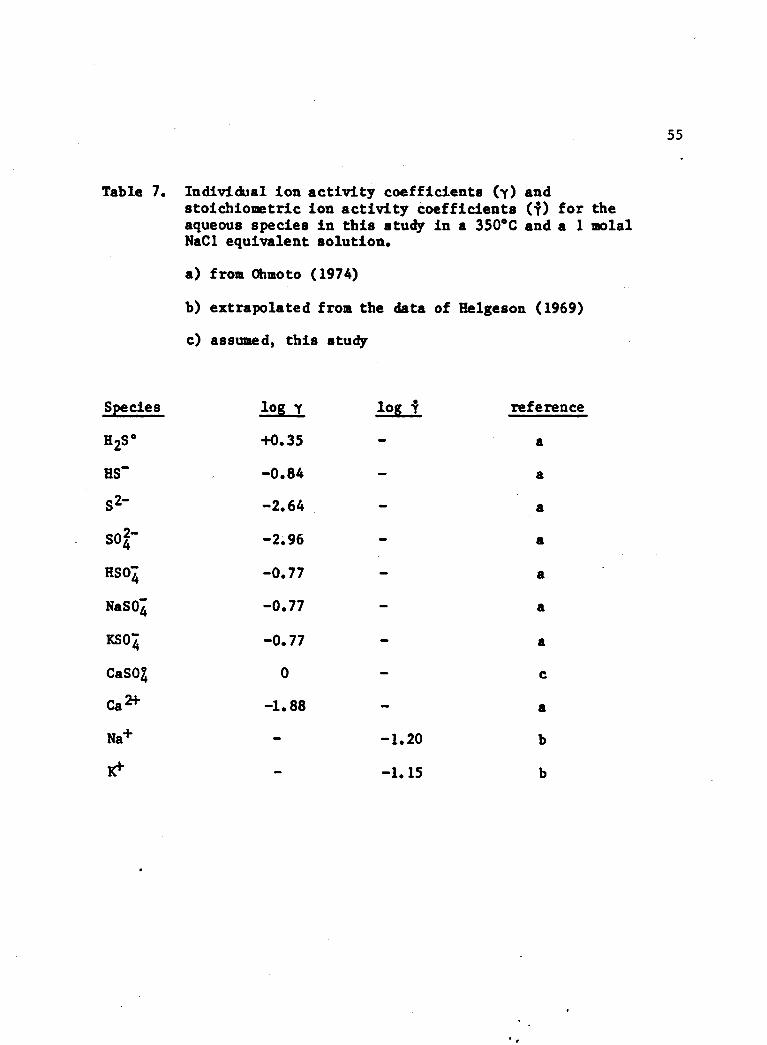
7. Individual ion activity coefficients (y) and stoichiometric ion activity coefficients (y) for the aqueous species in this study in a 350°C and 1 racialNaCl equivalent solution.............................. 55
8. Summary of the molalities, relative distributionand isotopic compositions of aqueous sulfur species determined in this study........... 56
9. The relative sulfur isotopic enrichment factors of the sulfur-bearing aqueous and mineral speciesin this study......................................... 60
v
ABSTRACT
The application of sulfur isotopy to studies on the genesis of
porphyry copper deposits requires knowledge of the physio-chemical
parameters governing aqueous sulfur distribution accompanied by the
isotopic composition of precipitated sulfur-bearing minerals.
Detailed study of a single vein from the Sierrita deposit permitted
the determination of the parameters: temperature (350°C), pressure
(330 bars), salinity (1.14 molal), fg^ (10“^*^), pH (5.8) and sodium,
potassium and calcium activities (6.3 x 10“^, 9.8 x 10“^ , 1.0 x 10“ ,
respectively) from which the relative molar distribution of aqueous
sulfur was calculated to be 50% sulfide and 50% sulfate. Isotopic
analyses of vein sulfides (pyrite » -0.8°/oo, chalcopyrite * -2.0°/oo) and sulfates (anhydrite = +8.8°/oo) indicate a system which is not in isotopic equilibrium. This lack of equilibrium precludes quantitative
calculation of the isotopic composition of aqueous sulfur. The
concept of systematic disequilibrium may allow interpretation of these results that imply either an igneous or a dual igneous - sedimentary
sulfate sulfur source.
vi

INTRODUCTION AND BACKGROUND
Introduction
The source of the ore-forming materials, and the relative
importance of 'magmatic* vs 'meteoric* waters in the derivation and
distribution of these materials are of continuing controversy in the
study of the origins and genesis of porphyry copper deposits. To
date, no satisfactory method of directly characterizing or tracing the
source of the metals has been found. However, porphyry copper
deposits are more than simply economic accumulations of copper and
molybdenum, they are also significant sulfur anomalies. Sulfur
locally composes up to 6Z of mineralized rock (Chaffee, 1982), which
corresponds to a 200- to 1000-fold increase above concentrations in equivalent non-mineralized rocks (Banks, 1982; Turekian, 1972). It is
the purpose of this study to isotopically characterize the sulfur in the hydrothermal fluid from which the mineralization formed, for the
purpose of defining a possible source, or sources, of sulfur in a typical porphyry copper deposit.
Early applications of sulfur isotope studies to hydrothermal
ore deposits and, in particular, attempts to identify possible
source(s) of the introduced sulfur, consisted primarily of determining
the sulfur isotopic composition of sulfur-bearing minerals and
comparing the results with 'typical* sulfur isotopic compositions from
various possible sulfur sources. However, if the source of the sulfur
1

2
is to be accurately identified, it is not sufficient simply to analyze
the minerals which are present in the system today. Rather, it is
necessary to determine the isotopic composition of the sulfur in the
mineralizing solution which may be significantly different from that
of related sulfur-bearing minerals.
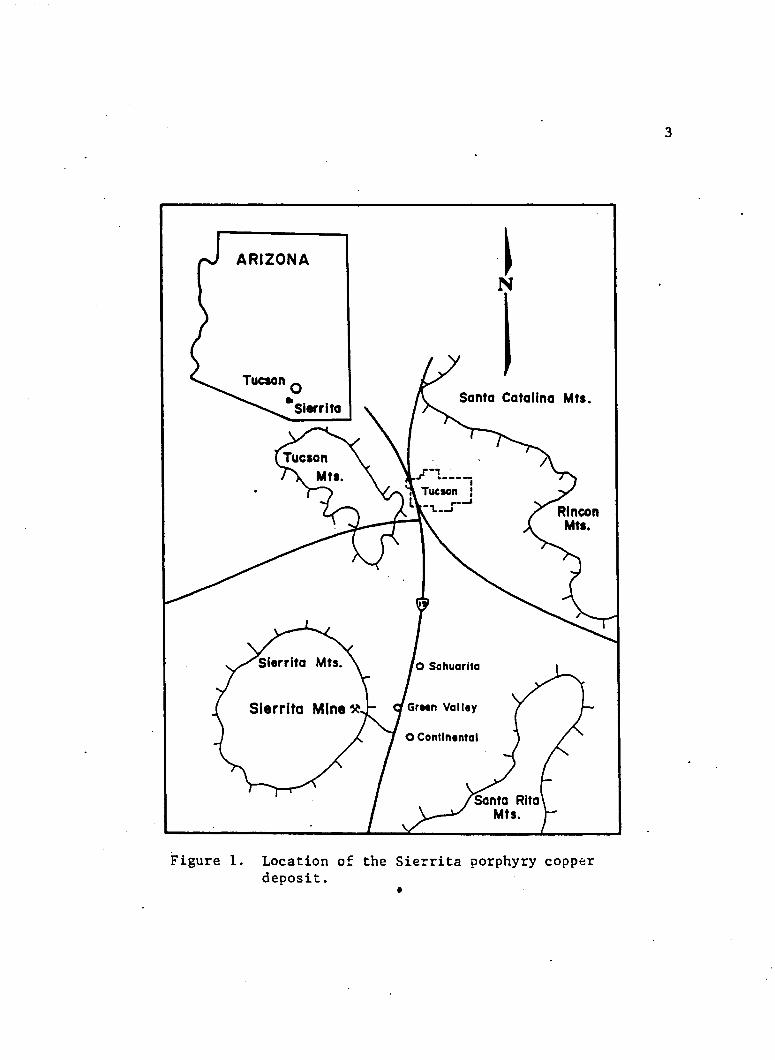
Samples from the Duval Corporation's Sierrita porphyry copper
deposit, located 15 miles south of Tucson in Pima County, Arizona
(Fig. 1), were chosen for this study because extensive previous work
(West and Aiken, 1980; Preece and Beane, 1982; Aiken and West, 1978)
has defined mineral assemblages which can be employed to determine the
variables which control distribution and isotopic composition of
sulfur in the hydrothermal fluid. Sierrita also offers the
simplification of having been only weakly modified by supergene
processes. The vein and wall rock minerals in the deeper exposures of
mineralization are texturally and, by implication, chemically
relatively unaffected by post mineralization events (West and Aiken,
1980; Preece and Beane, 1982; Aiken and West, 1978). Samples for this
study were collected from several locations within the Sierrita pit
where favorable mineral assemblages were present. Petrographic, fluid
inclusion, scanning electron microprobe and sulfur isotope analyses
were conducted in order to evaluate the parameters required to
calculate the sulfur isotopic composition of the hydrothermal fluid.
ARIZONA
Santa Catalina Mts.
Tucson i rx_i 1 Rincon
Slerrito Mts. O Sahuarito
Sierrita Mine x. Green Valley
Santa Rita Mts.
Figure 1. Location of the Sierrita porphyry copper deposit.

4
Theory of Sulfur Isotopy in Hydrothermal Environments
The theory of the application of sulfur isotopy to hydrothermal systems will be briefly reviewed below. For more
extensive treatments of the subject, the reader is referred to Ohmoto
and Rye (1979), Faure (1977), Rye and Ohmoto (1974), Ohomoto (1972)
and Sakai (1968).
There are four stable isotopes of sulfur in nature; ^S, 33g 34S and 36S having approximate relative distributions of 95%, 0.75%, 4.2% and 0.002%, respectively (Ohmoto and Rye, 1979). Most sulfurisotope studies have been made on variations in the ratio of the two
most abundant isotopes, and 3^S. The isotopic composition of a
given sulfur-bearing species is usually given as a 63^S value, where 63^S is the per mil variation in the molar 3^S/3^S ratio of the sample with respect to the molar 3^S/3^S ratio of a standard as defined by:
• " • - P i . - [ 4 S-/-f f i sajpl-e - 1 ] X 1000 ( S / -3 S)standard
The generally accepted standard for sulfur isotopy is the 3^S to 3^S
ratio of troilite from the Canon Diablo meteorite, in which 3^S/3^S = 0.0450045 (Ault and Jensen, 1963).
5
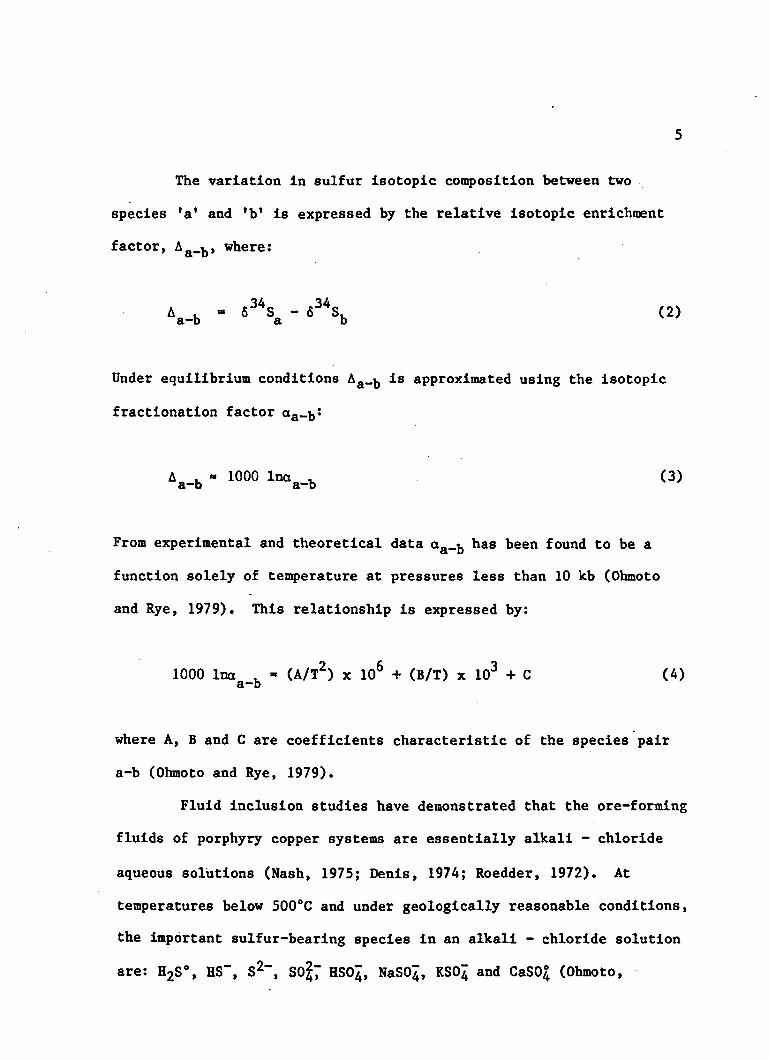
The variation in sulfur isotopic composition between two
species 'a* and 'b* is expressed by the relative isotopic enrichment
factor, Aa_k> where:
V b - 63\ - {34sb <2)
Under equilibrium conditions Aa_y is approximated using the isotopic
fractionation factor
Aa-b “ 1000 lncta-b (3)
From experimental and theoretical data aa_y has been found to be a
function solely of temperature at pressures less than 10 kb (Ohmoto
and Rye, 1979). This relationship is expressed by:
1000 Ina , - (A/T2) x 106 + (B/T) x 103 + C (4)a-b
where A, B and C are coefficients characteristic of the species pair
a-b (Ohmoto and Rye, 1979).
Fluid inclusion studies have demonstrated that the ore-forming
fluids of porphyry copper systems are essentially alkali - chloride
aqueous solutions (Nash, 1975; Denis, 1974; Roedder, 1972). At
temperatures below 500°C and under geologically reasonable conditions,
the important sulfur-bearing species in an alkali - chloride solution
are: H2S0, HS“, S2“, 80^7 HSO4, NaSO%, KSO4 and CaS0£ (Ohmoto,
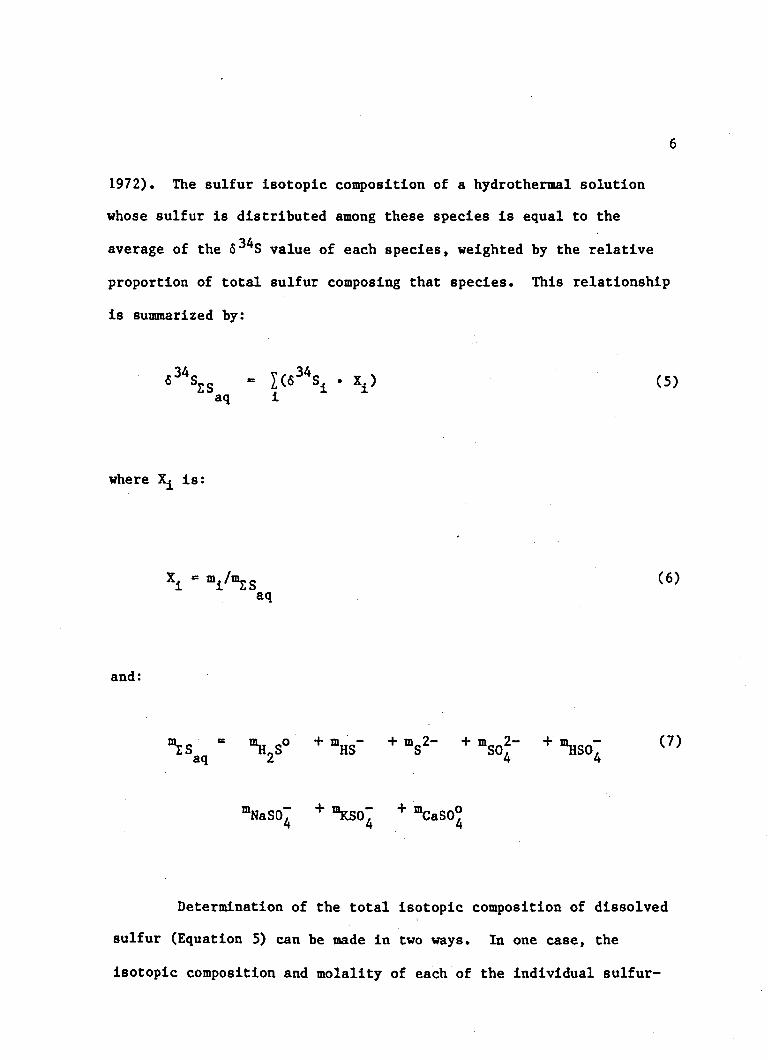
6
1972). The sulfur Isotopic composition of a hydrothermal solution whose sulfur is distributed among these species is equal to the
average of the 6^ S value of each species, weighted by the relative proportion of total sulfur composing that species. This relationship
is summarized by:
63 S£g - I(63\ • X±) (5)aq i
where is:
xi * aq
and:
mZS _ ■ mH2S° + mHS~ + mS2" + "so2" * °HSO:
mNaS07 + "KS07 + "CaSO°
Determination of the total isotopic composition of dissolved
sulfur (Equation 5) can be made in two ways. In one case, the
isotopic composition and molality of each of the individual sulfur
7
bearing aqueous species is directly determined. Alternatively, at
chemical equilibrium, the isotopic composition of a single species is
determined, and then with knowledge of the physical and chemical parameters influencing chemical speciation and isotope partitioning,
the isotopic compositions and relative concentrations of the other aqueous sulfur-bearing species are calculated. Direct measurements
of the concentration and sulfur isotopic composition of aqueous sulfur-bearing species in the mineralizing fluids of porphyry copper
deposits are rarely possible, because these fluids are no longer
present in such systems today except in fluid inclusions whose small
size introduces practical sampling difficulties. Therefore, it is
generally necessary to calculate the sulfur isotopic composition of
the fluid from the calculated distribution and isotopic compositions
of aqueous sulfur species which requires knowledge of certain physical
and chemical parameters, in addition to sulfur isotope data derived
from minerals.
As stated above, isotope partitioning among the various
sulfur-bearing species, under the conditions of porphyry copper
formation, is a function solely of temperature. The absolute 6^ S value for each species can be calculated from the measured 6^ S value of a sulfur-bearing mineral precipitated from the solution if the
temperature of that the solution at the time of precipitation is
known. The relative distribution of the aqueous sulfur species of
interest (H2S0, HS", S2", S0J7 HSO4, NaSO T, KSO4 and CaSO%) can be calculated using the following equilibrium relations:

8
H2S0 - HS“ + H+ (8)
H2S0 - S2" + 2 H+ (9)
H2S° + 2 02 * SO4™ + 2 H+ (10)
H2S° + 2 02 = HSO^ + H+ (11)
H2S° + 2 02 + Na+ - NaSO^ + 2 H+ (12)
H2S° + 2 02 + K+ » KSO4 + 2 H+ (13)
H2S° + 2 02 + Ca2+ - CaSO% + 2 H+ (14)
Employing the equilibrium reaction constant, K, for each of these
reactions yields the following equations:
(aHS~) (aH+) aH2S°)
(aS2~) (aHf)< <aH2So)
<aso24-’ ('»+)'
(aH2S°) 'f„2>2
(15)
(16)
(17)

9
_____4_______
(aH2So) (f02)
aNaS0 (aH+^4(aH2So) (f0 2) (8a +)
(aKS0%) aH+ ^____ 4____________(aH2S0) (f02) (aK+)
(aCaS0?) aH+ 4(aH2So) (f02) (aCa2+)
(18)
(19)
(20)
(21)
The molality of these species, m, can be introduced by employing the
activity coefficient, y , for each species from the relationship:
a. m. (22)
Rearranging Equations 15-21 and using the activity - molality
relationship in Equation 22 yields the following set of reactions
which define the relative molalities of the aqueous sulfur species:
“h s"
(Kg) (mH2So) (y H2So)(23)

10
ms2“<K9) (mH2So) <TH2So)
< V - > <aH+)2(24)
msof-4(Kl0> <mH2S0) (rH2S0) (t02r
^ S O 2 (*H+)(25)
“hso"(Kn) (mg^go) (Yjj^gO) Cf02)‘
YHS0T aH+^4(26)
mNaSO,K12^ mH2So^ YH2SO^ f02 aNa+ *
(YNaS0:) (aH+)Z(27)
°KS074( V (\ s 0) \ s ° > « 02> (aK+>
y k s o7^ aH+^4(28)
mCaS0°40=14) (mH2So) ^ H 2S°) « 0 2> (aCa2+)
YCaS0°^ (aH ^4(29)
By solving Equations 23-29, the mole fractions of the various sulfur-
bearing species can be determined, and if the absolute molality of
HgS*, or any of the other sulfur-bearing species, is determined, then
the absolute molality of each can be calculated.

11
The equilibrium reaction constant, K, for any given reaction
is a function of temperature and pressure (Carrels and Christ,
1965). The activity coefficient, y , for any given species is a
function of temperature, pressure and ionic strength of the solution
(Carrels and Christ, 1965). Thus, in order to calculate the relative
distribution of aqueous sulfur species from Equations 23-29, it is
necessary to establish, or approximate; temperature, pressure, ionic strength, oxygen fugacity, pH and activities of Na+ , id" and Ca^+ in
the hydrothermal solution.
Temperature, ionic strength (salinity) and, less readily,
pressure can be determined from analysis of fluid inclusions in
hydrothermal minerals. Oxygen fugacity, pH and the activities of Na+ ,+ 9-L.K and Ca may, under proper conditions, be calculated using
equilibrium relations among minerals formed in the rock by the
mineralizing solution.
Geology of the Sierrita Deposit
The Sierrita porphyry copper deposit, together with the Esperanza deposit, is part of the Sierrita - Esperanza porphyry copper
complex located at the southeastern end of the Sierrita Mountains
(Fig. 1). Detailed descriptions of the geology, structure and
mineralization of the system are given by West and Aiken (1982), Aiken
and West (1978), Smith (1975) and Lynch (1966). Only a brief
description of the general geology within the Sierrita pit will be included here.

12
Within the pit at Sierrita three intrusive units dominate the
geology: the Jurassic - Triassic Harris Ranch quartz monzonite, the
67 m.y. (Cooper, 1973) biotite quartz diorite and the 57 m.y. (Cooper,
1973) Ruby Star quartz monzonite porphyry (Fig. 2). Average modal
mineralogies of these three intrusives, as they are found in the mine, are listed in Table 1. The Ruby Star quartz monzonite porphyry is a
facies of the batholithic Ruby Star granodiorite which makes up the
bulk of the Sierrita Mountains. This porphyritic differentiate is
spatially and structurally at the center of the Sierrita - Esperanza porphyry copper system (Thompson, 1981; Haynes, 1980) and is thought
to be responsible for the mineralization (West and Aiken, 1982; Aiken and West, 1978; Smith, 1975).

I I quartz latlte|___| porphyry
EXPLANATION
bio__diorite
rr -q biotit# quartz L + J diorite
r r q quartz monzonite lr * I porphyry[*» breccia
Ruby Star FT7 ! Harris Ranchgranodiorite |» , I quartz monzonite
0I 300Meters Ox Frame
volcanic#jOk Sample v Location
Figure 2. General geology of the Sierrita open pit. After Preece 1978.
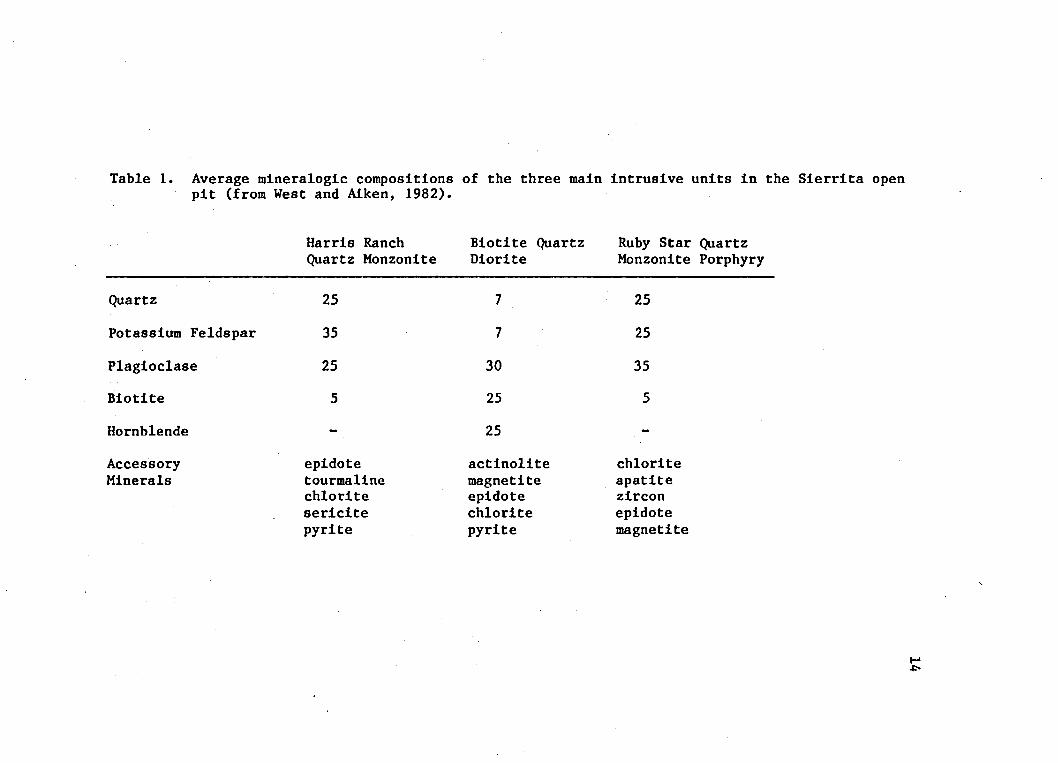
Table 1. Average mineralogic compositions of the three main intrusive units in the Sierrita open pit (from West and Aiken, 1982).
Harris Ranch Biotite Quartz Ruby Star QuartzQuartz Monzonite Diorite Monzonite Porphyry
Quartz 25 7 25
Potassium Feldspar 35 7 25
Plagioclase 25 30 35Biotite 5 25 5
Hornblende - 25 -
AccessoryMinerals
epidotetourmalinechloritesericitepyrite
actinolitemagnetiteepidotechloritepyrite
chloriteapatitezirconepidotemagnetite
H

ANALYTICAL METHODS
Sample DescriptionsSeveral hand samples were collected from Inside the Slerrita
pit near the contact between the biotite quartz diorite and the Harris
Ranch quartz monzonite within 250 m of the Ruby Star quartz monzonite
porphyry intrusive contact (Fig. 2). After hand lens examination of
slabbed surfaces of these samples, a single vein from the biotite
quartz diorite was chosen for study. The selection was based on the
presence of wall rock alteration and vein-filling mineralogies which
would provide a means of establishing the composition of the
hydrothermal solution from which the vein formed. The portion of the
vein studied was specially isolated from other veins (2-3 cm minimum)
so that vein selvage alteration could be unequivocally ascribed to
this solution conduit.
The original modal mineralogy of the biotite quartz diorite
sample chosen for study was: plagioclase feldspar 50%, biotite 25%,
hornblende 20%, and quartz 5% with minor magnetite. This mineralogy was determined by petrographic microscope examination of a polished
thin section from the least altered wall rock in the sample. Vein
controlled alteration consisted of: partial to complete destruction of hornblende, commonly by conversion to biotite; chloritization of both
'alteration1 and 'original' biotites; and weak to moderate dusting of15

16
sericite In feldspars and, to a lesser extent, chlorites. Each of
these alteration manifestations was seen to be strongest near the vein
edge, diminishing to nearly absent over a very short distance into the wall rock (generally less than 1 cm).
The vein contains quartz, epidote, pyrite, chalcopyrlte and
anhydrite with trace amounts of molybdenite and magnetite. The
contact between vein minerals and wall rock is sharp along most of its
length in the sample. It is marked by a sudden change from relatively
fine grained (less than 0.5 mm) quartz, sericite-dusted feldspar and
chlorite in the wall rock to relatively coarse (greater than 1 mm in diameter) vein quartz. Very fine molybdenite flakes (less than 0.1 mm
in length) are present along the vein margin and are oriented
perpendicular to the vein wall. The central portion of the vein contains a more complex mineral assemblage consisting of quartz, which
is optically identical to that along the vein edge, epidote, pyrite,
chalcopyrlte and anhydrite. Trace amounts of magnetite occur as tiny
blebs in pyrite grains. The vein-filling mineralogy and wall rock
alteration assemblage are summarized in Table 2. It is not possible
to say that all vein-filling minerals observed were coprecipitated in
euqilibrium with one another. However, each mineral, with the
exception of magnetite, is in contact with every other vein-filling
mineral at some point along the studied section of the vein. This
distribution of mineral grains in the vein is such that a solution
.depositing any one mineral would be in intimate physical contact with
any previously deposited minerals, and since no evidence was seen to

17Table 2. Summary of original wall rock mineralogy, vein-filling
mineralogy, and wall rock alteration adjacent to the vein as determined by petrographic examination.
Mineralogy of Vein Studied:
Edge;
QuartzMolybdenite
Center;
Quartz PyriteEpidote ChalcopyriteAnhydrite Magnetite
Wall Rock Alteration Adjacent to Vein Studied:
Hornblende ____________— Biotite _____________Chlorite
Biotite ___________ Chlorite
Plagioclase -----------weak Sericitization
Original Wall Rock Mineralogy of Studied Sample:
PlagioclaseBiotiteHornblendeQuartzMagnetite
50%25205
tr
%
18
indicate either dissolution or alteration of these minerals it is unlikely that any one mineral is seriously out of equilibrium with any
others present.
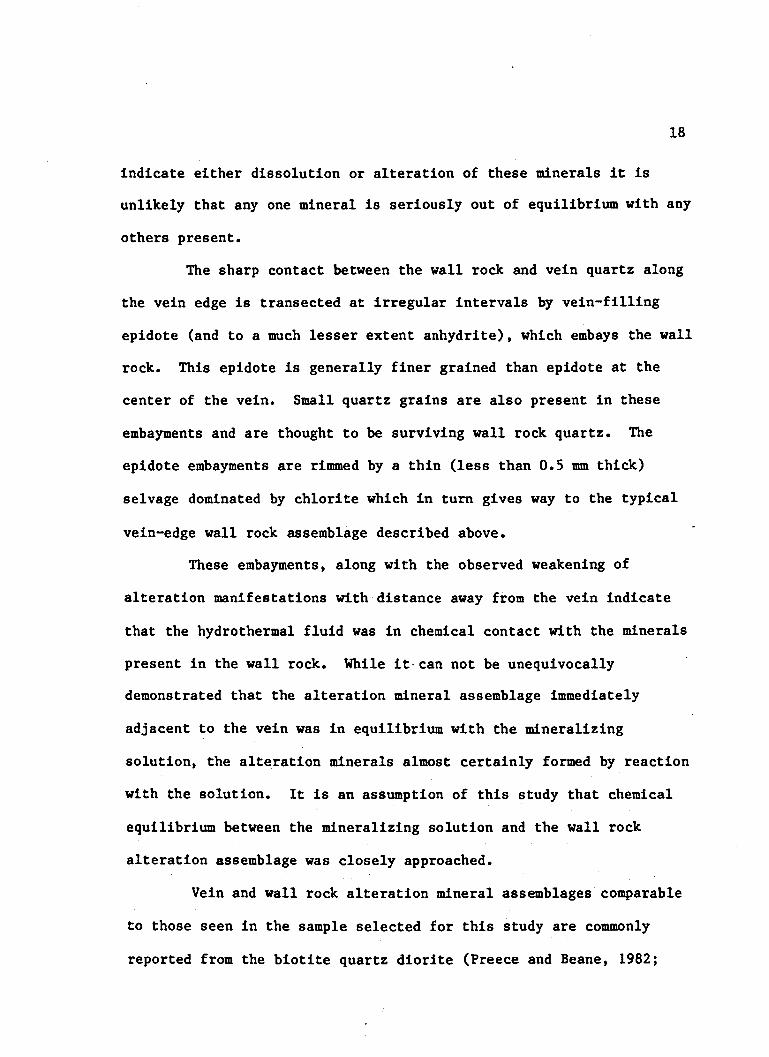
The sharp contact between the wall rock and vein quartz along
the vein edge is transected at irregular intervals by vein-filling
epidote (and to a much lesser extent anhydrite), which embays the wall
rock. This epidote is generally finer grained than epidote at the
center of the vein. Small quartz grains are also present in these
embayments and are thought to be surviving wall rock quartz. The
epidote embayments are rimmed by a thin (less than 0.5 mm thick)
selvage dominated by chlorite which in turn gives way to the typical
vein-edge wall rock assemblage described above.These embayments, along with the observed weakening of
alteration manifestations with distance away from the vein indicate
that the hydrothermal fluid was in chemical contact with the minerals
present in the wall rock. While it can not be unequivocally demonstrated that the alteration mineral assemblage immediately
adjacent to the vein was in equilibrium with the mineralizing
solution, the alteration minerals almost certainly formed by reaction
with the solution. It is an assumption of this study that chemical
equilibrium between the mineralizing solution and the wall rock
alteration assemblage was closely approached.
Vein and wall rock alteration mineral assemblages comparable
to those seen in the sample selected for this study are commonly
reported from the biotite quartz diorlte (Preece and Beane, 1982;

19Smith, 1975). From cross-cutting relationships in a single hand sample, Preece and Beane (1982) documented a minimum of five cycles of
development of similar alteration assemblages in the biotite quartz
diorite. Mineral compositions of these veins, along with the vein
described in this study, are listed in Table 3. Each cycle begins
with an early vein-edge assemblage of quartz, biotite and feldspar
(both potassic and sodic) which is followed by an assemblage of quartz, epidote, chlorite, pyrite and chalcopyrite with minor
magnetite and molybdenite. The vein selected for this study contains
a mineral assemblage which corresponds with that of the later portion
of one of Preece and Beane's (1982) cycles and lacks the biotite and
feldspar characteristic of the early part of each cycle. From this
observation, it is inferred that the portion of the vein studied was
closed to fluid circulation during the early 'potassic' stage defined
by Preece and Beane, and was opened when circulating fluids were
depositing the later 'propylitic' assemblage.
Fluid Inclusion Analyses
Fluid inclusion analysis of vein-filling quartz was carried out using standard fluid inclusion heating-freezing techniques.
Doubly polished (0.3 micron grit) sections 100-200 microns thick were
prepared. The analyses were conducted on an S.G.E. Inc., Model III
dual purpose gas flow heating/freezing stage at the University of
Arizona and at AMAX Exploration Inc. of Tucson, Arizona. Heating was
accomplished by passing air over an electric torch and then over the

Table 3
Early
, Mineralogy and fluid inclusion data determined by Preece and Beane (1982) for a set of veins from the biotite quartz diorite at Sierrita. •Early® and ®late® refer to relative ages of veins, ’Wall® and ’Center® refer to early and later mineral assemblages, respectively, within each vein. Capitalized mineral abbreviations indicate relative abundance of the mineral in the assemblage, while lower case abbreviations indicateminor or trace amounts of the mineral.
Vein Mineralogy
FluidthCc)
Inclusion:Salinity
(molal NaClgq)VeinMineralogy
FluidtHCC)
InclusionSalinity
(molal WaCleq)
BQD-2A qtz, Bio, an, or, anh, ser
325 12 Qtx, Epid, (hi, PY. cpy
390 2
BQD-2B Qtz, Mo, An, Or, Anh (ser)
410 2 qcx, Epid, Py,Q>y, chi, mgt, hem
390 3
BQD-2C Qtz. Mo, An, Or, Ser
375 2 Qcx, Epid, (hi, Py Cpy, Anh, mo, mgt
340 2
BQD-2D Qtz, Mo, An, Or, anh, ser
360 2 Epid, qtx, Qiy, Py, Anh, mo, mgt, chi, ser
320 2
BQD-2E Qtz, Bio, An Anh, Or, ser
325 2 Epid, Qtx, q>y, Py, chi, mgt, mo, anh, ear
310 3
Vein Studied; (in this paper)
Mineralogy Ty Salinity(*C) (molal NaCl*q)
Qtz, Epid, Cpy, Py, anh, mgt, mo
320 1MO
21
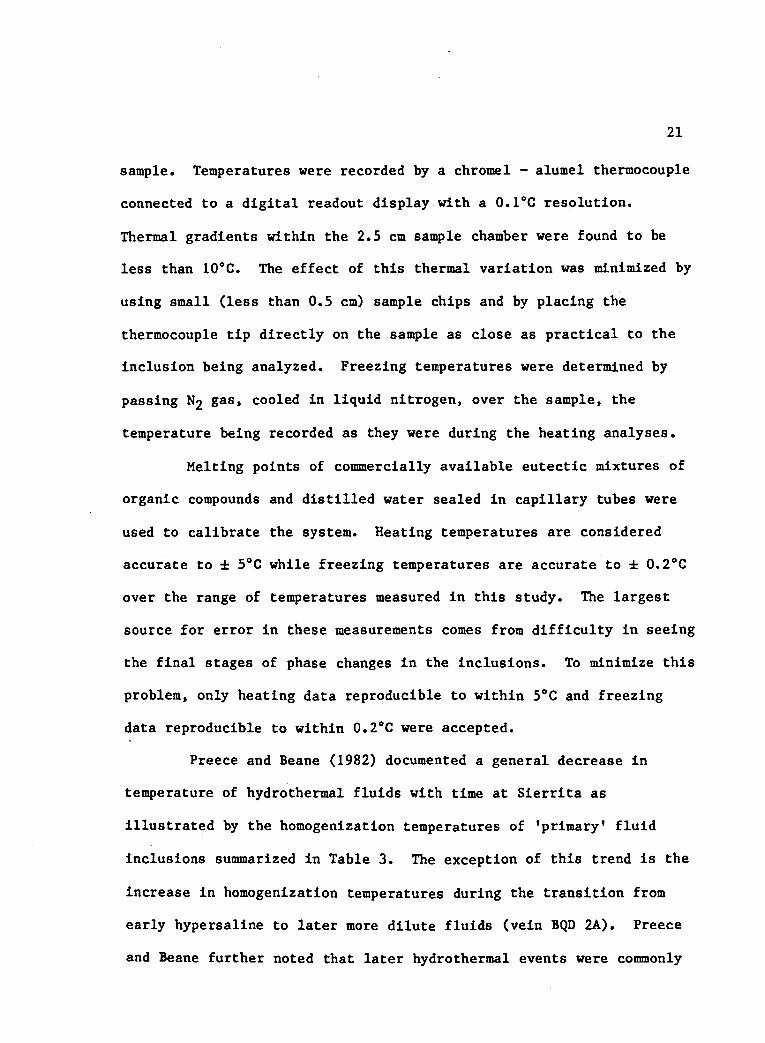
sample. Temperatures were recorded by a chrome1 - alumel thermocouple
connected to a digital readout display with a 0.1°C resolution.
Thermal gradients within the 2.5 cm sample chamber were found to be less than 10°C. The effect of this thermal variation was minimized by
using small (less than 0.5 cm) sample chips and by placing the
thermocouple tip directly on the sample as close as practical to the
inclusion being analyzed. Freezing temperatures were determined by
passing N£ gas, cooled in liquid nitrogen, over the sample, the
temperature being recorded as they were during the heating analyses.
Melting points of commercially available eutectic mixtures of
organic compounds and distilled water sealed in capillary tubes were
used to calibrate the system. Heating temperatures are considered
accurate to ± 5°C while freezing temperatures are accurate to i: 0.2°C
over the range of temperatures measured in this study. The largest
source for error in these measurements comes from difficulty in seeing
the final stages of phase changes in the inclusions. To minimize this
problem, only heating data reproducible to within 5°C and freezing
data reproducible to within 0.2°C were accepted.
Preece and Beane (1982) documented a general decrease in
temperature of hydrothermal fluids with time at Sierrita as
illustrated by the homogenization temperatures of 'primary* fluid
inclusions summarized in Table 3. The exception of this trend is the
increase in homogenization temperatures during the transition from
early hypersaline to later more dilute fluids (vein BQD 2A). Preece
and Beane further noted that later hydrothermal events were commonly

22recorded as secondary fluid inclusions in earlier formed vein
quartz. It was their conclusion that the highest temperature
inclusions found in a given vein represented the temperature of
formation of that vein unless the early hypersaline fluids were
involved. This principle has been applied to the determination of the
homogenization temperatures of inclusions in this study. No attempt
has been made to distinguish between ’primary', ’secondary’ or
'pseudo-secondary' inclusions based on morphology, a distinction which
is often difficult to make in veins from porphyry copper deposits
(Nash, 1975).In order to screen out the numerous low temperature secondary
fluid inclusions in the quartz, individual polished quartz chips were
examined at 250°C in order to locate inclusions which had not yet
homogenized at this temperature. When found in a chip, one higher
homogenization temperature inclusion only was analyzed, and that
measurement repeated, to ensure against errors resulting from leakage
or decrepitation. The freezing point depression of that inclusion was then measured twice.
The homogenization temperatures in excess of 250°C measured in this study are shown in Figure 3. The distinct grouping between 310
and 330°C, averaging approximately 320°C, is interpreted to represent
the ’primary’ vein-filling solution temperature. The freezing point
depression measured for these inclusions averaged, with only minior
variation, -3.5°C. According to Potter, et al (1977), this
corresponds to a salinity of 1.14 molal NaCl equivalent.

Freq
.
23
4r2oL (x a w w s ^TI
250 300 350Temperature °C
Figure 3. Fluid inclusion homogenization temperatures from the vein studied.Only inclusions with T greater than 250°C were analyzed. The average freezing point depression of the six highest temperature (310-330°C) inclusions was -3.6°C.

24
From indications of boiling in the fluid inclusions from one
sample, Preece and Beane (1982) inferred a pressure of formation of
that vein to be 330 bars* Lacking such boiling relationships in the
vein selected for this study, or any further indications of pressure
in the literature, it is assumed that pressure during the time of
formation of the vein studied was also 330 bars.
At 330 bars pressure, the correction to the homogenization
temperature of 320°C for a 1 molal NaCl equivalent fluid is +25°C.
This implies a temperature of formation of the vein of 345°C. For the purposes of this study a temperature of 350°C will be used as the
temperature of formation in all subsequent calculations. The measured
homogenization temperature and salinity correlates with the later
'propylitic* stage of Preece and Beane's vein BQD 2D which exhibits a
comparable mineralogy (see Table 3).
Mineral CompositionsSeveral of the minerals in the vein-filling and wall rock
assemblages are solid solutions whose compositions can not be safely
assumed to be end-member compositions. Of particular importance to
this study are the compositions of the feldspars and epidotes, as the
compositions of these minerals have a dramatic effect on the activity
of their end-member components. These compositions were determined by
electron microprobe analyses. Equipment, procedures and results are described in Appendix A.

25
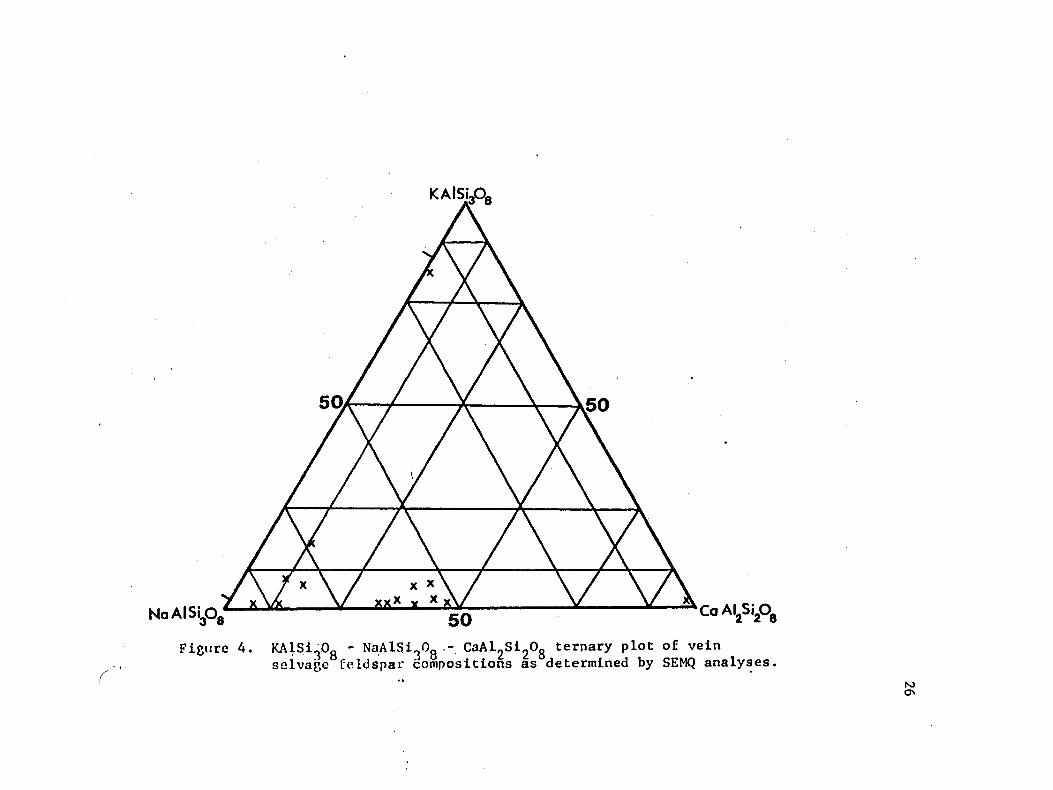
Fifteen wall rock feldspars were analyzed and the results
plotted on a KAlSigOg - NaAlSigOg - CaA^S^Og ternary diagram (Fig.
4). These results are similar to those obtained by Preece and Beane
(1982) for selvage feldspars. The cluster of analyses about Org,
AbgQ, Angg is interpreted to represent the composition of the igneous plagioclase from the biotite quartz diorite. A distinct compositional
break occurs between these igneous feldspars and the more alkali-rich
feldspars which contain only 5-10 moleZ An component. These low An
feldspars are interpreted to be alkali-altered plagioclases. The
general tendency for the alkali-rich feldspars to be near the vein and
the more calcic ones to lie further into the wall rock was noted during the analyses and taken to indicate that the vein-forming fluids
were responsible for the alteration of these plagioclases.
The large range in the Na and K contents of the alkali
feldspars is probably not representative of equilibrium partitioning
of these elements at vein-filling temperatures. The two alkali
feldspar compositions with Or concentrations in excess of 10 mole %
are theoretically impossible for feldspars formed, or equilibrated, at
or near 350°G (Parsons, 1978). The scatter in the Na and K contents
and the disequilibrium feldspar compositions are interpreted to be the
result of the width of the electron beam relative to the thickness of
perthite lamellae. The electron beam probably measured bulk, or
weighted average, compositions of Na- and K- rich lamellae of two
compositionally distinct feldspars. The compositions of these two

Figure 4. KA1SigOg - NaAlSigOg - CaAlgSigOg ternary plot of vein selvage feldspar compositions as determined by SEMQ analyses.
The two tick marks along the KA1SigOo - NaAlSigOg join indicate the composition of the alkali feldspar solvus at 350°C.
%
KAlSi30 8
NaAlSi3Oa
Figure 4.
Co AI2Si208
KAlSi„0„ - NaAlSi-Og CaAL Si Og ternary plot o£ vein selvage teldspar compositions as determined by SEMQ analyses.
toON

27
equilibrium feldspars should lie on the alkali feldspar solvus for the
temperature at which they equilibrated. Figure 5 is a diagram showing
the solvus compostions for the alkali feldspars as a function of
temperature. At 350°C the equilibrium solvus compositions are Orgy,
Abjg and Org, Abgg. Figure 5 applies to pure alkali feldspars only;
the effects of calcium on the solvus compositions are not considered. For alkali feldspar compositions more Or-rich than about
XQr = 0.5, the maximum An content is less than 2 mole % (Saxena, 1973)
which will have only a minor affect on the Or concentration in such a
feldspar. However, An concentrations in high Ab alkali feldspars can
be significant (in this study around 10 mole Z, see Fig. 4). The data
necessary for the calculation of the activity - composition
relationship of ternary feldspars are not available. It is therefore
necessary to assume ideal mixing behaviors between the Ab-rich alkali
feldspar and the contained An component. This assumption yields a
mixture of an alkali feldspar with a composition of Or2, Abgg and a calcic feldspar, An^QQ, of (Or2» ^98^0.9^^n100^0.1* T^e ^ content of such a mixture is 0.88. The composition of alkali feldspars to be
used in this study are Orgy, Ab^g for the potassium-rich feldspar and
0r2> Abgg, AnjQ for the sodium-rich feldspar.Twenty-six epidote analyses, from both vein-center and selvage
epidotes, are plotted in Figure 6. The results fall into two distinct
groups on either side of the ideal epidote composition,
Ca2FeAl2Si30i2(0H), in the clinozoisite - pistacite solid solution series. The significance of this bimodal distribution of epidote

Tem
pera
ture
.25 .50 .75Mole Fraction KAISLCl3 8
Figure 5. Equilibrium alkali feldspar solvus compositions as a function of temperature.From Parsons, 1978.

29
Figure 6. Compositions of vein and wall rock epidotes as determined by SEMQ analyses.The results are plotted as mole fraction
FeFe + A1 X 3.

30compositions is not known. In his study of epidote compositions at
Sierrita, Fellows (1976) reports a similar bimodal distribution of
epidote compositions for which no explanation is offered.
Thermodynamic data for epidote compositions more iron-rich than ideal
epidote are limited and suspect while reliable data are available only
for compositions in the clinozoisite - epidote range (D. Bird, pers.
comm., 1982). Therefore, the composition of 'epidote’ used in this
study is taken from the lower-iron set of analyses. The average
composition of this group is; - 0.915, Xclino ” 0.085.Because the vein sulfides pyrite and chalcopyrite were-
complexly intergrown, it was not possible to physically separate the
two minerals for sulfur isotope analysis. Therefore, a mixed pyrite +
chalcopyrite sample was extracted from the vein by hand, crushed to a
fine powder, homogenized and split into six samples. Five of these
were reserved for mass spectrometric analysis. The sixth was analyzed
for its copper to iron ratio which was used to calculate the original
chalcopyrite to pyrite ratio in the powder. The small amount of
magnetite present in the sulfides was removed with a magnet. The
sample was then fused in a molybdenum strip furnace in order to create
a thoroughly homogenized pellet. Some of the sulfur was lost during
this process, but the iron and copper, which have very low vapor
pressures, remained and were combined into a single phase. After
rapid quenching, the resulting pellet was analyzed for its copper,
iron and sulfur contents. Sixteen spot analyses indicated a molar
copper to iron ratio of 0.305 : 0.695. Since pyrite and chalcopyrite

were the only minerals in the sulfide powder, the measured atomic
ratio indicates a molar chalcopyrite to pyrite ratio of 0.44 : 0.56
(assuming stoichiometric compositions for pyrite and chalcopyrite).
Sulfur Isotopic Analyses
The isotopic compositions of sulfide minerals were determined
at the University of Arizona’s Laboratory of Isotope Geochemistry on a
602C Micromass mass spectrometer relative to a standard SO2 gas of known isotopic composition. Both SOg and SO were analyzed so that it
was possible to account for the isotopic composition of oxygen in the
gases. The resulting data were reduced on a TRS-80 computer using a
program written by D. Steinke and A. Long of the University of
Arizona.
The five powdered pyrite + chalcopyrite samples visually
estimated to be > 95% sulfide were extracted from the vein, combined
with excess amounts of an oxidant (tenorite), placed in a vacuum
system and heated to in excess of 900°C. This process liberated the
sulfur from the sulfide phase and combined it with oxygen to form SOg
gas. The gas was isolated from potential contaminants (O2, CO2, H2O, etc.) and collected. The sulfur isotopic compositions of the five
sulfide samples are listed in Table 4. The average of these values,
which ranged from -1.86 to -0.76°/oo, is -1.33°/oo
A sample of vein-filling anhydrite was extracted from the vein. Binocular microscope examination indicated that the sample
contained less than 2% sulfide contamination. The sulfur isotopic
31
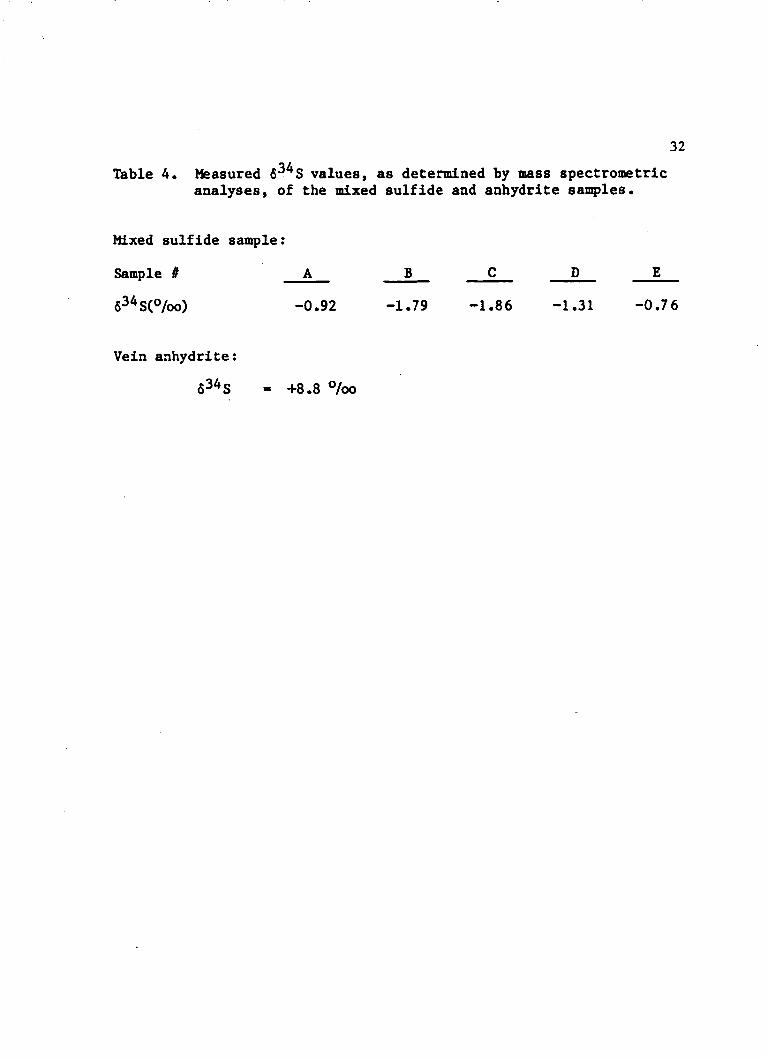
Table 4. Measured 6 S values, as determined by mass spectrometrlc analyses, of the mixed sulfide and anhydrite samples.
32
Mixed sulfide sample:
Sample # A
634S(°/oo) -0.92
B
-1 .79 - 1.86 -1.31 -0.7 6
Vein anhydrite:
634S +8.8 % o

33
analysis of the anhydrite was performed by Geochron Laboratories in
Cambridge, Massachusetts. The 6^ S value of the anhydrite was determined to be +8.8°/oo.

CALCULATION OF SOLUTION COMPOSITION
Based on the assumption of chemical equilibrium between the
vein-filling and alteration mineral assemblages and the mineralizing solution, necessary chemical parameters of the solution were derived
using mineral stability calculations. The vein-filling assemblage of
quartz, epidote, anhydrite, pyrite and magnetite fixes the oxygen
fugacity of the system. The presence of two alkali feldspars in the
wall rock alteration assemblage allows the ratio of aqueous Na+ to K+
to be fixed, which in conjunction with the salinity of the fluid allows the activities of both species to be calculated. The pH of the
solution is bracketed by the sericite - potassium feldspar and epidote
- garnet buffers, while a reaction written between epidote and sodium feldspar can be employed to fix the pH within those limits. Another
epidote - feldspar reaction can be used to define the Ca^+ activity.
These calculations will all be described and discussed in detail
below. It is important to note that all reactions to be employed in
fixing these chemical parameters involve mineral assemblages present
in this single vein.
The reaction constants used in these calculations are the
'thermodynamic equilibrium reaction constants' of Carrels and Christ
(1965). The activities of pure solids are defined as unity. Minerals
•not known to have significant impurities have been assigned activities
of one for use in the following calculations. In this study, these
34

35
minerals include: anhydrite, chalcopyrite, hematite, magnetite,pyrite and quartz. Sericite (muscovite) is known to contain
significant impurities. However, it was present in such fine grains
in the sample that SEHQ analysis was precluded. Sericite was
therefore arbitrarily assigned an activity of one. The activity of
H2O in a 1 molal NaCl equivalent solution at 350°C is calculated by Helgeson (1968) to be 0.98.
Oxygen Fugacity
General constraints on oxygen fugacity in the fluid can be
drawn from the presence of magnetite and the general absence of
hematite in the alteration assemblage of the biotite quartz diorite,
while hematite appears to be the stable iron oxide phase in the Harris
Ranch quartz monzonite alteration assemblage (Preece and Beane
1982). As the sample for this study came from very near the contact
(less than 25 m, see Fig. 2) of these two units, the oxygen fugacity
of the fluid can reasonably be expected to be close to the value for
the hematite-magnetite oxygen buffer. The equilibrium fg^ for this buffer can be calculated from the equilibrium constant, K^q , for the
reaction:
(hem)
3 Fe203
(mgt)
2 Fe304 + 1/2 02 (30)

36
where:
K30» o / / 2 < V
(31)
from which the oxygen fugacity is defined as:
log f02 = 2 log K30 (32)
Substituting the reaction constant K3q from Table 5 in Equation 32
yeilds an equilibrium oxygen fugacity of log fg^ ■ -27.4, magnetite
being the stable iron oxide at lower values. This value represents an
upper limit on the fugacity of oxygen.
A direct measure of the oxygen fugacity comes from a reaction
between the observed vein-filling minerals:
(epid) (py)
18 Ca2FeAl2Si3012(OH) + 6 FeS2 + 20.5 0% = (33)
(clino) (anh) (qtz) (mgt)
12 Ca2Al3Si3012(0H) + 12 CaS04 + 18 Si02 + 8 Fe304 + 3 H20
from which:
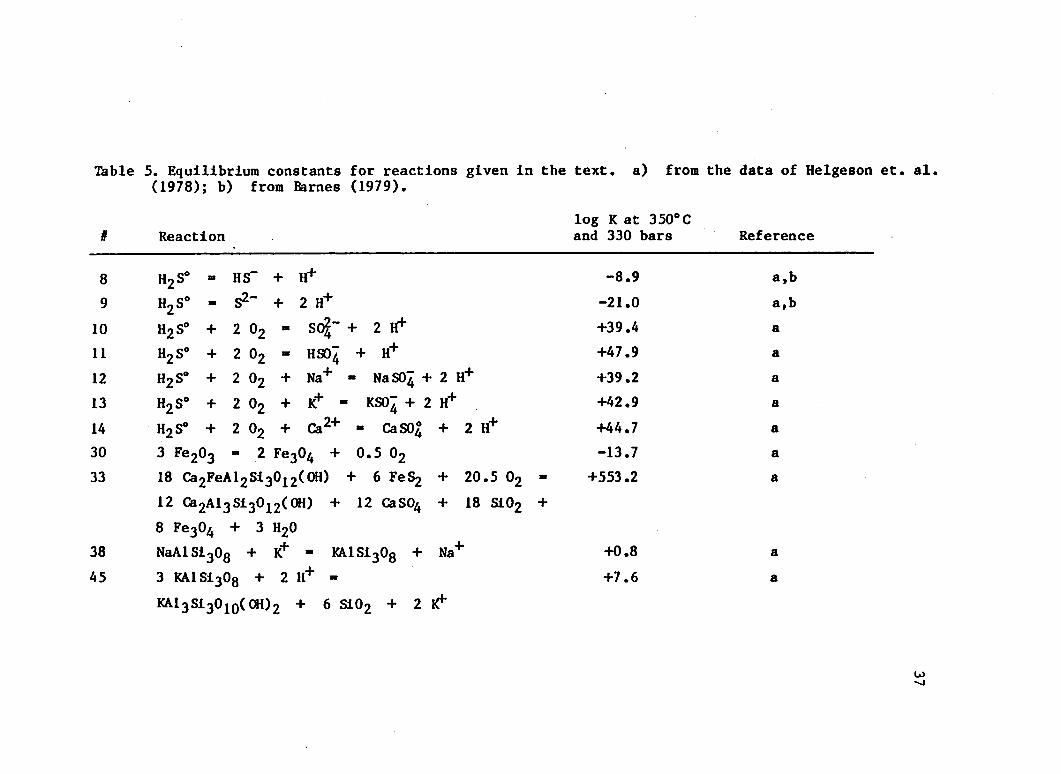
Table 5. Equilibrium constants for reactions given In the (1978); b) from Barnes (1979).
text, a) from the data of Helgeson
# Reactionlog K at 350°C and 330 bars Reference
8 H2S0 - HS“ + H+ -8.9 a,b
9 h2s° - S2“ + 2 H+ -21.0 a,b
10 H2S* + 2 02 - SC%~ + 2 1^ +39.4 a
11 H2S° + 2 02 - HS04 + H+ +47.9 a
12 H2S° + 2 02 + Na+ - NaS04 + 2 H+ +39.2 a
13 H2S° + 2 02 + K+ - KS04 + 2 H+ +42.9 a
14 H2S° + 2 02 + Ca2+ - CaS04 + 2 H+ +44.7 a30 3 Fe20g ■ 2 Fe304 + 0.5 02 -13.7 a33 18 Ca2FeAl2Si3012(OH) + 6 FeS2 + 20.5 02 -
12 Ga2Al3Si3012(0H) + 12 CaS04 + 18 S102 ++553.2 a
8 Fe304 + 3 h2o38 NaAlSi308 + K+ - KA1S1308 + Na+ +0.8 a
45 3 KA1S130q + 2 H+ - +7.6 a
KAl3Si3010( 0H)2 + 6 Si02 + 2 K1*

Table 5 - continued
# Reactionlog K at 350°Cand 330 bars Reference
48
51
54
84 Ca2Al3Sl3012(OH) + 306 Si02 + 10 Fe304 +2.5 02 + 120 Na+ + 33 H20 =36 Ca3Al2Si3012 + 30 Ca2FeAl2Sl3012(0H) +120 NaAlSl308 + 120 H*"6 Ca2FeAl2Sl3012(OH) + 6 NaAlSl308 + 6 H+ «6 Ca2Al3Sl3012(0H) + 18 S102 + 2 Fe304 +6 Na+ + 0.5 02 +’ 3 H2012 Ca2FeAl2Sl3012(0H) + 32 H2S° + 19 02 -8 Ca2Al3Sl3012(OH) + 12 FeS2 + 8 CaS04 +12 S102 + 34 H20
(anh) ' » 2+ + “ f
+500.6
+8.6
+147.3
a
a
a
58 -11.7 a

39<*clino>12 K n h >12 <a,tz>18 < V t )8 (aH20>3
^epid)18 S y > 6 'f02>20'5(34)
The fugacity of oxygen is then defined by:
lo6 f02 “ IQT3 l12 lo8 aclino + 3 lo8 aH20 (35)
- 18 log aepld - log K33]
The activities of clinozoisite and epidote can be calculated from the
composition of the solid solution as determined by SEMQ analysis using the activity-composition relationships for this solid solution series
given by Bird and Helgeson (1980) in Figure 7. From these
relationships and the measured composition of vein epidotes of =0.915, the activities of clinozoisite and epidote in this system are
found to be 0.12 and 0.95, respectively. Substituting these values
for the activities of clinozoisite and epidote and the reaction
constant for Reaction 33 (Table 5) into Equation 35 yields log f = -27.5. This is close to the magnetite-hematite buffer and satisfies
the requirement for magnetite stability discussed above.
Activities of Ha* and K+
Neither fluid inclusion analyses nor equilibrium mineral stability relationships alone are sufficient to determine the

Act
ivity
40
Figure 7. Activity - composition relationships of epidote and clinozosite in the epidote solid solution series.Contours show the activity - composition relationships at 25 and 600 C. From Bird and Helgeson, 1980.

41
activities of the Na+ and K+ ions in the mineralizing solution.
However, salinity data from fluid inclusion studies provide
information on the total molality of Na and K in solution, while the
alkali feldspar assemblage serves to fix the activity ratio of Na"*" :
K+ . Taken together, this information can be used to calculate the absolute activities of both Na+ and K+ .
From the measured freezing point depression in fluid
inclusions, a salinity of 1.14 molal NaCl equivalent was determined
for the mineralizing fluids. It has been shewn that the salinity of
hydrothermal solutions in general and of porphyry copper deposits in
particular are dominated by NaCl and KC1 (Roedder, 1979, 1972; Dennis,
1974). Since the effect on the aqueous freezing point depression of
NaCl + KC1 solutions is nearly identical to that of pure NaCl
solutions (Potter, 1977), the NaCl equivalent salinity may be very
closely approximated by:
1*14 * “NaCl + “KCl (36)
which in turn implies that:
1.14 « mNa + mR (37)
Based on the presence of two coexisting alkali feldspars in
the vein selvage, as indicated by the SEMQ analysis, the followingreaction can be written:

42
(Ab) (Or)
NaAlSi30g + K + - KAlSigOg + Na+ (38)
where:
K38 “) (aNa+)T T v T -
from which the activity ratio of Na+ to K+ is defined by:
(39)
(aNa+)(aK+)
(K38) ^Ab^ (40)
This activity ratio of Na"*" to K"*" can be converted to a molar ratio of
Na to K in solution through the stoichiometric ion activity
coefficient, -y:
ai “ “Ei * Ti (41)
where 'i' is an ion of an element and ’m^^' is the total molalilty of
that element in solution (both free and associated). The y for any given ion in solution is a function of temperature, pressure, solution
composition and properties of the individual ion (size and charge)
(Carrels and Christ, 1965). Helgeson (1974, 1969) has tabulated
values of y for Na" and K 1" in aqueous solutions for various NaCl
concentrations at temperatures up to 300°C. Above 300°C, the

43thermodynamic data for species in concentrated solutions are not well
known. It was therefore necessary to extrapolate the y ’s reported by
Helgeson (1974) up to 350°C. Although values of y for Na+ and K*
begin to change significantly at and above.300*0 in concentrated
chloride solutions, the ratio of YNa+ to 'Yk+ changes more slowly with increasing temperature and is hence more acceptable for extrapolation
at 350*0. For a 350*0 and 1 molal NaCl equivalent solution, the
extrapolated 1^ + : ratio is 0.89. The individual y *s for Na" and
K+ are estimated to be 0.063 and 0.071, respectively. The error
involved in these extrapolations can not be readily estimated.
Substituting the relationships between activity and molality
(Equation 41) and the activity coefficient ratio of these species
(0.89) into Equation 40 gives an equation defining the molar ratio of
Na : K in solution:
_ ^K 3 8 ^ aAb) (42)mg. (aOr)(0T89) ^
The results of the SEMQ analysis of vein selvage feldspars
indicate the presence of two coexisting alkali feldspars. The
compositions of these are interpreted to be Orgy, Abjg, and Org, Abgg,
AnjQ for the potassium- and sodium- rich alkali feldspars,
respectively. Waldbauo and Thonq>son (1969) have calculated the
activity-composition relationships for the alkali feldspars and their
results are summarized in Figure 8. At temperatures near 350®C it is

Mole Fraction KAISi3Og Mole Fraction KAISijOg
Figure 8. Activity - composition relationships of alkali feldspars.Contours indicate the activity - composition relationships at 200, 350 and 500°C. From Waldbaum and Thompson, 1969.
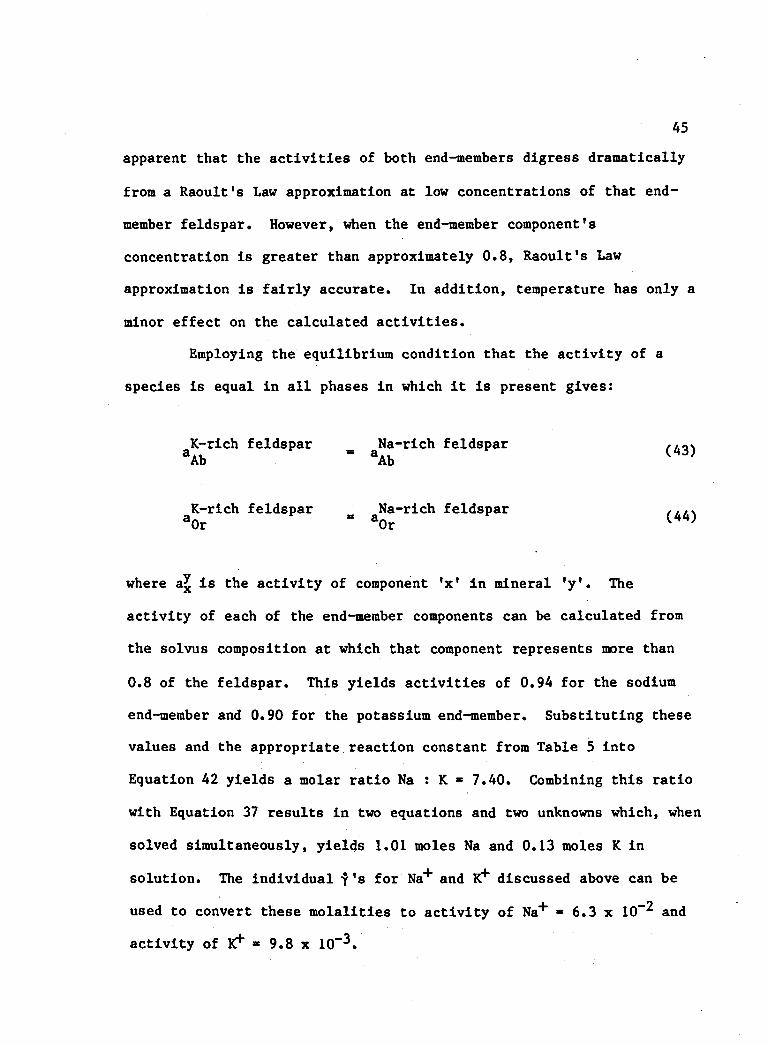
45apparent that the activities of both end-members digress dramatically
from a Raoult's Law approximation at low concentrations of that end-
member feldspar. However, when the end-member component’s concentration is greater than approximately 0.8, Raoult's Law
approximation is fairly accurate. In addition, temperature has only a
minor effect on the calculated activities.Employing the equilibrium condition that the activity of a
species is equal in all phases in which it is present gives:
K-rich feldspar aAb
Na-rich feldspar aAb (43)
K-rich feldspar a0r
Na-rich feldspar " a0r (44)
where a£ is the activity of component 'x' in mineral 'y'. The
activity of each of the end-member components can be calculated from
the solvus composition at which that component represents more than
0.8 of the feldspar. This yields activities of 0.94 for the sodium
end-member and 0.90 for the potassium end-member. Substituting these values and the appropriate reaction constant from Table 5 into
Equation 42 yields a molar ratio Na : K * 7.40. Combining this ratio
with Equation 37 results in two equations and two unknowns which, when
solved simultaneously, yields 1.01 moles Na and 0.13 moles K in
solution. The individual ^ 's for Na"*" and K*" discussed above can be
used to convert these molalities to activity of Na"*" * 6.3 x 10~^ and
activity of K* « 9.8 x 10“ .
46
Solution pH
Upper and lower limits on the activity of the H+ ion, or pH,
were established based on the presence and absence of certain minerals
in the observed assemblages. Sericite was observed in the wall rock
assemblage, but its place in the paragenetic sequence is not
certain. In particular, the possibility that this sericite is the
product of a weak 'phyllic overprint' can not be ruled out. However,
potassium feldspar Is present in the wall rock alteration assemblage,
and its presence implies that the equilibium pH did not fall below the
limit imposed by the reaction:
(Or) (ser) (qtz)
3 KAlSi308 + 2 H+ = K A ^ S ^ O jqCOH^ + 6 Si02 + 2 K+ (45)
where:
ser) (aqtz)6 (y )2(V > 3 ( V )
(46)
The equilibrium pH, at a fixed activity of K+ , is defined by:
log aH+ = 0.5 log ager + log aR+ - 1.5 log a0r (47)
- 0.5 log K45
Substituting the activities of potassium feldspar and K+ as well as
the reaction constant, K4g, from Table 5 into Equation 47 fixes the

minimum pH for this system at 5.8. A lower solution pH would
correspond to destruction of potassium feldspar to form sericite.
Similarly, the absence of a Ca - Fe - A1 garnet phase in the
vein-filling assemblage sets a maximum limit on pH, from the reaction:
(clino) (qtz) (mgt)
84 Ca2Al3Si3012(0H) + 306 Si02 + 10 Fe304 + (48)
2.5 02 + 120 Na+ + 33 H20 «
(gr) (epid)
36 Ca3Al2Si30i2 + 30 Ca2FeAl2Si30i2(0H) +
47
where:
(Ab)
120 NaAlSigOg + 120 H+
(49)
< V >36 (aepid)3° <-Ab>12° <=H+)120clino> 'a.gt)lU V o f <aNa+)
This equation places a maximum limit on pH defined by:

481
log aH+ = TZ5 [log K43 + 84 log aclino + 2.5 log +
120 log aNa+ + 33 log ay^o ” 36 log agr - 30
log aepld - 120 log aAb - log aH+] (50)
The activities of all species involved in Equation 50 except grossular garnet have previously been calculated. The activity of
grossular garnet can be derived from the composition of the epidote
with which it would have had to have been in equilibrium as described
by Bird and Helgeson (1980). The activity of the grossular component
of the grandite garnet which would be in equilibrium with the
composition of epidote in this study (Xgpid = 0.915) at 350°C is agr -
0.068.
When this value and the other known parameters are substituted
into Equation 50, a maximum solution pH is defined at 6.6. A pH
larger than this value would require the stabilization of a garnet
phase which was not observed in the sample.
A reaction which directly provides pH is:
(epid) (Ab)
6 Ca2FeAl2Si3012(OH) + 6 NaAlSi^Og + 6 H+ = (51)
(clino) (qtz) (mgt)
6 Ca2Al3Si30i2(0H) + 18 Si02 + 2 Fe304 + 6 Na+
+ 0.5 02 + 3 H20
49
where:
(*=ll-=>6 <aqtz>18 < V t >2 <=N,+)6 <£o/ ' 5 W 20>3
<»epid>6 (aAb)6 < V >6(52)
The equilibrium pH defined by this reaction is given by:
log aH+ * 1/6[6 log aclino + 6 log aNa+ + 0.5 log +
3 log aH 0 - log K51 - 6 log aepid -
6 log aAb] (53)
The activities of each of the terms on the right side of Equation 53
have been calculated above. Substituting these and the reaction
constant K51, from Table 5 into Equation 53 yields an equilibrium pH ** 5.8. The pH calculated by this reaction (5.8) is in agreement with
the limiting conditions previously calculated (5.8 - 6.6). A further
aspect of this direct pH calculation is that it is identical to thatfor the limiting Equation.45. Thus sericite is indicated to be a
stable part of the equilibrium wall rock assemblage at the time of
mineralization and not necessarily the product of a later 'phyllic
overprinting'. The pH of the mineralizing solution seems to have been
controlled by the alkali feldspar - sericite pH buffer.

50Activities of H?S°t S0^~ and Ca^*
The activity of HgS" can be defined by the reaction:
(epid)
12 Ca2FeAl2Si3012(OH) + 32 H2S0 + 19 02 - (54)
(clino) (py) (anh) (qtz)
8 Ca2Al3Si3012(OH) + 12 FeS2 + 8 CaSO* + 12 Si02
+ 34 H20
where:
‘clino) (*py) ^anh^ (aqtz)
^epid*12 <*H2S»>32 <£o/ 9(55)
The activity of aqueous H2S° is given by:
lo8 aH2S° “ 1/32(8 log aclino + 34 log a ^ Q - (56)12 log aepid - 19 log f0 - log K54]
Substituting the previously calculated values for each of the terms

51
and the reaction constant, K54, from Table 5 into the right side of Equation 56 determines the activity of ■ 4.80 x 10” .
The activity of S0^ in the mineralizing solution can now be
calculated from Equation 10:
H2S0 + 2 02 = Sol" + 2 H+
From this reaction the activity of S0|“ is defined by:
iog aso2- = log K10 + log aH2So + 2 log f ^ -
2 log aH+ (57)
Substituting the appropriate values determined above into Equation 57
yields an activity of S0jj~ « 5.13 x 10~^.
From this value for the activity of aqueous sulfate and the presence of anhydrite in the vein mineral assemblage, the activity of
O4.Ca can be calculated. The reaction:
CaS04 (anh) - Ca2+ + SO?" (58)
where:
(aCa2+) (aS0?™)
... 4(59)

52
provides the activity of Ca2+ to be 1.03 x 10⁻⁵ from:
log aCa2+ - log K58 log aS02- (60)
RESULTS AND DISCUSSION
Distribution of Aqueous Sulfur
The necessary physical and chemical variables outlined above
for the calculation of the distribution of aqueous sulfur have now
been determined for the mineralizing solution. These results are
summarized in Table 6. The molalities of the remaining aqueous
sulfur-bearing species can now be calculated from Equations 15-21.
Substituting into these equations the appropriate calculated
parameters from Table 6 and the individual ion activity coefficients, listed in Table 7, yields the molalities of the aqueous sulfur
species as summarized in Table 8. Also presented in Table 8 are the molar percentage of total aqueous sulfur each species represents.
The single most important sulfur-bearing species in solution
is H2S0 which accounts for 49.5% of total aqueous sulfur. Other
important species are HSO^ (37.4%) and S0|~ (10.8%). Thus sulfur is
transported in this solution as nearly equal amounts of sulfide and
sulfate.
Figure 9 summarizes graphically the effects of solution
chemistry, in particular oxygen fugacity and pH, on the distribution
of aqueous sulfur. The calculated fg^ and pH of the solution forming
the vein studied have been plotted, along with the hematite-magnetite
oxygen buffer and the calculated limits to solution pH. The various
fields in Figure 9 depict regions where the labeled species is the
53

54Table 6. A summary of the physical and chemical parameters
determined for the vein studied.
X
Temperature 34 5° CPressure 330 barsIonic Strength 1.141°6 fo2 -27.5^calculated 5.8
minimum 5.8maximum 6.6
Individual ion activities:Na+ 6.3 x 10⁻²K*" 9.8 x IQ-2Ca2+ 1.0 x 10"5h2s0 4.79 x IQ"2
Isotopic Compositions:
5 ASpyrit:e-0.82°/oo
.34 q° ^anhydrite + 8.8°/oo
55
Table 7. Individual Ion activity coefficients (y) andstoichiometric ion activity coefficients (•?) for theaqueous species in this study in a NaCl equivalent solution.
a) from Ohmoto (1974)
350°C and a 1
b) extrapolated from the data of Helgeson (1969)
c) assumed, this study
Species log y log i reference
h 2s 0 +0.35 aHS“ -0.84 aS2- -2.64 a
o -2.96 — ah s o ^ -0.77 aNaS0% -0.77 aKSO4 -0.77 aCaS0% 0 cCa24- —1.88 — aNa+ - 1.20 bId- -1.15 b

56
Table 8. Summary of the molalities, relative distribution and isotopic compositions of aqueous sulfur speciesdetermined in this study.
Aqueous Sulfur Species Molality Molar Z 634S(°/oo)h2s° 2.14 x 10‘3 49.5 -1.85
HS~ 2.63 x 10⁻⁵ 0.6 -2.60
s2- 2.09 x 10"9 — — -5.59
SO2- 4.68 x 10"4 10.8 +8.8HSO4 ' 1.62 x 10"3 37.4 +8.8NaSO* 1.26 x 10”7 — +8.8KSO4 7.25 x 10“5 1.7 +8.8CaS0% 5.01 x 10⁻⁷ +8.8
4.33 x 10"3 100.0

Figure 9. Molar predominance diagram for aqueous sulfur species; f0 vs. pH. u2Drawn for a system at 350°C, 330 bars and Ionic strength of solution * 1. NaSO^, KSO^ and CaSO^ do not have a field of predominance at the activities of Na+ , id" and Ca^+ determined in this study (Table 6). The heavy solid lines define regions where the indicated species is the most abundant sulfur-bearing species in - solution. The dashed lines indicate the region in each field where the appropriate species makes up greater than 90% of the total aqueous sulfur. Also plotted in this diagram is the hematite-magnetite oxygen buffer and the pH limits calculated for the mineralizing solution in this study.

57
solution
Figure 9. Molar predominance diagram for aqueous species; fQ vs. pH.

58
most abundant sulfur-bearing form in solution. As a boundary between
two fields is approached, the molar ratio of the two aqueous species
changes, as illustrated by the dashed line contours. The solid
boundary defining lines indicate equal amounts of the two species in
solution. The dashed lines show where the individual species becomes
90% of total aqueous sulfur. Every aqueous sulfur species is present
in solution over the entire extent of the diagram, although when
solution conditions plot well outside the field of predominance of a
given species, its molar fraction in such a solution may be trivially
small. The oxygen fugacity and pH calculated in this study define a
point in the diagram falling just on the H^S* side of the H^S" - HSO^
predominance boundary, reflecting the calculated 50 : 37 molar ratio
of these two species. Note that small changes (eg., 0.5 log unit) in
pH and/or f c a n have a dramatic affect on the distribution of
aqueous sulfur. Such changes may control the timing and style
(sulfide vs. sulfate) of mineralization in the system.
Sulfur Isotopic Composition of the Hydrothermal Solution
The sulfur isotopic composition of the hydrothermal pyrites in / the studied vein can be calculated from the measured 6^ S = - 1.33°/oo
of the mixed sulfide sample. During the SEMQ analysis, it was noted
that iron and copper were the only metals present in the sulfide
powder in anything but trace quantities. Thus, the isotopic
composition of the sulfide powder can be expressed as:

59
^ ^ Ssulfide powder “ xcpy * ^^^Scpy^ + (^py Spy^
The mole fractions of chalcopyrite and pyrite were determined by the
SEMQ to be 0.44 and 0.56, respectively. The isotopic composition of
chalcopyrite can be related to that of pyrite by the equilibrium
isotopic enrichment factor, ^cpy-py* From Equation 2 and the value of ACpy_py in Table 9, 634Scpy is given by:
634Scpy = 634Spy - 1.16 (62)
Substituting this relation and the appropriate values from above into
Equation 61 yields:
- 1.33 - 0.44(634Spy - 1.16) + 0.56(634Spy) (63)
from which the isotopic composition of pyrite is calculated to be
-0.82%>o. The corresponding isotopic composition of chalcopyrite is
-1.98°/oo.
The calculation of the S34S values of the pyrite and
chalcopyrite in the mixed sulfide sample assumes isotopic equilibrium
between the two minerals at the fluid inclusion-based temperature of
formation of 350°C. The corresponding 634S of anhydrite in equilibrium with these sulfides at 350°C is calculated to be +18.5°/oo
(Ohmoto and Rye, 1979). This is significantly different than the 634S value of +8.8°/oo measured in this study. The temperature at which the

60
Table 9. The relative sulfur Isotopic enrichment factors of thesulfur-bearing aqueous and mineral species in this study (from Ohmoto and Rye, 1979).
Ai-I 634S1 - 634S
Species
H2SeHS"
82-
all S0^ species (mineral and aqueous)
Ai-py (at 350"C) -1.03
-1.78
-4.77
+18.5
Pyrite
Chalcopyrite -1.16

61measured isotopic compositions of sulfide and sulfate minerals would
be in equilibrium, as calculated from the Ag^h-py value of 9.6°/oo and
the data of Ohmoto and Rye (1979), is nearly 620°C. This temperature is inconsistent with the temperature of vein formation determined from
fluid inclusion and mineral stability data, implying that sulfur
isotopic equilibrium was not established. This apparent isotopic
disequilibrium between the sulfide and sulfate minerals precipitated
from the mineralizing solution could have occurred for several
reasons, including: 1) non-systematic isotopic disequilibrium amongthe various sulfur-bearing species, 2) deposition of the sulfide and sulfate minerals from different solutions of varying isotopic
characters, 3) errors in the A values currently in use for sulfide -
sulfate mineral pairs or, 4) systematic isotopic disequilibrium among
the sulfur-bearing species. These possibilities will be discussed and
evaluated individually below.
Non-systematic isotopic disequilibrium:
Non-systematic isotopic disequilibrium would occur in a system
where the isotopic compositions of sulfur-bearing species not only " failed to reach, or approach, internally consistent equilibrium
values, but also deviated from the calculated equilibrium
distributions in an apparently non-systematic manner. If non-
systematic disequilibrium applies to the sulfur isotope system in this
study, then the sulfur isotopic composition of the ore-forming fluid
can not be calculated. While this possibility can not be ruled out,

62
the fact that sulfur Isotopes have, been demonstrated to behave
systematically in other similar hydrothermal systems (Field and
Gustafson, 1976; Ohmoto and Rye, 1979; Shelton and Rye, 1982) requires
that other possible explanations be considerd.
Deposition of minerals from isotopically distinct solutions:
The apparent isotopic disequilibrium observed in this study
could have arisen from the equilibrium precipitation of the sulfide
and sulfate minerals from isotopically distinct solutions; either from
two separate solutions using the same vein as a pathway or from the
same solution at different times as the sulfur isotopic composition
and/or the relative distribution of aqueous sulfur species in solution
varied.
The lack of observed reaction rims or replacement textures in
the vein-filling minerals is evidence that the minerals, once
deposited, were never significantly out of equilibrium with vein
fluids. It is unlikely that a second solution, encountering the vein
filling assemblage of an earlier solution, would be in equilibrium with all of the minerals previously deposited. Evidence for two
separate solutions is also lacking at a larger scale at Sierrita.
Preece and Beane (1982) report vein-filling assemblages from several
locations in the biotite quartz diorite which are nearly identical to
the assemblage present in this study. Field (1981), in an unrelated
study, reports 6^ S values for chalcopyrite and anhydrite from a single vein in the biotite quartz diorite at Sierrita of -1.l°/oo and

63
+9.7°/oo, respectively. These values are very similar to those
determined in this study (-2.0°/oo and +8.8°/oo, respectively), and the Aanh-cpy values in both cases are identical (10.8°/oo), indicating the same degree of sulfur isotopic disequilibrium in each vein. For a two
solution model to account for the apparent sulfur isotopic
disequilibrium, it would be necessary for both solutions to have circulated extensively throughout the biotite quartz diorite along the
same channel-ways. Further, as Preece and Beane (1982) have
documented a minimum of five discrete mineralizing cycles, the two solution model would require a minimum of five repetitions of the two
solutions, the second following the first along each vein as it
formed. Such a recurrence of two distinct solutions along each vein
seems improbable at best and is the major drawback of the two solution
model as an explanation for the observed isotopic relationships.
Evidence for the chemical evolution of the hydrothermal
solution with time is seen in the repeated 'potassic* to 'propylitic*
alteration sequences reported by Preece and Beane (1982). Changes in
the chemical conditions prevailing in the solution could have led to
the deposition, at different times, of sulfide and sulfate minerals
each of which was in isotopic equilibrium with the fluid at the time
of deposition. The isotopic composition of total aqueous sulfur, and
hence the isotopic composition of minerals precipitated from the
solution, could change with time as sulfur-bearing minerals were
deposited and/or dissolved. Alternately, changes in the physio/chemical conditions prevailing in the solution could change the

64
relative distribution of aqueous sulfur species in solution which,
while not affecting the sulfur isotopic composition of total aqueous
sulfur, would affect the isotopic compositions of the sulfide and
sulfate components.
Changes in the isotopic composition of aqueous sulfur is to be
expected as sulfur-bearing minerals are precipitated from, or
dissolved by, the hydrothermal solution. In each of the six veins
from the biotite quartz dlorite studied by Preece and Beane (1982),
the vein-filling mineralogy evolved from an early 'potassic' phase,
characterized by alkali feldspar and biotite, to a later 'propylitic'
phase, characterized by epidote, chlorite and sulfides. This
mineralogic evolution was accompanied by a 25 - 50oC decrease in
temperature. In five of the six veins they studied, anhydrite was
deposited with the 'potassic1 assemblage. However, sulfides were
notably absent from this early mineralization in all veins studied.
In general, 6^ S values for sulfate minerals at Sierrita fall in a fairly narrow range of +9 to +13°/oo (Ohmoto and Rye, 1979; this
study). As the sulfur isotopic fractionation between aqueous and
mineral sulfate species is negllgable (Ohmoto and Rye, 1979), a value
of +10°/oo may be considered representative of aqueous sulfates. The
equilibrium composition of coexisting aqueous sulfides, at 350 to
400°C would have been between -5 and -10°/oo and, at the aqueous
sulfide : sulfate ratio calculated in this study of 1 : 1, total aqueous sulfur would have been between 0 and +5°/oo.
65
Later solutions passing along the same channel ways coulddissolve previously deposited anhydrite. If the sulfur isotopic
compositions of the 'potassic' and 'propylitic* solutions were the
same originally (0 to 50/oo), the addition of sulfur with 6^ S - +10°/oowould increase the 6^ S value of total aqueous sulfur. Furthermore,
if the ratio of aqueous sulfide to sulfate were maintained at 1 : 1(this ratio being governed primarily by solution pH and fn ) then
2dissolution of enough anhydrite to yield a 6 value of total aqueous
sulfur of +8 to +10°/oo would allow the subsequent equilibrium34precipitation of sulfide minerals with 6 S values similar to those
measured in this study. In order to accomplish the required shift in
the isotopic composition of total aqueous sulfur, between two and ten
times the amount of sulfur originally present in the solution would have to be acquired by anhydrite dissolution.
In the vein-filling assemblage described in this study,
anhydrite and the sulfides pyrite and chalcopyrite were seen to be
part of the vein center assemblage. Textures indicating replacement
of anhydrite by the sulfides were not noted. Neither are indications
of anhydrite deposition and subsequent redissolution at Sierrita
reported in the literature. Thus this mechanism does not appear to be
the cause of the apparent isotopic disequilibrium.
Chemical evolution of the hydrothermal solution, and the attendant redistribution of the aqueous sulfur species could lead to
the observed mineral sulfur isotopic compositions without changing the
isotopic composition of total aqueous sulfur. For example, if at the

66time of anhydrite deposition the S ^ S value of aqueous sulfate was
+10°/oo, the equilibrium 6^ S value of aqueous sulfides would be near -10°/oo, at a temperature of roughly 350°C. If the ratio of aqueous
sulfide to sulfate in this solution was 1 : 3, the isotopic
composition of total aqueous sulfur would have been about +5°/oo. If,
over time, the aqueous sulfur was reduced to a 3 : 1 sulfide to
sulfate ratio, the S^S^g would remain unchanged, but the equilibrium 6 values of aqueous sulfides would now be near 0°/oo, and pyrite and chalcopyrite deposited from this solution would have
6"^S values comparable to those measured in this study.At the pH calculated in this study (5.8), a decrease of 1/2
log fg^ unit could be sufficient to change the aqueous sulfide to
sulfate ratio from 1 : 3 to 3 : 1. Such a reduction would be expected in a solution moving from a relatively felsic rock (the quartz
monzonite porphyry) to a more mafic one (the biotite quartz
diorite). Conversely, at the fg^ calculated in this study (log f “
-27.5), a decrease of 1 pH unit could also serve to effect the
required species redistribution. These effects of changes in solution
chemistry can be seen graphicaly in Figure 10. The 1/2 log fg^ unit
shift from sulfate to sulfide dominance would, at the pH calculated in
this study, require a change from the solution being hematite stable
to magnetite stable. A shift from hematite to magnetite is not seen
in the vein studied, nor was hematite found in more than trace amounts
in other veins in the biotite quartz diorite by Preece and Beane
(1982). However, the relatively minor amounts, or even absence, of

67hematite does not necessarily preclude the solution having been stable
with respect to hematite relative to magnetite. Reduction of such a
fluid by reactions with the more mafic minerals in the biotite quartz
dlorite could well be the cause of sulfide deposition, while anhydrite
stability was maintained by the addition of calcium from the
alteration of wall rock plagioclase and hornblende discussed
previously.Changes in the isotopic composition of total aqueous sulfur
due to dissolution of previously deposited sulfates does not appear to
be a reasonable explanation of the apparent isotopic disequilibrium
found in this study. However, chemical evolution of the solution,
specific decreasing fg^ or pH resulting in changes in the relative
distribution of aqueous sulfur species, could have led to the observed
isotopic compositions. In either case it is not possible to directly
calculate the isotopic composition of total aqueous sulfur because the
deposition of the sulfides and sulfates occurred at different times
from changing solutions. However, both models do place constraints on
total aqueous sulfur, limiting possible values to between -5 and
+10°/oo.
Errors in the isotopic enrichment factors:
The generally accepted isotopic enrichment factors for
sulfide-sulfate isotopic fractionations reported in the literature were derived from theoretical considerations (Sakai, 1968). The
apparent isotopic disequilibrium found in this study could have arisen

from errors in these values. However, evaluation of such a
possibility is beyond the scope of this study.
Systematic isotopic disequilibrium:
Systematic isotopic disequilibrium, or heterogeneous isotopic
equilibrium is the condition where isotopic equilibrium is established
among the sulfide species and among the sulfate species but not between them. Shelton and Rye (1982) suggested this as an explanation
for similar apparent isotopic disequilibrium observed at the Gasp6 porphyry copper deposit. Such isotopic disequilibrium would not
necessarily imply chemical disequilibrium between the sulfur-bearing
species, but rather that isotopic equilibration is slow relative to
chemical reaction rates involving sulfides and sulfates. The isotopic
compositions of aqueous sulfide and sulfate species could be inherited
from earlier solution conditions and preserved meta-stably in the
solution until the time of mineralization in the studied vein. For
example, at 'magmatic' temperatures of roughly 700°C, the equilibrium
^sulfate-sulfide value *s +4 to +5°/oo (Ohmoto and Rye, 1979). If, after establishing the isotopic compositions of species at such a
temperature, the fluid was cooled rapidly, relative to the time
required for sulfide-sulfate isotopic equilibration such that sulfur isotopic equilibrium was not reached, the resulting values of
minerals precipitated from the solution might exhibit Asuifate_suifide values similar to those measured here. Other possible mechanisms resulting in a systematic isotopic disequilibrium include: relatively
68

69
rapid mixing of sulfide- and sulfate- rich fluids, local dissolution
of sulfur-bearing minerals, or relatively rapid changes in solution
chemistry.
Regardless of the cause, or causes, of the isotopic
disequilibrium between the aqueous sulfides and sulfates, if the
departure from equilibrium is systematic with a heterogeneous isotopic
equilibrium established among the sulfides and sulfates independently,
then calculation of the isotopic composition of total aqueous sulfur
can be accomplished by considering sulfides and sulfates separately.
Isotopic equilibrium among the sulfates implies that the +8.8°/oo 6^ S value measured for anhydrite is representative of all aqueous sulfates
(Ohmoto and Rye, 1979). The 6^ S values of aqueous sulfides can be calculated from the isotopic composition of pyrite and the isotopic
enrichment factors listed in Table 9. The isotopic compositions of
the various sulfur species calculated under the assumption of a
systematic disequilibrium are listed in Table 8. Employing these
values along with the molar distribution of aqueous sulfur species
previously calculated in Equation 5 yields an isotopic composition of
total aqueous sulfur of +3.5°/oo.
DiscussionIf the isotopic disequilibrium is a result of non-systematic
sulfur isotopic fractionations, or the result of depositions of the
vein-filling minerals from two or more different solutions, then the calculation of isotopic composition of total aqueous sulfur is not

70
possible. This possibility can not be overlooked. However, similar
apparent sulfur isotopic disequilibrium behavior has been shown to be
systematic in its departure from equilibrium in two other porphyry
copper systems. For the Gasp6 porphyry copper deposit in Quebec,Canada and the El Salvador porphyry copper deposit in Chile, Shelton
and Rye (1982) have suggested that the sulfur isotopic data imply a
systematic disequilibrium or heterogeneous equilibrium, where sulfur
isotopic equilibrium existed among the sulfide species and among the
sulfate species, but not between the two sets of species. If this
concept is applied to the Sierrita porphyry copper deposit, then the
isotopic compositions of aqueous sulfide and sulfate species can be
calculated independently from the measured isotopic compositions of
sulfide and sulfate minerals precipitated from the solution. The
sulfur isotopic composition of total aqueous sulfur in the
hydrothermal solution responsible for mineralization calculated under
the assumption of systematic isotopic disequilibrium is 6^ S y c ■i0aq+3.5°/oo.
The significance of this calculated isotopic composition of
aqueous sulfur is illustrated in Figure 10, a summary of the
characteristic sulfur isotopic signatures of generalized sulfur
sources. Sulfides of igneous origin generally have 6^ S values near 0 °/oo(± 5P/oo). Sedimentary sulfides (commonly biogenic) have a very
large range of values, but are usually isotopically light, having
large negative 6^ S values. Sedimentary sulfates (evaporites)
generally have positive 5^ S values between +10 and +30°/oo. The line

71
-40 -20l r
Igneous Sulfides
Sedimentary Sulfides
o# r
A. Meteorites
I_____ i_____ i_____ I
Figure 10. S values typical of various generalizedsulfur resevoirs.The insert indicates the changes in the sulfur isotopic composition of marine evaporite sulfates with time in the Phanerozoic. 0% is defined as the sulfur isotopic composition of the mineral troilite from the Canon Diable meteorite. From Ohmoto and Rye, 1979.
72
in the insert in Figure 10 shows the variation in 6^ S values ofmarine evaporite sulfur through the Phanerozoic. The 5 ^ S r<; =LOaq+ 3.5°/oo calculated above indicates a probable igneous source for the aqueous sulfur. It is important to note here that an indicated
igneous source does not necessarily imply a 'magmatic' origin for the
sulfur, because no distinction is, or can be, made between sulfur
evolved from a cooling or crystalizing magma (a syn-mineralization
intrusive) and sulfur leached from pre-mineralization intrusive rocks
by circulating hydrothermal fluids.
When calculated, or measured, sulfur isotopic compositions of
aqueous sulfur are used to determine the source of sulfur in
hydrothermal fluids, it is implied that the composition calculated for
the mineralizing solution accurately represents the original isotopic
composition of the hydrothermal fluid upon obtaining its sulfur.
However, the fluid depositing the minerals seen in the vein studied
here has an uncertain and potentially complex history between the time
the solution acquired its sulfur and the time of deposition of the
minerals in the vein studied. The precipitation of minerals from the
solution prior to deposition at this vein could have changed the
isotopic composition of the fluid by selectively removing relatively
heavy, or light, sulfur from the fluid into the mineral phases. Since
the ultimate source of the sulfur is best represented by the isotopic
composition of the fluid prior to deposition of any sulfur-bearing
minerals, it is necessary to modify Equation 5 in order to account for
this previously precipitated sulfur:

73
634g(634S,
original + 34sJ ‘ "j*(mzs + l “ i )
(65)
In this equation, * and 'ny' are the isotopic composition and
number of moles per 1000 g of HgO, respectively, of sulfur precipitated as mineral phase(s) 'j ' prior to the arrival of the
solution at the point in the system represented by the studied vein.To relate the S ^ g value calculated in this paper to that
£1>aqof the original hydrothermal fluid requires knowledge of the identity
and number of moles of the sulfur-bearing minerals which have
precipitated from (and/or been dissolved by) the solution along its
path to the point at which the sample was collected for study. It is beyond the scope of this study to attempt a rigorous determination of
these parameters. However, the effects of previous depositions can be
evaluated qualitatively. Immediately prior to arrival at the studied
vein, a sulfate mineral precipitated from the solution would have a
6 3^5 value, of near 9°/oo, which is 5°/oo heavier than the solution from which it precipitated. This means that the d34g 0f the solution
immediately prior to deposition of this sulfate was greater than it
was afterwards. Conversely, a sulfide mineral deposited immediately
prior to arrival at the studied vein would have a 63^S value on the order of -2°/oo, indicating an isotopically lighter original solution.
Estimates of the amounts of sulfide and sulfate minerals
deposited from the solution can be made. If, for example, it is

74assumed that the mineralogy of the studied vein Is representative of
minerals previously precipitated from the fluid, then the predominance
of sulfides over anhydrite (visually estimated to be 5 : 1) in the hand sample would indicate a lower original 6^ S of solution than that calculated here. However, a comparison of fluid inclusion data and
mineralogy of the studied vein with those of Preece and Beane's BQD -
02 vein (Table 3) indicates that the vein studied here corresponds to
the later 'propylitic' portion of a mineralizing cycle. In each of
the cycles documented by Preece and Beane (1982), deposition of a
'potassic' assemblage, often containing anhydrite but not sulfides,
preceded the 'propylitic' phase which commonly contained both
anhydrite and sulfides. If it is assumed that the solution
responsible for mineralization in the studied vein had a history
similar to those documented by Preece and Beane, then a significant
amount of anhydrite might have been deposited elsewhere in the
'potassic' assemblage and not be represented in the vein assemblage
seen in this study. For example, if the original solution had
deposited an amount of anhydrite equivalent to the amount of sulfur
determined to have been present when formation of the vein occurred
(i.e., the original solution contained twice as much dissolved sulfur
as the solution forming the vein studied), then the solutions original
6^ S value would have been approximately +7°/oo. In order to shift the
sulfur isotopic composition of the solution to an original value
compatible with a sedimentary sulfate source of the aqueous sulfur (i.e. to +10°/oo) it would be necessary for the original fluid to have

75
contained nearly ten times the 0.004 molal concentration of sulfur
calculated for the mineralizing solution in this study and 90% of that
original sulfur would have to have been precipitated as anhydrite.
Such large amounts of anhydrite, relative to the amounts of sulfide
present at Sierrita, have not been found. Thus prior deposition can
not be invoked to account for the relatively light 6^ S of the solution if the sulfur was originally from a sedimentary source.
However, some contribution from such a sulfate source to the total
sulfur content of the solution can not be ruled out.
The establishment of equilibrium is an assumption which is
behind the chemical and isotopic calculations made in this study, yet
the measured 6^ S values of the sulfide and sulfate minerals present in the vein indicate a system which is not completely in
equilibrium. The preceding discussions of potential causes of sulfur
isotopic disequilibrium all assumed a system in which vein-filling
minerals and the hydrothermal solution were in chemical equilibrium.
And yet, the deposition of the minerals may well have been the product
of a solution, out of equilibrium with its surroundings, attempting to
move towards equilibrium. If chemical equilibrium was not reached, or
at least closely approximated, then not only must the behavior of the
isotopes in sulfur-bearing species be questioned, but the calculated
distribution of aqueous sulfur species must also be suspect. Ohmoto
and Lasaga (1982), in their study on aqueous sulfide and sulfate
kinetics, suggest that for a cooling hydrothermal fluid in a fracture
controlled system at temperatures below about 350°C, the attainment of

76
sulfide-sulfate equilibrium is not to be expected. Minerals deposited from a solution out of equilibrium with its surroundings may lock into
their compositions signatures of a chemical environment intermediate
to those which might best describe the solution and the
surroundings. Further, the ’assemblage’ of minerals precipitated
under such conditions may be the result of various segments of the solutions' chemistry attempting to equilibrate with their surroundings rather than the solution as a whole depositing an 'equilibrium
assemblage', strictly defined.
Because of the uncertainties in both the sulfur isotopic and
chemical behavior of a system not at, or near, equilibrium, the
isotopic composition of total aqueous sulfur can not be calculated
with any degree of confidence under such conditions. However, some
constraints can be placed on the nature of aqueous sulfur at
Sierrita. Since the sulfur isotopic fractionation is negligible among
sulfate species, both aqueous and mineral, the isotopic composition of
anhydrite is a measure of the composition of the aqueous sulfates.
The narrow range in 6^ S values of sulfate minerals (anhydrite and gypsum) determined at Sierrita (+9 to +13°/oo) indicates a 6^ S value consistent with a marine evaporite, specifically one of Permian age,
as the source of aqueous sulfates. Similarly, Shelton and Rye (1982)
demonstrated that aqueous and mineral sulfides may establish
equilibrium relatively quickly in porphyry copper deposits. If this
is the case at Sierrita, then the measured isotopic compositions of
the pyrite and chalcopyrite imply that the sulfide fraction of total

aqueous sulfur had an isotopic composition between -5 and 0°/oo, a
range most consistent with an igneous sulfur source. The relative importance of these two potential sulfur sources is proportional to
their relative molalities in solution, which in turn is governed by
solution chemistry and the degree of equilibrium established in the system.
77

SUMMARY AND CONCLUSIONS
When applying sulfur isotopy to problems in the origins of
mineralization in porphyry copper systems it is necessary to determine
the sulfur isotopic composition of the hydrothermal solution from
which the ores formed. In a system at equilibrium, the 6^ S value of aqueous sulfur can be calculated from a knowledge of the physio-
chemical parameters governing the distribution of aqueous sulfur
species (temperature, pressure, ionic strength, oxygen fugacity, pH
and the activities of the Na+ , K+ and Ca^+ ions in the solution)
combined with the isotopic composition of a sulfur-bearing mineral
precipitated from the solution. In order to minimize problems arising
from spatial and temporal variations in solution conditions within the
system, these parameters were determined from a single vein from the
Sierrita porphyry copper deposit. Based on the assumption of solution
- mineral equilibrium the following information was obtained:1) From fluid inclusion analysis of vein quartz the temperature,
pressure and ionic strength (salinity) of the solution were found to
be 350°C, 330 bars and 1.14 molal NaCl equivalent, respectively.
2) From equilibrium mineral stability and composition data the
following were caluclated; log fQ^ = -27.5, pH = 5.8, aNa+ «=
6.3 x 10~2, aK+ - 9.8 x 10~3, and aCa2+ = 1.0 x 10⁻⁵.
78
79
From these data the relative molar distribution of aqueous
sulfur species is calculated to be; l^S0 * 49.5%, HS~ ■ 0.6%, S0|~=
10.8%, HSO^ = 37.4% and KSO4 = 1.7%. Other species, while present,
are not significant under these conditions.The measurement of 6^ S values of apparently coexisting
sulfide (pyrite - -0.8°/oo, chalcopyrite = -2.0°/oo) and sulfate (anhydrite ■ +8.8°/oo) minerals are not compatable with isotopic equilibrium at, or near, 350°C, the sulfur isotopic temperature of
formation indicated by these measurements being 620eC. These disequilibrium 6^ S values for the vein-filling minerals bring into question the assumption of equilibrium behind all the chemical and
isotopic calculations made in this study, making any determination of
the sulfur isotopic composition of aqueous sulfur questionable.
However, assuming that chemical equilibrum was at least
approached, as suggested by the petrographic relationships observed among the vein-filling minerals and the similarity of the results of
this study with those reported from other porphyry copper deposits,
and assuming heterogeneous isotopic equilibrium among the sulfur
bearing species, based on the relatively slow sulfur isotopic
equilibration of sulfide and sulfate species, the isotopic composition
of total aqueous sulfur is calculated to be +3.5°/oo. This value is
most compatible with an igneous sulfide source for the sulfur.
Consideration of the two disequilibrium sulfur populations, sulfides
and sulfates, separately tends to indicate a dual sulfur source. The

806^ S values of aqueous sulfide (-5 to 0°/oo) Implying an Igneous sulfur source while the 5^ S values of sulfates ( *» + 10°/oo) is best explained by a (Permian) sedimentary sulfate sulfur source.

APPENDIX At
SEMQ Analyses:
Compositions of minerals used in this study were determined at
the University of Arizona, Department of Planetary Sciences, on an ARL
Scanning Electron Microprobe Quantometer (SEMQ) together with a
Tracor-Northern system for the reduction of data. Internal laboratory
standards whose compositions are accurately known were used to
calibrate the system. Elements analyzed for in the feldspars and
epidotes were: Na, K, Ca, Al, Si, Mg, Mn, Fe and Ti. The results are
expressed as weight percent oxides. The SEMQ is not capable of2+ 34.distinguishing between Fe and Fe in its analyses, so total iron
has been assumed to be in the ferric state and given as FegOg.
The results have been recalculated into mineral compositions
based on the number of oxygens in the ideal mineral formula. Since
structural water can not be measured on the SEMQ, it has been deleted from the mineral composition calculations of the epidotes. For the
feldspars, the mineral composition was based on eight oxygens, epidote
compositions are based on twelve and one half oxygens.
Analyses of the fused sulfide powder were for the elements Cu,
Fe and S. Qualitative analyses indicated that only trace amounts of
other base metals were present. Results from these analyses are given
in weight percent of each element in the sample.
81

Appendix ATable 1. SEMQ Analyses, of Feldspars
Oxide Weight Percent
1 2 3 4
Na20 5.93 7.41 7.35 8.56
k 2o 0.11 0.18 2.75 0.13CaO 9.64 6.56 1.74 2.07
s io 2 54.69 58.64 59.01 65.43
a 12°3 27.34 24.88 24.38 18.80
Fe2°3 0.22 0.25 0.19 0.08Totals 97.93 97.92 95.42 95.07
Molecular Formula Based on 8 OxygensNa 0.53 0.65 0.66 0.76
K 0.01 0.01 0.16 0.01Ca 0.47 0.32 0.09 0.10Si 2.51 2.67 2.74 2.99A1 1.48 1.33 1.33 1.01Fe(III) 0.01 0.01 0.01 — ■■ Ml
5 6 7 8 9
8.89 5.82 6.42 7.28 6.90
0.13 0.55 0.14 0.16 0.162.39 7.80 8.10 6.55 6.94
61.87 52.22 55.68 57.48 57.5622.68 27.13 26.33 25.07 25.43
0.17 0.25 0.08 0.07 0.1296.99 93.77 96.75 96.61 97.11
0.78 0.54 0.58 0.65 0.61
0.06 0.03 0.01 0.01 0.010.12 0.40 0.40 0.32 0.34
2.81 2.50 2.57 2.65 2.64
1.22 1.53 1.43 1.36 1.37
0.01 0.01coto
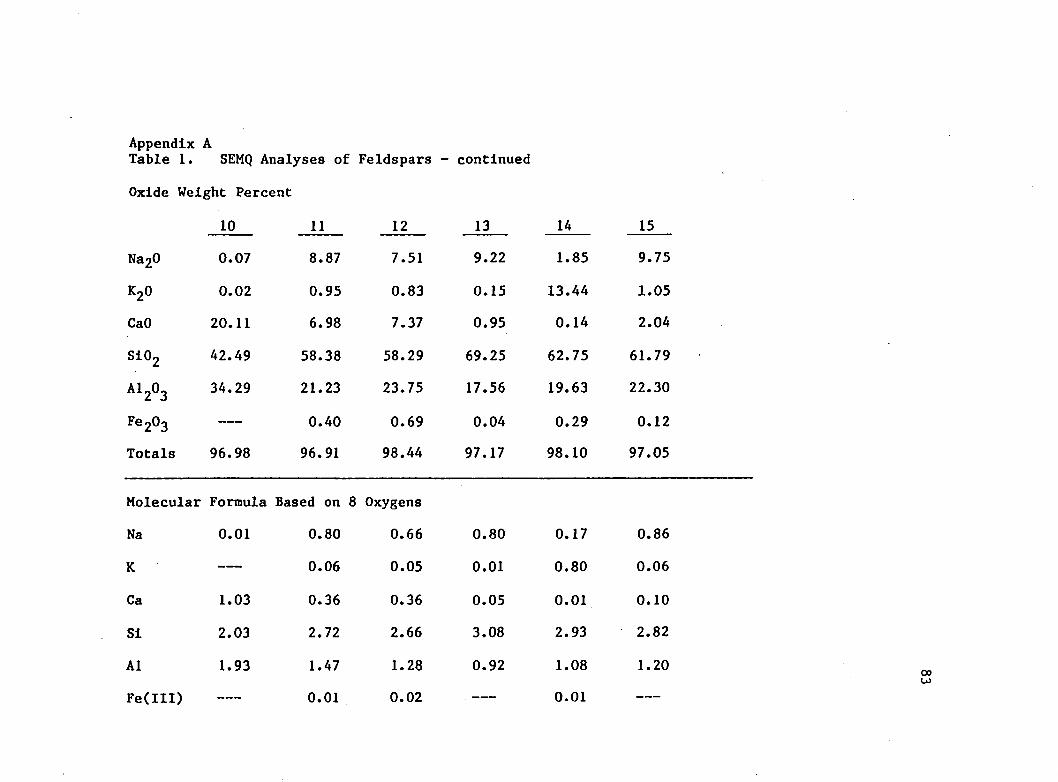
Appendix ATable 1. SEMQ Analyses of Feldspars - continued
Oxide Weight Percent
10 11 12 13
Na20 0.07 8.87 7.51 9.22
k2o 0.02 0.95 0.83 0.15
CaO 20.11 6.98 7.37 0.95
Si02 42.49 58.38 58.29 69.25
A12°3 34.29 21.23 23.75 17.56
Fe2°3 -— 0.40 0.69 0.04Totals 96.98 96.91 98.44 97.17
Molecular Formula Based on 8 OxygensNa 0.01 0.80 0.66 0.80
K — 0.06 0.05 0.01Ca 1.03 0.36 0.36 0.05
Si 2.03 2.72 2.66 3.08
A1 1.93 1.47 1.28 0.92
Fe(III) 0.01 0.02
14 151.85 9.75
13.44 1.050.14 2.04
62.75 61.79
19.63 22.30
0.29 0.1298.10 97.05
0.17 0.860.80 0.06
0.01 0.102.93 2.82
1.08 1.200.01 — ■' ■
00u>

Appendix ATable 2. SEMQ Analyses of EpidotesOxide Weight Percent
1 2 3 4NagO 0.02 0.07 — 0.03k 2° 0.01 0.01 — —CaO 22.05 22.08 22.07 22.56A12°3 21.99 22.36 19.80 19.69Fe203 15.21 15.31 18.79 18.26MnO 0.31 0.30 0.09 0.01Ti02 — 0.06 — —— 0.01S102 37.07 37.74 36.65 36.83TotalsMolecular
96.66Formula
97.93 Based on
97.4012.5 Oxygens
97.39
Na — 0.01 —- —K — — — — — — — — —Ca 1.99 1.96 2.02 2.06A1 2.19 2.19 2.00 1.98Fe(III) 0.97 0.96 1.21 1.18Mn 0.02 0.02 0.01 —Ti — — — —Si 3.31 3.14 3.14 3.15
Fe/Fe+Al 0.92 0.91 1.13 1.12
5
17.4415.4612.820.130.0452.6998.58
1.411.380.730.01
3.97
1.04
60.02
25.7119.8913.190.390.0532.3891.63
2.412.050.860.03
2.83
0.89
70.020.01
22.3719.8018.470.10
36.5197.28
1.961.911.140.01
2.98
1.12
8
22.6822.9514.350.160.06
36.9497.14
1.962.180.860.01
2.98
0.85 CO4N

Appendix ATable 2. SEMQ Analyses of Epidotes - continuedOxide Weight Percent
9 10 11 12Na20 0.06 0.01 0.03 -——k 2o — 0.01 — 0.01CaO 22.63 21.40 22.41 22.34A12O3 21.65 22.05 19.24 21.73Fe2°3 15.96 15.11 19.32 15.44MnO 0.09 0.73 0.09 0.17Ti02 0.05 0.06 -— 0.03Si02 37.06 35.61 36.16 36.07Totals 97.50 94.98 97.25 95.79Molecular Formula Based on 12.5 OxygensNa 0.01 ——— — —K.Ca 1.96 1.90 1.97 1.97A1 2.06 2.16 1.86 2.10Fe 0.97 0.94 1.20 0.96Mn 0.01 0.05 0.01 0.01TiSi 2.99 2.95 2.97 2.97
Fe/Fe+Al 0.96 0.91 1.17 0.94
130.010.02
22.5521.5415.510.120.06
36.1295.91
14
0.0221.9220.5017.000.06
36.3895.88
150.020.0122.3121.9115.240.080.0236.5796.16
160.03
22.3021.4915.840.170.0536.2296.10
1.98 1.94 1.95 1.962.08 1.99 2.11 2.070.96 1.05 0.94 0.980.01 -- . 0.01 0.01
2.97 3.00 2.99 2.97
0.95 1.04 0.92 0.96ooin

Appendix ATable 2. SEMQ Analyses of Epidotes - continuedOxide Weight Percent
17 18 19 20NagO — 0.01 0.12 0.02k2o 0.02 0.07 0.04 0.03CaO 22.30 21.74 21.58 22.43Al203 18.36 18.50 18.64 20.95Fe2°3 17.70 16.61 15.88 13.70MnO — 0.18 0.25 0.07Ti02 ----— — — 0.01Si02 36.87 36.94 36.98 37.18Totals 95.29 94.05 93.49 94.39Molecular Formula Based on 12.5 OxygensNa — — 0.02 —
K — 0.01 — —
Ca 1.91 1.88 1.87 1.91A1 1.73 1.76 1.78 1.96Fe 1.06 1.01 0.97 0.82Mn ——— 0.01 0.02 —
11Si 2.95 2.98 2.99 2.95
Fe/Fe+Al 1.14 1.09 1.06 0.88
21
0.0321.7016.5516.920.08
36.7292.00
22
0.0321.8517.6014.970.430.0536.8191.74
230.010.03
21.1716.9715.380.04
36.3091.26
240.020.0419.7513.9315.91 0.08 0.0243.1792.92
1.92 2.01 1.98 1.771.61 1.78 1.75 1.371.05 0.97 1.00 1.000.01 0.03 0.01 0.01
3.04 3.16 3.17 3.59
1.18 1.06 1.10 .1.2700o\

Appendix ATable 2. SEMQ Analyses of Epidotes - continued Oxide Weight Percent
25 26Na20 0.04 0.07K20 0.02 — —CaO 22.57 22.87A1203 22.89 21.97Fe203 14.58 15.52MnO 0.10 0.22Ti02 0.05 0.39Si02 36.75 37.84Totals 97.00 98.88Molecular Formula Based on 12.5 OxygensNa 0.01 0.01
Ca 1.95 1.95A1 2.18 2.04Fe 0.89 0.93Mn 0.01 0.02Ti --- 0.02Si 2.97 3.01
Fe/Fe+Al 0.87 0.94oo
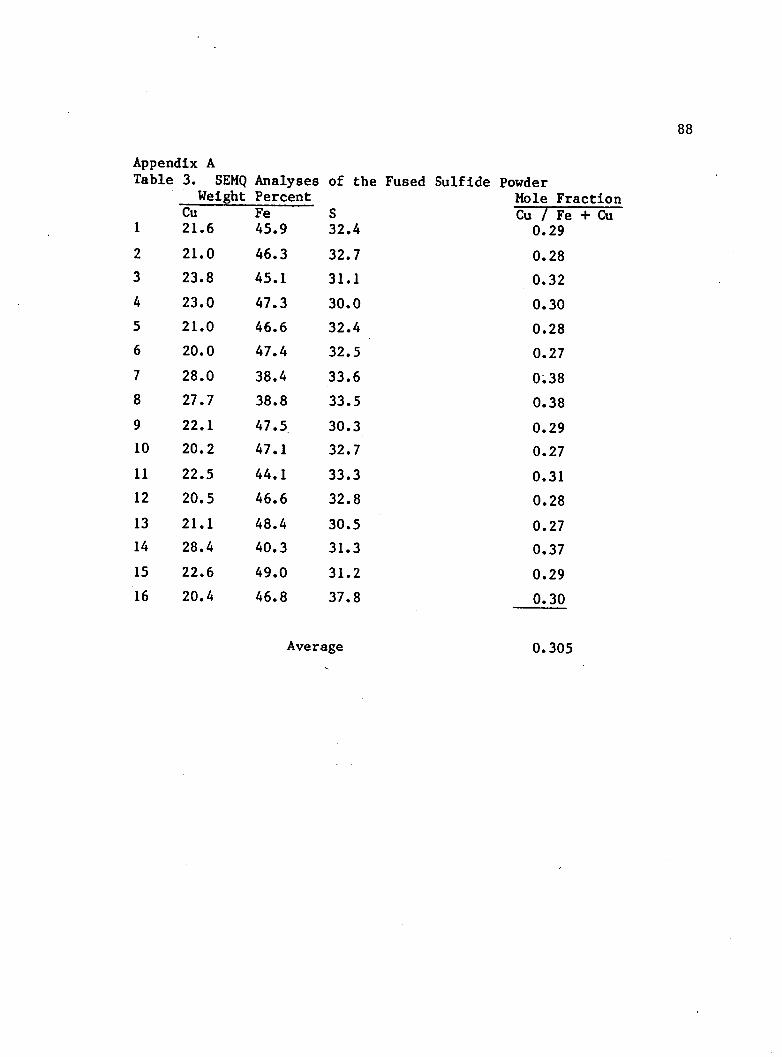
Appendix ATable 3. SEMQ Analyses of
Weight PercentCu Fe S
1 21.6 45.9 322 21.0 46.3 323 23.8 45.1 314 23.0 47.3 305 21.0 46.6 326 20.0 47.4 327 28.0 38.4 338 27.7 38.8 339 22.1 47.5 3010 20.2 47.1 3211 22.5 44.1 3312 20.5 46.6 3213 21.1 48.4 3014 28.4 40.3 3115 22.6 49.0 3116 20.4 46.8 37
Fused Sulfide PowderHole Fraction Cu / Fe + Cu
0.290.280.320.300.280.270.380.380.290.270.310.280.270.370.290.30
the
471045653738532
8
Average 0.305

LIST OF SYMBOLS AND ABBREVIATIONS
Symbol Explanation
Sulfur isotopic composition of species 'i*
^a-b Sulfur isotopic enrichment factor
“a-b Sulfur isotopic fractionation factor
“ aq Total aqueous sulfur
xi Mole fraction represented by species 'i*
“i Molality of species 'i* in solution
al Activity of species *1' in solution
% Equilibrium reaction constant for reaction ’i'
f °2Fugacity of oxygen
Y i Individual ion activity coefficient
Stoichiometric ion activity coefficient
th Fluid inclusion homogenization temperature
Abbreviation Mineral
AbAnanhbiochiclinocpyepidgrhemmgtmoOrpyqtzser
Sodium FeldsparCalcium FeldsparAnhydriteBiotiteChloriteClinozoisiteChalcopyriteEpidoteGrossular GarnetHematiteMagnetiteMolybdenitePotassium FeldsparPyriteQuartzSericite (Muscovite)
89

LIST OF REFERENCES
Aiken, D. M., and West, R. J., 1978, Some geologic aspects of the Slerrlta-Esperanza copper-molybdenite deposit, Pima County, Arizona; Arlz. Geol. Soc. Digest, vol. 11, p. 117-128.
Ault, W. V., and Jensen, M. L., 1963, Summary of sulfur isotopestandards, lii Biogeochemistry of Sulfur Isotopes, Jensen, M. L. (ed.), Natl. Sci. Found. Proc., Yale Univ., April 12-14, 1962, p. 16-29.
Banks, N. G., 1980, Sulfur and copper in magmas and rocks, in Advances in Geology of the Porphyry Copper Deposits, Southwestern North America, Titley, S. R. (ed.), Univ. of Ariz. Press, Tucson, 560P*
Bird, D. K., and Helgeson, H. E., 1980, Chemical interaction ofaqueous solutions with epldote-feldspar mineral assemblages in geologic systems, I, Thermodynamic analysis of phase relations in the system CaO-FeO-FeoOq- AloOo-SiOo-HoO-COot Am. Jour. Sci., vol. 280, p. 907-941.
Bird, D. K, 1982, personal communication, research associate.Department of Geosciences, University of Arizona, Tucson.
Chaffee, M. A., 1982, A geochemical study of the Kalamazoo porphyry copper deposit, in Advances in Geology of the Porphyry Copper Deposits, Titley, S. R. (ed), Univ. of Ariz. Press, Tucson,560p.
Cooper, J. R., 1973, Geologic map of the Twin Buttes quadrangle,southwest of Tucson, Arizona: U. S. Geol. Surv. Misc. Geol.Inv., Map 1-745.
Denis, M., 1974, Alterations et fluides associes dans le porphyre cuprifere de Serrits: Unpublished Disertation, 3° Cycle, University of Nancy, France, 149 p.
Faure, G., 1977, Principles of Isotope Geochemistry, John Wiley and Sons, Inc., New York, 464 p.
Fellows, M. L., 1976, Composition of epidote in porphyry copperdeposits: Unpublished Masters Thesis, Univ. of Arizona., Tucson, 190 p.
Field, C. W. and Gustafson, L. B., 1976, Sulfur Isotopes in theporphyry copper deposit at El Salvador, Chile: Econ. Geol., v. 71, p. 1533-1548.
90

91
Field, C. W., 1981, personal communication, Professor, Department of Geology, Oregon State University, Corvallis.
Garrells, R. M., and Christ, C. L., 1965, Solutions, Minerals and Equilibria: Freeman, Cooper and Co., San Francisco, 450p.
Haynes, F. M., 1980, The evolution of fracture-related permiability within the Ruby Star granodiorite, Sierrita porphyry copper deposit, Pima County, Arizona: Econ. Geol. vol. 75, p. 673 - .
Helgeson, H. C., 1969, Thermodynamics of hydrothermal systems atelevated temperatures and pressures: Am. Jour. Sci., vol. 267,p. 729-804.
________ , and Kirkham, D. H., 1974, Theoretical prediction of thethermodynamic behavior of aqueous electrolytes at high pressures and temperatures; Parts I and II: Am. Jour. Sci., vol. 274, p. 1089-1261.
________ , Delany, J. M., Nesbitt, H. W., and Bird, D. K., 1978,Summary and critique of the thermodynamic properties of rockforming minerals: Am. Jour. Sci., vol. 278-A, p. 1-229.
Lynch, D. W., 1966, The economic geology of the Esperanza mine andvicinity, in Geology of the Porphyry Copper Deposits, Titley, S. R., and Hicks, C. L. (eds.), Univ. of Ariz. Press, Tucson, p. 267-279.
Nash, J. T., 1975, Fluid-inclusion petrology - data from porphyry copper deposits and applications to exploration: U. S. Geol.Surv. Prof. Paper 907-D, 16p.
Ohmoto, H., 1972, Systematics of sulfur and carbon isotopes inhydrothermal ore deposits: Econ. Geol. vol. 67, p. 551-579.
______ , and Rye, R. 0., 1979, Isotopes of sulfur and carbon, inGeochemistry of Hydrothermal Ore Deposits, second edition,Barnes, H. L. (ed.), John Wiley and Sons, Inc., New York, p. 509-567.
______ , and Lasaga, A. C., 1982, Kinetics of reactions between aqueoussulfates and sulfides in hydrothermal systems: Geoch. andCosomoch. Acta, v. 46, p. 1727.
Parsons, I., 1978, Alkali-feldspars: which solvus?, in Physics and Chemistry of Minerals, vol. 2, p. 199-213.
References— continued

92
Potter, R. W., Jr., 1977, Pressure corrections for fluid-inclusion homogenization temperatures based on volumetric properties of the system NaCl-H.O: U. S. Geol. Surv. Journ. Res., vol. 5, no.5, p. 603-607.
______ , Clynne, M. A., and Brown, D. L., 1978, Freezing pointdepression of aqueous sodium chloride solutions: Econ. Geol.,vol. 73, p. 284-285.
Preece, R. K., III, 1979, Paragenesis, geochemistry and temperatures of formation of alteration assemblages at the Sierrita deposit, Pima County, Arizona: Unpublished Masters Thesis, Univ. of Ariz., Tucson, 106 p.
________ , Beane, R. E., 1982, Contrasting evolutions of hydrothermalalteration in quartz monzonite and quartz diorite wall rocks at the Sierrita Porphyry Copper Deposit, Arizona: Econ. Geol., v.77, p. 1621-1641.
Roedder, E., 1972, Composition of fluid inclusions: U. S. Geol. Surv. Prof. Paper 440-JJ, 164 p.
_______ , 1979, Fluid inclusions as samples of ore fluids, inGeochemistry of Hydrothermal Ore Deposits, second edition, Barnes, H. L. (ed.), John Wiley and Sons, Inc., New York, p. 648-737.
Rye, R. 0., and Ohmoto, H., 1974, Sulfur and carbon isotopes and ore genesis; a review: Econ Geol., vol. 69, -. 826-842.
Sakai, H., 1968, Isotopic properties of sulfur compounds inhydrothermal processes: Geochem. Jour., vol. 2, p. 29-49.
Saxena, S. K., 1973, Thermodynamics of Rock-Forming Crystalline Solutions; Springer-Verlag, New York, 188 p.
Shelton, K. L., and Rye, D. M., 1982, Sulfur isotopic compositions of ores from Mines Gaspe, Quebec: an example of sulfate-sulfide isotopic disequilibrla in ore-forming fluids with applications to other porphyry-type deposits: Econ. Geol., v. 77, p. 1688-1709.
Smith, V L., 1975, Hypogene alteration at the Esperanza Mine, Pima county, Arizona: Unpublished Masters Thesis, Univ. Of Ariz.,Tucson, 161 p.
References— continued
93
Thompson, R. C., 1981, The development of fractures in the mesozoicvolcanic rocks adjacent to the Sierrita porphyry copper deposit, Pima County, Arizona: Unpublished Masters Thesis, Univ. of Ariz., Tucson, 85 p.
Turekian, K. K., 1972, Chemistry of the Earth, Holt Rinehart and Winston, Inc., 131 p.
Waldbaum, D. R., and Thompson, J. B., Jr., 1969, Mixing properties of sanadine crystalline solutions; IV, phase diagrams from equations of state: Am. Mineralogist, vol. 54, p. 1274-1298.
West, R. J., and Aiken, D. M., 1982, Geology of the Sierrita-Esperanza deposit, Pima Mining District, Pima County, Arizona, in Advances in Geology of the Porphyry Copper Deposits, Southwestern North America, Titley, S. R. (ed.), Univ. of Ariz. Press, Tucson,560 p.
References— continued
'

I


![PREPARATION AND CHARACTERIZATION OF [FeFe ...arizona.openrepository.com/arizona/bitstream/10150/...PREPARATION AND CHARACTERIZATION OF [FeFe]-HYDROGENASE ACTIVE SITE MIMICS STUDIED](https://img.pdfslide.us/doc/110x75/5acc509c7f8b9a875a8c735d/preparation-and-characterization-of-fefe-and-characterization-of-fefe-hydrogenase.jpg)