Embed Size (px)
Citation preview
Dispersion patterns as a possible guide to ore depositsin the Cerro Colorado district, Pima County, Arizona
Item Type text; Thesis-Reproduction (electronic); maps
Authors Chaffee, Maurice A.
Publisher The University of Arizona.
Rights Copyright © is held by the author. Digital access to this materialis made possible by the University Libraries, University of Arizona.Further transmission, reproduction or presentation (such aspublic display or performance) of protected items is prohibitedexcept with permission of the author.
Download date 08/06/2018 09:05:42
Link to Item http://hdl.handle.net/10150/553998
DISPERSION PATTERNS AS A POSSIBLE GUIDE
TO ORE DEPOSITS IN THE CERRO
COLORADO DISTRICT, PIMA
COUNTY, ARIZONA
by
M aurice A* Chaffee
A Thesis Submitted to the Faculty of the
DEPARTMENT OF GEOLOGY
In P artia l Fulfillm ent of the Requirem ents For the Degree of
MASTER OF SCIENCE
In the Graduate College
THE UNIVERSITY OF ARIZONA
1964
STATEMENT BY AUTHOR
This thesis has been submitted in partia l fulfillment of req u ire ments for an advanced degree at The University of Arizona and is deposited in the University L ibrary to be made available to borrow ers under ru les of the L ibrary.
B rief quotations from this thesis a re allowable without special perm ission, provided that accurate acknowledgment of source is made. Requests for perm ission for extended quotation from or reproduction of this m anuscript in whole or in p art may be granted by the head of the m ajor department or the Dean of the Graduate College when in his judgment the proposed use of the m ateria l is in the in te rests of scholarship. In all other instances, however, perm ission m ust be obtained from the author.
APPROVAL BY THESIS DIRECTOR
This thesis has been approved on the date shown below:
7 So R. TITLEY /A ssociate P rofessor o r Geology
Date

ACKNOWLEDGMENTS
The author wishes to express his appreciation to Dr„ S. R .
Titley, whose guidance on this problem was m ost helpful. M r. J . R.
Hancock, University of Arizona graduate student, assisted in the opera
tion of the X -ray unit used in the analyses. M r. Henry G. Worsley,
owner of the Mary G mine, showed the author many of the old workings
in the C erro Colorado d is tric t and supplied valuable knowledge concern
ing the past h istory of the area .

TABLE OF CONTENTS
Page
LIST OF ILLUSTRATIONS................................................ vi
LIST OF TABLES .................................................................................. viii
ABSTRACT..................................................................................... ix
INTRODUCTION..................................... 1
Location and A ccessib ility ...................................... .Topography, Drainage, Clim ate, and Vegetation Purpose of Study and Method of Treatm ent . . . . .Previous W o rk ........................................................... .
DESCRIPTION OF UNITS..................................................................... 5
Igneous R o c k s ................................................................................. 5
Q uartz Latite Porphyry ....................................................... 5Andesite Porphyry Flow R o c k s .......................................... 8Andesite Porphyry D ik e s ........... '......................................... 13Rhyolite Dikes ........................................................................ 15
Sedimentary Rocks ........................................................................ 16
STRUCTURAL GEOLOGY ................................................................... 19
AGE RELATIONSHIPS ...................................................... 21
ECONOMIC GEOLOGY....................... 23
Description of Deposits .................................................. 23
Silver Hill A r e a ...................................................................... 24M ary G M in e .............................................................. 26Liberty Mine A r e a ......................................... 27
iv
r-4 i—4 CO

V
TABLE OF CONTENTS— Continued
Relation of Deposits to Regional S tru c tu re s ........................... 27Mineralogy ........................................................................... 28Ore Textures and P ar a g e n e s is .................................................. 29Classification of Deposits ........................................................... 31
TRACE-ELEMENT INVESTIGATIONS ............................................ 38
Method of S am pling ........................................................................ 38Selection of Methods of Investigation......................... .............. 40Study of M ercury D ispersion .................................... .. 42
Selection of Method of Analysis .......... 42General Theory of X-Ray Fluorescence A n a ly s is ......... 43Analytical Procedure .................................................. 45Discussion of A n a ly ses ......................................................... 46C onclusions..................................................................... 53
Study of D ispersion of a Selected Group of E lem en ts ........... 54
Selection of Elem ents for Further Investiga tion ........... 54Method of Analysis .............. 55Discussion of Analyses ....................................... 56C onclusions..................................................................... 61
RECOMMENDATIONS FOR FUTURE STUDY ................................ 65
REFERENCES C ITED ........................................................................... 67
Page

LIST OF ILLUSTRATIONS
1. Index map showing location of thesis a rea ....................... 2
2. Geologic map of a portion of the C erro Coloradomining d is t r ic t ............................................................... in pocket
3. Thin section— quartz latite p o rp h y ry ........................ 7
4. Thin section— andesite porphyry flow r o c k s ........... 7
5. Thin section— andesite porphyry flow r o c k s ........... 10
6« Thin section— C erro Colorado C onglom erate......... 10
7, Polished section— tetrahedrite replacing q u a r t z ........ 30
8, Polished section— tetrahedrite replacing sphalerite . . . 30
9„ Polished section— tetrahedrite replacing sphalerite . . . 32
10. Polished section— composite texture ................................ 32
11. Polished section— azurite and m alachite replacingtetrahedrite .......................................................................... 33
12. Polished section— azurite and m alachite replacingtetrahedrite .......................................................................... 33
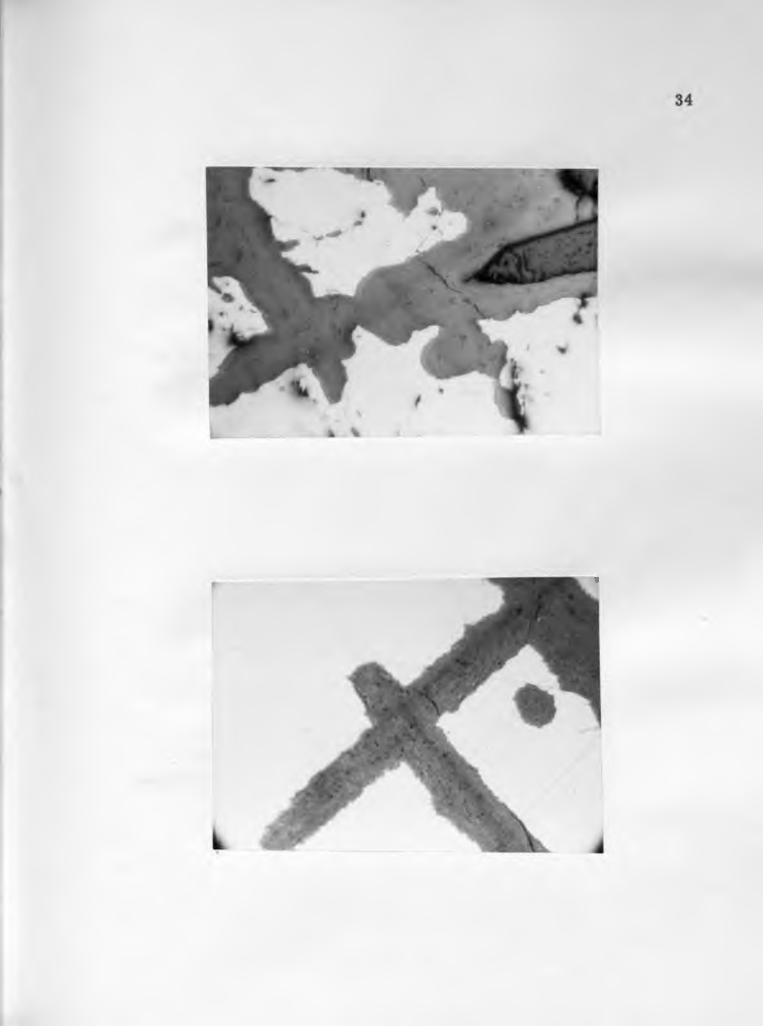
13. Polished section— m alachite replacing te trahedrite . . . 34
14. Polished section— m alachite replacing g a le n a ....... 34
15. Polished section— m alachite replacing prim arym in e ra ls ....................................................................... 35
Figure . . Page
vi
LIST OF ILLUSTRATIONS— Continued
Figure Page
16. Polished section— m alachite and azurite replacingte tra h e d r ite ............................................................................ 35
17. P ar agenesis diagram ................................................................ 36
18. Standardization curves for H g .................................................. 48
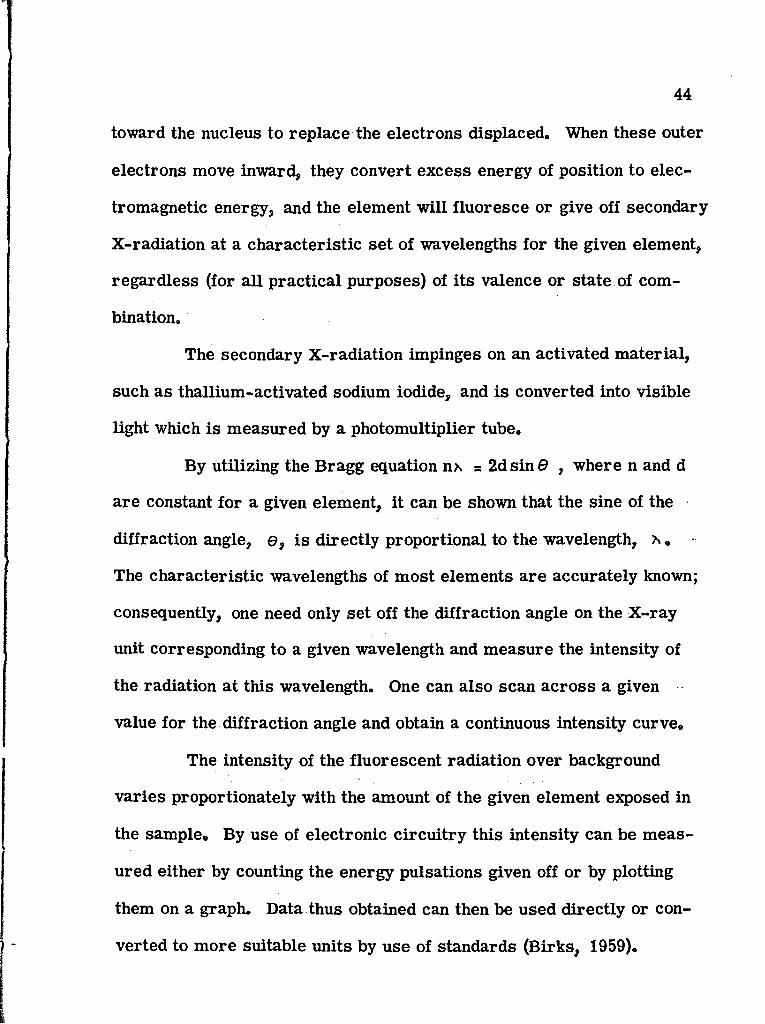
19. T raverse eAt soil sample data— Hg .................................. 49
20. T raverse ’C* soil sample data— H g ....................................... 50
21. T raverse 'D* soil sample data— H g ....................................... 51
22. T ra v e r s e ’A* soil sample data— Sr, Zn, C u ....................... 57
23. T raverse ’B* soil sample data— Sr, Zn, C u ......... ............. 59
24. T raverse 'C* soil sample data— Sr, Zn, C u ...................... 60
25. T raverse 'D* soil sample data— Sr, Zn, Cu ....................... 62
vii
LIST OF TABLES
1. Soil sampling trav e rse d a ta .......................................... ............ 40
Table Page
viii

ABSTRACT
The C erro Colorado mining d is tric t is located in Pim a County,
Arizona, about 50 m iles south-southwest of Tucson, Rock types ex
posed in the a rea mapped include T ertiary (?) igneous intrusive and
extrusive varieties and a conglomerate.
S tructures occur in two predominant directions: north and N.
60o-90° E. S tructurally controlled epitherm al quartz veins in the a rea
contain minor amounts of base m etals, s ilv e r- and m ercury-bearing
te trahedrite , and several secondary m inerals.
Soil sam ples collected across several m ineralized veins were
tested by X -ray fluorescence analysis for trace amounts of Hg, Cu, Zn,
and Sr to determ ine if these elements formed any dispersion patterns
re la ted to m ineralization. R esults of analyses for Hg were largely
negative. Results of analyses for Cu, Zn, and Sr seem ed to indicate
that a combination of high Cu and Zn values and low Sr values might be
a useful guide to ore deposits in this d istric t. A general evaluation of
the use of X -ray fluorescence analysis for soil sampling is given.
ix

INTRODUCTION
Location and Accessibility
The C erro Colorado mining d is tric t is located in southeastern
Pim a County, Arizona, about 50 m iles south-southwest of Tucson (fig,
1), The d is tric t lies within T, 20 S», R. 10 E ,, Gila and Salt River
Base Line and M eridian.
The a rea is accessible by automobile and is reached by driving
west on a partially paved road for approximately 15 m iles from Arivaca
Junction, a point on U. S. Highway 89 between Tucson and Nogales,
Arizona, to the vicinity of the C erro Colorado mine, where the road.
divides. The southern boundary of the area studied is reached by driving
west and northwest from this junction for about 4 m iles over unimproved
d irt roads. All roads a re passable except during periods of heavy ra in s .
The nearest ra il shipping point is near Amado, a siding on the
Nogales branch of the Southern Pacific Railroad, about 2 m iles south
and east from Arivaca Junction.
Topography, Drainage, Climate, and Vegetation
The C erro Colorado mining d is tric t is within the Basin and
Range physiographic province, in a group of low hills having about 500
1

2
PIMA COUNTY
TUCSON
ARIVACA JUNCTION'AMADO
SANTA CRUZARIVACA
COUNTY
ARIZONA
PIMA
FIG. 1. Index Map Showing Location ofTHESIS AREA
3
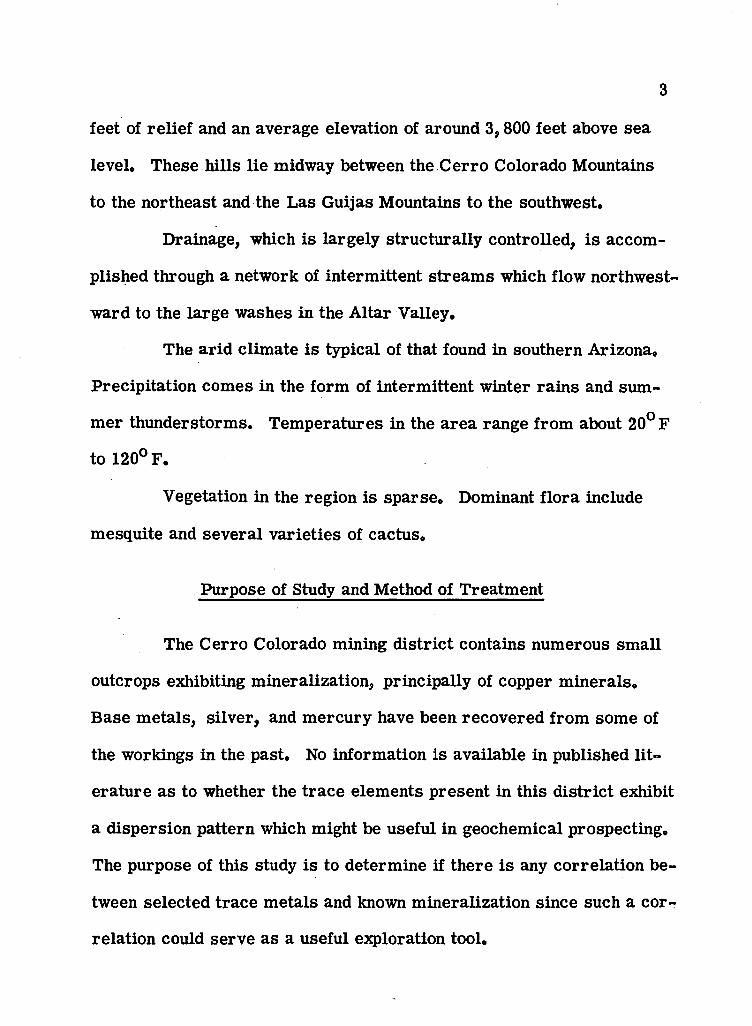
feet of re lie f and an average elevation of around 3,800 feet above sea
level. These hills lie midway between the C erro Colorado Mountains
to the northeast and the Las Guijas Mountains to the southwest.
Drainage, which is largely structurally controlled, is accom
plished through a network of interm ittent stream s which flow northwest
ward to the large washes in the A ltar Valley.
The arid clim ate is typical of that found in southern Arizona.
Precipitation comes in the form of interm ittent winter ra in s and sum
m er thunderstorm s. Tem peratures in the a rea range from about 20° F
to 120° F .
Vegetation in the region is sparse . Dominant flora include
mesquite and several varie ties of cactus.
Purpose of Study and Method of Treatm ent
The C erro Colorado mining d is tric t contains numerous sm all
outcrops exhibiting m ineralization, principally of copper m inerals.
Base m etals, silver, and m ercury have been recovered from some of
the workings in the past. No information is available in published lit
era tu re as to whether the trace elem ents present in this d istric t exhibit
a dispersion pattern which might be useful in geochemical prospecting.
The purpose of this study is to determ ine if there is any correlation be
tween selected trace m etals and known m ineralization since such a cor
relation could serve as a useful exploration tool.

4
An a rea including several known m ineralized localities was
selected for detailed study. The geology of th is area was mapped dur
ing the spring of 1964 on Soil Conservation Service ae ria l photographs
enlarged to a scale of approximately 1:12,360 or 1 inch equals 1,030
feet. The field data were then tran sfe rred to a topographic base map
of the same scale enlarged from the U.S. Geological Survey A rivaca
15-minute quadrangle sheet (1941 edition).
Soil sam ples were then taken along trav e rse s norm al to the
established structu res and studied to determ ine if the distribution of
trace elem ents present had any relation to the known m ineralization.
P rev ious Work
Very little detailed geologic information has been w ritten about
this d istric t. Two University of Arizona m astersf theses (Davis, 1955;
Jones, 1957) have discussed the general geology of much of the d istric t.
Lausen and Gardner (1927) give a short discussion of the economic
aspects of the d istric t.

DESCRIPTION OF UNITS
The geology of the C erro Colorado d is tric t as a whole is quite
complex. Jones (1957), in his work to the east of the area of this
study, found at least 12 different mappable rock units; however, in the
a rea examined by th is w riter only five units a re present. Minor a l
luvial deposits consisting of unsorted, locally derived m aterial a re also
found, principally in washes. Because alluvial m aterial is considered
unimportant in this study from an economic standpoint, it will not be
dealt with further. Of the five units found, one is sedim entary in origin
and four a re igneous. Among the igneous units one extrusive type p re
dominates over all the others (fig. 2). C lassification of rock units is
based on c r ite ria given by T ravis (1955). The units found will be d is
cussed below under the headings Igneous Rocks and Sedimentary Rocks.
Igneous Rocks
Q uartz Latite Porphyry
Q uartz latite porphyry, previously mapped and described by
both Davis (1955) and Jones (1957), is thought to be the oldest rock unit
within the a rea studied. This unit is m ore re s is tan t to weathering than
5

6
any of the andesite porphyry units, apparently due to its higher silica
content; consequently, exposures of this rock form prominent, relatively
steep-sided ridges. F resh exposures vary in color from light to dark
gray, usually with a reddish cast due to staining by iron oxides. More
highly weathered ejqrosures a re darker in color, varying from reddish
gray to nearly b la ck .' Some outcrops weather to an overall finer grained
appearance than do o thers.
Hand-specimen examination clearly shows the porphyritic
texture in m ost cases. F re sh quartz "eyes’1 a re readily distinguished.
Feldspar phenocrysts, amounting to about 40 percent of the total rock,
a re large enough to distinguish in a hand specimen, but alteration p re
cludes making an accurate estim ate of the relative percentages of ortho-
clase and plagioclase.
In thin section the rock is hypocrystalline porphyritic with
altered phenocrysts of quartz, feldspar, and magnetite occurring in a
m icrocrystalline to glassy groundmass (fig. 3). The phenocrysts a re
subhedral to anhedral and generally do not exceed 1 mm in their longest
dimension. Flow banding is clearly evident in the groundmass, but no
obvious orientation of the phenocrysts is present. The m ajority of the
feldspar p resent is orthoclase in composition based on use of the stain-- • -
ing technique of Bailey and Stevens (1960).
In some specimens the feldspar p resent is alm ost all ortho
clase. This corroborates the statem ents by Jones (1957) that this unit
/
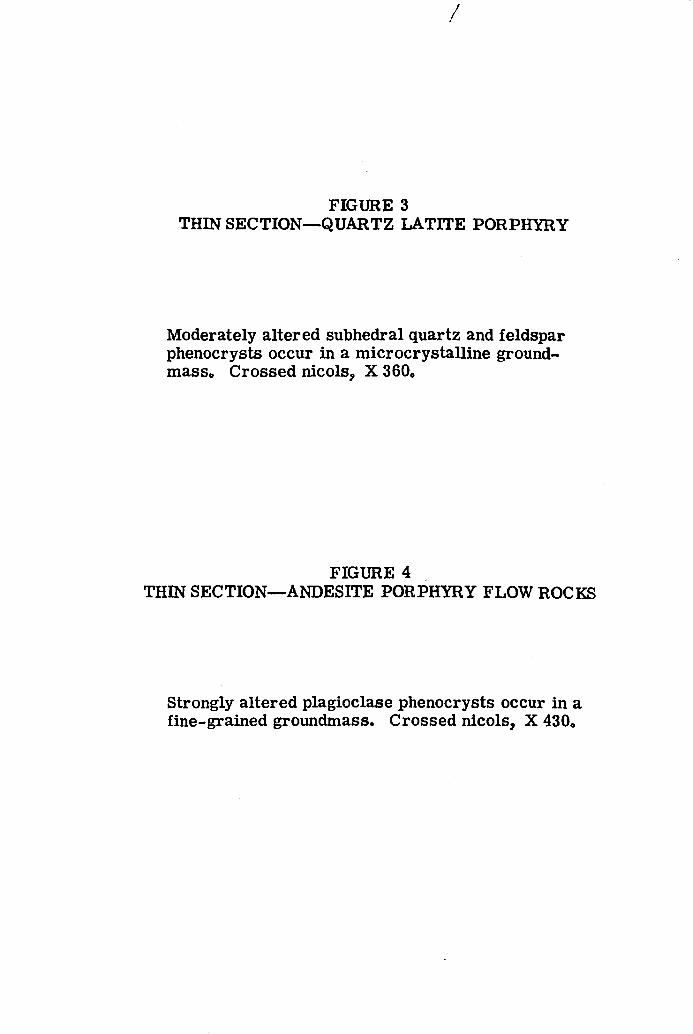
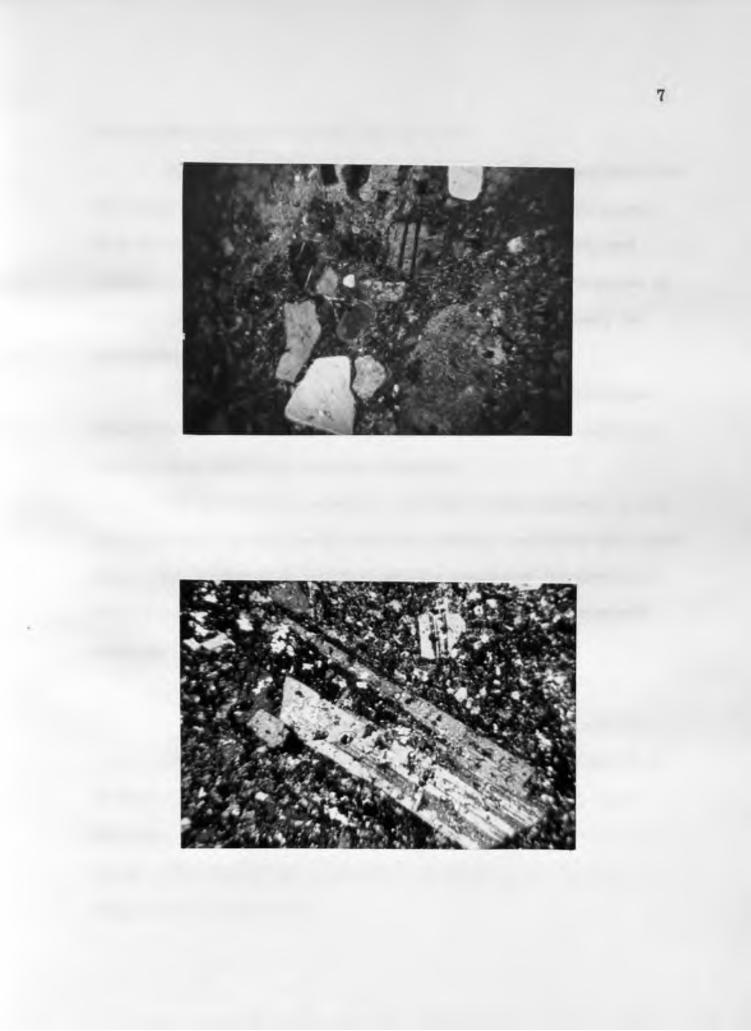
FIGURE 3THIN SECTION—QUARTZ LATITE PORPHYRY
Moderately altered subhedral quartz and feldspar phenocrysts occur in a m icrocrystalline ground- m ass, Crossed nicols, X 360,
FIGURE 4THIN SECTION—ANDESITE PORPHYRY FLOW ROCKS
Strongly altered plagioclase phenocrysts occur in a fine-grained groundmass. C rossed nicols, X 430,

8
is som etim es closer to rhyolite in composition.
Phenocrysts com prise between 30 percent and 45 percent of the
total rock. The essential m inerals in the phenocrysts include quartz
10 to 30 percent of the total rock, orthoclase 10 to 30 percent, and
plagioclase 5 to 10 percent. As an accessory, magnetite com prises up
to 5 percent. The groundmass is believed to contain essentially the
sam e composition.
The feldspars a re highly altered , principally to se ric ite and
clay m inerals. Quartz crysta ls a re usually embayed. The magnetite
locally shows associated secondary hem atite.
The aphanitic groundmass, a product of rapid cooling, is seen
throughout the exposures of th is unit and probably rep resen ts devitrified
glass. This groundmass, together with the distinctive and ubiquitous
flow structu re , suggest an extrusive origin for this unit as originally
suggested by Davis (1955).
Andesite Porphyry Flow Rocks
The andesite porphyry flow rocks cover the great m ajority of
the area studied (fig. 2). Reconnaissance indicates that this unit is
also quite common farther to the south and west. The unit is le ss r e
sistan t to weathering than the quartz latite porphyry; consequently, it
form s m ostly rounded hills.

9
What is here called "andesite porphyry" actually appears to be
several slightly different textural or m ineralogical phases of the same
basic unit. Attempts to separate the phases in mapping have been only
partially successful because there a re very subtle and gradational changes
between them.
At least three separate phases can be seen in the field: a
"norm al" phase, an agglom erate-breccia phase, and a mafic phase.
The "norm al" phase is especially common in the weakly m ineralized
a rea to the east of the M ary G mine but also occurs in other scattered
locations. Exposures show well-developed phenocrysts, up to several
m illim eters in longest dimension. The rock is commonly strongly
propylitized giving r is e to colors ranging from gray to greenish gray to
tan or buff. Alignment of the phenocrysts is subtle but often present.
Mafic m inerals, including hornblende, augite, biotite, and magnetite,
usually do not exceed 5 to 10 percent of the total rock.
Viewed m icroscopically, specimens of this phase a re holo-
crystalline porphyritic (fig. 4). Flow banding is locally presen t. The
phenocrysts, com prising 30 to 80 percent of the total rock, a re found
up to about 1 mm in longest dimension. They a re generally subhedral
to anhedral and often show orientation (fig. 5).
M ajor constituents found in both the phenocrysts and the ground-
m ass include oligoclase 40 to 80 percent of the total rock, mafic m iner
a ls 10 to 20 percent, and quartz generally less than 5 percent.

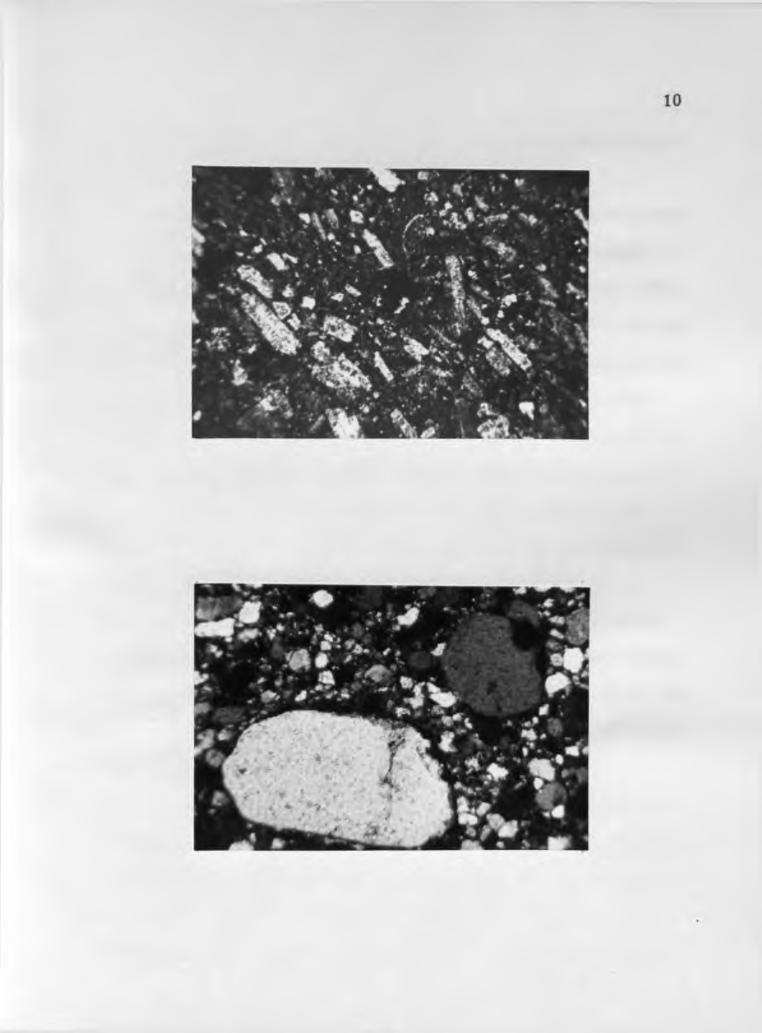
FIGURE 5THIN SECTION—ANDESITE PORPHYRY FLOW ROCKS
Plagioclase phenocrysts are oriented in a subparallel manner in a fine-grained groundmass. C rossed nicols, X 410.
FIGURE 6THIN SECTION— CERRO COLORADO CONGLOMERATE
Generally well-rounded quartz grains exhibit a lack of sorting. Crossed nicols, X 430.

11
Hornblende, augite, and magnetite a re the m ost common mafic m iner
als. Some plagioclase c rysta ls show zoning.
The rock is commonly strongly propylitized; traces of epidote
and chlorite(?) a re often present, and pyrite was seen in one hand
specimen. The magnetite p resen t is being altered to hem atite. Feld
spars a re often so strongly altered that the porphyritic texture becomes
indistinct. A lteration m inerals in addition to the above include se ric ite
and clay m inerals. W illiams, T urner, and G ilbert (1958) note that
propylitization of andesites often occurs close to orebodies but that the
genetic association is not certain . Lindgren (1933) has pointed out,
however, that the genetic implications of th is association a re well
founded. He sta tes that propylitization often extends over a large a rea
which has been hydrotherm ally altered .
The agglom erate-breccia phase is the m ost abundant of the
three. It is m ore re s is tan t to weathering than the others and common
ly caps h ills. Exposures in the field a re very rugged in appearance and
often have a mottled appearance due to m arked color differences among
the included fragm ents.
The breccia and agglom erate commonly a re interm ixed, but
the agglom erate com prises the g reater portion of this phase. Both a re
composed of andesite porphyry fragm ents, as previously described, se t
in a m atrix of sim ilar composition. The breccia exhibits angular to
subangular fragm ents up to several inches in longest dimension, while
12
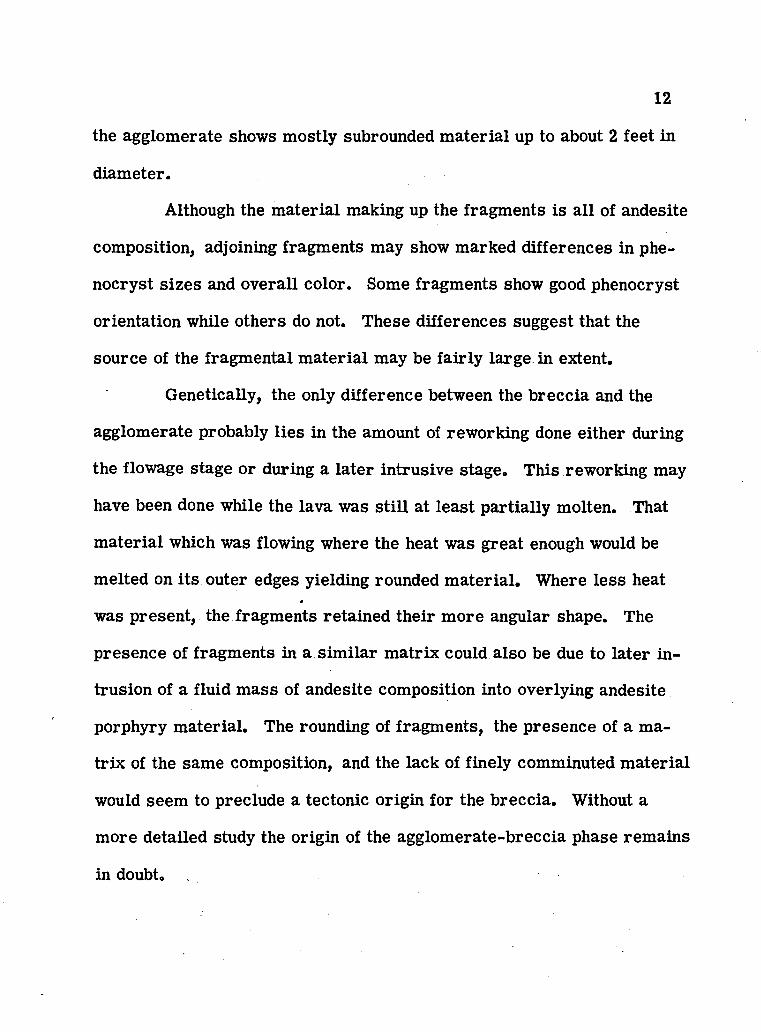
the agglom erate shows m ostly subrounded m ateria l up to about 2 feet in
diam eter.
Although the m aterial making up the fragm ents is a ll of andesite
composition, adjoining fragm ents may show m arked differences in phe-
nocryst sizes and overall color. Some fragm ents show good phenocryst
orientation while others do not. These differences suggest that the
source of the fragm ental m aterial may be fairly large in extent.
Genetically, the only difference between the breccia and the
agglomerate probably lies in the amount of reworking done either during
the flowage stage or during a la ter intrusive stage. This reworking may
have been done while the lava was s till at least partia lly molten. That
m aterial which was flowing where the heat was great enough would be
melted on its outer edges yielding rounded m ateria l. Where less heat
was present, the fragm ents retained the ir m ore angular shape. The
presence of fragm ents in a sim ilar m atrix could also be due to la ter in
trusion of a fluid m ass of andesite composition into overlying andesite
porphyry m aterial. The rounding of fragm ents, the presence of a m a
tr ix of the same composition, and the lack of finely comminuted m ateria l
would seem to preclude a tectonic origin for the breccia. Without a
m ore detailed study the origin of the agglom erate-breccia phase rem ains
in doubt

13
The mafic phase crops out in an area running roughly north-
south just east of the Mary G mine, near the contact of the andesite
porphyry and the quartz latite porphyry.
In the field th is phase is much darker in appearance than the
other phases because it contains a higher percentage of hornblende
phenocrysts than the o thers. Hornblende phenocrysts, up to 25 mm in
longest dimension, com prise as much as 40 to 50 percent of the total
rock. Feldspar phenocrysts do not exceed 1 to 2 mm in longest dimen
sion.
Viewed m icroscopically th is phase resem bles the "norm al"
porphyry except for a higher percentage of hornblende together with
augite, chlorite, zeolites, and various iron oxides. This phase was the
only one in which zeolites were found. It is suggested that there might
be a genetic association between the zeolites in country rocks and n ea r
by m ineralization, but no definite evidence is available.
Andesite Porphyry Dikes
Intruding all the older units a re a group of andesite porphyry
dikes. While they are scattered throughout the a rea of study, they do
show two p referred orientations: north and N. 60o-80° E.
Only subtle differences reveal the presence of these dikes
where they cut through the andesite porphyry flow rocks. Usually the
dikes exhibit la rger phenocrysts. Because they are composed of

14
relatively le ss-re s is tan t m aterial, these dikes form slight depressions
where they intrude the quartz latite porphyry; however, where they cut
the andesite porphyry flow rocks, the rev e rse is tru e— the dikes form
gentle ridges in the flow rocks. These dikes vary in width from several
tens of feet to several hundreds of feet. In all cases they show a very
steep dip.
There may be m ore than one stage of intrusion of andesite
porphyry dikes. In the a rea about 2,000 feet north of the Mary G mine
the north-strik ing se t of dikes seem s to have been cut by a la ter north
east dike.
Viewed m icroscopically the andesite porphyry dike rocks a re
sim ilar to the flow rock ’’norm al” phase. Phenocrysts appear to be
somewhat m ore abundant in the dike m aterial, but th is may be due only
to a le sse r degree of alteration. Q uartz, com prising about 5 percent of
the total rock, is m ore plentiful in the dike rocks. . Staining techniques
indicate that up to about 4 percent orthoclase is p resen t. Other m ineral
percentages and the general alteration appearance a re essentially the
sam e as in the flow rocks. This sim ilarity of mineralogy and petrology
of the dikes and flow rocks suggests a common genetic origin. No chilled
borders a re obvious in the dike rocks, indicating that they may have in
truded while the ea rlie r rocks were s till warm.

15
Rhyolite Dikes
Thin rhyolite dikes crop out throughout much of the a rea
studied. These dikes intrude a ll other rock types and are therefore the
youngest rock unit present. These dikes are 1 to 5 feet wide and, a l
though somewhat discontinuous, can be traced along strike in some lo
cations for over a m ile. In the field these dikes form narrow white
ridges which a re clearly visible on ae ria l photographs.
All of the rhyolite dikes seen exhibit a northeast trend, indi
cating that their emplacement is structurally controlled. Many of these
dikes have intruded in a reas of ea rlie r struc tu ra l weakness, such as
along the contacts between andesite porphyry dikes and flow rocks.
The rhyolite is readily identified in the field because of its
nearly white color, aphanitic texture, and positive re lie f rela tive to the
surrounding rocks. Flow folds, common within the dikes, a re defined
by the presence of thin black, green, and red bands, not unlike
schlieren in appearance, which are probably composed of various iron
oxides. The dikes are generally well jointed.
In thin section this unit is very fine-grained holocrystalline,
nearly m icrocrystalline. Staining reveals that 60 to 70 percent of the
rock is orthoclase. The rem ainder is either quartz or is simply too
fine grained to identify. No plagioclase or mafic m inerals were seen
in any of the thin sections studied.

16
The rhyolite m ust have intruded the older rocks after the older
rocks had cooled, About 1,000 feet south of the southern end of Silver
Hill several rhyolite dikes intrude the andesite porphyry flow rocks, A
1- to 5-foot deep-red baked zone can be seen on each side of one of these
dikes. The red color is due to a high hem atite content. The iron has
apparently been re leased from the porphyry as a re su lt of the high tem
pera tu res of the intruding rock and does not rep resen t introduced m ate
r ia l.
Sedimentary Rocks
The lone sedim entary unit mapped within the area studied has
been called "latite conglom erate” (Davis, 1955) and "conglomerate I"
(Jones, 1957). As previously noted by these w rite rs , this unit occurs
as discontinuous lenses along the contact between the andesite porphyry
flow rocks and the quartz latite porphyry.
In outcrop the conglomerate is hummocky in appearance, r e
flecting the rounded cobbles and boulders present. Q uartzite float
readily identifies the presence of this unit even when no obvious outcrop
is nearby. The unit contains about 60 to 80 percent pink to tan suban-
gular fragm ents of quartz latite porphyry and 20 to 40 percent light- to
dark-gray, generally well-rounded fragm ents of quartzite. Boulders of
quartzite ranging up to 2 feet in diam eter were seen. The unit contains
no andesite porphyry fragm ents.
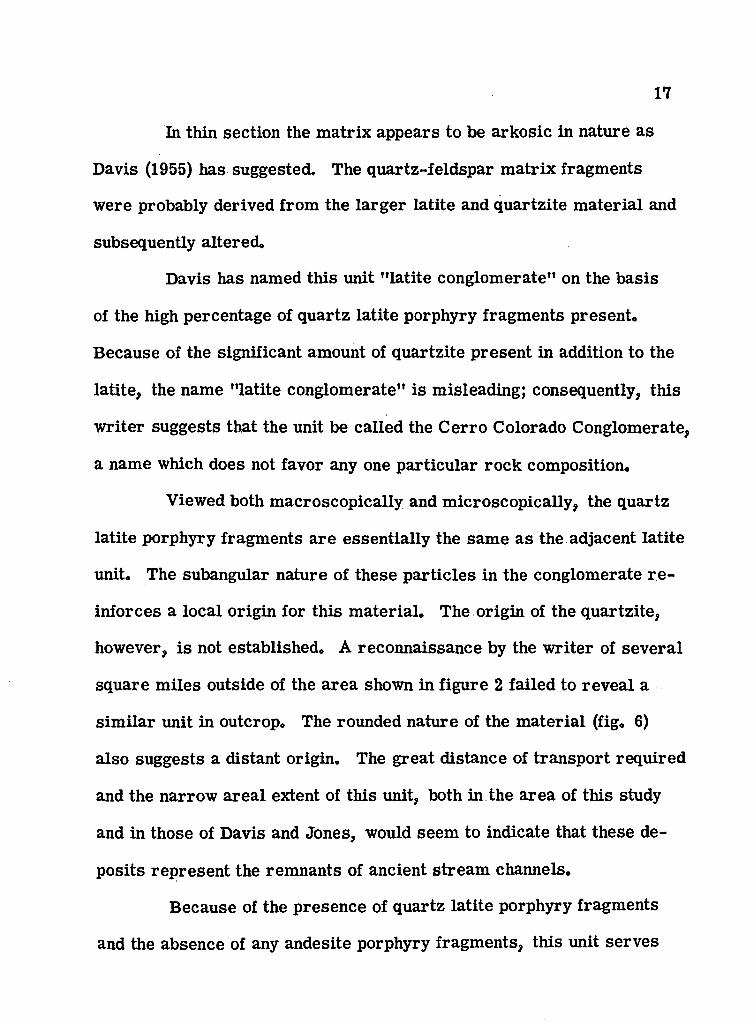
In thin section the m atrix appears to be arkosic in nature as
Davis (1955) has suggested. The quartz-feldspar m atrix fragm ents
were probably derived from the la rger latite and quartzite m aterial and
subsequently altered,
Davis has named th is unit "latite conglomerate" on the basis
of the high percentage of quartz latite porphyry fragm ents present.
Because of the significant amount of quartzite p resen t in addition to the
latite , the name "latite conglom erate" is misleading; consequently, this
w riter suggests that the unit be called the C erro Colorado Conglomerate,
a name which does not favor any one particu lar rock composition.
Viewed both m acroscopically and m icroscopically, the quartz
latite porphyry fragm ents are essentially the sam e as the adjacent la tite
unit. The subangular nature of these partic les in the conglomerate r e
inforces a local origin for this m aterial. The origin of the quartzite,
however, is not established. A reconnaissance by the w riter of several
square m iles outside of the a rea shown in figure 2 failed to reveal a
sim ilar unit in outcrop. The rounded nature of the m aterial (fig. 6)
also suggests a distant origin. The great distance of transpo rt required
and the narrow area l extent of this unit, both in the a rea of this study
and in those of Davis and Jones, would seem to indicate that these de
posits rep resen t the rem nants of ancient stream channels.
Because of the presence of quartz latite porphyry fragm ents
and the absence of any andesite porphyry fragm ents, this unit serves
17
as a valuable m arker "bed" in assigning rela tive ages to the rock units
in the a rea studied. By its very composition this unit m ust be younger
than the quartz latite porphyry and older than the andesite porphyry.
18
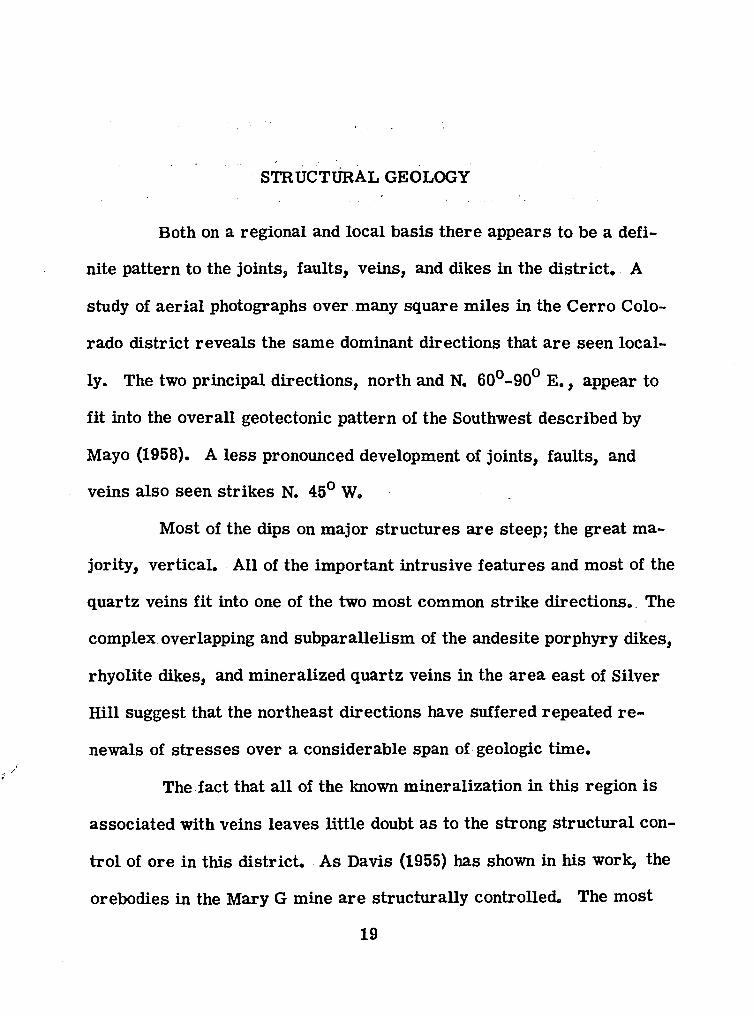
s t r u c t u r a l g e o l o g y
Both on a regional and local basis there appears to be a defi
nite pattern to the joints, faults, veins, and dikes in the district* A
study of ae ria l photographs over many square m iles in the C erro Colo
rado d is tric t reveals the sam e dominant directions that a re seen local
ly. The two principal directions, north and N. 60o-90° E . , appear to
fit into the overall geotectonic pattern of the Southwest described by
Mayo (1958). A le ss pronounced development of joints, faults, and
veins also seen strikes N. 45° W.
M ost of the dips on m ajor s truc tu res a re steep; the great m a
jority , vertical. All of the im portant intrusive features and m ost of the
quartz veins fit into one of the two m ost common strike directions. The
complex overlapping and subparallelism of the andesite porphyry dikes,
rhyolite dikes, and m ineralized quartz veins in the a rea east of Silver
Hill suggest that the northeast directions have suffered repeated r e
newals of s tre sse s over a considerable span of geologic tim e.
The fact that a ll of the known m ineralization in this region is
associated with veins leaves little doubt as to the strong structu ra l con
tro l of ore in th is d is tric t. As Davis (1955) has shown in his work, the
orebodies in the Mary G mine a re structurally controlled* The most
19
20
favorable locations for orebodies a re shown to be at fault and fractu re
in tersections.
Although jointing is common in all of the rock units mapped,
obvious faulting is not. Faults a re probably m ore common than su r
face indications reveal, but, because of a lack of stratigraphic m ark ers,
even sm all displacem ents a re not obvious. B recciation is commonly
seen in association with the quartz veins, indicating that many or p e r
haps a ll of these veins have been form ed in fault zones. No evidence of
any kind was seen to indicate the type of faults p resent.
Lineation is fairly common in the andesite porphyry flow rocks.
No dominant trend was found in a cursory examination of several out
crops; however, a detailed study might reveal a p referred orientation
and possibly give a direction of flowage. The presence of disoriented
fragm ents in the agglom erate-breccia phase would certainly complicate
such a study. The recognition of the tops or bottoms of various flows
could determ ine the orientation of the flows and thereby reveal the
overall stratigraphy of the d istric t.
AGE RELATIONSHIPS
Much of southern Arizona contains isolated blocks of exposed
rocks surrounded by extensive pediments and areas of valley fill. As
a resu lt, correlations of any kind between blocks are difficult, if not
im possible. F ossils may be of assistance in correlating sedim entary
units, but for volcanic rocks m ineralogic s im ila rities or associations
with contiguous dateable sedim ents are the only c r ite ria generally
available for correlation a t this tim e, .
Because of a lack of any dateable units associated with the
igneous rocks exposed throughout the C erro Colorado mining d istric t,
no absolute dates can be assigned. Rocks of sim ilar lithology in other
a reas of southern Arizona have mostly been assigned to the T ertia ry (?).
This w riter hopes that at some future date the volcanic rocks
of the C erro Colorado d is tric t will be dated by radioactive methods. At
least two basic facts could be derived from such dating: (1) the age of
the igneous rocks, and (2) the maximum age of the m ineralization.
Knowing the age of the igneous units, together with those of
sim ilar lithology in other a reas , would help to tie together the m ore
recen t geologic history of southern A rizona. A date in this a rea would
also fix a maximum age for the m ineralization in the d istric t. With
21
22
sim ilar dates in other m ineralized a reas associated with sim ilar rock
types, it might be possible to a rriv e a t a better answer to the m etallo-
genic history of southern Arizona. The low -tem perature nature of the
deposits in the a rea studied, together with a possible T ertia ry age of
the host rocks, indicates that these deposits may be re la ted to the
waning stages of Laram ide metallogenic activity.
Relative ages can be assigned to the units mapped. The C erro
Colorado Conglomerate, containing quartz latite porphyry fragm ents
but none of andesite porphyry, leaves little doubt that the quartz la tite
porphyry is the oldest rock unit exposed in the a rea studied and that
the andesite porphyry flow rocks a re post-conglom erate in age. Since
the andesite porphyry dikes cut the flow rocks, the dikes m ust be the.
younger of the two. Sim ilarly, the rhyolite dikes, which intrude all of
the other units, m ust be the youngest unit in the area . The m ineraliza
tion is la te r than the tim e of emplacement of the andesite porphyry dikes
since many veins a re found cutting these, dikes. The age of the veins .
re la tive to the rhyolite is not certain; the two may be contemporaneous.

ECONOMIC GEOLOGY
A number of quartz veins, some barren and some sulfide b ea r
ing, crop out throughout the a rea investigated. Nearly a ll of these veins
are associated with the dominant directions of struc tu ra l weakness.
Workings have been mined in the past for base m etals, s ilver, and m er
cury; however, no mining is being done in the a rea investigated a t this
tim e. Ore textures and m ineral assem blages indicate that m ineraliza
tion probably occurred in a m oderate to low -tem perature near-su rface
environment.
Description of Deposits
Davis. (1955) and Jones (1957) have described in some detail -
the mine workings and ore occurrences at the C erro Colorado mine,
the Black P rincess mine, and the M ary G mine. Most of the investiga
tions covered in this repo rt w ere done in the vicinity of Silver Hill. The
a reas surrounding the Mary G mine and the Liberty mine were also
studied.
23

24
Silver Hill A rea
A large number of shafts, inclines, adits, and prospect pits
a re p resen t in the vicinity of Silver Hill, especially on the eastern
slope and in the fla t valley to the east. Most of the deeper workings
a re no longer accessible; however, two shafts with associated inclines
were stiU open and were investigated.
On the north slope of Silver Hill about 100 feet south of the
andesite porphyry flow rock-dike rock contact (point A in fig. 2), there
is a shaft-incline complex with a large waste dump. The shaft is in
accessible, at least 75 feet deep, and dips a t about 70° to the southeast.
It is joined to the incline 50 feet below the surface by a 30-foot crosscu t
along the m ineralized vein. The incline is accessible to its bottom at
the crosscu t and was developed along the principal vein in the workings,
which strikes N. 60° E. and dips 25° SE.
The country rock is a ltered and bleached andesite porphyry
flow rock. The main quartz vein varies in width from 1 to 6 inches.
M inerals present a re scattered throughout the quartz and probably do
not make up m ore than 5 to 10 percent of the whole vein. M inerals
identified include te trahedrite , sphalerite , galena, malachite, azurite,
and yeUow to red to dark-brown iron and manganese oxides. P rim ary
sulfides occur to within 30 feet of the surface.

25
About 1, 700 feet south- southeast of this location is another
shaft-incline complex (point B in fig. 2). These workings are also en
tire ly within the andesite porphyry flow rocks. A vertical shaft, ap
proximately 50 feet deep, in te rsec ts at its bottom an incline driven
westward down along the principal quartz vein in the area . This vein
strikes north and dips 30° W. From the shaft-incline intersection sev
e ra l short inclines and d rifts, a ll le ss than 50 feet long, have been
driven along the vein in an attem pt to develop ore. The vein, which
varies in width from 4 to 12 inches, contains scattered ore m inerals
which constitute under 5 percent of the total vein m aterial. The quartz
is locally vuggy with sm all euhedral crysta ls lining the vugs. No band
ing was seen in the quartz. P rim ary m inerals seen included only sm all
amounts of galena and sphalerite .
Oxidation has evidently penetrated deeper in this a rea than
a t the workings previously described. A deep b rick -red gossan is lo
cally developed in the deeper workings, probably representing leached
te trahedrite . Cinnabar may be present in this gossan, but it was not
positively identified. M alachite is p resen t a t all depths. Manganese
dendrites and red to dark-brown iron oxides a re p resen t in the well-
fractured andesite porphyry wall rocks. Yellow earthy m assicot(?)
and perhaps ce rru site and angle site a re p resent near sm all oxidizing
pods of galena.
26
Many of the prospect pits ju st southeast of Silver Hill show
abundant quartz veinlets and stringers , as well as m ore m assive quartz
veins, as a m atrix cementing brecciated, bleached andesite porphyry.
Scattered galena, m alachite, azurite , and red to brown iron oxides
were noted in many of these p its . The presence of a sm all re to r t near
several workings in this a rea indicates that m ercury has been recovered
from some of these veins. Minor calcite is also present.
M ary G Mine
The Mary G mine is presently inactive; consequently, no a t
tempt was made to examine the underground workings. However, Davis
(1955) has described the conditions underground. The workings in gen
e ra l consist of two shafts intersecting two levels, one at 135 feet and
the other at 170 feet. (The newer, or south, shaft was not present when
Davis wrote his th e s is .) The ore occurs in quartz veins which pinch
and swell along strike from about 2 to 24 inches in width. The veins
a re associated with faults or frac tu res in the andesite porphyry country
rock. The richest ore occurs a t the intersections of such s truc tu res.o
The main m ineralized fault zone strikes approximately N. 10 E. and
dips 45° W. Iron-rich d ark -red andesite porphyry is seen near the
veins underground. Ore m inerals seen by Davis include galena,
te trahedrite , anglesite, ce rru s ite , m alachite, and cinnabar, Gangue

27
m inerals included mostly milky and grayish-colored quartz with minor
barite and calcite.
None of the m ineralized veins crop out on the surface, but they
may be hidden under overburden and dumps emplaced during the course
of mining operations. D ark-red high-iron alteration of the porphyry is
evident on the surface along several fractu re zones. It is not certain
whether these a reas are surface expressions of the underground veins.
Liberty Mine A rea
Several shafts and prospect p its near the northeastern corner
of the a rea studied (point C in fig. 2) m ark the location of the abandoned
Liberty mine. The main shaft, perhaps exceeding 100 feet in depth,
was sunk near the contact of the andesite porphyry flow rocks and an
andesite porphyry dike. Other shafts and pits have been developed in
the immediate area , apparently along the sam e contact. A search of
waste dumps in the a rea by the w riter failed to reveal what was being
sought. No evidence of even b arren quartz was seen.
Relation of Deposits to Regional S tructures •• .
As stated previously under the topic of struc tu ra l geology,
there a re two dominant trends to m ost struc tu res in the a rea of investi
gation: north and N. 60°-90o E. A study of the accompanying geologic
map (fig. 2) will show that the g reater m ajority of all of the m ineralized
28
areas mapped in th is study fall into one of these two dominant strike
directions* Nearly all of the veins located in or near the two northeast-
striking dikes flanking Silver Hill on the north and south have a strike
roughly parallel to these dikes. Again, th is parallelism of struc tu res
seem s to indicate a zone of weakness along which there has been r e
peated stressing through geologic tim e.
Mineralogy
P rim ary ore m inerals from the d is tric t seen in hand specimen
and polished section include te trahedrite , chalcopyrite, sphalerite , and
galena. Associated gangue m inerals include quartz and minor calcite.
P rim ary m inerals a re only found in deeper workings or on dumps a s
sociated with workings exceeding 30 to 50 feet in depth. This depth ap
parently rep resen ts the extent of oxidation in th is region.
Spectrographic analyses of the ore m inerals show that the fol
lowing elements a re present in detectable amounts: Cu, Pb, Zn, Hg,
Ag, Al, Ca, Si, Mg, Fe, Te, Sn, Cd, Sb, As, Mo, C r, Th, and pos
sibly Sr and Bi. The Al, Si, Fe, Mg, and Sr a re probably from andesite
im purities in the sam ples. Definitely absent or in le ss than detectable
amounts a re Ni, Au, Pt, Ge, U, V, W, Mn, and Ba.
The presence of m ercury and silver in te trahedrite was con
firm ed and indicates that this m ineral is actually presen t as the varie ties
freiberg ite , the argentiferous form , and schwazite, the m ercuria l form .
29
The quartz gangue is commonly vuggy. These vugs a re usually
lined with term inated quartz cry sta ls . Most of the quartz is milky in
appearance, but locally it may appear dark gray or even clear.
Secondary ore m inerals seen include azurite , m alachite, py-
r ite , cinnabar, m assicot(?), and iron and manganese oxides. Small
amounts of chrysocholla(?) may also be presen t. A zurite and m alachite
are commonly seen in the quartz gangue in near-su rface prospect pits
and in the waste dumps of many workings. P yrite , which is ra re ly
seen, is not an ore m ineral; it is a product of propylitization found in
andesite porphyry rocks. Cinnabar is occasionally seen as sm all red
crysta ls in gossans. It is thought to be a stable secondary m ineral
formed by the breakdown of schwazite and perhaps m ercuria l galena
and sphalerite (Bancroft, 1909; Allen and Crenshaw, 1912; Booer, 1944),
Ore Textures and Paragenesis
The ore m inerals in polished section clearly show textures in
dicating that at least the ea rlie s t one, sphalerite, was deposited in open
spaces, and that a ll the m inerals were deposited in a well-defined se - _
quence. Where the quartz-o re interface is seen (fig. 7), the quartz is
nearly always subhedral to euhedral, reflecting the quartz-lined vugs
often seen in hand specimen.
The f ir s t ore m ineral deposited was sphalerite . It is often
seen filling the void spaces around euhedral quartz crysta ls .

/ /
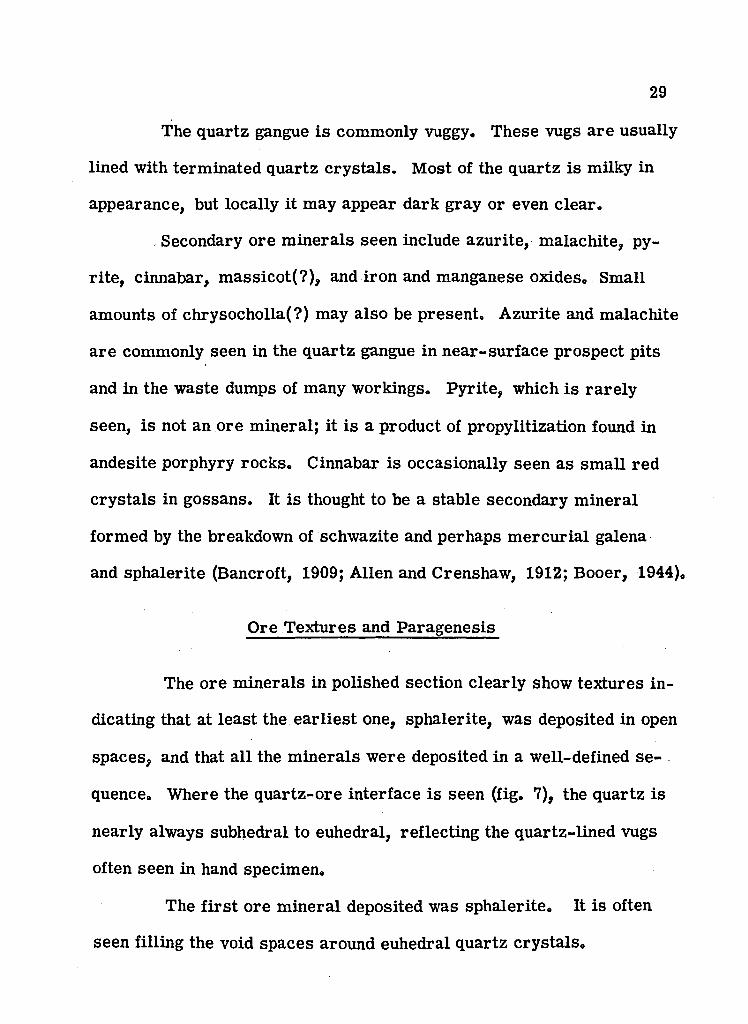
FIGURE 7POLISHED SECTION— TETRAHEDRITE REPLACING
QUARTZ
Tetrahedrite (white) is replacing a euhedral quartz crysta l (dark gray). Reflected light, X 145,
FIGURE 8POLISHED SECTION— TETRAHEDRITE REPLACING
SPHALERITE
Tetrahedrite (light gray) is replacing sphalerite (medium gray) along a fractu re. Quartz (dark gray) is also present. Reflected light, X 135.
30

31
Chalcopyrite is present but only in very sm all amounts. Because of its
close association with sphalerite, the chalcopyrite was probably de
posited contemporaneously with the sphalerite. The only specimen
studied in which chalcopyrite was found came from the M ary G mine and
may be indicative of a slightly deeper and hotter environment of deposi
tion than the re s t of the specimens.
T etrahedrite replaces sphalerite along ea rlie r fractu res and
in a ca ries or indentation texture (figs. 8 and 9). Galena is the youngest
of the ore m inerals and rep laces all the others, often in a ca ries tex
tu re (fig. 10).
Oxidation has produced secondary azurite and malachite which
a re often seen as banded crusts on prim ary m inerals (figs. 11 and 12)
or as fractu re or cleavage fillings (figs. 13, 14, 15, and 16). The over
a ll paragenesis is sum m arized in figure 17.
Classification of Deposits
The conditions of formation of the deposits in the C erro Colo
rado mining d istric t a re fairly c lear. The m ineral assem blage p re s
ent, especially the presence of m ercury in the prim ary ore m inerals,O '
precludes a tem perature of formation exceeding about 400 C (Krauskopf,
1964). Abundant brecciation and open-space filling would seem to in
dicate a relatively shallow depth of deposition. T races of tellurium ,
determ ined in the spectrographic analyses of o res, a re also an indication

FIGURE 9POLISHED SECTION—TETRAHEDRITE REPLACING
SPHALERITE
Tetrahedrite (light gray) is replacing sphalerite (medium gray). Note ca ries texture. Reflected light, X 135.
FIGURE 10POLISHED SECTION— COMPOSITE TEXTURE
A composite ore section showing quartz (black), sphalerite (dark gray), te trahedrite (medium gray), and galena (light gray). Note caries texture where galena is replacing te trahedrite . Reflected light, X 135.


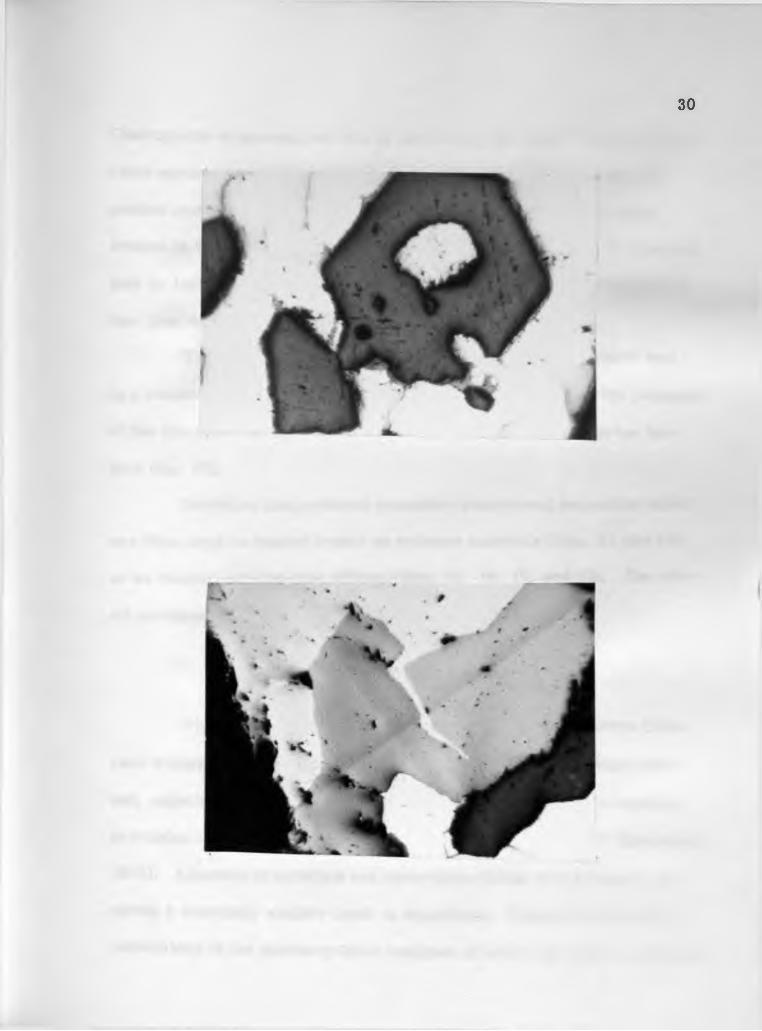
FIGURE 11POLISHED SECTION—AZURITE AND MALACHITE
REPLACING TETRAHEDRITE
Banded azurite and malachite are replacing te tra - hedrite (white). Reflected light, X 145.
FIGURE 12POLISHED SECTION—AZURITE AND MALACHITE
REPLACING TETRAHEDRITE
Banded azurite and malachite are replacing te tra - hedrite along its contact with euhedral quartz crysta ls . Reflected light, X 135.
33
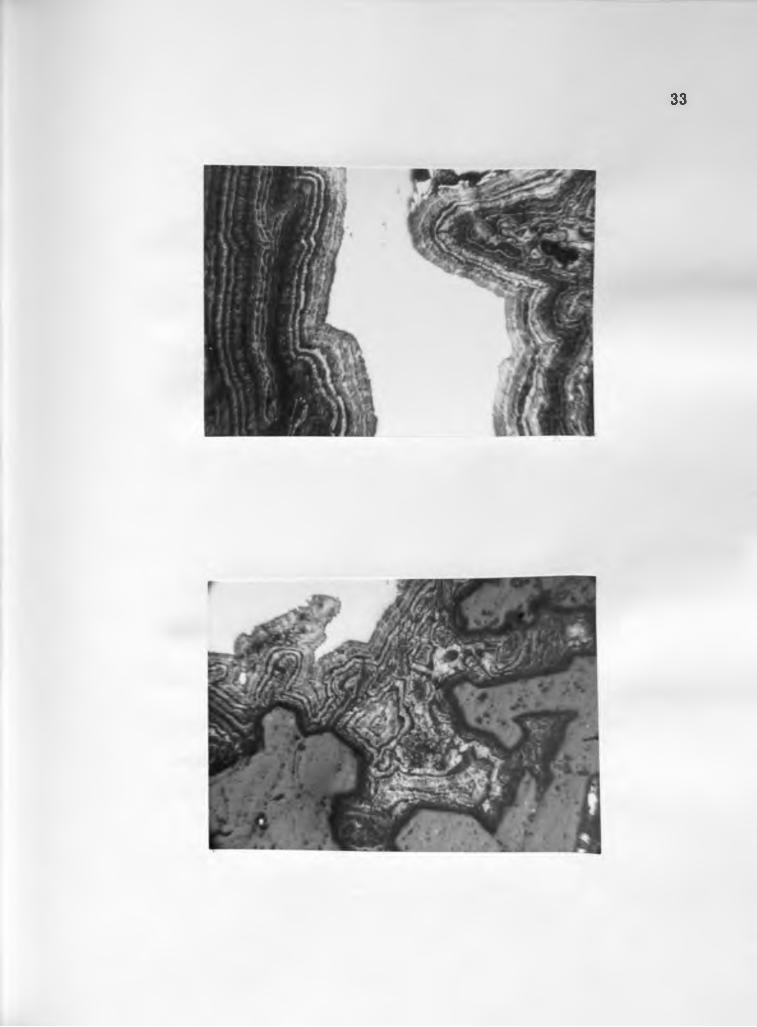
FIGURE 13POLISHED SECTION—MALACHITE REPLACING
TETRAHEDRITE
Malachite (medium gray) is replacing te trahedrite (white) along its cleavage. The dark-gray m ineral is quartz. Reflected light, X 145.
FIGURE 14POLISHED SECTION— MALACHITE REPLACING
GALENA
Malachite is forming along the cleavage in galena, Reflected light, X 135.
1

FIGURE 15POLISHED SECTION— MALACHITE REPLACING
PRIMARY MINERALS
Malachite is forming in the boundary between te tra - hedrite (white) and quartz (dark gray). Reflected light, X 135.
FIGURE 16POLISHED SECTION— MALACHITE AND AZURITE
REPLACING TETRAHEDRITE
Malachite (medium gray) and azurite (dark gray) a re replacing tetrahedrite (light gray) along its frac tu res. Reflected Hght, X 135.

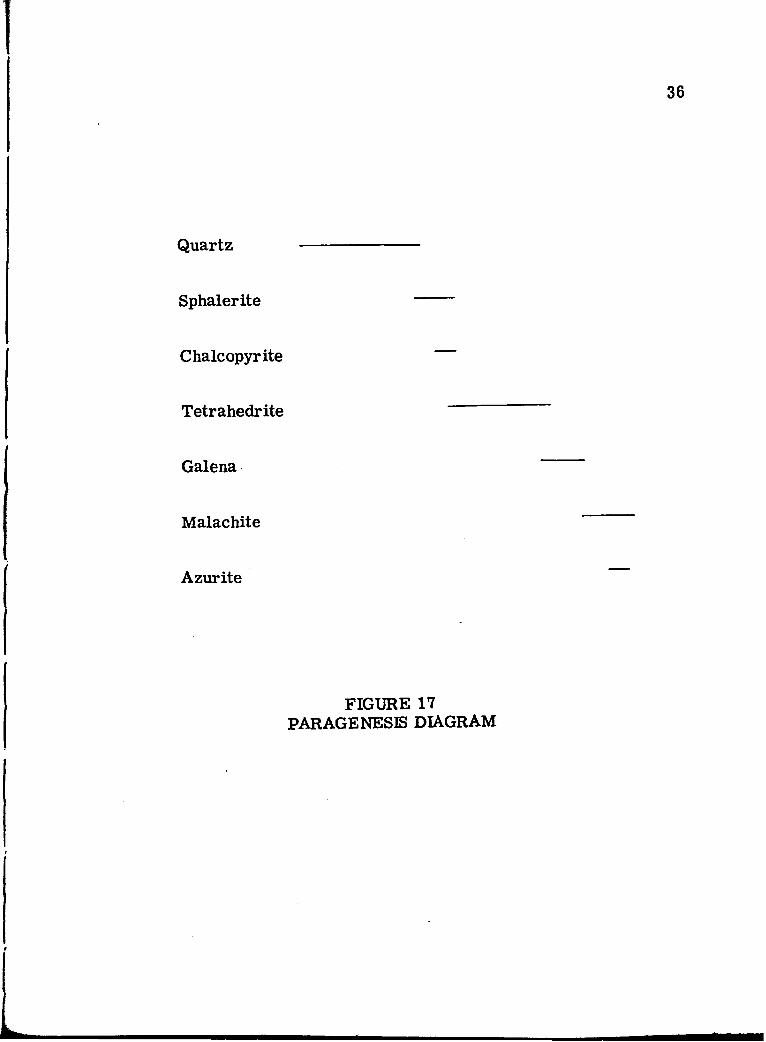
Quartz
Sphalerite
Chalcopyrite
Tetrahedrite
Galena
Malachite
Azurite
FIGURE 17PARAGE NESIS DIAGRAM

37
of a low -tem perature environment. Lindgren (1933) and Graton (1933)
note that propylitization is mainly associated with near-su rface ore
occurrences in andesite rocks.
Form ation of m inerals began with the quartz veins, probably
under cooler m esotherm al conditions, to produce the vuggy, milky to
locally c lear, unbanded quartz. As the tem perature dropped, sphalerite,
chalcopyrite, te trahedrite , and galena were deposited, in that o rder.
Spectrographic analyses show that m ercury is p resen t in the
base m etal o re m inerals, but its form is not known. It may be p resen t
as an atomic substitution within the crysta l s truc tu res of the base m etal
o res, or it may occur as native m ercury or cinnabar finely dissem inated
through the ore m inerals. H either of these conditions prevail, the
m ercury is contemporaneous with base m etal sulfide deposition. The
m ercury may also have been deposited la ter than the base m etals and
may rep resen t a depositional phase at a somewhat lower tem perature
and p ressu re , m ore in keeping with known m ercury deposits.
In sum m ary, it would thus appear that the C erro Colorado de
posits exhibit the effects of slight to m oderate changes in tem perature
and perhaps some change in p ressu re during deposition. As a re su lt of
the m ineralogical, s tructu ra l, and tex tural conditions present, the
C erro Colorado ore deposits probably can best be classified as epi
therm al as defined by Emmons (1940) and Burbank (1933) or perhaps as
leptotherm al as defined by Graton (1933).

TRACE-ELEMENT INVESTIGATIONS
The resu lts of the geological mapping and regional s truc tu ra l
analysis revealed several favorable trends of the m ineralization. As
stated previously, all of the known m ineralized a reas studied in this
d is tric t a re associated with one of two m ajor directions: north or N.
60o-90° E ., especially with the la tte r. Nearly a ll of the dikes and
m ost of the m ineralized veins a re associated with this trend . Soil
sampling was ca rried out on trav e rse s run essentially norm al to these
trends of favorable s truc tu res.
Method of Sampling
In general the soil profile is poorly developed in the C erro
Colorado d istric t. Poor soil development is a common feature in a rid
a reas . Samples were taken from the ” 8 " soil horizon, where it was
present, usually a t a depth of 4 to 6 inches. A few sam ples were taken
at a depth of only 2 inches where bedrock was nearly at the surface. At
some sample sites a definite clay layer was developed in the "B" hori
zon, This development appeared to be especially evident in the soil
overlying the andesite porphyry dikes, perhaps indicating that these
rocks break down chemically in a different manner than the extrusive
rocks.38

39
Caliche is only ra re ly seen throughout the entire a rea mapped.
When present, it only occurs in minor amounts in the vicinity of some
of the sm aller arroyos. This lack of caliche is im portant in soil sam
pling since it means that the soil sampled is m ore closely rep resen ta
tive of the underlying rock type. Soil sam ples taken from above a
caliche horizon might not be representative of the underlying rock type
since the caliche could form an im perm eable b a rr ie r to inhibit m igra
tion and concentration of the desired elem ents.
As far as could be ascertained in the field all sampling was
done in residual soil; consequently, the sam ples should be rep resen ta
tive of the underlying rock type. This conclusion has been corroborated
by a com parison of several elem ents in soil sam ples with the underlying
bedrock. Both showed sim ilar concentrations when compared by X -ray
fluorescence analysis.
Every effort was taken to make su re that the sam ples were
not contaminated by unnatural m eans. Occasionally sample sites were
offset or spaced irregu larly to avoid such contamination.
Four trav e rse s w ere run to te s t th ree different a reas for de
tectable m ineralization (fig. 2). These trav e rse s a re tabulated in table
1.Samples were also taken from both the andesite dikes and the
andesite flow rocks in a reas rem ote from m ineralization. These sam
ples were used to determ ine the regional background values for all of

40
TABLE 1SOIL SAMPLING TRAVERSE DATA
T raverse Bearing Sample Interval
A
°oCO£ 25 feet
B North 50 feet
C N. 30° W. 25 feet
D N. 45° W. 25 feet
the analyses and to p repare standards. All sam ples were dried at 50°
C and sieved. The minus 200 fraction was retained for the analyses.
Selection of Methods of Investigation
Sulfide ore m inerals often contain trace elements as diadochic
substitutes in the struc tu res of m ore common m inerals (Fleisher,
1955). In a sim ila r manner trace elem ents may be p resen t in the com
mon country rock m inerals surrounding an orebody.
Elem ents often found as minor substitutions in sulfides include
As, Sb, Bi, Cd, Cu, Ga, Ge, Fe, Mn, Ag, Sn, Tl, Zn, Co, Se, Te,
In, Ni, Ba, Hg, Mo, V, and others. In the past decade a number of
Russian w orkers (for example: Fursov, 1958; Ozerova, 1959; Dvornikov
and Petrov, 1961; Dvornikov, Vasilevskaya, and Shcherbakov, 1963) and
41
an increasing number of w estern w orkers (Hawkes and Webb, 1962;
Hawkes and Williston, 1962) have studied the dispersion patterns p ro
duced by m ercury as a trace element in sulfide deposits. During em
placement of a given sulfide orebody, trace amounts of m ercury, as
well as other m etals present, -will be driven upward and outward beyond
the orebody proper, creating a dispersion aureole around the orebody
in an effort to reach equilibrium. Because i t is perhaps the m ost vola
tile chalcophilic element, m ercury can produce dispersion aureoles up
to 10 tim es wider, but quantitatively much sm alle r, than those of lead,
zinc, and copper; consequently, m ercury serves as a "pathfinder" ele
ment for base m etal sulfide orebodies. In addition, because they are
m ore widely dispersed, m ercury anom alies can be used to detect o re-
bodies at g reater depths (at least 300 m eters) than can be done with
other elem ents (Fursov, 1958).
Geological lite ra tu re contains many artic les which note that
various elem ents or compounds have been added to or subtracted from
the country rock adjacent to a m ineralized a rea as a d irec t re su lt of the
m ineralization.
On the basis of the above information, an investigation was
made of the dispersion of m ercury and other m etals rela tive to known
m ineralization in the C erro Colorado mining d is tric t, one known to con
tain sulfide deposits with a rela tively high m ercury content. Two in
vestigations will be discussed below under the headings Study of M ercury
42
Dispersion and Study of D ispersion of a Selected Group of Elem ents.
Study of M ercury D ispersion
As noted above, m ercury is known to be a "pathfinder" element
for various sulfide o res. To be useful, however, m ercury m ust nor
mally be detected with a method sensitive to as little as 10 to 20 ppb
Hge When the sensitivity is reduced to 0.3 to 0 .5 ppm, the m ercury
aureole is no wider than that of lead, and the m ercury method loses its
advantage (Ozerova, 1959).
Selection of Method of Analysis
Several methods have been used in the past for detecting trace
amounts of m ercury in soils and rocks. The R ussians, pioneers in the
use of m ercury as a "pathfinder," have re lied exclusively on an em is
sion spectrographic method (Sergeev, 1961). An ultraviolet absorption
technique has been used successfully in the United States (Hawkes and
Williston, 1962). The U. S. Geological Survey has developed a colori
m etric method for field determ inations (Ward and Bailey, 1960).
Because there has been no mention in the lite ra tu re of the use
of X -ray fluorescence for detecting trace amounts of m ercury, it was
decided to evaluate the fluorescence method in th is problem on at least
a semiquantitative basis. The use of this method for other trace anal
yses has been described by Liebhafsky et a l. (1960). In general this

43
method has several advantages over other methods: (1) The prepared
sample is not destroyed in the analysis— it can be sto red and rerun at
a la ter date, if necessary ; (2) the resu lts can be electronically plotted
on a graph to give a perm anent reco rd of re su lts obtained; and (3) sam
ples can be run for several elem ents at the sam e tim e without extra
preparation or separations.
There a re several obvious disadvantages: (1) The equipment
is costly; (2) the operator m ust be specially trained; (3) tim e for a
single quantitative analysis can exceed that of other analytical methods
unless sam ples a re run for several elem ents or many sam ples a re run
at one tim e; (4) the equipment in m ost cases is not reliab le for concen
trations below 0.02 weight percent of the elem ent sought; (5) under nor
mal circum stances the method cannot detect elem ents below about
calcium on the periodic table; and (6) interfering phenomena, including
undesirable enhancements and absorptions, and the effects of the ta rge t
spectra and changes in m atrix from sample to sample can reduce p re
cision and accuracy.
General Theory of X-Ray F luorescence Analysis
P repared sam ples a re exposed to a high-energy source. In the
investigation discussed here th is source is X -radiation. This energy,
when high enough, excites the atom s of the sam ple, displacing one or
m ore of the inner electrons of a given atom. Other electrons move
44
toward the nucleus to replace the electrons displaced. When these outer
electrons move inward, they convert excess energy of position to elec
tromagnetic energy, and the element will fluoresce or give off secondary
X-radiation at a characteristic se t of wavelengths for the given element,
regard less (for all p ractical purposes) of its valence or state of com
bination.
The secondary X -radiation impinges on an activated m aterial,
such as thallium -activated sodium iodide, and is converted into visible
light which is m easured by a photomultiplier tube.
By utilizing the Bragg equation n v = 2d sin 6 , where n and d
are constant for a given element, it can be shown that the sine of the
diffraction angle, e , is d irectly proportional to the wavelength, x . -
The characteristic wavelengths of m ost elem ents a re accurately known;
consequently, one need only se t off the diffraction angle on the X -ray
unit corresponding to a given wavelength and m easure the intensity of
the radiation a t this wavelength. One can also scan ac ro ss a given
value for the diffraction angle and obtain a continuous intensity curve.
The intensity of the fluorescent radiation over background
varies proportionately with the amount of the given element exposed in
the sam ple. By use of electronic c ircu itry th is intensity can be m eas
ured either by counting the energy pulsations given off or by plotting
them on a graph. Data thus obtained can then be used directly or con
verted to m ore suitable units by use of standards (Birks, 1959).

45
Analytical Procedure
All sam ples were analyzed on a G eneral E lectric XRD-5 X -ray
unit modified for fluorescence analysis. A platinum tube was used for
generation of p rim ary X -rays. The tube was run at 50 kv and 40 ma to
achieve the g reatest intensity of characteristic X -rays in the sam ples.
F luorescent radiation was monochromatized by being diffracted on a
lithium fluoride crysta l. Radiation intensity was m easured by a scin til
lation counter coupled both to an electronic counter and a graph reco rd er.
Although the sensitivity threshold of th is method for m ercury
was thought to be a concentration of around 100 to 200 ppm Hg, i t was
felt that the m ercury background concentration in the country rocks of
the C erro Colorado d is tric t, a m ercury province, might exceed this
sensitivity threshold. K th is assum ption w ere valid, then the method
might be feasible; however, early investigations indicated that th is high
background concentration of m ercury was not p resen t. In order to put
all sam ples above the sensitivity threshold, they were "spiked” with
400 ppm Hg (2 mg Hg added to 4.998 g of sam ple).
Standards were also prepared for concentrations of 100, 200,
400, 500, and 600 ppm Hg using m aterial of the sam e rock type as the
sam ples being tested but collected from a b arren a rea in order to m ain
tain, as nearly as possible, a constant m ass absorption coefficient of
the m atrix for both standards and field sam ples.

46
Dried, sieved, and "spiked" sam ples were placed ii a planchette
and firm ly p ressed to provide a smooth uniform surface of exposure.
The planchette was next put in a sam ple holder in the X -ray unit and
then counted for 100 seconds both at the peak value of the m ost intense
m ercury line, La^ f irs t order, and a t established background points on
either side of the peak. Each sam ple was then ro tated 90° in the sample
holder and analyzed again. If the sample values from both orientations
did not agree within about + 2 percent (approximately 10 counts per sec
ond), then a new sample was made and analyzed. Background counts
were then averaged and th is average subtracted from the peak count to
determ ine the net count for interpretation. The data obtained were then
plotted graphically (figs. 18-25).
D iscussion of Analyses
Because b arren andesite porphyry flow rock sam ples taken
over several square m iles gave nearly identical values across the m eas
ured m ercury peak, an in itial assumption was made that the background
was constant, and all sam ples were run for total counts. A correction
factor was established for the andesite porphyry dike sam ples based on
slight intensity differences noted between standard sam ples of th is unit
and those of the flow rock unit.
To check the validity of the above assum ption sam ples from
trav e rse A were run for a net count and a total count. The comparison

47
of the two methods (fig. 19) revea ls a sim ilarity of high and low values,
indicating that the background is essentially the sam e for each of the
two rock units m easured. T raverses C and D were therefore not run
for net counts.
Standards were plotted as total and net peak values against
p a rts per million m ercury on arithm etic graph paper, and then standard
conversion lines were drawn (fig. 18).
Total peak values for trav e rse s A, B, and D and net values for
trav e rse A were then plotted against feet of trav e rse covered. These
line graphs were then com pared to the known lithology and m ineraliza
tion of the sample a reas (figs. 19-21).
The net count line in figure 19 shows that nearly all sam ples
in trav e rse A, run across an exposed vein on the north flank of Silver
Hill, were at or below background (400 ppm Hg).
The high at site A-4 is topographically above the known min
eralization, but within 50 feet of it. The broad plateau including sam ples
A-10 to A-16 probably reflec ts the change of rock type. The steep low
at A-17 may be re la ted to a 5-foot rhyolite dike intruded in the andesite
porphyry dike-flow rock contact near the sam ple location.
T raverses C and D a re plotted only for total concentrations
(figs. 20 and 21). Again, no significant correlation is evident between
the values obtained and the associated geology. The peak for sample
C-3 might be re la ted to nearby quartz vein outcrops. Samples D-18 to

200
r /V
' l
700
48
j f -
TOTAL COUNTS PER SECOND
NET COUNTS PER SECOND FIG
. 18.
STA
ND
AR
DIZ
ATI
ON
CU
RVE
S FO
R
Hg.
49
ppm . Hg
FIG
. 19.
TR
AV
ERSE
'A S
OIL
SAM
PLE
DA
TA-
Hg

500
50
l i i I
3 C-14
lcoin0z<1otrou_oLUt™CO
Q > <
oOI
Taf_
Tad
Jaf_
J a d
Taf
Tad
Taf
vein
vein
ppm Hg
S i
S4LU
<UCO
o J
FIG
. 20
. TR
AV
ER
SE r
SO
IL
SAM
PLE
DA
TA-
Hg

M.S7N
51
ppm Hg
FIG
. 21
. TR
AV
ERSE
'O
' SO
IL
SAM
PLE
DA
TA-H
g

52
D-20 show a high which extends out of the a rea sampled. Since there is
no surface exposure of m ineralization in th is area , th is high may rep
resen t a change in the m atrix . However, one of the veins mapped by
Davis (1955) underground may reach the surface in th is vicinity. There
is also a possibility of contamination in th is area . The sam ples were
carefully taken, but the a rea is near the south shaft and several mine
buildings and could have been contaminated by m an 's activ ities.
The fact that many of the sam ples ran below the background
level is puzzling. Weighings for "spikes” were all done to an accuracy
of + 0.1 mg in a 5 g sample (+ 20 ppm). Mixing was accomplished by
repeated passes of the sam ples through a se t of sieves grading down to
minus 140 m esh. The fact that the standardization net-count plot is
very close to a straight line— the expected configuration over a narrow
range of concentration— would seem to preclude weighing and mixing
e r ro rs .
Counting e r ro rs due to any slight differences in sample prep
aration are reduced by repetition of counting to gain a statistically m ore
accurate value. Another possible explanation for the low values might
be the effects of enhancement or absorption of m ercury by the elem ents
p resen t in the country rocks or by the platinum tube.

53
Conclusions
X -ray fluorescence as used in this investigation is not effec
tive in detecting trace amounts of m ercury in concentrations below■ ■ ■
about 100 ppm m ercury. For the detection of m ercury dispersion pat
te rn s, a method is needed that can detect m ercury in concentrations
between 10 ppb and 100 ppm. Although the addition of 400 ppm of m er
cury to each sample will put its total m ercury content within the detect
able range, the discrim ination of the method is not good enough to detect
reliably the difference between a dead sample with 400 ppm Hg and an
anomalous sample with, for example, 401 ppm, the concentration of a
"spiked" sample containing 1 ppm Hg above background. An increase
in the counting tim e per sam ple from 100 seconds to 200 seconds did not
help in increasing the reliab ility of the method.
It was originally thought that the C erro Colorado d is tric t, being
in a m ercury province, might show high m ercury concentrations in the
soil, especially near orebodies, so that sensitiv ities would not have to
be below 100 ppm for detection. The re su lts of th is study show that
such high concentrations of m ercury only exist in the ore m inerals
them selves and not as a d ispersion pattern around the orebodies. The
range of dispersed mercury in the soil in the Cerro,Colorado d is tric t is
probably on the sam e order of magnitude as was determ ined in Russian
and Am erican studies (10 ppb to 100 ppm).
54
A number of modifications to the method used a re possible.
Changes in one or m ore of these might increase the sensitivity or r e
liability of the method and perhaps make it applicable for concentrations
of the magnitude desired in m ercury detection. Some of the m ore im
portant modifications that could be made a re (1) the use of a controlled
atm osphere— helium or a vacuum— to increase the net radiation reach
ing the scintillation counter, (2) the use of the sample as the X -ray tube
target, (3) concentration of the elem ents sought, by dry or wet methods,
before analysis, (4) the use of m ateria l of minus 300 m esh or sm alle r,
and (5) mechanical adjustm ents in the basic equipment (see Liebhafsky
et a l . , 1960; B irks, 1959 for m ore detailed discussions).
Study of D ispersion of a Selected Group of Elem ents
The second study made in th is investigation of trace elements
was to determ ine if any of a selected group of the m ore abundant ele
ments p resen t in the soil sam ples might show a characte ristic change
in concentration that could be re la ted to a reas of m ineralization.
Selection of Elem ents for Further Investigation
Representative sam ples from near each m ineralized a rea sam
pled were f ir s t scanned with the X -ray unit through a range of 5° to 110°
IQ in order to gain a qualitative estim ate of the heavy elem ents presen t.

55
Those elem ents detected with reasonable certainty include Cu, Zn, Pb,
Fe, Mn, Sr, Ag, Hg, and Se.
The previous work with m ercury showed that it was not a
"pathfinder" m ineral within the range of sensitivity of the X -ray unit
used; consequently, th is element was eliminated from further study.
Probably because both Fe and Mn a re persis ten t throughout the a rea
studied, prelim inary plots of these elem ents showed no trends re la ted
to known m ineralization; therefore, these elem ents were also eliminated.
P relim inary work also disclosed that the peaks of Ag, Pb, and Se were(
obscured by stronger platinum peaks and superim posed higher order
peaks of other elem ents. A clear definition of the peaks of these th ree
elements for m easurem ent was therefore not deemed possible, and
these elem ents were also elim inated.
The final investigation was therefore concentrated on Sr, Zn,
and Cu, none of which appeared to have any interfering elem ents near
its high-intensity peaks. The em ission lines used in the scanning of
these three elem ents w ere, in all th ree cases, the K alpha f irs t order
peaks.
Method of Analysis
The sam ples for th is investigation w ere prepared in the same
manner as for the m ercury determ inations and were scanned using a
log scale for Sr, Zn, and Cu so as to obtain a complete peak for each.

56
A line was drawn between the two minimum values on each side of the
peak. The distance between the maximum peak point and the minimum
peak line was then m easured horizontally and recorded in m illim eters.
This distance rep resen ts semiquantitatively the amount of the given
element present in the sam ple. No standards were made to equate
peak heights to p arts per million of each element since a rela tive change
or trend was sought. No attem pt was made to count on any of the peaks
since the em phasis in this experiment was to determ ine trends by a
m ore rapid method than was used in the previous m ercury investigations.
D iscussion of Analyses
Plots were made on arithm etic graph paper of m easured net
peak heights of sam ples against distance along a given trav e rse for
each of the th ree elements investigated (figs. 22-25). These line plots
were then compared to the geology traversed .
Samples from trav e rse A (fig. 22) show a crude pattern of
positive and negative anomalies which apparently a re re la ted to known
m ineralization. Both Cu and Zn plots show a noticeable r is e in values
between sample sites A-3 and A-10. These plateaus a re approximately
centered on the vein located near site A -6.
An apparent Sr low centered at site A -5 may also be re la ted to
the m ineralization. If th is variation, is rea l, a coincidence of a low Sr
value with either a Zn or Cu high value or with both may be the best


58
guide to m ineralization. A noticeable drop in Cu and Zn values to the
northwest of site A -10 is apparently re la ted to a change in rock units.
The andesite porphyry flow rock-dike contact is thought to be between
sites A - l l and A-12.
T raverse B, about 800 feet east of trav e rse A, did not cross
any exposed quartz veins (fig. 2). Sampling, on th is trav e rse only,
was done at 50-foot in tervals. A study of the trav e rse B plots (fig. 23)
would seem to indicate that the m ost favorable location for further ex
amination would be near sample site B-5 where the closest coincidence
of a low Sr value and high Cu and Zn values can be found. The peak in
tensity dropoff due to the andesite porphyry dike is again evident north
of site B-7,
On trav e rse C (fig. 24) quartz float is fa irly common between
sample sites C-2 and C-4, a probable indication of a nearby vein. The
Zn "peaks” a t s ites C-2 and C-4 and the Cu "peak" at site C-3, as well
as the Sr lows at s ites C-2 and C-4, may be re la ted to this m ineraliza
tion. Because these "peaks" a re not well defined, it appears m ore likely
that they are a fortuitous expression of background variations.
The m ost prom ising a rea on this trav e rse is around sample
site C -8. Although this sample shows essentially no positive response
from Cu, it does show a good peak from Zn coupled with a strong low
from Sr. No m ineralization is known a t th is site; the values may be due
to a change in rock unit.

NO
RT
H
59
FIG
. 23
. T
RA
VE
RSE
'B'
SOIL
SA
MPL
E D
AT
A-S
r.Zn.
Cu.

MoO
CN \
/ 3oO
CS
60
zzo%
lU —1 < u tnPEAK HEIGHT ini FI
G.
24.
TRA
VE
RSE
C S
OIL
SA
MPL
E D
AT
A-S
r,Z
n,C
u.

61
T raverse D (fig. 25) was run across the main vein at the
M ary G mine (N. 10° E . , 45° W .). The surface projection of th is vein,
based on underground data by Davis (1955), is thought to be between
sam ple sites D-3 and D-5, and the line plots seem to bear th is out.
The highest intensities obtained for Cu and Zn were both at site D-4,
while the Sr low is 50 feet further to the southeast.
Site D-19 also exhibits a favorable coincidence of the th ree
elem ents. Although there is no surface indication of m ineralization in
this a rea , Davis’ mine map shows a strongly m ineralized vein striking
east and dipping steeply to the north, which, when projected to the su r
face, would crop out very near site D-19. It should be recalled , how
ever, that the m ercury plot near site D-19 also was high. Both highs
may be the re su lt of a m atrix change.
Conclusions
X -ray fluorescence analysis as a rapid means of determining
trace-elem ent dispersion patterns, on at least a semiquantitative basis,
appears to be a useful tool, particu larly when the analyzing is done in
a vacuum. The ability to scan a sample rapidly for a large number of
elem ents might prove very useful in evaluating an ore deposit qualita
tively. There can be little doubt that many potentially valuable elements
and m inerals have been overlooked in ore-deposit evaluations because
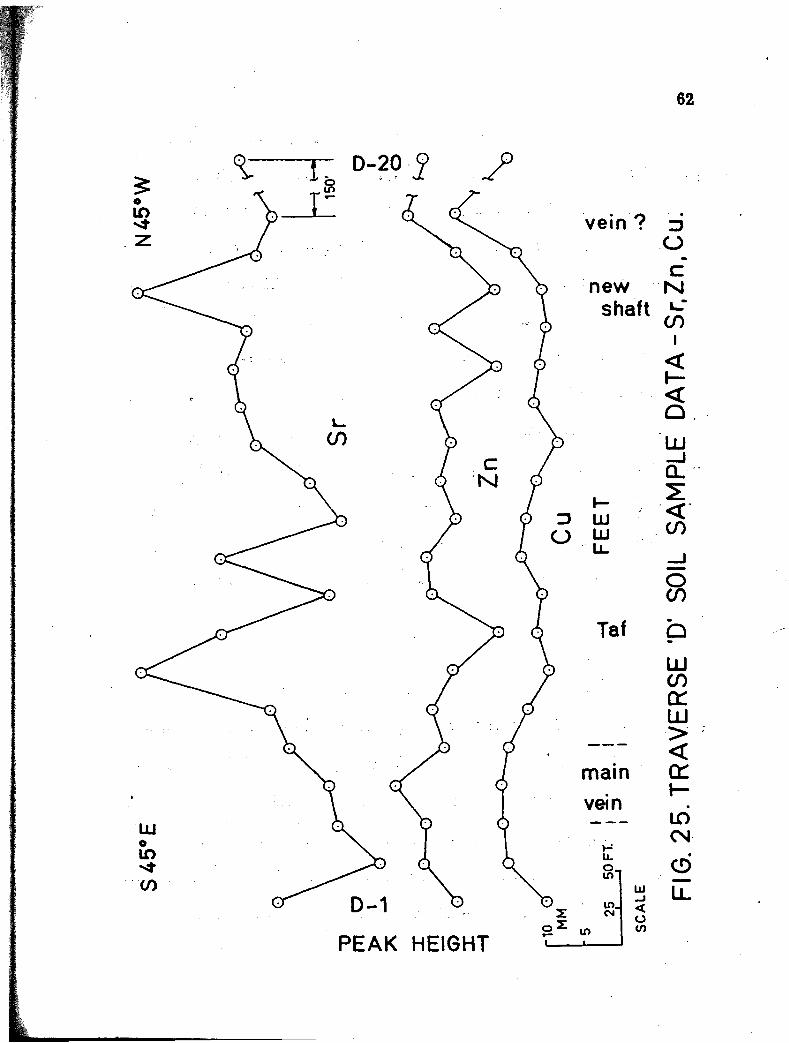
S 45
® E
ft
R
N
45*W
62
T " D -2 0 9• JL * V . ' vi.
vein ?
n ewsh aft
0-1
PEAK HEIGHT
FIG
. 25.
TR
AV
ER
SE '
D' S
OIL
SAM
PLE
DA
TA
-Sr.
Zn.
Cu.
63
the evaluator was not aware of their presence or was only looking for
specific elem ents or m inerals.
The method for delineating dispersion patterns used in this in
vestigation may hold m erit, but only for certain elem ents, and these
elem ents m ust be presen t in detectable quantities. The coincidence of
high Cu and Zn values and low Sr values near suspected sites of min
eralization seem s to be m ore than just a fortuitous occurrence.
An increase in Cu and Zn as sampling approaches a vein is to
be expected. It is somewhat m ore difficult to explain the decrease in
Sr, Spectrographic analyses of ore m inerals and host rocks indicate
that Sr is fairly abundant in the host rocks but essentially absent in the
ore. This is in keeping with geochemical data which show that concen
trations of Sr in igneous rocks a re norm ally around 350 ppm (Green,
1959), well above the sensitivity threshold of the analytical method
used. Apparently the low Sr values are due to a dilution of the S r-
r ich host rock soil by the Sr-deficient vein soil. The possibility also
exists that the heat or reactiv ity of the m ineralizing solutions was great
enough to drive the Sr away from the vein or leach it from the contiguous
wall rock and transport i t elsew here.
Weathering may also have played a p a rt in the dispersing of
the th ree elem ents to the ir p resen t localities, but the general lack of a
well-developed soil profile would seem to indicate that the effects of
weathering a re relatively minor in th is a rea .
A com parison was made of the line plots of Hg with those of
Sr, Zn, and Cu for each trav e rse . Only trav e rse C showed anything
reasonably close to a coincidence of highs and lows; consequently, it
can be resta ted that the m ercury plots are probably meaningless as far
as determining any dispersion pattern re la ted to m ineralization.
The platinum tube may not be the best one for determining a ll
of the elem ents sought in this or any other investigation. Platinum
peaks in terfered with those of Pb, Ag, and Se; w hereas, the Cu, Zn,
and Sr peaks were not adversely affected, and these elem ents could be
analyzed with a platinum tube. K elem ents other than those lis ted above
a re sought, another tube ta rg e t might be necessary .
Sampling, if not done consistently from the same soil environ
ment, may give erroneous re su lts . Hawkes and Webb (1962) illu stra te
the problem s inherent with th is situation. Every effort was made in
this work to achieve a consistency in sampling to avoid such problem s.
The topographic slope over an orebody can cause a downhill
m igration of the associated anomaly. No evidence of such an effect was
seen in any of the trav e rse s ; however, m ore data might show such a
phenomenon.
64
RECOMMENDATIONS FOR FUTURE STUDY
As a resu lt of the fieldwork and sample analyses, several
suggestions can be made as to problem s needing further work, hi te rm s
of geology, a t least three problem s need m ore study. The source of the
quartzite in the C erro Colorado Conglomerate is as yet unknown; con
sequently, a much broader p icture of the geology of th is region is
needed. Even after further geologic mapping in the region, the source
a rea may never be found; for the present there is not enough known
about the geology of the region to give an adequate answer.
A detailed analysis of the lineation in the flow rocks might
prove useful in determining the orientation and source of the flows and
thereby fill the present void concerning the stratigraphy of the region.
Lastly, geochemical dating of the dikes or flow rocks, if feasible,
could provide a maximum date for the m ineralization in the d istric t as
well as give a better age for all the units present.
Much work is needed in the applications of X -ray fluorescence
analysis to naturally occurring m ateria ls . If fluorescence analysis is
ever to compete with rapid wet chem ical field methods in applied geo
chem ical studies, a method is needed to increase the sensitivity and
accuracy of resu lts in a variety of m atrices without m aterially increasing
65

66
the tim e for each analysis. Basic data obtained by X -ray fluorescence
analysis on naturally occurring m aterials in widely differing environ
ments would be extrem ely useful for further evaluating th is method in
te rm s of applied geochem istry.
Methods need to be perfected for analyzing the lighter ele
m ents. In a study such as this one, an examination of any trends in
concentrations of such elem ents as Ca, Mg, Si, and A1 might have been
of value.
In the a rea investigated in th is problem m ore extensive sam
pling is needed to prove conclusively that dispersion patterns actually
do exist and a re coincident with m ineralization, A m ore detailed study
of sampling in tervals might also show that 25 feet is not the optimum
spacing.
Ultimately, absolute values should be determ ined for all ele
m ents sampled. This can be done by comparing field sam ples to stand
ards using X -ray fluorescence or an independent wet analysis technique.
With the absolute values of the sam ples a better assessm ent of the
magnitude of any m ineralization discovered can be made.
If a large number of sam ples were run in th is area , or in any
other, a reduction of the data by use of a s ta tistica l approach would
help in evaluation of the data.

REFERENCES CITED
Allen, E» T. , and Crenshaw, J» L ., 1912, The sulphides of zinc,cadmium, and m ercury; their crystalline form s and genetic conditions: Am. Jour. S c i., 4th s e r . , v. 34, p. 367-383.
Bailey, E. H ., and Stevens, R . E ., 1960, Selective staining of K-feldspar and plagioclase on rock slabs and thin sections: Am. M ineralogist, v. 45, p. 1020-1025.
Bancroft, Howard, 1909, Notes on the occurrence of cinnabar in centr a l w estern Arizona: U.S. Geol. Survey Bull. 430, p. 151- 153.
B irks, L. S ., 1959, X -ray spectrochem ical analysis: New York, Interscience Publishers, Inc ., 137 p.
Booer, J . R . , 1944, The behavior of m ercury compounds in soil: Annals App. B io l., v. 31, p. 340-359.
Burbank, W. S ., 1933, Epitherm al base-m etal deposits in Ore deposits of the w estern sta tes: New York, Am. Inst. Mining and Met. E ng., p. 641-682.
Davis, R. E . , 1955, Geology of the M ary G mine area , Pim a County, Arizona: unpublished master* s thesis, Univ. Arizona, 51 p.
Dvornikov, A. G ., and Petrov, V. Y a ., 1961, Some data on the content of m ercury in soils of the Nagol'nyi Range: Geochemistry, no. 10, p. 1021-1028.
Dvornikov, A. G ., Vasilevskaya, A. E . , and Shcherbakov, V. P . ,1963, M ercury dispersion aureoles in the soils of the NagoVnyi Range: Geochemistry, no. 5, p. 501-509.
Emmons, W. H ., 1940, The principles of economic geology: New York, McGraw-Hill Book C o., Inc ., 2nd ed ., 529 p.
67

68
F leischer, Michael, 1955, Minor elem ents in some sulfide m inerals: Econ. Geol. 50th Ann. V ol., p. 970-1024.
Furzov, V. Z ., 1958, Halos of dispersed m ercury as prospectingguides at the Achisai lead-zinc deposits: Geochemistry, no.3, p. 338-344.
Graton, L. C ., 1933, The depth-zones in ore deposition: Econ. G eol., v. 28, no. 6, p. 513-555.
Green, Jack, 1959, Geochemical table of the elem ents: Geol. Soc. A m erica B u ll., v. 70, no. 9, p. 1127-1184.
Hawkes, H. E . , and Webb, J. S ., 1962, Geochemistry in m ineral exploration: New York, H arper and Row, 415 p.
Hawkes, H. E ., and Williston, S. H ., 1962, M ercury vapor as a guide to lead-zinc deposits: Mining Cong. Jo u r ., v. 48, no. 12, p. 30-32.
Jones, R. D ., 1957, Geology of the C erro Colorado mining d istric t: unpublished m aste r1 s thesis, Univ. Arizona, 59 p.
Krauskopf, K. B ., 1964, The possible ro le of volatile m etal compounds in ore genesis: Econ. GeoL, v. 59, no. 1, p. 22-45.
Lausen, C arl, and G ardner, E. D ., 1927, Quicksilver resou rces of Arizona: A riz. Bur. Mines Bull. 122, 113 p.
Liebhafsky, H. A ., P feiffer, H. G ., Winslow, E. H ., and Zemany,P . D ., 1960, X -ray absorption and em ission in analytical chem istry: New York, John Wiley and Sons, Inc ., 357 p.
Lindgren, Waldemar, 1933, M ineral deposits: New York, McGraw- Hill Book C o., In c ., 4th ed ., 930 p.
Mayo, E. B ., 1958, Lineament tectonics and some ore d istric ts of the Southwest: Mining Engineering, v. 10, no. 11, p. 1169-1175.
Ozerova, N. A ., 1959, The use of p rim ary dispersion halos of m ercury in the search for lead-zinc deposits: Geochemistry, no. 7, p. 793-801.
69
Sergeev, E. A ., 1961, Methods of m ercurom etric investigations: International Geol. R ev ., v. 3, no. 2, p. 93-99.
T rav is, R. B ., 1955, Classification of rocks: Golden, C olo ., Colo. School of Mines Q u art., v. 50, no. 1, 98 p.
Ward, F . N ., and Bailey, E. H ., 1959, Camp and sam ple-site determination of traces of m ercury in soils and rocks: Am. Inst. Mining and Met. Eng. T ra n s ., v. 217, p. 343-350.
W illiams, Howel, T urner, F . J . , and G ilbert, C. M ., 1958, Petrography: San Francisco, W. H. Freem an and C o ., 406 p.

T 20 S.
R.I0E% ’
s. 'Tad * ' - - - 'Tad
I " * . Tr
y Z z z ■ 'y y SO od
cLf
-T?1>/
A O. X Irl-1
15' Dd* » " / "
Qal
Qalxl
Ta d /
m i y < « x)gr ^al o F6 tin
e n
r '
ilMFe .;10X ® Fe
/ . ; ■fit ^y#oX.,
%/
Z
j
fI x
\
t y x \dy
1tFe
' 30 cMfi-’sr* * z F e ® 8 So F«
x v %
T r ^Q F e M ^ / f p Q Met
z
-
XV
> \ J
y : ^ a z ^ 6 -ra d z
v 4 .
Tad-------7Q
Tr: /
--'• z / X < 70 \ , \ \ A
: / . y j T C y t D y I X A i M a t
z>y .»/• ^ Ta^ x ' \ T*f , - -i°,z : I*x
A' F* tit c z / ^ / A ; .
> - . . :
w A T q t
' \ k ... i
y
V
X
f*» -oai-X C
EXPLANATION
jAlluvium f Q U A T E R N A R YJ
t 7 Rhyolite dikes
Andesite porphyry dikes
Andesite porphyry f lows TERTIARY ( ? )
tl£*f Cerro Colorado Conglomerate
Quartz lati te porphyry
V Q T d S l G n 0 0 S n l S f * \ ,
' C •, ' Tql -W
^ Iti ZP /
IX V
X":v'
/X
zX
, * f e z . \Vr '►Z Y < J
/ / /
l
Topographic Base from U. S. Geological Survey Arivaca Quadrangle, Arizona
Geology by M A Chaffee, '64
Contact showing dip. Dashed where approximately located.dotted where concealed
Fault showing dip
Strike and dip of vert ical joint
Strike and dip of foliation
Mineral ised vein showing dip
Shaft
Adit
Prospect pit
Sampling traverses
Mineralization and hydrothermal alteration
ABBREVIATIONSAz Azur i te
Cal Calc ite Dd dead Fe Iron oxide Gn Galena Mai Malachite
Py Pyrite
Q Quartz SI Sphalerite
Spec S p e c u la n te
Td Tetra hedrite
GEOLOGIC MAP OF A PORTION OF THE CERRO COLORADO MINING DISTRICT
PIMA COUNTY, ARIZONA1000 750 500 250 0
FIGURE 21000
— G 52000 FEET
SCALE 1 :12 ,3 60
CONTOUR INTERVAL 50 FT,
DATUM IS MEAN SEA LEVEL
TN Mfj