Embed Size (px)
Citation preview

NASA/CR-2002-211675
A Description of the Software Element of the NASA Portable Electronic Device Radiated Emissions Investigation
Sandra V. KoppenLockheed Martin Corporation, Hampton, Virginia
May 2002

The NASA STI Program Office . . . in Profile
Since its founding, NASA has been dedicated to the advancement of aeronautics and space science. The NASA Scientific and Technical Information (STI) Program Office plays a key part in helping NASA maintain this important role.
The NASA STI Program Office is operated by Langley Research Center, the lead center for NASA’s scientific and technical information. The NASA STI Program Office provides access to the NASA STI Database, the largest collection of aeronautical and space science STI in the world. The Program Office is also NASA’s institutional mechanism for disseminating the results of its research and development activities. These results are published by NASA in the NASA STI Report Series, which includes the following report types:
• TECHNICAL PUBLICATION. Reports of completed research or a major significant phase of research that present the results of NASA programs and include extensive data or theoretical analysis. Includes compilations of significant scientific and technical data and information deemed to be of continuing reference value. NASA counterpart of peer-reviewed formal professional papers, but having less stringent limitations on manuscript length and extent of graphic presentations.
• TECHNICAL MEMORANDUM. Scientific and technical findings that are preliminary or of specialized interest, e.g., quick release reports, working papers, and bibliographies that contain minimal annotation. Does not contain extensive analysis.
• CONTRACTOR REPORT. Scientific and technical findings by NASA-sponsored contractors and grantees.
• CONFERENCE PUBLICATION. Collected papers from scientific and technical conferences, symposia, seminars, or other meetings sponsored or co-sponsored by NASA.
• SPECIAL PUBLICATION. Scientific, technical, or historical information from NASA programs, projects, and missions, often concerned with subjects having substantial public interest.
TECHNICAL TRANSLATION. English-language translations of foreign scientific and technical material pertinent to NASA’s mission.
Specialized services that complement the STI Program Office’s diverse offerings include creating custom thesauri, building customized databases, organizing and publishing research results . . . even providing videos.
For more information about the NASA STI Program Office, see the following:
• Access the NASA STI Program Home Page at
http://www.sti.nasa.gov
• Email your question via the Internet to [email protected]
• Fax your question to the NASA STI Help Desk at (301) 621-0134
• Telephone the NASA STI Help Desk at (301) 621-0390
• Write to:NASA STI Help DeskNASA Center for AeroSpace Information7121 Standard DriveHanover, MD 21076-1320

National Aeronautics andSpace Administration
Langley Research CenterHampton, Virginia 23681-2199
NASA/CR-2002-211675
A Description of the Software Element of the NASA Portable Electronic Device Radiated Emissions Investigation
Sandra V. KoppenLockheed Martin Corporation, Hampton, Virginia
May 2002
Prepared for Langley Research Centerunder Contract NAS1-00135

Available from:
NASA Center for AeroSpace Information (CASI) National Technical Information Service (NTIS)7121 Standard Drive 5285 Port Royal RoadHanover, MD 21076-1320 Springfield, VA 22161-2171(301) 621-0390 (703) 605-6000
The use of trademarks or names of manufacturers in this report is for accurate reporting and does not constitute anofficial endorsement, either expressed or implied, of such products or manufacturers by the National Aeronautics andSpace Administration.

- 1 -
Abstract
NASA Langley Research Center's (LaRC) High Intensity Radiated Fields Laboratory (HIRF Lab) recently conducted a series of electromagnetic radiated emissions tests under a cooperative agreement with Delta Airlines and an interagency agreement with the Federal Aviation Administration (FAA). The frequency spectrum environment at a commercial airport was measured on location. The environment survey provides a comprehensive picture of the complex nature of the electromagnetic environment present in those areas outside the aircraft. In addition, radiated emissions tests were conducted on portable electronic devices (PEDs) that may be brought onboard aircraft. These tests were performed in both semi-anechoic and reverberation chambers located in the HIRF Lab. The PEDs included cell phones, laptop computers, electronic toys, and family radio systems. The data generated during the tests are intended to support the research on the effect of radiated emissions from wireless devices on aircraft avionic systems.
Both test systems relied on customized control and data reduction software to provide test and instrument control, data acquisition, a user interface, real time data reduction, and data analysis. The software executed on PC's running MS Windows 98 and 2000, and used Agilent Pro Visual Engineering Environment (VEE) development software, Component Object Model (COM) technology, and MS Excel.
This report describes the tests and automated data acquisition systems used on location at the airport and in the HIRF Lab. In addition, the data reduction process is discussed in detail. The main concentration is on the application and development of the software used for the emissions tests and data analysis. Hardware and software interfaces are illustrated and discussed, as well as, file formats and the development process.

- 2 -
Symbols and Abbreviations
CDMACode Division Multiple Access
COM Component Object Model
DBm Decibel referenced to 1 mW
DUT Device Under Test
EMC Electromagnetic Compatibility
EMI Electromagnetic Interference
FAA Federal Aviation Administration
GPS Global Positioning System
GSM Global System for Mobile Communication
PED Portable Electronic Device
RF Radio Frequency
RTCA Formerly the Radio Technical Committee on Aeronautics
SA Spectrum Analyzer
VEE Visual Engineering Environment

- 3 -
Introduction
The goal of the electromagnetic radiated emissions experiments conducted by the HIRF Lab personnel is to characterize the interference potential of wireless devices to aircraft communication and navigation receivers and to develop a measurement process for evaluating the radiated emissions produced by wireless phones. In support of this goal, the software provided an automated method for implementing the measurement process, acquiring data, and analyzing data. The information resulting from the conduct of an extensive series of tests is of benefit for understanding aircraft electromagnetic interference (EMI) issues and for advancing research performed on portable electronic device emission measurements and, thereby, promoting safe flight.
The advancement of wireless technology has produced numerous portable electronic devices that many people rely on daily. It is a reasonable expectation that these devices will be brought onboard commercial aircraft. However, the operation of intentional wireless transmitters, such as cell phones, is currently prohibited during flight and the use of unintentional wireless transmitters, such as laptop computers, is restricted. Anecdotal data obtained from the Aviation Safety Reporting System Database suggests that operation of PEDs onboard an aircraft may interfere with aircraft flight systems producing anomalous behavior [Ref. 1]. It is, therefore, important to provide an understanding supported by empirical data of the potential effects of radiated emissions from PEDs on and around aircraft avionic systems. With this information, the airlines, the wireless device industry, and the regulatory agencies are equipped to develop policies that support aircraft safety.
The research currently conducted by members of the NASA HIRF Lab and its partners has evolved around two specific efforts. Included in the research are the airport frequency spectrum environment survey measurements and the electromagnetic radiated emissions tests conducted on wireless devices. During the summer of 2000, several members of the NASA HIRF Lab traveled to the Atlanta Hartsfield Airport and working together with Delta Airlines personnel setup and conducted tests to monitor the electromagnetic environment present at an airport terminal gate and outside a loading ramp. The tests were designed to provide a picture of the electromagnetic environment that may be present at an airport outside the aircraft with an emphasis on aircraft communication and navigation frequency bands and signals produced by PEDs.
A related but different series of emissions tests were conducted at NASA LaRC in a semi-anechoic chamber and a reverberation chamber on an assortment of cell phones and other wireless devices. Numerous emissions tests were performed to determine the effects produced by various cell phone power levels and operating modes, by manipulating a cell phone while transmitting, by extending and retracting a cell phone antenna, and by holding a cell phone close to a human head or an arm's distance away. Included in the test series were tests to characterize any effects produced as cell phone battery power was exhausted. The results of the tests were analyzed and the data correlated between chambers.

- 4 -
The software requirements were derived from the experimental nature of the tests. The main objective of the test software was to develop an automated measurement process for capturing and recording radiated emissions. As exact hardware configurations, measurement conditions and variables were not known initially, software flexibility was a necessity. The software provided the ability to control instruments and assign parameters that may vary depending on test conditions. In addition, the test software was usable in either semi-anechoic or reverberation chambers and with varying instrumentation. Feedback was provided in the form of instrument settings and data displays. As software development progressed, additional requirements were identified and implemented.
The cell phone emissions tests and battery life tests produced large amounts of data, some of which were redundant and not in support of the analysis process. In order to reduce the time required for data reduction and analysis, software was developed to manipulate and organize the data to a manageable size. Software was designed and implemented to provide the capability to identify and sort extraneous data and to consistently display data using MS Excel spreadsheets and charts.
This paper describes the development of measurement and data acquisition systems for both series of tests, the control software, and the data reduction software. Also, described are the application procedures, software evolution, and development of a software tool set. The user interfaces, software capabilities, and future development are discussed in detail.
Test and Software Architecture
Test and data analysis requirements mandated the development of a software tool set. The set includes three separate software implementations. The Electromagnetic Interference (EMI) Test Software was used during emissions testing to control data acquisition and to capture and record data. The EMI Data Reduction and Plotting Software was used to reduce and analyze data in a consistent and timely manner. The EMI Battery Life Data Screening Software was used to reduce, screen, and identify pertinent data.

- 5 -
Figure 1: Block Diagram of Measurement Tasks and Analysis Tasks
Test measurement tasks and data reduction tasks can be associated directly with the software utilized to perform each task. Figure 1 is a block diagram of the measurement and analysis tasks conducted during the PEDs radiated emissions effects research effort. The tasks that were software-supported and automated appear in dashed-lined blocks. The tasks performed manually appear in solid-lined blocks. The diagram illustrates that all measurement tasks were automated using customized software. In addition, software was provided for data reduction and analysis for all test data except the EMI Environment Survey Measurements. As illustrated, all data, both reduced and raw, was stored and resides in a database.
Figure 2 relates the measurement and analysis tasks of Figure 1 to the software utilized to perform the tasks. Each block in Figure 1 has a corresponding block in Figure 2. The dashed-lined blocks represent specialized software used to support the tasks as specified in Figure 1. For instance, the Semi-Anechoic Emission Measurements task illustrated in Figure 1 was implemented using the Emissions Test Operation in the EMI Test Software shown in Figure 2. The solid-lined block represents software that was utilized manually to perform a task. Lines are drawn to indicate the data reduction and analysis software employed to process data from each test. Automated data analysis included the Data Reduction and Plotting Software and the Battery
Semi-Anechoic Emission Msmts.
Reverberation Chamber Emission
Msmts.
Reverberation Chamber Spectrum Monitoring Msmts.
HIRF Lab EMI Emissions Msmts
Manual Data Analysis Automated Data
Analysis
Stored Database
PED's Emissions Testing
EMI Environment
Survey Msmts.

- 6 -
Life Data Screening Software. As indicated by the diagram, all data reduction software produced data files.
Figure 2: Block Diagram of Emission Test and Data Reduction and Analysis Software
Software design utilized an object-oriented methodology. Functions needed to perform tasks were identified, implemented, and tested. Selection of ActiveX components to perform computational and plotting tasks was based on functionality, familiarity, and ease of use. The user interfaces were designed and modified on a user feedback basis. File formats were designed to be compatible among the various software tools. Error trapping and handling were designed, but only partially implemented and presently include file I/O and instrument communication fault detection.
Airport EMI Environment Survey Test
Test Description
The Airport EMI Environment Survey Test requirements were to monitor the environment for electromagnetic radiated signals, capture the measurements, and record the data. The test employed two fully automated spectrum monitoring systems as presented in the block diagram in
PED's Emissions Software
Emissions Test Operation
EMI Environment
Monitor Software.
Emissions Test Operation
Spectrum Monitoring Operation.
MatLab
Stored Database
Data Reduction and Plotting Software
BatLif Data Screening Software
EMI Test Software

- 7 -
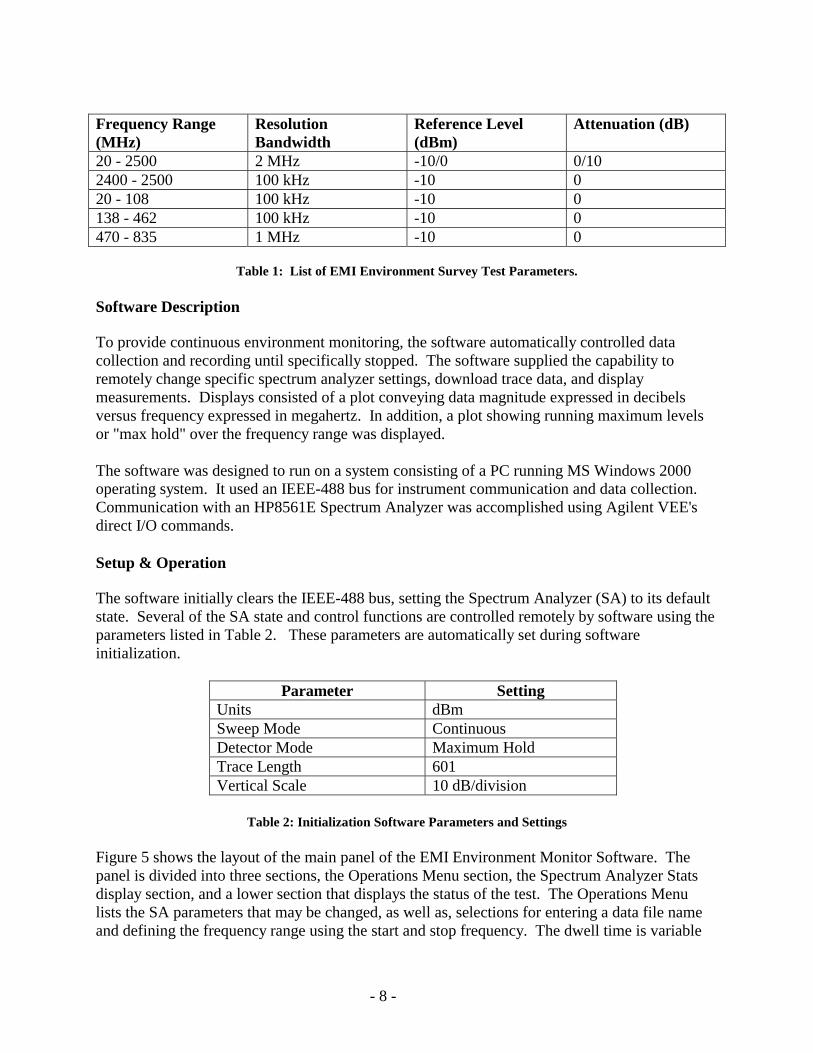
Figure 3. Each system consisted of a control computer, a preamplifier, an HP8561E spectrum analyzer (SA), a broadband omni-directional antenna, an IEEE-488 bus, and radio frequency (RF) cabling. Figure 4 shows the monitoring instrumentation, including control computers and spectrum analyzers on location. Antennas were mounted at a gate inside a terminal and outside a loading ramp. Table 1 lists the test frequency ranges, resolution bandwidths, reference levels, and attenuation for the spectrum analyzer used during testing. The frequency ranges were selected to include the operating frequencies of cell phones and other wireless devices that might be present, as well as, aircraft and ground control communication and navigation signals. The tests collected and recorded data in one-minute time intervals for an extended time period of hours or days without interruption. During the one-minute interval, the spectrum analyzer was set on peak hold. At the end of the interval, the trace was downloaded to a file and reset before the next measurement.
Figure 3: Airport Spectrum Monitoring Configuration
Figure 4: Airport Spectrum Monitoring Instrumentation [Ref. 2]
IEEE-488 Bus
Control and Data
Acquisition Computer
Control and Data
Acquisition Computer
HP8561E Spectrum Analyzer
HP8561E Spectrum Analyzer
PreAmp
Antenna
Loading Ramp
TerminalGate
PreAmp
Antenna
RF Cables
- 8 -
Frequency Range (MHz)
ResolutionBandwidth
Reference Level (dBm)
Attenuation (dB)
20 - 2500 2 MHz -10/0 0/10 2400 - 2500 100 kHz -10 0 20 - 108 100 kHz -10 0 138 - 462 100 kHz -10 0 470 - 835 1 MHz -10 0
Table 1: List of EMI Environment Survey Test Parameters.
Software Description
To provide continuous environment monitoring, the software automatically controlled data collection and recording until specifically stopped. The software supplied the capability to remotely change specific spectrum analyzer settings, download trace data, and display measurements. Displays consisted of a plot conveying data magnitude expressed in decibels versus frequency expressed in megahertz. In addition, a plot showing running maximum levels or "max hold" over the frequency range was displayed.
The software was designed to run on a system consisting of a PC running MS Windows 2000 operating system. It used an IEEE-488 bus for instrument communication and data collection.Communication with an HP8561E Spectrum Analyzer was accomplished using Agilent VEE's direct I/O commands.
Setup & Operation
The software initially clears the IEEE-488 bus, setting the Spectrum Analyzer (SA) to its default state. Several of the SA state and control functions are controlled remotely by software using the parameters listed in Table 2. These parameters are automatically set during software initialization.
Parameter Setting Units dBm Sweep Mode Continuous Detector Mode Maximum Hold Trace Length 601 Vertical Scale 10 dB/division
Table 2: Initialization Software Parameters and Settings
Figure 5 shows the layout of the main panel of the EMI Environment Monitor Software. The panel is divided into three sections, the Operations Menu section, the Spectrum Analyzer Stats display section, and a lower section that displays the status of the test. The Operations Menu lists the SA parameters that may be changed, as well as, selections for entering a data file name and defining the frequency range using the start and stop frequency. The dwell time is variable

- 9 -
and reflects the wait time in seconds between starting a measurement and ending a measurement. At the completion of a dwell time interval, a trace is downloaded, recorded, and the trace reset.The user-changeable SA parameters include frequency, sweep time, reference level, attenuation, and resolution bandwidth. The Operations Menu section has two buttons. The Start Test button begins the automated test including data acquisition and recording. The Stop Test & Save button stops data acquisition, saves the open file, and exits the program.
Figure 5: Main Screen for EMI Environment Monitor Software
The Spectrum Analyzer Stats display section shows the immediate values of the SA parameters. The displayed parameters are obtained directly from the SA and updated regularly every two seconds. As parameters are changed in the Operations Menu, their new values are displayed in this section. In some cases where an illegal parameter value is requested, the display of that parameter value will be different from the one commanded by the software, as the SA reverts to a legal value. The Resolution Bandwidth, Sweep Time, or Reference Level parameters are coupled within the SA and incompatibilities can occur when modifying their values. The SA may revert to default values, the closest legal values, or change another parameter. If illegal values are used, the SA will display a warning message.
The bottom section of the Main Panel updates bookkeeping counters and provides information on a test's current time status and progress. The information is given in terms of minutes and columns, hours and worksheets, and days and workbooks. The "minutes" display is directly related to the dwell time. Each increment in the minutes display represents the expiration of a dwell time interval. To accommodate future tests, it was desirable to add flexibility to the software by making the dwell time a variable. It should be noted that the dwell time can equal values other than 60 seconds. In that case, the "minutes" display will not represent a time interval equal to 60 seconds, but whatever the value to which the dwell time parameter was set.
- 10 -
It will still represent the number of columns of data recorded. For instance, if the dwell time is 120 seconds, then measurements are taken for two minutes and data recorded every two minutes. Thus, a one in the minutes and column display represents one column of data every two minutes. The display simply represents the number of time intervals that have currently expired. During the EMI Environment Survey Test the dwell time was always equal to one minute, and the software was customized to reflect the requirement. Therefore, there is a direct relationship between the display nomenclature and the dwell time used during the test.
In addition, this section displays plots of the current SA trace, and the "max hold" trace. The plot contains two markers that can be moved and activated to points on the graph. The plot will then display the corresponding frequency and magnitude values of the marker. The program executes continuously until the Stop Test & Save button is selected.
Data Acquisition
The data acquisition process is fully automated and runs until specifically stopped. The process begins by clearing the SA trace, waiting the required dwell time, then downloading and recording the SA trace. These functions are repeated until the test is terminated. The current trace represents the maximum magnitudes at each frequency measured over the frequency range for the specified dwell time. A running maximum value for each frequency is calculated as the test progresses producing a "max hold" trace. Both traces are continuously updated and displayed in the plot at the bottom of the screen. The software applies no calibration data.
Excel functions are used from within the VEE environment during the execution of the test software. Accessing Excel functions is possible using ActiveX technology. A client/server relationship exists between VEE and Excel within the Component Object Model (COM) technology. COM is a software architecture that provides for application components, objects, and their interoperability. The objects or ActiveX controls are utilized using Visual Basic Script (VBScript). VBScript is a Microsoft Window's platform interface that can access ActiveX components. This technology allows Excel ActiveX automation libraries to be loaded into computer memory and utilized within the VEE development software. The exposed library objects are employed using VBScript. Object methods and properties are utilized to select and activate spreadsheets, record data, and open and save files.
Database Structure
Data were recorded into MS Excel files and text files. An entire Spectrum Analyzer trace consisting of 601 data points was recorded in an Excel spreadsheet column and to a text file approximately every minute. Frequencies were listed in the first column of each worksheet. Sixty traces or columns were recorded and saved to one spreadsheet, representing one hour, and then another sheet was started. After 24 spreadsheets, representing 24 hours, were filled the MS Excel workbook was closed, the file saved, and another workbook opened. This format produced a worksheet per hour and a workbook per day. In addition, a header comprised of a date, time, start frequency, stop frequency, SA resolution bandwidth, SA sweep time, SA reference level, and SA attenuation was recorded in the first two lines of each worksheet.

- 11 -
The naming convention for output data files was root name + date + time + .xls. The date and time were automatically generated and reflected the moment that an output data file was opened. The worksheets composing each file were named using the date and time stamp when the first trace data was entered into the worksheet. The naming convention for worksheets was root name + "Start" + date + time. Text files were saved and named the same as worksheets with a .dat extension. Table 3 lists examples of the file naming convention as applied for text files and Excel files.
Text File Names Excel File Names Test1 Start-07-Sep-2000_10-49-07.dat Test107-Sep-2000-10-49-07.xls Test1 Start-06-Sep-2000_12-10-12.dat Test106-Sep-2000-12-10-12.xls Test2 Start-27-Aug-2000_10-11-09.dat Test227-Aug-2000_10-11-09.xls Test2 Start-26-Aug-2000_14-13-15.dat Test226-Aug-2000_14-13-15.xls
Table 3: Examples of Text and Excel File Names
As seen in Figures 1 and 2, no automated data reduction software was developed for handling and plotting the data produced during the EMI Environment Survey Test. The reduction process was manually performed using MatLab software to process and plot data. Using plotted data, frequencies were identified and their relative magnitudes and time of presence were compared.
HIRF Lab EMI Tests
Test Description
In support of the FAA's Electromagnetic Hazards to Aircraft Systems (EHAS) Plan and a FAA/LaRC Interagency Agreement, the HIRF Lab conducted a series of EMI tests on cell phones and some preliminary tests on various other portable electronic devices. A goal of the cell phone testing was to determine if spurious signals emitted by cell phones have the potential to interfere with aircraft communication and navigation systems. EMI tests were conducted in a semi-anechoic chamber and a reverberation chamber at NASA Langley Research Center. A process for conducting the measurements in two types of chambers was needed and developed.The software contributed to the implementation of the process.
Test instrumentation consisted of either an HP8561E or Agilent E4407B Spectrum Analyzer, an HP85644A Tracking Source, RF filters, preamplifier, and transmit and receive antennas. During emissions testing, the tracking source was removed and the transmit path connection was terminated. Different frequency bands were tested preceded by chamber and cable calibrations. Antennas used were appropriate for test frequency bands and included log periodic, dual ridge horn, biconical, and Global Positioning System (GPS) survey. Input power was used during reverberation chamber calibrations, cable calibrations, and for verification of antenna factors in the semi-anechoic chamber. During actual testing, a transmit antenna remained in the reverberation chamber, but was removed from the semi-anechoic chamber. To obtain a lower noise floor and to eliminate effects such as equipment saturation caused by cellular transmissions within the test bands, a combination of RF filters and preamplifiers was used in both test

- 12 -
configurations and are referred to collectively as an external attenuator. The external attenuator was used during tests performed in Frequency Bands B1 and B2 as listed in Table 4.
The University of Oklahoma Center for Wireless EMC was contracted to supply the cell phones, base-station control equipment, keypad entry codes, operational modes, and expertise. The tests required the cell phones to be operated at several power levels, channels, and voice rates. Since an isolated cell phone cannot communicate or operate in a typical fashion, tests were conducted using three methods to simulate communication and modes of operation. These methods included base-station equipment, software controlled test-harness, and codes entered by keypad. The cell phones that were tested utilized either a Code Division Multiple Access (CDMA) or a Global System for Mobile Communication (GSM) technology. It was necessary to have a person inside the chamber during testing to enter keypad codes, to change phone positions (semi-anechoic chamber only), and to answer and terminate calls.
Frequency Band ID
Frequency (MHz)
Antenna Resolution Bandwidth (kHz)
Reference Level (dBm)
Sweep Time (ms)
B1 105-120 Biconical 10 -10 375 B2 325-340 Dual Ridge
Horn10 -10 375
B3 960-1215 Dual Ridge Horn
100 20 64
B4 1565-1585 GPS Survey
10 -10 500
Table 4: List of EMI Test Parameters
Test Configuration
Table 4 is a list of frequency bands and other instrument and test parameters employed in tests conducted in both chambers. Figure 6 illustrates a reverberation chamber EMI test setup. The receive antenna represents any of the antennas previously mentioned. The diagram shows the position of a cell phone and a base station antenna on a foam block test stand located in the center of the chamber. The two stirrers located in the corners of the chamber were continuously rotated at 5 revolutions per minute during chamber calibration and EMI testing. Having a person inside a chamber during testing contributes to chamber power losses. For this reason, chamber calibrations were conducted with a person inside.

- 13 -
Figure 6: Reverberation Chamber Calibration and Test Setup
Figure 7: Semi-Anechoic Chamber Calibration and Test Setup
Filter & Preamp
Foam Block Test Stand
Base Station Simulator
Xmit Antenna
Receive Antenna
HP8561E Spectrum Analyzer
HP85644A Tracking Source
Stirrer Controller
PC Test Controller
IEEE488 Bus
Lines to Stirrers
Control and Data Acquisition System
Stirrer
Stirrer
Control and Data Acquisition System
Base Station
Filter & Preamp
HP8561E Spectrum Analyzer
HP85644A Tracking Source
PC Test Controller
IEEE488 Bus
Rotating Foam Test Stand
Receive Antenna
Antenna Positioner
Reference Dipole Xmit Antenna

- 14 -
Figure 7 illustrates the semi-anechoic EMI test setup. Antenna factors were verified using a reference dipole antenna placed on a foam test stand with no phone present. During testing, the dipole was removed and a phone placed on the test stand as seen in the diagram. Phones were tested in vertical and horizontal positions. The foam test stand was slowly rotated during testing.
Semi-Anechoic Chamber Testing
A semi-anechoic chamber is a shielded room with specially treated absorber material attached to the walls and ceiling to prevent reflections of electromagnetic waves. It is used for testing the electromagnetic radiated susceptibility or compatibility of electronic devices. Radiated emissions measurements are conducted by measuring power at a receive antenna in terms of dBµV/m. Emissions from test articles are measured in one plane and one polarization at a time. To achieve a more comprehensive characterization of a test article, it or the receive antenna must be repositioned and reoriented several times. This allows for the measurement of emissions from more than one face of the test article, such as top, bottom, and sides. Numerous positions produce a more comprehensive data set on which to base characterization of a test article.
The cell phone emissions testing conducted in the semi-anechoic chamber was based on the RTCA DO-233 EMI testing procedures. As per the testing guide, test objects were placed on a non-conductive foam table approximately 0.8 meters from the conductive floor. A receive antenna placed on an antenna positioner approximately 1 meter from the cell phone measured signals emitted from the test object. Test objects were rotated on a foam table during testing. Measurements were conducted on the receive path to determine path loss factors. Emissions test measurements were normalized with the calibrated data.
To compare measurements between semi-anechoic chamber data and reverberation chamber data, it was desirable to have all measurements in terms of power in dBm. To accomplish this, certain assumptions and conversions were made. The electric field intensity measurements obtained during semi-anechoic chamber testing assumed an isotropic radiator. Also, the antenna factors obtained from the manufacturer assumed a free space input relative to a 50 Ohm output.To obtain radiated power measurements in terms of total radiated power in dBm, several conversions were made. Equations (1) and (2) basically define the process. The measured voltage in dBµV units, antenna factors, and receive cable losses are used in a standard formula, Equation (1), to obtain the electric field intensity. Equation (2) is a DO-233 formula for converting electric field to total radiated power in watts. It assumes distance, R, equals to one meter. Applying unit and power conversions produces Equation (3). Additional calculations, which are defined below, give Equations (4) and (5). Equation (6) defines the total radiated power in terms of power measured at the SA with losses and conversions applied. The expression relates the measurements at the SA and the radiated power emitted by a test article during emissions testing in a semi-anechoic chamber [unpublished data from J. Ely, Langley Research Center].
Given:
)/( mdBuVE = )(dBuVMeasV + )(dBAF + )(Re dBcCableL (1)

- 15 -
)(WTotRadP =π
π120
422
)/(RE mV ∗
= [ ]2
)/(6
30
10 muVE−
(2)
Where,
)/( mdBuVE = Radiated electric field intensity (dBµV/m)
)(dBuVMeasV = Measured voltage (dBµV)
)(WTotRadP = Total radiated power (Watts)
)(dBAF = Antenna factor from manufacturer (dB)
)(Re dBcCableL = Receive cable loss (dB)
R = Distance (m) = 1
Converting power in watts to power in dBm using dBm = 10 Log ����
��
−310
Watts, produces Equation
(3).
)(dBmTotRadP = 10 Log
��
�001.
)(WTotRadP = 10 [ ] [ ]
���
��� +
�� �++
�� � −
)/(12 2
30
110
001.
1muVELogLogLogLog
)(dBmTotRadP = -104.77 + )/( mdBuVE (3)
Where,
)(dBmTotRadP = Total radiated power (dBm)
Substituting Equation (1) into Equation (3) produces the following:
)(dBmTotRadP = )(dBuVMeasV + ( )(dBAF - 104.77) + )(Re dBcCableL (4)
)(dBuVMeasV is needed in terms of Total Radiated Power Measured in dBm. Using the following
standard equations for conversions and assuming 50 Ohms produces Equation (5).
Watts = Ohms
Volts 2
, dBµV = 20 Log ����
��
−610
Volts, dBm = 10 Log �
���
��
−310
Watts,
)(dBmSAMeasP = 10 Log���
���
���
����
�����
��
− Ohms
Volts 2
310
1
)(dBmSAMeasP = dBµV - 107
dBµV = )(dBmSAMeasP + 107 (5)
Where,

- 16 -
)(dBmSAMeasP = Power measured at the Spectrum Analyzer (dBm) during test.
Substituting Equation (5) into Equation (4) produces the following:
)(dBmTotRadP = ( )(dBmSAMeasP +107) + ( )(dBAF - 104.77) + )(Re dBcCableL
Combining terms produces Equation (6).
)(dBmTotRadP = )(dBmSAMeasP + )(Re dBcCableL + )(dBAF + 2.23 (6)
To determine the receive cable losses, a known amount of power was input at the antenna connector and measurements were made at the receiver. The receive path calibration factors were measured at frequencies that included the test frequency range. In order to reduce the noise floor, as previously discussed, external attenuation was added depending on test frequencies.The attenuation then became part of the receive path loss. The noise floor was determined with the device under test (DUT), in this case cell phones, turned off. Emissions test measurements were then conducted using the chamber configured as in Figure 7 with phones turned on. The electric field measurements obtained during the emissions tests were converted to total radiated power by applying the receive cable loss data and the antenna factor data as furnished by manufacturers to the measured power and applying Equation (6).
Reverberation Chamber Testing
A reverberation chamber is a shielded enclosure designed to reflect and propagate electromagnetic signals in order to obtain statistically uniform fields within the enclosure. Radiated susceptibility tests and emissions tests are conducted within the chambers. Tests conducted in reverberation chambers rely on several different methods to produce a statistically uniform electromagnetic environment [Ref. 3]. Two of these methods are mode-stirring and mode-tuning. Stirrers with reflective surfaces are rotated continuously during mode-stirring or stepped equal intervals for a complete rotation during mode-tuning. A transmit antenna is used to inject a known power during calibration. During emissions testing, no power is directly injected while the power emitted by a DUT is measured. Measurements are made in terms of total radiated power in units of dBm. The quality of the electromagnetic field uniformity throughout the chamber is affected by the chamber's construction and geometry. The advantages of using a reverberation chamber are that total radiated power can be measured, testing does not require repositioning DUT or antenna, and the testing process is expedited. For further information on reverberation chambers, see Reference 3.
The tests conducted in the HIRF Lab reverberation chamber on cell phones were concerned with emissions measurements and used the same instrumentation as tests conducted in the semi-anechoic chamber. The tests relied on mode-stirring, using two stirrers placed at opposite ends of the chamber as illustrated in Figure 6. Chamber, receive path, and transmit path losses were measured. Emissions test measurements were normalized with the calibrated data.

- 17 -
Equation (7) defines the measured total radiated power as applied during testing. Total radiated power in a reverberation chamber is then calculated by normalizing the measured data by the loss factors. That is, the loss factors are used to determine the transfer function that is applied to the test measurements. Here, the losses include chamber losses, transmit cable losses, and receive cable losses. During testing, the chamber calibration factor was determined as defined in Equation (8) and included transmit cable losses, chamber losses, and receive cable losses. Taking the difference between Equations (7) and (8) and manipulating terms gives Equations (9) and (10). Equation (10) was used during the data reduction process to determine the true value for the total radiated power.
)(dBmTotRadP = )(dBmSAMeasP + )(dBChmbrL + )(Re dBcCableL (7)
CF = ( )(dBXmitCableP - )(dBmSAMeasP ) = )(dBChmbrL + )(Re dBcCableL + )(dBXmitCableL (8)
Taking the difference between Equations (7) and (8) and rearranging terms results in Equations (9) and (10).
)(dBmTotRadP - CF = )(dBmSAMeasP - )(dBXmitCableL (9)
)(dBmTotRadP = )(dBmSAMeasP - )(dBXmitCableL + CF (10)
Where,
)(dBmTotRadP = Total radiated power (dBm)
)(dBmSAMeasP = Power measured at the SA (dBm)
)(dBChmbrL = Reverberation chamber loss (dB)
)(Re dBcCableL = Receive cable loss (dB)
)(dBXmitCableL = Transmit cable loss (dB)
CF = Chamber Calibration Factor (dB)
Prior to running the emissions tests in the reverberation chamber, cable, and chamber losses were measured and recorded. The transmit cable losses were measured from the source to the antenna connector. The measurement reflected in the variable )(Re dBcCableL included attenuation, as well
as, cable losses. The chamber calibration factor was measured by injecting a known power into the chamber using a tracking source and measuring the receive power at a spectrum analyzer. The chamber calibration factor included the transmit cable loss, the chamber loss, the receive cable loss, and attenuation. A noise floor power measurement was conducted with cell phone off to determine the ambient environment. Next, emissions measurements were done with cell phones on. Equation (9) was applied using the chamber calibration factor, the transmit cable loss, and the measured power as described. Calculations were performed in log scale or dBm units.

- 18 -
Software Description
As illustrated in Figure 6 and Figure 7, similar automated test and data acquisition systems were used in both chambers. The EMI Test software was executed on a laptop computer running MS Windows 2000. The test controller, spectrum analyzer, tracking source, and stirrer controller utilized an IEEE-488 bus for data transfer and communication. The control software managed the test instruments, test procedure, and data transfer and recording. The software was capable of handling either the HP8561E or Agilent E4407A Spectrum Analyzer. During emissions testing, the software was able to place the tracking source to an offline state.
The EMI Test software was developed in order to place specific operational procedures required for the conduct of emissions testing within one control system. Calibration procedures, emissions testing methods and procedures, and spectrum monitoring controls were identified and developed into one test system. The operations were selectable from a menu on the Main Panel.Emissions test procedures were developed to allow use in either a reverberation or semi-anechoic chamber. The test methods incorporated a variable dwell time that permitted measurements to be conducted over a user-specified time period. This time period was varied depending on type of testing conducted. The main functions of the continuous environment monitoring operation in the EMI Environment Monitor Software were retained with modifications in the Spectrum Monitoring Operation of the EMI Test Software. Changes included application of calibration data to the measured data and display of raw and calibrated data. Each operation in the EMI Test Software required its own user interface for control of parameters, tests, and data collection.
Calibration
The Calibration Operation is executed by selecting Chamber/Cable Calibration from the Main Panel Menu. The operation includes procedures for measuring power losses, such as reverberation chamber calibrations and transmit and receive cable calibrations. Data is stored in the form of formatted text files that provide input to the emissions testing operation where the calibration factors are applied to raw data.
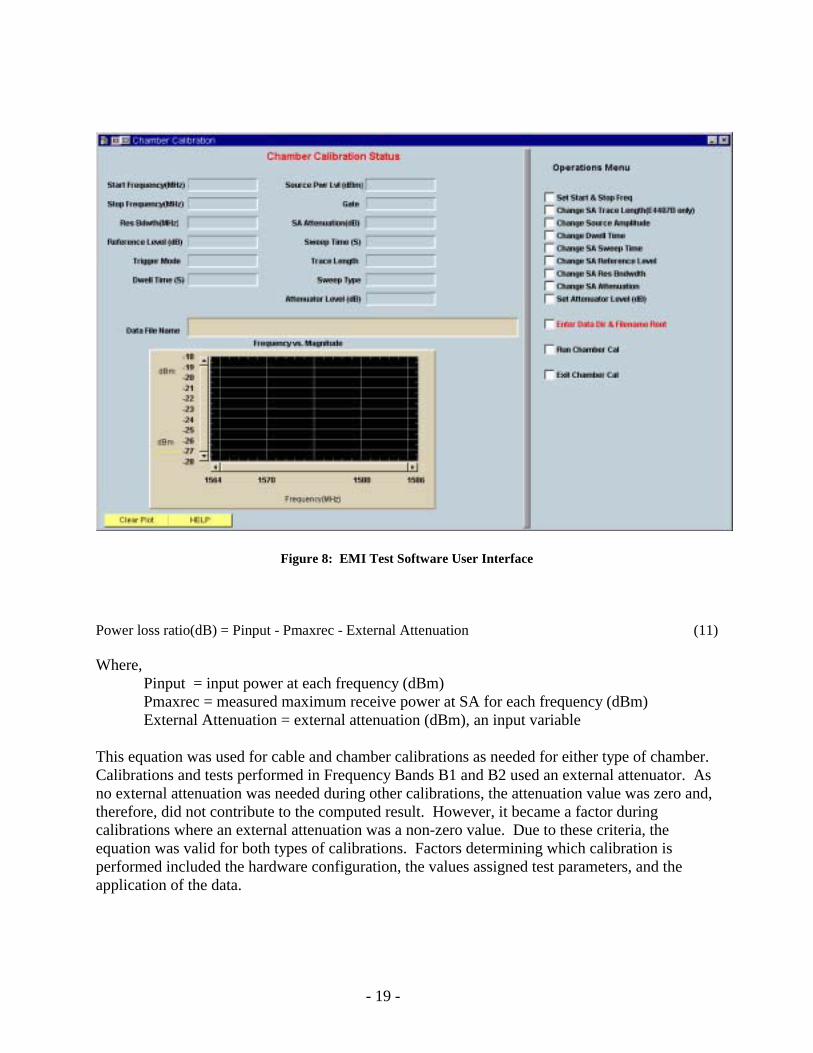
The Calibration Panel is presented in Figure 8 as an example of a user interface. The dual functionality of this panel and underlying operation demonstrates the flexibility of the software. Power loss measurements performed in the reverberation chamber included chamber and transmit cable calibrations. Power loss measurements performed in the semi-anechoic chamber included receive cable calibrations. The Calibration Operation serves as an automated means of collecting data and computing the power losses. Power loss is defined in Equation (11) as the difference between the input power and the measured power at the receiver less any attenuation. The software utilizes the formula presented in Equation (11) to compute power loss ratios.
- 19 -
Figure 8: EMI Test Software User Interface
Power loss ratio(dB) = Pinput - Pmaxrec - External Attenuation (11)
Where, Pinput = input power at each frequency (dBm) Pmaxrec = measured maximum receive power at SA for each frequency (dBm) External Attenuation = external attenuation (dBm), an input variable
This equation was used for cable and chamber calibrations as needed for either type of chamber. Calibrations and tests performed in Frequency Bands B1 and B2 used an external attenuator. As no external attenuation was needed during other calibrations, the attenuation value was zero and, therefore, did not contribute to the computed result. However, it became a factor during calibrations where an external attenuation was a non-zero value. Due to these criteria, the equation was valid for both types of calibrations. Factors determining which calibration is performed included the hardware configuration, the values assigned test parameters, and the application of the data.

- 20 -
Setup and Operation
An Operations Menu is part of each user-interface and is used to specify instrument parameters and test control information during setup. An example Operations Menu is presented in Figure 8. Changes to spectrum analyzer and tracking source function values are reflected in the Status area. Setting a start and stop frequency and a data file name is mandatory. The software handles setting parameters and querying instruments for current values. It also commands instruments to perform functions such as clearing the SA trace, setting the SA to a peak hold mode, capturing and downloading a trace, setting RF on or off, and reporting errors. Run Cal automatically utilizes test parameters, controls the instruments, waits the user-specified dwell time, and captures and records the trace to a data file. During calibration, a data trace is plotted and displayed in the lower part of the panel.
The Emissions Test and Spectrum Monitoring interfaces are similar to the Calibration interface. The Operations Menus include the same entries with the addition of an entry for the cable and chamber calibration file names and type of test facility. The data plot at the bottom of the panels contains a raw data trace and a trace with calibrations applied. The Spectrum Monitoring panel is the same as that discussed previously in the EMI Environment Monitor software with the addition of calibrated data in the display.
Selecting Exit returns to the Main Menu. From the Main Menu, any of the operations may be selected or tests rerun. However, in the current software version, setting the status of the tracking source to on or off is accomplished during the initialization process. In order to change the status, the software must be restarted. Future development will modify the method and interface for setting the tracking source status.
Hardware configurations and test parameters determined whether cable or chamber calibrations were performed during the EMI testing in the HIRF Lab. The dwell time for a cable calibration was relatively short compared to a reverberation chamber calibration. During a reverberation chamber calibration and test, the dwell time was 120 seconds. Reverberation chamber tests require this value to be greater than or equal to a stirrer rotation time. Cable calibrations utilized a dwell time of only 2 seconds. Calibrations required the tracking source be online to provide transmit power. Setting the source's power amplitude level in the Operations Menu enabled control of the input power level.
Data Acquisition
A degree of independence between test locations, hardware configurations, and automated operations was implemented within the software. The Run Cal Operation and the Run Test Operation were used to begin the process of collecting data. The Run Cal operation was used during cable and chamber calibrations. The Run Test Operation was used during emissions testing in the semi-anechoic and reverberation chambers. Both operations automatically utilized test parameters, controlled instruments, and determined and applied proper calculations. In addition, the operations waited the user-specified dwell time, and then captured and recorded trace data to a file. Much of this activity was dependent on the type of facility and test conducted. Based on instrument and test parameters, the software handled the application of

- 21 -
calibration data and instrument control. The Emissions Test Operation used the type of chamber specified to document and to determine the correct equation and calibration data to apply when computing power measurements. Measurement time was controlled by the dwell time parameter and varied depending on type of test being conducted.
One of the functions of the Emissions Test Operation was to determine calibration factors for each test frequency and apply the factors to the measured data. To do this, the procedure utilized calibration data and interpolated where corresponding data could not be found. Using this method, calibration test data was valid for use with several different emissions tests even when the frequencies were not exactly the same. The only requirement was that the emissions test frequency range be contained within the calibration data frequency range. Capitalizing on VEE's capability to interface with other MS Windows applications, a MatLab interpolate function was utilized. ActiveX and VBScript technologies were used to input data to MatLab and compute values. The software utilized Equation (6) for tests conducted in the semi-anechoic facility to compute total radiated power in dBm. Equation (10) was applied for test run in the reverberation chamber to determine the true measurement or total radiated power in dBm.
The Spectrum Monitoring Operation was used during the cell phone battery life testing conducted in the reverberation chamber. Its functions are similar to the Emissions Test Operation except testing is continuous until stopped. Using this operation, tests were run for many hours and often for days to determine the effect of battery exhaustion on the emission of spurious signals.
Database Structure
The Calibration Test Operation of the EMI Test Software writes data and a header to a text file. The data is recorded in three columns that include frequency, power loss, and maximum receive power. The frequency column is a list of all frequencies within the selected spectrum. The maximum receive power is the power in dBm units measured at the SA at each frequency. The power loss or calibration factor reflects the difference between input and output power at each frequency.
The Emissions Test Operation used data from the Calibration Test Operation output data files and applied the values to the raw measurements. Data were recorded in Excel spreadsheets using an ActiveX interface as previously described for the EMI Environment Monitor Software. An Excel file or workbook was composed of four worksheets where each worksheet contained ten sets of data consisting of two columns per set. Each data set included a column of raw or un-calibrated data and another column of total radiated power values or calibrated data. The first column in each spreadsheet was a list of test frequencies. In addition, a header was added to each spreadsheet. The header consisted of a date, time, start frequency, stop frequency, resolution bandwidth, sweep time, reference level, SA attenuation, external attenuation, and the calibration data file names.
The file format for the Spectrum Monitoring Operation is the same as discussed in the EMI Environment Monitor software section with the addition of calibrated data columns. Correction factors from data files created during the Calibration Operation are applied to the measured data.

- 22 -
As an input source is not required during spectrum monitoring, the tracking source is set to offline by the software.
The data file naming conventions conformed to the requirements of the test plan and are illustrated below:
Chamber Type + Measurement Type + Phone Type + Phone Model + Mode of Operation + Frequency Band + Phone Orientation (Semi-Anechoic Chamber) + Special Test Suffix + Date and Time
Some examples of file names and their meaning are given here:
SAC CblCal B1 - denotes a cable calibration conducted in semi-anechoic chamber using Frequency Band 1
RCA Emeas CDM1 MPmax PRvar B1 KPD13-8-2001-15-45-23 - denotes emissions test conducted in reverberation chamber A on a CDM type phone #1using maximum power, variable phone rate, in Frequency Band 1, using keypad codes on August 13, 2001 at 3:45:23 P.M.
RCA Emeas CDM2 MPUP PReigh B1 BS13-8-2001-11-40-20 - denotes emissions test conducted in reverberation chamber A on CDM type phone # 2, with power level always up, phone rate is one eighth, in bandwidth 1, using base-station control on August 13, 2001 at 11:40:20 A.M.
The date and time were automatically appended to a file name as a test started. Emissions Test data files were organized into directories by chamber type including the calibration data files. Battery life test data files were placed in a battery life directory where each file name was also dated and time stamped.
Data Reduction Tools
The cell phone emissions tests and the spectrum monitoring tests generated gigabytes of data that are contained in Excel spreadsheets. Manually post processing data using Excel proved to be slow and inconsistent. It became obvious that a method was needed to expedite the data reduction and plotting tasks. Therefore, two customized and automated processes were developed and implemented. One of the processes handled the Emissions Test output data files and the other the Spectrum Monitoring output data files. The processes were developed to run on PCs using MS Windows 98 or 2000 using VEE and Excel ActiveX objects. The software was used to automatically generate data plots using consistent formatting and to scan through large amounts of data quickly.
The Data Reduction and Plotting Software is a tool used to view and plot data collected during emissions testing. It imports several user-designated data files, plots the data into Excel charts, and provides appropriate labeling and titles. The software was used to plot all the emissions test data. It allowed several data sets to be plotted on one chart using consistent plotting parameters.
- 23 -
During analysis, it was important for charts to use a consistent array of colors to portray information and to utilize comparable axes.
The Battery Life Data Scanning Software is an analysis tool for viewing data generated by the Spectrum Monitoring Operation. It automatically imports each data file located within a user-specified directory and plots the data. A quick analysis of the battery life data was conducted using this software in order to spot spurious radiated signals that may have occurred as battery power was exhausted.
Data Reduction and Plotting Software
Design
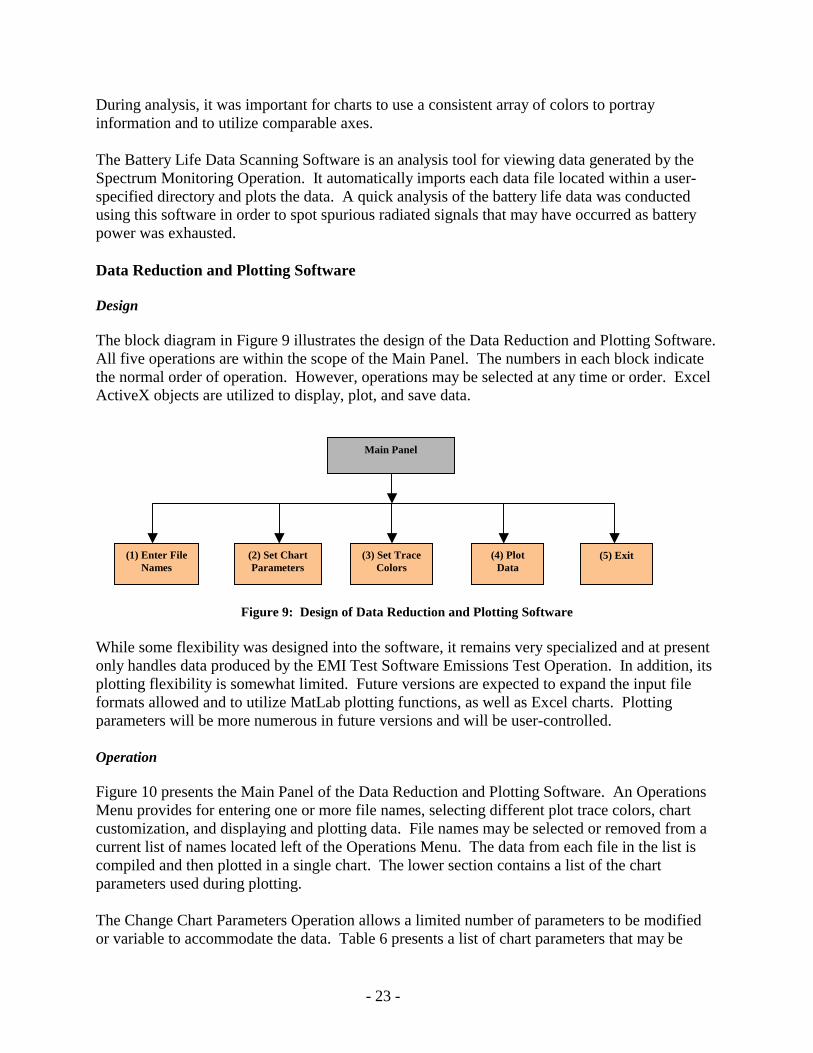
The block diagram in Figure 9 illustrates the design of the Data Reduction and Plotting Software. All five operations are within the scope of the Main Panel. The numbers in each block indicate the normal order of operation. However, operations may be selected at any time or order. Excel ActiveX objects are utilized to display, plot, and save data.
Figure 9: Design of Data Reduction and Plotting Software
While some flexibility was designed into the software, it remains very specialized and at present only handles data produced by the EMI Test Software Emissions Test Operation. In addition, its plotting flexibility is somewhat limited. Future versions are expected to expand the input file formats allowed and to utilize MatLab plotting functions, as well as Excel charts. Plotting parameters will be more numerous in future versions and will be user-controlled.
Operation
Figure 10 presents the Main Panel of the Data Reduction and Plotting Software. An Operations Menu provides for entering one or more file names, selecting different plot trace colors, chart customization, and displaying and plotting data. File names may be selected or removed from a current list of names located left of the Operations Menu. The data from each file in the list is compiled and then plotted in a single chart. The lower section contains a list of the chart parameters used during plotting.
The Change Chart Parameters Operation allows a limited number of parameters to be modified or variable to accommodate the data. Table 6 presents a list of chart parameters that may be
Main Panel
(1) Enter File Names
(2) Set Chart Parameters
(3) Set Trace Colors
(4) Plot Data
(5) Exit

- 24 -
modified and their default values. However, in the current software version, several of the plotting parameters are hard-coded as constants and, therefore, non-variable. These are listed in Table 7. The data processing software's plotting parameter default values are very specific to the data format of the files produced during the cell phone emissions tests. The variable and non-variable parameters are initially selected to expedite the data reduction process as related to the cell phone emissions tests conducted in the HIRF Lab.
Figure 10: Data Reduction and Plotting Software Main Panel
The Plot Data Operation imports the data, sets the plot parameters, and causes an Excel process to execute. The process, utilizing the data sets and plot parameters, plots data to an Excel chart. Once the Excel process completes plotting the data, the chart may then be modified, printed, or saved.
While a chart that is automatically generated by the software will utilize variable and non-variable parameters, the values can be changed manually once the chart is completed. The changeable values include tick point increments and labels, legend position and labels, and line styles. Future development requires that many of the parameters be variable so as to eliminate the need for manual changes and to increase software usability and flexibility.

- 25 -
Parameter Default Chart Title "Data Title" X Axis Title "MHz" Y Axis Title "dBm" X Axis Minimum and Maximum 1565,1585 Y Axis Minimum and Maximum -120, -50 XY Cross Over -120
Table 6: Variable Plotting Parameters and Default Values
Parameter Value Y Axis Tick Point Increment 10 Number of X Axis Tick Points 10 Grid Vertical Lines Dashed Grid Horizontal Lines Solid Legend Series Lables Input File Names Legend Position Upper Right Corner Chart Style Line with Markers
Table 7: Non-Variable Plotting Parameters and Values
Database Structure
Input data files utilize a spreadsheet format as generated by the EMI Test Software Emissions Test Operation and have at least two columns of data. Generated Excel charts may be saved to the currently open data file or another user-specified Excel file.
Battery Life Data Screening Software Design
The block diagram in Figure 11 illustrates the design of the Battery Life Data Screening Software. The two operations, Enter File Names and Plot Data, are within the scope of the Main Panel. The numbers in each block indicate the normal order of operation. Information from the user-specified data files is displayed and plotted in separate charts using Excel ActiveX objects. The software sequences through all the input data files from a list as prompted.

- 26 -
Figure 11: Battery Life Data Screening Software Design
The software sifts through large amounts of data in order to view maximum data values. The current version of the software is very specialized and only handles data produced by the EMI Test Software Spectrum Monitoring Operation. The input data must be in an Excel spreadsheet format and organized, as specified, by the Spectrum Monitoring Operation. The software utilizes system calls to perform directory-listing functions making it Windows 98 dependent. Later versions are expected to accommodate Windows 2000 and Windows 98 system calls. In addition, future development will focus on expanding the input file formats allowed and utilizing MatLab and Excel plotting functions. User-controlled plotting parameters will also be provided.
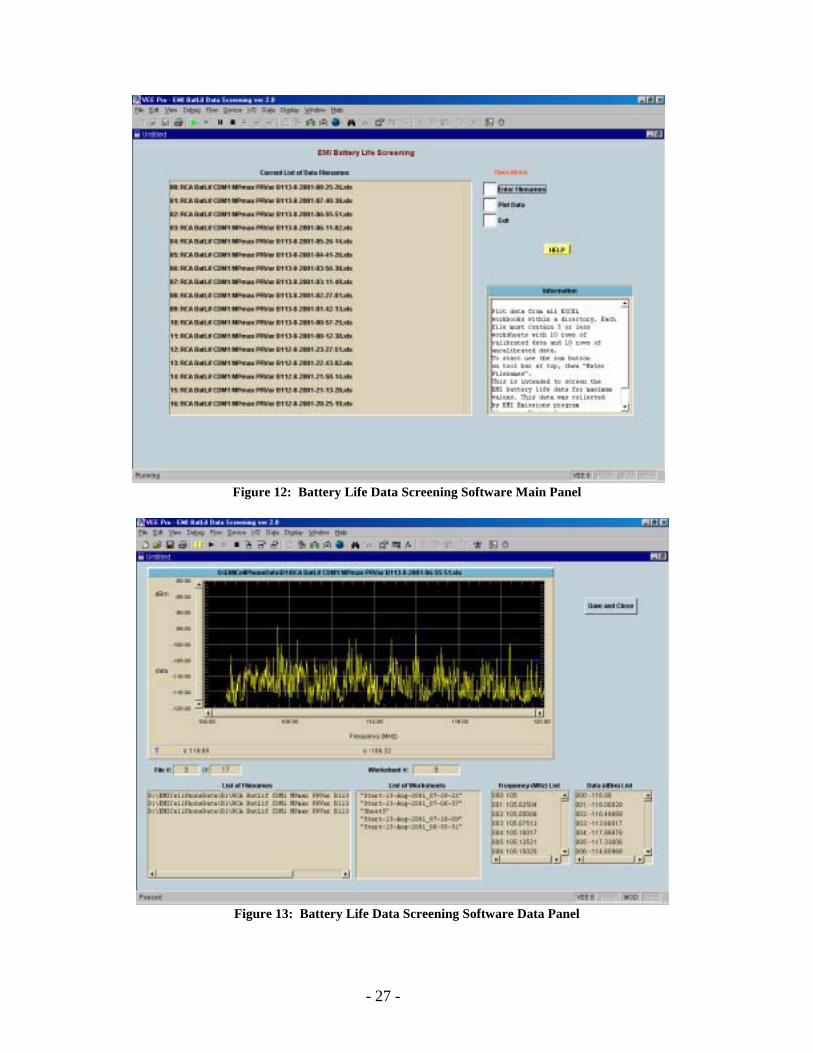
Operations
Figure 12 presents the Main Panel of the Battery Life Data Screening Software. An Operations Menu provides for entering a directory name and plotting and displaying data. A list of file names contained in a user-specified directory is automatically generated and displayed in the left section of the panel, thus, eliminating the need to select and enter each file individually. The data from each file in the list is plotted to its own chart. All chart parameters are hard-coded as constants and are selected based on the cell phone battery life emissions tests conducted in the HIRF Lab. The Plot Data Operation imports data, sets plot parameters, and executes an Excel process that plots the data. As seen in Figure 13, it provides a panel that displays a data plot, a list of input data filenames, a list of worksheets contained in the current file, a frequency list, a data values list, and the number of files to process.
The software automatically scans each file or workbook and determines the maximums for each frequency. It then displays and records the maximums. Running maximums are computed and maintained by examining the maximums of each input data file. The maximum values for each file are then written to an Excel spreadsheet, as well as, the final maximum values computed from all data files. The software sequences through the data files at a user-controlled rate. When the software completes processing and plotting, all the data is saved in an Excel workbook.
Main Panel
(1) Enter File Names
(2) Plot Data
(3) Exit
- 27 -
Figure 12: Battery Life Data Screening Software Main Panel
Figure 13: Battery Life Data Screening Software Data Panel

- 28 -
The Battery Life Data Screening Software was used to screen data produced during cell phone battery life tests conducted in the HIRF Lab. The data files were organized into directories by phone type and bandwidths. Each directory was sorted by creation date and time. The software was then able to process the data files sequentially. The time-ordered processing produced and displayed emissions data as a phone was operated with batteries at full power, as the batteries were exhausted, and then after the batteries lost all power. Future development will further process data from the output Excel workbook containing the maximum values and provide displays and plots of the data.
Database Structure
Battery Life Data Screening Software input data files must be in the format of Excel workbooks generated during the Spectrum Monitoring Operation. Processed output data is recorded to an Excel worksheet and saved as a workbook with a user-specified name and an .xls extension. Each column in an output worksheet contains maximum values computed from data included in each input workbook. The columns are headed by input file names. The last column contains maximum values computed from all input data files.
Summary
The data collection and reduction software discussed in this paper composes a tool set for the current and future HIRF Lab radiated emissions tests, analysis, and research. Testing of wireless devices and data analysis will continue. The test control software provided extensive automation of radiated emissions tests and contributed to the integrity of the data produced during cell phone testing. This software provided user interfaces, test and instrument control, and file generation for the conduct of calibrations and radiated emissions tests. The data reduction software expedited the data analysis process by automating data reduction and plot generation. The customized software is currently specific to the format of the cell phone data, but will be more generalized in future versions. The emissions test data was processed and the database populated with reduced and plotted data.
References
1. Eldon Ross, "Personal Electronic Devices and Their Interference With Aircraft Systems," NASA CR-2001-210866, June 2001.
2. J. Ely, "An EM Survey at the Gate and Ramp at the Hartsfield International Airport, Atlanta, GA, Automated Spectrum Monitoring," Digital Avionics Systems Conference, October 2001.
3. M. L. Crawford, G. H. Koepke, "Design, Evaluation, and Use of a Reverberation Chamber for Performing Electromagnetic Susceptibility/Vulnerability Measurements", NBS Technical Note 1092, U. S. Department of Commerce/National Bureau of Standards, April 1986.

REPORT DOCUMENTATION PAGE Form Approved OMB No. 0704-0188
Public reporting burden for this collection of information is estimated to average 1 hour per response, including the time for reviewing instructions, searching existing data sources, gathering and maintaining the data needed, and completing and reviewing the collection of information. Send comments regarding this burden estimate or any other aspect of this collection of information, including suggestions for reducing this burden, to Washington Headquarters Services, Directorate for Information Operations and Reports, 1215 Jefferson Davis Highway, Suite 1204, Arlington, VA 22202-4302, and to the Office of Management and Budget, Paperwork Reduction Project (0704-0188), Washington, DC 20503.
1. AGENCY USE ONLY (Leave blank) 2. REPORT DATE
May 20023. REPORT TYPE AND DATES COVERED
Contractor Report4. TITLE AND SUBTITLE
The Software Element of the NASA Portable Electronic Device Radiated Emissions Investigation
5. FUNDING NUMBERS
NAS1-00135 722-64-10-53
6. AUTHOR(S)
Sandra V. Koppen
7. PERFORMING ORGANIZATION NAME(S) AND ADDRESS(ES)
Lockheed Martin Corporation Langley Program Office Langley Research Center Hampton, VA 23681-2199
8. PERFORMING ORGANIZATION REPORT NUMBER
9. SPONSORING/MONITORING AGENCY NAME(S) AND ADDRESS(ES)
National Aeronautics and Space Administration Langley Research Center Hampton, VA 23681-2199
10. SPONSORING/MONITORING AGENCY REPORT NUMBER
NASA/CR-2002-211675
11. SUPPLEMENTARY NOTES
Langley Technical Monitor: Reuben A. Williams
12a. DISTRIBUTION/AVAILABILITY STATEMENT
Unclassified-Unlimited Subject Category 33 Distribution: Standard Availability: NASA CASI (301) 621-0390
12b. DISTRIBUTION CODE
13. ABSTRACT (Maximum 200 words)
NASA Langley Research Center's (LaRC) High Intensity Radiated Fields Laboratory (HIRF Lab) recently conducted a series of electromagnetic radiated emissions tests under a cooperative agreement with Delta Airlines and an interagency agreement with the FAA. The frequency spectrum environment at a commercial airport was measured on location. The environment survey provides a comprehensive picture of the complex nature of the electromagnetic environment present in those areas outside the aircraft. In addition, radiated emissions tests were conducted on portable electronic devices (PEDs) that may be brought onboard aircraft. These tests were performed in both semi-anechoic and reverberation chambers located in the HIRF Lab. The PEDs included cell phones, laptop computers, electronic toys, and family radio systems. The data generated during the tests are intended to support the research on the effect of radiated emissions from wireless devices on aircraft systems. Both tests systems relied on customized control and data reduction software to provide test and instrument control, data acquisition, a user interface, real time data reduction, and data analysis. The software executed on PC's running MS Windows 98 and 2000, and used Agilent Pro Visual Engineering Environment (VEE) development software, Common Object Model (COM) technology, and MS Excel.
14. SUBJECT TERMS
Portable Electronic Devices, EMI, Emissions, Automated Software, Data Reduction 15. NUMBER OF PAGES
33Data Analysis, Aircraft Avionics, Control Software 16. PRICE CODE
17. SECURITY CLASSIFICATION
OF REPORT
Unclassified
18. SECURITY CLASSIFICATION OF THIS PAGE
Unclassified
19. SECURITY CLASSIFICATION OF ABSTRACT
Unclassified
20. LIMITATION OF ABSTRACT
UL
NSN 7540-01-280-5500 Standard Form 298 (Rev. 2-89)Prescribed by ANSI Std. Z-39-18 298-102