Embed Size (px)
Citation preview

A decision-tree-based Bayesian approach for chance-constrained health prevention budget rationing
Journal: IEEE Transactions on Automation Science and Engineering
Manuscript ID T-ASE-2019-804
Manuscript Categories: Regular Paper
Date Submitted by the Author: 17-Sep-2019
Complete List of Authors: Herazo-Padilla, Nilson; Ecole des Mines de Saint-Etienne, I4S; Centre technique d'appui et de formation des Centres d'examens de sante, PESAugusto, Vincent; Ecole des Mines de Saint-Etienne, Dalmas, Benjamin; École des Mines de Saint-Étienne, Centre Ingénierie et SantéXie, Xiaolan (Guest Editor Only); Ecole des Mines de Saint-Etienne; Bongue, Bienvenu; CETAF, PES; Laboratoire SNA-EPIS EA 4607
Key Words: Machine Learning, Healthcare, Bayesian Inference, Decision-Tree, Medical Test Rationing
Note: The following files were submitted by the author for peer review, but cannot be converted to PDF. You must view these files (e.g. movies) online.
T-ASE_2019_Paper_v8.texT-ASE_Refs.bib
T-ASE
IEEE TRANSACTIONS ON AUTOMATION SCIENCE AND ENGINEERING, VOL. XX, NO. XX, JULY 2019 1
A decision-tree-based Bayesian approach forchance-constrained health prevention budget
rationingNilson Herazo-Padilla, Member, IEEE, Vincent Augusto, Benjamin Dalmas, Xiaolan Xie, Fellow, IEEE
and Bienvenu Bongue
Abstract—Medical test selection is a recurring problem inhealthcare prevention and consists in proposing a set of teststo each subject for diagnosis and treatment of pathologies. Theproblem is characterized by the unknown risk probability dis-tribution across the population and two contradictory objectives: minimizing the number of tests and giving the medical test toall at-risk population. This paper sets this problem in a moregeneral framework of chance-constrained medical test rationingwith unknown subject distribution over an attribute space andunknown risk probability but with a given sample population. Anew approach combining decision-tree and Bayesian inferenceis proposed to allocate relevant medical tests according tosubjects profile. A case study on ECG allocation in healthprevention is conducted and the performance of the proposedapproach evaluated. The results show that significant savingson unnecessary tests could be achieved with limited numbers ofsubjects needing but not receiving ECG.
Index Terms—Machine Learning, Healthcare, Health Pre-vention, Bayesian Inference, Decision-Tree, ECG, Medical TestRationing.
I. INTRODUCTION
THIS paper addresses the problem of optimizing publichealth prevention budget by personalized portfolio of
medical tests depending on personal characteristics of thesubject. Such health prevention budget rationing is of coursesubject to the constraints related to the missions of healthprevention, i.e. to allow population at risk to have theirrecommended medical tests. In this paper, we address thebasic problem of whether an expensive medical test such asECG(electrocardiogram) is needed for a particular subject.
This paper is part of our collaboration with CETAF (Centretechnique d’appui et de formation des centres d’examen sante,in French), the technical center of support and training inhealth prevention of the French national social-security sys-tem. In France, all citizens have access to a preventive medicalexamination every year called EPS (Examen de Preventionen Sante, in French). These medical tests are performed inpublic centers for medical tests called CES (Centre d’examensde sante, in French). One primary mission of the CETAF is
N. Herazo-Padilla, V. Augusto B. Dalmas and X. Xie are with Mines Saint-Etienne, Univ Clermont Auvergne, CNRS, UMR 6158 LIMOS, Centre CIS, F-42023 Saint-Etienne France. Email: nilson.herazo, augusto, benjamin.dalmas,[email protected].
Bienvenu Bongue is with CETAF and Laboratoire SNA-EPIS EA 4607,Saint-Etienne, France. Email: [email protected].
X. Xie is also with Shanghai Jiao Tong University, China.Manuscript received xxxx xx, 2019; revised xxxx xx, 2019.
the development and implementation of healthcare preventionprograms.
Implementation of EPS raises challenges. Given the het-erogeneity of the population and the intrinsic difficulty ofdisease screening, the current practice of CESs have been theprescription of a comprehensive set of medical tests to allsubjects. Such practices are conservative, many unnecessarymedical tests are prescribed to healthy subjects and hence donot contribute to the screening of the subjects health problems.This not only results in an unnecessary waste of time andefforts from physicians, nurses and staff of the CESs but alsoincrease the costs of the whole national healthcare system.
To improve the cost-efficiency of the EPS, the CETAF hasinvestigated the design and implementation of EPS modulationwhich involves a classification of the subjects initially byage, and then by population affected by common chronicdiseases as well as population affected by different addictions.A different set of medical tests is then proposed to eachpopulation group, however this process is still very generalsince classifying an individual to a certain group does notprovide physicians and practitioners with effective tools toefficiently allocate medical tests to subjects.
The research question that motivates this paper is whetherECG test is necessary for all subjects. ECG is mainly usedfor detection of cardiac rhythm disorders and cardiovascularpathologies. The current practice of most CESs is to proposeECG to nearly all subjects in order to detect all subjects atrisk. This unfortunately comes with excessive public healthcost for only about 1% of hypertension subjects detected. Atthe same time, it is intuitively conceivable that the optimalrange of medical tests to perform varies according to thecharacteristics and profile of the subject. One CES has alreadytried to rationalize ECG tests. It is found that, with appropriateprofiling of CES subjects, it is possible to significantly reducethe number of ECG tests without decreasing the number ofcases of hypertension detected. In a preliminary study [1],decision-tree techniques are used for subject profiling and todesign profiling rules to determine populations for which ECGis needed and those for which ECG is not needed.
The goal of this paper is to develop a decision-tree Bayesianbased approach to ration the health prevention budget onmedical test ordering by profiling and allocating tests tosubjects a risk. The second goal is to quantify the overallsavings on unnecessary tests and assess the performance ofthe proposed approach.
Page 1 of 15 T-ASE
123456789101112131415161718192021222324252627282930313233343536373839404142434445464748495051525354555657585960
IEEE TRANSACTIONS ON AUTOMATION SCIENCE AND ENGINEERING, VOL. XX, NO. XX, JULY 2019 2
This paper builds on our preliminary study [1] to pro-pose a decision-tree based Bayesian approach for medicaltest rationing by taking into account sample size relateduncertainties. More specifically, we first set the problem ina more general framework of chance-constrained medical testrationing with unknown subject distribution over an attributespace and unknown risk probability but with a given samplepopulation. We then propose a four-step decision-tree basedapproach. The first step is the population classification bydecision-tree. The decision-tree being given, the second stepis a Bayesian inference of the unknown probabilities, i.e.the probabilities with which a generic subject traverses thedecision-tree and the risk probability of each sub-class. Thekey to the Bayesian inference is to consider the samplepopulation as i.i.d. realization of the corresponding stochasticdecision-tree model. With the inferred probabilities, the thirdstep evaluates the key performance indicators including theprobability of a generic subject being in a sub-class and theprobability that it is an at risk subject of the sub-class. Theseperformance indicators are used in Step 4 to build an integerprogramming model for medical test rationing. The proposedapproach is then applied to a real case study.
The scientific contribution of this paper are two-fold : (i)a general framework with unknown subject distribution overan attribute space and unknown risk probability but with agiven sample population and (ii) a new decision-tree-basedBayesian approach to allocate relevant medical tests accordingto subjects profile. This approach has the ability of quantifyingrelevant uncertainties from a given dataset of sample popula-tion. Potential reductions on healthcare prevention costs arepresented with the implementation of this approach comparedto the current practices in CESs.
The remainder of this paper is organized as follows. SectionII presents a background of the main contributions in the fieldof medical test selection and rationing as well as machinelearning based solutions presented. Section III provides a gen-eral framework of medical test rationing. Section IV presentsthe decision-tree-based Bayesian approach. Section V presentsnumerical results and a study case considered, to show thebenefits of implementing the proposed approach. Conclusionare presented in section VI.
II. LITERATURE REVIEW
A. Data-mining and Machine learning related applications inhealthcare
Current research on healthcare and health prevention pro-grams shows an emerging trend towards the implementation ofmachine learning and data-mining related techniques to dealwith different problems in such fields. This is also reinforcedwith the use of Electronic Health Records (EHR) which allowscollecting and exploiting large databases of medical informa-tion. Recent reviews on data-driven applications in healthcareconcluding this trend can be found in [2]–[4]. Machine learn-ing has been implemented in medical diagnostics. In [5] theauthors propose ensemble feature selection strategies for acuteabdominal pain classification. One of the most commonlyaddressed subjects in terms of health prevention is patient
readmission. Studies addressing patient readmission predictionusing multivariate statistical analysis and logistic regressionto develop predictive models are presented in [6], [7]. Aninteresting review on risk prediction models is presented in[8]. Machine learning and predictive models have also beenused in pathology screening and detection [9], [10]. In [9]for instance a set of data-mining models including neuralnetworks, Bayesian Networks, Random Forest, Decision Treesand Log Regression, were implemented using EHRs data topredict individual patient treatment response. A comprehensivereview of predictive data-mining applications in medicineis presented in [2]. A set of important guidelines for theimplementation of such techniques in the field of medicineare presented. Recent applications of machine learning havefocused on determining the set of features determinant inpathology detection [11]–[13]. These studies aim at providingmedical staff with useful insights and support for decision-making. This strategy could be highly beneficial since, ac-cording to [14] providing physicians with valuable informationcontributes to improve their professional practice better thanother methods such as educational conferences.
B. Applications related to medical test rationing
Back in 1983 the problem of test ordering is already high-lighted by [15] where authors show that due to conservativebehaviors and professional practice habits clinicians tend toorder more tests than needed which leads to unnecessaryexpenses. Studies addressing applications for test rationing viachanging physicians behavior are presented in [14], [16]–[18].In these studies, intervention strategies based on physician ed-ucation and bans, to ration test ordering are discussed. Patientprofile-based test selection strategies are also studied. In [19]a Decision Support System application, reveal interesting per-spectives on the use of medical records and information fromclinical guidelines to support test ordering. In [20] differentmachine learning techniques are used to analyze text fromindividual patient’s electronic medical records. A medical testrecommendation system is then proposed to support medicaltest selection. In [1] a decision-tree-based strategy is presentedto profile subjects for pathology detection and test rationing.In such types of problems an efficient strategy for test orderingis crucial.
C. Contribution of this paper
Research on profiling subjects for medical test rationingis scarce and to the best our knowledge, studies consideringuncertainties related to sample size and risk probability in thefield of health prevention programs have not been proposed.Most data-driven solutions presented consider multiple ma-chine learning related models sometimes integrated to DSSsto support medical decision-making on test selection. Howeversuch strategies do not account for the intrinsic stochasticityrelated to risk detection, sample size and particular char-acteristics within these types of problems. The constructionof subjects profiles in order to personalize the test selectionprocess is also rarely considered in current studies regardingmedical test rationing. The contribution of this paper helps to
Page 2 of 15T-ASE
123456789101112131415161718192021222324252627282930313233343536373839404142434445464748495051525354555657585960
IEEE TRANSACTIONS ON AUTOMATION SCIENCE AND ENGINEERING, VOL. XX, NO. XX, JULY 2019 3
fill the gap in data-driven solutions for this problem, account-ing for the intrinsic stochastic behavior on test prescriptiondue to uncertainties related to the use of different datasets.Bayesian analysis have been used to account for uncertaintiesrelated to data input and output [21], [22], however in thecontext of the problem under study no applications have beenproposed. To introduce a general application solution, thispaper presents a bayesian-based decision tree classification-optimization approach for health prevention profiling andmedical test rationing.
III. PROBLEM DESCRIPTION
This paper considers the problem of screening a givendisease (hypertension in our case study, HTA for short) fora homogeneous population. Each subject is characterized by aset of attributes such as age, profession, blood pressures, . . . .Each attribute can be either qualitative or quantitative. Let zbe the vector of attribute values of the subject. The attributevector is from the attribute space according to some givenbut unknown probability distribution (called to subject flowdistribution).
Assume that the subject with attribute vector z is at riskof the disease with a given but unknown risk probabilityF (z). We assume that the medical test of interest (ECGin our case study)is only recommended for subject at risk.Formally speaking, the whole population P is divided inat risk population PY and population without risk PN , i.e.P = PY ∪ PN .
The problem consists in first partitioning the whole pop-ulation P into sub-population P1, . . . , Pm (called profiling)and then determining whether to give each sub-population themedical test (called rationing) in order to minimize the totalnumber of medical tests, i.e.
minEz
[m∑i=1
Ii1(z ∈ Pi)
](1)
such that the probability that a generic new subject is at riskbut is not given the recommended medical test is at most α,i.e.
Ez
[m∑i=1
(1− Ii)F (z)1(z ∈ Pi)
]≤ α (2)
which is called the chance constraint where Ii is a binaryvariable equal to 1 if sub-population Pi is given medical testand 1(z ∈ Pi) is an identity function indicating whether theattribute vector z belongs to Pi.
The major challenge is the unknown subject flow distri-bution over the attribute space and the risk probability foreach attribute vector. Instead, the input data of our study isa given collection of subjects from some data-base that wecall sample population. For each given subject, we know itsattribute vector and whether the subject is at risk or not.• Remark 1 : The partition of the population P is equivalent
to partition the attribute space and each sub-populationcorresponds to a disjoint attribute sub-space.
• Remark 2 : Our model contains two uncertainties, theprobability of the distribution of the population overthe attribute space and the risk probability of eachsub-population. Both probability distributions are un-known.
• Remark 3 : In this paper, the chance constraint is definedas the risk of the whole population (at risk or not). Analternative chance constraint is the probability of notgiving the recommended medical test to an at risk subject.
IV. A DECISION-TREE-BASED BAYESIAN APPROACH
A. Overview of the approach
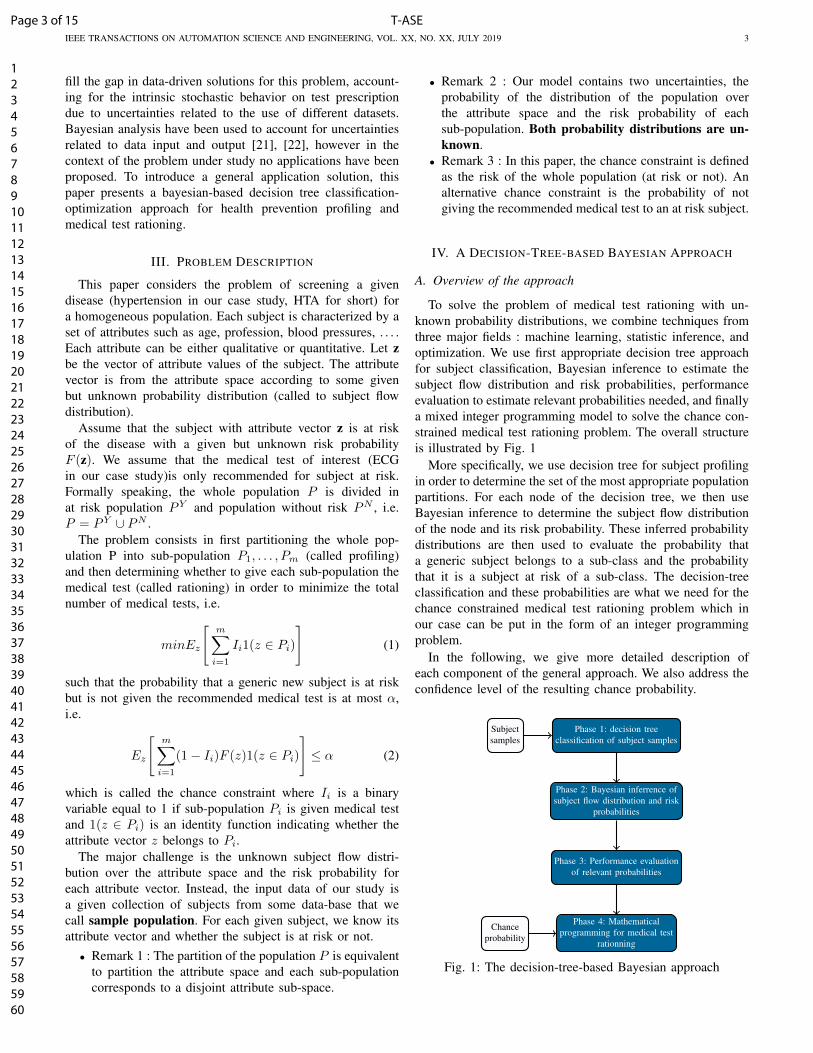
To solve the problem of medical test rationing with un-known probability distributions, we combine techniques fromthree major fields : machine learning, statistic inference, andoptimization. We use first appropriate decision tree approachfor subject classification, Bayesian inference to estimate thesubject flow distribution and risk probabilities, performanceevaluation to estimate relevant probabilities needed, and finallya mixed integer programming model to solve the chance con-strained medical test rationing problem. The overall structureis illustrated by Fig. 1
More specifically, we use decision tree for subject profilingin order to determine the set of the most appropriate populationpartitions. For each node of the decision tree, we then useBayesian inference to determine the subject flow distributionof the node and its risk probability. These inferred probabilitydistributions are then used to evaluate the probability thata generic subject belongs to a sub-class and the probabilitythat it is a subject at risk of a sub-class. The decision-treeclassification and these probabilities are what we need for thechance constrained medical test rationing problem which inour case can be put in the form of an integer programmingproblem.
In the following, we give more detailed description ofeach component of the general approach. We also address theconfidence level of the resulting chance probability.
Phase 1: decision treeclassification of subject samples
Phase 2: Bayesian inferrence ofsubject flow distribution and risk
probabilities
Phase 3: Performance evaluationof relevant probabilities
Phase 4: Mathematicalprogramming for medical test
rationning
Subjectsamples
Chanceprobability
Fig. 1: The decision-tree-based Bayesian approach
Page 3 of 15 T-ASE
123456789101112131415161718192021222324252627282930313233343536373839404142434445464748495051525354555657585960
IEEE TRANSACTIONS ON AUTOMATION SCIENCE AND ENGINEERING, VOL. XX, NO. XX, JULY 2019 4
B. Decision-tree classification of subjects
The decision tree approach proposed in this paper aim atprofiling subjects for test rationing. Decision trees not onlyoffer a practical way of solving classification problems but arealso very effective on identifying shared features on subjectsclassified under a given category. These categories could be forinstance, a set of pathologies related to the type of populationanalyzed. This also allows the characterization of subjectunder separate profiles. The model developed in this researchimplements decision trees and intends to define the optimalset of medical tests for screening, diagnosis or treatment ofpathologies related to the profiles identified. Subject profilesare determined by a set of common features to which pertinentmedical tests are to be assigned. The appropriateness of a testassigned to a specific profile is determined by the selection ofthe test result feature on the decision tree. This indicates anhistorical and statistical importance of this particular test inthe prediction and classification of the defined categories orclasses. Hence, our methodology is able to learn from medicalhistory data, the characteristics of subjects at risk of differentpathologies commonly affecting the population under study.
In order to implement decision tree classification a datasetwith subjects socioeconomic information and characteristicsis preprocessed. Categorical variables are transformed intonumerical equivalents and a response variable on which pre-dictions are based is also defined. The response variable couldhave either a single or multiple outcomes and the classificationproblem is then either a single or multiclass problem. Ingeneral, this clustering method labels records into the setof levels of the response variable taking into account thefrequency of appearance of each feature value or split value,each time a level of the response variable occurs. The proposedmodel is based on the classic CART (Classification AndRegression Tree) algorithm [23]. This algorithm produces aclassification tree by means of three simple steps: I. Definea sample spitting rule II. Define a goodness-of-split criterionIII. Define a criterion for choosing an optimal final tree. First,splitting rules are defined. An impurity function that measurethe misclassification rate on each node (split) is introduced.Based on this criterion, a splitting rule is defined. These rulesare defined by selecting the feature and split value whichreduce the most the impurity of the resulting sub-populations.If the feature X value is lower or equal to the splitting values, the record is sent to the subset on the left, if not then issent to the right. Both resulting nodes should contain a morehomogeneous sub-samples of subjects. After this, a goodness-of-fit criterion is defined. This criterion measures the decreasein impurity produced by the selected split. Finally the selectionof the optimal tree is performed measuring the accuracy ofthe tree. Learning and testing datasets are predefined and thenthe tree is constructed and its predictive accuracy is measuredusing the testing dataset. The length and width of the tree canbe established by means of predefined parameters [23]. Thefinal objective of this technique is to predict the occurrenceof the response variable outcomes in future scenarios usinginformation from the features and set of rules constructed.
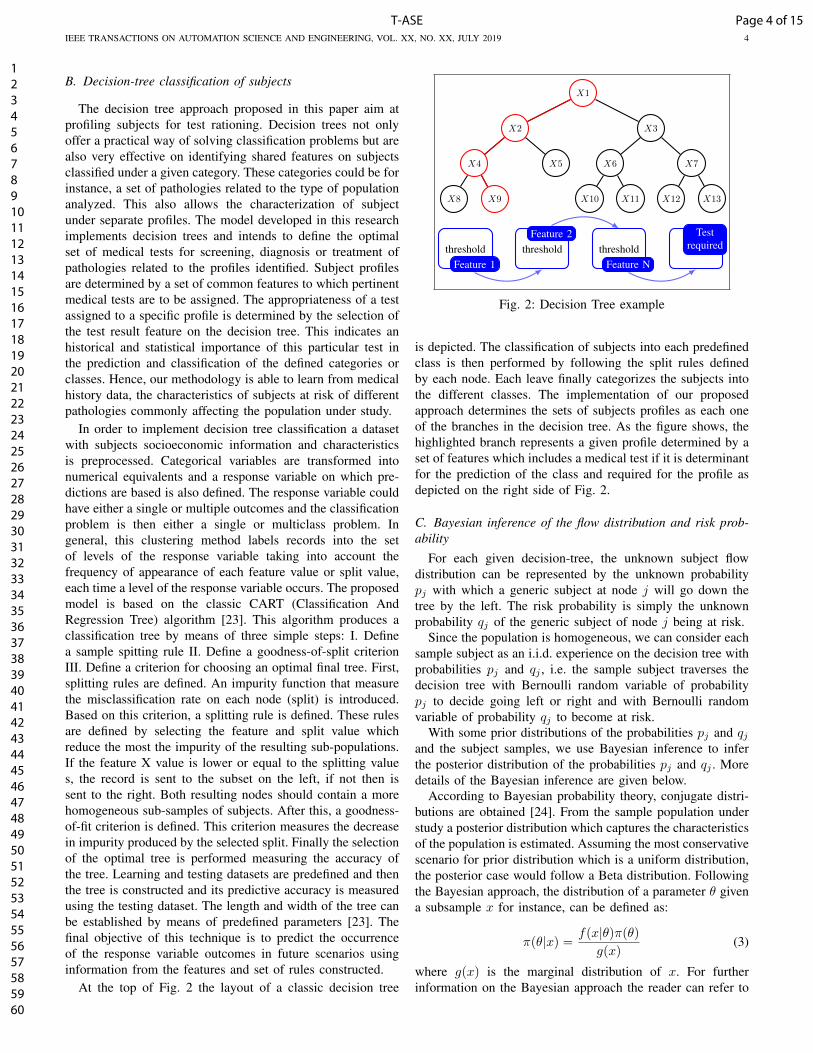
At the top of Fig. 2 the layout of a classic decision tree
X1
X2
X4
X8 X9
X5
X3
X6
X10 X11
X7
X12 X13
thresholdFeature 1
thresholdFeature 2
thresholdFeature N
Testrequired
Fig. 2: Decision Tree example
is depicted. The classification of subjects into each predefinedclass is then performed by following the split rules definedby each node. Each leave finally categorizes the subjects intothe different classes. The implementation of our proposedapproach determines the sets of subjects profiles as each oneof the branches in the decision tree. As the figure shows, thehighlighted branch represents a given profile determined by aset of features which includes a medical test if it is determinantfor the prediction of the class and required for the profile asdepicted on the right side of Fig. 2.
C. Bayesian inference of the flow distribution and risk prob-ability
For each given decision-tree, the unknown subject flowdistribution can be represented by the unknown probabilitypj with which a generic subject at node j will go down thetree by the left. The risk probability is simply the unknownprobability qj of the generic subject of node j being at risk.
Since the population is homogeneous, we can consider eachsample subject as an i.i.d. experience on the decision tree withprobabilities pj and qj , i.e. the sample subject traverses thedecision tree with Bernoulli random variable of probabilitypj to decide going left or right and with Bernoulli randomvariable of probability qj to become at risk.
With some prior distributions of the probabilities pj and qjand the subject samples, we use Bayesian inference to inferthe posterior distribution of the probabilities pj and qj . Moredetails of the Bayesian inference are given below.
According to Bayesian probability theory, conjugate distri-butions are obtained [24]. From the sample population understudy a posterior distribution which captures the characteristicsof the population is estimated. Assuming the most conservativescenario for prior distribution which is a uniform distribution,the posterior case would follow a Beta distribution. Followingthe Bayesian approach, the distribution of a parameter θ givena subsample x for instance, can be defined as:
π(θ|x) =f(x|θ)π(θ)
g(x)(3)
where g(x) is the marginal distribution of x. For furtherinformation on the Bayesian approach the reader can refer to
Page 4 of 15T-ASE
123456789101112131415161718192021222324252627282930313233343536373839404142434445464748495051525354555657585960
IEEE TRANSACTIONS ON AUTOMATION SCIENCE AND ENGINEERING, VOL. XX, NO. XX, JULY 2019 5
[24]. The posterior distribution of the parameter θ, is derivedas π(θ|x) for the current subsample x. Each new subsamplewill then update the parameters of the posterior distribution.This process intends to provide a more accurate idea of the truevalue of the parameter and capture changes and differences ineach one of the subsamples used to analyze the populationunder study.
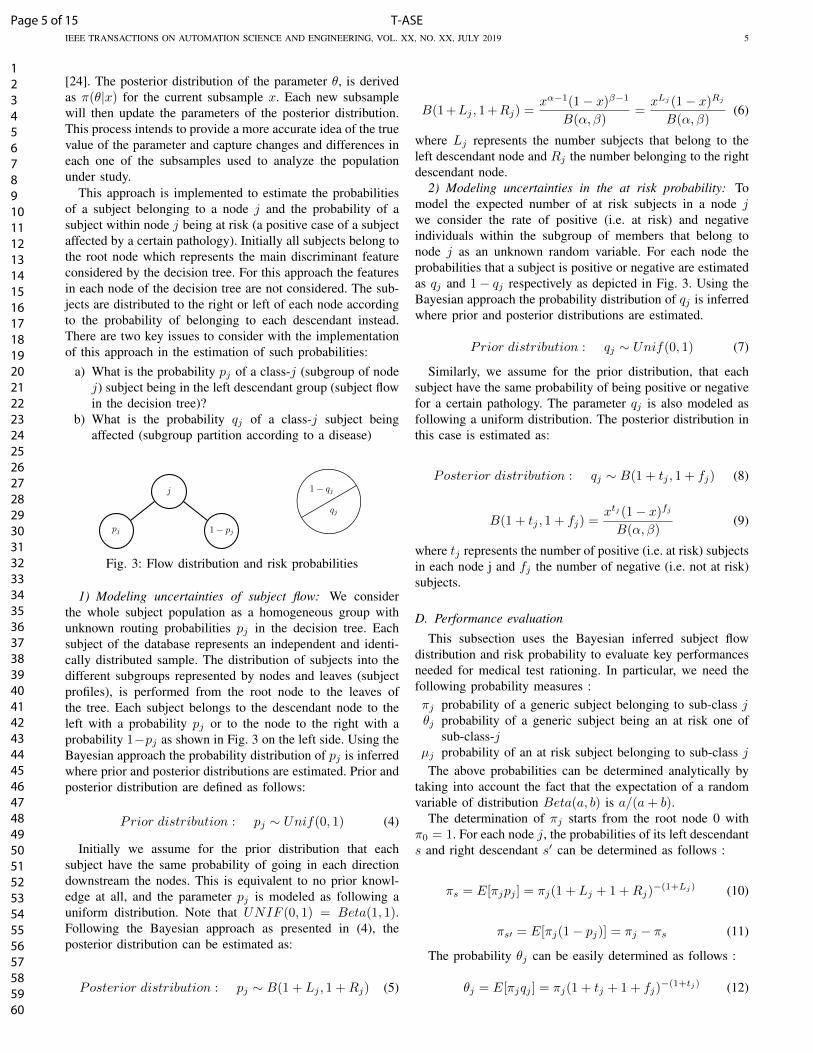
This approach is implemented to estimate the probabilitiesof a subject belonging to a node j and the probability of asubject within node j being at risk (a positive case of a subjectaffected by a certain pathology). Initially all subjects belong tothe root node which represents the main discriminant featureconsidered by the decision tree. For this approach the featuresin each node of the decision tree are not considered. The sub-jects are distributed to the right or left of each node accordingto the probability of belonging to each descendant instead.There are two key issues to consider with the implementationof this approach in the estimation of such probabilities:
a) What is the probability pj of a class-j (subgroup of nodej) subject being in the left descendant group (subject flowin the decision tree)?
b) What is the probability qj of a class-j subject beingaffected (subgroup partition according to a disease)
j
pj 1− pj
1− qj
qj
Fig. 3: Flow distribution and risk probabilities
1) Modeling uncertainties of subject flow: We considerthe whole subject population as a homogeneous group withunknown routing probabilities pj in the decision tree. Eachsubject of the database represents an independent and identi-cally distributed sample. The distribution of subjects into thedifferent subgroups represented by nodes and leaves (subjectprofiles), is performed from the root node to the leaves ofthe tree. Each subject belongs to the descendant node to theleft with a probability pj or to the node to the right with aprobability 1−pj as shown in Fig. 3 on the left side. Using theBayesian approach the probability distribution of pj is inferredwhere prior and posterior distributions are estimated. Prior andposterior distribution are defined as follows:
Prior distribution : pj ∼ Unif(0, 1) (4)
Initially we assume for the prior distribution that eachsubject have the same probability of going in each directiondownstream the nodes. This is equivalent to no prior knowl-edge at all, and the parameter pj is modeled as following auniform distribution. Note that UNIF (0, 1) = Beta(1, 1).Following the Bayesian approach as presented in (4), theposterior distribution can be estimated as:
Posterior distribution : pj ∼ B(1 + Lj , 1 +Rj) (5)
B(1 +Lj , 1 +Rj) =xα−1(1− x)β−1
B(α, β)=xLj (1− x)Rj
B(α, β)(6)
where Lj represents the number subjects that belong to theleft descendant node and Rj the number belonging to the rightdescendant node.
2) Modeling uncertainties in the at risk probability: Tomodel the expected number of at risk subjects in a node jwe consider the rate of positive (i.e. at risk) and negativeindividuals within the subgroup of members that belong tonode j as an unknown random variable. For each node theprobabilities that a subject is positive or negative are estimatedas qj and 1− qj respectively as depicted in Fig. 3. Using theBayesian approach the probability distribution of qj is inferredwhere prior and posterior distributions are estimated.
Prior distribution : qj ∼ Unif(0, 1) (7)
Similarly, we assume for the prior distribution, that eachsubject have the same probability of being positive or negativefor a certain pathology. The parameter qj is also modeled asfollowing a uniform distribution. The posterior distribution inthis case is estimated as:
Posterior distribution : qj ∼ B(1 + tj , 1 + fj) (8)
B(1 + tj , 1 + fj) =xtj (1− x)fj
B(α, β)(9)
where tj represents the number of positive (i.e. at risk) subjectsin each node j and fj the number of negative (i.e. not at risk)subjects.
D. Performance evaluation
This subsection uses the Bayesian inferred subject flowdistribution and risk probability to evaluate key performancesneeded for medical test rationing. In particular, we need thefollowing probability measures :πj probability of a generic subject belonging to sub-class jθj probability of a generic subject being an at risk one of
sub-class-jµj probability of an at risk subject belonging to sub-class j
The above probabilities can be determined analytically bytaking into account the fact that the expectation of a randomvariable of distribution Beta(a, b) is a/(a+ b).
The determination of πj starts from the root node 0 withπ0 = 1. For each node j, the probabilities of its left descendants and right descendant s′ can be determined as follows :
πs = E[πjpj ] = πj(1 + Lj + 1 +Rj)−(1+Lj) (10)
πs′ = E[πj(1− pj)] = πj − πs (11)
The probability θj can be easily determined as follows :
θj = E[πjqj ] = πj(1 + tj + 1 + fj)−(1+tj) (12)
Page 5 of 15 T-ASE
123456789101112131415161718192021222324252627282930313233343536373839404142434445464748495051525354555657585960
IEEE TRANSACTIONS ON AUTOMATION SCIENCE AND ENGINEERING, VOL. XX, NO. XX, JULY 2019 6
Probability µj can be determined as πj by replacing thegeneric population by the at risk population.
Apart from the analytical evaluation, we also propose asimulation algorithm which can be used to evaluate aboveprobability measures and easily extended to evaluate otherssuch as the confidence intervals with respect to the uncertainprobability distributions.
Algorithm (simulating the decision tree traverse)
Step 1 : Initialization πj = θj = 0Step 2 : Start the decision tree traverse at root node j = 0Step 3 : Sample the risk probability qj of distributionBeta(1 + tj , 1 + fj)Step 4 : πj = πj + 1, θj = θj + qjStep 5 : If j is a leave, then go to Step 9Step 6 : Sample the routing probability pj of distributionBeta(1 +Lj , 1 +Rj) and sample a Bernoulli variate Ujwith probability pjStep 7 : Replace j by its left descendant if Uj = 1 andby its right descendant otherwiseStep 8 : Repeat steps 2− 7Step 9 : Repeat N times the decision tree traverseStep 10 : πj = πj/N, θj = θj/N,∀j
E. Medical test rationing
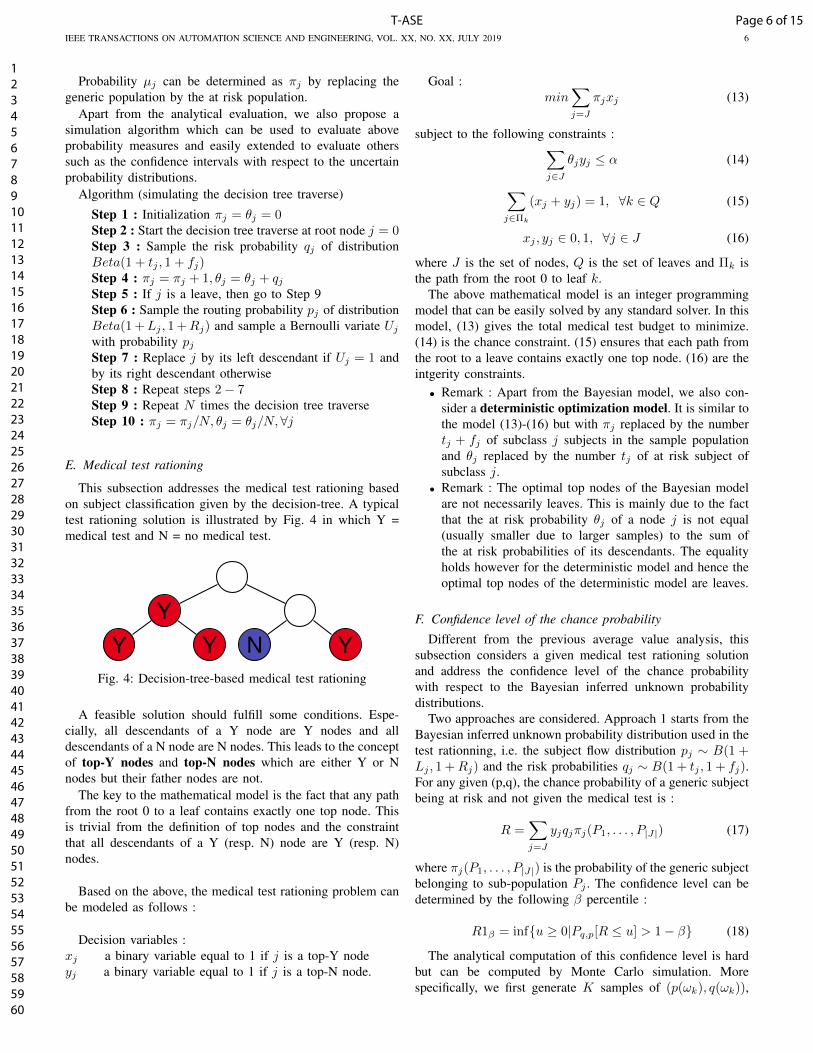
This subsection addresses the medical test rationing basedon subject classification given by the decision-tree. A typicaltest rationing solution is illustrated by Fig. 4 in which Y =medical test and N = no medical test.
YY Y N Y
Fig. 4: Decision-tree-based medical test rationing
A feasible solution should fulfill some conditions. Espe-cially, all descendants of a Y node are Y nodes and alldescendants of a N node are N nodes. This leads to the conceptof top-Y nodes and top-N nodes which are either Y or Nnodes but their father nodes are not.
The key to the mathematical model is the fact that any pathfrom the root 0 to a leaf contains exactly one top node. Thisis trivial from the definition of top nodes and the constraintthat all descendants of a Y (resp. N) node are Y (resp. N)nodes.
Based on the above, the medical test rationing problem canbe modeled as follows :
Decision variables :xj a binary variable equal to 1 if j is a top-Y nodeyj a binary variable equal to 1 if j is a top-N node.
Goal :min
∑j=J
πjxj (13)
subject to the following constraints :∑j∈J
θjyj ≤ α (14)
∑j∈Πk
(xj + yj) = 1, ∀k ∈ Q (15)
xj , yj ∈ 0, 1, ∀j ∈ J (16)
where J is the set of nodes, Q is the set of leaves and Πk isthe path from the root 0 to leaf k.
The above mathematical model is an integer programmingmodel that can be easily solved by any standard solver. In thismodel, (13) gives the total medical test budget to minimize.(14) is the chance constraint. (15) ensures that each path fromthe root to a leave contains exactly one top node. (16) are theintgerity constraints.• Remark : Apart from the Bayesian model, we also con-
sider a deterministic optimization model. It is similar tothe model (13)-(16) but with πj replaced by the numbertj + fj of subclass j subjects in the sample populationand θj replaced by the number tj of at risk subject ofsubclass j.
• Remark : The optimal top nodes of the Bayesian modelare not necessarily leaves. This is mainly due to the factthat the at risk probability θj of a node j is not equal(usually smaller due to larger samples) to the sum ofthe at risk probabilities of its descendants. The equalityholds however for the deterministic model and hence theoptimal top nodes of the deterministic model are leaves.
F. Confidence level of the chance probability
Different from the previous average value analysis, thissubsection considers a given medical test rationing solutionand address the confidence level of the chance probabilitywith respect to the Bayesian inferred unknown probabilitydistributions.
Two approaches are considered. Approach 1 starts from theBayesian inferred unknown probability distribution used in thetest rationning, i.e. the subject flow distribution pj ∼ B(1 +Lj , 1 +Rj) and the risk probabilities qj ∼ B(1 + tj , 1 + fj).For any given (p,q), the chance probability of a generic subjectbeing at risk and not given the medical test is :
R =∑j=J
yjqjπj(P1, . . . , P|J|) (17)
where πj(P1, . . . , P|J|) is the probability of the generic subjectbelonging to sub-population Pj . The confidence level can bedetermined by the following β percentile :
R1β = inf{u ≥ 0|Pq,p[R ≤ u] > 1− β} (18)
The analytical computation of this confidence level is hardbut can be computed by Monte Carlo simulation. Morespecifically, we first generate K samples of (p(ωk), q(ωk)),
Page 6 of 15T-ASE
123456789101112131415161718192021222324252627282930313233343536373839404142434445464748495051525354555657585960
IEEE TRANSACTIONS ON AUTOMATION SCIENCE AND ENGINEERING, VOL. XX, NO. XX, JULY 2019 7
determine their chance probabilities R(ωk) as in subsectionIV-D, sort them in non-increasing order R(ω[1]) ≥ R(ω[2]) ≥. . . ≥ R(ω[K]) and finally determine the confidence levelR1β = R(ω[bβKc]).
Approach 2 does not use the Bayesian inferred probabilitydistributions and use instead the partition of the samplepopupation P in four sub-population : TP (at risk and recevingtest), TN (not at risk and not receiving test), FP (not at riskbut receving test), FN(at risk but not receving test). Similarto the Bayesian inference of the previous subsections, witha uniformally distributed prior, the chance probability equalto the probability of a generic subject belonging to FN isB(1 + |FN |, 1 + |P |− |FN |). As a result, the β percentile ofthe chance probability is
R2β = F−1(β; 1 + |FN |, 1 + |P | − |FN |) (19)
where F (β; 1 + |FN |, 1 + |P | − |FN |) is the cdf of the betadistribution.
Comparing the two approaches, Approach 1 is based onmulitple prior distributions (for each pj and each qj) whereasApproach 2 relies only on a single prior. For this reason, weexpect R2β to be a better estimation of the confidence leveland only use approach 2 in our case study.
Note that the chance probability of an at risk subject notbeing given the medical test can be estimated similarly byreplacing the whole population by the at risk population.
V. CASE STUDY
This section presents the application of the proposed ap-proach in a real case study. The data used comes from the cen-ter for medical tests of Saint-Etienne in France. Centers suchas this are institutions connected to the national healthcaresystem where a health prevention medical examination is of-fered to all insured citizens. The screening process for differentpathologies in this center normally involves the prescriptionof medical and clinical tests. In the case of cardiovasculardiseases for instance, the search for risk factors and anomaliesusually involves the prescription of an electrocardiogram,called ECG from now on.
In this case study, we address the problem of rationing ECGtest subject to a public health constraint : the probability of ageneric subject being at risk and not receiving ECG is no morethan α. Our approach first generates a decision-tree model.Then flow distribution and risk probabilities are estimated andevaluated using Bayesian inference. Finally a mathematicalprogramming model for test rationing is solved.
A preliminary analysis on the data from the center understudy shows that about 85% of the subjects received an ECGand only a small percentage of those showed anomalies,corresponding to just 1% of the total population. Given thatECG for the screening of certain cardiovascular anomalies isonly justified in specific cases showing risk factors and specificcharacteristics [25]–[27], we apply our approach to propose amore efficient way to target and allocate tests while reducingthe probability that an affected subject will not receive a test.
The motivation behind this case study is based on thefact that current practices in the centers lean towards a very
conservative habit of prescribing the ECG to almost everysubject to avoid missing important cases. This behavior causesan increase in the prescription of unnecessary tests whichon large scale undoubtedly leads to a considerable waste ofnational healthcare system resources. The proposed approachis implemented for subject profiling and medical test rationing,aiming at improving the screening and treatment of subjectsat risk.
A. Dataset presentation and descriptive statistics
The dataset used for this study contains epidemiologicalinformation gathered in the center. It contains medical testresults and diagnosis, geographic, socioeconomic, clinical andlifestyle information of the subjects. Part of these data iscollected via questionnaires assigned to subjects upon arrivalat the center. The rest is obtained from medical history andthe preventive medical examination within the center. For thisstudy, data from 2006 and 2007 was analyzed. A generaldescription of the data from the population under study ispresented in Tables I - IV.
TABLE I: Dataset Content
PersonnalInformation Socioeconomic, work and living conditions
Medical historyand lifestyle Health status, medical history, alcohol, tobacco use, physical activity
Clinicalinformation Spirometry, blood pressure, biological tests, dental health
Healthfollow-up reports Vaccinal, cancer, oral hygienne, hypertention ...
TABLE II: Descriptive statistics of main variables
Variable N Minimum Maximum Average Std. Dev. Skewness Kurtosis
Age 21796 7 90 49.08 16.31 -0.40 -0.74
Weight 21778 19 172 69.80 14.64 0.45 0.98
BMI 21778 11.97 55.53 25.26 4.57 0.90 1,99
SBP 21769 80 270 123.90 14.92 0.75 1.93
DBP 21769 40 170 73.40 9.92 0.27 0.63
Tables I and II present a brief description of the generalinformation contained in the dataset used. The descriptivestatistics on Table II show that subjects are from almostall ages with the slightly left skewed age distribution whichsuggests a majority of adults with a mean of 49 years oldsubjects. This is consistent with the fact that historically themain users of medical examination centers are adults andelderly subjects. Concerning obesity, the dataset shows a rathercentered distribution with about half of the total within thenormal BMI values and half either in overweight or obesity.This is an important issue, since obesity is well-known to berelated to cardiovascular pathologies.
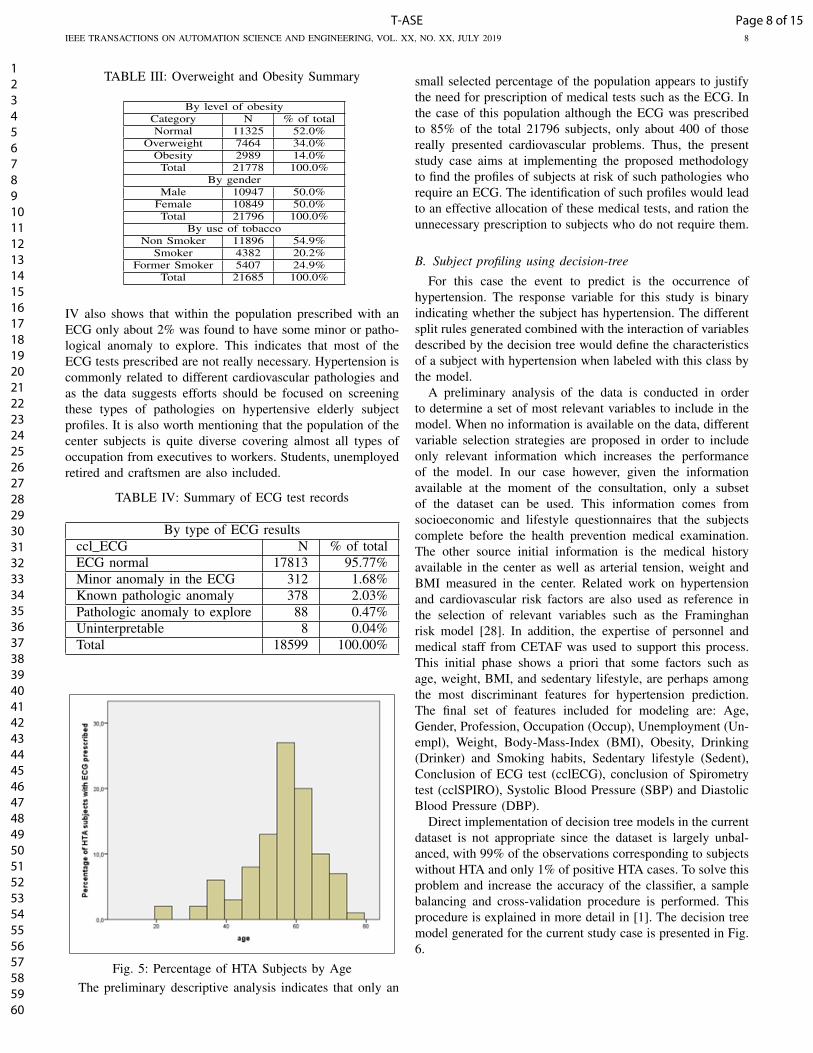
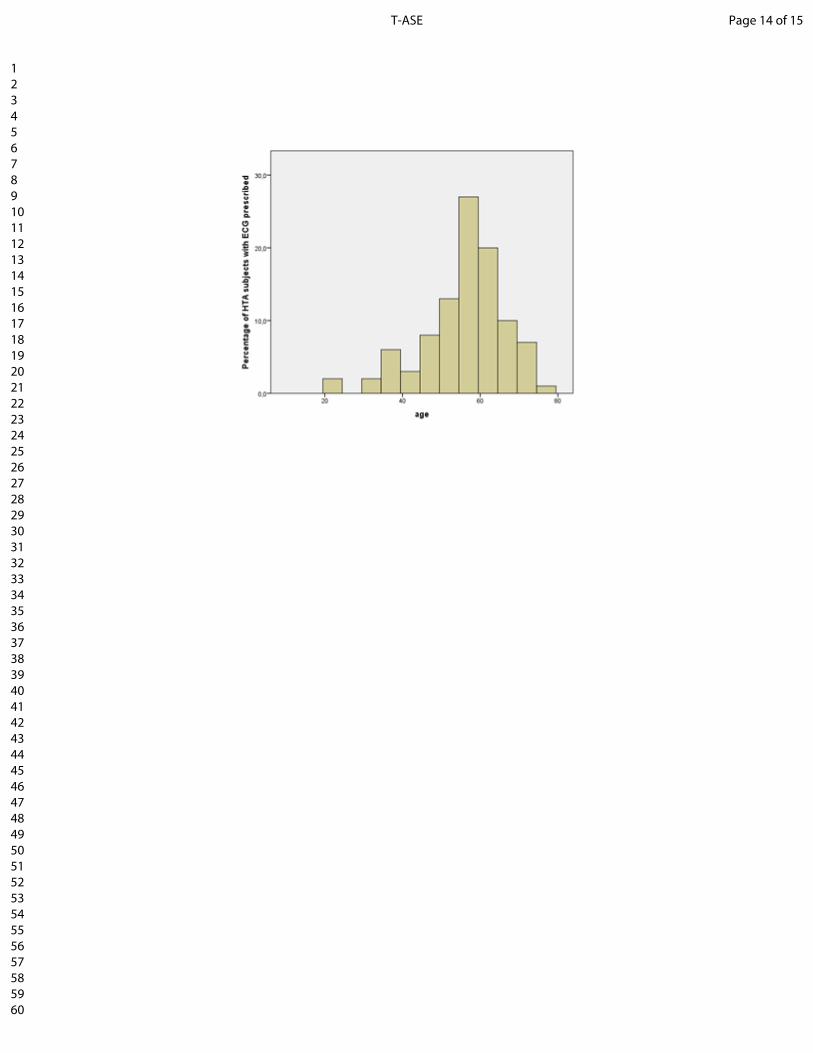
Given that an ECG is commonly prescribed for the screen-ing of cardiovascular diseases, Table IV and Fig. 5 presentssome general results of ECG test. From Fig. 5, the agedistribution of hypertensive subjects who were prescribed anECG is left skewed with a majority of elderly subjects. Table
Page 7 of 15 T-ASE
123456789101112131415161718192021222324252627282930313233343536373839404142434445464748495051525354555657585960
IEEE TRANSACTIONS ON AUTOMATION SCIENCE AND ENGINEERING, VOL. XX, NO. XX, JULY 2019 8
TABLE III: Overweight and Obesity Summary
By level of obesityCategory N % of totalNormal 11325 52.0%
Overweight 7464 34.0%Obesity 2989 14.0%
Total 21778 100.0%By gender
Male 10947 50.0%Female 10849 50.0%Total 21796 100.0%
By use of tobaccoNon Smoker 11896 54.9%
Smoker 4382 20.2%Former Smoker 5407 24.9%
Total 21685 100.0%
IV also shows that within the population prescribed with anECG only about 2% was found to have some minor or patho-logical anomaly to explore. This indicates that most of theECG tests prescribed are not really necessary. Hypertension iscommonly related to different cardiovascular pathologies andas the data suggests efforts should be focused on screeningthese types of pathologies on hypertensive elderly subjectprofiles. It is also worth mentioning that the population of thecenter subjects is quite diverse covering almost all types ofoccupation from executives to workers. Students, unemployedretired and craftsmen are also included.
TABLE IV: Summary of ECG test records
By type of ECG resultsccl ECG N % of totalECG normal 17813 95.77%Minor anomaly in the ECG 312 1.68%Known pathologic anomaly 378 2.03%Pathologic anomaly to explore 88 0.47%Uninterpretable 8 0.04%Total 18599 100.00%
Fig. 5: Percentage of HTA Subjects by AgeThe preliminary descriptive analysis indicates that only an
small selected percentage of the population appears to justifythe need for prescription of medical tests such as the ECG. Inthe case of this population although the ECG was prescribedto 85% of the total 21796 subjects, only about 400 of thosereally presented cardiovascular problems. Thus, the presentstudy case aims at implementing the proposed methodologyto find the profiles of subjects at risk of such pathologies whorequire an ECG. The identification of such profiles would leadto an effective allocation of these medical tests, and ration theunnecessary prescription to subjects who do not require them.
B. Subject profiling using decision-tree
For this case the event to predict is the occurrence ofhypertension. The response variable for this study is binaryindicating whether the subject has hypertension. The differentsplit rules generated combined with the interaction of variablesdescribed by the decision tree would define the characteristicsof a subject with hypertension when labeled with this class bythe model.
A preliminary analysis of the data is conducted in orderto determine a set of most relevant variables to include in themodel. When no information is available on the data, differentvariable selection strategies are proposed in order to includeonly relevant information which increases the performanceof the model. In our case however, given the informationavailable at the moment of the consultation, only a subsetof the dataset can be used. This information comes fromsocioeconomic and lifestyle questionnaires that the subjectscomplete before the health prevention medical examination.The other source initial information is the medical historyavailable in the center as well as arterial tension, weight andBMI measured in the center. Related work on hypertensionand cardiovascular risk factors are also used as reference inthe selection of relevant variables such as the Framinghanrisk model [28]. In addition, the expertise of personnel andmedical staff from CETAF was used to support this process.This initial phase shows a priori that some factors such asage, weight, BMI, and sedentary lifestyle, are perhaps amongthe most discriminant features for hypertension prediction.The final set of features included for modeling are: Age,Gender, Profession, Occupation (Occup), Unemployment (Un-empl), Weight, Body-Mass-Index (BMI), Obesity, Drinking(Drinker) and Smoking habits, Sedentary lifestyle (Sedent),Conclusion of ECG test (cclECG), conclusion of Spirometrytest (cclSPIRO), Systolic Blood Pressure (SBP) and DiastolicBlood Pressure (DBP).
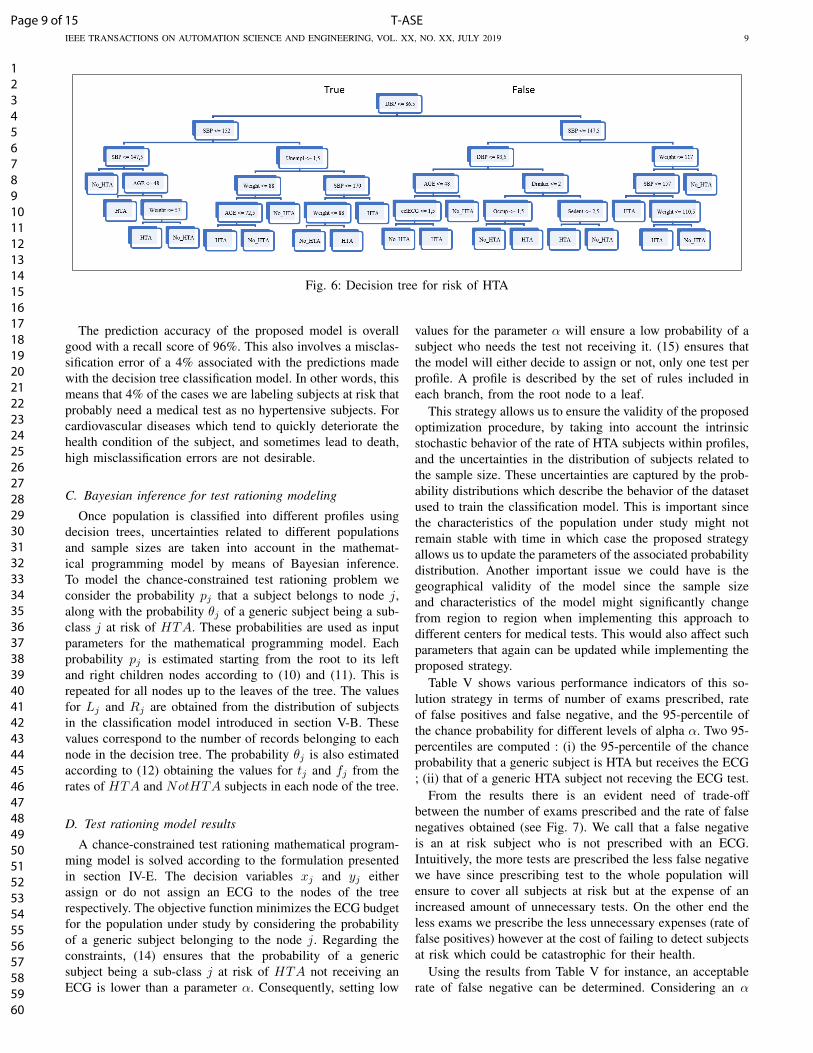
Direct implementation of decision tree models in the currentdataset is not appropriate since the dataset is largely unbal-anced, with 99% of the observations corresponding to subjectswithout HTA and only 1% of positive HTA cases. To solve thisproblem and increase the accuracy of the classifier, a samplebalancing and cross-validation procedure is performed. Thisprocedure is explained in more detail in [1]. The decision treemodel generated for the current study case is presented in Fig.6.
Page 8 of 15T-ASE
123456789101112131415161718192021222324252627282930313233343536373839404142434445464748495051525354555657585960
IEEE TRANSACTIONS ON AUTOMATION SCIENCE AND ENGINEERING, VOL. XX, NO. XX, JULY 2019 9
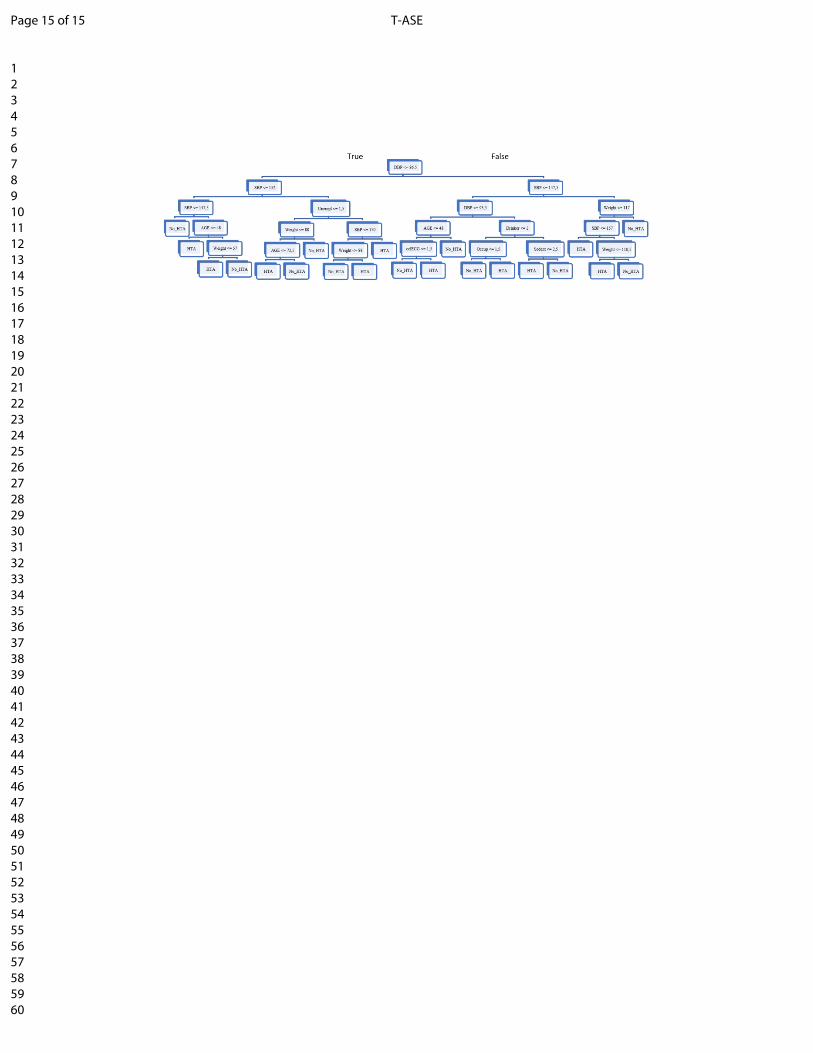
Fig. 6: Decision tree for risk of HTA
The prediction accuracy of the proposed model is overallgood with a recall score of 96%. This also involves a misclas-sification error of a 4% associated with the predictions madewith the decision tree classification model. In other words, thismeans that 4% of the cases we are labeling subjects at risk thatprobably need a medical test as no hypertensive subjects. Forcardiovascular diseases which tend to quickly deteriorate thehealth condition of the subject, and sometimes lead to death,high misclassification errors are not desirable.
C. Bayesian inference for test rationing modeling
Once population is classified into different profiles usingdecision trees, uncertainties related to different populationsand sample sizes are taken into account in the mathemat-ical programming model by means of Bayesian inference.To model the chance-constrained test rationing problem weconsider the probability pj that a subject belongs to node j,along with the probability θj of a generic subject being a sub-class j at risk of HTA. These probabilities are used as inputparameters for the mathematical programming model. Eachprobability pj is estimated starting from the root to its leftand right children nodes according to (10) and (11). This isrepeated for all nodes up to the leaves of the tree. The valuesfor Lj and Rj are obtained from the distribution of subjectsin the classification model introduced in section V-B. Thesevalues correspond to the number of records belonging to eachnode in the decision tree. The probability θj is also estimatedaccording to (12) obtaining the values for tj and fj from therates of HTA and NotHTA subjects in each node of the tree.
D. Test rationing model results
A chance-constrained test rationing mathematical program-ming model is solved according to the formulation presentedin section IV-E. The decision variables xj and yj eitherassign or do not assign an ECG to the nodes of the treerespectively. The objective function minimizes the ECG budgetfor the population under study by considering the probabilityof a generic subject belonging to the node j. Regarding theconstraints, (14) ensures that the probability of a genericsubject being a sub-class j at risk of HTA not receiving anECG is lower than a parameter α. Consequently, setting low
values for the parameter α will ensure a low probability of asubject who needs the test not receiving it. (15) ensures thatthe model will either decide to assign or not, only one test perprofile. A profile is described by the set of rules included ineach branch, from the root node to a leaf.
This strategy allows us to ensure the validity of the proposedoptimization procedure, by taking into account the intrinsicstochastic behavior of the rate of HTA subjects within profiles,and the uncertainties in the distribution of subjects related tothe sample size. These uncertainties are captured by the prob-ability distributions which describe the behavior of the datasetused to train the classification model. This is important sincethe characteristics of the population under study might notremain stable with time in which case the proposed strategyallows us to update the parameters of the associated probabilitydistribution. Another important issue we could have is thegeographical validity of the model since the sample sizeand characteristics of the model might significantly changefrom region to region when implementing this approach todifferent centers for medical tests. This would also affect suchparameters that again can be updated while implementing theproposed strategy.
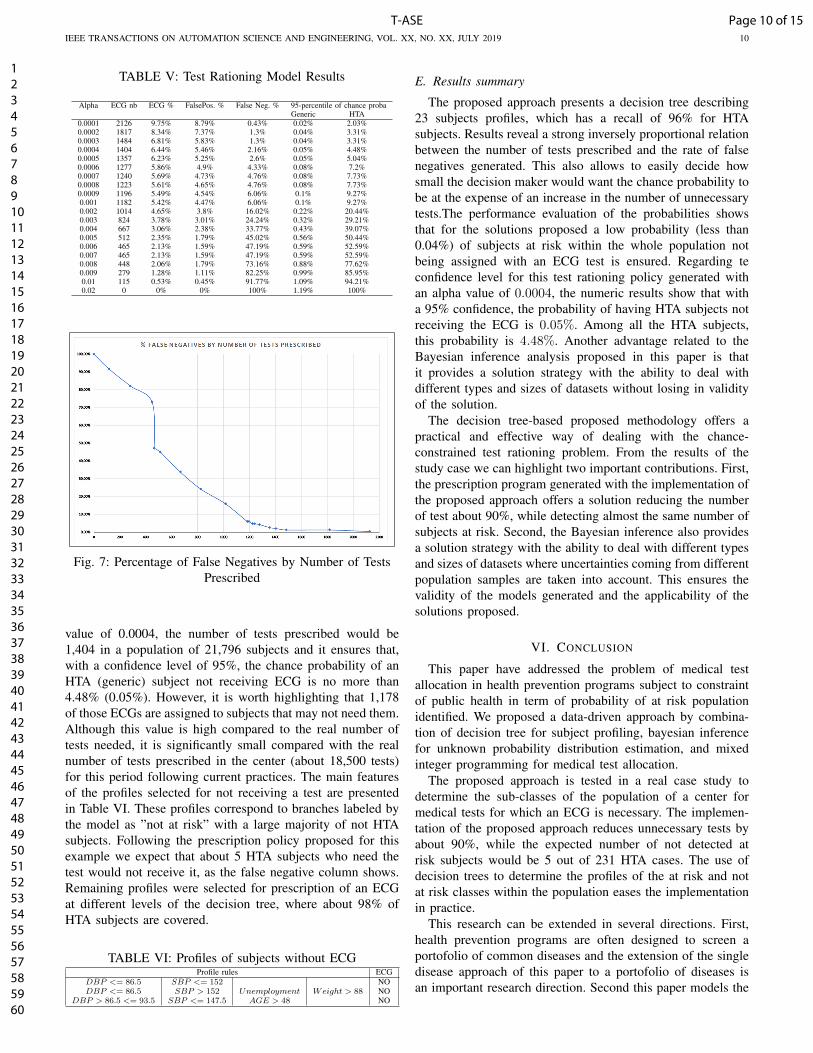
Table V shows various performance indicators of this so-lution strategy in terms of number of exams prescribed, rateof false positives and false negative, and the 95-percentile ofthe chance probability for different levels of alpha α. Two 95-percentiles are computed : (i) the 95-percentile of the chanceprobability that a generic subject is HTA but receives the ECG; (ii) that of a generic HTA subject not receving the ECG test.
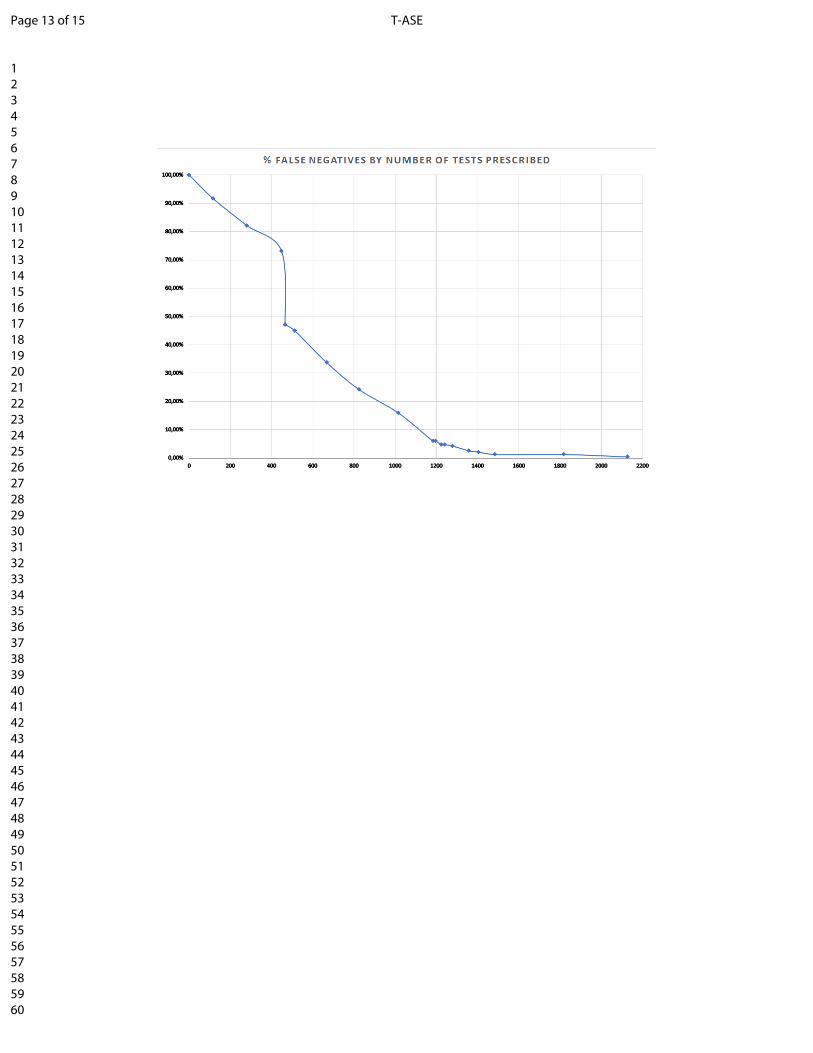
From the results there is an evident need of trade-offbetween the number of exams prescribed and the rate of falsenegatives obtained (see Fig. 7). We call that a false negativeis an at risk subject who is not prescribed with an ECG.Intuitively, the more tests are prescribed the less false negativewe have since prescribing test to the whole population willensure to cover all subjects at risk but at the expense of anincreased amount of unnecessary tests. On the other end theless exams we prescribe the less unnecessary expenses (rate offalse positives) however at the cost of failing to detect subjectsat risk which could be catastrophic for their health.
Using the results from Table V for instance, an acceptablerate of false negative can be determined. Considering an α
Page 9 of 15 T-ASE
123456789101112131415161718192021222324252627282930313233343536373839404142434445464748495051525354555657585960
IEEE TRANSACTIONS ON AUTOMATION SCIENCE AND ENGINEERING, VOL. XX, NO. XX, JULY 2019 10
TABLE V: Test Rationing Model Results
Alpha ECG nb ECG % FalsePos. % False Neg. % 95-percentile of chance probaGeneric HTA
0.0001 2126 9.75% 8.79% 0.43% 0.02% 2.03%0.0002 1817 8.34% 7.37% 1.3% 0.04% 3.31%0.0003 1484 6.81% 5.83% 1.3% 0.04% 3.31%0.0004 1404 6.44% 5.46% 2.16% 0.05% 4.48%0.0005 1357 6.23% 5.25% 2.6% 0.05% 5.04%0.0006 1277 5.86% 4.9% 4.33% 0.08% 7.2%0.0007 1240 5.69% 4.73% 4.76% 0.08% 7.73%0.0008 1223 5.61% 4.65% 4.76% 0.08% 7.73%0.0009 1196 5.49% 4.54% 6.06% 0.1% 9.27%0.001 1182 5.42% 4.47% 6.06% 0.1% 9.27%0.002 1014 4.65% 3.8% 16.02% 0.22% 20.44%0.003 824 3.78% 3.01% 24.24% 0.32% 29.21%0.004 667 3.06% 2.38% 33.77% 0.43% 39.07%0.005 512 2.35% 1.79% 45.02% 0.56% 50.44%0.006 465 2.13% 1.59% 47.19% 0.59% 52.59%0.007 465 2.13% 1.59% 47.19% 0.59% 52.59%0.008 448 2.06% 1.79% 73.16% 0.88% 77.62%0.009 279 1.28% 1.11% 82.25% 0.99% 85.95%0.01 115 0.53% 0.45% 91.77% 1.09% 94.21%0.02 0 0% 0% 100% 1.19% 100%
Fig. 7: Percentage of False Negatives by Number of TestsPrescribed
value of 0.0004, the number of tests prescribed would be1,404 in a population of 21,796 subjects and it ensures that,with a confidence level of 95%, the chance probability of anHTA (generic) subject not receiving ECG is no more than4.48% (0.05%). However, it is worth highlighting that 1,178of those ECGs are assigned to subjects that may not need them.Although this value is high compared to the real number oftests needed, it is significantly small compared with the realnumber of tests prescribed in the center (about 18,500 tests)for this period following current practices. The main featuresof the profiles selected for not receiving a test are presentedin Table VI. These profiles correspond to branches labeled bythe model as ”not at risk” with a large majority of not HTAsubjects. Following the prescription policy proposed for thisexample we expect that about 5 HTA subjects who need thetest would not receive it, as the false negative column shows.Remaining profiles were selected for prescription of an ECGat different levels of the decision tree, where about 98% ofHTA subjects are covered.
TABLE VI: Profiles of subjects without ECGProfile rules ECG
DBP <= 86.5 SBP <= 152 NODBP <= 86.5 SBP > 152 Unemployment Weight > 88 NO
DBP > 86.5 <= 93.5 SBP <= 147.5 AGE > 48 NO
E. Results summary
The proposed approach presents a decision tree describing23 subjects profiles, which has a recall of 96% for HTAsubjects. Results reveal a strong inversely proportional relationbetween the number of tests prescribed and the rate of falsenegatives generated. This also allows to easily decide howsmall the decision maker would want the chance probability tobe at the expense of an increase in the number of unnecessarytests.The performance evaluation of the probabilities showsthat for the solutions proposed a low probability (less than0.04%) of subjects at risk within the whole population notbeing assigned with an ECG test is ensured. Regarding teconfidence level for this test rationing policy generated withan alpha value of 0.0004, the numeric results show that witha 95% confidence, the probability of having HTA subjects notreceiving the ECG is 0.05%. Among all the HTA subjects,this probability is 4.48%. Another advantage related to theBayesian inference analysis proposed in this paper is thatit provides a solution strategy with the ability to deal withdifferent types and sizes of datasets without losing in validityof the solution.
The decision tree-based proposed methodology offers apractical and effective way of dealing with the chance-constrained test rationing problem. From the results of thestudy case we can highlight two important contributions. First,the prescription program generated with the implementation ofthe proposed approach offers a solution reducing the numberof test about 90%, while detecting almost the same number ofsubjects at risk. Second, the Bayesian inference also providesa solution strategy with the ability to deal with different typesand sizes of datasets where uncertainties coming from differentpopulation samples are taken into account. This ensures thevalidity of the models generated and the applicability of thesolutions proposed.
VI. CONCLUSION
This paper have addressed the problem of medical testallocation in health prevention programs subject to constraintof public health in term of probability of at risk populationidentified. We proposed a data-driven approach by combina-tion of decision tree for subject profiling, bayesian inferencefor unknown probability distribution estimation, and mixedinteger programming for medical test allocation.
The proposed approach is tested in a real case study todetermine the sub-classes of the population of a center formedical tests for which an ECG is necessary. The implemen-tation of the proposed approach reduces unnecessary tests byabout 90%, while the expected number of not detected atrisk subjects would be 5 out of 231 HTA cases. The use ofdecision trees to determine the profiles of the at risk and notat risk classes within the population eases the implementationin practice.
This research can be extended in several directions. First,health prevention programs are often designed to screen aportofolio of common diseases and the extension of the singledisease approach of this paper to a portofolio of diseases isan important research direction. Second this paper models the
Page 10 of 15T-ASE
123456789101112131415161718192021222324252627282930313233343536373839404142434445464748495051525354555657585960
IEEE TRANSACTIONS ON AUTOMATION SCIENCE AND ENGINEERING, VOL. XX, NO. XX, JULY 2019 11
public health objective by a chance probability and a betterapproach would be to precisely model the consequence of notscreening a disease. This requires to link health preventiondata used in this paper with healthcare data such as hospi-talization and drug consumption. Linking these data offersopportunities for better health prevention program design butraises significant challenges due to the huge amount of highlyheterogenuous data. The third research direction is to usethe results of health prevention tests to orient subjects todifferent educational health and/or therapy programs. Againthe combination with other relevant databases is highly neededfor an explanable system for relevant health/therapy recom-mendation.
ACKNOWLEDGMENT
The authors would like to thank all the staff of CETAF andthe directors of the Center for Medical Examinations fromSaint-Etienne for their contribution to this research and thedata provided which made possible this work.
REFERENCES
[1] N. Herazo-Padilla, B. Augusto, V. Bongue, and X. Xie, “Profilinghealth prevention population for hypertension screening and ECG testrationing,” in 2018 IEEE 14th International Conference on AutomationScience and Engineering (CASE), 2018, pp. 371–377. [Online].Available: http://dx.doi.org/10.1109/COASE.2018.8560601
[2] R. Bellazzi and B. Zupan, “Predictive data mining in clinical medicine: Current issues and guidelines,” International Journal of MedicalInformatics, vol. 77, no. 2, pp. 81–97, 2008. [Online]. Available:https://doi.org/10.1016/j.ijmedinf.2006.11.006
[3] N. Jothi, N. Aini, A. Rashid, and W. Husain, “Data Miningin Healthcare A Review,” Procedia - Procedia ComputerScience, vol. 72, pp. 306–313, 2015. [Online]. Available:http://dx.doi.org/10.1016/j.procs.2015.12.145
[4] N. Peek, C. Combi, R. Marin, and R. Bellazzi, “Thirty years ofartificial intelligence in medicine (AIME) conferences: A review ofresearch themes,” Artificial Intelligence In Medicine, 2015. [Online].Available: http://dx.doi.org/10.1016/j.artmed.2015.07.003
[5] A. Tsymbal, P. Cunningham, M. Pechenizkiy, and S. Puuronen, “Searchstrategies for ensemble feature selection in medical diagnostics,” in 16thIEEE Symposium Computer-Based Medical Systems, New York, NY,USA, 2003, pp. 124–129.
[6] J. Billings, J. Dixon, T. Mijanovich, and D. Wennberg, “Case finding forpatients at risk of readmission to hospital: Development of algorithm toidentify high risk patients,” British Medical Journal, vol. 333, no. 7563,pp. 327–330, 2006.
[7] J. Billings, I. Blunt, A. Steventon, T. Georghiou, G. Lewis, and M. Bard-sley, “Development of a predictive model to identify inpatients at riskof re-admission within 30 days of discharge (PARR-30),” BMJ Open,vol. 2, no. 4, pp. 1–10, 2012.
[8] D. Kansagara, D. Kagen, C. Theobald, and M. Freeman,“Risk Prediction Models for Hospital Readmission A SystematicReview,” JAMA, vol. 306, no. 15, 2015. [Online]. Available:https://jamanetwork.com/journals/jama/fullarticle/1104511?tab=cme
[9] C. C. Bennett, T. W. Doub, and R. Selove, “EHRs connectresearch and practice : Where predictive modeling , artificialintelligence , and clinical decision support intersect,” Health Policyand Technology, vol. 1, no. 2, pp. 105–114, 2012. [Online]. Available:http://dx.doi.org/10.1016/j.hlpt.2012.03.001
[10] M. Bardsley, A. Steventon, J. Smith, and J. Dixon, “Evaluating integratedand community based care.” The Nuffield Trust, no. June, 2013.
[11] M. Tayefi, H. Esmaeili, M. Saberi Karimian, A. Amirabadi Zadeh,M. Ebrahimi, M. Safarian, M. Nematy, S. M. R. Parizadeh, G. A.Ferns, and M. Ghayour-Mobarhan, “The application of a decision treeto establish the parameters associated with hypertension,” ComputerMethods and Programs in Biomedicine, vol. 139, pp. 83–91, 2017.[Online]. Available: http://dx.doi.org/10.1016/j.cmpb.2016.10.020
[12] P.-R. Burgel, J.-L. Paillasseur, W. Janssens, J. Piquet, G. ter Riet,J. Garcia-Aymerich, B. Cosio, P. Bakke, M. A. Puhan, A. Langhammer,I. Alfageme, P. Almagro, J. Ancochea, B. R. Celli, C. Casanova,J. P. De-Torres, M. Decramer, A. Echazarreta, C. Esteban, R. M.Gomez Punter, M. K. Han, A. Johannessen, B. Kaiser, B. Lamprecht,P. Lange, L. Leivseth, J. M. Marin, F. Martin, P. Martinez-Camblor, M. Miravitlles, T. Oga, A. Sofia Ramırez, D. D. Sin,P. Sobradillo, J. J. Soler-Cataluna, A. M. Turner, F. J. VerduRivera, J. B. Soriano, and N. Roche, “A simple algorithm for theidentification of clinical COPD phenotypes,” European RespiratoryJournal, vol. 50, no. 5, p. 1701034, 2017. [Online]. Available:http://erj.ersjournals.com/lookup/doi/10.1183/13993003.01034-2017
[13] T. Zheng, W. Xie, L. Xu, X. He, Y. Zhang, M. You, G. Yang, Y. Chen,and D. Ph, “A machine learning-based framework to identify type 2diabetes through electronic health records,” International Journal ofMedical Informatics, vol. 97, pp. 120–127, 2017. [Online]. Available:http://dx.doi.org/10.1016/j.ijmedinf.2016.09.014
[14] D. A. Davis, M. A. Thomson, A. D. Oxman, and R. B. Haynes,“Changing physician performance: a systematic review of the effect ofcontinuing medical education strategies,” JAMA, vol. 274, no. 9, pp.700–705, 1995.
[15] G. Lundberg, “Perseveration of Laboratory Test Ordering: A SyndromeAffecting Clinicians,” JAMA, vol. 249, no. 5, p. 639, 1983.[Online]. Available: https://jamanetwork.com/journals/jama/article-abstract/382946
[16] P. Glasziou and J. Hilden, “Test selection measures,” Medical DecisionMaking, vol. 9, no. 2, pp. 133–141, 1989. [Online]. Available:https://doi.org/10.1177/0272989X8900900208
[17] D. K. Litzelman, R. S. Dittus, M. E. Miller, and W. M. Tierney,“Requiring physicians to respond to computerized reminders improvestheir compliance with preventive care protocols,” Journal of GeneralInternal Medicine, vol. 8, no. 6, pp. 311–317, 1993.
[18] A. W. Lyon, D. C. Greenway, and J. T. Hindmarsh, “A Strategyto Promote Rational Clinical Chemistry Test Utilization,” AmericanJournal of Clinical Pathology, vol. 103, no. 6, pp. 718–724, 1995.[Online]. Available: https://doi.org/10.1093/ajcp/103.6.718
[19] Z. Y. Zhuang, C. L. Wilkin, and A. Ceglowski, “A framework for anintelligent decision support system: A case in pathology test ordering,”Decision Support Systems, vol. 55, no. 2, pp. 476–487, 2013. [Online].Available: http://dx.doi.org/10.1016/j.dss.2012.10.006
[20] M. Ceyhan, Z. Orhan, and E. Domnori, e-Medical Test RecommendationSystem Based on the Analysis of Patients’ Symptoms and Anamneses,A. C. . Badnjevic, Ed. Singapore: Springer, Singapore, 2017. [Online].Available: https://doi.org/10.1007/978-981-10-4166-2 98
[21] S. Chick, “Bayesian analysis for simulation input and output,”Proceedings of the 29th conference on Winter simulation, pp. 253–260,1997. [Online]. Available: http://dl.acm.org/citation.cfm?id=268488
[22] F. Zouaoui and J. R. Wilson, “Accounting for Input Model andParameter Uncertainty in Simulation,” in Proceedings of the 33NdConference on Winter Simulation, ser. WSC ’01. Washington, DC,USA: IEEE Computer Society, 2001, pp. 290–299. [Online]. Available:http://dl.acm.org/citation.cfm?id=564124.564165
[23] L. Breiman, J. H. Friedman, R. A. Olshen, and C. J. Stone,Classification and regression trees. New York, NY, USA: Routledge,2017. [Online]. Available: https://doi.org/10.1201/9781315139470
[24] R. E. Walpole, R. H. Myers, S. L. Myers, and K. Ye, Probability andstatistics for engineers and scientists, ninth edit ed., BOSTON, MA,2012.
[25] D. Pewsner, P. Juni, M. Egger, M. Battaglia, J. Sundstrom, and L. M.Bachmann, “Accuracy of electrocardiography in diagnosis of left ven-tricular hypertrophy in arterial hypertension: Systematic review,” BritishMedical Journal, vol. 335, no. 7622, pp. 711–714, 2007. [Online].Available: http://www.bmj.com/cgi/doi/10.1136/bmj.39276.636354.AE
[26] S. J. Curry, A. H. Krist, D. K. Owens, M. J. Barry, A. B. Caughey,K. W. Davidson, C. A. Doubeni, J. W. Epling, A. R. Kemper,M. Kubik, C. Seth Landefeld, C. M. Mangione, M. Silverstein,M. A. Simon, C. W. Tseng, and J. B. Wong, “Screening for atrialfibrillation with electrocardiography: US preventive services task forcerecommendation statement,” JAMA - Journal of the American MedicalAssociation, vol. 320, no. 5, pp. 478–484, 2018. [Online]. Available:https://jamanetwork.com/journals/jama/fullarticle/2695678
[27] ——, “Screening for cardiovascular disease risk with electrocardiogra-phy us preventive services task force recommendation statement,” JAMA- Journal of the American Medical Association, vol. 319, no. 22, pp.2308–2314, 2018.
[28] N. I. Parikh, M. J. Pencina, T. J. Wang, E. J. Benjamin, K. J.Lanier, D. Levy, S. D’Agostino Ralph B., W. B. Kannel, and
Page 11 of 15 T-ASE
123456789101112131415161718192021222324252627282930313233343536373839404142434445464748495051525354555657585960

IEEE TRANSACTIONS ON AUTOMATION SCIENCE AND ENGINEERING, VOL. XX, NO. XX, JULY 2019 12
R. S. Vasan, “A Risk Score for Predicting Near-Term Incidenceof Hypertension: The Framingham Heart Study,” Annals of InternalMedicine, vol. 148, no. 2, pp. 102–110, 2008. [Online]. Available:https://doi.org/10.7326/0003-4819-148-2-200801150-00005
Page 12 of 15T-ASE
123456789101112131415161718192021222324252627282930313233343536373839404142434445464748495051525354555657585960
Page 13 of 15 T-ASE
123456789101112131415161718192021222324252627282930313233343536373839404142434445464748495051525354555657585960
Page 14 of 15T-ASE
123456789101112131415161718192021222324252627282930313233343536373839404142434445464748495051525354555657585960
Page 15 of 15 T-ASE
123456789101112131415161718192021222324252627282930313233343536373839404142434445464748495051525354555657585960