Embed Size (px)
Citation preview
This is a self-archived – parallel published version of this article in the
publication archive of the University of Vaasa. It might differ from the original.
A connectivity model as a potential tool for
smart specialization strategies
Author(s): Virkkala, Seija; Mäenpää, Antti; Mariussen, Åge
Title: A connectivity model as a potential tool for smart specialization
strategies
Year: 2017
Version: Accepted manuscript
Copyright © 2017 Taylor & Francis. This is an Accepted Manuscript of an
article published by Taylor & Francis in European Planning
Studies on 30 Jan 2017, available online:
http://www.tandfonline.com/10.1080/09654313.2017.1283391.
Please cite the original version:
Virkkala, S., Mäenpää, A., & Mariussen, Å. (2017). A connectivity
model as a potential tool for smart specialization strategies,
European Planning Studies 25(4), 661–679.
https://doi.org/10.1080/09654313.2017.1283391
Article Title: A connectivity model as a potential tool for smart specialization strategies
Journal name: European Planning Studies Corresponding author: Seija Virkkala, email: [email protected] Address: University of Vaasa, P.O.Box 700, FI 65101, Vaasa, Finland Authors: Seija Virkkala*, Antti Mäenpää* & Åge Mariussen** *University of Vaasa, Department of Regional Studies **Nordland Research Institute, Bodø, Norway and University of Vaasa, Department of Re-gional Studies Acknowledgements We would like to acknowledge the Regional Council of Ostrobothnia, and especially Mr. Jerker Johnson, as well as the other members of the research team Smart specialisering strategi Österbotten for co-operation. Åge Mariussen acknowledges the support of Nord-land County Council VRI program through the RISCK project. We would also like to thank the two anonymous referees for valuable comments.
ABSTRACT The article contributes to the smart specialization literature by presenting a new approach, connec-tivity analysis, where Triple Helix relations (involving universities, companies and government) are at the centre of the entrepreneurial discovery process. Relations between helices may be seen, from the point of departure of proximity, as preconditions of connectivity, or interaction, measured through expectations and experiences. This offers potential solution to two limitations of proximity approach: its static nature and narrow focus on dyadic relationships. The connectivity analysis re-veals the extent of mutual expectations, as well as tensions, or gaps. Based on this analysis, the arti-cle presents a policy model that is used to map structures of networks and gaps between Triple He-lix actors. It may also identify strengths, weaknesses and problems. This analysis is used as input to structured dialogues between actors in leading positions in the Triple Helix and in smart specializa-tion policymaking and implementation. This approach may lead to policy interventions supporting entrepreneurial discoveries. The model has been developed in partnership with researchers and the Regional Council of Ostrobothnia. The article also presents this case study and demonstrates the use of the connectivity model in practice. Keywords: connectivity model; entrepreneurial discovery process; gap analysis; proximity; smart specialization; Triple Helix connectivity. 1. Introduction The major regional innovation agenda of the European Union (EU) cohesion policy in the period 2014–2020 is based on the concept of smart specialization. The concept was devel-oped in the Knowledge for Growth group as a response to the economic crisis and growth problems in the EU (Foray, 2015). It quickly diffused into mainstream EU regional policy, and was used as an ex ante condition for Structural Fund programmes. The rapid translation into practice of theoretical ideas, which are still in development, may provide challenges for implementation. However, it might also provide an opportunity to develop theory in practice rather than as a linear leap from theory to practice without “proof of concept”
(Nauwelaers et al., 2014: 3). Smart specialization can be characterised by the search for new growth opportunities
at the regional level via analysis of unique regional strengths and specializations. New
growth opportunities are exploited through regional strategies that prioritise certain cross-sector and cross-helix policy interventions. Public agents are expected to play a proactive role in these entrepreneurial discovery processes (EDP). The aim is to concentrate re-sources on activities that are likely to transform existing economic structures and reveal emerging opportunities (Foray, 2015).
An emerging body of literature addresses both the concept of smart specialization and experiences of implementing regional strategies based on the concept called the Research and Innovation Strategies for Smart Specialization (RIS3). Scholars have identified weak-nesses of the smart specialization concept and its translation into practice. Those include Cooke (2016), who states the concept does not refer to specialization as such, but to diver-sification. Other scholars emphasise the difficulties in designing and implementing RIS3, for example in England (Marlow & Richardson, 2016) and Portugal (Cooke, 2016). Capello and Kroll (2016) also highlight the problems and risks for less developed regions, including difficulties in precisely defining smart specialization, the capacity for identification of new related activities and difficulties in policy prioritisation. More developed regions might al-ready have many viable specializations, and they may try to avoid a too narrow specializa-tion on one or even a few specific domains. Local conditions vary and there is a general need for several types of analysis and policy agendas.
This paper provides a starting point for one challenge that many regions face: the level of connectivity between the stakeholders needed for RIS3 and particularly for entre-preneurial discovery. Even actors in large cities may have low levels of regional connectiv-ity. Peripheral areas might also need more connectivity, both inside and outside the region.
Accordingly, we argue for the relevance of connectivity measurements within, as well as beyond, the region for strategy preparation.
We aim to answer the following research question: What is the role of connectivity in smart specialization, and how could it be measured and improved in RIS3?
In order to answer this question, we present a connectivity model, which was devel-oped in partnership with the Regional Council as an attempt to implement smart specializa-tion strategy. The model can be used as an analytical tool for mapping networks, and identi-fying bottlenecks and missing links, as well as a policy model for improving the connectiv-ity between stakeholders in the region.
The article explains how the Triple Helix (TH) model can contribute to EDP. TH ac-tors (i.e. companies, universities and public organisations) are expected to be at the fore-front of the entrepreneurial discovery process and they should work along the same lines. The RIS3 guide book (Foray et al., 2012) emphasises both EDP and TH connectivity, with-out clear linkages between these two theoretical approaches. This paper provides a new ap-proach in which connectivity is at the centre of the process of EDP. In order to explicate the relevance of the TH in EDP, we extend the research on TH by using two approaches: the proximity approach and gap analysis. Various proximities are preconditions of connectiv-ity, and connectivity as an interaction between TH actors is conceptualised and measured with the help of gap analysis. There is a considerable amount of literature on both the TH model (Leydesdorff & Etzkowitz, 1998) and proximity dimensions (Boschma, 2005), but these two strands have not yet been combined in the RIS3 context. We also demonstrate in
practice how TH connectivity is relevant in EDP through a policy model that includes vi-sion, analysis, governance, priority selection, policy mix and evaluation.
We argue that the driver of change in relations is the tension caused by expectations, which may be confirmed and strengthened, or frustrated. A gap – a difference between ex-pectation and experience – is seen as the key to discussions of RIS3 for all kinds of regions, technology inventors and followers. More developed regions, transition regions and less de-veloped regions all need to find more common ground and initiate discussions to identify regional strengths and new business areas. By providing a tool for measuring and improv-ing the connections between helices we aim to broaden the scope of the discussion and pro-vide a proper scenario for possible entrepreneurial discovery. Gaps may also help to iden-tify emergent connections (weak relations that may be strengthened) and structural holes (lack of relations), which may reveal the issues hindering cooperation on various aspects of innovation. Gap analysis is based on the assumption that improving connectivity favours regional development. However, improvement might sometimes require extra-regional links to avoid a possible regional lock-in situation. Gap analysis provides a soft power ap-proach to multi-level governance in TH coordination through the identification of problems and by setting the parameters of the dialogues to resolve them.
In the next section, we describe the smart specialization concept, EDP and the RIS3. Subsequently, we present the conceptual framework and characteristics of the connectivity model based on TH connectivity, proximity approach and gap analysis. The fourth section examines what role the model can play in the implementation of RIS3 by referring to the steps in the RIS3 guidelines. The fifth section presents preliminary evidence on how the connectivity model has been applied in practise in the region of Ostrobothnia, Finland. The
final section examines the findings in the light of relevant literature, and draws conclusions on the potential of the connectivity model for RIS3. 2. Smart specialization as a renewal of regional innovation policy thinking Smart specialization is an academic concept that has evolved into a practice-oriented effort known as RIS3 (McCann & Ortega-Argilés, 2016) as third generation regional innovation strategy. The concept of EDP as a core of the smart specialization process has attracted considerable attention, but it has also created confusion among regional developers. Ac-cording to Foray (2015), EDP can occur spontaneously and in a decentralised way, and with great success. However, policy efforts are necessary in many regions, and the EU has used the concept of smart specialization as one of the foundations of its cohesion and inno-vation policy: the so-called RIS3. The aim of RIS3 is to ensure the continuous transfor-mation of productive structures through research and innovation, a transformation that con-cerns the entire regional economy. The process of structural transformation will be con-ducted via the discovery and exploration of new domains (Foray, 2015).
RIS3 differs from the earlier regional innovation policy agendas of the EU in that it targets all regions in Europe, and it takes into consideration innovation concepts broader than R&D-based innovation (i.e. practice-based innovation). The bottom-up approach and priority-setting practice differs from standard, top-down industrial policy.
Many of the routines, practices and tools needed for the implementation of RIS3 have already been discussed in economic geography and related research (Kroll, 2015). The dis-cussion includes concepts such as constructed advantage (Asheim, Boschma & Cooke, 2011), endogenous approaches, TH connected regions (Goddard, Kempton & Vallance, 2013), place-based development (Barca, McCann & Rodriguez-Pose, 2011), as well as the process of discovery and general purpose technologies (Foray, 2015). Smart specialization can therefore be seen as the synthesis of different frameworks and approaches. According to the place-based approach to development, the RIS3s should be tailored to the local con-text on the basis of the best data available, the most detailed knowledge and an explicit con-sideration of the realistic potential of the region (McCann & Ortéga-Argilés, 2013).
The concept of EDP is used in the RIS3 approach in a new way. Originally, the con-cept was used in business theory to describe the process where entrepreneurs are continu-ally searching for, identifying and evaluating new business opportunities (Shane 2003). Ac-cording to Foray and Rinoldi (2013), entrepreneurial discovery within RIS3 is the same on a regional level, but regional policy makers and developers should focus on specific activi-ties instead of sectors. Foray and Goenega (2013) call this level of intervention “granular-
ity”. For example, a region should prioritise developing eco-tourism activities over devel-oping specific companies or sectors. Regional actors should work together like entrepre-neurs, evaluate their resources and try to combine them in new ways in order to appeal to global markets. In this context, TH cooperation also plays an important role in mutually de-termining these regional assets.
According to RIS3, innovation policy needs to allow for experiments in order to dis-cover what works and what does not in a particular context. Failures must also be noted in
order to identify success. Smart specialization relies on the theories of experimental learn-ing based on Sabel (1992), and it develops the idea of self-discovery elaborated by Haus-man and Rodrik (2003). This is the process of policy learning. The idea of discovery and experimentation points to the role of indicators and evaluations (McCann & Ortega-Argilés, 2013).
The prioritisation of activities with potential to spark regional growth is essential for smart specialization. However, how it happens is open to debate, for example, it might be necessary to assess the degree of related variety between industries as a rationale for defin-ing specialization domains. Nauwelaers et al. (2014) distinguish between policy domains focusing on thematic prioritisation such as a specific technology crucial for regional devel-opment or clustering, and on functional prioritisation such as system failure or connectivity problems. This article sees the prioritisation process from the functional point of view, as it focuses on the gaps in the innovation system. It argues that improving connectivity in the regional network by bridging gaps or building new intra-regional or extra-regional links al-lows something new to emerge.
The concept of EDP emphasises the search for entrepreneurial knowledge in regional partnership (Foray, 2015). However, elaboration of the EDP concept is still in progress (Ca-pello & Kroll, 2016), and there is limited information as to how its aims might be achieved, which has left policy makers and other implementers to seek solutions on how to apply the concept. This paper aims to offer one possible solution through the method of gap analysis, which measures potential barriers in the EDP.
In addition, we also aim to contribute to the implementation of RIS3 by providing a new policy model, the so-called connectivity model. The model explicates the areas where interaction is needed in order to develop connectivity between stakeholders. It also helps to form the policy mix for the selected areas, for example it can align educational, research and innovation policies in line with the local EDP, and thus adds experimental learning and gradual improvements to RIS3.
In this way, the paper will deal with the research question regarding the role of con-nectivity in smart specialization and measuring and improving connectivity between stake-holders in the RIS3 context. We believe that responding to this question leads to inputs both to the emerging smart specialization literature and to relevant policy tools. The con-nectivity analysis can give some new input to the EDP issues and help implementers of RIS3.
3. Conceptual framework and characteristics of the connectivity model 3.1. Triple Helix connectivity The Triple Helix (TH) model (Leydesdorff & Etzkowitz, 1998, Etzkowitz & Leydesdorff, 2000) is used to describe both dynamic interaction between universities, companies and public institutions and institutional continuity, as these helices consist of historical institu-tions with selection environments or rules. The universities, as scientific systems, com-municate and function in accordance with the code of true/false, companies in accordance with the code of profit/loss and the public sector in accordance with the code of
right/wrong. According to the TH model, the best environments for innovation are created at the intersection of the helices, where different types of knowledge and institutional logics intermingle (Ranga & Etzkowitz, 2013).
The TH model emphasises interaction between institutional spheres and thus has dif-ferent starting points from regional innovation system (RIS) theory, which emphasises knowledge production and use as a basis of innovation (functional differentiation). The idea of institutional differentiation (as in the TH model) may seem a good point of departure for an empirical study. Whereas most firms mainly specialise in the exploitation of knowledge for economically useful purposes, universities are mainly involved in knowledge creation through academic – and sometimes applied – research, followed by dissemination through education. The TH concept provides ready-made empirical categories for studying connec-tivity between different types of actors. We gathered data on the basis of the described in-stitutional spheres: companies, universities and public government.
The concept of TH has been applied in smart specialization forming the basis for con-nectivity within regions. A connected region is a norm or vision where the three helices work in harmony, thereby mutually reinforcing each other (Goddard et al., 2013). They co-evolve and interact through an overlay of recursive networks and organisations which can be seen as a precondition for innovation. In a disconnected region, there are no boundary spanners, the partnerships are ineffective or non-existent and there is a lack of understand-ing about the changes. Entrepreneurs are locked out of regional planning (Goddard et al., 2013) and entrepreneurial discovery process cannot emerge. In other words, TH connectiv-ity for successful implementation of RIS3 should offer potential for entrepreneurs to partic-ipate in its planning processes. TH actors should be connected in the search for new growth
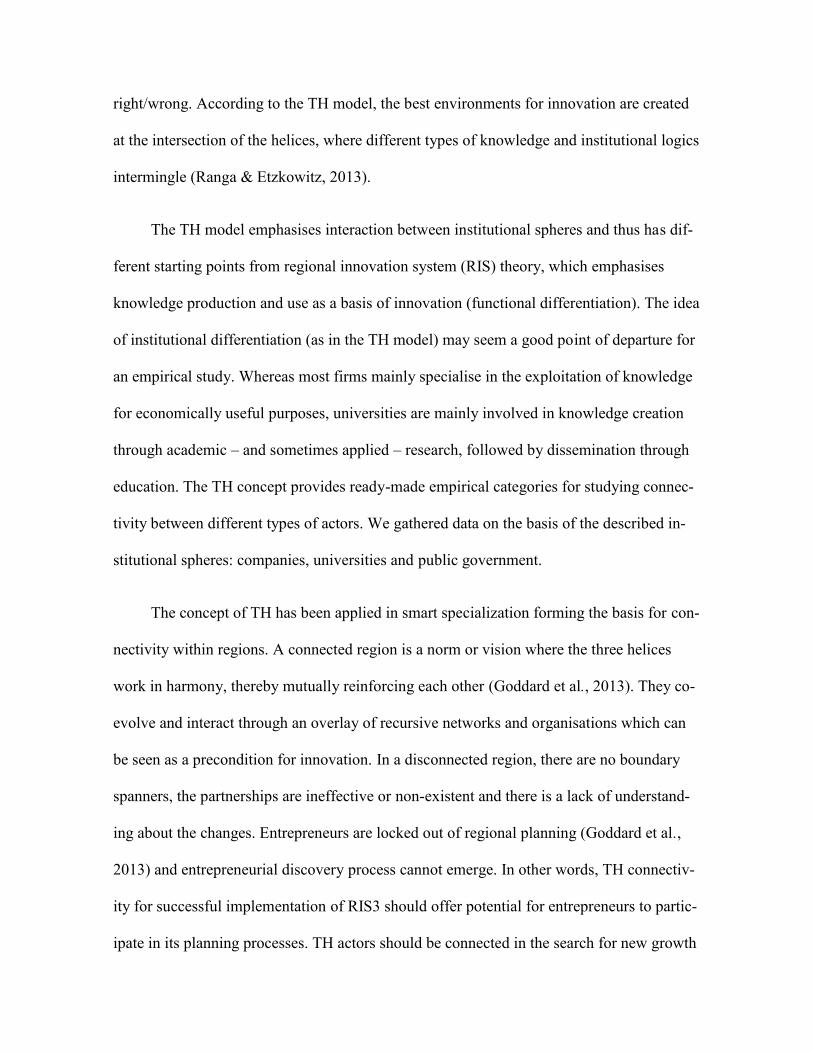
potential. Figure 1 describes TH connectivity in the EDP, and shows how better coopera-tion creates more opportunities for innovative interaction. What follows is an elaboration of the TH model, first with different forms of proximity indicating different preconditions for connectivity, and second with gap analysis characterising tensions in TH relations. Proxim-ities and gap analysis are the main elements of the connectivity analysis and policy model.
Figure 1. Triple Helix connectivity in the entrepreneurial discovery process (EDP). 3.2. Proximity as a precondition for connectivity Proximity is required to connect actors and to enable interactive learning and innovation. This paper is based on five dimensions of proximity suggested by Boschma (2005); those being geographical, social, institutional, organisational and cognitive proximity. Geograph-ical proximity promotes unique local competences, skills and new knowledge, which can diffuse spontaneously through personal contacts via the “local buzz” (Bathelt, Malmberg &
Maskell, 2004). Social proximity refers to personal relationships between actors, institu-tional proximity to joint formal and informal rules, organisational proximity to the member-ship of the same organisational entity and cognitive proximity to the distance between the knowledge base of actors.
However, proximity between agents in networks does not always increase their inno-vative performance and may even harm it. It is called proximity paradox (Boschma & Frenken, 2013). If two actors have a similar knowledge base, the cognitive distance be-tween them is short, and their collaboration might not increase innovation performance since new ideas and some recombination are central to innovation; instead, the collabora-tion might give rise to lock-ins. An intermediate level of differences in knowledge bases is needed for innovative cooperation. Moreover, the strength of social ties between two actors can vary. According to Granovetter (1973), strong ties between two actors will be redun-dant since other actors will also be tied to them. Weak ties are important since they can connect different social groups and serve as bridges. An optimal balance of socially proxi-mate and socially distant relations is needed. Generally, the potential of a relation depends on optimal levels of proximity, and on a balance between local and non-local links. An in-novative region should be locally embedded, but at the same time oriented towards a wider market in order to gain access to global knowledge.
The proximity approach can also be used at a regional level with a focus on partner-ships between actors. In this paper, geographical proximity is applied to the region that should be developed with RIS3; institutional proximity indicates the rules and norms differ-ing according to the helices, cognitive proximity refers to the similarity of knowledge bases of the selected activities or domains, organisational proximity is applied to a temporary
learning organisation that forms when stakeholders meet in focus groups, and social prox-imity refers first to the precondition for the creation of a shared vision of the regional strat-egy, and second to the precondition of achieving consensus within the focus group on how to bridge the selected gaps.
The proximity approach has some known limitations. Firstly, it is mostly applied to the analysis of dyadic relations to explain knowledge network (Balland, Boschma & Frenken, 2015). The authors try to solve the problem by using proximity approach in TH relations in the context of RIS3. Secondly, proximities are seen as static, and a more dy-namic approach between proximity and knowledge network is needed (ibid). We try to ap-proach this limitation by measuring the expectation and experience of relationship, indicat-ing the interaction between the partners. In doing so we take into account the dynamic co-evolution of connectivity and proximity dimensions. This is where the role of gaps comes in. Expectations and experiences from interaction (connectivity) may be seen as dynamic results of proximities. Interaction involving dynamic combinations of expectations and ex-periences may also contribute to various forms of social and cognitive proximity, which may cut across organizational, institutional and spatial boundaries. 3.3. The role of gaps in cooperation and gap analysis as measurement of connectivity We can analytically differentiate phases of relation-building based on the typology of tacit and codified knowledge. Tacit knowledge is deeply rooted in individuals’ action and expe-rience; people know more than they can explicitly say. Codified knowledge is formalised for example in books, manuals and programs (Nonaka & Takeuchi, 1995:59). In the first
phase, actors build a relationship with their partners based on the information they possess about the importance of the relationship. The actor has expectations of this relationship. Expectations may be codified in various forms of contracts, or be tacit, based on norms that are taken for granted. In the second phase, there is interaction in the relationship, during and after which the actor has an experience, which can be characterised as tacit knowledge. In the third phase, a researcher asks about the tacit knowledge concerning the relationship; here, the expectations and experiences will be codified, and their distance will represent the gap index describing the strength of the specific relationship. In this way, local knowledge of the region can be presented in abstract measurements. In the next phase, the gaps will be explained by the relevant stakeholders in a focus group meeting – sometimes causal and sometimes more theoretical explanations are needed. In this way, the tacit knowledge of ex-pectations and experiences is codified and shared. The aim of the meeting is to reach a con-sensus on the reasons for the relevant gap, as well as on the possible policy interventions through structured discussions with different actors.
The authors have simplified and transferred gap analysis from risk level measuring in industrial management (Ranta & Takala 2007) to the regional level in order to describe the strength of the relationship between and within helices (i.e. the connectivity). This analysis includes two key figures of expectation and experience. When both are at a high level, the relation can be seen as strong, indicating a good solution in terms of regional development policy. It can then be proposed as good practice, and other actors could learn something from the strong relationship. When both expectation and experience are low, the relation is weak. When expectation is high and experience low, there is a development challenge that should raise concerns for regional development planners.
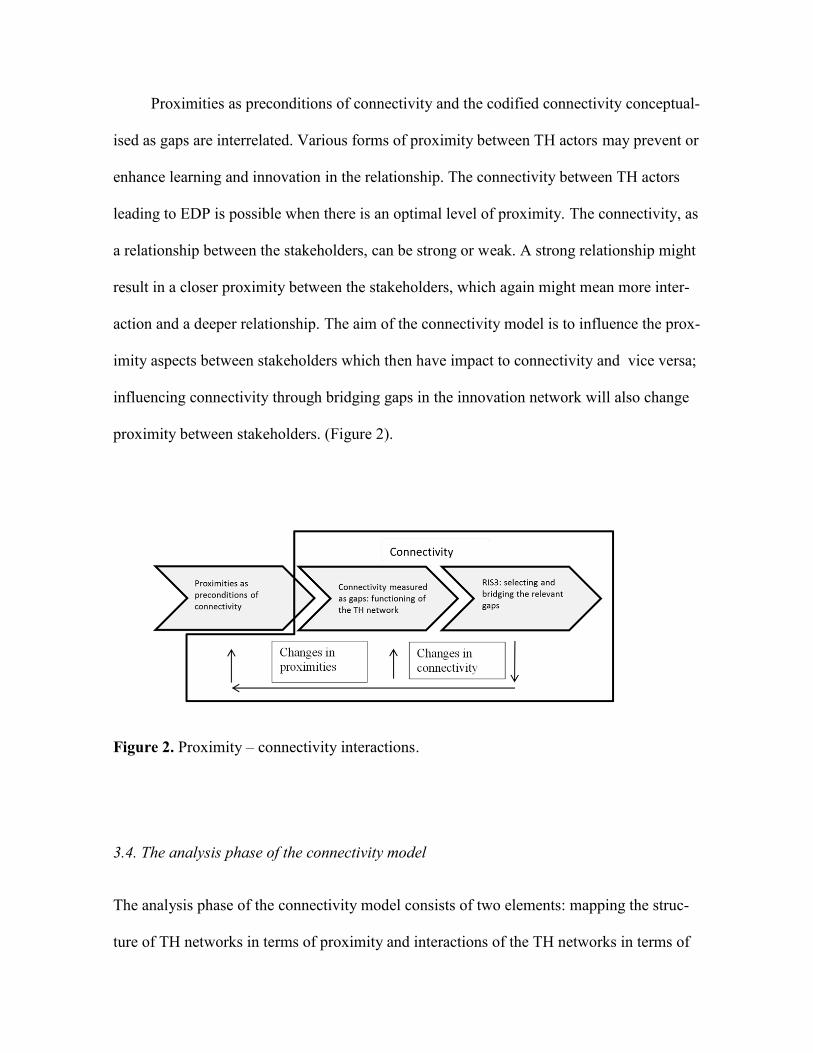
Proximities as preconditions of connectivity and the codified connectivity conceptual-ised as gaps are interrelated. Various forms of proximity between TH actors may prevent or enhance learning and innovation in the relationship. The connectivity between TH actors leading to EDP is possible when there is an optimal level of proximity. The connectivity, as a relationship between the stakeholders, can be strong or weak. A strong relationship might result in a closer proximity between the stakeholders, which again might mean more inter-action and a deeper relationship. The aim of the connectivity model is to influence the prox-imity aspects between stakeholders which then have impact to connectivity and vice versa; influencing connectivity through bridging gaps in the innovation network will also change proximity between stakeholders. (Figure 2).
Figure 2. Proximity – connectivity interactions.
3.4. The analysis phase of the connectivity model The analysis phase of the connectivity model consists of two elements: mapping the struc-ture of TH networks in terms of proximity and interactions of the TH networks in terms of
gaps. This effort requires an understanding of their geographical reach, that is, the im-portance of regional, national and international contacts. The first element of the model is the extent to which a specific region is a connected region in terms of geographical and in-stitutional proximity. This is studied:
by identifying the partners of the actors in each helix as well as their locations in the TH structure and at a different geographical scale;
by evaluating the importance of these partners by helices and by geographical scales; and
by mapping how well connected the three helices are both internally and exter-nally.
We gathered the empirical material on relationships between actors, but we draw con-clusions on the network structure of the region reflecting the relations between and within the helices and regions (case study region vs. other regions), which describe, in particular, the institutional and geographical proximity of the stakeholders.
The second element of the analysis phase is the study of the interaction of actors be-tween and within helices. Gap analysis enabled the authors to identify the relationships that should be developed in order to improve connectivity. There can also be holes in the net-works when the actors have no relationship at all, but the presence of a relationship could be favourable for regional innovation and development. This case is a challenge for those with a boundary spanner whose task is to link different actors and create connectivity in a fragmented system.
4. RIS3 and the connectivity model The connectivity model is a result of an action research process in which the researchers conducted a survey and gap analysis that were inputs in focus group meetings with the rele-vant stakeholders. Researchers also facilitated the dialogue process. The model consists of analysis and policy phases, which can be implemented according to the guidelines of the RIS3 guidebook (Foray et al., 2012). The connectivity will serve to extend knowledge of the innovative process and to make more targeted interventions in the direction of smart specialization. It will also serve to identify research agendas on relevant topics for innova-tion policies, key legislation needs and missing relevant innovation parameters to be com-municated in a dialogue.
The different phases of the connectivity model can be described by utilising the six steps analogy as suggested by the RIS3 guide (Foray et al., 2012: 27). These phases include the original steps from the RIS3 guide, as well as additions from the connectivity model. 1) A shared vision for the future: a connected region
According to the RIS3 guide, a successful strategy should feature a shared vision of the region’s future. An overall vision for the idea of a connected region can be one tenet of RIS3, and the steps of the connectivity model are derived from that vision. Since stakehold-ers often live in different worlds in terms of their rules and modes of operation, TH coordi-nation is rather difficult. To formulate a vision of a connected region requires sufficient so-cial proximity between the stakeholders.
2) Analysis of the potential for innovation: survey and gap analysis Gap analysis is one possible method to analyse the bottlenecks in the regional innova-
tion system. It is expected that it would identify core positions in the regional economy and builders in the Triple Helix, connecting science, politics and visionary entrepreneurs. 3) Governance: building a learning organisation
Improving connectivity is a learning process that needs coordination and a learning organisation. The key stakeholders are members of smart clusters and regional authorities who build a learning organisation. These key actors should be included in the learning or-ganisation through focus group meetings. In learning organisations, temporary organisa-tional proximity is created when partners are connected, and the shared vision is imple-mented and extended. 4) Identification of priorities: gap indices and focus group meetings
Stakeholders should be engaged with questions about partners that will identify gaps in the innovation structure. The findings must then be verified in a structured dialogue. The bottlenecks in the innovation system are the largest gaps between expectations and experi-ences found in the gap analysis, and it is important to discuss the policy interventions avail-able to bridge these gaps. In the focus group meetings, two sets of operational knowledge – the abstract and explicit (gap index) – and the tacit knowledge of the stakeholders are con-sidered positive and sympathetic towards each other. In this way, social and cognitive prox-imity is enhanced between the stakeholders. 5) Definition of policy mix: implementation
In the focus group meeting, the potential policy interventions available to fill the gaps will be discussed. Policy interventions can be either part of a larger programme, just one project or investment, or a change in regulation. The priorities would however most likely involve the promotion of cooperation through mutual projects. After focus group discus-sions, public actors – and possibly the other stakeholders – should make decisions and pre-pare a policy intervention. 6) Starting a new circle: monitoring and evaluation with the help of gap indices
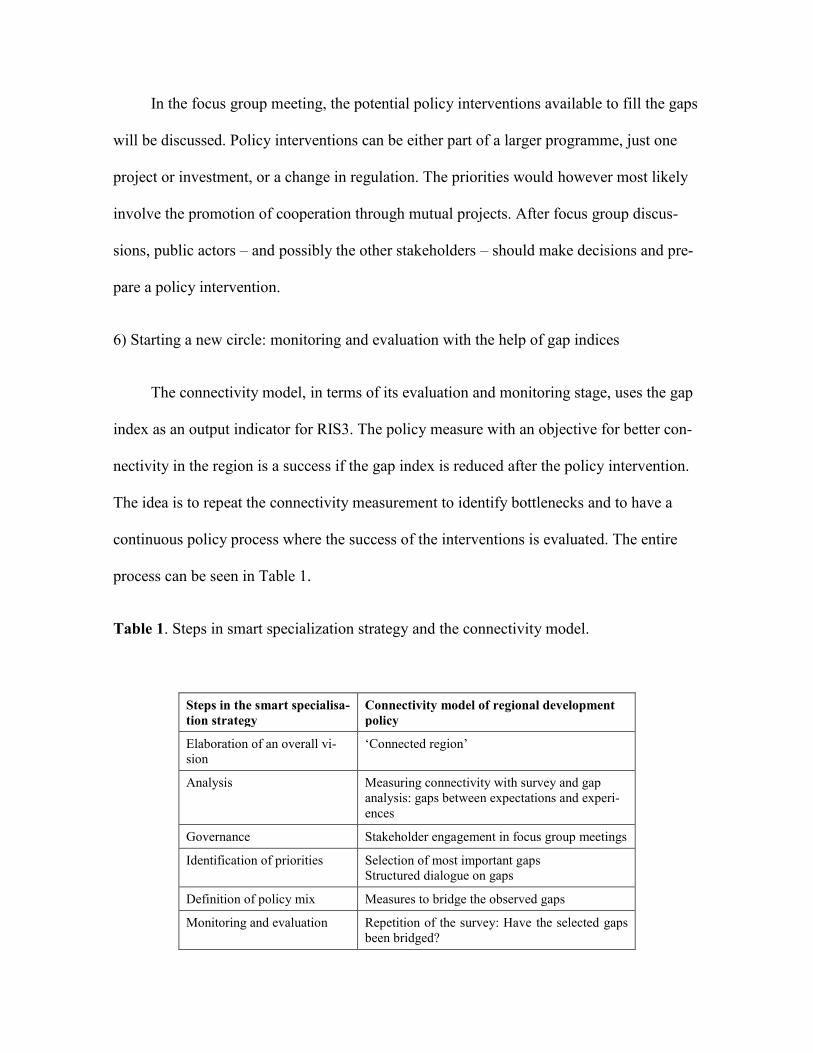
The connectivity model, in terms of its evaluation and monitoring stage, uses the gap index as an output indicator for RIS3. The policy measure with an objective for better con-nectivity in the region is a success if the gap index is reduced after the policy intervention. The idea is to repeat the connectivity measurement to identify bottlenecks and to have a continuous policy process where the success of the interventions is evaluated. The entire process can be seen in Table 1. Table 1. Steps in smart specialization strategy and the connectivity model.
Steps in the smart specialisa-tion strategy Connectivity model of regional development policy Elaboration of an overall vi-sion ‘Connected region’ Analysis Measuring connectivity with survey and gap analysis: gaps between expectations and experi-ences Governance Stakeholder engagement in focus group meetings Identification of priorities Selection of most important gaps Structured dialogue on gaps Definition of policy mix Measures to bridge the observed gaps Monitoring and evaluation Repetition of the survey: Have the selected gaps been bridged?
Besides focus group meetings arranged around gap indices, other methods of struc-
tured dialogue have also been used in regional development policy, for example construct-ing regional advantage through related variety and platform policies (Asheim et al., 2011). Structured dialogue in the focus group meetings of relevant stakeholders can be seen as a regional development platform, but instead of megatrends and cross-sectoral needs (Har-maakorpi, 2006), the participants relate to the gaps and holes in the TH network. 5. The Connectivity Model in practice: case study from Ostrobothnia 5.1. Case study region: connected region? Ostrobothnia is a region in western Finland with 180,000 inhabitants. It has a vibrant indus-trial sector, exemplified by the energy technology cluster in and around the regional capital Vaasa, and also a boat building cluster, and fur farming businesses in the countryside. Over 60% of the value of industrial production was exported in 2012, and Ostrobothnia has been characterised as a globalised innovation system. Among the Ostrobothnian workforce 6% earned their living from agriculture, 32% from industry and 61% from the service sector in 2010 (AMCER report, 2012).
The Finnish innovation system is centralised and many important policy domains such as science, technology, innovation and university policies are coordinated at national
level, with weak regional approaches. Regional Councils are responsible for regional devel-opment, including RIS3. In Ostrobothnia, a “connected region” was selected as a vision for
RIS3, and a policy model was developed according to the vision. The model was presented and commented on at a seminar on the subject of the smart specialization platform held in Vaasa, 14 May 2013. A detailed questionnaire was prepared and 53 interviews were con-ducted in the autumn of 2013.
5.2. Case study survey The actual selection of respondents was made using stratified sampling. Leaders of organi-sations from the three helices were interviewed. The respondents were found mainly via in-ternet searching, but some were already well known within the research group. We focused mostly on regional fields of export known as smart industrial fields, such as the energy in-dustry, boat building and fur farming.
Information was gathered concerning the amount of cooperation between the re-spondent’s organisation and all the different helices on the three spatial levels. Each rela-tion had unique features and required its own questionnaire, albeit the majority of the ques-tions across the questionnaires could be linked. The method provided data on certain unique aspects of cooperation from both sides of the relationship. The network structure was out-lined with the question about the number of partners within the nine relations between uni-versities, public organisation and companies on local, national and international level (Mäenpää 2014, p. 52).
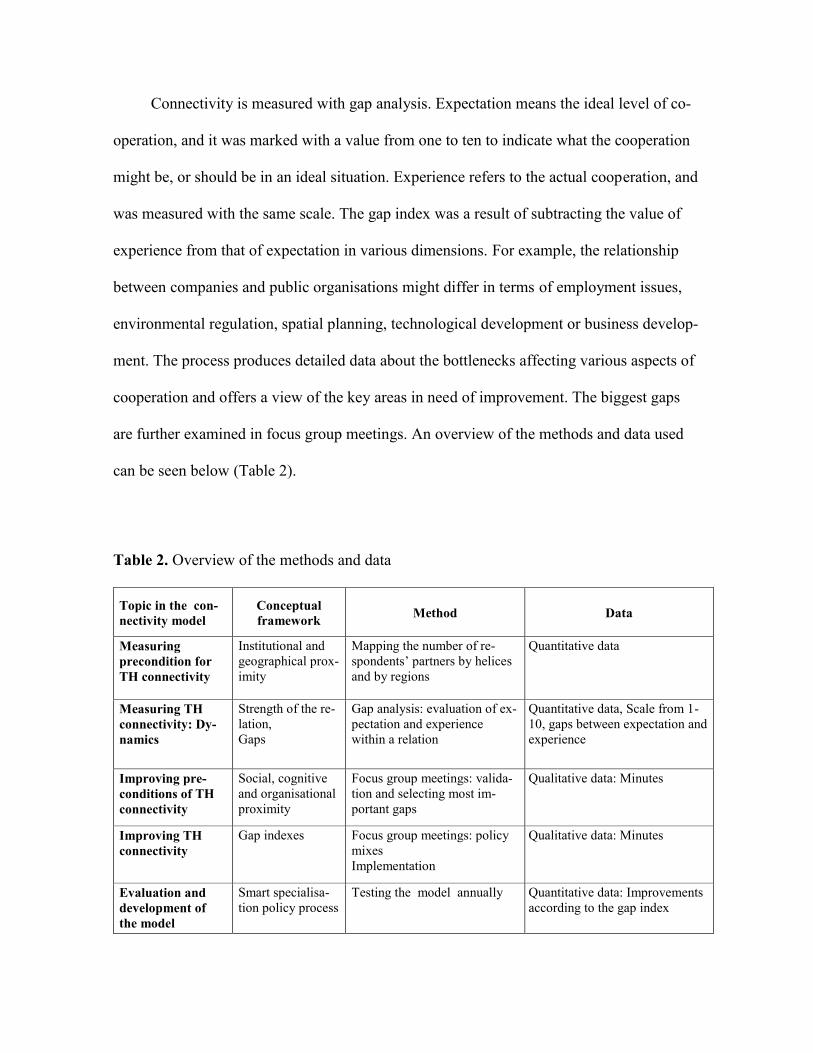
Connectivity is measured with gap analysis. Expectation means the ideal level of co-operation, and it was marked with a value from one to ten to indicate what the cooperation might be, or should be in an ideal situation. Experience refers to the actual cooperation, and was measured with the same scale. The gap index was a result of subtracting the value of experience from that of expectation in various dimensions. For example, the relationship between companies and public organisations might differ in terms of employment issues, environmental regulation, spatial planning, technological development or business develop-ment. The process produces detailed data about the bottlenecks affecting various aspects of cooperation and offers a view of the key areas in need of improvement. The biggest gaps are further examined in focus group meetings. An overview of the methods and data used can be seen below (Table 2).
Table 2. Overview of the methods and data Topic in the con-nectivity model Conceptual framework Method Data Measuring precondition for TH connectivity
Institutional and geographical prox-imity Mapping the number of re-spondents’ partners by helices and by regions
Quantitative data
Measuring TH connectivity: Dy-namics Strength of the re-lation, Gaps
Gap analysis: evaluation of ex-pectation and experience within a relation Quantitative data, Scale from 1-10, gaps between expectation and experience
Improving pre-conditions of TH connectivity Social, cognitive and organisational proximity
Focus group meetings: valida-tion and selecting most im-portant gaps Qualitative data: Minutes
Improving TH connectivity Gap indexes Focus group meetings: policy mixes Implementation Qualitative data: Minutes
Evaluation and development of the model Smart specialisa-tion policy process Testing the model annually Quantitative data: Improvements according to the gap index
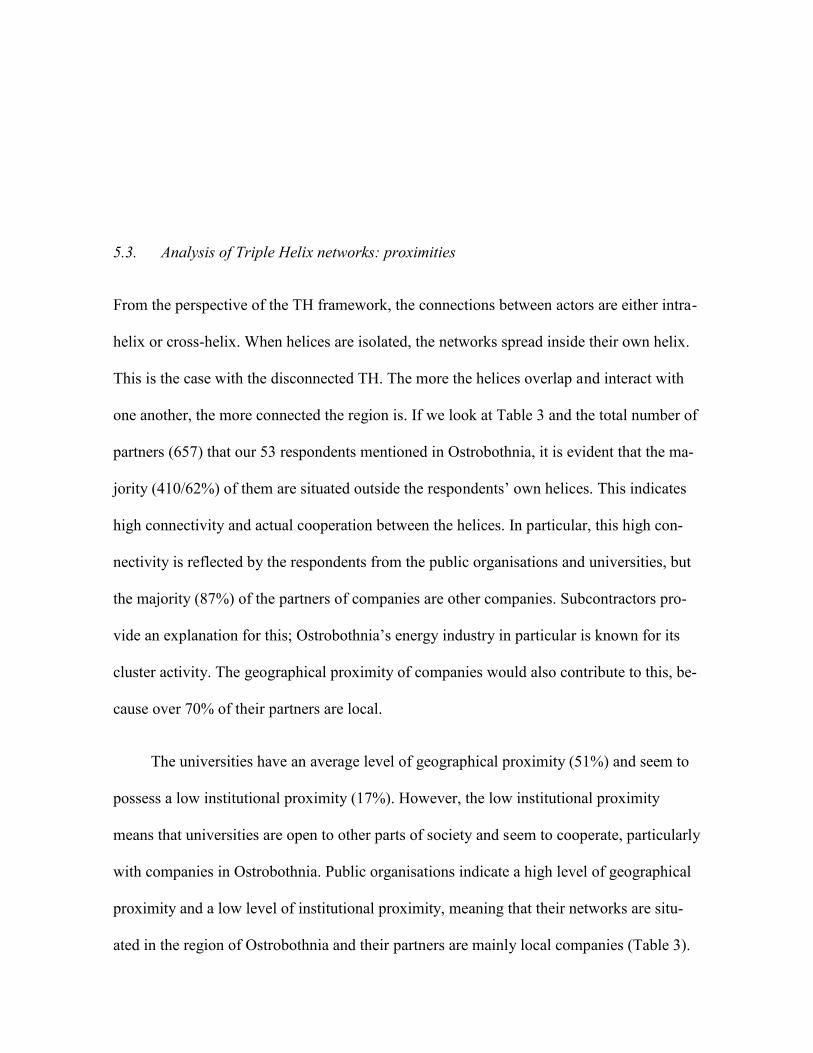
5.3. Analysis of Triple Helix networks: proximities From the perspective of the TH framework, the connections between actors are either intra-helix or cross-helix. When helices are isolated, the networks spread inside their own helix. This is the case with the disconnected TH. The more the helices overlap and interact with one another, the more connected the region is. If we look at Table 3 and the total number of partners (657) that our 53 respondents mentioned in Ostrobothnia, it is evident that the ma-jority (410/62%) of them are situated outside the respondents’ own helices. This indicates
high connectivity and actual cooperation between the helices. In particular, this high con-nectivity is reflected by the respondents from the public organisations and universities, but the majority (87%) of the partners of companies are other companies. Subcontractors pro-vide an explanation for this; Ostrobothnia’s energy industry in particular is known for its
cluster activity. The geographical proximity of companies would also contribute to this, be-cause over 70% of their partners are local.
The universities have an average level of geographical proximity (51%) and seem to possess a low institutional proximity (17%). However, the low institutional proximity means that universities are open to other parts of society and seem to cooperate, particularly with companies in Ostrobothnia. Public organisations indicate a high level of geographical proximity and a low level of institutional proximity, meaning that their networks are situ-ated in the region of Ostrobothnia and their partners are mainly local companies (Table 3).
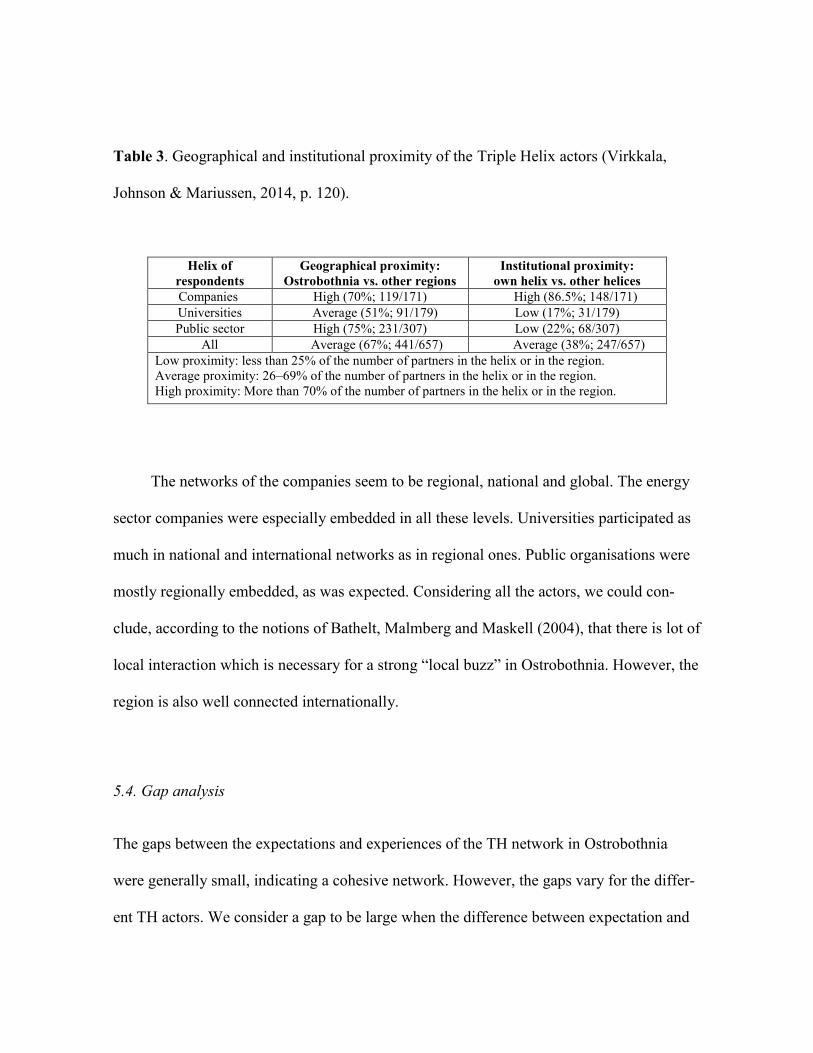
Table 3. Geographical and institutional proximity of the Triple Helix actors (Virkkala, Johnson & Mariussen, 2014, p. 120).
Helix of respondents Geographical proximity: Ostrobothnia vs. other regions Institutional proximity: own helix vs. other helices Companies High (70%; 119/171) High (86.5%; 148/171) Universities Average (51%; 91/179) Low (17%; 31/179) Public sector High (75%; 231/307) Low (22%; 68/307) All Average (67%; 441/657) Average (38%; 247/657) Low proximity: less than 25% of the number of partners in the helix or in the region. Average proximity: 26–69% of the number of partners in the helix or in the region. High proximity: More than 70% of the number of partners in the helix or in the region.
The networks of the companies seem to be regional, national and global. The energy sector companies were especially embedded in all these levels. Universities participated as much in national and international networks as in regional ones. Public organisations were mostly regionally embedded, as was expected. Considering all the actors, we could con-clude, according to the notions of Bathelt, Malmberg and Maskell (2004), that there is lot of local interaction which is necessary for a strong “local buzz” in Ostrobothnia. However, the
region is also well connected internationally. 5.4. Gap analysis The gaps between the expectations and experiences of the TH network in Ostrobothnia were generally small, indicating a cohesive network. However, the gaps vary for the differ-ent TH actors. We consider a gap to be large when the difference between expectation and
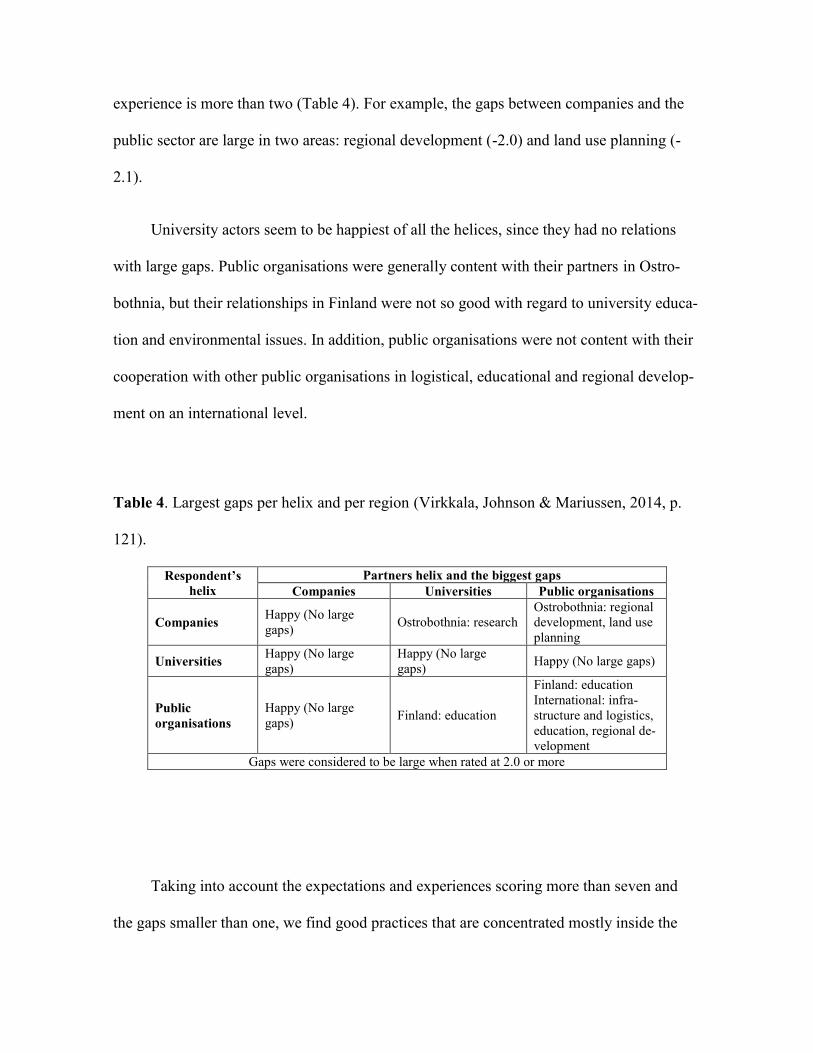
experience is more than two (Table 4). For example, the gaps between companies and the public sector are large in two areas: regional development (-2.0) and land use planning (-2.1).
University actors seem to be happiest of all the helices, since they had no relations with large gaps. Public organisations were generally content with their partners in Ostro-bothnia, but their relationships in Finland were not so good with regard to university educa-tion and environmental issues. In addition, public organisations were not content with their cooperation with other public organisations in logistical, educational and regional develop-ment on an international level.
Table 4. Largest gaps per helix and per region (Virkkala, Johnson & Mariussen, 2014, p. 121).
Respondent’s helix Partners helix and the biggest gaps Companies Universities Public organisations Companies Happy (No large gaps) Ostrobothnia: research Ostrobothnia: regional development, land use planning Universities Happy (No large gaps) Happy (No large gaps) Happy (No large gaps)
Public organisations Happy (No large gaps) Finland: education Finland: education International: infra-structure and logistics, education, regional de-velopment Gaps were considered to be large when rated at 2.0 or more
Taking into account the expectations and experiences scoring more than seven and the gaps smaller than one, we find good practices that are concentrated mostly inside the

company helix. These results indicate a well-functioning company network in Ostroboth-nia, with links to both national and international actors.
One major finding was that the innovation system in Ostrobothnia is business-ori-ented and relatively well connected. The relations are asymmetrical: local companies have the majority of their connections with other companies, and both the public and university sectors also rely heavily on companies as their partners. This might indicate cognitive prox-imity in the region, as clearly the knowledge embedded in companies is sought after in all of the helices. The networks in Ostrobothnia are locally embedded and cohesive, so the gaps are relatively small. This does not mean that the innovation system is working opti-mally. On the contrary, emerging gaps in the system have to be identified and bridged to ensure favourable development.
5.5. Focus group meetings and policy interventions Three focus group meetings were held with stakeholders from the energy industry, boat building and fur farming in 2014. The analysis results were presented and possible reasons for the biggest gaps were discussed. These meetings were also a good forum for increasing social proximity between the participants.
The energy industry representatives told the research team that they did not feel the local universities supported the sector enough, because there were too few students and pro-jects. They disliked the fragmented nature of Finnish government. There were also large
differences in the expectations and experiences of companies and their regional subcontrac-tors (i.e. other companies) and high expectations for the quality of production were men-tioned as an explanation.
The policy interventions were planned by the Regional Council of Ostrobothnia, which decided to use a Logic Framework Analysis. The gaps were analysed by origin and consequences, enabling the creation of intervention logic both for short- and long-term in-terventions. This intervention presented activities and investments that aimed to bridge the gaps. The results of this analysis were then tied to the call for proposals by the Regional Council of Ostrobothnia. The Regional Council has followed the connectivity approach as part of its regional development plan 2014–2020, and the development resources are di-rected yearly to the biggest gaps identified through the analysis and discussed at the focus group meetings. Since the available development resources are limited, only one or two gaps can be addressed annually. In 2014, there was a call for projects aiming to bridge the gaps between suppliers and the region’s largest companies, and three projects were se-
lected. Figure 3 summarises the phases of the connectivity model of smart specialization, which should be a continuous process in order to evaluate whether the policy interventions bridge the gaps.
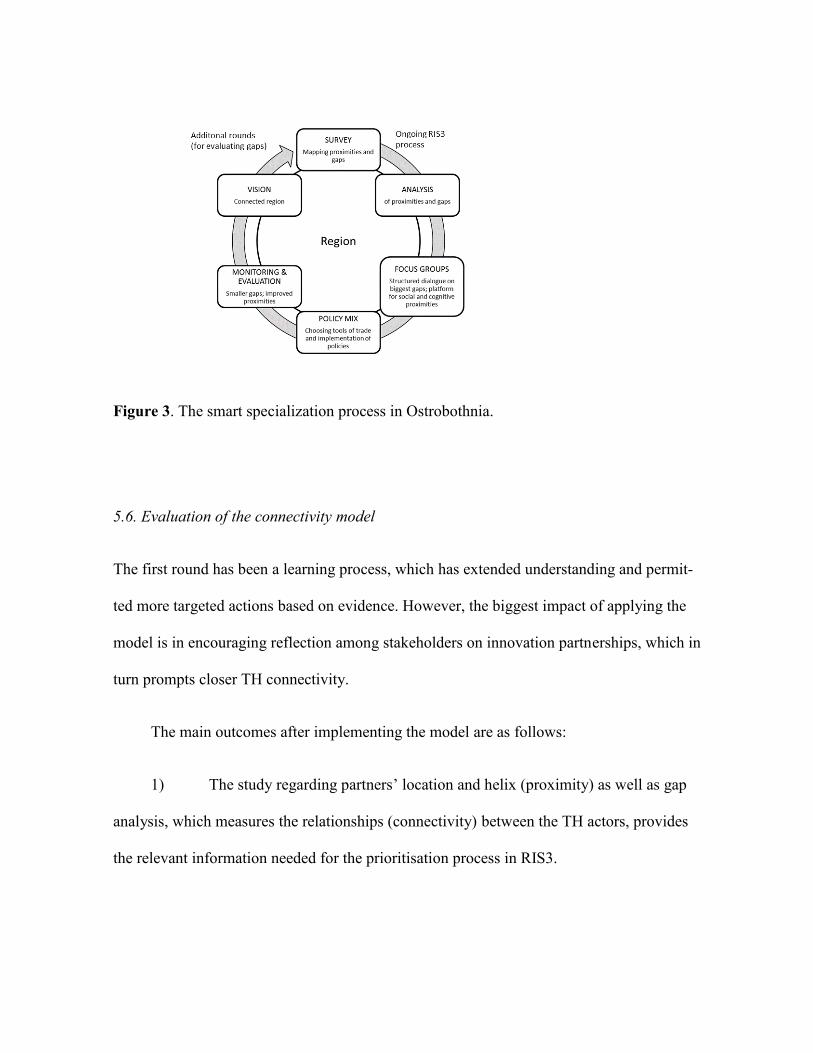
Figure 3. The smart specialization process in Ostrobothnia. 5.6. Evaluation of the connectivity model The first round has been a learning process, which has extended understanding and permit-ted more targeted actions based on evidence. However, the biggest impact of applying the model is in encouraging reflection among stakeholders on innovation partnerships, which in turn prompts closer TH connectivity.
The main outcomes after implementing the model are as follows: 1) The study regarding partners’ location and helix (proximity) as well as gap
analysis, which measures the relationships (connectivity) between the TH actors, provides the relevant information needed for the prioritisation process in RIS3.
2) Structured dialogue between stakeholders in the focus group meetings helps us to understand the gaps and bottlenecks in the innovation system, and to discover and se-lect the relevant ones (i.e. the prioritisation process is based on dialogue). In the case study region, only one or two gaps have been selected annually.
3) The discussions are also useful in designing the policy mixes that are used for bridging the gaps in the agenda. In the Finnish case, the Regional Councils have limited authority compared to the national government, which restricts the opportunities for re-gional level development policies. The Structural Fund resources are very limited, but the discussion could be broadened towards bridging the most important gaps with all possible resources, such as government funding programmes and so forth.
4) EDP is a continuous process and the connectivity analysis, as well as focus group meetings, should be repeated in order to monitor the policy interventions applied to bridge the gaps identified. The gap index forms an evaluation indicator for the success of a specific policy intervention (see Figure 3).
These outcomes can be seen as useful phases in increasing TH connectivity, which can expand the intersection between helices and form a point of departure for additional EDPs. A connectivity model with structured dialogue between companies, universities and public administration is a method of entrepreneurial discovery because it helps to improve regional innovation cooperation by presenting the bottlenecks affecting it and by focusing support on the biggest issues.
A similar methodological approach has also been applied in the Nordland County, Norway (Mariussen, Gjertsen, Løvland & Lindeløv, 2013). The application of the model
enabled comparison and learning between the regions because Nordland also used gap anal-ysis and focus group seminars. For instance, the first round showed that Ostrobothnian en-terprises were more content with the local educational system than the corresponding com-panies in Nordland. This finding then raises the question of what is done differently in Os-trobothnia and whether this experience can be transferred. Through learning seminars, this knowledge can be codified, transferred and internalised between regions (Mariussen & Virkkala, 2013).
The connectivity model, however, still has obvious limitations: first, the regional in-stitutions might not have enough capability to build a common vision, or organise a survey or focus group meetings. Second, even if the core actors managed to organise the survey and focus groups meetings, the relevant stakeholders (especially companies) might not par-ticipate in the meetings. Third, the relevant stakeholders might have vested interests. They might evaluate the connectivity from their own somewhat egocentric views and not from the point of view of the whole region. Fourth, the model does not give clear methods for evaluating the importance of the gaps, or the possibility or cost of filling the selected gaps. In the case study region, the Regional Council planned the measures to fill the gaps based on the discussions in the focus group meetings. 6. Conclusion The paper is based on the hypothesis that improving connectivity between regional stake-holders can contribute to the renewal of the regional economy. We have dealt with the re-search question concerning the role of connectivity in smart specialization, how to measure
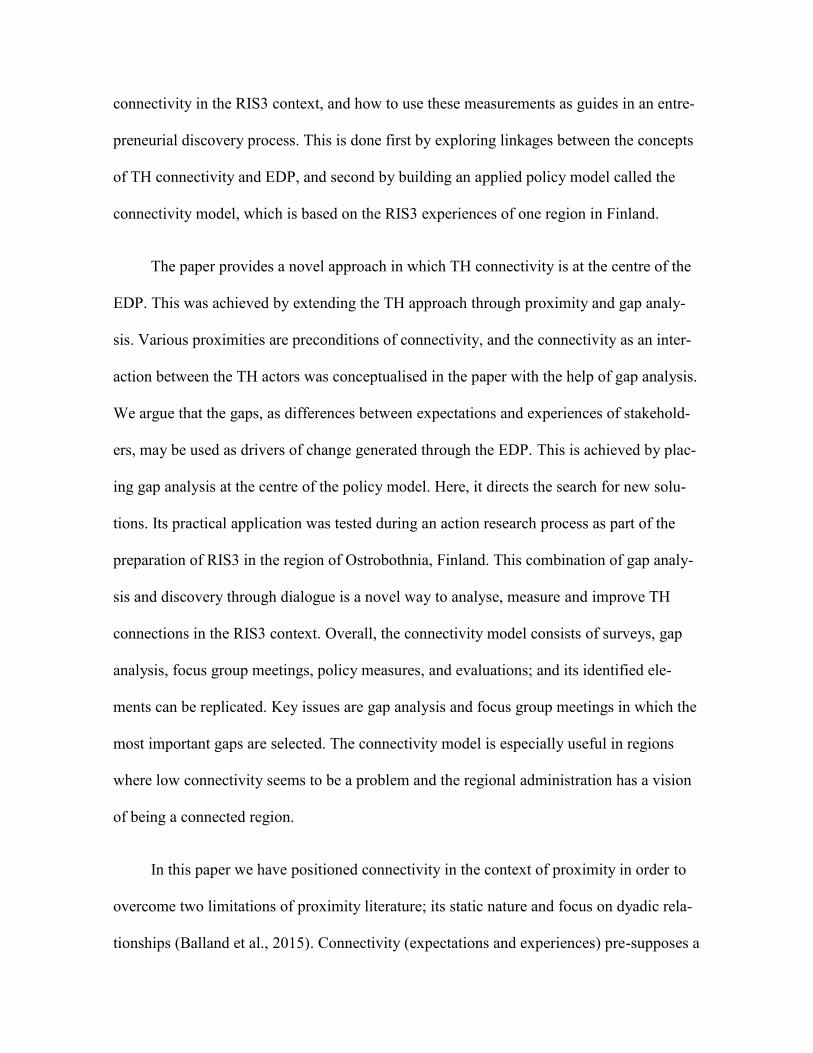
connectivity in the RIS3 context, and how to use these measurements as guides in an entre-preneurial discovery process. This is done first by exploring linkages between the concepts of TH connectivity and EDP, and second by building an applied policy model called the connectivity model, which is based on the RIS3 experiences of one region in Finland.
The paper provides a novel approach in which TH connectivity is at the centre of the EDP. This was achieved by extending the TH approach through proximity and gap analy-sis. Various proximities are preconditions of connectivity, and the connectivity as an inter-action between the TH actors was conceptualised in the paper with the help of gap analysis. We argue that the gaps, as differences between expectations and experiences of stakehold-ers, may be used as drivers of change generated through the EDP. This is achieved by plac-ing gap analysis at the centre of the policy model. Here, it directs the search for new solu-tions. Its practical application was tested during an action research process as part of the preparation of RIS3 in the region of Ostrobothnia, Finland. This combination of gap analy-sis and discovery through dialogue is a novel way to analyse, measure and improve TH connections in the RIS3 context. Overall, the connectivity model consists of surveys, gap analysis, focus group meetings, policy measures, and evaluations; and its identified ele-ments can be replicated. Key issues are gap analysis and focus group meetings in which the most important gaps are selected. The connectivity model is especially useful in regions where low connectivity seems to be a problem and the regional administration has a vision of being a connected region.
In this paper we have positioned connectivity in the context of proximity in order to overcome two limitations of proximity literature; its static nature and focus on dyadic rela-tionships (Balland et al., 2015). Connectivity (expectations and experiences) pre-supposes a
certain level of social and cognitive proximity. By measuring expectations, experiences and gaps the connectivity approach throws light on social and cognitive proximities. Through the following dialogue in focus groups, these indicators are discussed, evaluated and acted upon. The aim of the connectivity model is to influence proximity between stakeholders through bridging gaps in the innovation networks (Figure 2)1. During the EDP process both cognitive and social proximity may be increased. In the focus group meetings, the reasons for distance between partners are discussed, mental models are shared, and strategies for knowledge bases are agreed upon. We agree on Balland et al. (2014) who see cognitive proximity as the most dynamic dimension since knowledge bases change continuously. The focus group meetings are attempts to create temporary organizational proximity. Institu-tional proximity was defined on macro scale as norms and operating codes of the helices, and it´s very difficult to change. However, the institutional logics could be intermingled at the intersection of the helices (Etzkowitz & Leydesdorff, 2000; Ranga & Etzkowitz, 2013), and a new norm of cooperation between actors from different helices may emerge in the long run.
The paper tried to solve the limitations of dyadic relationships by using proximity ap-proach in TH relations in the context of RIS3. In regional partnership there are many vary-ing actors and also relationships. Some of them might be closer than others on different di-
1 The optimal proximity could be found by comparing regions and their connectivity measurements (gap in-dex) with other regional performance. Then the optimal level of connectivity can also vary between regions depending on the value of these indicators and other factors.
mensions of proximity. In the case study, we used the average institutional and geograph-ical proximity based on dyadic relations. There are still limitations in our analysis and more research should be done to apply proximity approach in regional partnerships.
The connectivity model is a soft and gradual approach of TH coordination in multi-level governance. It makes it possible to direct specialization and priority seeking in a nar-row and specific way, which helps the policy process. It can be used as one approach in the RIS3 process, possibly combined with other approaches. The connectivity model has some bottlenecks that can be addressed, especially by creating more specific methods to evaluate the importance of the gaps and their selection.
The connectivity model was planned for regions with problems of connectivity be-tween the stakeholders and thus for the RIS3 focused on functional prioritisation. Accord-ing to the model, new areas and activities can be discovered where perceived gaps might be bridged. These new activities might be smaller entities than the new business areas (do-mains) that Foray (2015) emphasises as a result of entrepreneurial discovery. In principle, focus group meetings could potentially lead to (cross-) technological discoveries, even un-intentionally, when the actors “collide”. However, more research is needed on how to com-
bine functional and thematic aspects of the model, such as specific technology or activity that enables the renewal of the regional economy.
References AMCER report (2012). Advanced monitoring and coordination of EU R&D policies at re-
gional level [Report]. Retrieved from http://www.espon.eu/export /sites/de-fault/Documents/Projects/TargetedAnalyses/AMCER/DFR/AMCER_Draft_Fi-nal_Report_v1.pdf.
Asheim, B.T., Boschma, R. & Cooke, P. (2011). Constructing regional advantage: Platform policies based on related variety and differentiated knowledge bases. Regional Stud-ies, 45(7), 893–904. doi:10.1080/00343404.2010.543126
Balland, P.A., Boschma, R. & Frenken, K. (2015). Proximity and innovation: From statics to dynamics. Regional Studies 49(6), 907–920. doi:10.1080/00343404.2014.883598 Barca, F., McCann, P. & Rodriguez-Pose, A. (2011). The case for regional development in-tervention: Place-based versus place-neutral approaches. Journal of Regional Sci-ence, 52(1), 134–152. doi:10.1111/j.1467-9787.2011.00756.x
Bathelt, H., Malmberg, A. & Maskell, P. (2004). Clusters and knowledge: Local buzz, global pipelines and the process of knowledge creation. Progress in Human Geog-raphy, 28, 31–56. doi: 10.1191/0309132504ph469oa
Boschma, R. (2005). Proximity and innovation: a critical assessment. Regional Studies, 39(1), 61–74. doi: 10.1080/0034340052000320887
Boschma, R. & Frenken, K. (2013). Technological relatedness and regional branching. In H. Bathelt, M.P. Feldman & D.F. Kogler (Eds.), Beyond territory: Dynamic geogra-phies of knowledge creation, diffusion, and innovation (pp. 64–81). London: Routledge.
Capello, R. & Kroll, H. (2016). From theory to practice in smart specialization strategy: emerging limits and possible future trajectories. European Planning Studies, 24(8), 1393–1406. doi: 10.1080/09654313.2016.1156058
Cooke, P. (2016). Four minutes to four years: the advantage of recombinant over special-ized innovation – RIS3 versus ‘smartspec’. European Planning Studies, 24(8), 1494–1510. doi: 10.1080/09654313.2016.1151482
Etzkowitz. H. & Leydesdorff, L. (2000). The dynamics of innovation: from National Sys-tems and “Mode 2” to a Triple Helix of university–industry–government relations. Research Policy, 29(2), 109–123. doi:10.1016/S0048-7333(99)00055-4
Foray, D. (2015). Smart specialisation: Opportunities and challenges for regional innova-tion policy. Abingdon: Routledge.
Foray, D., Goddard, J., Beldarrain, X., Landabaso, M., McCann, P., Morgan, K. ,… Ortega-Argilés, R. (2012). Guide to research and innovation strategies for smart speciali-sation (RIS3). Europe: European Commission.
Foray, D. & Goenaga, X. (2013). The goals of smart specialization (S3 Policy Brief Series, 1). Europe: European Commission.
Foray, D. & Rinoldi, A. (2013). Smart specialisation programmes and implementation (S3 Policy Brief Series, 2). Europe: European Commission.
Goddard, J., Kempton, L. & Vallance, P. (2013). Universities and smart specialisation: Challenges, tensions, and opportunities for the innovation strategies of European re-gions. Ekonomiaz, 83.
Granovetter, M. (1973). The strength of weak ties. American Journal of Sociology, 78, 1360–1380. Retrieved from https://sociology.stanford.edu/sites/default/files/publi-cations/the_ strength_of_weak_ties_and_exch_w-gans.pdf.
Harmaakorpi, V. (2006). Regional development platform method (RDPM) as a tool for re-gional innovation policy. European Planning Studies, 14(8), 1085–1114. doi: 10.1080/09654310600852399
Hausman, R. & Rodrik, D. (2003). Economic development as self-discovery. Journal of Development Economics, 72(2), 603–633. doi:10.1016/S0304-3878(03)00124-X
Kroll, H. (2015). Efforts to implement smart specialisation in practice - leading unlike horses to the water. European Planning Studies, 23, 2079–2098. doi: 10.1080/09654313.2014.1003036
Leydesdorff, L. & Etzkowitz. H. (1998). The Triple Helix as a model for innovation stud-ies. Science & Public Policy, 25(3), 195–203. doi: 10.1093/spp/25.3.195
Mariussen, Å. & Virkkala, S. (2013). Methodologies and methods of transnational learning. In Å. Mariussen & S. Virkkala (Eds.), Learning transnational learning (pp. 155–
195). Abingdon: Routledge.
Mariussen, Å. , Gjertsen, A., Løvland,J. & Lindeløv, B. (2013). Smart 4H: Forslag til smart spesialisering for Nordland. (NF Rapport 4/2013). Bodø: Nord-landsforskning.
Marlow, D. & Richardson, K. (2016). How smart is England’s approach to smart speciali-
zation? A policy paper. European Planning Studies, 24(8), 1478–1493. doi: 10.1080/09654313.2016.1179267
McCann, P. & Ortega-Argilés, R. (2013). Modern regional innovation policy. Cambridge Journal of Regions, Economy and Society, 6, 187–216. doi: 10.1093/cjres/rst007
McCann, P. & Ortega-Argilés, R. (2016).The early experience of smart specialization im-plementation in EU cohesion policy. European Planning Studies, 24(8), 1407–1427. doi: 10.1080/09654313.2016.1166177
Mäenpää, A. (2014). Methodology and research design. In S. Virkkala, A. Mäenpää & Å. Mariussen (Eds.), The Ostrobothnian model of smart specialization (pp. 49–65). Proceedings of the University of Vaasa, Reports 196.
Nauwelaers, C., Magro, E., Aranguren, M., Navarro, M., Wilson, J., Trippl, M., …Healy,
A. (2014). Underpinning effective strategy design: Smart specialisation for regional innovation (Work package 4)[Reflection paper]. Retrieved from http://www.car-diff.ac.uk /cplan/sites/default/files/Underpinning %20Effective%20Strategy%20De-sign.pdf.
Nonaka, I. & Takeuchi, H. (1995). The knowledge-creating company: How Japanese com-panies create the dynamics of innovation. Oxford: Oxford University Press.
Ranga, M. & Etzkowitz, H. (2013). Triple Helix systems: An analytical framework for in-novation policy and practice in the knowledge society. Industry & Higher Educa-tion, 27(3), 237–262. doi: 10.5367/ihe.2013.0165
Ranta, J.-M. & Takala, J. (2007). A holistic method for finding out critical features of in-dustry maintenance services. International Journal Services and Standards, 3(3), 312–325. doi: 10.1504/IJSS.2007.013752
Sabel, C. (1992). Learning by monitoring: The institutions of economic development (Working paper No.102). New York: Colombia University School of Law.
Shane, S. (2003) A general theory of entrepreneurship. The individual-opportunity nexus. Cheltenham: Edward Elgar Publishing.

Virkkala, S., Johnson, J. & Mariussen, Å. (2014). Summary and conclusion. In S. Virkkala, A. Mäenpää & Å. Mariussen (Eds.), The Ostrobothnian model of smart specialisa-tion (pp. 118-132). Proceedings of the University of Vaasa, Reports 196.