Embed Size (px)
Citation preview

A Concept for Seabed Rare Earth Mining in the Eastern South Pacific
Authors: M Bashir, SH Kim, E Kiosidou, H Wolgamot, W Zhang
Series Editors: R A Shenoi, P A Wilson, S S Bennett
Seabed Exploitation The LRET Collegium 2012 Series, Volume 1

“The Lloyd’s Register Educational Trust (The LRET) funds education, training and research programmes in transportation, science, engineering, technology and the safety of life, worldwide for the benefit of all. Funding is split between four categories to provide a continuum of support. We do not fund individuals direct, in any category.
Pre-university education – promoting careers in science, engineering and technology to young people, their parents and teachers;
University education – supporting exceptional students at undergraduate and masters level through scholarship programmes at selected universities;
Vocational training and professional development – funding organisations that provide training, knowledge sharing and skills development opportunities for people in work;
Research – adding value to society by funding research programmes which address fundamental challenges that affect us all.”

A Concept for Seabed Rare Earth Mining in the Eastern South Pacific Musa Bashir · Sung-hee Kim · Evangelia Kiosidou · Hugh Wolgamot · Wei Zhang
Titles in the LRET Collegium 2012 Series:
Volume 1: A Concept for Seabed Rare Earth Mining in the Eastern South Pacific
M B Bashir, S H Kim, E Kiosidou, H Wolgamot, W Zhang
ISBN 978-0-854-32949-6
Volume 2: Feasibility Study on Manganese Nodules Recoveryin the Clarion-Clipperton Zone
B Agarwal, P Hu, M Placidi, H Santo, J J Zhou
ISBN 978-0-854-32950-2
Volume 3: The deep sea energy park: Harvesting hydrothermal energy for seabed exploration
J Parada, X Feng, E Hauerhof, R Suzuki, U Abubakar
ISBN 978-0-854-32951-9
Volume 4: Sustainable Seabed Mining:Guidelines and a new concept for Atlantis II Deep
L Egorov, H Elosta, N L Kudla, S Shan, K K Yang
ISBN 978-0-854-32952-6
Volume 5: Polymetallic nodule mining: Innovative concepts for commercialisation
W Flentje, S E Lee, A Virnovskaia, S Wang, S Zabeen
ISBN 978-0-854-32953-3

University of Southampton Highfield, Southampton SO17 1BJ, England © University of Southampton, 2012 All rights reserved; no part of this publication may be reproduced, stored in any retrieval system, or transmitted in any form or by any means, electronic, mechanical, photocopying, recording, or otherwise without either the prior written permission of the Publishers or a license permitting restricted copying in the United Kingdom issued by the Copyright Licensing Agency Ltd, 90 Tottenham Court Road, London W1P 9HE. First published 2012 British Library Cataloguing in Publication Data A catalogue entry for this title is available from the British Library ISBN: 978-0-854-32949-6
Printed in Great Britain by The Print Centre, University of Southampton

i
Foreword
The Lloyd�’s Register Educational Trust (The LRET) in collaboration with the University of Southampton instituted a research collegium in Advanced Ship and Maritime Systems Design in Southampton between 16 July and 7 September 2012. This year�’s collegium has focused on The LRET�’s research-led education agenda. Successful ship and maritime systems design depends on the collaborative application of a broad range of engineering competences as the drive for improved efficiency and environmental performance places greater demand on the design community. This aspect needs to be reflected in the education of naval architects, marine engineers and others who are the active contributors to the ship design processes. The aim of the research collegium has been to provide an environment where young people in their formative post-graduate years can learn and work in a small, mixed discipline group drawn from the maritime community to develop their skills whilst completing a project in advanced maritime systems design. The project brief that initiates each project set challenging user requirements to encourage each team to develop an imaginative solution, using individual knowledge and experience, together with learning derived from teaching to form a common element of the early part of the programme. The collegium format provided adequate time for the participants to enhance their knowledge through a structured programme of taught modules which focussed on the design process, advanced technologies, emerging technologies and novel marine solutions, regulatory and commercial issues, design challenges (such as environmental performance and climate change mitigation and adaptation) and engineering systems integration. Lecturers were drawn from academic research and industry communities to provide a mind-broadening opportunity for participants, whatever their original specialisation. The subject of the 2012 collegium has been systems underpinning seabed exploitation. The 25 scholars attending the 2012 collegium were teamed into five groups. The project brief included: (a) quantification of the environmental challenge; (b) understanding of the geo-political legal-social context; (c) possible techniques for harvesting or recovering resources from the seabed; (d) one engineering system to achieve seabed exploitation; (e) economics and logistics challenges. While all the groups addressed the items (a) to (c), each team focused on just one engineering system in dealing with items (d) and (e). This volume presents the findings of one of the five groups. R A Shenoi, P A Wilson, S S Bennett Southampton 2 September 2012

ii
AcknowledgementsIt is a pleasure to thank the many people who made this report possible.
We wish to acknowledge, first and foremost, Mr. Michael Franklin, Director of the Lloyd�’s Register Educational Trust (LRET) and the Board of Trustees for realising the Research Collegium for a 2nd year, and we all hope this Collegium will become a tradition.
We would like to express the deepest appreciation to Professor Shenoi and Professor Wilson because their contributions, detailed comments and insight have been of great value to us.
It gives us great pleasure to acknowledge the support and help of Professor Pomeroy and Prof. Rachel Mills, through lectures and further advice in their fields of specialization.
We wish to thank Dr. Sally Bennett because she has been providing us with encouragement, sound advice, and valuable feedback for improvement, during the whole of the collegium. We are also grateful to Dr. Alex Phillips for his technical guidance and his apt inquiries during our weekly presentations, which introduced new issues for consideration each time.
We particularly thank Dr Kelsey Jordahl for making bathymetric grids available, Professor Ian Croudace for his extensive help and Dr Maaten Furlong for expert submarine advice. Special thanks go to Mr Craig Porter for his assistance on the risk matrix.
We are indebted to Mrs. Aparna Subaiah-Varna for her willingness to organize our accommodation, arrange our fare, organize our trips and make sure everyone has a good time.
We would like, also, to thank Ms. Mirjam Fürth for getting her last year experience across, accompanying and guiding us in our trips and for her advice to �“study hard and play hard�”. Very special thanks to Mr. Bhawanin Mahesa, as well, for listening and discussing our concerns, assisting and mentoring.
Last but certainly not least, our special thanks to the whole academic and technical stuff of the Fluid Structure Interactions building, where we had the support and equipment we needed to produce and complete our report.
Finally, we wish to thank deeply all of our colleagues on the LRET Collegium, for the great time we had during these two months and for the quality friendships arisen through this unique experience.
For any errors or inadequacies that may remain in this work, of course, the responsibility is entirely our own.
iii
Table of Contents Acknowledgements ................................................................................................................ ii
Table of Contents ................................................................................................................. iii
List of Figures ..................................................................................................................... viii
List of Tables ......................................................................................................................... xi
List of Abbreviations ........................................................................................................... xii
Summary ............................................................................................................................. xiii
1 Introduction ....................................................................................................................1
1.1 Contents of this report .................................................................................................. 1
1.2 What is the seabed? ...................................................................................................... 1
1.3 Motivation for investigating marine minerals .............................................................. 2
1.4 Seabed law .................................................................................................................... 3
1.4.1 Definition of ocean territory and jurisdiction .......................................................... 3
1.4.2 Legal issues surrounding seabed resource exploitation .......................................... 5
1.4.3 Tensions in making ocean laws ................................................................................ 7
1.5 Review of seabed mining activities .............................................................................. 8
1.5.1 Seafloor Massive Sulfides ........................................................................................ 8
1.5.2 Manganese Nodules ................................................................................................. 9
1.5.3 Cobalt Crusts .......................................................................................................... 10
1.5.4 Continental shelf mining ........................................................................................ 11
1.6 Summary .................................................................................................................... 11
2 Rare Earth Elements .................................................................................................... 12
2.1 What are rare earth elements? .................................................................................... 12
2.2 Uses of REEs .............................................................................................................. 13
2.2.1 Current uses ........................................................................................................... 13
2.2.2 Future Uses ............................................................................................................ 15
2.3 World Resources and Production ............................................................................... 15
2.3.1 Resources and reserves .......................................................................................... 15

iv
2.3.2 Current production ................................................................................................. 17
2.3.3 Future production .................................................................................................. 17
2.4 Global Demand and Supply ....................................................................................... 18
2.4.1 The role of China .................................................................................................... 18
2.5 Price ............................................................................................................................ 19
2.6 Summary .................................................................................................................... 22
3 Resources and exploration ........................................................................................... 23
3.1 Rare earth resources on the seabed ............................................................................ 23
3.2 Resource ..................................................................................................................... 25
3.3 Bathymetry ................................................................................................................. 28
3.3.1 Acoustic methods .................................................................................................... 28
3.3.2 Existing bathymetric data ...................................................................................... 29
3.4 Resource mapping ...................................................................................................... 32
3.4.1 Seabed investigation - deployment ......................................................................... 33
3.4.2 Seabed investigation �– geophysical methods ......................................................... 34
3.5 Exploration plan ......................................................................................................... 37
4 Location for study �– French Polynesia ....................................................................... 38
4.1 French Polynesia - general information ..................................................................... 38
4.2 French Polynesian law ............................................................................................... 39
4.2.1 EEZ and environmental law ................................................................................... 39
4.3 French Polynesian society and the ocean environment.............................................. 40
4.4 Practicalities of mining seabed minerals .................................................................... 41
4.4.1 Marine protected areas in French Polynesia......................................................... 42
5 Environment ................................................................................................................. 44
5.1 Introduction ................................................................................................................ 44
5.2 Abyss biology of the eastern South Pacific Ocean .................................................... 44
5.2.1 Seabed habitat parameters ..................................................................................... 44
5.2.2 Abyss communities ................................................................................................. 46
5.2.3 Abyss lithology ....................................................................................................... 48
5.3 Environmental Impacts .............................................................................................. 49

v
5.4 Suspended sediment ................................................................................................... 51
5.4.1 Suspended sediment processes ............................................................................... 51
5.4.2 Impacts of suspended sediment .............................................................................. 52
5.4.3 Mitigation ............................................................................................................... 52
5.5 Tailings ....................................................................................................................... 53
5.5.1 Deep Sea Tailings Placement (DSTP) ................................................................... 53
5.5.2 General practice in deep sea mining proposals ..................................................... 54
5.5.3 Global ocean dumping regulations ........................................................................ 54
5.5.4 National ocean dumping regulations ..................................................................... 55
5.5.5 Tailings disposal conclusions ................................................................................ 57
5.6 Noise ........................................................................................................................... 57
5.6.1 Surface vessels ........................................................................................................ 58
5.6.2 Seabed equipment ................................................................................................... 58
5.6.3 Biological impacts .................................................................................................. 58
5.7 Light & Heat ............................................................................................................... 60
5.7.1 Light emissions ....................................................................................................... 60
5.7.2 Heat ........................................................................................................................ 60
5.8 Conclusions and recommendations ............................................................................ 61
5.8.1 Conclusions ............................................................................................................ 61
5.9 Suggestions & Environmental Considerations ........................................................... 61
6 Technology ....................................................................................................................63
6.1 Introduction ................................................................................................................ 63
6.2 Existing technologies ................................................................................................. 63
6.3 Basic considerations in selecting REE mining equipment ......................................... 64
6.3.1 Production Support Vessel ..................................................................................... 64
6.3.2 Water depth ............................................................................................................ 65
6.3.3 Hydrodynamics ....................................................................................................... 65
6.3.4 Soil stability ............................................................................................................ 66
6.3.5 Materials selection ................................................................................................. 67
6.3.6 Powering ................................................................................................................ 67
6.4 Concept for seabed REE mining ................................................................................ 68

vi
6.4.1 Objectives ............................................................................................................... 68
6.4.2 Design considerations ............................................................................................ 68
6.4.3 Overview and process description ......................................................................... 69
6.4.4 Production volumes ................................................................................................ 71
6.5 Surface vessels ........................................................................................................... 72
6.5.1 The Production Support Vessel (PSV) ................................................................... 72
6.5.2 Supply vessel .......................................................................................................... 74
6.6 The REE Mud Collector ............................................................................................. 74
6.6.1 General aspects of the solution .............................................................................. 74
6.6.2 The crawler chassis ................................................................................................ 76
6.6.3 Design of the cutter-suction system ........................................................................ 78
6.6.4 Operation ............................................................................................................... 79
6.6.5 Environmental impact ............................................................................................ 80
6.7 Hub ............................................................................................................................. 81
6.7.1 Mud distributor ...................................................................................................... 81
6.7.2 REE recovery from solution ................................................................................... 82
6.7.3 Acid recycling ......................................................................................................... 83
6.8 Leaching Tanks .......................................................................................................... 83
6.8.1 Tank with piston ..................................................................................................... 84
6.8.2 Subsea Flexible Bladder......................................................................................... 86
6.9 Separator ..................................................................................................................... 86
6.9.1 Filtration separation .............................................................................................. 88
6.9.2 Filter types .............................................................................................................. 89
6.9.3 Centrifugal Separation ........................................................................................... 91
6.9.4 Hydrocyclone Separation ....................................................................................... 94
6.9.5 Conclusions ............................................................................................................ 96
6.10 Lifting system ............................................................................................................. 98
6.11 Remotely Operated Vehicle (ROV) ........................................................................... 99
6.12 Installation and testing ............................................................................................... 99
6.13 Summary .................................................................................................................. 100
7 Finance, Logistics, Risk ............................................................................................. 101

vii
7.1 Commercial arrangements ........................................................................................ 101
7.2 Commercial Analysis ............................................................................................... 101
7.2.1 Capital cost (CAPEX) .......................................................................................... 102
7.2.2 Operating cost (OPEX) ........................................................................................ 103
7.2.3 Price forecast ....................................................................................................... 103
7.3 Risk analysis ............................................................................................................. 105
8 Conclusion ................................................................................................................... 111
References ...........................................................................................................................112

viii
List of Figures Figure 1: Seabed features. ........................................................................................................ 2
Figure 2: Definitions of important seabed jurisdictional zones. (http://www.un.org/Depts/los /clcs_new/marinezones.jpg) ..................................................................................................... 4
Figure 3: Legal relationships between coastal states, international organizations and enterprises seabed resource mining. ......................................................................................... 5
Figure 4: Global distributions of hydrothermal vent fields (yellow dots) and polymetallic nodule exploration areas (red boxes) (dash-dot line is limits of the EEZ) (ISA). ................. 10
Figure 5: Periodic table of the elements with the rare earths highlighted. ............................. 12
Figure 6: Chinese and world production of REO between 1992-2010 (British Geological Survey, 2011). ........................................................................................................................ 17
Figure 7: Forecast for global demand and supply for individual rare earths in 2015. ........... 19
Figure 8: Price trends for selected HREO from 2001 to 2011 (BGS, 2011). ........................ 20
Figure 9: Price trends for selected LREO from 2001 to 2011 (BGS, 2011). ......................... 21
Figure 10: Price trends for selected HREO from April 2008 to September 2011. ................ 22
Figure 11: Seabed REE concentrations at tested sites in the Pacific with total REE concentration above 400ppm (data from Kato et al, 2011). ................................................... 23
Figure 12: Sites with REE concentration > 400ppm studied by Kato et al (2011) displayed relative to EEZ boundaries. .................................................................................................... 24
Figure 13: Depth profile of total REE concentration at site 76 (Kato et al, 2011). ............... 26
Figure 14: Depth profile of total REE concentration at site KH-71-5-15-2 (Kato et al, 2011). ................................................................................................................................................ 27
Figure 15: Bathymetric data for French Polynesia from Jordahl et al (2004). The boxes 1 and 2 refer to the areas displayed in Figures and respectively. .............................................. 30
Figure 16: a) Contour map of the region of site 76; b) Shaded map of the region of site 76; c) Contour map of the immediate location of site 76; d) Shaded map of the immediate region of site 76 ...................................................................................................................... 31
ix
Figure 17: a) Contour map of the region of site KH71-5-15-2; b) Shaded map of the region of site KH71-5-15-2; c) Contour map of the immediate location of site KH71-5-15-2; d) Shaded map of the immediate region of site KH71-5-15-2. .................................................. 32
Figure 18: Schematic of truck-mounted CPT rig with XRF (Elam et al, 2000) .................... 35
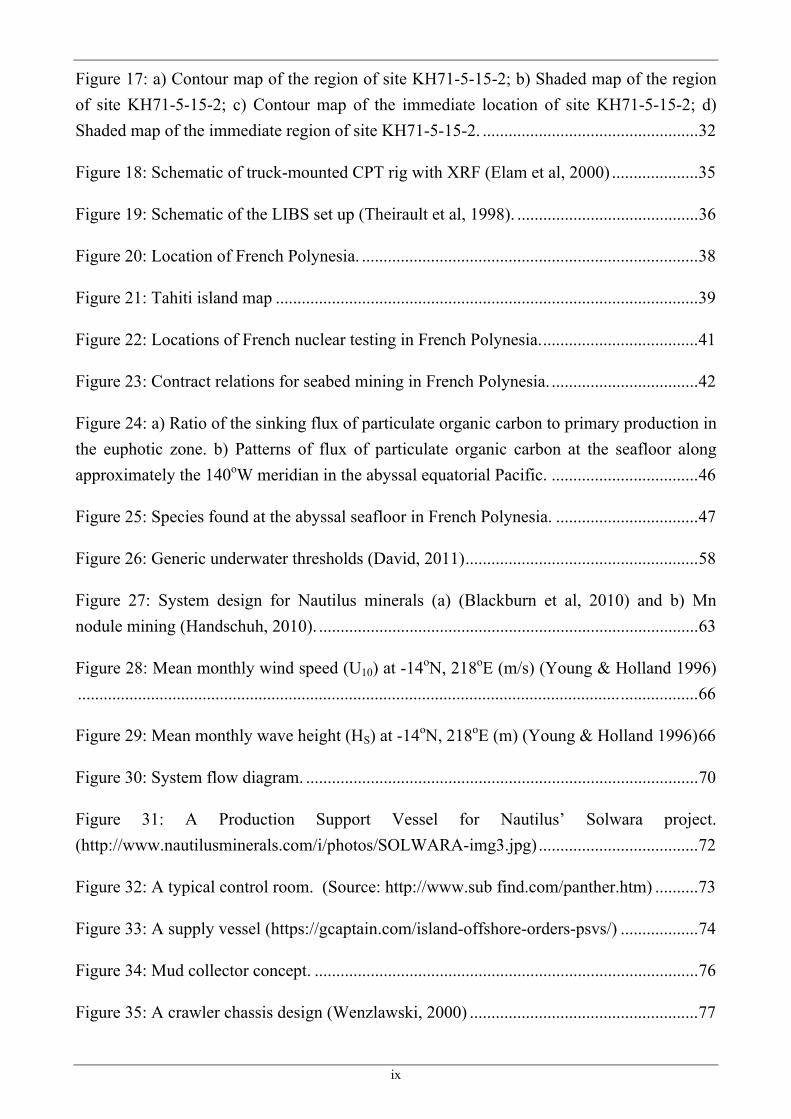
Figure 19: Schematic of the LIBS set up (Theirault et al, 1998). .......................................... 36
Figure 20: Location of French Polynesia. .............................................................................. 38
Figure 21: Tahiti island map .................................................................................................. 39
Figure 22: Locations of French nuclear testing in French Polynesia. .................................... 41
Figure 23: Contract relations for seabed mining in French Polynesia. .................................. 42
Figure 24: a) Ratio of the sinking flux of particulate organic carbon to primary production in the euphotic zone. b) Patterns of flux of particulate organic carbon at the seafloor along approximately the 140oW meridian in the abyssal equatorial Pacific. .................................. 46
Figure 25: Species found at the abyssal seafloor in French Polynesia. ................................. 47
Figure 26: Generic underwater thresholds (David, 2011) ...................................................... 58
Figure 27: System design for Nautilus minerals (a) (Blackburn et al, 2010) and b) Mn nodule mining (Handschuh, 2010). ........................................................................................ 63
Figure 28: Mean monthly wind speed (U10) at -14oN, 218oE (m/s) (Young & Holland 1996) ................................................................................................................................................ 66
Figure 29: Mean monthly wave height (HS) at -14oN, 218oE (m) (Young & Holland 1996) 66
Figure 30: System flow diagram. ........................................................................................... 70
Figure 31: A Production Support Vessel for Nautilus�’ Solwara project. (http://www.nautilusminerals.com/i/photos/SOLWARA-img3.jpg) ..................................... 72
Figure 32: A typical control room. (Source: http://www.sub find.com/panther.htm) .......... 73
Figure 33: A supply vessel (https://gcaptain.com/island-offshore-orders-psvs/) .................. 74
Figure 34: Mud collector concept. ......................................................................................... 76
Figure 35: A crawler chassis design (Wenzlawski, 2000) ..................................................... 77

x
Figure 36: Cutter track of the mud collector .......................................................................... 80
Figure 37: Illustration of the mud collector with a cover...................................................... 81
Figure 38: A typical subsea template for the oil and gas industry. ........................................ 82
Figure 39: Diagram of an electrodialysis tank. ...................................................................... 83
Figure 40: Schematic of piston leaching tank. ....................................................................... 85
Figure 41: Subsea flexible bladder (ATL company) .............................................................. 86
Figure 42: Flow chart of classification of the common solid-liquid separation processes (Armenante, 2003b). .............................................................................................................. 88
Figure 43: a) Filtration: solid-liquid separation; b) Mechanisms of filtration (Wachara wichanant 2008a). .................................................................................................................. 88
Figure 44: a) rotary drum filter; b) disc filter (Wacharawichanant, 2008a). ......................... 90
Figure 45: a) Centrifuge design parameters correlation (Perry 1984); b) recommended centrifuge type for different size and amount of solid particles (Margaritis 2007). ............. 93
Figure 46: Schematic diagram of a typical hydrocyclone (Svarovsky 2000) ........................ 94
Figure 47: Grade efficiency curves for a hydrocyclone (Svarovsky 2000) ........................... 95
Figure 48: Schematic diagram of a nozzle-type disc centrifuge (Svarovski 2000). .............. 97
Figure 49: Remotely operated vehicle. (http://www.sub-find.com/panther.htm) .................. 99
Figure 50: NPV in US dollars for discount rate of 8%. ....................................................... 105

xi
List of Tables Table 1: Organisations with exploration agreements with the ISA. ........................................ 7
Table 2: Uses of the rare earth elements. ............................................................................... 15
Table 3: World rare earth reserves by country (USGS, 2011). .............................................. 16
Table 4: Properties of the core locations being studied. ........................................................ 25
Table 5: Average REE contents of the two cores. ................................................................. 27
Table 6: Marine protected areas in French Polynesia. ........................................................... 43
Table 7: Sample locations indicating regions of interest ....................................................... 44
Table 8: Pacific Ocean floor pelagic sediments in the French Polynesia Region (Hays et al 1972a;b). ................................................................................................................................. 48
Table 9: Environmental consequences of deep seabed mining (Berge et al, 1991). .............. 50
Table 10: Characteristic comparison of guidelines and criteria (David, 2011). .................... 59
Table 11: Typical operating range of centrifuges (Belier 1982). ........................................... 92
Table 12: Capital cost in US dollars..................................................................................... 102
Table 13: Operating Cost in US dollars. .............................................................................. 103
Table 14: Average price of REE per tonne in US dollars. ................................................... 103
Table 15: Estimated Annual Revenue in US dollars. ........................................................... 104
Table 16: NPV figures. ......................................................................................................... 104
Table 17: Risk analysis matrix for the mining system. ........................................................ 108
Table 18: Consequence categories and probability rating matrix for risk analysis. ............ 109

xii
List of Abbreviations AUV Autonomous Underwater Vehicle
CAPEX Capital Expenditure
CPT Cone Penetrometer Test
CSA International Seabed Authority
EEZ Exclusive Economic Zone
FP French Polynesia
LIBS Laser-Induced Breakdown Spectroscopy
OPEX Operating expenditure
PSV Production Support Vessel
REE Rare Earth Elements
REO Rare Earth Oxide
ROV Remotely Operated Vehicle
XRF X-Ray Fluorescence spectroscopy

xiii
SummaryThis report presents a concept for mining of rare earth elements from seabed sediment in a promising area of the eastern South Pacific. The document begins with an introduction to the seabed, its regulation and resources. The rare earth elements and their uses, production and trade are then considered �– although demand for rare earths is forecast to grow, price forecasts are very difficult.
The available data on rare earth elements in seabed sediment is analysed, and a promising region selected for investigation; acoustic and geophysical/geochemical methods to explore and gather new data using underwater vehicles are discussed.
The environmental, legal and social context of the chosen mining site is considered and the impacts of mining on the environment analysed; suspended sediment and tailings release are identified as major issues. It is clear that much is still not understood about the potential environmental effects of deep sea mining.
A system for mining seabed mud rich in rare earth elements is then proposed �– the method involves processing on the seafloor to minimise the volume that must be lifted to the surface and eliminate the uneconomic riser system. Aspects of this seabed processing apparatus are considered in some detail, though many problems remain unresolved.
Finally, some financial and risk analyses of the project are completed, making an assumption that successful exploration has taken place.

1
1 Introduction
1.1 Contents of this report
This report presents issues relating to, and a concept for, extraction of rare earth elements (REE) from seabed sediments in the eastern South Pacific. As seabed mining is an emerging field, the first chapter is spent establishing some background about the seabed, the regulations that govern it, and efforts already underway to exploit the seabed. The second chapter similarly provides some introduction to the rare earth elements, and discusses the economics of rare earths, to provide some justification for the sections that follow.
In chapter three existing knowledge on rare earth deposits on the seabed is summarised, a site in the eastern South Pacific is selected for further analysis and techniques to quantify the nature of the resource in this region discussed. Chapter four reviews the legal and social aspects relevant to mining in the chosen area, while chapter five examines the state of the existing environment and potential impacts of a mining operation in this location. A system to extract REE from the seabed is described in chapter six, and a financial analysis of the system follows in the chapter seven.
The final chapter draws some conclusions about seabed mining of rare earths, both in relation to the specific region investigated, and more generally, in terms of its financial and technical feasibility.
1.2 What is the seabed?
The seabed is the bottom of the ocean, or the top of the earth�’s crust which is overlain by oceans. Different areas of the seabed may be identified, based upon their location and geology. Some major seabed units are described below, and illustrated in Figure 1:
A continental shelf surrounds each continent and is actually a subsea extension of the continent itself. The continental shelf is generally in waters less than 200m deep and may vary in width from a couple of kilometers to a few hundred kilometers (Segar, 2007); The continental slope begins at the seaward edge of the continental shelf and runs down to depths of about 2km at a much steeper gradient than the shelf ; The continental rise begins seaward of the continental slope and runs down to a depth of around 3500m, at a flatter gradient than the continental slope; A large proportion of the seabed is abyssal plain, an area of almost flat seafloor which begins after the continental rise and occurs at depths of between 3500 and 6500m; and, Deep-ocean trenches may occur at tectonic plate boundaries and extend down to depths of up to 11000m.

2
Other seabed features of interest include seamounts, which are underwater mountains formed by volcanic hot spot activity, and mid-ocean ridges, where new seafloor is created as tectonic plates move apart.
The seafloor rock is generally covered in sediment, the thickness of which varies greatly. In general the sediment layer is thinnest on the mid ocean ridges and becomes thicker with distance from the ridges.
Figure 1: Seabed features.
1.3 Motivation for investigating marine minerals
The search for mineral resources to meet global demand, which is steadily rising due to global population growth, is fast moving to deeper ocean environments. Mineral resources, especially metallic minerals, are used in the manufacture of products that are increasingly needed for the sustenance of the ever-changing life style of the population. As the world�’s economy grows, the ability of the people to afford quality products that could improve their living standard always increases. Other benefits of these minerals are their uses in the manufacture of products that are less harmful to the environment e.g. electric cars, wind turbines, batteries
The search for seabed minerals is partly driven by the decline in the reserves of land-based minerals and the need to find additional resources to meet the future demand. The economic viability and the increasingly tougher environmental regulations faced by land-based mining is also contributing to the decline in these resources (S. Hrg 110-272, 2007; Doyle et al, 2006; McBride and Bei, 2001).
A key obstacle to successful exploitation of mineral resources in the seabed, especially in deepsea environment, has always been the limited availability of requisite technology

3
needed to access the locations. Although recent technological advancements have enabled the successful exploitation of hydrocarbons in deep water, the use of relatively similar concepts for mineral mining in the same environment is still unknown. Equipment with great capabilities has been built for the exploitation of hydrocarbons in environments that a few decades ago many thought was improbable to exploit (UC Davis, 2012). Again, the exploitation of seabed minerals has not yet witnessed a level of interest and investment that could guarantee the development of some technological means of exploiting the resources.
It has been suggested that the seabed contains a substantial volume of metallic minerals that could rival the total hydrocarbon energy available in it (Bandow, D, 1982). However, despite various studies in the form of exploratory surveys that have been performed (Chung, JS, 2009), only limited success has been recorded in terms of properly documenting the actual quantity available. The actual volume of seabed mineral reserves remains a guess.
In view of the foregoing, the need to expand the seabed mineral resources frontier has become imperative. Apart from the need to augment the current reserves to meet the increase in population, exploitation of seabed minerals could be less harmful to the environment and cheaper to exploit than land minerals.
1.4 Seabed law
1.4.1 Definition of ocean territory and jurisdiction
Territorial rights and jurisdiction over the ocean and seabed is defined by the United Nations Convention on the Law of the Sea (UNCLOS, 1982). Coastal states have rights pertaining to certain zones of ocean or seabed adjacent to their territory, while the ocean and seabed outside these zones is common property, governed by the UN. Zones relevant to coastal states are defined with reference to a baseline, which is, in general, the low water mark of the coastline.
A coastal state exercises sovereignty over a zone called the territorial sea, which extends to a limit not exceeding 12 nautical miles from the baseline. Beyond this, the coastal state has rights to prevent, and punish, infringement of customs, fiscal, immigration or sanitary laws to the limit of a contiguous zone which extends seaward from the limit of the territorial sea to 24 nautical miles from the baseline.
For exploitation of marine resources in the ocean and on the seabed a key concept is the Exclusive Economic Zone (EEZ). In the EEZ coastal states have sovereign rights for economic exploration and exploitation of resources in the water column and on or below the seabed. The EEZ extends up to 200 nautical miles from the baseline (less where EEZs overlap).

4
Coastal states may have further seabed exploitation rights beyond the outer extent of the EEZ to the limit of the continental shelf. The outer limit of the continental shelf is defined with reference to the continental slope, and is either: 60 nautical miles from the foot of the continental slope or the point at which the thickness of sedimentary rocks is 1% or greater than the distance to the foot of the continental slope. In either case the outer extent of the continental shelf is not to exceed 350 nautical miles from the baseline, or 100 nautical miles from the 2500m depth contour (isobath). Although a coastal state has exclusive rights to develop the resources of its continental shelf beyond the EEZ, if it does so it will be liable to pay a fee to the UN. This fee is introduced at 1% of the value of mining for the year in the sixth year of operation, and thereafter increases by 1% per year until it reaches a ceiling of 7%, which extends to the end of the project.
The waters of the world�’s oceans outside the EEZs of coastal states are denoted the high seas by the UN, and the governing doctrine is that of �“freedom of the high seas�”. The seabed outside the continental shelf areas of coastal states is termed the Area. UNCLOS (1982) states that �“The Area and its resources are the common heritage of mankind.�” Activities in the Area are governed by the International Seabed Authority (ISA), of which all countries are members. Figure 2 illustrates the various zones described above.
Figure 2: Definitions of important seabed jurisdictional zones. (http://www.un.org/Depts/los/clcs_new/marinezones.jpg)

5
1.4.2 Legal issues surrounding seabed resource exploitation
Seabed resources may be found in the EEZ or continental shelf zone, or in the Area, and the law that applies depends on the location.
Resources found within a country�’s EEZ must be exploited in accordance with the laws of that country. National legislation is often written so as to be similar to international laws. However, as seabed mining is a relatively new industry, many countries lack relevant laws. When a country doesn�’t have sufficient law governing seabed development, the country may choose to enforce the relevant international law or a neighbouring country�’s law. This depends on the contract between the country and the enterprise, and international organizations watch the contract contents with interest. However, the international organizations cannot enforce any laws in this case.
Figure 3: Legal relationships between coastal states, international organizations and enterprises seabed resource mining.
In the Area, exploration and exploitation are managed by the ISA in accordance with UNCLOS. Some features of the UNCLOS legislation of significance for exploitation include:
Any organisation wishing to carry out activities in the Area must have state sponsorship; In applying to work in an area, an organisation must submit a plan for an area split into two halves of equal commercial value; the ISA then chooses one which is

6
reserved for the ISA to exploit if it wishes and authorises the organisation to work in the other; When an organisation has commenced production, it must make financial contributions to the ISA, in the form of royalties, or some similar arrangement, at a level agreed with the ISA and of similar magnitude to such fees for land based mining.
In addition to UNCLOS, the ISA intends to produce a Mining Code, to �“regulate prospecting, exploration and exploitation of marine minerals in the international seabed Area�” (ISA, 2012a). However, only limited parts of this code, dealing with prospecting for polymetallic nodules and polymetallic sulfides (see Section 1.5) have so far been produced.
A draft environmental code, the Code for Environmental Management of Marine Mining, was developed by the International Marine Minerals Society (IMMS) which is a division of the Society for Mining, Metallurgy and Exploration (SME). This code was presented to the ISA, and, according to the ISA is �“likely to serve as a model for legally binding legislation on marine mining�” (Van Dover, 2011a) �– however, nothing is currently in force. While the ISA manages the rights of exploration and prospecting for marine minerals, the IMMS Code ranges from research, exploration and exploitation to decommissioning and rehabilitation. The Code emphasizes preventing environmental damage rather than trying to fix environmental problems after they have occurred.
As of September 2012, the ISA had issued 17 licenses for exploration. These are detailed in Table 1.
Organisation CountryDate registered
(or Approved)
Date contract signed
The Government of India India 17 August 1987 25 March 2002
Institut français de recherché pour l�’exploitation de la mer / Association
française pour l�’étude et la recherche des nodules (IFREMER/AFERNOD)
France 17 December 1987 20 June 2001
Deep Ocean Resources Development Company (DORD)
Japan 17 December 1987 20 June 2001
State Enterprise Yuzmorgeologiya Russia 17 December 1987 29 March 2001

7
China Ocean Mineral Resources Research and Development Association (COMRA)
China 5 March 1991 22 May 2001
Interoceanmetal Joint Organization (IOM)
Bulgaria, Cuba, Czech
Republic, Poland, Russia,
Slovakia
21 August 1991 29 March 2001
The Government of the Republic of Korea Korea 2 August 1994 27 April 2001
The Federal Institute for Geosciences and Natural Resources of the Federal Republic
of Germany Germany
Approved during the 11th Session in 2005
19 July 2006
Nauru Ocean Resources Inc Nauru Approved during the 17th Session in 2011
11 January 2012
China Ocean Mineral Resources Research and Development Association (COMRA)
China Approved during the 17th Session in 2011
11 January 2012
Tonga Offshore Mining Limited Tonga Approved during the 17th Session in 2011
11 January 2012
The Government of the Republic of Korea Korea Approved during the 18th Session in 2012
_
Institut français de recherché pour l�’exploitation de la mer (IFREMER)
France Approved during the 18th Session in 2012
_
US Seabed Resources Ltd. US Approved during the 18th Session in 2012
_
Marawa Research and Exploration Ltd. Kiribati Approved during the 18th Session in 2012
_
G-TEC Mineral Resources NV Belgium Approved during the 18th Session in 2012
_
Table 1: Organisations with exploration agreements with the ISA.
1.4.3 Tensions in making ocean laws
Although laws dealing with exploitation of the seabed exist, some tensions should be noted.
Firstly, legal approval does not guarantee social acceptance. Nautilus Minerals is a Canadian company planning to mine Seafloor Massive Sulphides (SMS, see Section 1.5.1)

8
located in 1600m of water off Papua New Guinea (PNG). Nautilus is the first company to obtain an exploration license for this type of mining in PNGs EEZ, and sought, in addition to two legal permits, a �“social license to operate�”. This involves helping local communities understand the company�’s plans, and hopefully gaining community acceptance. To engage local stakeholders, Nautilus visited many local communities around the mining area and gave them information about the project, while scientific stakeholders were engaged by holding international workshops with world experts in related scientific fields.
A second tension is that the ocean is one body �– nature does not respect the arbitrary boundaries drawn by the UN or individual countries. Poor decisions made in one part of the ocean will affect others. Further, the deep oceans are poorly understood and gaining answers to scientific questions can take a long time. In contrast, the technology of seabed mining is relatively well understood and could be deployed quickly, even if the project was not necessarily economically successful.
1.5 Review of seabed mining activities
There are a number of different types of mining operations that have been proposed on the seabed. A brief review of pertinent mining types is given below (note that this review excludes the oil and gas industry).
1.5.1 Seafloor Massive Sulfides
Seafloor massive sulfides are bodies of metallic sulfides precipitated at and near the sea floor when submarine volcanic hot spring fluids (at 250-350oC) from hydrothermal vents mix with cold seawater. The fluid issues from chimneys which may vary from a few centimeters to several meters long (Binns 2011) and mixes with the surrounding seawater to form characteristic black �“smoke�”. Hydrothermal vents are found in regions of tectonic interest, including along mid-ocean ridge systems, volcanic arcs and back arc systems which collectively stretch across around 89,000km of ocean floor (Hoagland et al, 2010), see Figure 4. Vents may be found in water depths between 1000m and 5000m (Hein 2011), with the lower depths typically associated with arcs and back-arcs and the higher depths with mid-ocean ridges.
Hydrothermal vents occur in �‘fields�’, that is, clusters of vent chimneys within an area of a few hundred square meters. The spreading rate of mid-ocean ridges determines the space between the vent fields. For instance, on the fast spreading East Pacific Rise the vent fields may be 10s of kilometers apart, whereas on the slow spreading Mid-Atlantic Ridge the vent fields may be 100s of kilometers apart. Further, vent fields are ephemeral and the frequency with which they are interrupted or cease issuing hydrothermal fluid is again correlated with

9
the spreading rate �– the figure may be 10s or 1000s of years for fast and slow spreading ridges respectively. Deep sea vents are home to unique chemosynthetic ecosystems, where the fixation of inorganic carbon to organic material takes place using chemical energy from oxidation of H2S. A variety of remarkable vent animals can exploit chemosynthetic primary production by microbes, and new species are still being discovered. Vent biology is still poorly understood and documented, even at sites that have been of interest for decades (Van Dover, 2011b).
A Canadian company, Nautilus minerals, is preparing to mine an SMS deposit, Solwara 1, in 1600m of water in Papua New Guinea�’s EEZ. Investigation of the deposit has taken place and Nautilus has received a mining license and environmental permit from the PNG Government. The company proposes using a series of large, tracked vehicles adapted from land based mining to cut the rock, collect it, and pump it to the surface. In addition to the Solwara project, Nautilus is seeking other SMS deposits within the EEZs of Pacific countries. Nautilus comments that mining in EEZs �“avoids issues in international waters related to the lack of jurisdiction, lack of internationally ratified mining and exploration laws, and uncertain tenure status�” (Blackburn et al, 2010).
SMS mining at active vent sites is fraught with problems, due to the disruption that will be caused to the unique ecosystems at these sites. Inactive sites may offer better prospects, but are harder to locate, lacking a characteristic smoke signal, and have been even less well studied than active sites.
1.5.2 Manganese Nodules
Manganese nodules (or polymetallic nodules) form on the vast deep water abyssal plains, in deep ocean basins far from land, at depths between 4000-6500m. They form by precipitation from cold ambient bottom water and sediment pore fluids and are composed of manganese and ferrous oxides, while they also contain significant amounts of nickel and copper. Nodules range in size from the microscopic to 20cm across, but the most common size is about 5-10cm across.
The abyssal plain environment of manganese nodules is more widespread than the localised pockets of extraordinary life at hydrothermal vents. However, while nodule mining proposals generally involve collecting nodules from the seafloor rather than excavating, these activities could still affect the balance of a sea floor habitat that has received very little scientific attention.
Manganese nodule mining was of significant interest in the 1970s and 1980s, when forecasts of high mineral prices drove a significant number of exploratory cruises and

10
subsea mining system tests 1 (Glasby, 2010, Hein, 2011). However, the forecasts were overly optimistic and interest in nodule mining declined from 1982, although it is rising again �– 3 of the 5 exploration applications approved by the ISA in the last year have been for manganese nodules (ISA, 2012b).
Nodules are found anywhere on the seafloor that sediment deposition rates are low �– this usually means far from land. Two zones have been designated exploration zones by the ISA �– the Clarion Clipperton Zone and the Indian Ocean nodule mining area �– see Figure 4.
Figure 4: Global distributions of hydrothermal vent fields (yellow dots) and polymetallic nodule exploration areas (red boxes) (dash-dot line is limits of the EEZ) (ISA).
1.5.3 Cobalt Crusts
Cobalt crusts (also known as ferromanganese crusts) usually grow on hard rock surfaces on seamount flanks, ridges and plateaus at water depths that vary from 400m to 7km. These crusts occur almost everywhere there is an exposed sediment-free rock surface. The most promising places to find ferromanganese crusts are mainly on Arctic and Antarctic seamounts. Crust thicknesses range from less than 1mm to approximately 260mm. The thickest crusts occur between water depths of 1.5km and 2.5km, in the area of the outer rim of the seamount summit (Hein, 2011). Most cobalt rich ferromanganese crusts are found at water depths of 800m to 2.2km, in and just below the oxygen-minimum zone (OMZ). They usually precipitate from cold ambient bottom water. They are not extracted commercially at
1 One of the subsea mining systems was later discovered to be a front for clandestine US recovery of a sunken Soviet submarine ([Author excised], "Project Azorian: The Story of the Hughes Glomar Explorer," Studies in Intelligence, Fall 1985, Secret, Excised copy, accessed at http://www.gwu.edu/~nsarchiv/nukevault/ebb305/index.htm)

11
the moment, but there are some potential commercial deposits at depths from 500m to 2.5km (Morgan 2011).
Amongst the most characteristic properties of ferromanganese crusts is their very high porosity, which reaches approximately 60% of their volume. Also, they have an extremely high specific surface area, with a mean value of 325m2/g, and at the same time they show incredibly slow rates of growth (1-5 mm/Ma). These properties are instrumental in allowing for surface adsorption of large quantities of metals from seawater.
Mining of ferromanganese crusts may have major impacts on the surrounding environment �– seamounts tend to be associated with specialised and dense biology (Rogers, 2004), so the obstacles to safe exploitation may be many.
1.5.4 Continental shelf mining
Mining of resources on the continental shelf is relatively common around the world and is at a much more advanced stage than deep seabed mining. Scott (2011) lists some major continental shelf mining classes including:
dredging of aggregates for building; mining of phosphorites for agriculture and other uses; and, mining of marine placer deposits, which have been eroded from the continent. This class includes major operations for tin mining in Indonesia (up to 50m water depth) and diamonds off southern Africa (up to 150m water depth).
1.6 Summary
Several types of seabed resource exist. Each has its own peculiar features and challenges, but a major factor affecting mining decisions is whether the resources occur on seabed controlled by a nation (in the EEZ) or on seabed controlled by the ISA. Although 17 licenses for exploration have been issued by the ISA, no commercial production has commenced on the international seabed. Organisations seeking to exploit seabed resources are choosing other areas to operate.

12
2 Rare Earth Elements
2.1 What are rare earth elements?
Rare earth elements (REEs) or rare earth metals are a set of elements of the periodic table, specifically the fifteen lanthanides plus scandium and yttrium. The lanthanides are a series of elements spanning the atomic numbers 57 (lanthanum, La) to 71 (lutetium, Lu). Yttrium and scandium are often classed with rare earth elements since they tend to occur in the same ore deposits as the lanthanides and exhibit similar chemical properties (British Geological Survey, 2011).
Figure 5: Periodic table of the elements with the rare earths highlighted.
Rare earth elements are commonly divided into two categories, the light rare earth elements (LREEs) and the heavy rare earth elements (HREEs), a separation based on chemical similarity. LREEs span lanthanum to europium, while the HREEs include gadolinium through lutetium as well as yttrium, which is included as an HREE on the basis of its chemical properties despite the fact that it is lighter than the LREEs.
When processed, rare earths often exist in oxide form �– rare earth oxides (REO) are generally the purest form of rare earths and are very thermodynamically stable (Molycorp, 1993). Figures for weights of rare earths may be quoted in either REE or REO; 1 tonne of REE metal is equivalent to 1.17 tonnes REO.

13
2.2 Uses of REEs
2.2.1 Current uses
REEs are used in a very wide range of products. Current usage may be divided into five parts, which consume approximately equal volumes; catalysts, metallurgical alloys, glass and polishing, magnets and other, which includes phosphors and ceramic applications.
Catalysts account for a significant share of the REE market by volume (19 per cent in 2008), but only five per cent of the total market value (British Geological Survey, 2011). REE used in metallurgical alloys accounted for 18 per cent of global consumption by volume, but, similar to the catalysts, less than this by value. Glass and polishing applications were another relatively low value application �– this accounted for 22 per cent of total REE consumption by volume in 2008, although only six per cent by value.
An increasingly important use of REE is in permanent magnets, which account for approximately 21 per cent of the REE market by volume and 38 per cent by value. Permanent magnets utilising REE were first developed in the 1960s when samarium alloyed with cobalt was used. Neodymium-iron-boron magnets were developed in the 1980s and have now replaced samarium-cobalt magnets in most applications. Neodymium magnets are more powerful than alternatives and are therefore used in a wide variety of applications, including earphones, hard disks, wind turbines and hybrid cars.
REE are also commonly used in phosphors. This application accounted for 32 per cent of global consumption by value in 2008, although only seven per cent by volume. Phosphors are important in televisions, computer screens and many other visual display or plasma display panel technologies.
REE oxides are essential in ceramics. Both the strength and toughness of structural ceramics are improved by adding REO (yttrium oxide and cerium oxide in particular) as stabiliser and sintering aids to reduce sintering temperature and production costs. Ceramic applications accounted for six per cent of global consumption of REE in 2008 and three per cent by value (British Geological Survey, 2011).
A table listing the seventeen rare earth elements, their atomic number and symbol, and their main current usages is provided in Table 2. Each element has its own individual applications within the broader fields.

14
Name Atomicno.
Symbol Selected applications
Scandium 21 Sc Light aluminium-scandium alloy for aerospace component, additive in Mercury-vapor lamps
Yttrium 39 Y Yttrium-aluminium garnet laser, Yttrium vanadate as host for europium in TV red phosphor, yttrium iron garnet microwave filters
Lanthanum 57 La High refractive index glass, flint, hydrogen storage, battery-electrodes, camera lenses, fluid catalytic cracking catalyst for oil refineries
Cerium 58 Ce Chemical oxidizing agent, polishing powder, yellow colours in glass and ceramics,
Praseodymium 59 Pr Rare-earth magnets, lasers, violet colours in glass and ceramics, ceramic capacitors
Neodymium 60 Nd Rare-earth magnets, lasers, violet colours in glass and ceramics, ceramic capacitors
Promethium 61 Pm Nuclear batteries
Samarium 62 Sm Rare-earth magnets, lasers, neutron capture, masers
Europium 63 Eu Red and blue phosphors, lasers, NMR relaxation agent
Gadolinium 64 Gd Rare-earth magnets, high refractive index glass or garnets, lasers, X-ray tubes, computer memories
Terbium 65 Tb Green phosphors, lasers, fluorescent lamps
Dysprosium 66 Dy Rare-earth magnets, lasers
Holmium 67 Ho Lasers
Erbium 68 Er Lasers, vanadium steel

15
Thulium 69 Tm Portable X-ray machines
Ytterbium 70 Yb Infrared lasers, chemical reducing agent
Lutetium 71 Lu High refractive index glass
Table 2: Uses of the rare earth elements (Norcomp, 2012).
Finally, it should be mentioned that REEs are used in a variety of ways in the construction of armaments and military equipment. For example, the USA has identified the following uses in their defence forces (Grasso, 2012):
fin actuators in missile guidance and control systems; disk drive motors in aircraft, tanks, missile systems and command and control centres; lasers for mine detection, etc; satellite communications, radar and sonar in naval applications; and, optical equipment and speakers.
2.2.2 Future Uses
Of the current uses, the USGS identifies catalysts, glass industry, metallurgy (excluding battery alloy) and phosphor applications as mature markets and magnets, ceramics and battery alloy metallurgy as developing markets (Goonan, 2011). The latter sectors therefore have significant growth potential in the coming decades.
Predicting future uses of such materials is difficult, however, applications of REEs in magnetic refrigeration, solid oxide fuel cells, water treatment and thorium nuclear reactors have been suggested as future applications.
It is also of interest to consider whether substitutes for REEs may be used �– the USGS asserts that while substitutes are available for REEs they are generally less effective.
2.3 World Resources and Production
2.3.1 Resources and reserves
Two different statistics are used in the mining industry to indicate how much of a mineral may exist for future mining; resources and reserves. The British Geological Survey (2011) defines a resource as �“a concentration of minerals�…that is, or may become, of potential

16
economic interest for the extraction of a mineral commodity�”. In contrast a reserve is �“the part of the resource which has been fully geologically evaluated and is commercially and legally mineable with current technology�” (British Geological Survey, 2011). An accurate figure for global rare earth resources is difficult to find. Figures for reserves, while still uncertain, are more readily available; the USGS estimates total world reserves of rare earth oxides to be about 114 million tonnes (USGS, 2011 �– see Table 3).
Country Reserves (tonnes)
China 55,000,000
Commonwealth of Independent States 19,000,000
United States 13,000,000
India 3,100,000
Australia 1,600,000
Other Countries 22,100,000
World Total 113,800,000
Table 3: World rare earth reserves by country (USGS, 2011).
China has the most abundant REE resources in the world, possessing about 48 per cent of total world reserves. The Bayan Obo bastnasite deposit is the largest deposit in the world and contains reported reserves of at least 48 million tonnes at 6 per cent REO. China also has a large REE resource in ion adsorption-type deposits, which have been estimated to contain more than 80% of the world�’s HREEs. Other countries that host significant REE reserves include the Commonwealth of Independent States (CIA), USA, India and Australia, with 17 per cent, 12 per cent, 3 per cent and 1 per cent of the world total reserves respectively. The remaining 19 per cent of reserves is shared by Canada, Brazil, Malaysia and so on (British Geological Survey, 2011).
REE reserves on land may contain up to 10% REO, although the figure is typically less than 5% and sometimes lower �– for example, ion adsorption deposits in China may contain less than 400ppm (British Geological Survey, 2011). The concentration varies greatly with the mineral, but as different minerals have different ratios of HREE:LREE, locations and

17
extraction methodologies, different grades may be attractive. This explains the interest in ion adsorption deposits; they have a high HREE:LREE ratio and very little radioactive thorium or uranium, which presents environmental problems when extracting REE from other minerals.
2.3.2 Current production
REE production has doubled in the last 20 years, reaching 137 000 tonnes in 2006 before declining slightly. China now dominates world production of REE, having done so since 1988 when it overtook the USA as the largest producer, and now produces more than 95% of world REEs (97% in 2010).
Russia accounts for the only other significant rare earth mine production outside China, with an output of about 2500 tonnes REO in 2010.
Figure 6: Chinese and world production of REO between 1992-2010 (British Geological Survey, 2011).
2.3.3 Future production
A number of new mines intending to produce rare earths are commencing or being considered at present. For example, in the USA, Molycorp is reopening the Mountain Pass mine which was closed in 2002. From 2013, this mine is expected to produce 40 000 tonnes of REO per year (Molycorp, 2012). The Mount Weld project in Western Australia is also scheduled to come online soon; a number of other projects around the world are to follow.

18
2.4 Global Demand and Supply
Historically the balance of demand and supply in the world rare earth market has been fairly stable. However, recently the market has changed and demand shortages are now common. Demand for rare earths is increasing; total Rare Earth Oxide (REO) demand in 2003 was 85 000 tonnes, in 2008 demand was 124 000 (Avalon, 2009) tonnes and in 2010 demand was estimated at 136,100 (Elisabeth, 2010) tons with global production around 133,600 (USGS, 2011) tons annually. The difference is covered by above-ground stocks or inventories. The countries which import the most REE are Japan, the USA, Germany and France.
By 2015, global demand for rare earth elements may reach 210,000 tons per year, according to one estimate. The Industrial Minerals Company of Australia (IMCOA) estimates demand will be 185,000 metric tons in 2015 (Marc Humphries, 2012). This is driven by forecast growth in consumption of REEs in the forms discussed in Section 2.2.1 above.
2.4.1 The role of China
China now dominates world production of REE to the extent that the REE market cannot be understood without considering the role of China. China has reached this dominant position because it has been able to produce rare earths at lower costs due to favourable deposits, weak environmental regulations and cheap labour. In recent years, however, it has become apparent that China is no longer content to merely be a link in Western supply chains, but intends to create domestic REE value-adding industries, including refining and processing facilities �– for example, a Chinese policy document states that �“China makes it a priority to enhance the level of scientific development and utilization of rare earth products�” (Information Office of the State Council, 2012). To increase its own manufacture of high-value products, China�’s government requires foreign companies to move factories to China to produce items using rare earths. As a result of this arrangement, domestic demand for rare earths in China has increased dramatically. The priorities of job creation and production dominance are factors that are likely to result in China continuing this trend.
The Chinese government has put a number of measures in place to attempt to protect and regulate the domestic REE industry �– these policies have a significant impact on exports from China. This includes setting an overall annual export quota, which aims to guarantee adequate REE for the domestic market, and an overall annual production quota, which aims to prevent over-mining of REE. The export quotas started in 2003 and the country has continued to become increasingly stringent and further restrict supplies of rare earths in the export markets. Export quotas for 2010 totalled 20,256 tonnes compared with 50,145 tonnes in 2009, representing a 40 per cent decline. On December 28, 2010, China announced allocations of rare earths quotas of 14,446 tonnes for the first half of 2011,

19
equivalent to a 35% decline relative to the first half of 2010. In order to prevent over-mining and illegal mining, the authorities introduced production quotas in 2007. As of September 2010, the production quotas stood at 83,320 (British Geological Survey, 2011) tonnes.
Due to this situation, China�’s output is estimated to reach 140,000 tons per year (up from 130,000 tons in 2010) in 2015 as China�’s annual demand is estimated to rise from 73,000 metric tons (mt) to 111,000 mt, according to the IMCOA. But the Chinese Rare Earth Industry Association estimates China�’s demand increasing to 130,000 metric tons by 2015. Based on the above estimates, the non-China annual output would need to be between 45,000 mt to 70,000 mt to meet global demand for REEs (Marc Humphries, 2012).
Although new mine production may be able to make up the difference for some lighter elements (there may be an excess supply of the lighter elements such as cerium, lanthanum, and praseodymium), several forecasts show that there will likely be shortfalls of other light rare earths (LREEs) and several heavier rare earth elements (HREEs), such as, dysprosium, terbium, neodymium, europium and erbium. The forecast for global demand and supply for individual rare earths in 2015 is shown in Figure 7 (Matt Gowing, 2011) (Based on total REO demand of 197,000 tonnes and an adjusted supply of 225,000 tonnes).
Figure 7: Forecast for global demand and supply for individual rare earths in 2015.
2.5 Price
REE prices are subject to the forces of supply and demand, and have fluctuated considerably over time. Further, the prices of indivdual REE metals and oxides vary greatly, reflecting

20
their individual uses (see Section 2.2.1) and associated demand. HREE are typically more expensive than LREE due to their lower abundance in most deposits.
Examples of the impact of the impact of the supply-demand balance in setting past REE prices include:
Low REE prices in the early 1990s as growth in Chinese supply growth outpaced demand; Low REE prices in the early 2000s as growth in magnet applications caused increased demand for neodymium and dysprosium which lead to increased mining, and oversupply of other REEs; and, After increasing throughout the mid-2000s REE prices were negatively affected by the global financial crisis, and prices fell in 2008.
However, the largest price fluctuations have been recent, occurring since 2010. China�’s announcement in July 2010 that its export quota for the second half of that year would decline by 70% marked the beginning of a period of substantial price changes. A similar reduction in China�’s export quota for the first half of 2011 forced prices of REEs higher and this trend continued until the beginning of August 2011. In the period between July 2010 and March 2011, cerium oxide increased in price from $6.7 per kg to $101 per kg. In an even shorter time, between July and August 2011, terbium oxide climbed from $700 per kilogram to $4250 per kilogram.
Figure 8: Price trends for selected HREO from 2001 to 2011 (BGS, 2011).

21
Figure 9: Price trends for selected LREO from 2001 to 2011 (BGS, 2011).
In early August 2011 the trend was reversed and REE prices began to fall. This decline has continued throughout 2012. Though there was a slight increase in the average REO price, which strengthened to $144,000 per ton in Feburary 2012, the price fell again in March and April. Now the average price of REO is about $100,000 per ton, the lowest point in the last six months, but still more than three times the average for 2010 before the crisis in supply began when China unexpectedly restricted exports. An REE consultant (TruGroup, 2012) said,
�“Predicting how far prices will fall and when price-stability will return to the market is complex. This is a small niche market, not a situation of supply-demand balance alone - even when this analysis is applied to an individual strategic rare earth such as neodymium, dysprosium or praseodymium.�”

22
Figure 10: Price trends for selected HREO from April 2008 to September 2011.
2.6 Summary
Rare earth elements are used in a huge range of modern technologies. Many applications are in areas that are expected to grow strongly and many rare earths are considered to have strategic importance due to their use in defence technologies. China currently dominates production of REE but mines in other countries are already being opened to try to offset this dominance and take advantage of historically high prices. However, the future balance of supply and demand is still likely to be determined by Chinese policy. Prices of individual rare earths may fluctuate more than the average, depending on the proportions mined and individual applications. Predicting future prices in this environment is difficult, but demand for rare earths will continue for the foreseeable future.

23
3 Resources and exploration
3.1 Rare earth resources on the seabed
Rare earth elements occur in various sub-sea sediments; REE in manganese nodules has been studied by, for example Courtois and Clauer (1980), while REE in seabed sediments was investigated by Murray and Leinen (1993). A study of the occurrence of REE in seabed sediments in the Pacific Ocean by Kato et al (2011) found that REE occurs in elevated concentrations in various locations in the Pacific; and went on to suggest the potential of these sediments as an REE resource. In particular, Kato et al found that the seabed sediments (seabed muds) had high HREE to LREE ratios, an absence of the thorium and uranium content that plagues land deposits of rare earths and that the REEs could be simply removed from the muds by acid leaching.
Figure 11 shows the locations of the sites tested by Kato et al, and the maximum total REE concentrations found at each site. Kato et al identified two areas as being particularly promising; the eastern South Pacific and central North Pacific. The clusters of high-REE samples in these locations may be seen in Figure 11 �– around sites 76 and 1222 respectively.
Figure 11: Seabed REE concentrations at tested sites in the Pacific with total REE concentration above 400ppm (data from Kato et al, 2011).
It is of interest to consider which of the sites studied by Kato et al has the most exploitable potential. Of the two main areas recommended, the eastern South Pacific is notable for

24
having higher concentrations (generally 1000-1500ppm) in shallower deposits, with the maximum concentration at or close to the seabed while the central North Pacific has lower concentrations (generally 500-1000ppm or less) in deeper deposits (up to 70m below seafloor) with the maximum concentration 10m or more below the seabed. When considering extraction of these minerals from this perspective, the eastern South Pacific appears more attractive due to the higher grades and the shallow nature of the deposit.
A critical point in considering exploitation of these resources, as the discussion in Section 1.4 shows, is the location of the sites relative to EEZ boundaries. Figure 12 therefore shows the most interesting sites examined by Kato et al (those with REE concentrations greater than 400ppm) plotted on a map of the Pacific with EEZ boundaries visible. It is immediately apparent that most of the sites fall outside EEZ boundaries, and in many cases, a long way outside. Those that fall firmly within EEZ boundaries have been labelled, as have the EEZs in which they fall.
Figure 12: Sites with REE concentration > 400ppm studied by Kato et al (2011) displayed relative to EEZ boundaries.
Sites 311 and 869 occur in the EEZs of the USA (Hawaii) and the Federated States of Micronesia, respectively, while sites 76 and KH71-5-15-2 occur in the EEZ of French Polynesia. The remainder of the sites occur in the Area. The approximate maximum REE concentrations at the four EEZ sites are respectively 800ppm, 800ppm, 1700ppm and 1300ppm. In addition, the higher concentrations of REE at site 869 are restricted to a thin layer at the surface, although the information at site KH71-5-15-2 is limited to a similar depth. Sites 311 and 869 are also somewhat isolated from the bulk of the samples with high concentrations. On the basis of this information the French Polynesian EEZ around sites 76

25
and KH71-5-15-2 appears to be the most promising area of the Pacific seabed under national control.
Sites 76 and KH71-5-15-2 belong to the eastern South Pacific area and the EEZ of French Polynesia. Some sites adjacent to the eastern boundary of French Polynesia (notably sites 75 and 597) have higher maximum REE concentrations, but the deposits occur only in a very thin (~1m) layer at the surface. Based on the information outlined here and in the paragraphs above, it is concluded that the most promising known site for extraction of REEs from the seabed in the Pacific basin is the French Polynesian EEZ in the regions of sites 76 and KH71-5-15-2 and it is this region that is the focus of this report.
3.2 Resource
The locations being considered are centred around two sites of geological sampling, as displayed in Table 4.
Site Latitude Longitude Water depth (m) Length of study core (m)
Drilled by (year drilled)
76 14°05.90'S 145°39.64'W 4,598 27.1 Deep Sea Drilling Project (1969)
KH71-5-15-2 20°23'S 148°02'W 4,615 0.72
Ocean Research Institute,
University of Tokyo (1971)
Table 4: Properties of the core locations being studied.
The rare earth content of both samples was analysed by Kato et al (2011). Figure 13 and Figure 14, taken from Kato et al, show the depth profile of the total REE concentration with depth at each site.

26
Figure 13: Depth profile of total REE concentration at site 76 (Kato et al, 2011).

27
Figure 14: Depth profile of total REE concentration at site KH-71-5-15-2 (Kato et al, 2011).
There are substantial differences between the sites; firstly and most obviously, Site 76 was drilled to approximately 27 metres below seafloor (mbsf) while in KH71 the sample extends to only 0.72mbsf. Further information is needed at KH71 to establish what the depth profile of REE below this level is.
An average REE concentration for each site may be roughly calculated from this data �– the values so obtained are displayed in Table 5. For site 76, the average is taken over the top 5m of the seabed, as this is the zone with the highest REE concentration. For site KH-71-5-15-2, all values are used.
Site Depth range (mbsf)
Average REE content (ppm)
76 0-5 1300
KH71-5-15-2 0-0.72 1000
Table 5: Average REE contents of the two cores.
A further point of interest is the relative proportion of the different REE �– this information was not provided by Kato et al on an element by element basis, however, this paper did state that the total HREE content in the eastern South Pacific region in which these sites occur was between 200 and 430ppm.

28
3.3 Bathymetry
3.3.1 Acoustic methods
Bathymetric information, which might also be termed seabed topography, refers to the detection of information about the physical location and form of the seabed. Early bathymetric surveys were completed with �“lead lines�” dropped over the side of ships, but this field has now moved to be completely dominated by acoustic methods, also known as SONAR (SOund NAvigation and Ranging). Acoustic methods are ubiquitous in marine applications, since electromagnetic radiation is rapidly attenuated in the ocean, so radio waves, visible light, etc, which are used extensively in air are of little use.
Acoustic methods produce low frequency sound waves which are reflected from solid obstacles (i.e. the seabed) and the return signal detected by a receiver, enabling a calculation of the distance to the obstruction to be performed (Lurton, 2002). In particular, three types of equipment are common: single beam sonar, multibeam sonar and side-scan sonar.
Single beam echo sounder �– single beam sounders send an acoustic signal vertically below the ship which returns local depth information. They are typically used for navigation and in applications like fisheries (schools of fish reflect the beam) but in mapping applications they have largely been superseded by multibeam sonars. Multibeam sonar or multibeam echo sounder (MBES) �– this technology uses a number (perhaps 100-200, Lurton, 2002) of sound beams to insonify a large width of seabed either side of the source vessel. As the source moves forwards, multibeam sounders provide bathymetric information along a swath of seabed. Ship based multibeam sounders are used to map shallow water (higher frequency source) or deep water (low frequency source) where large scale mapping is required. For more detailed mapping smaller systems are used either in towed or AUV form. Accuracy can be +/- 0.2m at 50m range (i.e. height above sea floor �– Kowalczyk, 2011). Sidescan sonar - these devices provide acoustic images of the seabed. They may be used to reveal the shape of the seabed (or something on it). Some information about the geological nature of the seabed may be gained from considering the reflectivity of the signal �– bottom sediments will reflect less energy than a rocky seabed. Sidescan sonars are typically deployed on towed �‘fish�’ so that the sonar is close to the seabed �– the angle between at which the sonar beam hits the seabed must be small for best performance (Lurton, 2002). Although originally designed for imaging the seabed, some sidescan sonars now have bathymetric capability.
Two other applications of acoustic methods should be noted here: sediment profilers and acoustic positioning. Sediment profilers (or sub-bottom profilers) are essentially single

29
beam echo sounders which operate at low frequencies and aim to capture information about the layering of sediments beneath the seabed (Lurton, 2002). Typically these will be ship mounted and will provide information down to several 10s of metres below seabed.
Acoustic positioning may be used during underwater operations to accurately locate equipment on the seafloor or below the surface of the sea (e.g. an AUV) by placing sonar transmitters on the seabed and receivers on the objects of interest. A couple of different configurations are common; long baseline systems use a network of seabed beacons and a single receiver on each object to be located while short baseline systems use a single seabed beacon and multiple receivers on the object to be located (ultra-short baseline systems use a single receiver made up of an array and are an extension of short baseline systems).
3.3.2 Existing bathymetric data
For any seabed venture it is important to have good knowledge of the seabed topography �– i.e. detailed bathymetric information. In seeking such data it is important to first understand what data is already available in the region of interest.
A systematic effort to understand the resources, mineral and biological, of the EEZ of French Polynesia was the ZEPOLYF (Zone Economique de la POLYnesie Francaise) program, which ran from 1996 to 2003 (Le Visage et al, 1998). A major objective of this program was collection of bathymetric data, although the focus was generally on features of the seabed like seamounts and superswells that occur in shallower waters than are of interest here. Two publicly available bathymetric data sets were released, one by Bonnenville and Sichoix (1998) and one by Jordahl et al (2004). We have obtained the Jordahl et al information, which is available on a 0.005 degree grid. This data set used a compilation of any available multibeam bathymetry (65 expeditions) and satellite altimetry bathymetric predictions in areas where multibeam bathymetry was unavailable. This bathymetric data is displayed in Figure 15 to Figure 17 below. No multibeam bathymetry was available around the sites of interest.

30
Figure 15: Bathymetric data for French Polynesia from Jordahl et al (2004). The boxes 1 and 2 refer to the areas displayed in Figure 16 and Figure 17 respectively.

31
(a) (b)
(c) (d)
Figure 16: a) Contour map of the region of site 76; b) Shaded map of the region of site 76; c) Contour map of the immediate location of site 76; d) Shaded map of the immediate region of site 76

32
(a) (b)
(c) (d)
Figure 17: a) Contour map of the region of site KH71-5-15-2; b) Shaded map of the region of site KH71-5-15-2; c) Contour map of the immediate location of site KH71-5-15-2; d) Shaded map of the immediate region of site KH71-5-15-2.
3.4 Resource mapping
Very little information about the REE resource under consideration is available. Any seabed mining venture will require knowledge of the areal and depth extent of the REE rich sediments, so that maps and reserve estimates can be completed.
The existing cores were taken by dedicated research vessels �– site 76 by the DSDP�’s Glomar Challenger and KH71 by the University of Tokyo�’s Hakuho Maru. Deep sea drilling ships like this could be used to characterise the REE deposit, by taking core samples

33
which could then be analysed in a ship- or shore-based laboratory. However, deep sea drilling ships may be too expensive for such a task. As Freudenthal and Wefer (2009) state �“�…these special vessels are expensive and their operation is not time effective when only short drilling (<150 mbsf) is required.�”
In the current application the existing cores indicate that only extremely shallow drilling (<10mbsf) is required, so alternative approaches have been investigated.
3.4.1 Seabed investigation - deployment
In considering new methods for characterising the seafloor REE resource speed/cost and accuracy must be balanced. The most accurate REE concentrations will be obtained from cores taken to the surface and analysed in a ship and/or laboratory based facility with high precision instruments. However, as identified above, taking shallow sediment cores with a drill ship is inefficient. The approach taken here is therefore to consider a mixture of geophysical methods which do not require taking a sample, correlated and benchmarked against some physical samples. Ideally these could be performed by the same instrument, which could take multiple samples in different seafloor locations before returning to the surface.
It is important to recognise that any geophysical sampling must be done at multiple depths at each site �– the depth profile of the resource is as important as the spatial extent. This suggests the use of a cone penetrometer test (CPT)-based instrument. The CPT is a tube with a (generally) pointed conical end which is pushed into the soil to measure soil resistance and determine soil type. Such technology has already been used on land; for example, Elam et al (2000) describe the use of an X-Ray Flourescence Spectrometer deployed from a truck-mounted CPT capable of investigating heavy metals in sediments down to 50m below the surface.
Three subsea technologies suggest themselves for transport and deployment of the CPT and coring rig;
Autonomous Underwater Vehicle (AUV); Autonomous seabed crawler; and, Remotely Operated Vehicle (ROV).
Aspects of these three technologies are discussed below.
AUVs are common in subsea oceanographic investigations and may be deployed with a variety of sensors to gather data about properties of sea water and the seabed and underlying material (e.g. Griffiths and McPhail). However, deploying a CPT from an AUV poses some

34
problems, as most AUVs are designed to be neutrally buoyant. This has three consequences that make the AUV unsuited for this task:
Being neutrally buoyant the AUV cannot exert a significant downwards force on the CPT without anchoring itself to the seabed or losing its neutral buoyancy; The AUV will have a limited power supply, as batteries are heavy; and The AUV will have limited capacity to carry samples.
Against this, if an AUV CPT rig could be designed to overcome these challenges it could cover large areas more quickly than the other technologies.
Seabed crawlers are common in various applications and have been used with CPT rigs in surfzone investigations where floating or buoyant vessels are compromised (Gardiner and Miles, 2006). The seabed crawler would have plenty of weight to work against when pushing the CPT and could carry sufficient batteries for longer operation. However, its progress over the seafloor would be slow and uncertain if the terrain was unexpectedly rough.
ROVs fitted with CPT rigs have already been developed. For example, geomarine2 advise that they can supply a CPT rig which can be mounted on a 100/150 horsepower ROV and is rated to take CPTs up to 3m long at depths of up to 1000m. The ROV, being connected to a vessel above has fewer power limitations, and has systems to mobilise sufficient force to take a CPT (to shallow sub-seabed depths). The ROV can travel from site to site without being recovered at greater speed than the crawler, and, importantly, is a more commercialised technology. ROVs capable of working at the required depths are available, and CPT rigs have been designed for deep water applications. The ROV is therefore the chosen platform for CPT and core deployment.
3.4.2 Seabed investigation �– geophysical methods
A number of geophysical methods for the detection of REEs may be employed in the CPT-based method being considered. Those considered here are:
X-ray fluorescence spectroscopy (XRF); and, Laser-induced breakdown spectroscopy (LIBS).
XRF may be performed in-situ or in a laboratory; while accurate quantitative analysis must still take place in a laboratory, many examples now exist of field applications of XRF. XRF measures X-rays emitted by relaxation of electrons from an outer to an inner orbital to take the place of an inner electron displaced by initial X-ray excitation. The frequency of an
2 http://www.geomarine.co.uk/

35
emitted X-ray identifies the element from which it came, while the intensity may be used to determine the concentration (Stallard et al, 1995).
Examples of XRF field applications include cone penetrometer deployment for heavy metal detection (Elam et al, 2000), deployment using a small AUV for study of heavy metals in marine sediments at the seabed in shallow water (Breen et al, 2011) and use of handheld XRF units in quantifying the REE concentration in cores taken from the Nechalacho Deposit in Canada by Avalon Rare Metals (Bakker et al 2011). In this latter application it should be noted that the Ce concentration was used to estimate the concentration of the LREE and Y to estimate the concentration of the HREE, a similar calibration exercise would likely be useful in any subsea deployment.
XRF has already been used in CPT rigs, subsea applications and REE estimation, so appears to be well suited for the exploration task at hand. However, when working at depths of ~4500m the environment is significantly more challenging than in the shallow sea or on land �– in particular, the pressure is very high (~45MPa). This may impact the usefulness of the XRF because the XRF requires a special window, nearly transparent to X-rays, to allow the outgoing and incoming beams to pass through the penetrometer tube while protecting the delicate sensors inside. These windows are made of special material which absorb little X-ray energy (e.g., boron carbide in the case of Elam et al), and it may be challenging to develop a window to withstand the desired pressure without unduly affecting sensor accuracy (Croudace, I., pers. comm.).
Figure 18: Schematic of truck-mounted CPT rig with XRF (Elam et al, 2000)
36
Laser induced breakdown spectroscopy uses a pulsed laser, focused through a lens, to generate plasma in the sample. The excited atoms in the plasma then emit characteristic wavelengths of light, which are detected and interpreted to yield information about the elements present in the sample. As with XRF, the wavelength of the various components of the emitted light spectrum gives qualitative information, while the intensity gives quantitative information (Cremers and Radziemski, 2006).
LIBS measurements may be taken with no sample preparation, so are ideally suited to field applications, although the lack of sample preparation must be considered in calibration when seeking to undertake a quantitative analysis (Cremers and Radziemski, 2006). A CPT-deployed LIBS instrument was designed by Theirault et al (1998) for land-based applications, with fibre optic cables carrying the laser signal from the laser to the probe and returning the spectral information. Commercial LIBS probes for working underwater are available (e.g. Applied Photonics�’ LIBSProbe 100S) although these have not been deep sea tested. LIBS has been used to detect elements in seawater at pressures up to 27MPa (Michel et al, 2006).
Figure 19: Schematic of the LIBS set up (Theirault et al, 1998).
As with XRF, in field applications for resource quantification a single element may be used to indicate the concentration of the rest of the series of LREE or HREE. Cremers and Radziemski (2006) give a table with detection limits compiled from laboratory results in the

37
literature. The detection limits for Y and La, for example, are 2 and 10ppm, respectively, more than suitable for rare earth exploration, though chemical and physical properties of the sample may change these limits. Importantly, the LIBS apparatus, and in particular the probe window, are more rugged than the XRF equivalents �– LIBS has seen applications on Mars. Another advantage is that LIBS could be combined with another laser technique, Laser Raman spectroscopy, with little additional equipment.
Discussions with one group (Croudace, I. and Applied Photonics, pers. comm.) indicate that there is ongoing interest in developing a deep sea LIBS probe appropriate for gathering geochemical data. One challenge in this task is to create a plasma at the high pressures at the deep seabed. This may be achieved by using a double laser pulse, or by releasing a gas bubble from the probe. On the basis of its greater robustness the LIBS instrument is preferred.
Either technique (LIBS or XRF) would need to be calibrated against more accurate, laboratory measurements of cores collocated with the CPTs. Conventional XRF, ITRAX XRF or ICP-MS could be used for this task. The ITRAX XRF would allow continuous sampling of the core (Croudace et al, 2006), while ICP-MS would be the most accurate for this task (Kato et al, 2011).
3.5 Exploration plan
As described in Section 3.1, this report is specifically interested in the feasibility of extracting Rare Earth Elements from the areas around the DSDP site 76 and site KH71-5-15-2 reported in Kato et al (2011), which are in the French Polynesian EEZ. In considering harvesting of REE from these sites, the limited nature of the available information means that any program which seeks to collect these resources must first seek to confirm and quantify what is there. To this end, this section outlines stages in a plan for exploration of these areas �– a more detailed plan is not practical, as each stage of exploration must inform the subsequent one.
Stages of exploration:
Coarse bathymetry and sediment profiling to establish seabed topography and how representative these sites sediment layering are of the surrounding areas; Sediment coring at wide spacing (with an ROV operated drill or drill ship) �– an opportunity to calibrate LIBS? ROV CPT LIBS with calibration cores on a finer grid; fine bathymetry (+/-0.2m ?), possibly utilising the same ROV.

38
4 Location for study �– French Polynesia
4.1 French Polynesia - general information
French Polynesia consists of over 130 islands located in the middle of the south Pacific. The land area of these islands is 4,167 km2 and the area of sea within the Exclusive Economic Zone (EEZ) is about 5,000,000 km2 �– the world�’s largest EEZ area per capita (Jordahl et al 2004). In 2010, the population of French Polynesia was 273,000 people, over 68 percent of whom lived on Tahiti Island. The main industries in French Polynesia are tourism, pearl harvesting, agricultural processing and military assistance, but unemployment is high at 13 percent.
Papeete, located on the western side of Tahiti, is the capital of French Polynesia and had a population of 29,900 people in 2007.
Figure 20: Location of French Polynesia.

39
Figure 21: Tahiti island map
4.2 French Polynesian law
French Polynesia is a semi-autonomous territory of France. French Polynesia was a protectorate of France from 1842, and the country was an overseas territory of France from 1946 before becoming an overseas collectivity (COM) of France in 2004. Overseas collectivities are first-order administrative divisions of France, meaning that the relationship is somewhat complex. In 2004 an �“Organic Law�” established the relationship between the two entities; French Polynesians were granted the right to vote in French presidential elections, whilst the Government of France could exercise influences over policy areas such as education, security and defense. French Polynesia has its own President and an Assembly of 57 members, however, independence from France is a fraught issue. France has the power to oppose the execution of the laws of French Polynesia.
4.2.1 EEZ and environmental law
The 2004 �“Organic Law�” governing the devolution of powers to French Polynesia states that:
�“La Polynésie française réglemente et exerce le droit d'exploration et le droit d'exploitation des ressources naturelles biologiques et non biologiques des eaux intérieures, en particulier les rades et les lagons, du sol, du sous-sol et des eaux sur-jacentes de la mer territoriale et de la zone économique exclusive dans le respect des engagements internationaux.�”
�“French Polynesia reserves the right to explore and the right to exploit the natural resources, biological and non-biological of the interior waters, in particular in harbours

40
and lagoons, of the soil, sub-soil and adjacent waters of the territorial sea and the exclusive economic zone with respect to international obligations.�”
In other words, the French Polynesian government has control over its EEZ.
Any large project taking place in French Polynesia is required to complete an Environmental Impact Assessment, as laid out in the Environmental Code. This will be assessed by the Direction de l�’environnement.
4.3 French Polynesian society and the ocean environment
French Polynesian society is intrinsically linked to the ocean. The major industries of tourism and pearl harvesting are ocean based, transport is often by sea and the history of the native people is one of intimate association with the sea. In addition, French Polynesia is one of the world�’s most desirable holiday destinations, and so the conditions of French Polynesia and its marine environment are highly sensitive and exposed around the world.
These days the pearl industry, which in the past has traditionally been a large source of income, is in decline, and attempts to revive it by diversifying export markets and launching a new pearl brands have not worked. In the context of the agricultural and tourism industries, REE mining is potentially a big opportunity. In this context Nautilus�’ example of community consultation should be remembered; local stakeholders should be consulted at every stage, and openness to the scientific community should be encouraged.
The French testing of nuclear weapons at two atolls in French Polynesia is a serious issue that has affected relations between the collectivity and the sovereign state since areound the 1970s. Between 1966 and 1974 nuclear tests were conducted in the atmosphere at Fangataufa, and between 1975 and 1996 nuclear undersea tests also took place at Moruroa atoll. This context must be noted, as it has influenced French Polynesia�’s attitude towards sovereign power over their territory and, in particular, the seabed and EEZ.

41
Figure 22: Locations of French nuclear testing in French Polynesia.
4.4 Practicalities of mining seabed minerals
Any company seeking to exploit REE in the territory of French Polynesia needs to understand the political situation of French Polynesia. Companies should avoid situations in which the intervention of the French government is required between the company and the French Polynesian government over a contract. If intervention were necessary, the French Government should be limited to their rights as an observer. A lot could also be learned from the case of the Solwara 1 project in Papua New Guinea. The company can get permits for mining and environmental approval and follow the legislations of French Polynesia. French Polynesia should adopt laws or systems from neighbour countries or international organizations if it doesn�’t have sufficient laws or systems, though in this case the source is likely to be France.

42
Figure 23: Contract relations for seabed mining in French Polynesia.
4.4.1 Marine protected areas in French Polynesia
There are nine marine protected areas in French Polynesia (Table 6: Marine protected areas in French Polynesia.); eight national designated areas and one international designated area. The IUCN (International Union for the Conservation of Nature) protected area categories are used as a global scale by national governments and international bodies. Category IV means that the area is classified as a habitat/species management area. These protected areas should be sufficiently controlled to guarantee the maintenance, conservation and restoration of particular species and habitats. UNEP-WCMC (United Nations Environment Programme �– World Conservation Monitoring Centre) which was established in July 2000 and is the world�’s most important intergovernmental environmental organization is monitoring MPAs of the world including these nine areas in French Polynesia. The two sites being considered in French Polynesia are far from these protected areas.
Name of protected area
IUCN Category
DesignationType
EnglishDesignation
Ilôt de Sable IV National Natural Reserve
Eiao Island IV National Natural Reserve
Hatutu Island Reserve
IntegraleIV National Strict Nature Reserve
Taiaro IV National Strict Nature Reserve

43
MohotaniReserve
IntegraleIV National Natural Reserve
Atoll de Taiaro Not Applicable International UNESCO-MAB Biosphere Reserve
Taiaro Atoll Nature Reserve IV National Strict Nature Reserve
Bellinghausen(Motu One) IV National Territorial Reserve
Scilly Atoll Reserve IV National Territorial Reserve
Table 6: Marine protected areas in French Polynesia.

44
5 Environment
5.1 Introduction
This chapter has two objectives; to survey the existing environment in the area of interest and to consider the main ecological impacts that a seabed mining operation could have on this environment. Finally, some recommendations are made.
5.2 Abyss biology of the eastern South Pacific Ocean
Any seabed mining operation must take note of the environment in which it will operate. In this section the morphology and geological characteristics of the seabed and the characteristic benthic communities in this area will be analysed. Benthic species are those that live on or in the seabed.
Depth is a critical parameter in the ocean; in assessing the environmental impacts of seabed REE mining at the sites of interest in French Polynesia it is important to note that the depth of the sites of interest is around 4500m. This means that any seabed mining activities will be performed in the abyssopelagic biological zone, which generally extends from 4000m downwards and is the deepest zone of the water column (IOC, 2009). This zone is characterized by a high degree of stability, in terms of temperature (mean value of 2oC), a low rate of sedimentation, extremely low light penetration and a limited supply of nutrients.
The sites of interest in our research are centred around the sample locations discussed in Chapter 3; these sites are given again in Table 7.
Site Latitude Longitude Water depth (m)
76 14°05.90'S 145°39.64'W 4,598
KH71-5-15-2 20°23'S 148°02'W 4,615
Table 7: Sample locations indicating regions of interest
5.2.1 Seabed habitat parameters
Several habitat variables play key roles in regulating the nature and abundance of life on the deep sea floor. These include (1) the substratum type (rocky versus soft sediments), (2) near-bottom current velocities, (3) bottom-water oxygen content and (4) the vertical flux of particulate organic carbon to the seafloor.
1) Substratum type: controls many characteristics of the deep sea benthos, including predominant taxa (classification groups of organisms), mobility patterns and feeding types. Hard, rocky substrata are frequently dominated by sessile (i.e. attached to the seabed)
45
suspension-feeding sponges, cnidarians (jellyfish, anemones, etc) and foraminifera (ubiquitous marine protozoans, see Section 5.2.3). In organic-poor soft sediments mobile, deposit-feeding worms such as polychaetes are usually found. On the other hand, in organic-rich sediments tube-dwelling polychaetes are more common.
Most of the deep Pacific seafloor is covered with soft sediments poor in organic carbon (�“food limited�”). At depths greater than 4000m, in the central gyres of the North and South Pacific, the sea bed consists mainly of red clay, which is extremely poor in organic material (< 0.25% organic carbon).
2) Near bottom currents: influence the nature of benthic habitats. Currents in the relatively flat areas of the deep Pacific seafloor, such as the vast regions of abyssal hills, are generally sluggish, imposing shear stresses inadequate to transport most sediment types.
3) Bottom-water oxygen: oxygen serves as electron acceptor for oxidative metabolism. When bottom-water oxygen concentrations fall below 0.5 ml/L in the deep sea, oxygen availability affects the benthic community structures addressed in such depths. n the eastern tropical Pacific area there is a minimum-oxygen zone at depths between 100 and 1000m. This zone results from the oxidation of organic particles sinking through the water column from the euphotic zone. Around the sites of study, bottom waters are well oxygenated (~3.7 mol O2 L-1) and sediment pore waters typically contain oxygen to tens of centimeters below the sediment-water interface.
(4) Sinking flux of particulate organic carbon to the seafloor: the primary source of food material for deep-sea communities, excluding hydrothermal vents and cold seeps, is the rain of organic particles, ranging from individual phytoplankton cells to carcasses of nekton, sinking from the euphotic zone. The primary productivity of organic matter in the euphotic zone and the depth of the water column are two factors that affect the total sinking flux on the ocean floor. The following figure shows the ratio of the sinking flux of particulate organic carbon to primary productivity in the euphotic zone as related to water column depth.

46
Figure 24: (a) Ratio of the sinking flux of particulate organic carbon to primary production in the euphotic zone (above the wavy line) as related to water column depth, based on sediment-trap studies in the world ocean (data points). (b) Patterns of flux of particulate organic carbon at the seafloor along approximately the 140oW meridian in the abyssal equatorial Pacific. Squares indicate flux estimates from the rain of particulate organic carbon into deep sediment traps and circles indicate flux estimates from sediment oxygen consumption (i.e. seafloor respiration) (Smith & Demopoulos 2003).
In the central gyres of the Pacific ocean, where the water column is deep (>5000m) and annual primary production very low, the particulate flux of organic carbon may be as little as 0.3g C m-2 y-1. The limited flux of particulate organic carbon in the region of the abyssal equatorial Pacific in the 140oW meridian is presented in Figure 24 (b). From the figure it can be concluded that the organic flux in the abyss at around 14oS & 140oW is about 0.3-0.4 g m-2 y-1. Net sedimentation at such depths is extremely low, with sediments accumulating at ~1 m yr-1.
In summary, the seabed habitat at our sites of interest is soft red clay with low nutrient content and high dissolved oxygen �– these conditions are given the name oligotrophic. Bottom currents are also expected to be weak. These conditions are common on the abyssal seafloor.
5.2.2 Abyss communities
The largest creatures living at the surface of the seabed (epibenthic megafauna) of the oligotrophic abyss are generally deposit feeders in the form of xenophyophores (giant single

47
celled organisms) and the holothurians Amperima (sea cucumbers), but suspension feeding cnidarians are also important. Sediment dwelling animals greater than 2mm size (macrofauna) in the oligotrophic abyss are very sparse, diminutive in body size and diverse. Mean macrofaunal body size is very small, around 0.07mg, while the total macrofaunal biomass is around 0.02-0.12 mgm-2. The biodiversity at oligotrophic benthic sites is high but the number of macrofaunal species in any unit area of seafloor is relatively low.
An abundant species found in such regions and depths is the protozoan Foraminifera which is found in macrofaunal and meiofaunal (smaller than 0.5mm) size (around 50% of meiobenthic community). Foraminifera are unicellular protozoa that bear a shell with small holes through which pseudopodia project. Foraminifera species are divided into planktic and benthic, the former inhabiting the upper few hundred meters of the ocean and the latter the ocean bottom. Their diameter is usually less than 1mm, but larger species may reach a diameter of 20cm. Also, in these sites prokaryiotic nanobiota of a diameter around 10 m may be traced. Meiofaunal and nanofaunal biota seem to dominate metabolic procedures. Thus, under extremely oligotrophic conditions, the smallest size classes of benthos appear to be of greater importance in the recycling of organic matter on the deep sea-floor (Smith & Demopoulos 2003).
Figure 25: Species found at the abyssal seafloor in French Polynesia.
The distribution of species with depth is important. Although in a different basin, Ingole et al (2005) found a steady decline in faunal density with depth and that two-thirds of macrofauna were located in the top 5cm of the sediment.
Suspension
feeders

48
In sum, the biomass at the sites of interest is low, although diversity may be high. Biomass is expected to decline with depth.
5.2.3 Abyss lithology
The sediments encountered on the seafloor in this region of the Pacific Ocean are generally soft oozes or clays, overlying rocks ranging from firm chalks to limestone, chert and basalts. A summary of sediments found on the ocean floor in French Polynesia is presented in Table 8.
Property ORGANIC ELEMENTS PREDOMINATE
MINERAL CONSTITUENTS PREDOMINATE
Sediment type Calcareous Oozes
(Contain skeletons made of CaCO3)
Siliceous Oozes (Contain skeletons made of
Si)
Red clay (Less than 30% biogenic
material)
Composition
> 30% calcareous microscopic shells of foraminifera, coccolithophores and pteropods
> 30% siliceous microscopic shells of plankton
Sediments that remain after dissolution of both calcareous and siliceous biogenic particles while they settle through the water column
Proportion of world seabed Cover 48% of world seabed Cover 15% of world seabed Cover 38% of world seabed
Accumulation rate
Fast, ~ 0.3-5cm/1000yr
Intermediate, ~ 0.2-1cm/1000yr
Slow ~ 0.1-0.5cm/1000yr
Contents
Globigerina ooze: Contain shells of planktonic Foraminifera Coccolithophore ooze: shells of microscopic CaCO3 plates Pteropod ooze: Contain shells of pelagic mollusks
Radiolarian ooze: Brown clay with more than 30% of the skeletons of warm-water protozoa Diatom ooze: tiny shells of diatoms
The bulk of red clay consists of Aeolian dust. They might also contain volcanic ash and residues of siliceous microfossils.
Locations
Globigerina oozes exist in Atlantic, Indian and Pacific Ocean. Coccolithophore oozes exist in all oceans. Pteropod oozes exist primarily in the mid-Atlantic but may exist in the French Polynesia region (Shipek 1960)
Exist only where the rate of deposition of diatoms or radiolarians is greater than the rate at which their Si content is dissolved in the deep waters. The diatom oozes are confirmed to belts in the North Pacific. The radiolarian are found at NEP (north-east Pacific)
Exist in areas with little planktonic production. They were transported into the deep ocean in suspension, either in the air over the oceans or in surface waters.
Table 8: Pacific Ocean floor pelagic sediments in the French Polynesia Region (Hays et al 1972a;b).

49
Table 8 indicates that the rate of accumulation of biogenous sediment predicts which sediment type may be encountered. The accumulation rate is dependent on the productivity of the overlying surface waters and in the equatorial Pacific is higher at the equatorial divergence and drops off to the north and south. Consistent with this observation is the fact that, according to Shipek (1960), red clay is the predominant sediment in the French Polynesia region.
Red clay sediments are extremely fine grained (median grain size < 2 m) and consist mainly of silica (SiO2, ~45%) and alumina (Al2O3, ~14%). The red color of the clay is due to the high proportion of Fe2O3 (~7%), while zeolite (Al2SiO5) and iron oxides in the form of goethite (FeO(OH)) are also present (Clarke 1907).
Following these general statements, the nature of the sediments at site 76 should be examined for comparison. Site 76 was cored to a total depth of 27.3m below the seafloor, however, the elevated REE concentration was only in the upper 5m of the sediment, so only the 1st unit of site 76 (down to 9.1mbsf) will be analysed here. The components of the 1st unit were (Hays et al, 1972b):
Dusky brown phillipsite clay mud (75-85% of the unit) �– massive �“red clay�” muds with no visible laminations; and, White to very pale orange allochthonous carbonate debris beds consisting of carbonate rock fragments and sands (15-20% or 5-90cm in thickness) which contain foraminiferal clasts up to 5cm in maximum diameter. Some contain very pale orange foraminiferal - calcareous nannofossil ooze. These beds have very low mud content.
5.3 Environmental Impacts
In general, during the mining process, there will be impacts with varying potential to cause environmental harm. It is most important to consider �‘significant adverse environmental impacts�’ that can be defined as:
important harmful changes in ecosystem diversity or the productivity of biological communities in the environment; threat to human health through direct exposure to pollutants, or through consumption of exposed aquatic organisms; or, important loss of aesthetic, recreational, scientific, or economic values (EPA 1972).
Some well documented environmental impacts are presented in Table 9.

50
Impact Impactedarea
Duration1 Near-field or far-field Recovery2 Significance3
Physical impact to seabed material
Seabed Long-term Near-field Slow High
Accumulated plume effect
Water column
Long-term Near-field Slow High
Re-sedimentation Seabed Long-term Near and far-field Slow High
Nutrition hindrance Seabed Long-term Near-field Slow Low
Thrusters Water column
Short-term Near-field Rapid Low
Expelling fish and marine mammals
Water column
Short-term Near-field Rapid Low
Light reduction Surface layer Short-term Near-field Rapid Low
Light intensity and quality reduction
Surface layer Short-term Near-field Rapid Low
Exhaust Surface layer/Air
Short-term Near-field Rapid Low
Noise Air/Seabed Short-term Near-field Rapid Low
Interference with commercial fishery
Water column
Short-term Near-field Rapid Low
Collision Surface Short-term Near-field Rapid Very low
Loss of mining ship Seabed Long-term Near-field Slow Very low
Loss of seabed system
Seabed Long-term Near-field Slow Very low
Table 9: Environmental consequences of deep seabed mining (Berge et al, 1991).

51
Notes: 1 Duration. Short-term: disturbance on a short-time scale, in the order of weeks; Long-term: disturbance over a longer period of time, in the order of years. 2 Recovery. Rapid: impacted environment will recover within months; Slow: environment will recover more slowly, with recovery to normal state taking years. 3 Significance: Low: not considered to cause any severe disturbance to the environment; Moderate: considered to cause a noticeable effect on the environment, but no major problem to the community in the environment in question; High: considered to cause severe harm to the environment; further studied needed prior to full-scale commercial mining.
The following sections deal with various potential environmental impacts from seabed mining.
5.4 Suspended sediment
Aside from the unavoidable impact on benthic communities in the sediment to be mined, one of the most common effects of deep-sea REE mining is sediment suspension in the water column, with associated impacts. The impact is greater inside the local mining region, but suspended sediments may be carried by sea currents out of the immediate area, either vertically or (more likely) horizontally through the water column. Plumes of sediment are associated with an increase in seawater turbidity and will eventually deposit the sediment in a new location. These processes could disrupt local benthic communities.
5.4.1 Suspended sediment processes
The sediments at site 76 are fine grained; excavation of such fine sediments will cause sediments to be resuspended and redistributed on the ocean floor, affecting the benthic and lithographic characteristics of the region.
Plumes may also be created during disposal of REE-depleted mud, or tailings. The plumes in this case may contain residual acid from processing, or possibly metal or other element concentrations released by the acid leaching process, which pose a risk for bio-accumulation at some sites (Waldichuk 1987). Although they are dilute compared to the tailings discharged, these plumes have higher turbidity than surrounding water �– tailings impacts are discussed in more detail in Section 5.5.
Suspended particles can either settle rapidly to the seafloor or remain suspended for a longer period of time and be carried away to adjacent regions. The density and migration direction of the plumes of suspended sediment is affected mainly by the strength of the bottom currents, as well as, the type, shape, weight and volume of the re-suspended particles (Chung et al 2002). Fine grained sediment, such as clay, will stay in suspension for longer than coarse sediments, while the profile of the bottom currents is also important �– currents are weakest just above the seabed, so the altitude above seabed at which sediment enters the

52
water column is a crucial parameter. Plumes become more dilute with increasing distance from the area where they form, while ocean currents and turbulence can make them disperse (Van Zyl et al 2002b). Tests indicate that plumes of sediment from a seabed mining process can be carried hundreds of kilometres away from the site (e.g. nodule mining - Sharma 2007).
Sharma et al (2001) performed some disturbance experiments in the Central Indian Basin region with a benthic disturber, whose tracks were 200m wide in total. The sedimentary plumes spread over a distance up to 150m from the edge of the disturbance site. They concluded that the intensity of the impact is highest within the disturbance area and decreases away from this zone. There are also a variety of other disturbance tests that have been performed in various oceanic regions around the globe (Thiel 2001), that aim to identify the total disturbance to the surrounding environment.
5.4.2 Impacts of suspended sediment
Any artificial intervention in the seafloor ecosystem may lead to alterations of the local geochemical, benthic and lithographic characteristics. Sediment settling from suspension may clog the filter-feeding process of epibenthic organisms, and smother the more sessile ones. In general, this happens when the deposition rate is greater than the ability of the slow moving organisms to move away. Species that rely on bioluminescence would be vulnerable to changes in water turbidity. So, sediment feeding fauna are threatened by food shortages if these manage to survive the direct mining impact (Markussen 1994). It can easily be seen that the mud coverage of the seabed fauna affects the diversity and population of the mobile species, while it may lead to extinction of the sessile ones. Also, in some cases the resedimented mud may also be colonized by opportunistic species or other meiofaunal and macrofaunal organisms, but the composition might be differ from the one commonly encountered in such abyssal plains (Thiel 2003). The impacts on the abyssal benthic meio- and macro-communities are so intense because the balance of the environment in such depths is very delicate; even small alterations can have major implications.
5.4.3 Mitigation
To minimize the above impacts, care needs to be taken with regard to the method, quantity and levels of discharge of sediments into the water column. Discharging of waste mud should be undertaken as close to the seafloor as possible, albeit not in a manner that would cause hydrodynamic disturbance of other sediments; a promising technique would be discharge of waste back into a dredged hole. In this way, the seabed would retain its original geological shape. If the resedimentation could be combined with nutrient rich sea currents, the resettlement of the clay particles would be accompanied by a large amount of organic-

53
rich matter which in turn could have positive effects on the local and adjacent benthic communities.
In conclusion, in order to effectively assess the environmental impact of REE mining on the French Polynesian seabed, with regard to sediment plumes, many parameters need to be addressed. These include the sediment-laden negative buoyancy effect, process of resuspension, grain size of resuspended material, bottom currents, red clay nutrient level and local and regional benthic communities. A completed environmental study is necessary, before proceeding with the mining process. This study will probably include comparative analysis between predictive simulation models (Jankowski et al 1995; Xie & Yapa 2003) and actual data (photographs, sediment traps). In this way, it will be possible to predict any potential environmental impact in future.
5.5 Tailings
In deep seabed REE mining, the REE-depleted mud being discharged after processing may be called tailings. This type of waste is going to be analysed in the following paragraphs.
5.5.1 Deep Sea Tailings Placement (DSTP)
Tailings disposal is one of the greatest concerns in the land based mining industry and will also be of concern in seabed mining activities. Tailings from mining usually come in a slurry form, and consist basically of suspended sediment, water and trace quantities of metals found in the host ore, but may also contain substantial amounts of compounds used in the extraction process. The composition varies by industry and location. There have been a number of methods proposed for their safe disposal. Among these solutions are submarine tailings disposal (STD) and deep sea tailings placement (DSTP). STD often occurs at relatively shallow depths, and extensive damage to the seafloor can result due to covering by the tailings product. In this case it is critical to control the density and temperature of the tailings product, to prevent it travelling long distances, or even floating to the surface. DSTP uses pipelines to discharge the waste until into greater depths. However, this method has not been widely adopted by land-mining because close proximity to off-shelf depths is rare.
In DSTP it is recommended that tailings are discharged on the seafloor at great depths to minimize the risk of tailings rising to the surface of the water column where the most biologically active zones exist (Van Zyl et al 2002a). Density differences in the ocean water column cause stratification, which is effective in trapping the tailing solids at depth. Recommended disposal depths are greater than 1000m (Van Zyl et al 2002b). Another measure to avoid entrainment of slurry to the water surface is through air bubble removal from the slurry mass (usually applied in land mining processes). Removal of process

54
chemicals, in order for the slurry to be neutralized to an extent that it does not cause �“severe harm to the environment�” is another treatment commonly used prior to discharging.
Tailing piping is a factor that also needs to be addressed. Location, length and pipe material are major parameters for effective tailing transportation. It is essential that pipelines retain integrity and that no breakage or leakage problems arise soon after operation starts. Regular monitoring and maintenance is essential, and if necessary, pipe steel casing might be an extra measure to ensure long term integrity on these deep submarine conditions.
5.5.2 General practice in deep sea mining proposals
Existing seabed mining strategies generally propose the use of a riser to pump excavated material as a slurry to the surface vessel where a de-watering process takes place to reduce the volume-to-weight ratio of the material to be temporarily stored in the vessel tanks (e.g. Blackburn, 2010). During the de-watering process, a large amount of water containing sediments, mud and some benthic biota is discharged into the water column. If the discharge takes place close to the surface level (depth 200m), the euphotic zone biota will be highly disturbed. Moreover, the discharged water has a higher temperature than the surrounding sea water, resulting in heat pollution of this pelagic zone. This is why several sources (UN, 1990; Chung et al, 2002) have recommended a discharging depth greater than 200m, and in many cases greater than 1000m (below the oxygen-minimum zone) to avoid disruption of vertical plankton movement.
In general, ocean dumping of dredge wastes in the euphotic zone may cause trace-metal bioaccumulation in surface water, reduction of primary productivity due to shading of phytoplankton and general disruption of marine mammal ecosystems. On the other hand, discharging in greater depths (below 200m depth; in the mesopelagic or bathypelagic zone) may cause mortality to zooplankton species resident at mid-water depths or that migrate to these depths on a seasonal basis, lack of prey for meso- and bathypelagic fishes and deep-diving marine mammals, depletion of oxygen by bacterial growth on suspended particles, as well as dissolution of heavy metals within the oxygen-minimum zone and their potential incorporation into the food chain.
5.5.3 Global ocean dumping regulations
At a global level ocean waste disposal is regulated by the �“Convention on the Prevention of Marine Pollution by Dumping of Wastes and Other Matter�”, also known as the �“London Convention�”. The London Convention Protocol (1996), Annex I, Article 4,
�“prohibits all dumping except: 1) dredged material, 2) sewage sludge, 3) fish waste, 4) vessels and man-made structures at sea, 5) inert geological material, 6) organic material of

55
natural origin and 7) certain unharmful bulky items made of iron, steel, concrete andsimilar harmless materials, for which the concern is physical impact, and limited to those circumstances where such wastes are generated at locations, such as small islands with isolated communities, having no practicable access to disposal options other than dumping.�”
In addition to the �“London Convention�” there is the UN Convention on the Law of the Sea (UNCLOS, 1982) which directs states to control pollution by dumping within its territorial seas, continental shelf, exclusive economic zone and over vessels flying its flag. Some relevant articles from UNCLOS, regarding ocean dumping are presented as follows:
Part XII, Section 5 states,
�“Article 208-Pollution from seabed activities subject to national jurisdiction: Coastal States shall adopt laws and regulations to prevent, reduce and control pollution of the marine environment arising from or in connection with seabed activities subject to their jurisdiction.�”
Further,
�“Article 210-Pollution by dumping: States shall adopt laws and regulations to prevent, reduce and control pollution of the marine environment by dumping. Dumping within the territorial sea and the exclusive economic zone or onto the continental shelf shall not be carried out without the express prior approval of the coastal State. National laws, regulations and measures shall be no less effective in preventing, reducing and controlling such pollution than the global rules and standards�”.
5.5.4 National ocean dumping regulations
National legislation consistent with the global regime may include law such as the U.S. Ocean Dumping Act, which focuses on regulation of materials that are dumped into the ocean in U.S. territorial waters and the contiguous zone. As per Policy & Congressional Regulation of Purpose, par. 1401, the congress recognizes the dangers of unregulated dumping: �“Unregulated dumping of material into ocean waters endangers human health, welfare, and amenities, and the marine environment, ecological systems, and economic potentialities�”. It is therefore the policy of the US to regulate the dumping of all types of materials into ocean waters, and strictly limit or prevent the dumping of hazardous minerals. In territorial waters each country is responsible and may regulate an ocean dumping framework and issue permits, through an environmental agency, for dumping that will not unreasonably degrade or endanger human health, welfare, amenities, or the marine environment, ecological systems, or economic potentialities. In order for permits to be
56
issued, the U.S. Ocean Dumping Act examines the following parameters, with regard to human and marine safety:
The need for the proposed dumping; The effect of such dumping on human health and welfare, including economic, aesthetic and recreational values; The effect of such dumping on fisheries resources, plankton, fish, shellfish, wildlife, shore lines and beaches; The effect of such dumping on marine ecosystems, particularly with respect to�—(i) the transfer, concentration, and dispersion of such material and its byproducts through biological, physical, and chemical processes.(ii) potential changes in marine ecosystem diversity, productivity, and stability, and (iii) species and community population dynamics; The persistence and permanence of the effects of the dumping; The effect of dumping particular volumes and concentrations of such materials. Appropriate locations and methods of disposal or recycling, including land-based alternatives and the probable impact of requiring use of such alternate locations or methods upon considerations affecting the public interest; and, The effect on alternate uses of oceans, such as scientific study, fishing, and other living resource exploitation, and non-living resource exploitation.
In designating recommended sites, the Administrator (of the EPA) shall utilize wherever feasible locations beyond the edge of the Continental Shelf.
In order for a site to be a potential tailings discharging location there are numerous parameters to consider, which are as follows:
current climate; water depth and bathymetry; bottom sediment physical characteristics including sediment grain-size differences; salinity and temperature distributions; normal levels and fluctuations of background turbidity; chemical and biological characterization of the site and environment (e.g. relative abundance of various habitat types in the vicinity, relative adaptability of the benthos to sediment deposition, presence of submerged aquatic vegetation, presence of unique, rare and endangered, or isolated populations); potential for recolonization of the site; previous disposal operations; availability of suitable equipment for disposal at the site; ability to monitor the disposal site adequately for management decisions;

57
ability to control placement of the material; volumetric capacity of the site; and, other site uses and potential conflicts with other activities.
The geological morphology of the site plays one of the most important roles, since there needs to be a deep target deposition where the tailings can settle and water conditions such that allow tailings to form a density current. Also, one of the criteria is that the chemistry of the mine waste must be such that there is minimal risk of toxin solubilisation, leaching to water column, and entry to biological cycles (Ellis et al 1995). By the time the tailings are discharged onto the seafloor, the concentrations of potential contaminants should be non-toxic to marine life and in compliance with appropriate water quality standards (Jones & Jones 2001).
Studies of national policy on DSTD indicates that many countries do not have specific tailings disposal legislation, so deal with applications within other frameworks or on a case-by-case basis (Van Zyl et al 2002b). Conforming to legislation like the US Ocean Dumping Act is a way of demonstrating good practice.
5.5.5 Tailings disposal conclusions
From the discussion above it seems that disposal of tailings at our sites of interest should be permissible provided that it takes place at the seabed, which is well below the recommended minimum depths, and all appropriate measures are taken, such as neutralization of tailings before disposal. Permission for DSTD would need to be issued from the national authority. Some ecotoxicity tests would need to be performed prior to the actual mining process to estimate the degree of interaction between benthic communities and tailings.
However, there are constraints that hinder a comprehensive environmental dumping assessment, such as the unknown toxicity of metals to organisms in the disposal environment and the lack of standard tests for these, the high cost of assessment and monitoring in deep waters, the lack of scientific knowledge as per large-scale impacts etc.
5.6 Noise
Underwater radiated noise propagates far from a source (e.g. around 600km distance from the mining site at Solwara 1 project). Both surface and seabed equipment can generate noise in seabed mining operations.

58
5.6.1 Surface vessels
Underwater radiated noise from floating vessels has an effect on marine species. A seabed mineral mining ship usually stays in the same area, and makes noise continuously. The density of marine life is higher near the surface, and creatures in these zones are exposed to noise from the vessel.
5.6.2 Seabed equipment
Deep seabed equipment is another significant noise source. The sound from a deep seabed source tends to be transmitted upwards, because the temperature at the deep seabed is usually lower than upper layers of sea water. Considering the distance that noise may propagate, it is apparent that noise from seabed mineral mining machines and processing equipment may affect creatures living in all zones of the sea
5.6.3 Biological impacts
In the deep sea, there are many marine creatures which may be affected by noise, as the undisturbed condition is very quiet. The ambient noise under 2,000m depth is not over 50 dB in the 10 kHz to 45 kHz frequency ranges and 60 dB from 2 kHz to 10 kHz (Riccobene, 2009). From Figure 26: Generic underwater thresholds (David, 2011) we can see that almost all marine species experience silence in the deep sea. Therefore, the induced noise during mineral mining from the seabed will be louder than the ambient noise, and have some influence on marine species. Also, the benthic communities at such depths integrate acoustically sensitive sensing systems, which enable them to detect environmental changes, suspended food or upcoming predators.
Figure 26: Generic underwater thresholds (David, 2011)

59
There have been some attempts to establish guidelines for underwater radiated noise (Table 10: Characteristic comparison of guidelines and criteria (David, 2011).). When evaluating noise from the seabed mineral mining system many things must be considered, including:
the operating time of each machine; frequency range of noise which will be decided by the frequency range of the species living near the mining area; noise level limits depend on frequency because different species are sensitive to different frequencies.
The noise level limit should be at or below a level that causes a temporary threshold shift in marine species near the mining area. A temporary threshold shift is a temporary injury to the inner ear of marine species caused by high sound pressure levels. A permanent threshold shift causes critical damage to species and usually, a big and intensive noise is required to cause it. However, in the seabed mineral mining field, because most equipment makes noise continuously, the temporary threshold shift is a better guideline. Also, the audible frequency ranges and the threshold of audibility are differ depending on the marine species (Figure 26). So, what kinds of species are living in the mining area should be considered, and their audibility characteristics should be investigated.
GuidelineCriteria
Time dependence
Frequency dependence
Absolute or relative level Species specific
USA National Marine Fisheries Service (NMFS) 1995
No No Absolute Cetaceans and
Pinnipeds
USA National Oceanic and Atmospheric Ad-ministration (NOAA) 2006 Guidelines
Yes No Absolute No
Southall et al 2007 Yes Yes Absolute Cetaceans and
Pinnipeds
High Energy Seismic Survey (HESS) 1997 No No Absolute
Cetaceans and Pinnipeds
UK Ministry Of Defence 2000
Yes Yes Relative No
Table 10: Characteristic comparison of guidelines and criteria (David, 2011).

60
However, many scientists suggest that there is a need for ambient noise characterization of the potential deep seabed mining sites, including frequency spectrum and energy levels and its propagation characteristics at the site. Such information could be collected with a number of different devices, such as Passive Acoustic Monitoring (PAM) sensors, which are deployed on the seafloor and detect ambient noise levels (e.g. for subsea vent and volcano sites). In order to understand the full impact of the mining process, it will be necessary to have a baseline for biologically generated sounds from the benthic communities at the area, which will potentially be masked by the dredging or environment noise.
Noise from cutter heads shall be thoroughly examined and modelled, probably through field/tank noise tests. Low frequency noise generation could be a potential and is expected to be audible at long distances from the mining location. Some characteristics of the dredge noise can be predicted, such as decibel level, frequency and propagation routes. Field test performance will be a very useful tool to combine the environmental characteristics of the particular site with the noise characteristics of the particular dredge. In the case of the site being studied the main noise problems are linked to the dredge, as well as the surface vessel, the ROV and the multi-purpose lifting tank.
5.7 Light & Heat
5.7.1 Light emissions
Light disruption should also be addressed. Increased light levels may affect the biotic communities inhabiting these depths, since the abyssal environments lack light and all the characteristics of these organisms are adapted to these conditions, e.g. organisms relying on bioluminescence. Any seabed mining operation is likely to have sources of light where human operator control is required. This is likely to be in places like ROVs, mining excavators, etc. Prior to full-scale operations, lighting studies are necessary, in order to test different light spectra, and examine which spectrum attracts the fewest organisms.
5.7.2 Heat
Another potential issue is temperature rise, caused during excavation, pumping and extraction processes. All of these are potential sources of heat; the dredged material is transferred through pipeline, where friction and flow generate heat; chemical leaching, is exothermic and mechanical excavation may generate more heat.
Tailing discharging, which takes place after the separation process, will probably raise the water temperature locally. A second possible disposal shall be neutralized, acidic liquids expelled from the previous chemical processes. It is expected that these wastes will also be

61
of higher temperature than the surrounding environment. However, the ambient ocean temperature is around 2oC, which means that the interaction between cold ocean and waste will lead to waste temperature reduction eventually.
There is still a concern, though, since the heating effects on the benthic communities are not clearly known, yet. Since the dredging machine plays an important role in the whole procedure, a possible discharging delay (due to equipment malfunction or other possible cause) could probably lead to higher waste temperature, causing potentially greater environmental harm. However, in some cases it is recommended that there is a possibility for cooling/refrigerating during the processing, so that the amount of thermal pollution from the effluent discharging on the seabed is reduced (Steiner 2009).
5.8 Conclusions and recommendations
5.8.1 Conclusions
The sites under consideration are expected to be characterised geologically by the presence of organic-poor red clays and to have low biomass.
There is considerable uncertainty as regards the environmental consequences of large-scale deep seabed mining and waste disposal, and the mining effects are strongly related to the nature of technology applied.
The benthic environment is going to be the most affected part of the entire ecosystem during a mining process.
Tailings disposal and sediment plumes are two basic environmental consequences of deep seabed REE mining. Ways of preventing or mitigating these impacts depend on a variety of parameters that need to be considered during the design of the mining system.
5.9 Suggestions & Environmental Considerations
In order to limit the impacts to minimum levels, the following measures need to be taken in design of a deep-sea mining system:
Reduce discharge of tailings into bathyal or abyssal depth, especially the latter, because the bathypelagic waters host a greater number of larger and more diverse biota; Reduce mass of sediment swirled up into the near-bottom water layer; Long-term pilot mining operations would probably give important information about the environmental consequences of deep seabed mining. In order to measure the

62
harm and design the consequent compensation plan, environmental data before and after the process could prove to be very useful (Nollkaemper 1991;Chung et al 2002).
It is necessary to draw an environmental protection plan, according to the existing mining technologies for the seabed resources of interest, which will be revised and improved at regular intervals, according to the environmental issues arising each time. However, scientific uncertainty leads to regulations uncertainty, as per how stringent these preventive rules should be. Until a specific regulations system is implemented, draft national environmental regulations will have to reflect a decision on the degree of precaution required.
Test work is required to characterise the toxicity of potential contaminants in the tailings. Treating prior to discharging is essential for the environment protection.
Prior to selecting a tailings disposal site, current practice recommends that existing and potential biota at the selected site and predicted final deposition area be assessed for minimal conflict. This means that all the environmental parameters need to be addressed and evaluated properly, in order to ensure the least possible environmental impact.
Finally, a pre-commencement baseline survey of key factors such as turbidity, species abundance, water temperature, etc would provide valuable data for any monitoring system during operations. This could be run simply in conjunction with bathymetric and geophysical surveys.

63
6 Technology
6.1 Introduction
Rare earth elements are found in Pacific seafloor mud at water depths between 3,500m and 6,500m, as discussed in Section 3.1. Unlike other seabed minerals, there is currently no record of any design, trial or practical undertaking of seabed mining to extract this mineral for commercial purposes anywhere in the world. However, seafloor mining of other types of minerals, such as seafloor massive sulphides (SMS) and manganese nodules, has been receiving attention in recent times. Therefore, it may be assumed that some of the existing technology being used for the exploitation of other seabed resources such as sediment dredging, diamond mining and oil and gas, as well as the proposed systems for manganese nodules and SMS could be adapted for the mining of REE, albeit with some modification.
6.2 Existing technologies
Since there is no precedence for the seabed mining of REE at present, it is important to consider the process of seabed mining as it is currently being practiced. Figure 27 shows simple schematic illustrations for SMS and manganese nodule mining, and it may be seen that the systems are qualitatively similar �– a seabed resource collector, hydraulic lifting system and support vessel are the common elements.
Figure 27: (a) System design for Nautilus minerals (Blackburn et al, 2010) and (b) Mn nodule mining (Handschuh, 2010).

64
The process of mining REE requires the use of robust equipment that can withstand the environmental challenges of the location in which it exists. The design of such equipment is critical to the success of seabed exploitation in general.
Recently, we have been witnessing the evolution of some large pieces of equipment being designed for seabed mining. This equipment is expected to operate at water depths of up to 6,500m under the influence of severe environmental and operational conditions. Most of the equipment being used for seabed exploitation was adapted from three key offshore industries. These are:
The oil and gas industry - The pipeline riser system - Umbilicals - Use of ROVs The land-based mining industry (terrestrial mining) - Production Tools - Mineral collectors The sediment dredging industry - Cutter Suction Dredge (CSD) - Bucket Dredge
The choice of mining equipment to be used in any given seabed exploitation process depends on the environmental and operational challenges encountered.
6.3 Basic considerations in selecting REE mining equipment
Seabed mining is a highly technological process due to the types of equipment and technical knowhow which need to be employed to overcome environmental challenges and successfully exploit a resource. This section lists some of the key considerations in developing a system for exploitation of the seabed.
6.3.1 Production Support Vessel
The requisite ocean surface production support system must be available. This could in the form of a production support vessel similar to the types used in oil and gas production. The choice of this system is governed by many factors, of which the following constitute some of the most critical:
daily production rate: the volume of the minerals to be produced at any given field dictates whether a storage facility onboard is required, as well the size of the support system;

65
configuration of the riser system: this includes the weight and number of risers and depends on the water depth and the production rate; and, presence of processing unit onboard: the decision whether to have a processing unit on- or off-board influences the sizes and the facilities on the support vessel.
6.3.2 Water depth
One of the challenges facing the mining of REE on the sea bed is the water depth of between 4000m �– 6000m where REEs are found. In order to select the most appropriate systems and equipment for REE mining, the effect of water depth on the equipment in installation, operation and recovery phases needs to be understood. Some of the most important depth dependent effects are:
pressure �– hydrostatic pressure increases linearly with depth; temperature; and, distance �– the physical distance of the seafloor from the production vessel influences how the vessel communicates with the seabed, how material can be transported, etc.
6.3.3 Hydrodynamics
The hydrodynamic forces acting on the equipment during installation, and to some extent during operation, could have a significant impact on the success of seabed REE exploitation. The loading conditions for the installation and recovery of seabed equipment are derived from the hydrodynamics of the operating environment in addition to the self weight of the equipment. Another aspect of the REE installations that requires thorough hydrodynamic analysis is the power cable (umbilical). The umbilical will be used to connect a power supply to the REE mud collector, the leaching tank and any other seabed installation that requires power for its operations.
In performing the installation analyses of this equipment, considerable attention should be paid to the prediction of hydrodynamic forces due to currents, waves, tidal movement etc.

66
Figure 28: Mean monthly wind speed (U10) at -14oN, 218oE (m/s) (Young & Holland 1996)
Figure 29: Mean monthly wave height (HS) at -14oN, 218oE (m) (Young & Holland 1996)
The combined effects of wave and current should be used in determining the worst loading conditions to be used in the design. The basis of the design for cylindrical elements should be based on the Morison�’s Equation while for large bodies; the diffraction method should be employed. The forces to be predicted should include the drag, inertia, added masses etc.
6.3.4 Soil stability
Understanding of the soil�’s properties and its ability to withstand the pressure to be induced by the equipment and other seabed installations is important in the design of a seabed system. Since most of the equipment would be sited on the seabed, soils at the location of the exploitation should need to offer adequate resistance to the forces induced by the weight of the equipment in both static and operating conditions. In order to know if the soils are

67
suitable, one needs to understand the types and properties of soils at the location in terms of the following:
1. Density of soils, ; 2. Particle size; 3. Angle of internal frictions, ; and, 4. Porosity of the soils.
Knowledge of the above parameters could be used to classify the types of soils available at the location. Once these are known, exploratory study could be conducted to establish the shear strength and the bearing capacity of the soil. The bearing capacity would then be used in determining the potential for installing equipment which can operate successfully at the site.
6.3.5 Materials selection
The selection materials to be used for the design of REE exploitation facilities and equipment are mostly governed by the environmental conditions in which they operate. Commonly used materials for seabed operations include the following:
1. Carbon and alloy steels 2. Titanium 3. Fibre Reinforced Plastics (FRP) such as GFRP, PPE, Polyurethane polymers
These materials must be able to ensure the adequacy of the structural integrity of the equipment and facilities operating at the location. In addition to the above, the materials should be able withstand problems such as the effects of chemical and temperature variability at the operating location. The following aspects are to be considered in the selection of material grades:
strength of the materials; temperature and corrosion resistance; method of deployment and recovery of the equipment ; and, fatigue life of the materials.
6.3.6 Powering
Seabed operations are generally regarded as an energy-intensive system because of the huge amount of energy required for powering the collective units of the entire system.
The key components of that require powering are:
1. REE mud collection equipment;

68
2. Pump stations; 3. Leaching tanks; 4. Work and inspection ROV; and, 5. Production support vessel (Ocean surface monitoring devices)
The REE mud collection equipment is the most power-consuming of all the equipment used in the exploitation of REE on the seabed. Since there has been no precedent of seabed REE mining, so far, the ideal size and configuration of REE collector equipment remain unknown. However, using the concept of a hybrid system that consists of Cutter Suction Dredge (CSD) and a Tractor unit as a basis, a preliminary power requirement for this equipment can been estimated.
6.4 Concept for seabed REE mining
6.4.1 Objectives
The objective of this seabed mining operation is to recover REE from seabed mud. The system outlined in this section is designed to recover REE from seabed mud to a surface vessel - separation of REE into pure individual metals and transport to a processing location and /or market is outside the scope of this design.
6.4.2 Design considerations
A key component of the proposed seabed mining systems shown in Figure 27 is the riser system which transports mined material to the surface. This technology is derived from oil and gas risers which connect subsea wells with surface production facilities. However, these riser systems are extremely expensive �– Nautilus Minerals estimates that their Solwara project riser system will cost $101 million, or about 26% of total capital expenditure (Blackburn et al, 2010). Nautilus�’ system is designed to lift mined material from a depth of approximately 1600m; at the sites of interest in French Polynesia the water is almost 3 times as deep, at 4500m.
A key difference between either the oil and gas industry or Solwara and REE mining in French Polynesia is the concentration of valuable material. In the oil and gas industry a large proportion of what is pumped through the riser is valuable, and at Solwara 1 the copper content of the ore alone is around 10% (Blackburn et al, 2010) with additional valuable materials also present. REE concentration in the mud at the sites of interest is of the order of 1000ppm, or 0.1%. Consideration of these two key points leads to the conclusion that it will be uneconomic to mine REE from seabed mud at the sites considered

69
unless the REE can be separated from the bulk of the mud on the seabed so that the volume of material transported to the surface is reduced.
Fortunately, according to the results of Kato et al (2011), REE can be leached from the seabed sediment at these sites with dilute acid over the course of a few hours. The concept presented here for the mining of seabed mud in French Polynesia is therefore based on seabed extraction of REE from the sediment, and riserless transport of a small volume of concentrated REE to the surface.
6.4.3 Overview and process description
A flow diagram of the mining system is shown in Figure 30. The system depicted here is summarised below:
seabed mud collected using the mud collector; mud pumped to the mud distributor in slurry form; doses of concentrated acid added; slurry pumped to a leaching tank, remains in leaching tank until REE removed into solution; slurry (with aqueous REE) pumped through a physical separator to separate the solids from the liquids (leachate); leachate pumped to REE precipitator while solids pumped back to excavation site for disposal as a slurry (using more seawater); in REE precipitator a reagent added to leachate to precipitate REE as a solid; REE precipitate transferred to REE tank for vertical lifting to surface; and, waste acid from precipitator pumped to acid recycler to be reconcentrated and reused or disposed of, depending on pH.
Multiple leaching and lifting tanks would be available, such that the system could run continuously. The elements of this system are discussed in more detail in Sections 6.6 to 6.10.

70
Figure 30: System flow diagram.

71
6.4.4 Production volumes
A mining project typically sets a yearly production target. This figure may then be used to calculate income and design the system and equipment. Usually the production volume is supported by reserve estimates, which are based on geophysical studies or other sampling approaches. In this case, the resource has not been explored, so selection of production volume is based on the limitations imposed by economic factors and equipment availability, rather than an assessment of reserve estimates.
The production volume selected is 2000 tonnes REO per year. This quantity is significant enough to hold some interest (it is more than half of total world non-China output in 2010, see Section 2.3.2), but small enough that design of the system laid out above is a tractable problem. If increased production were deemed economically desirable, in such a system this could proceed using multiple modules, rather than a scaling of the current system.
Using this yearly production figure, we can proceed to calculate some figures of interest, which will be carried through the sections on individual components. Hence:
yearly production REE = 2000/1.17 ~ 1700 tonnes REE/year using the value of 1.17 given in Section 2.1; average concentration of REE in the top 5m of seabed at site 76 is 1300ppm (Section 3.2) �– assume that 1000ppm is extracted. Therefore 1 700 000 tonnes dry sediment must be extracted per year; assuming g that the mining operation can run on 200 days/year �– 8500 tonnes dry sediment/day �– and 18hr/day �– 475 tonnes dry sediment/hr; in-situ the mud at site 76 has a porosity of approximately 75% (Hays et al, 1972), so the in-situ dry bulk density is approximately 2650(0.25) = 0.66 tonnes/m3; using the dry bulk density calculated above, the dredge must excavate 8500/0.66 ~ 12800m3/day or 715m3/hr; if the mining operation extends to 5m depth, the yearly area to be mined is 1700000/0.66/5 ~ 516 000 m2 or 0.52km2 per year; assuming that the (wet) pumped slurry density is approximately 1250kg/m3 then pumped �“porosity�” is 86% and pumped volume per hour is 475/(2.650(0.14)) ~ 1280m3/hr.

72
6.5 Surface vessels
Two vessels are required; a production support vessel and a supply vessel.
6.5.1 The Production Support Vessel (PSV)
The PSV is a floating vessel which serves as the control hub for the entire REE mining operation using remote control of underwater operations. It also provides a platform for the deployment and recovery of seabed equipment, storage of fuel, REE product and chemicals, as well as the transportation of REE mining equipment to the site. Figure 31 shows a similar vessel built by Nautilus Minerals for the mining of SMS in the Bismarck Sea off the coast of Papua new Guinea. Unlike Solwara�’s PSV, our concept does not have a drilling derrick since no riser would be required for either drilling or lifting of the product.
Figure 31: A Production Support Vessel for Nautilus�’ Solwara project. (http://www.nautilusminerals.com/i/photos/SOLWARA-img3.jpg)
In addition to its main function of providing a base for the mining of the seabed REE, the PSV must contain the following facilities in order to ensure an efficient mining operation. These are:
Launch and Recovery System (LARS): this has the shape of an A-Frame which is used for the deployment and retrieval of the ROV which is needed for monitoring (inspection) and execution (work) of the remote operations on the seafloor. The LARS could also be used in the deployment and lifting of other equipment. The LARS must be stable and strong enough to withstand the effects of weight of the equipment, environmental forces and the vessel motions during the installation and recovery operations.
Crane: A high capacity crane capable of lifting sufficient weight would be required to support the installation and recovery operations. This will include a wire rope of sufficient

73
length and sheave structures of adequate capacities to meet the requirements for installing and recovering of equipment at water depth of over 4500m. The crane must be fitted with a heave compensation device in order for it to execute its operations in relatively rough weather conditions.
Control facilities: Since most of the tasks involved in seabed REE mining are remotely monitored and controlled, it is expected that the PSV must provide enabling environment and equipment on board the vessel for the control of the work equipment and seabed facilities. The facilities must include interactive monitoring equipment such as monitors, position indicators, gauges etc. An example of a typical control room is shown in Figure 32 below.
Figure 32: A typical control room. (Source: http://www.sub find.com/panther.htm)
Power supply: The power requirement for this concept has been estimated to be in the region of 7 - 10MW and it is expected to be generated onboard the PSV. Consequently, the PSV must be able to provide enough power either from a standalone source or its engines to meet the peak power requirements of all the components of the REE mining equipment. In addition, the vessel must contain all the required power distribution and transmission appurtenances needed for the seabed equipment.
Acid and REE Storage Containers: Storage facilities for acid prior to its deployment to the seafloor and the mined REE from the seafloor to the ocean surface are required on the PSV. This could be in the form of tanks or other acceptable forms of containment. The containers

74
should be made of materials that are proven to be capable of keeping acid secured in accordance with relevant regulations.
6.5.2 Supply vessel
The supply vessel required for this concept of seabed REE mining would be essentially a small ship with a length of between 40m �– 60m. The vessel will be used as a shuttle between the PSV and the onshore processing centre for the transportation of supplies such as consumables, equipment, REE products and, occasionally, personnel to the production platform. The vessel is expected to be fitted with acid handling facilities since it is expected to be transporting concentrated acid to the site as some of its cargos. Figure 33 shows a sample of a supply vessel currently used in the oil and gas industry.
Figure 33: A supply vessel (https://gcaptain.com/island-offshore-orders-psvs/)
6.6 The REE Mud Collector
The first challenge in obtaining REE from seabed mud is how to get the mud from the seabed. A well-designed mud collection tool is therefore a fundamental part of the mining progress. In this section, the concept design of an integrated mud collector will be given.
6.6.1 General aspects of the solution
Based on the general idea of a seabed mining and processing system, the mud collector should be a vehicle-like or submarine-like machine. Driven by electric power from the

75
supporting vessel or another power source, it should be able to operate at some distance from this source. It also should be equipped with some devices which enable it to dig mud from the seabed to a certain depth and transfer it to another location.
Floating devices used to excavate seabed sediments in relatively shallow water are called dredges. These machines provide the closest analogue for the technology required. Dredges can be divided into two types: mechanical dredges and hydraulic dredges. The names of these two types identify the major difference between them, which is the way that the soil is excavated. Typical mechanical dredges include bucket ladder dredges, grab dredges and so on, while hydraulic dredges include cutter suction dredges and dustpan dredges. In the early years of dredging, mechanical dredges were widely used, however, in recent years, hydraulic dredges have become more and more popular, the cutter suction dredge (CSD), especially, playing the most important part in modern dredging.
The CSD, which was first used in the UK more than 100 years ago, today makes up more than 40 per cent of the world�’s modern dredging fleet of about 2500 dredges. The main advantages of the CSD include the following (Bray et al, 1996):
The ability to dredge a very wide range of materials, including mud, high plasticity clay and even some weak rock; The ability to convey the dredged material by pumping with water directly to the disposal area, which indicates the whole dredging process can be operated continuously; The ability to produce a uniform level bottom with high rates of production; and, Relatively few operators and devices needed.
These characteristics are well suited to the needs of seabed dredging �– in particular the ability to pump and relative simplicity are key. But it must be pointed out that the operation being considered involves dredging operations on the seabed beneath 4500m of water, which is a depth that a traditional CSD could never approach. So it is necessary to design a �‘subsea cutter suction dredge�’, which not only inherits the advantages of the traditional CSD, but also attempts to overcome its shortcomings (such as high mobilization cost), in order to meet our requirements.
The most intuitive solution is to transform the main hull of a conventional CSD to a submarine, or, in other word, to manufacture a submarine with cutter suction equipment. This approach does not seem feasible, because the reacting force from the cutter head will threaten the manoeuvrability and stability of the hull.
A modified plan is to combine a crawler chassis and a Cutter Suction Dredge head. This combination allows the collector to operate on the seafloor, which is a much more stable configuration than dredging from a buoyant or neutrally buoyant vessel. There are already

76
some similar designs (e.g. Handschuh, 2001) and this approach will therefore be followed. A conceptual illustration of the mud collector is shown in Figure 34.
Figure 34: Mud collector concept.
6.6.2 The crawler chassis
In land mining applications, the crawler chassis is a widely used technology. The basic principle of the crawler is that, by revolving the annular crawler around the outside of the driving wheel and a series of rollers, the vehicle can avoid contacting the ground directly. The traction forces are delivered to the vehicle though the crawler. When the crawler is driven by the drive unit, relative rolling motion takes place between the wheels and the crawler, which leads the chassis to move. Since the ground area of the crawlers is larger than the contact area of the wheels, the pressure the vehicle exerts on the ground is small. The stronger adhesion of the crawler to the surface can also provide more driving force than wheels.
Generally, crawler chassis use a dual crawler track structure. The two crawlers, which are located on either side of the chassis, are driven by two independent motors. When the chassis is moving forward or backward, the motors rotate in the same direction and at the same speed. When a change of direction is required the motors rotate at different speeds.
A crawler chassis to be used as part of the deep sea mud collector may be similar to the ordinary chassis on land, however, some specific environmental conditions have to be taken into account.

77
The first issue is the water depth. As discussed in Section 6.6.1, the mud collector will operate in a water depth of about 4500 meters, which means it has to operate in 45MPa (450 bar) pressures. The ambient temperature ranges from approximately 2ºC in the deep sea and up to 50 ºC when it is directly exposed to the sun on the deck of the supporting vessel before being launched into the water. While being launched, the mud collector is also exposed to high stresses caused by wave action and ship motions. To avoid damage, it has to be designed to stand a sea state of 5 during launching (Handschuh, 2001).
Another issue is trafficability of the seafloor mud. The shear strength of the operating area ranges from 1.7 to 3.4 kPa (Keller, 1967), which means the maximum traction force reacting on the crawler is 2.8 N/m2. Besides this, due to deep sinkage of the vehicle, high external resistances build up, so that the useable traction force is further decreased. (Wenzlawski 2001). Because of the limited traction force, very low traction potential can be expected. The bearing capacity at the limit of trafficability is calculated according to the approach of Terzaghi (1954) and it has a value of about 14 kPa. To guarantee the crawler�’s mobility, the ground pressure caused by the crawler on the seabed must not exceed this bearing capacity; the vehicle therefore has to be built as light as possible.
A detailed design is beyond the scope this report. Fortunately, because the crawler is a widely used commercial technology, purchase or customisation of a crawler should be possible. Wenzlawski (2000) gives a design of a crawler, whose operating conditions are similar to those here. A design of that crawler is shown in Figure 35. It is designed to be made of seawater-resistant aluminium alloy AlMgSi, titanium and stainless steel.
Figure 35: A crawler chassis design (Wenzlawski, 2000)

78
6.6.3 Design of the cutter-suction system
The design of the cutter-suction system is related to many factors such as soil type, dredging production, cutting depth, cutting speed, cutter head performance and cutting power. As we mentioned in the Chapter 5, the soil type in the operating seabed area is red clay, which is relatively soft and of high porosity. Based on the annual REE production target and the calculations in Section 6.4.4, the dredged production should be about 715 cubic meters per hour. Consistent with those calculations, the cutting depth is assumed to be 5 meters, which is the depth of the high-concentration sediment at site 76.
The cutter head is an important part of the cutter suction system. An efficient dredge has a direct relationship to a well designed cutter head. Nowadays, most of the cutterheads in use are the �‘crown�’ type and consist of five or six of specially shaped blades designed to cut the seabed material effectively.
For soft seabed materials, the plain-bladed cutter is commonly used. The plain-blade can provide a larger surface pressure, which enables it to cut into the soil easily. The number of blades is selected according to the application. By increasing the number of blades, the gaps between the blades is reduced. This restricts the size of solid which can pass and hence may be useful when dredging in areas which contain debris or large stones. Considering the seabed condition, a 5 plain-bladed cutter with five blades seems to be a proper choice.
The Diameter of the cutter head: The cutter head production is basically determined by the cutting depth, the feed length, and the traverse speed of the blade. An empirical equation of the cutter head production is written as (Zhang and Xing, 2003):
60 cosm smQ LD V (1)
Where mDL is the height of the cutter head, is the ratio of the cutterhead�’s height to its
diameter, usually between 0.7-0.9 (here set to 0.75), is the forward distance factor of the
cutterhead (here set to 0.75), smV is the traverse speed, here it is set to 12 m/min (based on
the crawler�’s move speed 0.2m/s), and is the cutting angle, usually 40º.
The cutter production is considerably higher than the dredged production because not all the material that has been cut enters the suction mouth. Often 20 �– 30 % remains behind as spillage. This must be taken into account when determining the production to be cut.
Another empirical equation about the relationship between the cutter production and the dredged production is written as following:
sQQ (2)
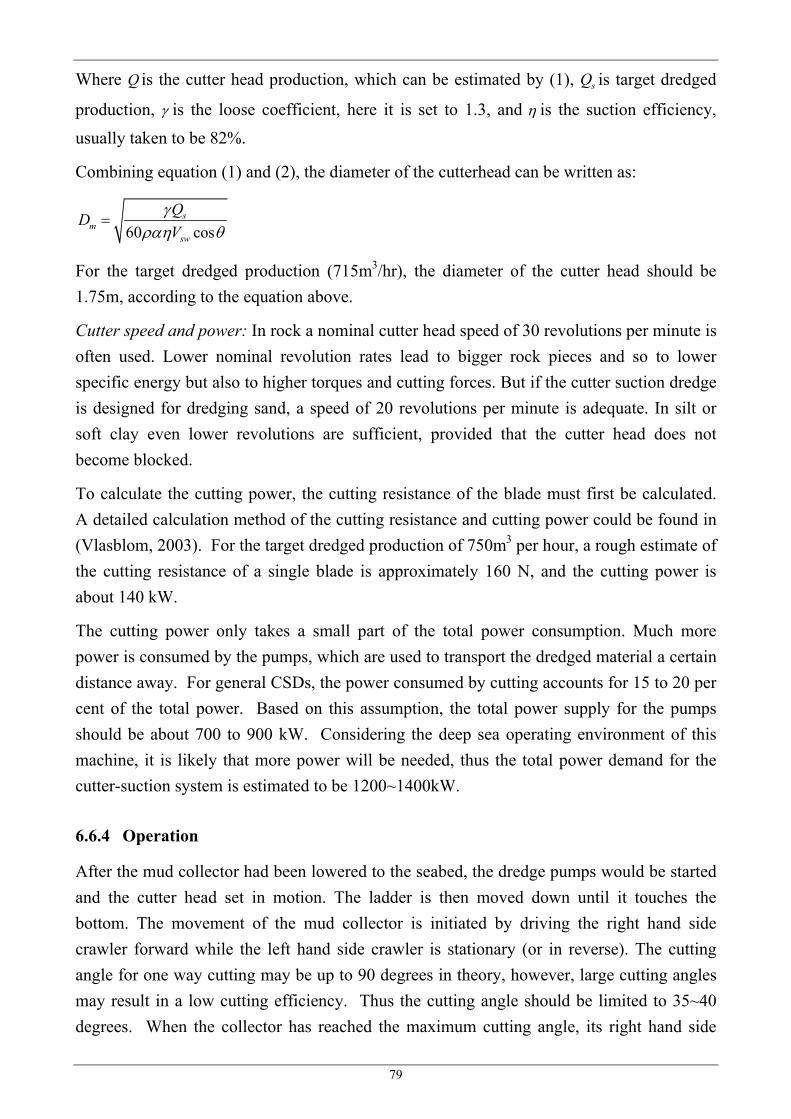
79
Where Q is the cutter head production, which can be estimated by (1), sQ is target dredged
production, is the loose coefficient, here it is set to 1.3, and is the suction efficiency,
usually taken to be 82%.
Combining equation (1) and (2), the diameter of the cutterhead can be written as:
60 coss
msw
QDV
For the target dredged production (715m3/hr), the diameter of the cutter head should be 1.75m, according to the equation above.
Cutter speed and power: In rock a nominal cutter head speed of 30 revolutions per minute is often used. Lower nominal revolution rates lead to bigger rock pieces and so to lower specific energy but also to higher torques and cutting forces. But if the cutter suction dredge is designed for dredging sand, a speed of 20 revolutions per minute is adequate. In silt or soft clay even lower revolutions are sufficient, provided that the cutter head does not become blocked.
To calculate the cutting power, the cutting resistance of the blade must first be calculated. A detailed calculation method of the cutting resistance and cutting power could be found in (Vlasblom, 2003). For the target dredged production of 750m3 per hour, a rough estimate of the cutting resistance of a single blade is approximately 160 N, and the cutting power is about 140 kW.
The cutting power only takes a small part of the total power consumption. Much more power is consumed by the pumps, which are used to transport the dredged material a certain distance away. For general CSDs, the power consumed by cutting accounts for 15 to 20 per cent of the total power. Based on this assumption, the total power supply for the pumps should be about 700 to 900 kW. Considering the deep sea operating environment of this machine, it is likely that more power will be needed, thus the total power demand for the cutter-suction system is estimated to be 1200~1400kW.
6.6.4 Operation
After the mud collector had been lowered to the seabed, the dredge pumps would be started and the cutter head set in motion. The ladder is then moved down until it touches the bottom. The movement of the mud collector is initiated by driving the right hand side crawler forward while the left hand side crawler is stationary (or in reverse). The cutting angle for one way cutting may be up to 90 degrees in theory, however, large cutting angles may result in a low cutting efficiency. Thus the cutting angle should be limited to 35~40 degrees. When the collector has reached the maximum cutting angle, its right hand side

80
crawler would stop and its left hand side start to move ahead. The two crawlers move alternately, until the chassis reaches a predetermined distance or until it reaches the maximum head of the pump. The ideal cutter track is drawn in Figure 36.
Figure 36: Cutter track of the mud collector
When the mud collector finishes the first run of cutting, it can go back to the origin, then change its direction and begin the next run.
6.6.5 Environmental impact
It is not easy to determine what the environmental impact of the mud collector would be. However, it is certain that during the dredging, vibration and noise will be caused by the machine with potential damage to the surrounding ecological environment. The temperature of the deep ocean is remarkably constant below the thermocline (2 °C or so), so the heat emitted by the high powered motors could threaten the surrounding creatures as well.
Creation of suspended sediment is likely to be an issue of greater concern than the above. In surface dredging works, silt curtains or booms may be used to prevent sediment escaping the area of the site. At depth there is no free surface, but a similar method to decrease the environmental impact is to add a cover to the mud collector. However, that will cause other issues due to additional structural weight.

81
Figure 37: Illustration of the mud collector with a cover.
6.7 Hub
This can be described as a seabed pumping station similar to the subsea template commonly used in the oil and gas industry. Its main function in this concept is the control of the entire flow process in the seabed mining operation. It consists of several components, which are described below.
6.7.1 Mud distributor
The mud distributor serves as a central distribution point for the transfer of the collected seabed sediment to various leaching tanks. It also serves as the injection point for acid required in the leaching process on the seabed. The advantage of injecting the acid into the mud distributor is that pumping the distance remaining to the leaching tank is expected to facilitate mixing of the mud and acid solution in the turbulent flow. Figure 38 shows a picture of a typical subsea template used in the oil and gas industry.

82
Figure 38: A typical subsea template for the oil and gas industry.
6.7.2 REE recovery from solution
After physical separation the leachate liquid will flow to the precipitator, where the REE will be precipitated as solids. However, a number of methods may be used to recover REE from solution (Tian et al, 2011) including:
precipitation; solvent extraction; ion exchange; and, liquid membranes.
Precipitation is most commonly used in recovery of REE from the leach solution created by leaching of ion-adsorption deposits in China (Tian et al, 2011). One common way to achieve this is to add oxalic acid (H2C2O4), which will form rare earth oxalate precipitates, either deca-hydrate with La - Ho (and Y), or hexa-hydrate for Er - Lu, the heavier lanthanides (Molycorp, 1993) according to the equation below.
where is 6 for La - Ho (and Y) and 10 for Er �– Lu.
The stoichiometry of this reaction indicates that the number of moles of acid added should be 1.5 times the number of moles of REE present/expected. In fact, Tian et al (2011) suggest that excess oxalic acid leads to better recovery of REE and recommend that an extra 40% be added.

83
6.7.3 Acid recycling
Once the REE precipitate has been recovered by filtering the leachate flow, the unspent acid will be recycled. This is intended to save cost and prevent the environmental problems that would be associated with large discharges of acid into the environment.
One method used for reconcentrating acid in industrial applications is electrodialysis. This method uses ion-exchange membranes and an applied current, and is used in desalination and industrial acid reconcentration. A series of alternating cationic and anionic membranes in combination with an applied current produce cells of dilute and concentrated acid; the combined effect of the current and the membrane is that cations and anions flow into the concentrated cell and out of the dilute cell, as shown in Figure 39.
Isolating the cell electrically from the surrounding seawater may be challenging. The effect of pressure and salt water is unknown at this time. Electrodialysis will consume a considerable amount of energy.
Figure 39: Diagram of an electrodialysis tank.
6.8 Leaching Tanks
In this concept, the REE minerals present in the mud are to be extracted by acid leaching at the seafloor. Kato et al (2011) report that leaching of seabed mud with dilute acids is suitable and that 0.2 mol/L sulphuric acid leached more than 80% of the REE (except Ce) in 1hr, while 0.5 mol/L hydrochloric acid leached more than 90% of the REE (except Ce) in 3hr. The figures in Kato et al (2011) were for site 68, close to Hawaii, but a personal
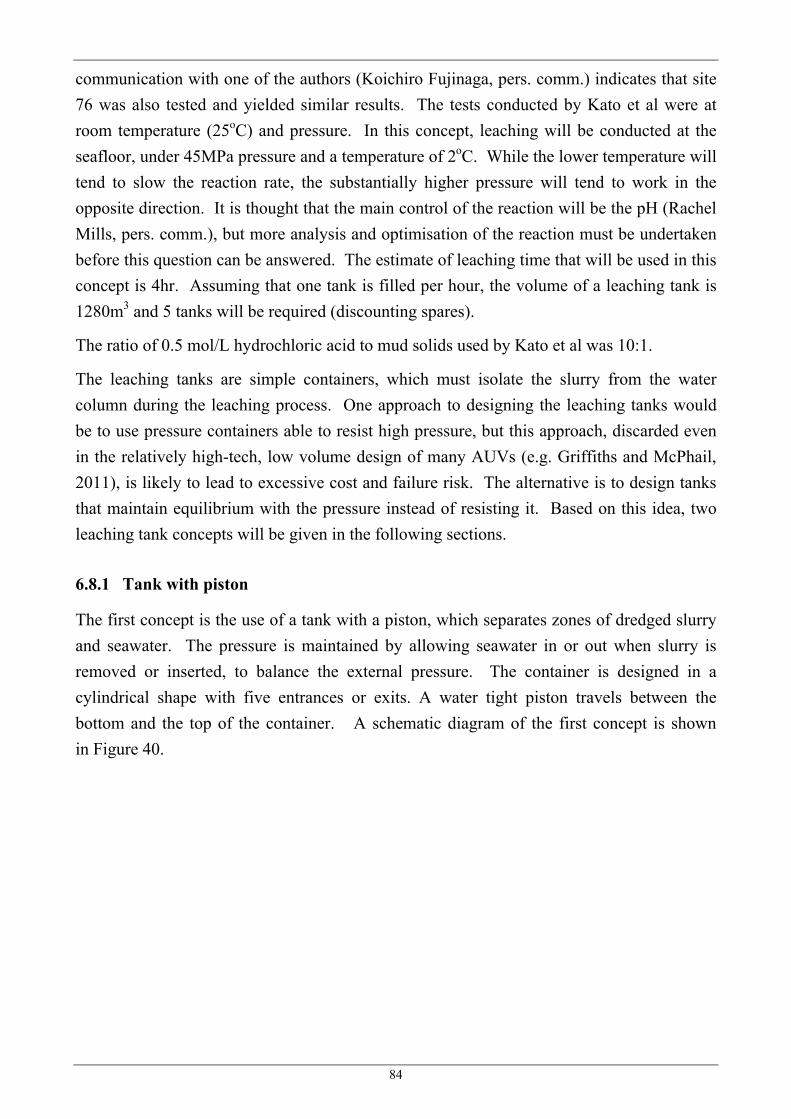
84
communication with one of the authors (Koichiro Fujinaga, pers. comm.) indicates that site 76 was also tested and yielded similar results. The tests conducted by Kato et al were at room temperature (25oC) and pressure. In this concept, leaching will be conducted at the seafloor, under 45MPa pressure and a temperature of 2oC. While the lower temperature will tend to slow the reaction rate, the substantially higher pressure will tend to work in the opposite direction. It is thought that the main control of the reaction will be the pH (Rachel Mills, pers. comm.), but more analysis and optimisation of the reaction must be undertaken before this question can be answered. The estimate of leaching time that will be used in this concept is 4hr. Assuming that one tank is filled per hour, the volume of a leaching tank is 1280m3 and 5 tanks will be required (discounting spares).
The ratio of 0.5 mol/L hydrochloric acid to mud solids used by Kato et al was 10:1.
The leaching tanks are simple containers, which must isolate the slurry from the water column during the leaching process. One approach to designing the leaching tanks would be to use pressure containers able to resist high pressure, but this approach, discarded even in the relatively high-tech, low volume design of many AUVs (e.g. Griffiths and McPhail, 2011), is likely to lead to excessive cost and failure risk. The alternative is to design tanks that maintain equilibrium with the pressure instead of resisting it. Based on this idea, two leaching tank concepts will be given in the following sections.
6.8.1 Tank with piston
The first concept is the use of a tank with a piston, which separates zones of dredged slurry and seawater. The pressure is maintained by allowing seawater in or out when slurry is removed or inserted, to balance the external pressure. The container is designed in a cylindrical shape with five entrances or exits. A water tight piston travels between the bottom and the top of the container. A schematic diagram of the first concept is shown in Figure 40.

85
Figure 40: Schematic of piston leaching tank.
The tank could work along these lines:
1. Open pump 1, fill the tank with seawater, the piston reaches the bottom; 2. Close pump 1, open pump 3 to pump the seawater from the bottom, the piston moves
up. when it reaches line b, stop pump 3, open the latch, then tank fills with the mud-acid mixture coming from the �‘hub�’, the piston goes to the top;
3. Stand for several hours, when leaching is over, open pump 4 and pump 1 simultaneously, pump the REE liquid out and fill the tank with sea water, when the piston reaches line b, close pump 4 and pump 1;
4. Open pump 3, pump in the seawater, mix the seawater with mud, the piston goes to the top;
5. Repeat step (3); (this step can also be neglected) 6. The last time, open pump 3; when the piston is above line a close pump 3, open
pump 2, pump the mud and water back to the buffer. 7. Open pump 1, refill the tank with seawater, a new leaching process can be started
from step 1 again.
This concept is feasible in theory. The most difficult component is pump 4, which is intended to pump the used acid out, while leaving the mud in the container. Though there are already some similar technologies used in slurry concentration on land, it is still uncertain whether these technologies can work here, because the used mud-acid mixture is highly diluted.
Another issue with this concept is the piston. Based on the leaching method described above, the piston will travel from the top of the container to the bottom frequently, and the
Pump 2 Pump 1
Pump 4
Pump 3
a
b Acid+mud
valve
HUB

86
driving force is the pressure difference from two sides. It is easy to imagine the piston becoming jammed, with little prospect of repairing this flaw on the seabed.
6.8.2 Subsea Flexible Bladder
The second concept is the use of a large volume subsea flexible bladder. When the slurry/acid mixture is pumped from the hub the bladder will fill, and after leaching has finished the bladder can be emptied again. At no stage will the bladder need to withstand a pressure differential.
The principle of the flexible bladder is much easier than the container with a piston concept. However, a suitably strong, marine tolerant, flexible, acid resistant material must be selected. For example, Aero Tec Laboratories (ATL, 2012) make a number of different subsea bladder products from �“materials ranging from thin, flexible films to high strength fabric reinforced rubber.�”
There are already some examples of sub-sea flexible bladder applications, which include bladders for liquid fuels and oxidizers, bladders for hydraulic fluids, flotation chambers, fuel bladders and so on. Furthermore, there are some companies committed to developing materials and technologies for bladders used in the extreme depths of the sea.
A shortcoming of the bladder is that when the leaching is finished, the acid and mud will be pumped out of the bladder simultaneously. To solve this problem, a �‘separator�’ will be used. The specifications of the �‘separator�’ will be discussed in Section 6.9.
Figure 41: Subsea flexible bladder (ATL, 2012)
6.9 Separator
After completion of the leaching process, the slurry mixture contains mud (solids) and water containing aqueous acid and REEs (leachate). In the leaching tank, the leachate will float over the heavier clay that settles to the bottom. However, the phase separation will be

87
incomplete, so that there is a continuous grading from liquids to solids. In the REE mining process outlined, the valuable leachate must be separated from the waste mud, in order to proceed with further purification of the extracted minerals. Consequently, in the proposed concept, the mixture is transferred after the leaching process to a separation facility, where physical separation of solid and liquid phases will take place.
As regards the separation process itself, there are a variety of methods that could be applied, were it to take place on land. In this case, the choice of the right technique from existing methods would depend mainly on the nature of the extracted ore, method of extraction, environmental conditions at extraction point and processing location, cost of equipment, amount and chemical composition of economically valuable minerals etc. However, the situation is complicated considerably by the need to perform the operation underwater, at great pressure, and no commercially available technologies suitable for this task have been found. Subsea processing in the oil and gas industry involves separation of oil and water fractions, and physical separation of sand and liquid, but neither is as challenging as removing fine clay particles (< 2 m, see Section 5.2.3) from suspension. In this case a review of available technologies will be presented, and some comments made on which may be most suitable for adaptation to a deep water environment.
Generally, separation processes are classified into evaporation, drying, distillation, absorption, membrane separation, liquid-liquid extraction, adsorption, ion exchange and liquid-solid leaching. In the current concept speed of operation is critical, as time spent in the system requires construction or acquisition of more subsea volume. Mechanical methods are therefore preferred to chemical, on the basis of rapidity of action. The most common mechanical-physical separation processes are filtration, settling and sedimentation, centrifugal settling and sedimentation, centrifugal filtration and mechanical size reduction and separation (Armenante 2003a). A classification of solid-liquid separation processes is summarized in the following figure (Armenante 2003b).

88
Figure 42: Flow chart of classification of the common solid-liquid separation processes (Armenante, 2003b).
6.9.1 Filtration separation
Filtration is the physical separation of solid particles from liquid or gas using a porous medium that allows fluid to pass through but hinders all or nearly all solid particles, due to its small openings. The accumulated solid is a porous filter cake, that lets the filtrate pass through. As the thickness of the cake increases, the pressure drop across the cake becomes greater (Armenante 2003b). This pressure drop is the driving force for the filtration separation. A very simple schematic illustration of the filtering process is presented in Figure 43.
Figure 43: a) Filtration: solid-liquid separation; b) Mechanisms of filtration (Wacharawichanant 2008a).

89
The filter medium is usually filter paper, woven material, sintered and perforated metal or glass, ceramic, or synthetic membranes. Also, the created solid cake acts as a filter itself. Another classification could be with regard to the filter operating cycle. Two main categories are distinguished in this case: batch processes (discontinuous �– cake is removed after every cycle) and continuous processes (cake is removed continuously). Filter classification is also dependent on the kind of filter used in the filtering process and there are two kinds: pressure filters and vacuum filters. Finally, a very important filtering classification comes from function. In this category, there are three types of filters: cake filters that are used to separate large amounts of solids in a form of a cake of crystals or sludge, clarifying filters in which small amounts of solids are entrapped and crystal clear water is filtrated, and crossflow filters where the feed suspension flows under pressure at a very high velocity across the filter. The basic mechanisms of filtration are presented in Figure 43.
6.9.2 Filter types
Some common types of press filter are described below:
Filter Press: The plates of the filter press may be square or circular, vertical or horizontal. The slurry is admitted to each compartment under pressure. By the end of the process, the liquor passes through the canvas and out a discharge pipe, leaving a wet cake of solids.
Belt filter process: For this continuous process, the slurry needs to be conditioned before filtering, usually by flocculation. The slurry is dewatered by pressing between two travelling belts and by the end of the process, almost all of the water has been expelled.
Plate and Frame Filter Press: In this case, filters consist of plates and frames assembled alternately with a filter cloth over each side of plates. The device must be taken apart and reassembled after each cycle.
Leaf filters: Leaf filters were developed for larger volumes of slurry and more efficient washing. The slurry enters a tank and is forced under pressure to the filter cloth. The filtrate flows inside across the device and then is discharged by a header. The wash liquid follows the same route as the slurry. When the cake is made, the shell opens and the cake is discharged.
Continuous rotary filters are the main representatives of the category of continuous application vacuum filters, though there are many others.
Continuous rotary vacuum-drum filter: This separation method filters, washes, and discharges the cake in a continuous, repeating sequence. A drum is covered with a suitable filtering medium. The drum rotates and an automatic valve in the centre serves to activate the filtering, drying, washing and cake-discharge functions in the cycle. The filtrate leaves

90
through the axle of the filter, while the automatic valve provides separate outlets for the filtrate and the wash liquid. The device is presented in Figure 44.
Figure 44: a) rotary drum filter; b) disc filter (Wacharawichanant, 2008a).
Disc filter: This type of filter is generally used in heavy duty applications such as the dewatering of iron ore taconite, hematite, coal, aluminium hydrate, copper concentrate, pyrite flotation concentrates and other beneficiation processes.
The filter consists of several discs, up to 15 in the larger machines, each made up of sectors which are clamped together to form the disc. The sectors are ribbed towards the neck and designed for a high drainage rate. During operation each sector enters submergence and a cake is formed on the face of the discs. It then emerges to the drying zone, the liquid drains to a central barrel and from there through a valve to the vacuum receiver. The valve with its bridge setting controls the timing, so that once the sector leaves the drying zone it moves over a separating bridge and a snap or low pressure blow is applied to discharge the cake. Scraper blades on the side of each disc guide the cake to discharge chutes which are positioned between adjacent discs and are wide enough to avoid their clogging by the falling cake. A paddle type agitator located at the bottom of the tank maintains the slurry in suspension which in most of the metallurgical applications contains solids with high specific gravity which are fast settling and abrasive. In the disc filter, cake wash is needed before discharging. Furthermore, the cake parts easily from the cloth, which has a high operative value, since it does not clog easily (Halberthal 2006b). The basic components of the disc filter are presented above, in Figure 44.
There are plenty of variables affecting filtration (and centrifugation) processing, such as flow rate of slurry and type of slurry and solid particles contained in it. The second variable includes parameters such as liquid viscosity, liquid density, solid concentration, particle size distribution, surface charge of particles, as well as type and/or shape of particles. Limitations of filtration include inability of solute removal in a solution, separation of chemical constituents present in the same phase, processing of viscous materials and processing of solid wastes (Armenante 2003b).

91
6.9.3 Centrifugal Separation
A centrifuge separates solid particles from a fluid using centrifugal force. Beside direct separation, centrifugal forces can also be used for filtration, in lieu of a pressure difference, to cause the flow of slurry in a filter where a cake of solids builds up on a screen.
There are two main categories of centrifuge: the type used for sedimentation (solid imperforate bowl) and the type used for filtration (perforated bowl). If a centrifuge is used for sedimentation (Wacharawichanant 2008b), a particle of given size (in this case, red clay particles with a size less than 2 m) can be removed from the liquid in bowl if there is sufficient residence time of particle in bowl to reach the wall. In general, solid particles denser than the liquid migrate radially outward toward the wall of the rotating cylinder (sedimentation). Particles less dense than the liquid migrate radially inward toward the axis, and finally they float. If the outer wall is perforated or permeable, liquid will pass through the sedimented solid and wall (centrifuge filtration). The main representatives of sedimenting centrifuges are the solid bowl centrifuges (decanters), disk bowl centrifuges and tubular bowl centrifuges. In our case study the separation process aims to separate liquid-solid phases, thus some of the most common centrifuges used, are going to be presented.
Tubular bowl centrifuge: This can be used to separate solid-liquid or liquid-liquid systems. The feed enters from a stationary nozzle inserted through an opening in bottom of the bowl. The incoming fluid is accelerated under pressure and it separates into two concentric layers inside the bowl. The inner, or lighter, layer spills over a weir at the top of the bowl, while the heavy liquid flows over another weir into a separate cover and discharge spout. It is usually used for low solids applications.
Disk bowl (or disk stack) centrifuge: This may be used in solid-liquid separation but is more often used in liquid-liquid separation processes. When used in solid-liquid separation solids accumulate inside the bowl and periodically must be discharged. This is accomplished by stopping the machine, removing and opening the bowl, and scraping out its load of solids.
Solid bowl centrifuge (decanter): It consists of an elongated cylindrical rotating bowl having a tapered conical end. The suspension is continuously introduced at one end and travels parallel to the bowl axis. The clarified liquid is collected at the end of the cylindrical section of the bowl. A helical scroll rotating at a slightly different speed than the bowl is used to move the solids toward the tapered and where they are continuously removed through ports.
Nozzle-discharge centrifuge: This centrifuge is used when the feed liquid contains more than a few percent solids, because it provides an automatic solids discharging capability. This separator is a modified disk type centrifuge with a double conical bowl. In the periphery of the bowl at its maximum diameter is a set of small holes or nozzles. The central

92
part of the bowl operates in the same way as the usual disk centrifuge, overflowing either one or two streams of clarified liquid.
The typical operating ranges of some centrifuges are presented in Table 11: Typical operating range of centrifuges (Belier 1982).
ScientificApproaches /
CharacteristicsTransport of sediment Solid content in feed
material, % by vol
Maximum throughput in largest machine m3/h
(gpm)
Solids bowl separators Stays in bowl 0-1 150(650)
Solids ejecting nozzle separator
Intermittent discharge through axial channels 0.01-10 200(880)
Solids ejecting separators
Intermittent discharge through radial slot 0.2-20 100(440)
Nozzle separator Continuous discharge
through nozzles or at near bowl periphery
1-30 300(1320)
Decanter Internal screw conveyor 5-80 200(880)
Table 11: Typical operating range of centrifuges (Belier 1982).
A very important diagram for the centrifuges is presented in Figure 45 which correlates the diameter at bowl or basket of the centrifuge with the applied centrifugal force. These two variables are very important designing parameters which affect the centrifugation speed, type and size of sediments that a centrifuge can process, etc. The left diagram correlates the amount of solids in the feed with the solid particle size.

93
Figure 45: (a) Centrifuge design parameters correlation (Perry 1984); (b) recommended centrifuge type for different size and amount of solid particles (Margaritis 2007).
There are also centrifugal filters, which are perforated in order for the liquid to be filtered out of the rotating bowl and the solid to be accumulated in a cake form on the internal side of the filter. However, filtration in centrifuges is more complicated than in pressure devices, since the area for flow and driving force increase with distance from axis and the specific cake resistance may change.
Perforated basket centrifuge: This is a very common centrifugal filtering centrifuge. The solid is intermittently (batch process) removed with a knife (not rotating with the basket) placed inside the basket, and collected in a vertical chute. Drier cakes are obtained with this type of centrifuge than with other types. Consequently, this type of centrifuge is used when the recovery of solids is desirable.
Continuous filtering centrifuges: A rotating basket with a slotted wall is fed through a revolving feed funnel. The purpose of the funnel is to accelerate the feed slurry smoothly. The feed enters the small end of the funnel from a stationary pipe at the axis of the rotation of the basket. It travels toward the large end of the funnel.
Disk bowl centrifuge: This kind of centrifuge can be used for sedimentation as well as for filtration purposes. The solids that accumulate inside the machine must be periodically discharged manually, as was previously described for this type of centrifuge (Wacharawichanant 2008c).

94
6.9.4 Hydrocyclone Separation
Hydrocyclones are another class of separation equipment. They are applied in industry, for clarification, classification, thickening, washing etc. Their basic use is for solid-air separation. However, their use has also expanded in liquid solid separation. Their shape is normally cylindrical at the top, where liquid is fed tangentially, and their base is conical. The angle, and hence the length of the conical section, plays a role in determining operating characteristics. Across the central axis there are two main exits: a smaller at the bottom (underflow or reject of coarser and thicker fraction) and a larger at the top (overflow or accept of lighter and finer fraction). Internally, centrifugal force is countered by the resistance of the liquid, causing the larger or denser particles to accumulate on the wall and be rejected from the bottom, while the finer particles remain in the liquid and exit from the top end of the device.
The basic principle of hydrocyclones is the same as for centrifugal sedimentation; the suspended particles are subjected to centrifugal acceleration, which makes them separate from the fluid. However, unlike centrifuges, cyclones have no moving parts and the necessary vortex motion is performed by the fluid itself. A typical hydrocyclone is presented in Figure 46.
Figure 46: Schematic diagram of a typical hydrocyclone (Svarovsky 2000)
During the separation process, the suspension density and apparent viscosity will vary and different feed solid particle size distributions will result in different spatial distributions of these two variables. Both the pressure drop and the separation efficiency depend strongly on the variation of these parameters (Ditria et al 1994). Therefore, the separation efficiency has a probabilistic character, which has to do with the probability of the position of the different particles in the entrance to the cyclone, their chances of separation in the boundary layer

95
flow and the general probabilistic character of turbulent flow inside the cyclone. Coarse particles are always more likely to be separated than fine particles. Thus, the hydrocyclone processes the feed solids by an efficiency curve called �“grade efficiency�”, which is a percentage increasing with particle size (Figure 47). The diameters of individual cyclones range from 10mm to 2.5m, cut sizes for most solids range from 2 to 250 m, flow rates (capacities) of single units range from 0.1 to 7200 m3/h. In case considered, red clay particles have an average value of 2 m or less, hence the hydrocyclone is at its lower limit of cut size for performance around 50%.
Figure 47: Grade efficiency curves for a hydrocyclone (Svarovsky 2000)
The advantages of hydrocyclones are as follows: they can be used for different applications, such as liquid clarification, slurry thickening, solids washing, solids clarification by particle size, particle size measurement etc. They are also simple and cheap to purchase, install and run, and require little in terms of maintenance. In addition, they are small relative to other separators, thus saving space, while they also give low residence times, thus saving time. Their disadvantages are that they are strongly dependent on flow rate and feed concentration and they are very sensitive to general instabilities in feed flow rate and solids concentration. Their performance is also limited by the restricted range of the particles cut size. This problem can be resolved by multistage arrangements, but at additional costs in terms of power and investment.
In the proposed concept, the volume ratio of water to mud is 10:1. This means that the concentration of clay particles into the solid/liquid mixture is around 10%. In this case, we could say that the feed liquid has only small amounts of solids, and since this amount is less than 12%, a clarification process could be applied to maximize the mass recovery of solids form the feed. The operating variables in this case include dilute feed, relatively open underflow orifice and high pressure drop. The design variables are small diameter, narrow-angle cyclone and high efficiency design (small inlet and overflow orifices etc). In a single cyclone installation the minimum effective particle size is around 2 m, which has the

96
potential to be improved if multiple cyclones are used. Clarification applications may include removal of silt from water or removal of any other fine particles from aqueous suspensions.
Thus, separation with a cyclone could probably be used for separation of clay particles from water, but the risk of such a process using a cyclone is greater than using a centrifuge, due to its limited performance with particle sizes smaller than 2 m. It is known, however, that hydrocyclones are more effective in sand and silt separation than separation of fine clay particles.
6.9.5 Conclusions
In this chapter, some basic separation processes were analysed, in order to propose one for REE separation subsea, in the proposed concept. The depth is around 4500m and the pressure around 40MPa. Consequently, the ambient conditions impose a major limitation as regards the type of separator that could be effectively employed at such depths. Three main separation procedures were presented: filtration, centrifugation and hydrocyclone separation. Each procedure is divided into other categories, broadening the range of candidate separators.
Cyclone separation may not be a feasible solution for REE subsea separation. This is because this kind of device is mainly employed in drilling applications where air/liquid or liquid/liquid separations are required. Although there are some remarkable steps being taken in the development of a hydrocyclone suitable for solid/liquid separation, hydrocyclones are still strongly dependent on the feed flow rate and solid particles cut size, performing effectively only at cut sizes greater than 2 m. The red clay encountered at the seabed considered has a grain size of less than 2 m. Therefore, the equipment could be really sensitive, with an uncertain grade efficiency and inadequate control ability (due to the large depth). However, hydrocyclones main advantages, which are the simplicity of its structure and the absence of moving parts make it seem a good solution for subsea application.
Press filtering seems to constitute a potential solution to the subsea separation problem, but these procedures have many parts requiring maintenance after a period of time, so they may not be an ideal solution in this particular case. However, if one of the filters discussed above were chosen, the continuous rotary vacuum-drum filter could be a potential alternative. This is because it is a simple concept (with low maintenance needs), it operates continuously and it can also perform in automatic mode. However, filtering, even though it seems to be recommended for particle sizes as small as 0.1-1 m, requires high pressure drops (vacuum separation) which might, in turn, lead to high energy needs subsea, thus increasing costs. Furthermore, discharged wastes contain an amount of residual liquid, while in this case a more thickened cake, with as little water composition as possible, is required. Although a

97
belt filter press could give a thicker cake as a final product, the pressure differences required for processing might be prohibitive for a subsea operation.
A potential solution for REE subsea mining could be a disc, nozzle type centrifuge separator (Figure 48). This centrifuge functions continuously, discharging the solids automatically as slurry. The shape of the bowl is modified so that the sludge space has a conical section thus providing a good storage volume and also giving a good flow profile for the ejected sludge.
Figure 48: Schematic diagram of a nozzle-type disc centrifuge (Svarovski 2000).
An important application of this centrifuge is separating kaolin clay, which is usually found in fine grain sizes. Also, according to the diagram proposed by Margaritis (2007), for a clay particle size of 2 m and a solid fraction up to 20% a disc centrifuge is considered the best option. Another option could be the disc, solids ejecting type centrifuge, but it is usually used where there is a medium concentration of solids of 2-6%, so that neither continuous discharge nor batch operation would be optimum. In this case, the daily volume of mud-water mixture to be separated has been calculated as about 1280m3/h. So, a centrifuge in continuous operation seems to be a rational choice.
Further challenges that need to be addressed include the selection of material and container vessel. Since the centrifuges are delicate devices that perform efficiently in certain conditions, during a subsea operation the centrifugal system should if possible be secured in an enclosed space, such as a pressure vessel. The material of the vessel should be pressure and HIC (hydrogen induced cracking) resistant. Materials such as titanium or high strength steel lined with ceramic polymer have proven to be effective.
However, subsea centrifugal separation needs further study, testing and evaluation from the scientific community before an integrated separation system for subsea mining can be proposed.

98
6.10 Lifting system
Precipitated REEs must be transported from the hub of the processing system on the seabed to the vessel on the sea surface. Also, various chemicals which are needed for processing must be supplied from the vessel to the processing system. Acid for leaching REE, precipitating agent for extracting REE from leached acid water and base for neutralizing the acid water before discharging must all be transported down in separate compartments. The distance from the vessel to the processing system is over 4,000 meters. To deliver these materials safely, a winch system will be used. If a container size is 5 cubic meters, then it can carry about 125 m3 volume of liquids or solids. If the container is filled with extracted REEs and water, almost 100 tons of REEs can be carried in a container. A container of 5 cubic meters can be handled by the winch. Some marine hydraulic winches are designed to lift over 100 tons. However, the wire length should be almost 5,000 meters. For that, a special winch which has an especially large diameter or multi-drums should be designed.
The REE containers are delivered to the vessel when they are filled with REEs. The unloaded REE containers filled with water for balancing pressure will be carried down to the processing system. The chemical containers deliver chemicals such as acid, base, and precipitating agent from the vessel to the processing system on the seabed on a chemical supplying schedule. The unloaded chemical containers will also be pulled up to the vessel under pressure equivalence. The containers approaching the vessel or the processing systems will be controlled and lifting speed and lowering speed will be slowed down for capturing the containers. When the containers are moved to the vessel, lifting equipment such as a crane will be used. When the containers are positioned in the lifting system at the seabed, a Remotely Operated Vehicle (ROV) will help the containers to be set.
The containers will be distinguished by colour, shape, size or marks. In the lifting system, produced REEs move to one REE container and empty REE containers wait for loading in a queue. The fully loaded REE containers will be lifted up, and the next empty container will be moved to loading position. The unloaded container on the vessel will be sent to the lifting system, and it will be located in the last position of the queue. The moving process of chemical containers is similar to that for REE containers. However, containers filled with chemicals will wait for unloading in a queue. The completely unloaded containers will be lifted up, and the next chemical container will be moved to the unloading position.
The final batch of leachate collected in the REE tank from the REE precipitator is then lifted to the ocean surface using the PSV�’s crane.
The lifting operations will be guided by the ROV during the entire operation to avoid the loss of product during the course of lifting.

99
6.11 Remotely Operated Vehicle (ROV)
The ROV is an underwater robot that has a unique capability to perform tasks that could not be undertaken by human beings due to environmental limitations. This concept is required for the purpose of undertaking inspection and installation of seafloor equipment. The ROV is also required for the execution of all the remote operations of REE mining and preliminary processing.
It consists of the main body of the machine which is tethered through an umbilical to the PSV on the ocean surface. Figure 49 shows a picture of a functional ROV. Some notable features of the ROV include the following components:
i. Two manipulators which are the working �“arms�” of the equipment.
ii. Ballast tanks: for stability proposes
iii. Thrusters for propulsion and manoeuvrability
iv. High resolution video cameras needed for interactive operations.
Figure 49: Remotely operated vehicle. (http://www.sub-find.com/panther.htm)
6.12 Installation and testing
The REE mining operation starts with the deployment of the REE mud collector and the installations of other seafloor facilities such as the mud distributor, leaching and acid tanks, separators etc. The ROV is expected to play a significant role in carrying out a pre-installation survey of the site and the installation operations. Once all the seafloor facilities

100
are installed, testing of both individual component and the collective system should be performed to ensure the integrity of the concept.
6.13 Summary
The concept presented in this chapter is based on a subsea processing, riserless model for REE extraction from the seabed. Subsea processing raises many questions which require future work, but it is believed that this idea offers promise.
The chapter has outlined basic principles and options for many of the required components, but detailed design of a working system would be an altogether different challenge.

101
7 Finance, Logistics, Risk
7.1 Commercial arrangements
Rare earth metals are typically not sold through exchanges, but in long-term supply agreements between private parties (British Geological Survey, 2011). For example, Lynas Corporation�’s Annual 2011 Report (Lynas, 2011) says that they have a �“Strategic Alliance Agreement�” with the Japanese company Sojitz, a long term supply agreement with BASF and a letter of intent with Siemens for a magnet production Joint Venture. The Lynas project has a processing and advanced materials plant in Malaysia.
In considering potential customers the leading importers of rare earths in Section 2.4 should be borne in mind; Japan, the US, Germany and France. Of these Japan and the US are the closest to the site, but pursuing an arrangement with a French company may be associated with large advantages in navigating the legal intricacies of the French Polynesia-France relationship. A French company like Rhodia, which has signed two rare-earth agreements in the 2011-2012 financial year (with China Rare Metals and Rare Earth Co. and Tantalus Rare Earths AG �– Rhodia, 2012), may be an option.
7.2 Commercial Analysis
Some commercial estimates have been made for the system designed in Chapter 6. The components of the seabed REE mining facility have been divided into two groups for the purpose of doing a financial analysis of the entire project. The groups are ocean surface and seabed facilities. The following components are included in CAPEX estimate:
Ocean Surface Facilities:
Production Support Vessel Umbilical
Seafloor Facilities
REE Mud Collector Leaching and Acid tanks Work-Class ROV Separators Pumps and Pipe works Acid Precipitators and Recyclers
The following items have been excluded from the expenditure estimates:
Leachate, storage and load-out onto supply vessels at the Port of Tahiti.

104
Shipping from load out facility to concentrate processing plant. Concentrator facility and / or charges. Shipping from concentrator facility to smelter clients. PSV/Supply Vessel dry docking costs (for maintaining class obligations) during life of mine operations. Site demobilisation costs.
The following components are included in the OPEX estimate:
Supply vessel (To be chartered) ProcessingFuel ChemicalsPersonnel Maintenance
7.2.1 Capital cost (CAPEX)
The total capital cost for the facilities required by this concept to mine REE from the seabed including a contingency of 10% is US$173m. A summary of the CAPEX cost is given in Table 12.
Capital Cost Type Cost (US$)
PSV 94,000,000
UMBILICALS 21,200,000
MUDCOLLECTOR 25,000,000
TANKS(LEACHING &
ACID) 6,000,000
CENTRIFUGAL PUMP 10,000,000
ROV 10,000,000
PUMP AND PIPES 3,000,000
CONTINGENCY (10%) 16,920,000
TOTAL 186,120,000
Table 12: Capital cost in US dollars.

103
7.2.2 Operating cost (OPEX)
The daily operating costs for mining seabed REE and the delivery of the leachate to the port of Papeete is estimated to be US$304,150 per day. The breakdown of this cost is shown in Table 13. A contingency of 10% has been included in the cost this brings the total annual operating cost to US$61m.
Operating Cost Type Cost (US$)
SUPPLYVESSEL 9,000
PROCESSING 75,000
FUEL 20,000
MAINTENANCE 20,000
PERSONNEL 72,500
CHEMICALS 80,000
CONTINGENCY (10%) 27,650
TOTAL 304,150
Table 13: Operating Cost in US dollars.
7.2.3 Price forecast
The price of REE per tonne for three market scenarios has been presented in Table 14: Average price of REE per tonne in US dollars.. These prices span the range of prices in the last 15 years �– this approach allows us to account for the possibility of fluctuations due to unforeseen market events and has been adopted in light of the high uncertainty surrounding REE price forecasts (see Section 2.5).
US$ per ton LREE HREE
Lowest price 3,233 141,533
Present price 78,333 158,333
Highest price 204,833 337,284
Table 14: Average price of REE per tonne in US dollars.

104
The estimated total annual revenue based on the lowest, present and highest average prices of REE are presented in Table 15. The revenue was calculated based on an annual production of 2,000 tonnes of REE.
US$ per year LREE HREE Profit(LREE:HREE = 8:2)
Lowest average price 6,466,000 283,066,000 61,786,000
Present average price 156,666,000 316,666,000 188,666,000
Highest average price 409,666,000 674,568,000 462,646,400
Table 15: Estimated Annual Revenue in US dollars.
Based on the above information (Tables 1.3 & 1.4), and using a 20 year operating period a Net Present Value (NPV) calculation in US dollars was performed. A plot showing the net profit for the entire life of the project based on 8% discount rate is given in Figure 50.
Discount rate Lowest average price Present average price Highest average price
5% -165,000,000 1,416,000,000 4,830,000,000
8% -163,000,000 1,083,000,000 3,773,000,000
10% -161,000,000 919,000,000 3,252,000,000
Table 16: NPV figures.
It may be seen that the NPV calculations merely reflect the huge spread in input prices, without adding a great deal of extra information. For these calculations to become more meaningful better price and cost input data would be required. Price data could become more certain if a contract was being drawn up, while cost data would necessarily decrease as a design moved from the concept to detail stage.

105
Figure 50: NPV in US dollars for discount rate of 8%.
7.3 Risk analysis
Quantitative risk analysis was investigated through a simplified analysis process. Risk was evaluated by multiplying consequence and probability estimates. Before classifying risks into consequence and probability rating categories, the mining system was analysed using a flow diagram which was based on the concept presented in this report. Every risk analysis step was evaluated by workshop brainstorming. The process was as follows:
1. Classify the main components of the mining system. 2. Define the process modes for every classified component. 3. Define the failure mode and find failure scenarios for each process mode. Several
failure scenarios can be found for one process mode. Here, the most severe scenario was selected.
4. Assign each failure scenario to a consequence class for each of the categories �‘personnel illness/injury�’, �‘environmental�’, and �‘equipment failure�’. Table 18 was used for classifying.
5. Decide the probability ranking of each failure scenario. Table 18 was used for classifying.
6. Find the Risk Priority Code (RPC) for each failure scenario based on the evaluated consequence and probability. If the RPC is 1, the concept design should be modified to mitigate the risk of the scenario.
7. Evaluate the RPC and find the highest risk scenario, then consider mitigation measures for the scenario.
0.5
0.0
0.5
1.0
1.5
2.0
2.5
3.0
3.5
4.0
1 2 3 4 5 6 7 8 9 10 11 12 13 14 15 16 17 18 19 20
Billions
NPV for the Lowest price
NPV for the Present price
NPV for the Highest price

106
The Risk Priority Codes for all scenarios were evaluated for the category (�‘personnel illness/injury�’, �‘environmental�’, and �‘equipment failure�’) with the worst consequence class. The RPC of all scenarios was 2, or medium risk (Table 17 andTable 18). However, because a lot of concentrated acid would be required in the planned mining system, only �‘personnel illness/injury�’ cases for on board processes and �‘environmental�’ cases for the underwater processes were considered. Mitigation measures for those cases should be further performed under a rigorous management system.

107
Component Process Mode Failure Mode Consequences Class
Probability Risk Priority Code Mitigation Personnel
illness/injury Environmental Equipment Failure
Chemical system
Transportation of chemicals to the PSV
Leakage during transportation of chemicals with supply vessel
II IV IV D 2 (II, D)
Ensure the use of water tight transport container and competent personnel for handling chemicals in accordance with COSHH regulations
Transfer of chemicals from supply vessel to PSV
Leakage during transportation of chemicals with supply vessel
II IV III C 2 (II, C)
Ensure the use of water tight transport container and competent personnel for handling chemicals in accordance with COSHH regulations
Storage of chemicals on the PSV
Leakage during the storage III IV III C 2
(III, C)
Ensure the use of water tight transport container and competent personnel for handling chemicals in accordance with COSHH regulations
Deployment of chemical to seabed tanks
Leakage during deployment of chemicals to seabed
V I IV D 2 (I, D)
Ensure the use of water tight containers for lifting system and provide adequate redundancy in the design of the tanks
Storage of chemicals on the seabed
Leakage during storage on the seabed V III I D 2
(I, D)
Ensure the use of water tight containers for lifting system and provide adequate redundancy in the design of the tanks, equip pH sensors and adequate monitoring devices
Use of Chemicals on the seabed for leaching
Leakage during processing V III III D 2
(III, D)
Use water tight pipes and valves for pumping system and provide adequate redundancy in the design of tank, equip pH sensors and adequate monitoring devices
Disposal of chemical on the seabed
Leakage before and during recycling V IV IV C 2
(IV, C)
Use trained personnel for handling acid on vessel in accordance with requirements of COSHH
Vessel Vessels
approaching Collision IV III II D 2
(II, D) Use competent personnel for monitoring of the operations
Weather/station keeping
Strong wind/tidal movement IV V III B 2
(III, B) Proper use of weather data for operational planning
Operating Power loss V V II D 2
(II, D) Provide adequate redundancy in the design generation and distribution system
Umbilical Loss of strength Snapping of the
cable V V I D 2 (I, D)
Use high strength umbilical cable from approved supplier

108
Third party interference
Snapping of the cable V V I D 2
(I, D) Surveillance
Mud collector
Operating Mechanical failure V V I D 2 (I, D)
Robust design of the machine and provide adequate redundancy
Operating Damage to component V V I D 2
(I, D) Use competent personnel and robust design
Deployment to and recovery from site
Lost or damage to the machine V V I D 2
(I, D)
Ensure caution during the deployment and lifting operations and also use appropriate equipment
Tanks Product
containment Leakage
V III IV C 2 (III, C)
Ensure the use of water tight containers for storage and provide redundancy design for tank, equip pH sensors and adequate monitoring devices
Separator Operating Mechanical failure V III III C 2
(III, C) Robust design of the machine and provide adequate redundancy
Deployment to and recovery from site
Lost or damage of machine V III III D 2
(III, D)
Ensure caution during the deployment and lifting operations and also use appropriate equipment
Pressure containment
Leakage
V III IV C 2 (III, C)
Ensure the use of water tight containers for storage and provide redundancy in the design of tanks, equip pH sensors and adequate monitoring devices
Pumps and pipes
Operating Leakage V III III C 2 (III, C)
Use high strength pipes and good quality pumps from approved supplier
Deployment to and recovery from site
Lost or damage of machine V III III D 2
(III, D)
Ensure caution during the deployment and lifting operations and also use appropriate equipment
Table 17: Risk analysis matrix for the mining system.

109
Hazard Severity Category
Descriptive Words
ACTUAL / POTENTIAL CONSEQUENCE PROBABILITY RATING
Personnel Illness / Injury
Environmental (Any incident that�…)
Equipment Failure; Quality; Incident
Cost of Loss
A B C D E
Very Likely Likely Possible Unlikely Very
Unlikely
I Very High Fatality(s), terminal lung disease or permanent debility
Potentially harms or adversely affects the general public and has the potential for widespread public concern of operations. Can have serious economic liability on the business.
> $ 1m 1
II High
Serious injury, poisoning, sensitisation or dangerous infection
Potentially harms or adversely affects employees and the environment at the worksite. Requires specialised expertise or resources for correction.
> $ 250,000
III Moderate
Injury leading to a lost time accident or persistent dermatitis or acne
Potentially harms or adversely affects employees and the environment at the worksite. Requires general expertise or resources for correction.
> $ 50,000 2
IV Slight
Mino injury requiring first aid treatment or headache, nausea, dizziness, mild rashes
Presents limited harm to the environment and requires general expertise or resources for correction.
> $ 10,000
V Negligible Negligible injury or health implications, no absence from work
Presents limited harm to the environment and requires minor correction action. < $ 10,000 3
Table 18: Consequence categories and probability rating matrix for risk analysis.
PROBABILITY RATING
A. VERY LIKELY: Almost inevitable that an incident would result. B. LIKELY: Not certain to happen but an additional factor may result in an incident. C. POSSIBLE: Could happen when additional factors are present but otherwise unlikely to occur. D. UNLIKELY: A rare combination of factors would be required for an incident to result. E. VERY UNLIKELY: A freak combination of factors would be required for an incident to result.

110
RISK PRIORITY CODE (RPC)
1. HIGH RISK: Must not proceed. Change task or further control measures required to reduce risk. 2. MEDIUM RISK: Can only proceed with senior management authorisation. 3. LOW RISK: Permissible by those trained and authorised to do so but a review should be carried out to see if risk can be reduced further.

111
8 ConclusionThis report has sought to develop a concept for seabed mining of rare earth elements from seabed mud in the eastern South Pacific and to identify related issues. It is obviously difficult to make a useful statement about the viability, or otherwise, of this venture when almost no resource data is available and rare earth prices are so difficult to predict. In the limited time available a complete solution for REE extraction has not been developed �– several areas still require much technical development.
However, it is felt that some interesting points have come out of this report.
Firstly, the concept of subsea processing, much used in oil and gas at this time, is felt to have considerable value in the case of seabed mining of REEs. Although many technical challenges remain, the prospect of transporting enough mud to the surface to extract an economic quantity of REEs is much more daunting. Some schemes that were discussed at the development stage, including seabed power plants, buoyancy-driven lifting, etc, may become more feasible with technical progress.
Given the ongoing demand for REEs and the problems associated with their mining on land, it is felt that exploration of the seabed REE resource may well lead to economically interesting results despite the price uncertainty that is so apparent when trying to forecast REE value into the future. In this exploration phase there are a number of interesting technologies that could be used
However, it is felt that there is good reason for such exploration to take place. If rare earth elements are to be separated from seafloor muds, the French Polynesian EEZ seems to be a good candidate, though the effect of such activities on a still largely unknown environment should be taken into account.

112
ReferencesABS (2006). Guide for Building and Classing Subsea Pipeline Systems. Houston, USA.
Armenante, P.M. (2003a). Waste water and waste treatment processes. Lecture notes in �“Industrial Waste Control: Physical and Chemical Treatment�”. New Jersey Institute of Technology, US.
Armenante, P.M. (2003b). Filtration. Lecture notes in �“Industrial Waste Control: Physical and Chemical Treatment�”. New Jersey Institute of Technology, US.
Armenante, P.M. (2003c). Cake filtration. Lecture notes in �“Industrial Waste Control: Physical and Chemical Treatment�”. New Jersey Institute of Technology, US.
Armenante, P.M. (2003d). Centrifugation. Lecture notes in �“Industrial Waste Control: Physical and Chemical Treatment�”. New Jersey Institute of Technology, US.
ATL (2012) http://www.atlinc.com/oceanic.html
Avalon Rare Metals Inc (2009). Rare Earths 101, [online]. Available: http://avalonraremetals.com/_resources/REE101-2012efile.pdf [Accessed 26 August 2012].
Bandow D. (1982). Developing the Mineral Resources of the Seabed, Cato Journal, vol.2(3).
Bakker, F., Delaney, B., Mercer, B., Qi, D. (2011). Technical Report on the Nechalacho Deposit, Thor Lake Project, Northwest Territories, Canada, Avalon Rare Metals Inc, Toronto, Canada.
Belier, P. (1982). Recovery Processes �– Past, Present and Future. American Chemical Society Mtg, 184.
Berge, S. Markussen, J. M. and Vigerust, G. (1991). Environmental consequences of deep seabed mining. Problem Areas and Regulations. The Fridtjof Nansen Institute, Lysaker, Norway.
Binns, R. (2011). Seafloor massive sulphide (SMS) potential within and beyond national jurisdiction in the Asia-pacific region. ISA International Workshop on Environmental Management Needs for Exploration and Exploitation of Deep Seabed Minerals, Nadi, Fiji.
Blackburn, J., Jankowski, P., Heymann, E., Chwastiak, P., See, A., Munro, P., Lipton, I. (2010). Offshore Production System Definition and Cost Study, SRK Consulting, Perth, Australia.
Bonneville, A. and Sichoix, L. (1998). Topographie des fonds océaniques de la Polynésie française : synthèse et analyse, Géologie de la France, 3, 15-28.

113
Bray R.N., Bates A. D., and Land J.M. (1996). Dredging, A Handbook for Engineers (second edition), Elsevier, UK.
Breen, J., de Souza, P., Timms, G., McCulloch, J., Ollington, R. (2012). Analysis of heavy metals in marine sediment using a portable X-ray fluorescence spectrometer onboard an Autonomous Underwater Vehicle, OCEANS, 2012 - Yeosu, 1-5.
British Geological Survey (2011). Rare Earth Elements, British Geological Survey, Nottingham, UK.
Chung, J.S. Schriever, G. Sharma, R. & Yamazaki, T. (2002). Deep seabed mining environment: preliminary engineering and environmental assessment. International Society of Offshore and Polar Engineers (ISOPE) Special Report OMS-EN-1.
Chung, J. S. (2005). Deep-ocean Mining Technology: Development II. Proceedings of the Sixth ISOPE Ocean Mining Symposium, Changsha, Hunan, China.
Chung, J.S. (2009). Advanced in Deep-Ocean Mining Technology III: Developments, Proceedings of the Eighth ISOPE Ocean Mining Symposium, Chennai, India.
Clarke, F.W. (1907). The composition of the red clay. The Journal of Geology, 15:8,783-789.
Copley, J. (2012). Ocean life: expeditions and essays exploring the abyss. Licence Notes, Smashwords.
Courtois, C. and Clauer, N. (1980), Rare earth elements and strontium isotopes of polymetallic nodules from southeastern Pacific Ocean, Sedimentology, 27:6, 687-695.
Cremers, D.A. and Radziemski, L.J. (2006), Handbook of Laser-Induced Breakdown Spectroscopy, Wiley, Chichester, UK.
David., A. (2011). Underwater environmental impact assessments on marine mammals and fish by high power anthropogenic radiated sound. Proceedings of ACOUSTICS 2011, Gold Coast, Australia
David AC, (2012). [on line] Available: www.cs.ucdavis.edu/~rogaway/classes/188 /material/bp.pdf, [Accessed 28 August 2012].
Doyle C, Wicks C. and Nally F, (2006). Mining in the Philippines: Concerns and Conflict, Columban Fathers, West Midland, UK.
Elam, W.T., Adams, J.W., Hudson, K.R., McDonald, B.J. Gilfrich, J.V. and Galambos, J. (2000). In-situ environmental XRF, Advances in X-Ray Analysis, 42, 137-145.
Ellis, D.V.; Poling, G.W.; Bare, R.L. (1995). Submarine Tailings Disposal (STD) for Mines: An Introduction. Marine Georesources and Geotechnology, v. 13 n. 1-2, p 3-18.

114
Elisabeth Behrmann and Gopal Ratnam (2010). Lynas Says Rare Earths Demand to Grow at 9% a Year, [online]. Available: http://www.bloomberg.com/news/2010-10-25/lynas-corp-says-global-demand-for-rare-earths-to-expand-at-9-annually.html [Accessed 26 August 2012].
Freudenthal, T., and Wefer, G. (2009). Shallow drilling in the deep sea: a new technological perspective for the next phase of scientific ocean drilling, IODP New Ventures in Exploring Scientific Targets (INVEST) Conference.
Gardiner, R. and Miles, A. (2006). Surf Zone Ground Investigation Using ROV-mounted CPT, Hydro International, 10:4
Glasby, G.P. (2010). Deep Seabed Mining: Past Failures and Future Prospects, Marine Georesources and Geotechnology, 20:2, 161-176
Goonan, T.G., (2011), Rare earth elements�—End use and recyclability: U.S. Geological Survey Scientific Investigations Report 2011�–5094, available only at http://pubs.usgs.gov/sir/2011/5094/.
Grasso, V.B., (2012). Rare Earth Elements in National Defense: Background, Oversight Issues, and Options for Congress, Congressional Research Service, Washington, US
Griffiths, G. and McPhail, S.D. (2011). AUVs for Depth and Distance: Autosub6000 and Autosub Long Range. Sea Technology, 52:12, 27-30.
Halberthal, J. (2006a). The rotary drum filter [online]. Available http://www.solidliquid-separation.com/VacuumFilters/vacuum.htm [Accessed 27 August 2012].
Halberthal, J. (2006b). The disc filter [online]. Available http://www.solidliquid-separation.com/VacuumFilters/vacuum.htm [Accessed 27 August 2012].
Handschuh R., Grebe H. et al. (2001). Innovative Deep Ocean Mining Concept based on Flexible Riser and Self-propelled Mining Machines. Proceedings of The Fourth Ocean Mining Symposium, 23-27.
Hays, J.D. Cook, H.E. Jenkins, D.G. Cook, F.M. Fuller, J. Goll, R. Milow, E.D. Orr, W. (1972a.). Introduction, DSDP Volume IX
Hays, J.D. Cook, H.E. Jenkins, D.G. Cook, F.M. Fuller, J. Goll, R. Milow, E.D. Orr, W. (1972b). Site 76, DSDP Volume IX
Hein, J.R. (2011). Deep-Ocean Mineral Deposits in the Asia-Pacific and Beyond. SPC/SOPAC-ISA International Workshop on Environmental Needs for Deep Seabed Minerals, Nadi, Fiji.
Hoagland, P. Beaulieu, S. Tivey, M.A. Eggert, R.G. German, C. Glowka, L. & Lin. J. (2010). Deep sea mining of seafloor massive sulfides. Marine Policy, 34, 728-732.

115
Ingole, B., Pavithran, S., Ali Ansari, Z., (2005). Restoration of deep-sea macrofauna after simulated benthic disturbance in the Central Indian Basin, Marine Georesources and Geotechnology, 23
S.Hrg. (2007). Hearing before the Senate Committee on Energy and Natural Resources, The United States Senates.
Intergovernmental Oceanographic Commission IOC, (2009), Global Open Oceans and Deep Seabed: biogeographic classification, UNESCO, Paris, France
ISA, 2012a, http://www.isa.org.jm/en/mcode, accessed 20/8/12.
ISA, 2012b, http://www.isa.org.jm/en/node/770, accessed 24/8/12.
ISA Report, (2009). Prospects for deep sea mining, International Seabed Authority(ISA), Kingston, Jamaica.
Jankowski, J.A. Malcherek, A. & Zielke, W. (1995). Numerical modelling of suspended sediment due to deep-sea mining. Journal of Geophysical Research-Oceans: 1-39.
Information Office of the State Council, (2012). Situation and Policy of China�’s Rare Earth Industry, Foreign Language Press, Beijing, China
Jones, S. and Jones, M. (2001). Overview of Deep Sea Tailing Placement January 2001 Update, NSR Environmental Consultants Pty Ltd, Victoria, Australia for BHP Minerals.
Jordahl, K., Caress, D., McNutt, M. and Bonneville, A. (2004). Seafloor topography and morphology of the Superswell region, in Oceanic Hotspots, R. Hékinian, P. Stoffers and J.-L. Cheminée, eds., Springer-Verlag, 9-28
Kato, Y., Koichrio, F., Nakamura, K., Takaya, Y., Kitamura, K., Ohta, J., Toda, R., Nakashima, T. and Iwamori, H. (2011). Deep-sea mud in the Pacific Ocean as a potential resource for rare-earth elements, Nature Geoscience, 4, 535-539.
Keller, G. H., (1967). Shear strength and other physical properties of sediments from some ocean basins, Proc. Conf. on Civil Eng. In the Oceans, San Francisco, U.S.
Kowalczyk, P., (2011). Geophysical exploration for Submarine Massive Sulfide deposits, OCEANS 2011, 1-5.
Le Visage, C., Auzende, J.M., Bonneville, A. and Grandperrin, R. (1998). Inventory of the Economic Zones of the French Territories in the Pacific, International Hydrographic Review, 75:1, 107-118.
Li, L. & Jue, Z. (2005). Research of China�’s Pilot-miner in the Mining System of Poly-metallic nodule. Proceedings of the Sixth Ocean Mining Symposium, 2005 Changsha, Hunan, China.

116
London Protocol (1996). 1996 Protocol to the Convention on the Prevention of Marine Pollution by Dumping of Wastes and Other Matter of December 1972. Annex I,Article4.[online].Available http://www.imo.org/OurWork/Environment/SpecialProgrammesAndInitiatives/Pages/London-Convention-and-Protocol.aspx [Accessed 24 August 2012].
Lurton, X. (2002). An Introduction to Underwater Acoustics, Praxis, Chichester, UK.
Lynas, (2011), 2011 Annual Report, Lynas Corporation Ltd, Sydney, Australia
MacBirde Jr, W.L and Bei W.,(2001). Chinese Mining Law overview, [on line] Available: http://www.gsjw.com/catalogs/catalog110/section173/file51.pdf. [Accessed 28 August, 2012].
Margaritis, A. (2007). Centrifugation processes. Lecture Notes, University of Western Ontario, Canada.
Marc Humphries (2012). Rare Earth elements: The global supply Chain, [online]. Available: www.fas.org/sgp/crs/natsec/R41347.pdf [Accessed 26 August 2012].
Markussen, J.M. (1994). Deep Seabed Mining and the Environment: Consequences, Perceptions, and Regulations. Green Yearbook of International Co-operation on Environment and Development, Oxford University Press: 31-39.
Matt Gowing and Raveel Afzaa (2011). Rare Earth Industry update, [online]. Available: http://www.ggg.gl/userfiles/file/Broker_Research_Reports/Rare_Earth_Mackie_Industry_Update.pdf [Accessed 26 August 2012].
Michel, A.P.M., Farr, N.E. and Chave, A.D. (2006). Evaluation of laser-induced breakdown spectroscopy (LIBS) as a new in situ chemical sensing technique for the deep ocean, OCEANS 2006 , 1-5.
Molycorp, (1993). Lanthanides: A Lanthology, Molycorp, Inc, Mountain Pass, USA
Molycorp, (2012). http://www.molycorp.com/about-us/project-phoenix
Morgan, C.L. (2011). Potential environmental impact of seabed mining. International Workshop on Environmental Management Needs for Exploration and Exploitation of Deep Seabed Minerals, Nadi, Fiji.
Murray, R. W. & Leinen, M. (1993). Chemical transport to the seafloor of the equatorial Pacific Ocean across a latitudinal transect at 135_ W: Tracking sedimentary major, trace and rare earth element fluxes at the Equator and the Intertropical Convergence Zone. Geochim. Cosmochim. Acta, 57, 4141-4163

117
Nollkaemper, A. (1991). Deep sea-bed mining and the protection of the marine environment. Law of the Sea: The Montego Bay Convention and the Preparatory Commission.Inter University Centre of Postgraduate Studies, Dubrovnik,4-9 June 1990.
Norcomp, (2012), Rare earth materials/metals, Norcomp, Charlotte, USA [online]. Available http://www.norcomp.net/documents/NorComp-Rare-Earth-Materials.pdf
Perry, R. and Green, D. (1984). Perry�’s Chemical Engineers�’ Handbook. 6th Edition ,The McGraw-Hill Companies Inc, FR.
Reichelt-Brushett, A. (2012). Risk Assessment and Ecotoxicology: Limitations and Recommendations for Ocean Disposal of Mine Waste in the Coral Triangle. Oceanography [online]. Available http://dx.doi.org/10.5670/oceanog.2012.64. [Accessed 23 August 2012].
Rhodia (2012) http://www.rhodia.com/en/news_center/news_releases/ [Accessed 26 August 2012].
Riccobene, G., (2009). Long-term measurements of acoustic background noise in very deep sea. Nuclear Instruments and Methods in Physics Research A, 604, 5149-5157
Rogers, A.D. (2004) The Biology, Ecology and Vulnerability of Seamount Communities, International Union for Conservation of Nature and Natural Resources
Scott, S.D. (2011). Marine Minerals: Their Occurrences, Exploration and Exploitation, OCEANS 2011, 1-8.
Segar, D.A. (2007). Introduction to Ocean Sciences, W. W. Norton and Company, Inc., New York, U.S.A.
Sharma, R. Nagender Nath, B. Parthiban, G. & Sankar, S.J. (2001). Sediment redistribution during simulated benthic disturbance and its implications on deep seabed mining. Deep-Sea Research, Part II,48:3363-3380.
Sharma, R. (2007). Environmental studies for deep seabed mining. Refresher course on marine geology and geophysics (22nd October to 2nd November 2007). National Institute of Oceanography, India Lecture notes.
Shipek, C.J. (1960). Photographic study of dome deep-sea floor environments in the eastern pacific. Bulletin of the Geological Society of America, 71,1067-1074.
Smith, C.R. & Demopoulos, W.J. (2003). Ecosystems of the World (28):Ecosystems of the deep oceans. P.A. Tyler.
Stallard, M.O., Apitz, S.E. and Dooley, C.A. (1995). X-Ray Fluorescence Spectrometry for Field Analysis of Metals in Marine Sediments, Marine Pollution Bulletin, 31:4, 297-305.

118
Steiner, R. (2009). Independent Review of the Environmental Impact Statement for the proposed Nautilus Minerals Solwara 1 Seabed Mining Project, Papua New Guinea. Bismarck-Solomon Seas Indigenous Peoples Council Madang, PNG.
Terzaghi, K (1954). Theoretische Bodenmechanik, Springer-Verlag,UK
Theirault, G.A., Bodensteiner, S. and Liebermann, S. (1998), A real-time fiber-optic LIBS probe for the in situ delineation of metals in soils, Field Analyt. Chem. Tecnol. 2:2, 117-125
Thiel, H. (2003). Ecosystems of the Deep Oceans. P. A. Tyler, Amsterdam.
Thiel, H. (2001). Use and protection of the deep sea-an introduction. Deep-Sea Research II, 48: 3427-3431.
Tian, J., Yin J., Chen K., Rao G., Jiang M., Chi R. (2011). Extraction of rare earths from the leach liquor of the weathered crust elution-deposited rare earth ore with non-precipitation, International Journal of Mineral Processing, 98:3�–4, 125-131.
Toyoda, K. Nakamura, Y. & Masuda, A. (1990). Rare earth elements of Pacific pelagic sediments. Geochemica et Cosmochimica Acta, 54,1093-1103.
TruGroup, (2012), Rare Earth Prices will continue to decline says TRU Rare Earth Consultants, TRU Group Inc, Tucson, USA. [online] Available http://trugroup.com/rare-earth-conference
United Nations (1990). Statement to the Plenary by the Chairman of Special Commission 3 on the Progress of the Work in that Commission: Preparatory Commission for the International Sea-Bed Authority and for the International Tribunal for the Law of the Sea : Corrigendum. UN
United Nations Convention on the Law of the Sea (1982). [online]. Available http://www.un.org/Depts/los/convention_agreements/convention_overview_convention.htm. [Accessed 20 August 2012]
United States Environmental Protection Agency (1972). Clean Water Act Section 403. A Framework For Ecological Risk Assessment [online]. Available http://water.epa.gov/aboutow/owow/programs/403.cfm. [Accessed 22 August 2012]
U.S. Geological Survey (2010). Mineral commodity summaries, United States Government Printing Office, Washington, US.
U.S. Geological Survey (2011). Mineral commodity summaries, U.S. Geological Survey, Reston, Virginia, US.
Valent, P.J. and Young, D.K., (1995). Abyssal Seafloor Waste Isolation: Environmental Report. Naval Research Laboratory, Stennis Space Center, MI, NRL/MR/7401 95 7576,

119
pp479Van Dover, C.L. (2011a). Tighten regulations on deep-sea mining, Nature, 470, 31-33.
Van Dover, C.L. (2011b). Mining seafloor massive sulphides and biodiversity: what is at risk? ICES Journal of Marine Science, 68:2, 341�–348.
Van Zyl, D. Sassoon, M. Digby, C. Fleury, A.-M. & Kyeyune, S. (2002a). Mining for the future (Main report). IIED and WBCSD, US.
Van Zyl, D. Sassoon, M. Digby, C. Fleury, A.-M. & Kyeyune, S. (2002b). Mining for the future (Appendix A: Large Volume Waste Working Paper). IIED and WBCSD, US.
Vlasblom W.J. (2003). Introduction to dredging equipment, [on line], http://www.dredging.org/documents/ceda/downloads/vlasblom1-introduction-to-dredging-equipment.pdf [accessed on28 August 2012].
Wacharawichanant, S. (2008a). Mechanical-Physical separation processes. Lecture notes, Silpakorn University.
Wacharawichanant, S. (2008b). Settling and sedimentation in particle-fluid separation. Lecture notes, Silpakorn University.
Wacharawichanant, S. (2008c). Centrifugal separation process. Lecture notes, Silpakorn University.
Wacharawichanant, S. (2008d). Cyclone separators. Lecture notes, Silpakorn University.
Waldichuk, M. (1987). Mineral extraction from the sea and potential environmental effects. Marine Pollution Bulletin, 18:7:378-380.
Wenzlawski, B (2000). System Specifications, Requirements and Preliminary Design of Crawler Chassis, Internal Report of Institut für Konstruktion, University of Siegen, 36 p.
Wenzlawski, B. (2001). Betrachtungen zur Traffikabilität eines Tiefsee-Raupenfahrzeugs im Zusammenhang mit Traktion und äußeren Fahrwiderständen, Internal Report of Institut für Konstruktion, University of Siegen, 32 p.
Woodruff, C. L. (2004). Princeton wastewater treatment plant. Bio-solids sludge press [online].Availablehttp://www.princeton-indiana.com/wastewater/pages/biosolids/press .html.[Accessed 28 August 2012]
Xie, H. & Yapa, P.D. (2003). Simulating the behaviour and the environmental effect of sediment plumes from deepwater mining. Journal of Advanced Marine Science Technology, AMTEC, Tokyo, Japan, 9(1):7-35
Young, I.R. and Holland, G.J. (1996). Atlas of the Oceans: Wind and wave climate, Elsevier, Oxford, UK.

120
Zhang, H. and Ding, X. (2003). Design and Analysis for the Cutterhead of M450 Cutter suction dredger, Anhui Water Science and Technology, 5, 23

Musa Bashir is a PhD Candidate at Newcastle University working on thehydrodynamics and structural behaviour of offshore vehicles. He obtained his MSc in Marine Structures and Integrity in 2007 from the same university and has experience in towing tank testing and the structural design of offshore structures.
Seabed Exploitation The LRET Collegium 2012 Series, Volume 1
Hugh Wolgamot is a DPhil candidate in the Department of Engineering Science at theUniversity of Oxford, where he is working on hydrodynamics of oceanwave energy devices. He obtained a BEng/BSc in Civil Engineering from theUniversity of Sydney in 2008 and subsequently spent some time working forWorleyParsons in Sydney.
Evangelia Kiosidou received her joint Bachelor’s and Master’s degree (5 years) inNaval Architecture and Marine Engineering from the National Technical University ofAthens (NTUA) in 2011. She is currently studying for a PhD at the Department ofNaval Architecture and Marine Engineering at NTUA in the field of antifouling marinecoatings. She is also pursuing a Bachelor’s degree in the Department of BusinessAdministration at Athens University of Economics and Business.
Sung-hee Kim is a Ph.D. candidate at Seoul National University (SNU) in Korea. He received his Bachelor’s degree in Naval Architecture & Ocean Engineering from SNU in 2005 and Master’s degree from the same institute in 2007. He has studied sound andvibration predictions using energy methods. These days, his research interests lie in riskand reliability analyses for subsea systems.
A Concept for Seabed Rare Earth Mining in the Eastern South Pacific
©University of Southampton 2012
Wei Zhang is a Ph.D. candidate at Shanghai JiaoTong University (SJTU). He receivedhis Bachelor of Engineering degree in 2006 from Wuhan University of Technology inChina and his Master of Engineering degree in 2009 from the same institute. Hisresearch interests focus on ship hydrodynamics and ship manoeuvrability.