Embed Size (px)
Citation preview
J Seismol (2006) 10:335–351
DOI 10.1007/s10950-006-9020-4
O R I G I N A L A R T I C L E
A comparative study of the design spectra definedby Eurocode 8, UBC, IBC and Turkish EarthquakeCode on R/C sample buildingsAdem Dogangun · Ramazan Livaoglu
Received: 8 November 2004 / Accepted: 20 April 2006C© Springer Science + Business Media B.V. 2006
Abstract Earthquake codes have been revised and up-
dated depending on the improvements in the represen-
tation of ground motions, soils and structures. These
revisions have been more frequently seen in recent
years. One of the key changes in earthquake codes
has been performed on the design spectra. In this pa-
per, the design spectra recommended by Turkish Earth-
quake Code and three other well known codes (Uniform
Building Code, Eurocode 8, and International Building
Code) are considered for comparison. The main pur-
pose of this study is to investigate the differences caused
by the use of different codes in the dynamic analysis
and seismic verification of given types of buildings lo-
cated at code defined different sites. The differences
in expressions and some important points for elastic
and inelastic spectra defined by the codes are briefly
illustrated in tables and figures. Periods, base shears,
lateral displacements and interstory drifts for the ana-
lyzed buildings located at code defined ground type are
comparatively presented.
Keywords Design spectra . Eurocode 8 . Ground
types . IBC . Seismic codes . Seismic response of
building . Turkish earthquake code . UBC
A. Dogangun (�) · R. LivaogluKaradeniz Technical University, Department of CivilEngineering, 61080 Trabzon, Turkey
Introduction
Earthquake codes are periodically revised and updated
depending on the improvements in the representation of
ground motions, soils and structures. Moreover, these
revisions have been made more frequently in recent
years. The Turkish Earthquake Code (TEC, 1998) was
also revised in 1997 and has been in effect since 1998.
Unfortunately, two destructive earthquakes [Kocaeli
and Duzce] occurred in Turkey in 1999 one year after
the enforcement of TEC. These earthquakes resulted in
more than 18,000 recorded deaths and 50,000 serious
injuries. More than 51,000 buildings were either heav-
ily damaged or totally collapsed. Some other 110,000
buildings moderately or lightly suffered damage. The
damage inflicted by the Kocaeli earthquake on struc-
tures in general, and on modern RC buildings in par-
ticular, is perhaps the worst seen in many years, and
certainly the worst in Europe in recent history. Aver-
age total loss may be in the range of 16 Billion USD,
about 7% of the Nation’s GDP (Erdik, 2004). A number
of separate teams from different disciplines conducted
damage surveys and reported some conclusions follow-
ing the two major earthquakes as briefly summarized
below.
Early reports stressed that quality of construction
material were poor and that there were many structural
mistakes and deficiencies due to the non-compliance
with the earthquake code. It was concluded that the
nature of the strong-motion was also a major con-
tributing factor to the level of damage. Some of the
Springer
336 J Seismol (2006) 10:335–351
teams indicated that soil effects played an important
role on damage with different forms such as lique-
faction, bearing capacity loss, subsidence and lateral
spread. In some studies, response spectra computed
from recorded accelerograms were compared with de-
sign spectra derived from TEC. It was concluded that in
a period range of about 1.0–1.5 sec, which corresponds
to the pulse periods of the Bolu and Duzce records the
capacity demand is considerably in excess of the de-
sign spectrum curve (Akkar and Gulkan, 2002). It was
also concluded that the acceleration response spectra
for the Duzce motion exceeded the UBC (1997) design
spectrum at periods less than 0.5 s and greater than 3.0 s
(Erdik, 2004). Another spectra-related study in which
the observed and simulated displacement spectra were
compared with the Eurocode 8 design displacement
spectrum for the Bolu expressway viaduct was carried
out by Faccioli et al. (2002). One another conclusion
was that peak acceleration for most near-source records
were not so high as expected and seemed to become sat-
urated for increasing magnitudes. However, the peak
velocities and corresponding drift demands were usu-
ally considerable, and this was confirmed by structural
damage (Akkar and Gulkan, 2002).
Under the light of the observations and lessons from
the 1999 earthquakes, many studies concerning TEC
have been carried out up to now and a number of im-
provements in TEC might be brought up to the agenda
in the near future. As known, one of the key changes
in the earthquake codes has been generally performed
on the design spectra. The requirements recommended
by EC8 are also very important for the Turkish com-
munity; so it will be helpful to establish a comparison
between the design spectra recommended by the EC8
(2004) and TEC. The influence of local ground con-
ditions on the seismic action is generally considered
depending on the ground types described by the strati-
graphic profiles and parameters. That is why the em-
phasis has been placed on the differences caused by the
use of spectra given in the TEC and other well known
codes such as UBC, EC8 and IBC(2003) in the seismic
analysis of sample buildings.
The effects of ground types defined in the codes on
the seismic response of buildings were also investigated
for both different building configurations and different
supporting soils. Base shears and interstory drifts for
considered ground types and buildings are compared
to reveal the differences. As design requirements given
in the earthquake codes are significantly different, the
seismic design of buildings is out of this paper scope.
However, authors tried to consider basic design require-
ments recommended in the codes for selection of the
building systems.
Seismic hazard is expressed in TEC and EC8 by a
single parameter, namely the reference peak ground
acceleration agR at the surface on rock for a refer-
ence mean return period. The reference return period
recommended for the non-collapse performance level
is the 475 year, corresponding to 10% probability of
exceedance in 50 years in a Poisson occurrence pro-
cess both TEC and EC8. A comparative study of the
seismic hazard assessments in European National Seis-
mic Codes including TEC was carried out by Garcia-
Mayordomo et al. (2004). In EC8 the design ground
acceleration (ag) is equal to agR times the importance
factorγ I . A single parameter, however, is insufficient to
characterize the ground motion hazard, because the fre-
quency content as well as the amplitude of the ground
motion affect structural response. The standard method
as in TEC and in EC8 is to describe the frequency
content by a response spectrum. Two influences on
frequency content are recognized by TEC and EC8,
namely the type of ground present at the site under
consideration and the magnitude of earthquake. The
former is accounted for by describing various ground
types as mentioned below:
Code defined ground types
The site conditions have been classified into different
categories in earthquake codes. These categories are
named ground types, soil profile types, local site classes
or subsoil classes. In this paper, the term of ground types
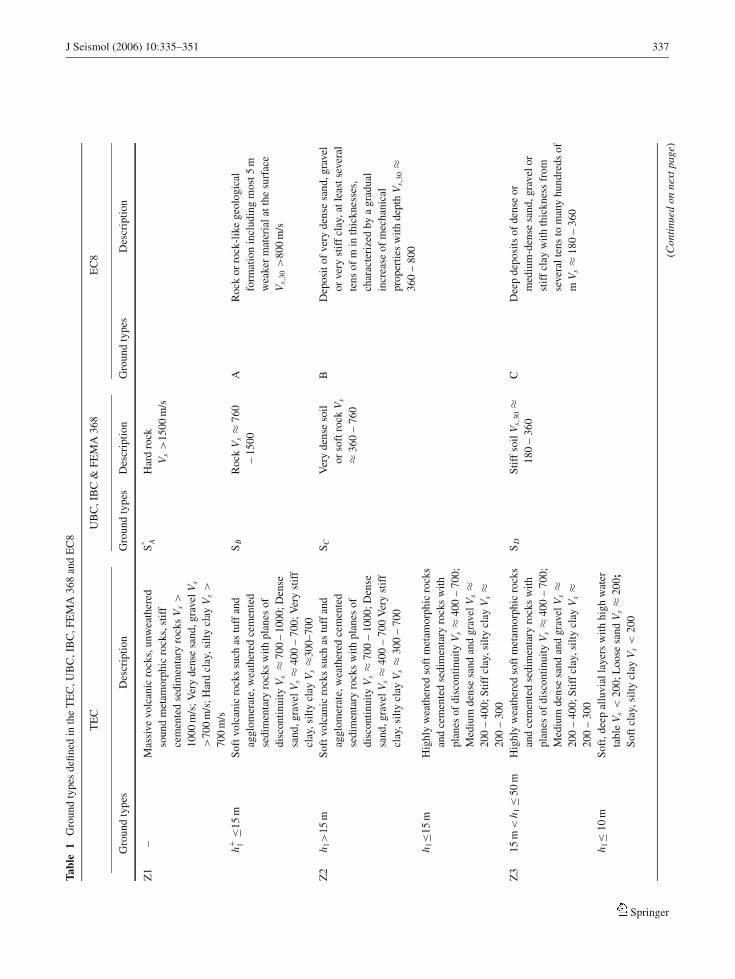
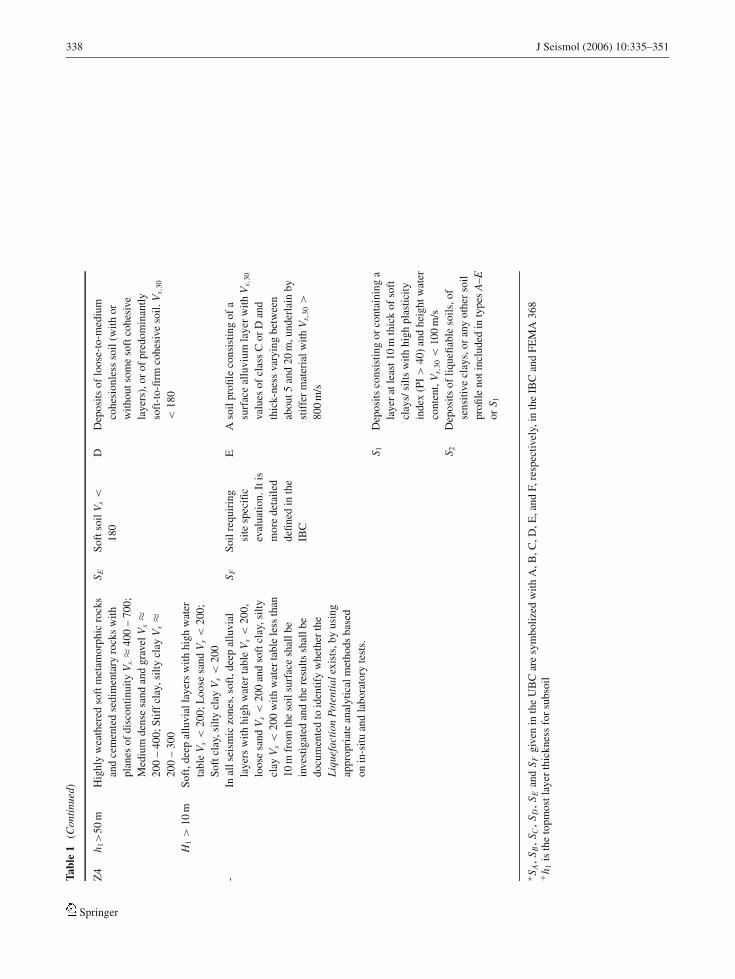
is selected in accordance with EC8. Table 1 presents
ground types and shear wave velocities given in the
codes including FEMA 368 (2001). As seen from this
table, TEC gives more information about ground types
depending on the topmost layer thickness of soil (h1).
Four and six ground types are defined in TEC and US
codes, respectively. It should be noted that in the 1998
edition of EC8 only three types of A, B and C were
defined. However, five main ground types as to be A,
B, C, D, E and two special ground types S1 and S2 have
been described in the final version of EC8.
The site classification system is based on definitions
of site classes in terms of a representative average shear
wave velocity, Standard Penetration Test blow-count,
Springer
J Seismol (2006) 10:335–351 337
Tabl
e1
Gro
un
dty
pes
defi
ned
inth
eT
EC
,U
BC
,IB
C,
FE
MA
36
8an
dE
C8
TE
CU
BC
,IB
C&
FE
MA
36
8E
C8
Gro
un
dty
pes
Des
crip
tio
nG
rou
nd
typ
esD
escr
ipti
on
Gro
un
dty
pes
Des
crip
tio
n
Z1
–M
assi
ve
volc
anic
rock
s,u
nw
eath
ered
sou
nd
met
amo
rph
icro
cks,
stif
f
cem
ente
dse
dim
enta
ryro
cks
Vs>
10
00
m/s
;V
ery
den
sesa
nd
,g
ravel
Vs
>7
00
m/s
;H
ard
clay
,si
lty
clay
Vs>
70
0m
/s
S∗ A
Har
dro
ck
Vs>
15
00
m/s
h+ 1≤1
5m
So
ftvo
lcan
icro
cks
such
astu
ffan
d
agg
lom
erat
e,w
eath
ered
cem
ente
d
sed
imen
tary
rock
sw
ith
pla
nes
of
dis
con
tin
uit
yV
s≈
70
0–
10
00
;D
ense
san
d,
gra
vel
Vs≈
40
0–
70
0;
Ver
yst
iff
clay
,si
lty
clay
Vs≈3
00
–7
00
SB
Ro
ckV
s≈
76
0
–1
50
0
AR
ock
or
rock
-lik
eg
eolo
gic
al
form
atio
nin
clu
din
gm
ost
5m
wea
ker
mat
eria
lat
the
surf
ace
Vs,
30>
80
0m
/s
Z2
h 1>
15
mS
oft
volc
anic
rock
ssu
chas
tuff
and
agg
lom
erat
e,w
eath
ered
cem
ente
d
sed
imen
tary
rock
sw
ith
pla
nes
of
dis
con
tin
uit
yV
s≈
70
0–
10
00
;D
ense
san
d,
gra
vel
Vs≈
40
0–
70
0V
ery
stif
f
clay
,si
lty
clay
Vs≈
30
0–
70
0
SC
Ver
yd
ense
soil
or
soft
rock
Vs
≈3
60
–7
60
BD
epo
sit
of
ver
yd
ense
san
d,g
ravel
or
ver
yst
iff
clay
,at
leas
tse
ver
al
ten
so
fm
inth
ick
nes
ses,
char
acte
rize
db
ya
gra
du
al
incr
ease
of
mec
han
ical
pro
per
ties
wit
hd
epth
Vs,
30≈
36
0–
80
0
h 1≤1
5m
Hig
hly
wea
ther
edso
ftm
etam
orp
hic
rock
s
and
cem
ente
dse
dim
enta
ryro
cks
wit
h
pla
nes
of
dis
con
tin
uit
yV
s≈
40
0–
70
0;
Med
ium
den
sesa
nd
and
gra
vel
Vs≈
20
0–
40
0;
Sti
ffcl
ay,
silt
ycl
ayV
s≈
20
0–
30
0
Z3
15
m<
h 1≤
50
mH
igh
lyw
eath
ered
soft
met
amo
rph
icro
cks
and
cem
ente
dse
dim
enta
ryro
cks
wit
h
pla
nes
of
dis
con
tin
uit
yV
s≈
40
0–
70
0;
Med
ium
den
sesa
nd
and
gra
vel
Vs≈
20
0–
40
0;
Sti
ffcl
ay,
silt
ycl
ayV
s≈
20
0–
30
0
SD
Sti
ffso
ilV
s,30≈
18
0–
36
0
CD
eep
dep
osi
tso
fd
ense
or
med
ium
-den
sesa
nd
,g
ravel
or
stif
fcl
ayw
ith
thic
kn
ess
fro
m
sever
alte
ns
tom
any
hu
nd
red
so
f
mV
s≈
18
0–
36
0
h 1≤
10
mS
oft
,d
eep
allu
via
lla
yer
sw
ith
hig
hw
ater
tab
leV
s<
20
0;
Lo
ose
san
dV
s≈
20
0;
So
ftcl
ay,
silt
ycl
ayV
s<
20
0
(Con
tinu
edon
next
page
)
Springer
338 J Seismol (2006) 10:335–351
Tabl
e1
(Con
tinu
ed)
Z4
h 1>
50
mH
igh
lyw
eath
ered
soft
met
amo
rph
icro
cks
and
cem
ente
dse
dim
enta
ryro
cks
wit
h
pla
nes
of
dis
con
tin
uit
yV
s≈
40
0–
70
0;
Med
ium
den
sesa
nd
and
gra
vel
Vs≈
20
0–
40
0;
Sti
ffcl
ay,
silt
ycl
ayV
s≈
20
0–
30
0
S ES
oft
soil
Vs<
18
0
DD
epo
sits
of
loo
se-t
o-m
ediu
m
coh
esio
nle
ssso
il(w
ith
or
wit
ho
ut
som
eso
ftco
hes
ive
lay
ers)
,o
ro
fp
red
om
inan
tly
soft
-to
-firm
coh
esiv
eso
il.
Vs,
30
<1
80
H1>
10
mS
oft
,d
eep
allu
via
lla
yer
sw
ith
hig
hw
ater
tab
leV
s<
20
0;
Lo
ose
san
dV
s<
20
0;
So
ftcl
ay,
silt
ycl
ayV
s<
20
0
-In
all
seis
mic
zon
es,so
ft,d
eep
allu
via
l
lay
ers
wit
hh
igh
wat
erta
ble
Vs<
20
0,
loo
sesa
nd
Vs<
20
0an
dso
ftcl
ay,
silt
y
clay
Vs<
20
0w
ith
wat
erta
ble
less
than
10
mfr
om
the
soil
surf
ace
shal
lb
e
inves
tigat
edan
dth
ere
sult
ssh
all
be
do
cum
ente
dto
iden
tify
wh
eth
erth
e
Liq
uefa
ctio
nPo
tent
iale
xis
ts,b
yu
sin
g
app
rop
riat
ean
aly
tica
lm
eth
od
sb
ased
on
in-s
itu
and
lab
ora
tory
test
s.
S FS
oil
req
uir
ing
site
spec
ific
eval
uat
ion
.It
is
mo
red
etai
led
defi
ned
inth
e
IBC
EA
soil
pro
file
con
sist
ing
of
a
surf
ace
allu
viu
mla
yer
wit
hV
s,30
valu
eso
fcl
ass
Co
rD
and
thic
k-n
ess
vary
ing
bet
wee
n
abo
ut
5an
d2
0m
,u
nd
erla
inb
y
stif
fer
mat
eria
lw
ith
Vs,
30>
80
0m
/s
S 1D
epo
sits
con
sist
ing
or
con
tain
ing
a
lay
erat
leas
t1
0m
thic
ko
fso
ft
clay
s/si
lts
wit
hh
igh
pla
stic
ity
ind
ex(P
I>
40
)an
dh
eig
ht
wat
er
con
ten
t,V
s,30<
10
0m
/s
S 2D
epo
sits
of
liq
uefi
able
soil
s,o
f
sen
siti
ve
clay
s,o
ran
yo
ther
soil
pro
file
no
tin
clu
ded
inty
pes
A–E
or
S 1
∗ SA
,S B
,S C
,S D
,S E
and
S Fg
iven
inth
eU
BC
are
sym
bo
lize
dw
ith
A,
B,
C,D
,E
,an
dF,
resp
ecti
vel
y,in
the
IBC
and
FE
MA
36
8+ h
1is
the
top
mo
stla
yer
thic
kn
ess
for
sub
soil
Springer
J Seismol (2006) 10:335–351 339
unconfined compression strength, relative density, etc.
in some earthquake codes like TEC. However, based on
empirical studies by Borcherdt (1994), recommended
shear wave velocity VS−30 as a means of classifying
sites for building codes, and similar site categories
were selected for the FEMA seismic design provisions
for new buildings (Dobry et al., 2000). Boore et al.
(1994) indicate that the ideal parameter would be the
average shear-wave velocity to a depth of one-quarter
wavelength for the period of interest, as was used by
Joyner and Fumal (1984). By the quarter-wavelength
rule, 30 m is the appropriate depth for period of 0.16 s
for stiff soil and period values tend to increase as the soil
gets softer (Boore et al., 1994). It should be noted that
code defined spectra depending on ground types are
provided only for cases where the 30 m of soil imme-
diately below the site dominates the frequency content
of the design motions. The average shear wave velocity
of the upper 30 m of soil (VS−30) is also considered in
EC8 and the velocity bounds of 360 m/s and 180 m/s for
types B, C and D, make the velocity values consistent
with the NSPT values (Sabetta and Bommer, 2002).
Elastic and inelastic response and designspectra
Various seismological and geophysical parameters af-
fect the shape of response spectra. Ambraseys et al.
(1996) and Bommer and Acevedo (2004) presented
and discussed the effects of earthquake magnitude,
source-to-site distance, site classification, and style-of-
faulting on the strong-motion accelerograms and con-
sequently response spectra. As known, the damping
ratio and structural vibration period are other param-
eters affecting the response spectra. The earthquake-
induced ground shaking is generally represented in the
form of acceleration response spectra or displacement
response spectra.
Acceleration response spectra
In all current seismic codes, the earthquake actions
are represented in the form of a spectrum of abso-
lute acceleration. But code acceleration spectra tend
to be conservative at longer periods with the result that
the long-period ordinates of the displacement spectra
are unnecessarily high (Bommer et al., 2000). This has
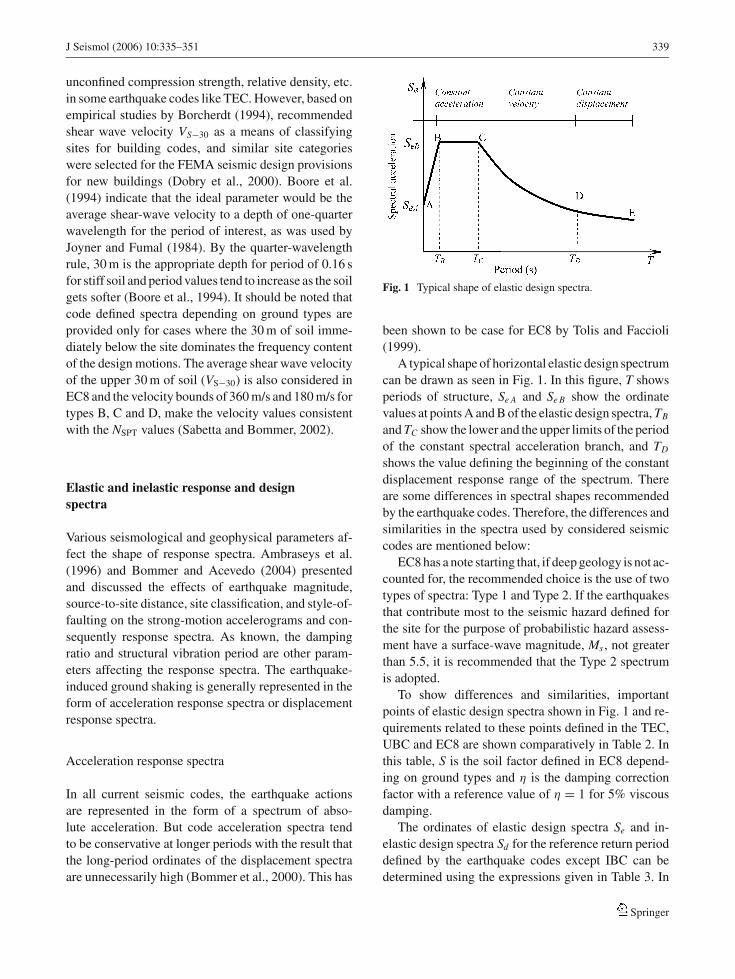
Fig. 1 Typical shape of elastic design spectra.
been shown to be case for EC8 by Tolis and Faccioli
(1999).
A typical shape of horizontal elastic design spectrum
can be drawn as seen in Fig. 1. In this figure, T shows
periods of structure, Se A and Se B show the ordinate
values at points A and B of the elastic design spectra, TB
and TC show the lower and the upper limits of the period
of the constant spectral acceleration branch, and TD
shows the value defining the beginning of the constant
displacement response range of the spectrum. There
are some differences in spectral shapes recommended
by the earthquake codes. Therefore, the differences and
similarities in the spectra used by considered seismic
codes are mentioned below:
EC8 has a note starting that, if deep geology is not ac-
counted for, the recommended choice is the use of two
types of spectra: Type 1 and Type 2. If the earthquakes
that contribute most to the seismic hazard defined for
the site for the purpose of probabilistic hazard assess-
ment have a surface-wave magnitude, Ms , not greater
than 5.5, it is recommended that the Type 2 spectrum
is adopted.
To show differences and similarities, important
points of elastic design spectra shown in Fig. 1 and re-
quirements related to these points defined in the TEC,
UBC and EC8 are shown comparatively in Table 2. In
this table, S is the soil factor defined in EC8 depend-
ing on ground types and η is the damping correction
factor with a reference value of η = 1 for 5% viscous
damping.
The ordinates of elastic design spectra Se and in-
elastic design spectra Sd for the reference return period
defined by the earthquake codes except IBC can be
determined using the expressions given in Table 3. In
Springer
340 J Seismol (2006) 10:335–351
Tabl
e2
Co
mm
ent
on
the
imp
ort
ant
per
iod
so
fel
asti
cd
esig
nsp
ectr
ad
efin
edin
the
TE
C,U
BC
and
EC
8
EC
8
Tw
oty
pes
of
spec
tru
m(T
yp
e-1
and
Ty
pe-
2)
defi
ned
dep
end
ing
on
the
TE
CU
BC
mag
nit
ud
eo
fea
rth
qu
akes
TB
Defi
ned
dep
end
ing
on
lysu
bso
ilcl
asse
s.
Th
eva
lues
of
TB
corr
esp
on
din
gto
Z1
,
Z2
,Z
3an
dZ
4g
rou
nd
typ
esca
nb
e
taken
0.1
0,0
.15
,0
.15
and
0.2
0,
resp
ecti
vel
y.
Defi
ned
dep
end
ing
on
gro
un
dty
pes
and
eart
hq
uak
ezo
ne.
Inad
dit
ion
,fo
r
seis
mic
zon
e4
ital
sod
epen
ds
on
the
nea
rso
urc
efa
cto
rs.
•Fo
rT
yp
e-1
the
valu
eso
fT
B
corr
esp
on
d-d
ing
toA
,B
,C
,D
and
Eg
rou
nd
typ
esca
nb
eta
ken
0.1
5,0
.15
,0
.20
,0
.20
and
0.1
5,re
spec
tivel
y.
TB
=0.2
Cv
2.5
·Ca
Th
eva
lue
of
TB
isch
ang
edfr
om
0.1
sto
0.2
2s
•Fo
rT
yp
e-2
the
valu
eso
fT
B
corr
esp
on
d-d
ing
toA
,B
,C
,D
and
Eg
rou
nd
typ
esca
nb
eta
ken
0.0
5,0
.05
,0
.10
,0
.10
and
0.0
5,re
spec
tivel
y.
TC
Defi
ned
dep
end
ing
on
lysu
bso
ilcl
asse
s.
Th
eva
lues
of
TC
corr
esp
on
din
gto
Z1
,
Z2
,Z
3an
dZ
4g
rou
nd
typ
esca
nb
e
taken
0.3
,0
.4,0
.6an
d0
.9,re
spec
tivel
y.
Defi
ned
dep
end
ing
on
gro
un
dty
pes
and
eart
hq
uak
ezo
ne.
Inad
dit
ion
,fo
r
seis
mic
zon
e4
itd
epen
ds
on
the
nea
r
sou
rce
fact
ors
.
•,Fo
rT
yp
e-1
Th
eva
lues
of
TC
corr
esp
on
din
g
toA
,B
,C
,D
and
Eg
rou
nd
typ
esca
nb
e
taken
0.4
,0
.5,0
.6,0
.8an
d0
.5,re
spec
tivel
y.
T C=
Cv
2.5
·Ca
Th
eva
lue
of
TC
isch
ang
edfr
om
0.4
sto
1.0
7s
•Fo
rT
yp
e-2
Th
eva
lues
of
TC
corr
esp
on
din
g
toA
,B
,C
,D
and
Eg
rou
nd
typ
esca
nb
e
taken
0.2
5,0
.25
,0
.25
,0
.3an
d0
.25
,
resp
ecti
vel
y.
TD
–(n
ot
defi
ned
)–
(no
td
efin
ed)
•It
iseq
ual
to2
for
Ty
pe-
1
Itis
equ
alto
1.2
for
Ty
pe-
2
S eA
1.0
·ag
1.0
·Ca
·gS
a gS e
B2
.5·a
g2
.5·C
a·g
2.5
·Sg
·ηa g
Wh
ere
Ca
and
Cv
are
soil
mo
difi
ed
gro
un
dm
oti
on
par
amet
ers
•Fo
rT
yp
e-1
con
sid
erin
g5
%d
amp
ing
rati
o,
S eco
rres
po
nd
ing
toA
,B
,C
,D
and
E
gro
un
dty
pes
can
be
taken
a gti
mes
2.5
,3
,
2.8
75
,3
.37
5an
d3
.5,re
spec
tivel
y.
•Fo
rT
yp
e-2
con
sid
erin
g5
%d
amp
ing
rati
o,
S eco
rres
po
nd
ing
toA
,B
,C
,D
and
E
gro
un
dty
pes
can
be
taken
a gti
mes
2.5
,
3.3
75
,3
.75
,4
.5an
d4
,re
spec
tivel
y.
Springer
J Seismol (2006) 10:335–351 341
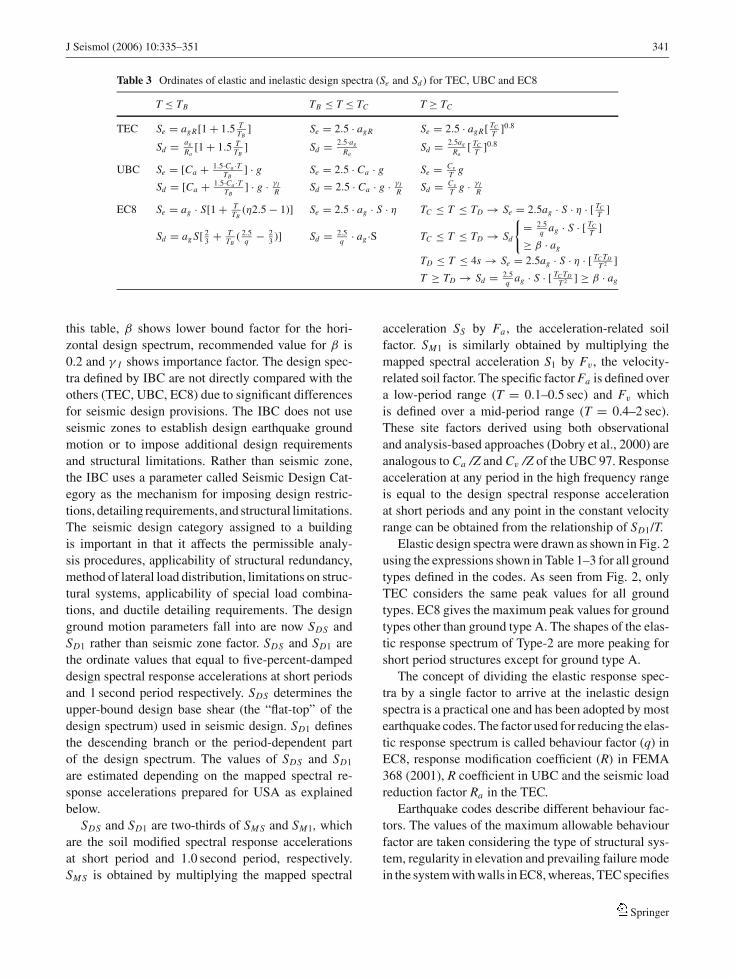
Table 3 Ordinates of elastic and inelastic design spectra (Se and Sd ) for TEC, UBC and EC8
T ≤ TB TB ≤ T ≤ TC T ≥ TC
TEC Se = agR[1 + 1.5 TTB
] Se = 2.5 · agR Se = 2.5 · agR[ TCT ]0.8
Sd = ag
Ra[1 + 1.5 T
TB] Sd = 2.5·ag
RaSd = 2.5ag
Ra[ TC
T ]0.8
UBC Se = [Ca + 1.5·Ca ·TTB
] · g Se = 2.5 · Ca · g Se = Cv
T g
Sd = [Ca + 1.5·Ca ·TTB
] · g · γI
R Sd = 2.5 · Ca · g · γI
R Sd = Cv
T g · γI
R
EC8 Se = ag · S[1 + TTB
(η2.5 − 1)] Se = 2.5 · ag · S · η TC ≤ T ≤ TD → Se = 2.5ag · S · η · [ TCT ]
Sd = ag S[ 23
+ TTB
( 2.5q − 2
3)] Sd = 2.5
q · ag ·S TC ≤ T ≤ TD → Sd
{= 2.5
q ag · S · [ TCT ]
≥ β · ag
TD ≤ T ≤ 4s → Se = 2.5ag · S · η · [ TC TDT 2 ]
T ≥ TD → Sd = 2.5q ag · S · [ TC TD
T 2 ] ≥ β · ag
this table, β shows lower bound factor for the hori-
zontal design spectrum, recommended value for β is
0.2 and γ I shows importance factor. The design spec-
tra defined by IBC are not directly compared with the
others (TEC, UBC, EC8) due to significant differences
for seismic design provisions. The IBC does not use
seismic zones to establish design earthquake ground
motion or to impose additional design requirements
and structural limitations. Rather than seismic zone,
the IBC uses a parameter called Seismic Design Cat-
egory as the mechanism for imposing design restric-
tions, detailing requirements, and structural limitations.
The seismic design category assigned to a building
is important in that it affects the permissible analy-
sis procedures, applicability of structural redundancy,
method of lateral load distribution, limitations on struc-
tural systems, applicability of special load combina-
tions, and ductile detailing requirements. The design
ground motion parameters fall into are now SDS and
SD1 rather than seismic zone factor. SDS and SD1 are
the ordinate values that equal to five-percent-damped
design spectral response accelerations at short periods
and 1 second period respectively. SDS determines the
upper-bound design base shear (the “flat-top” of the
design spectrum) used in seismic design. SD1 defines
the descending branch or the period-dependent part
of the design spectrum. The values of SDS and SD1
are estimated depending on the mapped spectral re-
sponse accelerations prepared for USA as explained
below.
SDS and SD1 are two-thirds of SM S and SM1, which
are the soil modified spectral response accelerations
at short period and 1.0 second period, respectively.
SM S is obtained by multiplying the mapped spectral
acceleration SS by Fa , the acceleration-related soil
factor. SM1 is similarly obtained by multiplying the
mapped spectral acceleration S1 by Fv , the velocity-
related soil factor. The specific factor Fa is defined over
a low-period range (T = 0.1–0.5 sec) and Fv which
is defined over a mid-period range (T = 0.4–2 sec).
These site factors derived using both observational
and analysis-based approaches (Dobry et al., 2000) are
analogous to Ca /Z and Cv /Z of the UBC 97. Response
acceleration at any period in the high frequency range
is equal to the design spectral response acceleration
at short periods and any point in the constant velocity
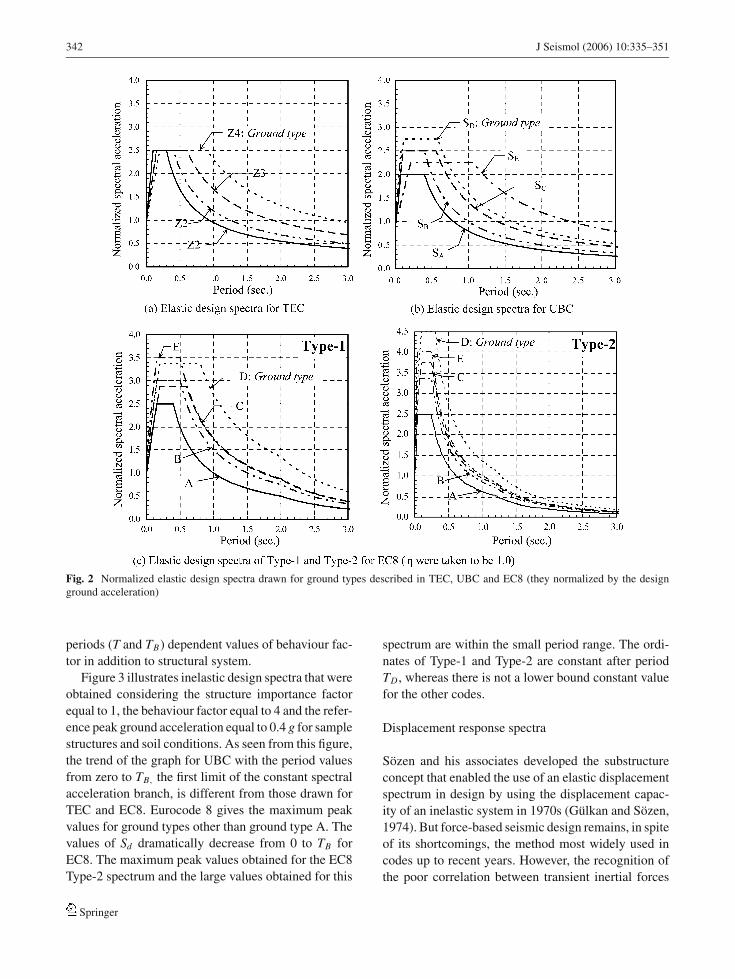
range can be obtained from the relationship of SD1/T.Elastic design spectra were drawn as shown in Fig. 2
using the expressions shown in Table 1–3 for all ground
types defined in the codes. As seen from Fig. 2, only
TEC considers the same peak values for all ground
types. EC8 gives the maximum peak values for ground
types other than ground type A. The shapes of the elas-
tic response spectrum of Type-2 are more peaking for
short period structures except for ground type A.
The concept of dividing the elastic response spec-
tra by a single factor to arrive at the inelastic design
spectra is a practical one and has been adopted by most
earthquake codes. The factor used for reducing the elas-
tic response spectrum is called behaviour factor (q) in
EC8, response modification coefficient (R) in FEMA
368 (2001), R coefficient in UBC and the seismic load
reduction factor Ra in the TEC.Earthquake codes describe different behaviour fac-
tors. The values of the maximum allowable behaviour
factor are taken considering the type of structural sys-
tem, regularity in elevation and prevailing failure mode
in the system with walls in EC8, whereas, TEC specifies
Springer
342 J Seismol (2006) 10:335–351
Fig. 2 Normalized elastic design spectra drawn for ground types described in TEC, UBC and EC8 (they normalized by the designground acceleration)
periods (T and TB) dependent values of behaviour fac-
tor in addition to structural system.
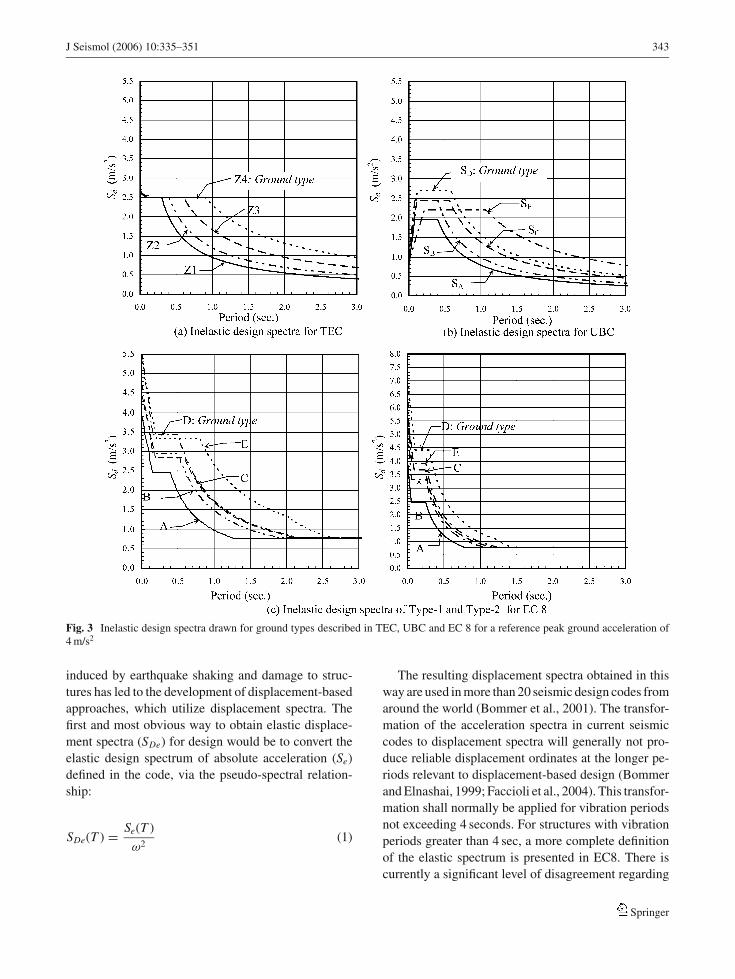
Figure 3 illustrates inelastic design spectra that were
obtained considering the structure importance factor
equal to 1, the behaviour factor equal to 4 and the refer-
ence peak ground acceleration equal to 0.4 g for sample
structures and soil conditions. As seen from this figure,
the trend of the graph for UBC with the period values
from zero to TB, the first limit of the constant spectral
acceleration branch, is different from those drawn for
TEC and EC8. Eurocode 8 gives the maximum peak
values for ground types other than ground type A. The
values of Sd dramatically decrease from 0 to TB for
EC8. The maximum peak values obtained for the EC8
Type-2 spectrum and the large values obtained for this
spectrum are within the small period range. The ordi-
nates of Type-1 and Type-2 are constant after period
TD , whereas there is not a lower bound constant value
for the other codes.
Displacement response spectra
Sozen and his associates developed the substructure
concept that enabled the use of an elastic displacement
spectrum in design by using the displacement capac-
ity of an inelastic system in 1970s (Gulkan and Sozen,
1974). But force-based seismic design remains, in spite
of its shortcomings, the method most widely used in
codes up to recent years. However, the recognition of
the poor correlation between transient inertial forces
Springer
J Seismol (2006) 10:335–351 343
Fig. 3 Inelastic design spectra drawn for ground types described in TEC, UBC and EC 8 for a reference peak ground acceleration of4 m/s2
induced by earthquake shaking and damage to struc-
tures has led to the development of displacement-based
approaches, which utilize displacement spectra. The
first and most obvious way to obtain elastic displace-
ment spectra (SDe) for design would be to convert the
elastic design spectrum of absolute acceleration (Se)
defined in the code, via the pseudo-spectral relation-
ship:
SDe(T ) = Se(T )
ω2(1)
The resulting displacement spectra obtained in this
way are used in more than 20 seismic design codes from
around the world (Bommer et al., 2001). The transfor-
mation of the acceleration spectra in current seismic
codes to displacement spectra will generally not pro-
duce reliable displacement ordinates at the longer pe-
riods relevant to displacement-based design (Bommer
and Elnashai, 1999; Faccioli et al., 2004). This transfor-
mation shall normally be applied for vibration periods
not exceeding 4 seconds. For structures with vibration
periods greater than 4 sec, a more complete definition
of the elastic spectrum is presented in EC8. There is
currently a significant level of disagreement regarding
Springer

344 J Seismol (2006) 10:335–351
appropriate values for the control periods of the dis-
placement spectra (Bommer and Mendis, 2005).
Faccioli et al. (1998) derived relationship between
damping and ductility for displacement spectra depend-
ing on European earthquakes and Borzi et al. (2001)
described derivation of inelastic displacement spectra
for displacement-based design in detail. In seismic de-
sign codes such as EC8, the displacement spectra for
damping ratios other than 5% are obtained by apply-
ing scaling factor to the ordinates of the 5% damped
spectrum as below;
η =√
10
5 + ξ(2)
where ξ is the viscous damping ratio of the structure,
expressed as a percentage. Bommer and Mendis (2005)
have recently reviewed several different proposals for
these scaling factors. In the EC8, the displacement
spectra were defined for various damping ratios. Since
such displacement spectra are not included in the TEC,
it is not possible to make a comparison for these spectra.
Structural data
Sample buildings described herein were selected as typ-
ical (not a template project) 6 and 12 story reinforced
concrete buildings. The buildings have three different
floor plans that are symmetric (SB), monosymmetric
(MB), and unsymmetric (UB). Six buildings are con-
sidered and they are henceforth referred to as; 6-SB,
6-MB, 6-UB, 12-SB, 12-MB and 12-UB. The plan di-
mensions of buildings, typical at all floors, are 22.7 m
by 13.75 m, with a story height of 3 m (Fig. 4). The
structural systems of the buildings are selected as struc-
tural systems consisting of structural walls and moment
resisting frames in both directions. It is assumed that
the structural systems have nominal ductility level. In
this case, the value of 4 is recommended by TEC for
structural behaviour factor (R). Seismic load reduction
factor (Ra) can be determined in terms of R according
to TEC. If natural vibration period (T) is smaller or
equal to the lower limit of the period of the constant
spectral acceleration branch (TB), Ra will be equal to
1.5 + (R-1.5)T/TB . If T is greater than TB , Ra will be
equal to R. As the fundamental periods obtained for
sample buildings considered in this study are greater
than TB , Ra is taken equal to R.Columns, beams, structural walls and slabs are sized
considering the requirements given in TEC. The di-
mensions of columns and structural walls for x and ydirections, the thickness of slabs, the width and height
of beams are given in Table 4. As seen from this table,
the cross-sections of columns have been changed after
the 3rd story for 6-story buildings, and changed after
the 4th and 8th story for 12-story buildings.
Flexural rigidities for longitudinal and transverse di-
rections are different for each building. Total moments
of inertia of vertical structural elements can be deter-
mined using dimensions given in Table 4 for x and ydirections. It should be noted that values used for rigidi-
ties are gross values and they are not reduced to consider
cracking. Minimum and maximum values of Torsional
Irregularity Factors (ηb) (which are defined for any of
the two orthogonal earthquake directions as the ratio
of the maximum storey drift at any story to the average
story drift at the same story in the same direction) for
sample buildings are also estimated. This factor reach
as its maximum values as; 1.12 for 6-SB, 1.55 for 6-
MB, 1,39 for 6-UB, 1,22 for 12-SB, 1.34 for 12-MB
and 1,89 for 12-UB. According to TEC, torsional irreg-
ularity occurs in buildings when ηb is greater than 1.2.
No other structural irregularities occurred for sample
buildings.
Finite element modeling of buildings andanalysis results
To evaluate the seismic response of the buildings, elas-
tic analyses were performed by the response spectrum
method using the computer program SAP2000 (2003).
The seismic analyses of the buildings are carried out
separately in the longitudinal and the transverse direc-
tions. However, seismic responses only for y direction
are comparatively presented with graphs and tables in
this paper for the sake of brevity. Sample finite element
models of the six and twelve story buildings are shown
in Fig. 5. Degrees of freedom at the base nodes are fixed,
for other nodes are left free. Therefore, there is no finite
element model for subsoil to consider soil-structure in-
teraction. Columns and beams are modelled with frame
elements, slabs and structural walls are modelled with
shell elements. Slabs also have been considered as a
rigid diaphragm in each story level. The masses of infill
Springer
J Seismol (2006) 10:335–351 345
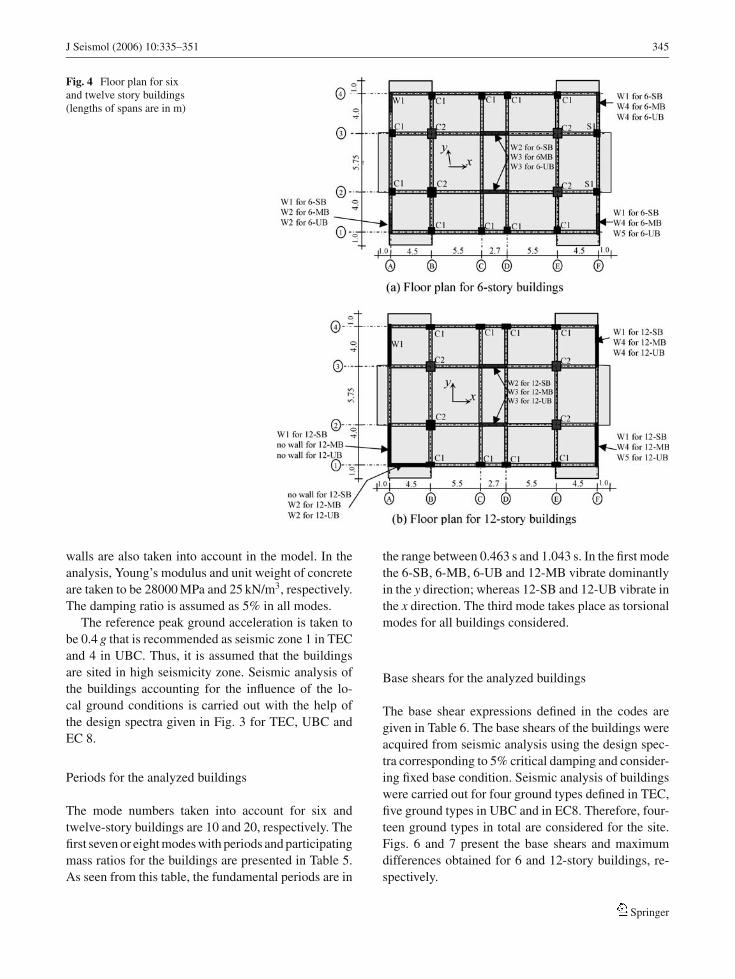
Fig. 4 Floor plan for sixand twelve story buildings(lengths of spans are in m)
walls are also taken into account in the model. In the
analysis, Young’s modulus and unit weight of concrete
are taken to be 28000 MPa and 25 kN/m3, respectively.
The damping ratio is assumed as 5% in all modes.
The reference peak ground acceleration is taken to
be 0.4 g that is recommended as seismic zone 1 in TEC
and 4 in UBC. Thus, it is assumed that the buildings
are sited in high seismicity zone. Seismic analysis of
the buildings accounting for the influence of the lo-
cal ground conditions is carried out with the help of
the design spectra given in Fig. 3 for TEC, UBC and
EC 8.
Periods for the analyzed buildings
The mode numbers taken into account for six and
twelve-story buildings are 10 and 20, respectively. The
first seven or eight modes with periods and participating
mass ratios for the buildings are presented in Table 5.
As seen from this table, the fundamental periods are in
the range between 0.463 s and 1.043 s. In the first mode
the 6-SB, 6-MB, 6-UB and 12-MB vibrate dominantly
in the y direction; whereas 12-SB and 12-UB vibrate in
the x direction. The third mode takes place as torsional
modes for all buildings considered.
Base shears for the analyzed buildings
The base shear expressions defined in the codes are
given in Table 6. The base shears of the buildings were
acquired from seismic analysis using the design spec-
tra corresponding to 5% critical damping and consider-
ing fixed base condition. Seismic analysis of buildings
were carried out for four ground types defined in TEC,
five ground types in UBC and in EC8. Therefore, four-
teen ground types in total are considered for the site.
Figs. 6 and 7 present the base shears and maximum
differences obtained for 6 and 12-story buildings, re-
spectively.
Springer
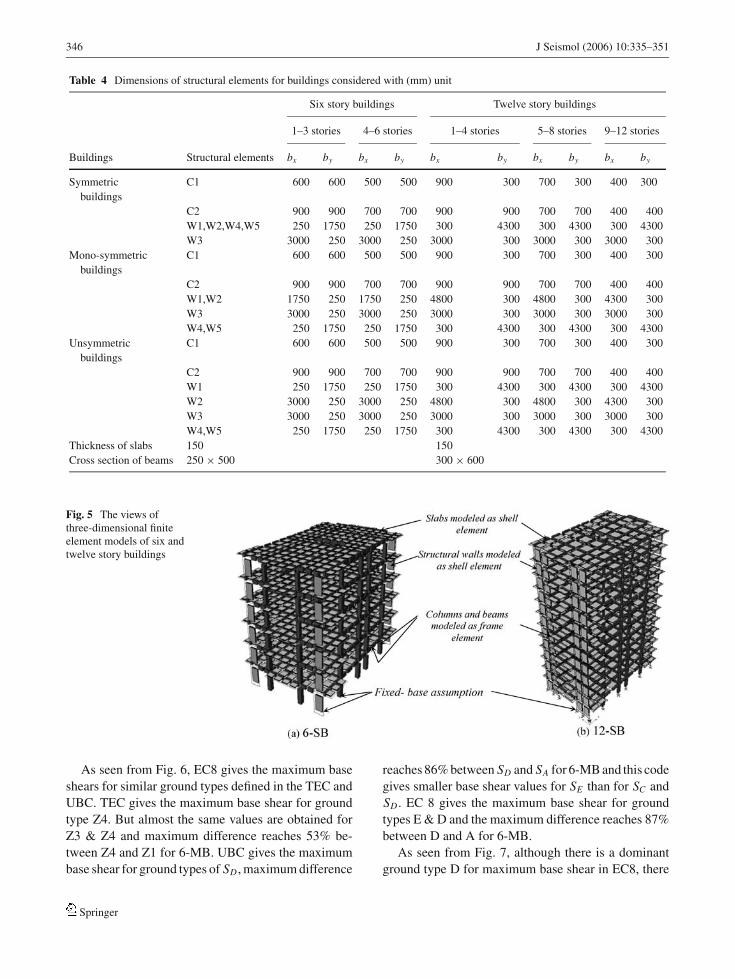
346 J Seismol (2006) 10:335–351
Table 4 Dimensions of structural elements for buildings considered with (mm) unit
Six story buildings Twelve story buildings
1–3 stories 4–6 stories 1–4 stories 5–8 stories 9–12 stories
Buildings Structural elements bx by bx by bx by bx by bx by
Symmetric C1 600 600 500 500 900 300 700 300 400 300
buildings
C2 900 900 700 700 900 900 700 700 400 400
W1,W2,W4,W5 250 1750 250 1750 300 4300 300 4300 300 4300
W3 3000 250 3000 250 3000 300 3000 300 3000 300
Mono-symmetric C1 600 600 500 500 900 300 700 300 400 300
buildings
C2 900 900 700 700 900 900 700 700 400 400
W1,W2 1750 250 1750 250 4800 300 4800 300 4300 300
W3 3000 250 3000 250 3000 300 3000 300 3000 300
W4,W5 250 1750 250 1750 300 4300 300 4300 300 4300
Unsymmetric C1 600 600 500 500 900 300 700 300 400 300
buildings
C2 900 900 700 700 900 900 700 700 400 400
W1 250 1750 250 1750 300 4300 300 4300 300 4300
W2 3000 250 3000 250 4800 300 4800 300 4300 300
W3 3000 250 3000 250 3000 300 3000 300 3000 300
W4,W5 250 1750 250 1750 300 4300 300 4300 300 4300
Thickness of slabs 150 150
Cross section of beams 250 × 500 300 × 600
Fig. 5 The views ofthree-dimensional finiteelement models of six andtwelve story buildings
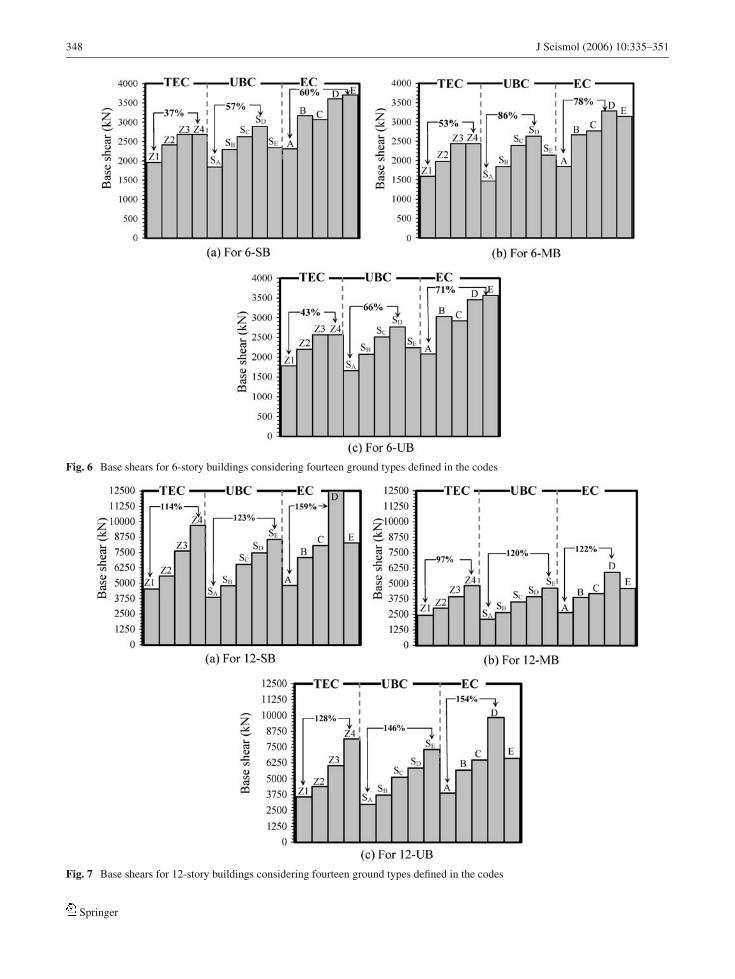
As seen from Fig. 6, EC8 gives the maximum base
shears for similar ground types defined in the TEC and
UBC. TEC gives the maximum base shear for ground
type Z4. But almost the same values are obtained for
Z3 & Z4 and maximum difference reaches 53% be-
tween Z4 and Z1 for 6-MB. UBC gives the maximum
base shear for ground types of SD , maximum difference
reaches 86% between SD and SA for 6-MB and this code
gives smaller base shear values for SE than for SC and
SD . EC 8 gives the maximum base shear for ground
types E & D and the maximum difference reaches 87%
between D and A for 6-MB.
As seen from Fig. 7, although there is a dominant
ground type D for maximum base shear in EC8, there
Springer

J Seismol (2006) 10:335–351 347
Table 5 First seven/eight periods (s) and modal properties for six different buildings considered
Horizontal modes for the buildings
Buildings x-direction y-direction Torsional mode
6-SB Mode, period 2nd, 0.440 5th, 0.126 – 1st, 0.463 4th, 0.139 7th, 0.068 3rd, 0.371 6th 0.111
Mass ratio 0.000 0.000 0.748 0.135 0.053 0.000 0.000
6-MB Mode, period 2nd, 0.418 5th, 0.119 – 1st, 0.546 4th, 0.175 7th, 0.093 3rd, 0.388 6th, 0.117
Mass ratio 0.000 0.003 0.658 0.103 0.040 0.104 0.021
6-UB Mode, period 2nd, 0.430 5th, 0.123 – 1st, 0.493 4th, 0.151 7th, 0.076 3rd, 0.382 6th, 0.115
Mass ratio 0.004 0.001 0.714 0.123 0.048 0.035 0.081
12-SB Mode, period 1st, 0.871 4th, 0.298 7th, 0.156 2nd, 0.825 5th, 0.226 8th, 0.100 3rd, 0.622 6th, 0.174
Mass ratio 0.000 0.000 0.000 0.687 0.157 0.000 0.000 0.000
12-MB Mode, period 2nd, 0.769 5th, 0.229 8th, 0.115 1st, 1.043 4th, 0.348 6th, 0.182 3rd, 0.534 7th, 0.157
Mass ratio 0.000 0.000 0.021 0.543 0.091 0.046 0.188 0.034
12-UB Mode, period 1st, 0.924 4th, 0.273 7th, 0.130 2nd, 0.813 5th, 0.254 8th, 0.117 3rd, 0.648 6th, 0.180
Mass ratio 0.013 0.049 0.016 0.634 0.088 0.016 0.022 0.061
Table 6 Base shear definedin the TEC, UBC and EC8 Codes Base shear
TEC Vt = Sd (T ) · Wg ≥ 0.1Ao · γI · W
UBC Vs = Sd (T ) Wg ≥
{0.11Ca · γI · W0.8Z NvγI
R W (for zone 4)2.5CaγI
R W ≥ Vs
T = min (Ta , 1.3Te) for zone 4
EC8 Fb = Sd (T ) · Wg · λ where λ = 0.85 if T1 ≤ 2 TC or λ = 1.00 otherwise
Note: The effective modal mass mk ,
corresponding to a mode k, is determined so that
the base shear force Fbk , acting in the direction of
application of the seismic action, may be expressed
as Fbk = Sd (Tk ) mk
Note. For Sd (T) given inthis table, differentexpressions introduced inTable 4 depending on soiland structure propertiesincluding structuralbehaviour factor
is no a dominant ground type like D in TEC and UBC.
TEC presents the maximum base shear for ground type
of Z4 and maximum difference reaches 128% between
Z4 and Z1 for 12-UB. UBC gives the maximum base
shear for ground type SE and maximum difference
reaches 146% between SE and SA for 12-UB. EC8 gives
the maximum base shear for ground type D and maxi-
mum difference reaches 154% between classes D and
A for 12-UB.
The story number of story in which the maximum
shear force occurred was investigated. Maximum shear
force occurs at the 1st story for 6-SB and 6-MB, 12-SB
and 12-UB, whereas it occurs at the 4th story for 6-UB
and 12-MB.
As seen from Figs. 6 and 7, very different base shear
values were obtained for different ground types and
building structural systems. Although all ground types
defined in the codes are included in this study, a general
conclusion cannot be reached due to the limited num-
ber (6) of buildings. For a general conclusion, more
buildings having different structural systems and pe-
riod values should be investigated taking into account
various design ground acceleration. Even now, it may
be said mainly two things for considered buildings:
Firstly differences for maximum base shears are ten-
dency to increase for unsymmetrical buildings. Sec-
ondly when the number of story increase, in this case
mass of the structure is also increase, the differences
between base shears obtained for various ground types
become larger. These increases for six to twelve story
buildings are meanly 69% for TEC, 60% for UBC and
75% for EC 8.
Springer
348 J Seismol (2006) 10:335–351
Fig. 6 Base shears for 6-story buildings considering fourteen ground types defined in the codes
Fig. 7 Base shears for 12-story buildings considering fourteen ground types defined in the codes
Springer
J Seismol (2006) 10:335–351 349
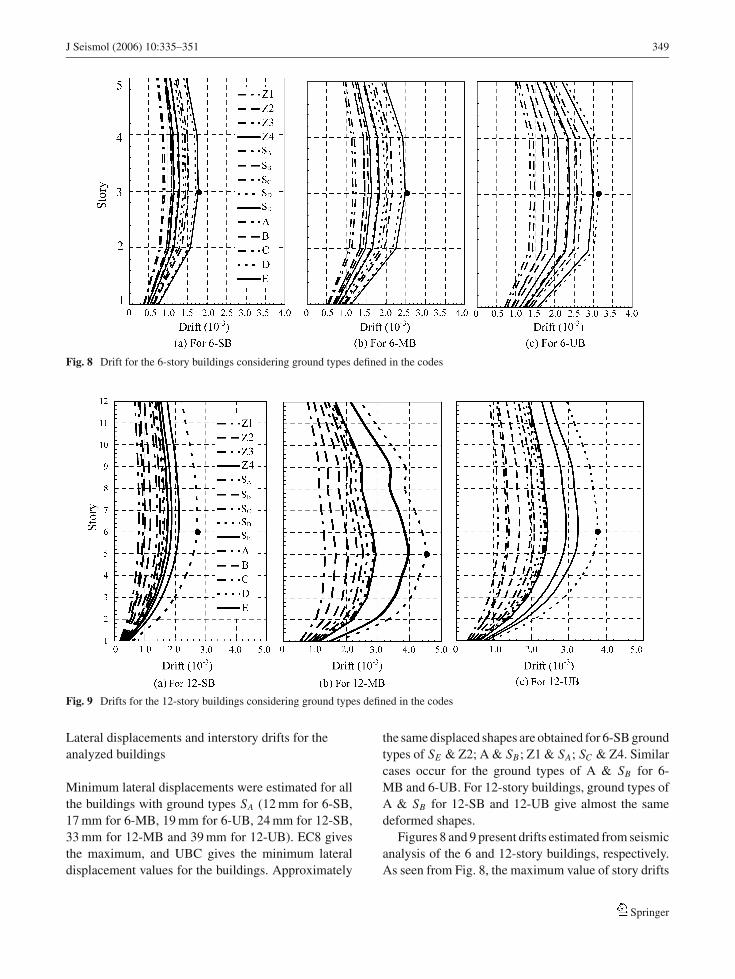
Fig. 8 Drift for the 6-story buildings considering ground types defined in the codes
Fig. 9 Drifts for the 12-story buildings considering ground types defined in the codes
Lateral displacements and interstory drifts for the
analyzed buildings
Minimum lateral displacements were estimated for all
the buildings with ground types SA (12 mm for 6-SB,
17 mm for 6-MB, 19 mm for 6-UB, 24 mm for 12-SB,
33 mm for 12-MB and 39 mm for 12-UB). EC8 gives
the maximum, and UBC gives the minimum lateral
displacement values for the buildings. Approximately
the same displaced shapes are obtained for 6-SB ground
types of SE & Z2; A & SB ; Z1 & SA; SC & Z4. Similar
cases occur for the ground types of A & SB for 6-
MB and 6-UB. For 12-story buildings, ground types of
A & SB for 12-SB and 12-UB give almost the same
deformed shapes.
Figures 8 and 9 present drifts estimated from seismic
analysis of the 6 and 12-story buildings, respectively.
As seen from Fig. 8, the maximum value of story drifts
Springer
350 J Seismol (2006) 10:335–351
Table 7 Maximum and minimum displacements obtained for the buildings considering each code
TEC UBC EC8
Buildings Min. Max. % Min. Max. % Min. Max. %
6-SB Displacement 13 mm 18 mm 38 12 mm 20 mm 67 16 mm 25 mm 119
Ground type Z1 Z4 SA SD A E
6-MB Displacement 21 mm 33 mm 57 19 mm 36 mm 89 24 mm 43 mm 79
Ground type Z1 Z4 SA SD A D
6-UB Displacement 17 mm 26 mm 53 17 mm 28 mm 65 21 mm 35 mm 67
Ground type Z1 Z4 SA SD A E
12-SB Displacement 28 mm 62 mm 121 24 mm 55 mm 129 30 mm 80 mm 167
Ground type Z1 Z4 SA SE A D
12-MB Displacement 47 mm 113 mm 140 39 mm 112 mm 187 48 mm 129 mm 169
Ground type Z1 Z4 SA SE A D
12-UB Displacement 40 mm 96 mm 140 33 mm 86 mm 161 42 mm 112 mm 167
Ground type Z1 Z4 SA SE A D
within a story, (�i )max, for columns and structural walls
of the i th story of a building for each earthquake di-
rection satisfies the conditions given by (�i )max/hi ≤0.0035 (defined in the TEC) for the 6-story building.
However, as seen from Fig. 9, the maximum values
of the story drift exceed the condition for 12-MB sup-
ported on ground types of D, Z4, SE , and for 12-UB
supported on ground type of D.
All maximum and minimum displacement values
determined for each code are given in Table 7. As seen
from this table, the smallest differences between maxi-
mum and minimum displacement values for the 6-story
buildings are obtained as to be 38% between Z1 and
Z4 in TEC, 65% between SA and SD in UBC and 67%
between A and E in EC8. The largest differences be-
tween maximum and minimum displacement values for
the 12-story buildings are obtained as to be 140% be-
tween Z1 and Z4 in TEC, 187% between SA and SE in
UBC and 169% between A and D in EC8. It should be
noted here that when the soil gets softer, as mentioned
above, the lateral displacements are increase.
Conclusions
The differences among the code defined response spec-
tra may be summarized as: (a) The near source factors
are considered only in the UBC. Such near source fac-
tors are not defined in EC8 and TEC. EC8 has a foot-
note such that the Type 2 Spectrum is adopted when a
surface-wave magnitude is not greater than 5.5. (b) The
ordinate value of design spectra increases with T for
UBC, decreases for the TEC and EC8 for small values
of vibration period (T < TB). (c) The TEC specifies the
same peak values for all ground types, whereas UBC
and EC8 specify different peak values. (d) EC8 spec-
ifies the values of the maximum allowable behaviour
factor depending on type of structural system, regu-
larity in elevation and prevailing failure mode in the
system with walls, whereas TEC specifies periods for
structure and ground class (T and TB) dependent values
of behaviour factor in addition to structural system. (e)
Although all domains of the response spectrum are de-
fined differently in the EC8, the constant displacement
and constant velocity domains are not defined differ-
ently in UBC and TEC.
There are significant differences between the three
codes (TEC, UBC, EC8) and IBC&FEMA seismic de-
sign provisions. The biggest change related to the de-
sign spectra from the codes to the IBC is in the design
ground motion parameters, now SDS and SD1, rather
than seismic zone factor.
EC8 presents an annex for elastic displacement spec-
trum for periods of long vibration period. As the cur-
rent trend in seismic design is displacement-based, it is
expected that the displacement design spectra and for
different peak values of the separate ground types are
also included in the new versions of the TEC.
For the buildings, EC8 gives the maximum and UBC
the minimum displacement values. EC8 generally gives
the larger base shear for similar ground types defined
in the other codes. The maximum base shears occurred
Springer
J Seismol (2006) 10:335–351 351
for ground types of D or E defined in EC8. The number
of the story in which maximum shear force is occurring
changes depending on the ground types.
Some engineers share the view that internal forces
decrease and lateral displacements increase from the
first ground type to the last ground type code defined,
that is, as if the ground becomes softer. This view is ver-
ified in the analysis carried out considering all ground
types and the requirements defined in TEC, while it
is valid only for the first two ground types defined in
EC8 and UBC when analyzing the sample buildings.
However, the view loses its meaning especially for the
last two ground types given in EC8 and UBC, because
larger internal forces are obtained for the 4th ground
types (D in EC8, SD in UBC) than that for the 5th
ground type (E in EC8, SE in UBC). Therefore, this
may lead to some mistakes for design for soft soils. It
should be noted that ground class E does not always
identify a soil profile softer than class D.
Acknowledgement Authors wish to tank Ezio Faccioli for hishelpful comments and suggestions on earlier versions of thismanuscript.
References
Akkar S, Gulkan P (2002) A critical examination of near-fieldaccelerograms from the Sea of Marmara region earthquakes.Bull Seism Soc Am 92:428–477
Ambraseys N, Simpson K, Bommer J (1996) Prediction of hori-zontal response spectra in Europe. Earthq Engng Struct Dyn25:371–400
Bommer JJ, Elnashai AS (1999) Displacement spectra for seis-mic design. J Earthq Engng 3:1–32
Bommer JJ, Elnashai AS, Weir AG (2000) Compatible accel-eration and displacement spectra for seismic design codes.Proc 12th World Conf Earthq Engng, Auckland, Paper no.207
Bommer JJ, Borzi B, Chlimintzas G, Elnashai AS, Lee D,Faccioli E, Tolis S (2001) Definition of displacement re-sponse spectra for design. In: Faccioli E, Paolucci R (eds.)Seismic Actions. ECOEST2/ICONS Report No.1, pp 3–34
Bommer JJ, Acevedo AB (2004) The use of real earthquakeaccelerograms as input to dynamic analysis. J Earthq Engng8:43–91
Bommer JJ, Mendis R (2005) Scaling of spectral displacementordinates with damping ratios. Earthq Engng Struct Dyn34:145–165
Boore DM, Joyner WB, Fumal TE (1994) Estimation of re-sponse spectra and peak accelerations from western North
American earthquakes, an interim report, USGS Open-FileReport 94–127
Borcherdt RD (1994) Estimates of site-dependent response spec-tra for design (methodology and justification). Earthq Spec-tra 10:617–653
Borzi B, Calvi GM, Elnashai AS, Faccioli E, Bommer JJ (2001)Inelastic spectra for displacement-based seismic design.Soil Dyn Earthq Engng 21:47–61
Dobry R, Borcherdt RD, Crouse CB, Idriss IM, Joyner WB,Martin GR, Power MS, Rinne EE, Seed RB (2000) Newsite coefficients and site classification system used in recentbuilding seismic code provisions. Earthq Spectra 16:41–67
EC 8 (2004) Eurocode 8: design of structures for earthquakeresistance Part 1: general rules, seismic actions and rulesfor buildings, European Norm. European Committee forStandardisation, European Committee for StandardisationCentral Secretariat, rue de Stassart 36, B-1050 Brussels
Erdik M (2004) Report on 1999 Kocaeli and Duzce (Turkey)earthquakes. Kandilli Obsarvotary and Earthquake Re-search Institute, Turkey. http://www.koeri.boun.edu.tr/ de-premmuh/eqspecials/kocaeli/Kocaelireport.pdf
Faccioli E, Tolis SV, Borzi B, Elnashai AS, Bommer JJ (1998)Recent developments in the definition of the design seismicaction in Europe. Proc 11th European Conf Earthq Engng,ISBN 90 54 10 982 3, Balkema, Rotterdam, pp 1–10
Faccioli E, Paolucci R, Pessina V (2002) Engineering assess-ment of seismic hazard and long period ground motions atthe Bolu Viaduct Site following the November 1999 earth-quake. J Seism 6:307–327
Faccioli E, Paolucci R, Rey J (2004) Displacement spectra forlong periods Earthq Spectra 20:347–376
FEMA 368–369 (2001) NEHPR-recommended provisions forseismic regulations for new buildings. Buildings SeismicSafety Council, Washington, DC, USA
Garcia-Mayordomo J, Faccioli E, Paolucci R (2004) Compara-tive study of the seismic hazard assessments in Europeannational seismic codes. Bull Earthq Engng 2:51–73
Gulkan P, Sozen MA (1974) Inelastic response of reinforced con-crete structures to earthquake motions. ACI Journal 71:604–610
IBC (2003) The International Building Code. International CodeCouncil, Virginia, USA
Joyner WB, Fumal TE (1984) Use of measured shear wave ve-locity for predicting geologic site effects on strong groundmotions. Proc 8th World Conf Earthq Engng San Francisco2:777–783
Sabetta F, Bommer JJ (2002) Modification of the spectral shapesand subsoil conditions in Eurocode 8. Proc 12th EuropeanConf Earthq Engng London, Paper No 518
SAP2000 (2003) Integrated Software for Structural Analysis andDesign: Computers and Struct. Inc. Berkeley, California
TEC (1998) Specification for Structures to be Built in DisasterAreas, Ministry of Public Works and Settlement Govern-ment of Republic of Turkey, 85 pp
Tolis SV, Faccioli E (1999) Displacement design spectra. J EarthqEngng 3:107–125
UBC (1997) Uniform Building Code, International Conferenceof Building Officials. Whittier, California, USA
Springer


![EN 1993-1-1: Eurocode 3: Design of steel structures - Part ... · PDF fileEN 1996 Eurocode 6: Design of masonry structures EN ]997 Eurocode 7: Geotechnical design EN 1998 Eurocode](https://img.pdfslide.us/doc/110x75/5a71061f7f8b9aa2538c9518/en-1993-1-1-eurocode-3-design-of-steel-structures-part-nbsppdf.jpg)