Embed Size (px)
Citation preview
A COMPARATIVE STUDY OF SELF-CONSOLIDATING
CONCRETES INCORPORATING HIGH-VOLUME
NATURAL POZZOLAN OR HIGH-VOLUME FLY ASH
Kemal Celik1, Cagla Meral
1, 2, Mauricio Mancio
1,3, P.K. Mehta
1, P.J.M. Monteiro
1
1Department of Civil and Environmental Engineering, University of California, Berkeley, CA 94720, USA 2Department of Civil Engineering, Middle East Technical University, 06800 Ankara, Turkey
3Unisinos University, Graduate Program in Civil Engineering (PPGEC), Avenue Unisinos, 950, 93022-000 Sao Leopoldo, RS-Brazil
ABSTRACT
The purpose of this study is to compare the effects of Portland cement replacement on the
strength and durability of self-consolidating concretes (SSC). The two replacement materials
used are high-volume natural pozzolan (HVNP), a Saudi Arabian aluminum-silica rich basaltic
glass and high-volume Class-F fly ash (HVFAF), from Jim Bridger Power Plant, Wyoming US.
As an extension of the study, limestone (LS) is also used to replace Portland cement, alongside
HVNP or HVFAF, forming ternary blends. Along with compressive strength tests, non-steady
state chloride migration and gas permeability tests were performed, as durability indicators on
SCC specimens. The results were compared to two reference concretes; 100% ordinary Portland
cement (OPC) and 85% OPC – 15% LS by mass. The HVNP and HVFAF concrete mixes
showed strength and durability results comparable to the reference concretes; identifying that
both can effectively be used to produce of low-cost and environmental friendly SCC.
Keywords: Ternary blend, high volume fly ash, high volume natural pozzolan, limestone,
durability
INTRODUCTION
As of 2012, more than 25 billion tonnes of Portland cement concrete is produced annually
making it the world’s most widely used manufactured material (WBCSD, 2009). Even though
the reasons for concrete’s dominance are diverse (Mehta and Monteiro, 2006), the massive
production and consumption cycle of concrete have significant environmental impacts, making
the concrete industry unsustainable (Mehta, 2001). Currently, Portland cement concrete
production accounts for around 7% of anthropogenic carbon dioxide (CO2) emissions annually
(Mehta, 2001). Most of the emissions are attributable to the production of Portland cement
clinker; the active ingredient in Portland cement ([IEA] and [WBCSD], 2009). Using an
increased proportion of supplementary cementing materials (such as natural pozzolan (NP) and
fly ash) provides a sustainable solution, while yielding concrete mixtures with high workability,
high durability, and comparable ultimate strength. HVFAF mixtures have been utilized
successfully in many projects with technical and environmental advantages and is a low-cost,
sustainable alternative to conventional Portland cement concrete (Malhotra and Mehta, 2008).
With growing field experience of fly ash and increasing demand for environment-friendly
structural materials, fly ash consumption through the concrete sector is expected to rise (Mehta,
2009, Malhotra and Mehta, 2008). However, the global availability of fly ash is around 900
million tonnes annually (Mehta, 2010), and not all of it is suitable for use in blended cements or
concrete mixtures. As a result, there is a need for other alternative materials, natural pozzolan
and ground limestone, being two possibilities (Khan and Alhozaimy, 2011, Celik et al., 2012,
Celik et al., 2013, Erdem et al., 2007, Uzal and Turanlı, 2012). Studies of Portland cement-based
ternary and quaternary blends containing combinations of fly ash Class F (FAF), silica fume,
blast furnace slag, ground limestone and natural pozzolans show that blended cements can be
optimized to minimize the shortcomings of each component, resulting in synergistic properties
of the cementing material (De Weerdt et al., 2011, Menéndez et al., 2003, Pipilikaki and
Katsioti, 2009).
With the ongoing technological advances, the design and placement techniques of concrete are
also changing. The ultimate target is the freedom in design while considering improved
productivity, profitability, and sustainability. SCCs are highly engineered concrete mixtures
obtained by optimizing normal concrete ingredients with a superplasticizer and a viscosity
modifying agent (VMA). This study is based on the authors' previous work on SCCs (Celik et
al., 2012, Celik et al., 2013), performed to analysis and compare the effect of NP/ FAF as OPC
replacement at 30 mass% and 50 mass% in SCC production without utilizing VMAs. The
interaction of NP/FAF with LS is also studied in 30 mass%, 40 mass%, 50 mass% NP/FAF and
15 mass% LS in the ternary blended cements. The results are compared in terms of compressive
strength development and durability performance with reference concrete mixes that have no
mineral admixture and 15 mass% LS.
MATERIALS AND METHODS
Materials Khan and Alhozaimy (Khan and Alhozaimy, 2011) reported that NP used in the present work
complies with the requirements of ASTM C618 for Class N; there are several studies describing
its pozzolanic properties (Khan and Alhozaimy, 2005, MR Moufti et al., 2000). The mean
particle sizes of the powder materials used in this study were determined by laser light scattering
as 10.4m, 17.4m, 22.3m, and 48.1m for OPC (ASTM Type I/II), NP from Saudi Arabia,
FAF from Jim Bridger Power Plant, Wyoming, US, and LS respectively. The chemical
composition of the powder materials used is given in Table 1. Aggregates used include quartzitic
sand with fineness modulus of 3.1, pea gravel with maximum size of 12.7mm (½”) and basalt
with maximum size of 19.0mm (¾”). The entry-level carboxylated polyether-based high-range
water reducer (ADVA-140) with a specific gravity of 1.04 kg/l was also used.
Table 1. Chemical composition of powder materials (oxides, % by mass)
OPC NP FAF LS
SiO2 20.44 46.48 62.0 0.70 Al2O3 3.97 14.74 18.90 0.50
Fe2O3 4.07 12.16 4.90 0.12
CaO 62.90 8.78 5.98 47.40 MgO 2.42 8.73 1.99 6.80
Na2O 0.37 3.39 2.41 --
K2O 0.43 1.27 1.14 -- P2O5 0.16 0.629 0.26 --
TiO2 0.23 2.31 1.09 --
MnO 0.32 0.19 0.04 -- L.O.I. 4.69 1.324 1.30 44.48
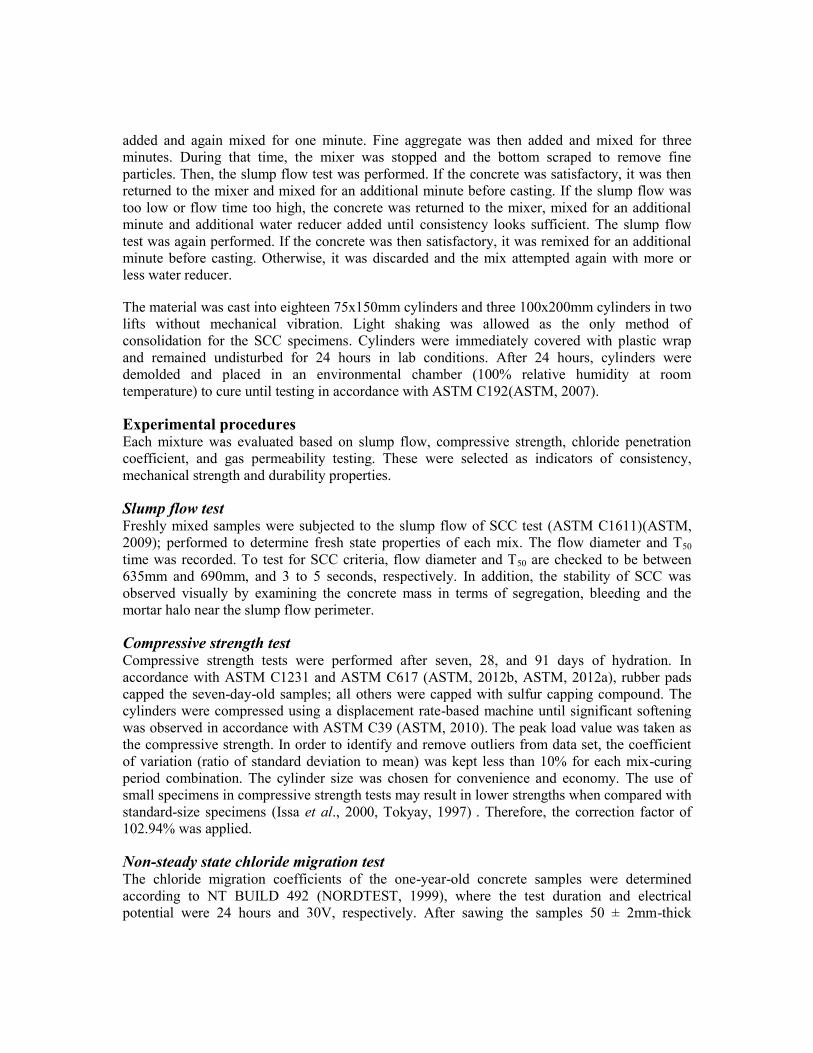
Concrete Mixture Proportions Concrete mixture proportions are given in Table 2. The water/ cementitious material (W/CM)
ratio was held constant at 0.35 for all mixes and the amount of superplasticizer (SP) was added
to provide a slump flow diameter between 635-690mm, and a diameter of 50mm flow time, T50,
between 3 to 5 seconds. In order to reduce cement content compared to typical SCCs, the total
aggregate to fines ratio was fixed at 4:1, and the cement replacement (CR) ratio ranging from 30
mass% to 65 mass%. For the ternary blends, the LS content was set as 15 mass%, and the ratio
of NP/FAF was varied between 30 mass% and 50 mass%. The ratio between coarse aggregates
(CA) and fine aggregates (FA) was kept at 1:1. The CA consists of 30 mass% pea gravel and 70
mass% basalt.
Table 2. Concrete mix proportions
OPC-LS-NP/FAF
(mass%) OPC NP/FAF LS FA CA W/CM
SP (NP/FAF) (mass%)
CM (kg/m3)
OPC (kg/m3)
CR (kg/m3)
Control mixes 100-0-0 1.00 – – 2 2 0.35 1.43 461 461 0
85-15-0 0.85 - 0.15 2 2 0.35 1.43 458 389 69
Binary HVNP/FAF blends
70-0-30 0.70 0.30 – 2 2 0.35 1.08/1.39 453 317 136
50-0-50 0.50 0.50 – 2 2 0.35 1.03/1.14 449 224 224
Ternary
HVNP/FAF-LS
blends
55-15-30 0.55 0.30 0.15 2 2 0.35 1.22/1.14 451 248 203
45-15-40 0.45 0.40 0.15 2 2 0.35 1.22/1.03 448 202 247
35-15-50 0.35 0.50 0.15 2 2 0.35 1.12/1.00 446 156 290
* The chemical admixture used was an entry-level carboxylated polyether-based high-range water reducer (ADVA 140) with a
specific gravity of 1.010-1.120.
Sample Preparation For the each mixture, a total volume of 22L of concrete was prepared in a pan planetary-type
mixer. The mixing procedure was as follows; CA and a small amount of water were mixed for
30 seconds. OPC, NP/FAF and more water were added and mixed for one minute. LS and the
rest of the water were added and mixed for a further minute before the superplasticizer was
added and again mixed for one minute. Fine aggregate was then added and mixed for three
minutes. During that time, the mixer was stopped and the bottom scraped to remove fine
particles. Then, the slump flow test was performed. If the concrete was satisfactory, it was then
returned to the mixer and mixed for an additional minute before casting. If the slump flow was
too low or flow time too high, the concrete was returned to the mixer, mixed for an additional
minute and additional water reducer added until consistency looks sufficient. The slump flow
test was again performed. If the concrete was then satisfactory, it was remixed for an additional
minute before casting. Otherwise, it was discarded and the mix attempted again with more or
less water reducer.
The material was cast into eighteen 75x150mm cylinders and three 100x200mm cylinders in two
lifts without mechanical vibration. Light shaking was allowed as the only method of
consolidation for the SCC specimens. Cylinders were immediately covered with plastic wrap
and remained undisturbed for 24 hours in lab conditions. After 24 hours, cylinders were
demolded and placed in an environmental chamber (100% relative humidity at room
temperature) to cure until testing in accordance with ASTM C192(ASTM, 2007).
Experimental procedures Each mixture was evaluated based on slump flow, compressive strength, chloride penetration
coefficient, and gas permeability testing. These were selected as indicators of consistency,
mechanical strength and durability properties.
Slump flow test Freshly mixed samples were subjected to the slump flow of SCC test (ASTM C1611)(ASTM,
2009); performed to determine fresh state properties of each mix. The flow diameter and T50
time was recorded. To test for SCC criteria, flow diameter and T50 are checked to be between
635mm and 690mm, and 3 to 5 seconds, respectively. In addition, the stability of SCC was
observed visually by examining the concrete mass in terms of segregation, bleeding and the
mortar halo near the slump flow perimeter.
Compressive strength test Compressive strength tests were performed after seven, 28, and 91 days of hydration. In
accordance with ASTM C1231 and ASTM C617 (ASTM, 2012b, ASTM, 2012a), rubber pads
capped the seven-day-old samples; all others were capped with sulfur capping compound. The
cylinders were compressed using a displacement rate-based machine until significant softening
was observed in accordance with ASTM C39 (ASTM, 2010). The peak load value was taken as
the compressive strength. In order to identify and remove outliers from data set, the coefficient
of variation (ratio of standard deviation to mean) was kept less than 10% for each mix-curing
period combination. The cylinder size was chosen for convenience and economy. The use of
small specimens in compressive strength tests may result in lower strengths when compared with
standard-size specimens (Issa et al., 2000, Tokyay, 1997) . Therefore, the correction factor of
102.94% was applied.
Non-steady state chloride migration test The chloride migration coefficients of the one-year-old concrete samples were determined
according to NT BUILD 492 (NORDTEST, 1999), where the test duration and electrical
potential were 24 hours and 30V, respectively. After sawing the samples 50 ± 2mm-thick
sections and brushing and washing away any burrs from the surfaces of the specimen, the
samples were returned to the fog room until the testing date. The test steps were as follows: a)
the specimens were vacuum soaked with a saturated Ca(OH)2 solution, b) a 30V electrical
potential was applied that forces chloride ions from a 10% NaCl solution (catholyte) to migrate
into the specimen, and c) the initial current through each specimen was recorded. Three
specimens were tested for each mixture. Each specimen was then split axially into two pieces,
and a 0.1M AgNO3 solution sprayed on the freshly split surfaces. The chloride penetration depth
was precisely measured on photographic images of the specimens enlarged in image processing
software at seven points over 70mm distance from the white silver chloride precipitation. From
the mean penetration depth, the non-steady state chloride migration coefficient Dnssm was
calculated, as described in NT BUILD 492 (NORDTEST, 1999), using equation (1):
(1)
where
(2) ; and
(3)
where
Dnssm is the non-steady-state migration coefficient (m2/s)
z is the absolute value of ion valence for chloride (z = 1)
F is the Faraday constant (F = 9.648 ×10⁴ J/(V·mol))
U is the absolute value of the applied voltage (V)
R is the gas constant (R = 8.314 J/(K·mol))
T is the average value of the initial and final temperatures in the anolyte solution (°K)
L is the specimen thickness (m)
xd is the average value of the penetration depths (m)
t is the duration (s)
erf–1
is the inverse of the error function
cd is the chloride concentration at which the color of the concrete changes for OPC
concrete (≈ 0.07N where N is the molar concentration divided by an equivalence factor)
c0 is the chloride concentration in the catholyte solution (≈ 2N)
Three specimens were tested for each mix, and the average result calculated.
Gas permeability test The gas permeability of the one-year-old concrete specimens was measured with the
CEMBUREAU method (RILEM, 1999) using nitrogen gas as the permeating medium. Five gas
pressure stages varying from 0.5bar (0.05MPa) to 2.5 bar (0.25MPa) were applied to the dried
specimens until the observed weight loss was less than 0.5g between two successive readings
over a time interval of 24 hours. Flow times were read every 30 minutes until a steady-state flow
was reached. If the difference between successive readings within five minutes was less than
3%, it was determined that the flow had reached a steady-state condition. For each gas pressure
step, the gas permeability coefficient, Kg, was calculated using the Hagen-Poiseuille relationship
for laminar flow of a compressible fluid through a porous under steady-state conditions (Kollek,
1989), so that:
𝐷𝑛𝑛𝑠𝑚 =𝑅𝑇
𝑧𝐹𝐸∙𝑥𝑑 − 𝛼√𝑥𝑑
𝑡
𝐸 =𝑈 − 2
𝐿 𝛼 = 2
𝑅𝑇
𝑧𝐹𝐸∙ 𝑒𝑟𝑓−1 1 −
2𝑐𝑑𝑐0
(4)
where
Kg is the gas permeability coefficient (m2)
Q is the volume flow rate of the fluid (m3 s
-1)
A is the cross-sectional area of the specimen (m2)
L is the thickness of the specimen in the direction of flow (m)
µ is the dynamic viscosity of the nitrogen at test temperature (N s m-2
)
P is the inlet (applied) pressure (absolute) (N m-2
)
Pa is the outlet pressure assumed in this test to be equal to atmospheric pressure (N m-2
)
P0 is the pressure at which the volume flow rate is determined, assumed in this test to be
atmospheric pressure (N m-2
).
RESULTS AND DISCUSSION
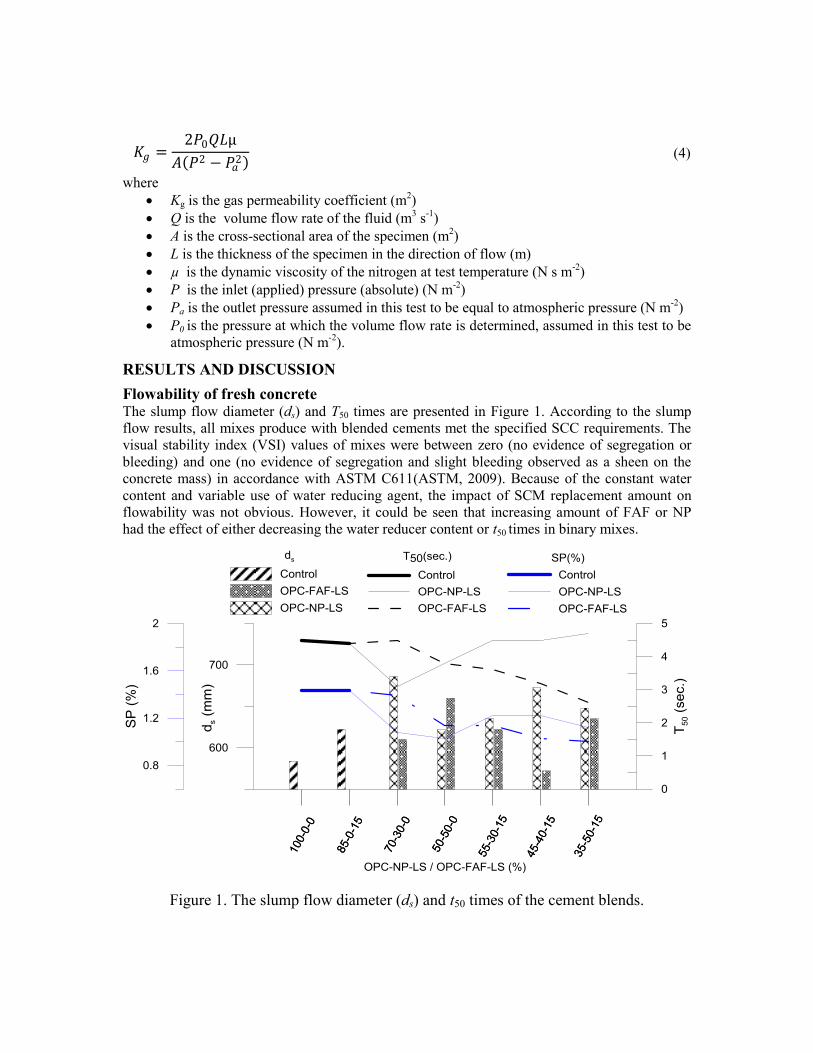
Flowability of fresh concrete The slump flow diameter (ds) and T50 times are presented in Figure 1. According to the slump
flow results, all mixes produce with blended cements met the specified SCC requirements. The
visual stability index (VSI) values of mixes were between zero (no evidence of segregation or
bleeding) and one (no evidence of segregation and slight bleeding observed as a sheen on the
concrete mass) in accordance with ASTM C611(ASTM, 2009). Because of the constant water
content and variable use of water reducing agent, the impact of SCM replacement amount on
flowability was not obvious. However, it could be seen that increasing amount of FAF or NP
had the effect of either decreasing the water reducer content or t50 times in binary mixes.
Figure 1. The slump flow diameter (ds) and t50 times of the cement blends.
𝐾𝑔 =2𝑃0𝑄𝐿µ
𝐴 𝑃2 − 𝑃𝑎2
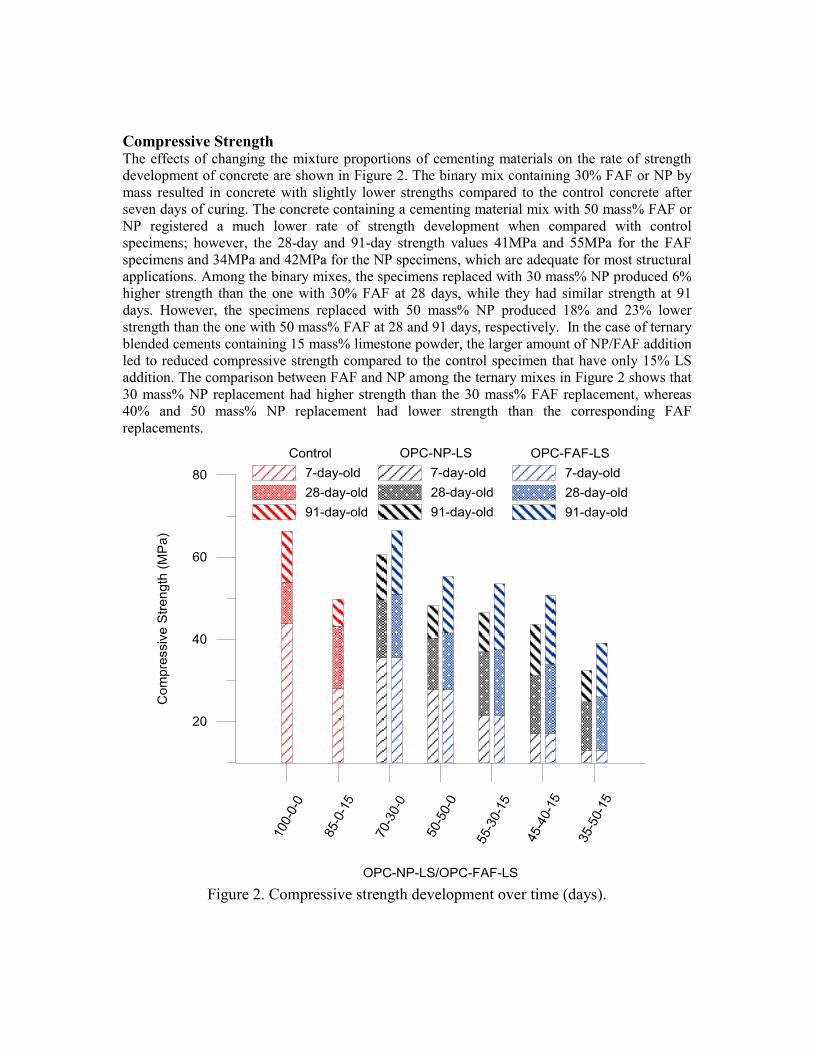
Compressive Strength The effects of changing the mixture proportions of cementing materials on the rate of strength
development of concrete are shown in Figure 2. The binary mix containing 30% FAF or NP by
mass resulted in concrete with slightly lower strengths compared to the control concrete after
seven days of curing. The concrete containing a cementing material mix with 50 mass% FAF or
NP registered a much lower rate of strength development when compared with control
specimens; however, the 28-day and 91-day strength values 41MPa and 55MPa for the FAF
specimens and 34MPa and 42MPa for the NP specimens, which are adequate for most structural
applications. Among the binary mixes, the specimens replaced with 30 mass% NP produced 6%
higher strength than the one with 30% FAF at 28 days, while they had similar strength at 91
days. However, the specimens replaced with 50 mass% NP produced 18% and 23% lower
strength than the one with 50 mass% FAF at 28 and 91 days, respectively. In the case of ternary
blended cements containing 15 mass% limestone powder, the larger amount of NP/FAF addition
led to reduced compressive strength compared to the control specimen that have only 15% LS
addition. The comparison between FAF and NP among the ternary mixes in Figure 2 shows that
30 mass% NP replacement had higher strength than the 30 mass% FAF replacement, whereas
40% and 50 mass% NP replacement had lower strength than the corresponding FAF
replacements.
Figure 2. Compressive strength development over time (days).
Durability Properties
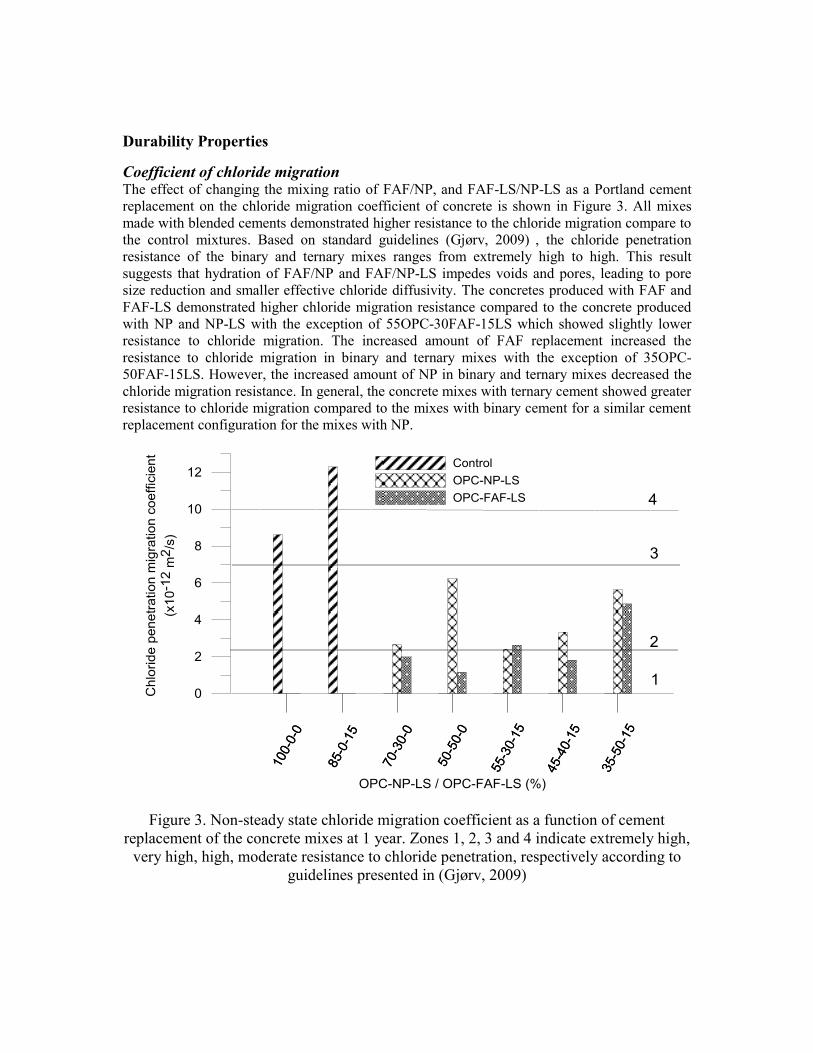
Coefficient of chloride migration The effect of changing the mixing ratio of FAF/NP, and FAF-LS/NP-LS as a Portland cement
replacement on the chloride migration coefficient of concrete is shown in Figure 3. All mixes
made with blended cements demonstrated higher resistance to the chloride migration compare to
the control mixtures. Based on standard guidelines (Gjørv, 2009) , the chloride penetration
resistance of the binary and ternary mixes ranges from extremely high to high. This result
suggests that hydration of FAF/NP and FAF/NP-LS impedes voids and pores, leading to pore
size reduction and smaller effective chloride diffusivity. The concretes produced with FAF and
FAF-LS demonstrated higher chloride migration resistance compared to the concrete produced
with NP and NP-LS with the exception of 55OPC-30FAF-15LS which showed slightly lower
resistance to chloride migration. The increased amount of FAF replacement increased the
resistance to chloride migration in binary and ternary mixes with the exception of 35OPC-
50FAF-15LS. However, the increased amount of NP in binary and ternary mixes decreased the
chloride migration resistance. In general, the concrete mixes with ternary cement showed greater
resistance to chloride migration compared to the mixes with binary cement for a similar cement
replacement configuration for the mixes with NP.
Figure 3. Non-steady state chloride migration coefficient as a function of cement
replacement of the concrete mixes at 1 year. Zones 1, 2, 3 and 4 indicate extremely high,
very high, high, moderate resistance to chloride penetration, respectively according to
guidelines presented in (Gjørv, 2009)
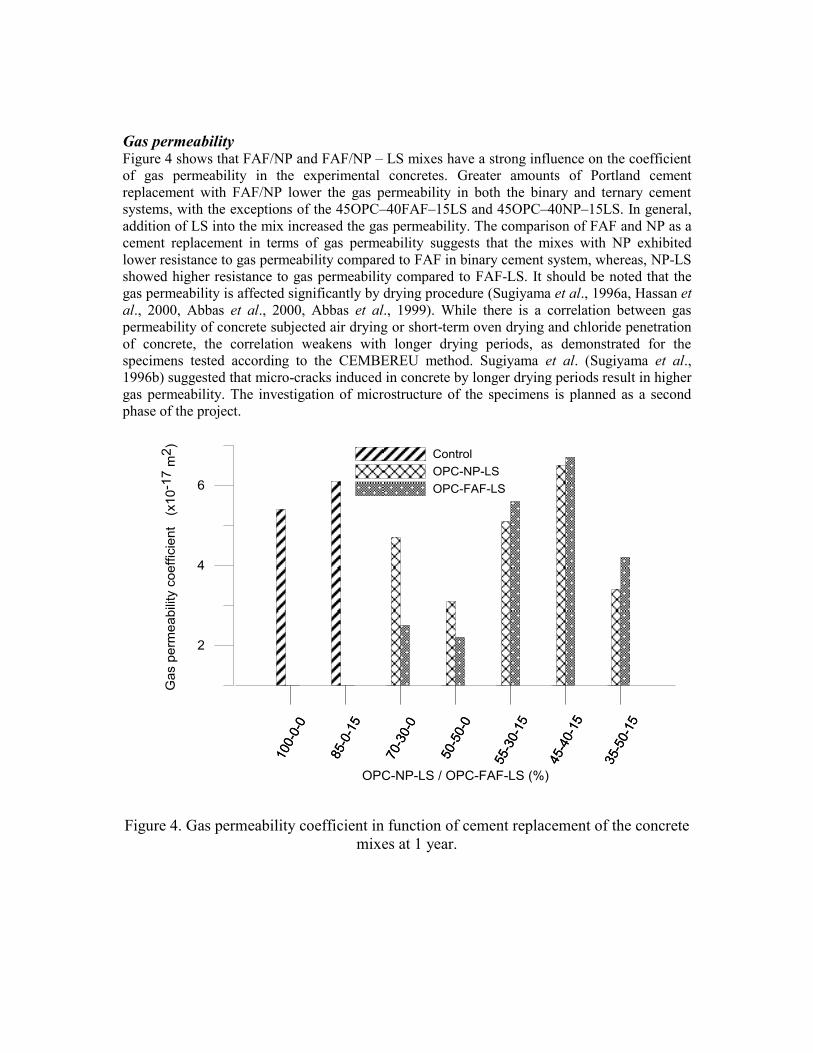
Gas permeability Figure 4 shows that FAF/NP and FAF/NP – LS mixes have a strong influence on the coefficient
of gas permeability in the experimental concretes. Greater amounts of Portland cement
replacement with FAF/NP lower the gas permeability in both the binary and ternary cement
systems, with the exceptions of the 45OPC–40FAF–15LS and 45OPC–40NP–15LS. In general,
addition of LS into the mix increased the gas permeability. The comparison of FAF and NP as a
cement replacement in terms of gas permeability suggests that the mixes with NP exhibited
lower resistance to gas permeability compared to FAF in binary cement system, whereas, NP-LS
showed higher resistance to gas permeability compared to FAF-LS. It should be noted that the
gas permeability is affected significantly by drying procedure (Sugiyama et al., 1996a, Hassan et
al., 2000, Abbas et al., 2000, Abbas et al., 1999). While there is a correlation between gas
permeability of concrete subjected air drying or short-term oven drying and chloride penetration
of concrete, the correlation weakens with longer drying periods, as demonstrated for the
specimens tested according to the CEMBEREU method. Sugiyama et al. (Sugiyama et al.,
1996b) suggested that micro-cracks induced in concrete by longer drying periods result in higher
gas permeability. The investigation of microstructure of the specimens is planned as a second
phase of the project.
Figure 4. Gas permeability coefficient in function of cement replacement of the concrete
mixes at 1 year.
CONCLUSIONS
This study focuses on comparing SCC mixes utilizing NP/FAF and LS. From the obtained
results for NP or FAF incorporating mixes, the following observations can be made:
In binary mixes, increasing the amount of NP/FAF used as OPC replacement resulted in
either decreased superplasticizer content or T50 times suggesting that both NP and FAF
might increase the flowability of concrete mixes.
Changing the OPC-NP/FAF-LS ratios utilized in the SCC allows designing for a desired
strength.
The 70 OPC-30 NP blend resulted in 12%, 6 %, 2% higher strength than the 70 OPC-30
FAF mix at the age of seven-, 28- and 91-days, respectively. The 50 OPC-50 NP,
however, showed 18% and 12% lower strength than the 50 OPC-50 FAF at 28- and 91-
days, correspondingly.
Among the ternary mixtures, 55OPC-30NP-15LS mix had higher strength, while
45OPC-40NP-15LS and 35OPC-50NP-15LS mixes had lower strength when compared
to the corresponding mixes with FAF.
All the binary and ternary mixes made with blended cements with either NP or FAF
demonstrated higher resistance to the chloride migration compared to the control mixes.
In general, the mixes with FAF or FAF-LS demonstrated higher chloride migration
resistance compared to the ones with NP or NP-LS with the exception of 55 OPC-30
FAF-15 LS which showed slightly lower resistance to chloride migration at one year.
In the binary mixes, the comparison of FAF and NP as a cement replacement in terms of
gas permeability suggests that the mixes with NP exhibited lower resistance to gas
permeability compared to FAF, whereas in the ternary mixes NP-LS showed higher
resistance to gas permeability compared to FAF-LS.
Overall, FAF and NP (with or without LS) can be both used effectively in producing sustainable
and durable SCC without utilizing VMA.
ACKNOWLEDGEMENTS
This publication was based on work supported in part by Award No. KUS-l1-004021, made by
King Abdullah University of Science and Technology (KAUST) and by NIST grants
60NANB10D014. The authors thank the insightful comments given by Dr. Rae Taylor.
REFERENCES
[IEA] & [WBCSD]. 2009. Cement Technology Roadmap 2009 - Carbon emissions reductions up to 2050 [Online]. Available: http://www.iea.org/papers/2009/Cement_Roadmap.pdf [Accessed May 11 2010].
ABBAS, A., CARCASSES, M. & OLLIVIER, J. P. 2000. The importance of gas permeability in addition to the compressive strength of concrete. Magazine of Concrete Research, 52, 1-6.
ABBAS, A., CARCASSES, M. & OLLIVIER, P. P. 1999. Gas permeability of concrete in relation to its degree of saturation. Materials and Structures, 32, 3-8.
ASTM 2007. C192/C192M – 07 Standard Practice for Making and Curing Concrete Test Specimens in the Laboratory1. Safety Precautions, Manual of Aggregate and Concrete Testing, Annual Book of ASTM Standards. ASTM.
ASTM 2009. C1611/C1611M – 09b Standard Test Method for Slump Flow of Self-Consolidating Concrete. ASTM.
ASTM 2010. C39/C39M – 10 Standard Test Method for Compressive Strength of Cylindrical Concrete Specimens. ASTM.
ASTM 2012a. C617/C617M-12 Standard Practice for Capping Cylindrical Concrete Specimens. ASTM 2012b. C1231/C1231M-12 Standard Practice for Use of Unbonded Caps in Determination
of Compressive Strength of Hardened Concrete Cylinders. ASTM. CELIK, K., JACKSON, M. D., MANCIO, M., MERAL, C., EMWAS, A.-H., MEHTA, P. K. & MONTEIRO,
P. J. M. 2012. High-volume natural volcanic pozzolan and limestone powder as partial replacements for portland cement in self-compacting and sustainable concrete. Cement & Concrete Composites, Submitted on 1st of October.
CELIK, K., MERAL, C., GURSEL, P. Y., HORVATH, A., MEHTA, P. K. & MONTEIRO, P. J. M. 2013. Self-consolidating concrete mixtures with high-volume fly ash and limestone powder: mechanical properties, durability and life-cycle analysis. submitted to Cem Concr Res.
DE WEERDT, K., KJELLSEN, K. O., SELLEVOLD, E. & JUSTNES, H. 2011. Synergy between fly ash and limestone powder in ternary cements. Cem Concr Compos, 33, 30-38.
ERDEM, T. K., MERAL, Ç., TOKYAY, M. & ERDOĞAN, T. Y. 2007. Use of perlite as a pozzolanic addition in producing blended cements. Cement and Concrete Composites, 29, 13-21.
GJØRV, O. E. 2009. Durability design of concrete structures in severe environments. New York: Taylor & Francis.
HASSAN, K. E., CABRERA, J. G. & MALIEHE, R. S. 2000. The effect of mineral admixtures on the properties of high-performance concrete. Cement & Concrete Composites, 22, 267-271.
ISSA, S. A., ISLAM, M. S., ISSA, M. A., YOUSIF, A. A. & ISSA, M. A. 2000. Specimen and Aggregate Size Effect on Concrete Compressive Strength. Cement Concrete Aggregat, 22, 103-115.
KHAN, M. I. & ALHOZAIMY, A. M. 2005. Performance of Concrete Utilizing the Natural Pozzolanic Material Available in the Kingdom of Saudi Arabia.
KHAN, M. I. & ALHOZAIMY, A. M. 2011. Properties of natural pozzolan and its potential utilization in environmental friendly concrete. Canadian Journal of Civil Engineering, 38, 71-78.
KOLLEK, J. J. 1989. The determination of the permeability of concrete to oxygen by the Cembureau method- a recommendation. Materials and Structures, 22, 225-230.
MALHOTRA, V. M. & MEHTA, P. K. 2008. High-Performance, High-Volume Fly Ash Concrete for Building Sustainable & Durable Structures, Ottowa, Canada, Supplementary Cementing Materials for Sustainable Development Inc.
MEHTA, P. K. 2001. Reducing the Environmental Impact of Concrete. Concrete International, 23, 61-66.
MEHTA, P. K. 2009. Global Concerete Industry Sustainability: Tools for Moving Forward to Cut Carbon Emissions. Concrete International, 45-48.
MEHTA, P. K. Sustainable Cements and Concrete for the Climate Change Era – A Review. In: ZACHAR, P. C., T R NAIK, E GANJIAN, ed. Second International Conference on Sustainable Construction Materials and TechnologiesSecond International Conference
on Sustainable Construction Materials and Technologies, 2010 Italy. Coventry University and The University of Wisconsin Milwaukee Centre for By-products Utilization,.
MEHTA, P. K. & MONTEIRO, P. J. M. 2006. Concrete: Microstructure, Properties, and Materials, USA, McGraw-Hill.
MENÉNDEZ, G., BONAVETTI, V. & IRASSAR, E. F. 2003. Strength development of ternary blended cement with limestone filler and blast-furnace slag. Cement and Concrete Composites, 25, 61-67.
MR MOUFTI, AA SABTAN, OR EL-MAHDY & SHEHATA, W. M. 2000. Assessment of the industrial utilization of scoria materials in central Harrat Rahat, Saudi Arabia. Engineering Geology, 57, 155–162.
NORDTEST 1999. NT BUILD 492: Concrete, mortar and cement-based repair materials: chloride migration coefficient from non-steady-state migration experiments. Finland: Nordtest.
PIPILIKAKI, P. & KATSIOTI, M. 2009. Study of the hydration process of quaternary blended cements and durability of the produced mortars and concretes. Construction and Building Materials, 23, 2246-2250.
RILEM 1999. RILEM TC 116-PCD:Permeability of Concrete as a Criterion of its Durability_Test for Gas Permeability of Concrete.pdf>. Materials and Structures, 32, 174-179.
SUGIYAMA, T., BREMNER, T. W. & TSUJI, Y. 1996a. Determination of chloride diffusion coefficient and gas permeability of concrete and their relationship. Cement and Concrete Research, 26, 781-790.
SUGIYAMA, T., BREMNER, T. W. & TSUJI, Y. 1996b. Determination of chloride diffusion coefficient and gas permeability of concrete and their relationship. Cem Concr Res, 26, 781-790.
TOKYAY, M., OZDEMIR, M. 1997. Specimen Shape and Size Effect on the Compressive Strength of Higher Strength Concrete. Cem Concr Res, 27, 1281-1289.
UZAL, B. & TURANLı, L. 2012. Blended cements containing high volume of natural zeolites: Properties, hydration and paste microstructure. Cement and Concrete Composites, 34, 101-109.
WBCSD 2009. The Cement Sustainability Initiative: Recycling Concrete. In: KLEE, H. (ed.). Geneva, Switzerland: World Council for Sustainable Business Development.