Embed Size (px)
Citation preview
1
Abstract— The growing popularity and success of fuel cells in aerospace, stationary power, and transportation applications is driving and challenging researchers to complement and in some cases altogether replace the bat-teries of portable systems in the hopes of increasing func-tional density, extending runtime, and decreasing size. Di-rect-methanol fuel cell batteries have now been built and conformed to low cost technologies and chip-scale dimen-sions. Conventional fuel cell models, however, fail to accu-rately capture the electrical nuances and runtime expec-tancies of these micro-scale devices, yet predicting these electrical characteristics are even more critical when de-signing portable low power electronics. A Cadence-compatible model of a direct-methanol fuel cell battery is therefore developed to capture all pertinent dynamic and steady-state electrical performance parameters, including capacity and its dependence to current and temperature, open-circuit voltage, methanol-crossover current, polariza-tion curve and its dependence to concentration, internal resistance, and time-dependent response under various loading conditions - the model can also be extended to oth-er micro- and macro-scale fuel cell technologies. The simu-lation results of the proposed electrical model are validat-ed and compared against the experimental performance of several direct-methanol fuel-cell prototypes, resulting in a runtime error of less than 10.8% and a voltage error un-der various current loads of less than 80 mV for up to 95% of its operational life. The root cause of the remaining er-rors and relevant temperature effects in the proposed model are also discussed.
Index Terms—Direct-methanol fuel cell, electrical model, I-V performance, methanol crossover effects, predicting runtime, temperature drift, transient response, battery.
I. INTRODUCTION he high energy densities exhibited by fuel cell (FC) tech-nologies in aerospace, stationary power, and transporta-tion applications [1-2] have inspired researchers to de-
velop similar solutions for portable and handheld electronics (e.g., cellular phones, PDAs, etc.) [3-5], including system-in-package (SiP) modules (e.g., wireless micro-sensors for ad-hoc networks) [6-10]. The idea is to achieve higher overall energy and power densities than state-of-the-art battery tech-nologies (i.e., nickel-metal hydride - NiMH, lithium-ion - Li-Ion, and others), reducing in the process the overall physical dimensions of micro-systems to unprecedented levels.
In theory, the energy density of direct-methanol fuel cells (DMFCs) is five times higher than that of Li-Ion batteries [3-
5], which explains why scaling DMFCs to micro-scale propor-tions is the subject of research for a growing number of re-searchers [6-10]. Other FC technologies require bulky fuel reformers, heaters, humidifiers, and other mechanical compo-nents [11-12] that are next to impossible to scale down to chip-size. In DMFCs, on the other hand, whose operating range includes ambient temperature, the fuel reservoir is di-rectly applied to the membrane and air is used to supply oxy-gen for its reaction. The end result is a relatively simple solu-tion that is scalable and compatible with low cost micro-electromechanical systems (MEMS) technologies.
To build practical micro-systems with volume- and there-fore energy-limited DMFCs, accurate models predicting cur-rent-voltage behavior over time are required. What is more, these models must interface with power-conditioning and ap-plication circuits to fully comprehend the electrical perfor-mance limits of the overall system. State-of-the-art FC mod-els, however, assume constant fuel-flow and unchanging con-centration conditions, and therefore predict only steady-state, time-independent performance. Micro-scale DMFCs have limited space to store fuel and must therefore account for its use and the resulting changes in concentration. Much like bat-teries, micro-scale FCs have finite runtimes.
An electrical model for micro-scale FCs capable of predict-ing current and voltage performance over time in a Cadence environment, which is an industry standard for designing inte-grated circuits, is developed and validated in this paper. The presentation is organized as follows: Section II reviews the state-of-the-art in FC models, Section III introduces the pro-posed model, Section IV discusses the extraction procedure, and Section V validates the model. Discussions on error sources and temperature effects follow in Sections VI and VII and conclusions in Section VIII.
II. STATE-OF-THE-ART IN FUEL CELL MODELS DMFCs are electrochemical energy conversion devices that
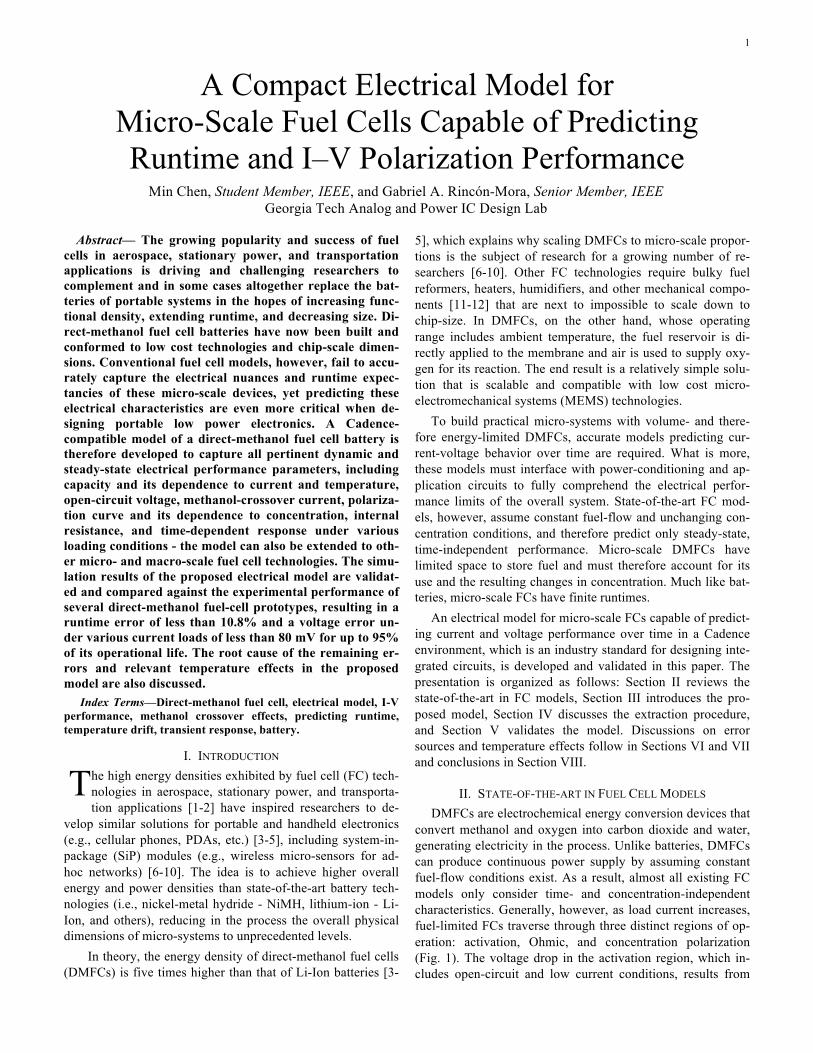
convert methanol and oxygen into carbon dioxide and water, generating electricity in the process. Unlike batteries, DMFCs can produce continuous power supply by assuming constant fuel-flow conditions exist. As a result, almost all existing FC models only consider time- and concentration-independent characteristics. Generally, however, as load current increases, fuel-limited FCs traverse through three distinct regions of op-eration: activation, Ohmic, and concentration polarization (Fig. 1). The voltage drop in the activation region, which in-cludes open-circuit and low current conditions, results from
A Compact Electrical Model for Micro-Scale Fuel Cells Capable of Predicting Runtime and I–V Polarization Performance
Min Chen, Student Member, IEEE, and Gabriel A. Rincón-Mora, Senior Member, IEEE Georgia Tech Analog and Power IC Design Lab
T
2
overcoming electronic barriers. The Ohmic region, as the name implies, refers to the load-current range for which inter-nal resistance effects are prevalent, that is to say, when voltage decreases linearly with increasing current. Finally, in the con-centration region, there is insufficient fuel flow (i.e., reactant) to supply and sustain high load levels, which results in addi-tional voltage drops.
IFC (A)
VFC
(V)
Activation Polarization
Ohmic Polarization
Concentration Polarization
Open Circuit Voltage - VOC
Fig.1. Polarization curve of a typical fuel cell.
Most FC models today fall under one of three categories: physically, mathematically, or electrically based. Chemists and physicists, for instance, require models to optimize how fuel cells are built by describing the physical and chemical character of a given configuration (e.g., thermal gradients, mass transport, electrochemical kinetics, etc.) [13-15]. From the perspective of electronic systems, however, these physical models are cumbersome and computationally intensive, espe-cially when considering the complex nature and circuit density of modern electronics.
Mathematical models [16-19], like physical models, are not meant to interface with circuits and consequently describe the operation of FCs with empirically or semi-empirically based equations. The relationship between cell voltages and load currents are tuned with coefficients meant to emulate fuel and air flow and pressure, fuel concentration, temperature, and various other conditions. The resulting model is unable to pre-dict the runtime of a system under various time-varying loads; in other words, it can predict steady-state performance but not transient response, which is extremely important to electronic engineers.
Electrical models cater to the electronic engineer by de-
scribing the electrical behavior of FCs with a combination of voltage sources, resistors, capacitors, inductors, diodes, and transistors. Yu and Yuvarajan, for instance, use transistors, inductors, and capacitors readily available in standard SPICE electronic libraries to emulate the steady-state polarization curve response of FCs [20]. To include both steady-state and transient response performance, Famouri and Gemmen em-ploy three dependent voltage sources and a resistor-capacitor network [21]. Garnier et al., on the other hand, use a small-signal equivalent circuit derived from electrochemical imped-ance spectroscopy to describe only static and small-signal transient response [22].
Although electrical models can be used in conjunction with integrated circuits, they cannot predict runtime (which is criti-cal in mobile applications) and large- and small-signal steady-state and transient response performance over time of micro-scale FCs, wherein fuel concentration decreases and fuel is exhausted with time and temperature and load are time-dependent. The battery model proposed in [23] can potentially predict these parameters, but it has yet to be applied to FCs, which is the objective of the proposed model.
III. PROPOSED MICRO-SCALE FUEL CELL MODEL The electrical behavior of micro-scale FCs, in other words,
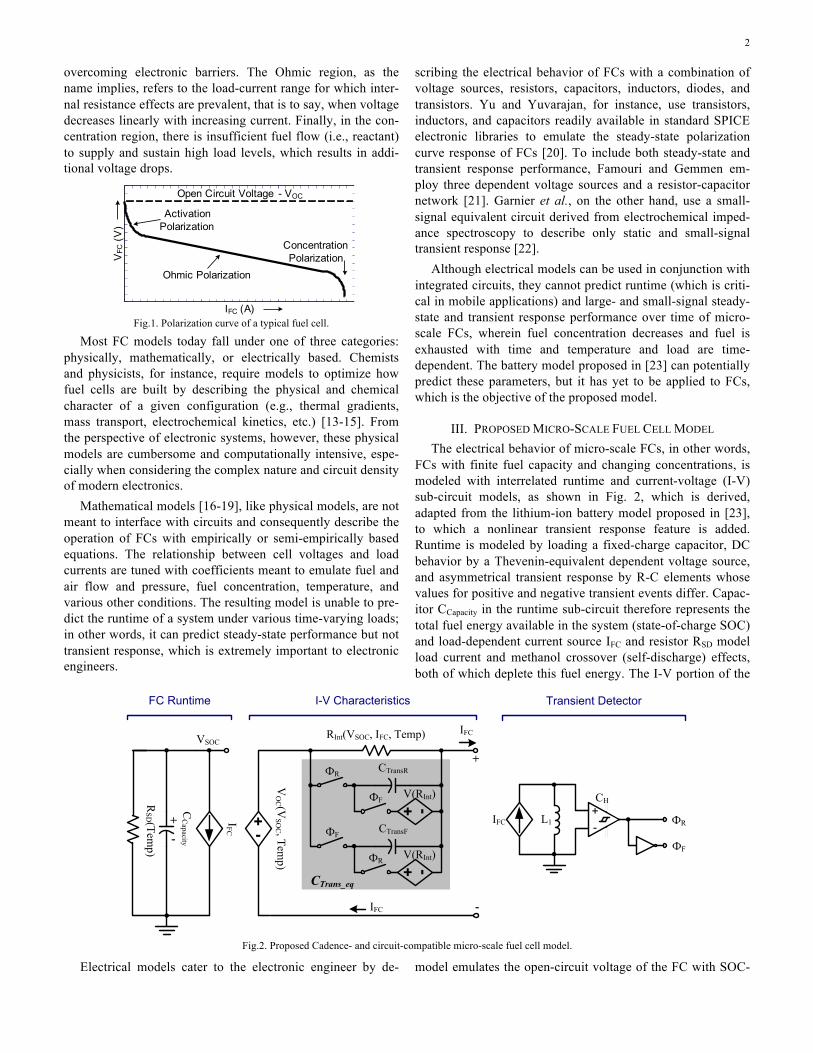
FCs with finite fuel capacity and changing concentrations, is modeled with interrelated runtime and current-voltage (I-V) sub-circuit models, as shown in Fig. 2, which is derived, adapted from the lithium-ion battery model proposed in [23], to which a nonlinear transient response feature is added. Runtime is modeled by loading a fixed-charge capacitor, DC behavior by a Thevenin-equivalent dependent voltage source, and asymmetrical transient response by R-C elements whose values for positive and negative transient events differ. Capac-itor CCapacity in the runtime sub-circuit therefore represents the total fuel energy available in the system (state-of-charge SOC) and load-dependent current source IFC and resistor RSD model load current and methanol crossover (self-discharge) effects, both of which deplete this fuel energy. The I-V portion of the
model emulates the open-circuit voltage of the FC with SOC-
+-
RSD (Tem
p)
IFC
VO
C (VSO
C , Temp)
VSOC
FC Runtime
+
-
IFC
I-V Characteristics
+-
IFC
CC
apacity
CTransR
+ -
RInt(VSOC, IFC, Temp)
CTransF
+ -
ФR
ФF
ФF
ФR
V(RInt)
V(RInt)
IFC L1 -+CH
ФR
ФF
CTrans_eq
Transient Detector
Fig.2. Proposed Cadence- and circuit-compatible micro-scale fuel cell model.
3
dependent voltage source VOC, internal resistance with equiva-lent series resistor RInt, and transient response performance with the RC network comprised of RInt and nonlinear CTrans_eq. From an electrical perspective, the proposed model should not only predict runtime, steady-state, and large- and small-signal transient response performance but also be compatible with standard circuit simulators like SPICE and SPICE-based Ca-dence environments. Usable Capacity: Usable energy or capacity nominally de-creases with load current IFC, the methanol crossover current induced by RSD, and decreasing temperatures, but only if fuel pressure to the membrane and fuel concentration remain con-stant and no other inter-dependencies exist, which is not the case in micro-scale systems. When temperature increases, for instance, high methanol diffusion across the membrane causes an increase in methanol crossover current (i.e., leakage of un-used methanol, which amounts to wasted energy), internal resistance RInt decreases, and thanks to a strong reaction, open-circuit voltage VOC increases. Usable capacity, as a result, is dependent on interrelated variables, whose interdependencies must be comprehended in the foregoing electrical model.
A tank completely filled with maximum concentration fuel corresponds to a fully pre-charged CCapacity in the proposed model. The voltage across the capacitor for this condition is 1 V and is equivalent to an SOC of 100% (0 V or 0% SOC de-notes a fully depleted tank). Capacitor voltage VSOC conse-quently represents the methanol concentration of the DMFC, which is assumed to be uniform across the reservoir at any given time. This is a reasonable approximation for low to moderate discharge current conditions, before the DMFC en-ters the concentration polarization region, because the fuel cell has the highest usable energy density when lightly loaded, and practical micro-systems will condition the load for this effect.
Methanol crossover (leakage) is directly proportional to methanol concentration and increases with temperature [24]. The resistance of RSD therefore represents methanol crossover effects and methanol concentration in the tank, having a net negative temperature coefficient (TC). Discharging CCapacity with load current IFC and methanol leakage resistance RSD ef-fectively predicts the runtime performance of the system. Open-Circuit Voltage: Open-circuit voltage VOC depends on methanol concentration, or said differently, on SOC and tem-perature, which is why voltage-controlled voltage source VOC is a function of VSOC and temperature. High concentration, which implies higher methanol crossover and therefore larger voltage drops across the membrane, and/or low temperature conditions produce low open-circuit voltages [25]. The rela-tionship between SOC and VOC, in fact, is unique and inde-pendent of discharge current, as demonstrated from theory in [1-2] and experimentally later in this paper. Polarization Curves: From an electrical perspective, the po-larization curve reflects how the output voltage of a FC changes under various loading and concentration conditions. Internal resistor RInt and voltage source VOC embody these effects. Consequently, since these parameters are dependent on SOC, discharge current IFC, temperature, and concentration,
the performance of micro-scale FCs are described by a family of polarization curves, not just one curve, as experiments will show in later sections. Transient Response: FCs respond slowly to changing loads because of their fuel-flow dependence and reaction kinetics. Maximum energy density performance is consequently achieved when FCs supply constant and continuous power, which is why capacitors, ultra-capacitors, and/or batteries are used in conjunction with FCs to supply the changing portion of a given load. This is also why existing FC models only con-sider steady-state performance. A micro-scale system, howev-er, does not have the luxury of bulky storage devices and therefore requires the transient response performance of a FC to be modeled.
Transient response is generally modeled with RC-dependent time-constants and micro-scale FCs are no differ-ent, except FCs respond differently to rising and falling dis-charge currents, especially when fuel concentration (i.e., SOC) is low. Equivalent nonlinear capacitor CTran_eq captures these direction-dependent time-constants. Comparator CH detects whether the current is rising or falling and its output is used to control the connectivity of falling and rising capacitors CTran_F and CTran_R. For instance, when load current increases, the voltage across inductor L1 increases, forcing ФF to disconnect CTran_F from the network and ФR to connect CTran_R into it (the opposite occurs when load current decreases). While one ca-pacitor is connected, the other is pre-charged so that no volt-age conflicts occur during transitions (i.e., voltages across CTran_F, CTran_R, and RInt are always equal). The resulting RC response is first order for both directions. A higher order filter would be more accurate, but also complex.
IV. MODEL EXTRACTION AND MEASUREMENTS Extracting all pertinent model parameters amount to sub-
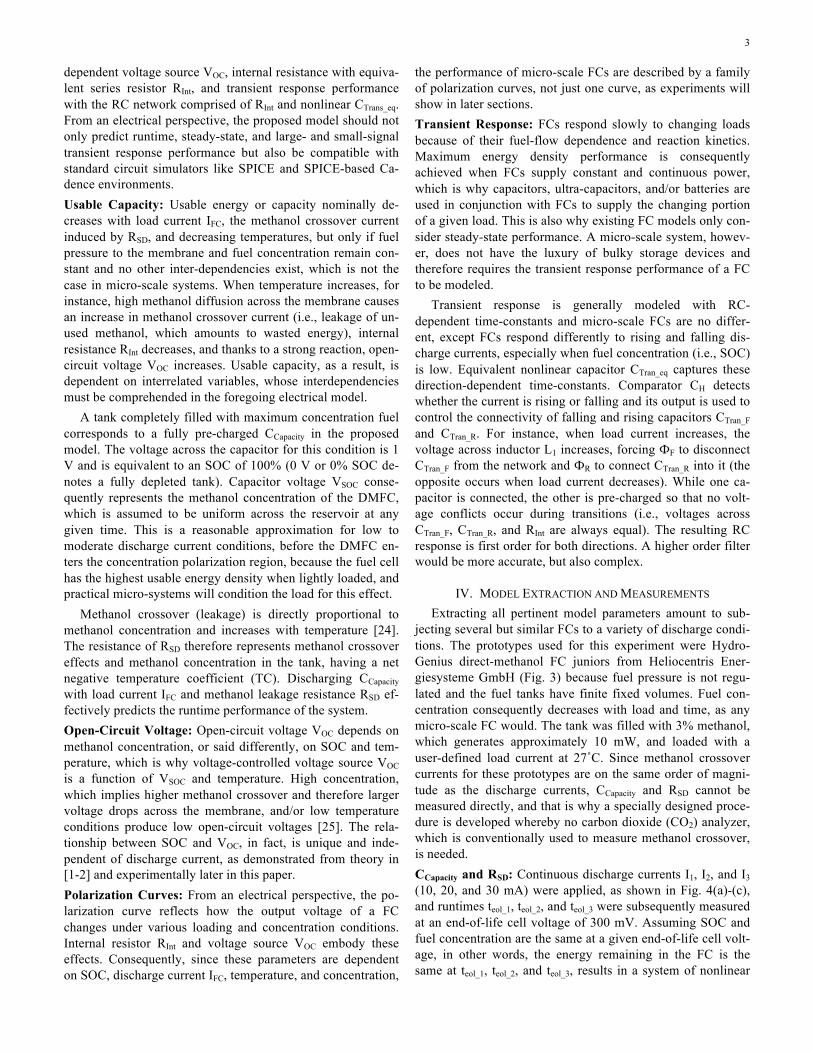
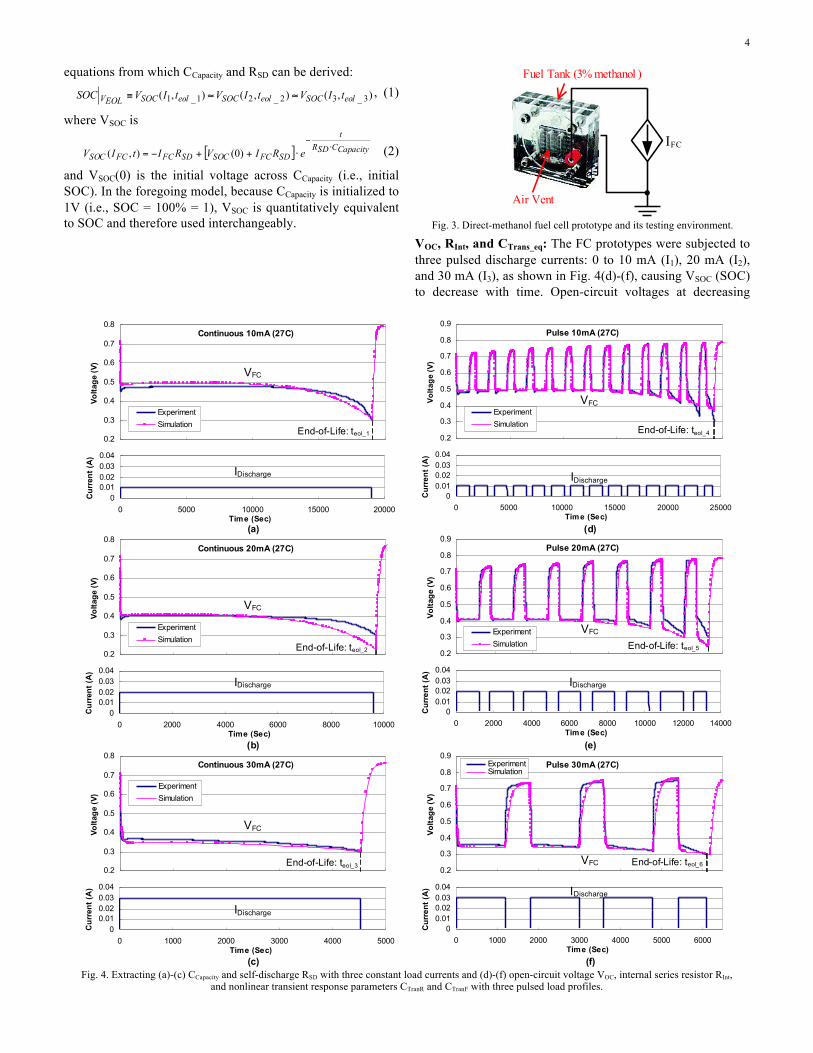
jecting several but similar FCs to a variety of discharge condi-tions. The prototypes used for this experiment were Hydro-Genius direct-methanol FC juniors from Heliocentris Ener-giesysteme GmbH (Fig. 3) because fuel pressure is not regu-lated and the fuel tanks have finite fixed volumes. Fuel con-centration consequently decreases with load and time, as any micro-scale FC would. The tank was filled with 3% methanol, which generates approximately 10 mW, and loaded with a user-defined load current at 27˚C. Since methanol crossover currents for these prototypes are on the same order of magni-tude as the discharge currents, CCapacity and RSD cannot be measured directly, and that is why a specially designed proce-dure is developed whereby no carbon dioxide (CO2) analyzer, which is conventionally used to measure methanol crossover, is needed. CCapacity and RSD: Continuous discharge currents I1, I2, and I3 (10, 20, and 30 mA) were applied, as shown in Fig. 4(a)-(c), and runtimes teol_1, teol_2, and teol_3 were subsequently measured at an end-of-life cell voltage of 300 mV. Assuming SOC and fuel concentration are the same at a given end-of-life cell volt-age, in other words, the energy remaining in the FC is the same at teol_1, teol_2, and teol_3, results in a system of nonlinear
4
equations from which CCapacity and RSD can be derived:
),(),(),( 3_32_21_1 eolSOCeolSOCeolSOCEOLV tIVtIVtIVSOC ≈≈≡ , (1)
where VSOC is
[ ] CapacityCSDRt
SDFCSOCSDFCFCSOC eRIVRItIV ⋅−
⋅++−= )0(),( (2)
and VSOC(0) is the initial voltage across CCapacity (i.e., initial SOC). In the foregoing model, because CCapacity is initialized to 1V (i.e., SOC = 100% = 1), VSOC is quantitatively equivalent to SOC and therefore used interchangeably.
IFC
Air Vent
Fuel Tank (3% methanol )
Fig. 3. Direct-methanol fuel cell prototype and its testing environment.
VOC, RInt, and CTrans_eq: The FC prototypes were subjected to three pulsed discharge currents: 0 to 10 mA (I1), 20 mA (I2), and 30 mA (I3), as shown in Fig. 4(d)-(f), causing VSOC (SOC) to decrease with time. Open-circuit voltages at decreasing
VFC
IDischarge
Continuous 10mA (27C)
0.2
0.3
0.4
0.5
0.6
0.7
0.8
Volta
ge (V
)
ExperimentSimulation
00.010.020.030.04
0 5000 10000 15000 20000Time (Sec)
Cur
rent
(A)
Pulse 10mA (27C)
0.2
0.3
0.4
0.5
0.6
0.7
0.8
0.9
Volta
ge (V
)
ExperimentSimulation
00.010.020.030.04
0 5000 10000 15000 20000 25000Time (Sec)
Cur
rent
(A)
VFC
IDischarge
Continuous 20mA (27C)
0.2
0.3
0.4
0.5
0.6
0.7
0.8
Volta
ge (V
)
ExperimentSimulation
00.010.020.030.04
0 2000 4000 6000 8000 10000Time (Sec)
Cur
rent
(A)
VFC
IDischarge
Continuous 30mA (27C)
0.2
0.3
0.4
0.5
0.6
0.7
0.8
Volta
ge (V
)
ExperimentSimulation
00.010.020.030.04
0 1000 2000 3000 4000 5000Time (Sec)
Cur
rent
(A)
VFC
IDischarge
VFC
IDischarge
Pulse 30mA (27C)
0.2
0.3
0.4
0.5
0.6
0.7
0.8
0.9
Volta
ge (V
)
ExperimentSimulation
00.010.020.030.04
0 1000 2000 3000 4000 5000 6000Time (Sec)
Cur
rent
(A)
VFC
IDischarge
Pulse 20mA (27C)
0.2
0.3
0.4
0.5
0.6
0.7
0.8
0.9
Volta
ge (V
)
ExperimentSimulation
00.010.020.030.04
0 2000 4000 6000 8000 10000 12000 14000Time (Sec)
Cur
rent
(A)
(a)
(b)
(c)
(d)
(e)
(f)
End-of-Life: teol_1
End-of-Life: teol_2
End-of-Life: teol_3
End-of-Life: teol_4
End-of-Life: teol_5
End-of-Life: teol_6
Fig. 4. Extracting (a)-(c) CCapacity and self-discharge RSD with three constant load currents and (d)-(f) open-circuit voltage VOC, internal series resistor RInt,
and nonlinear transient response parameters CTranR and CTranF with three pulsed load profiles.
5
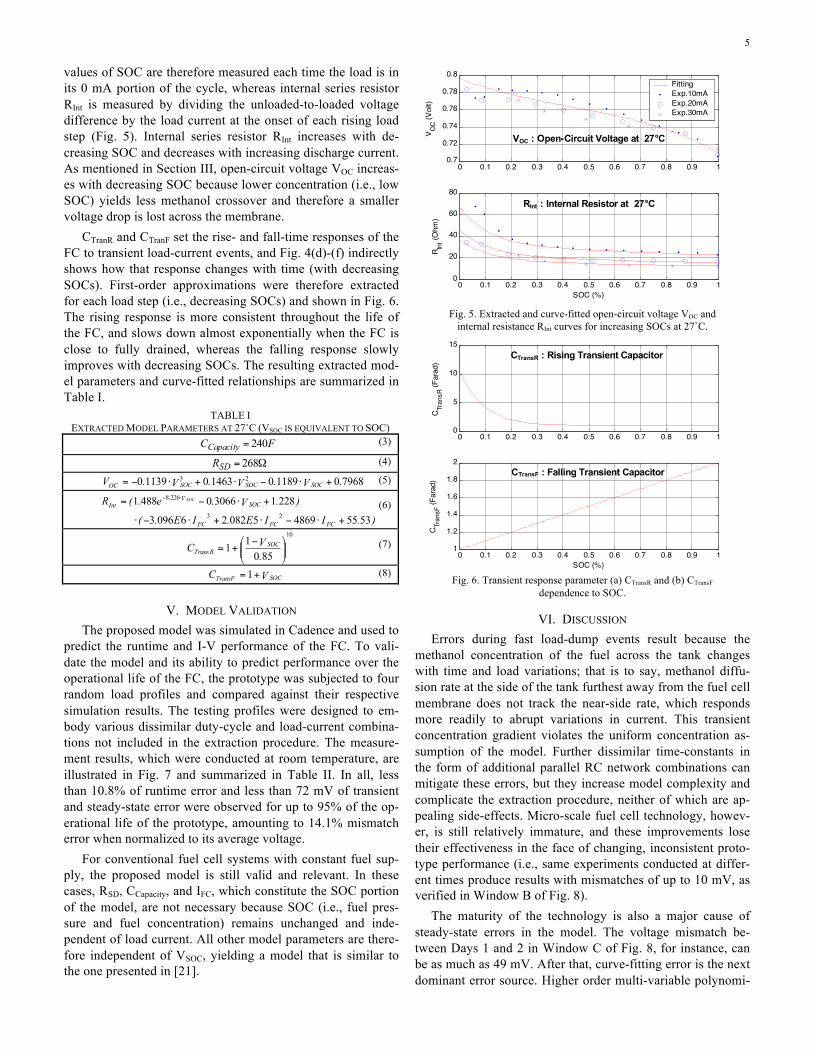
values of SOC are therefore measured each time the load is in its 0 mA portion of the cycle, whereas internal series resistor RInt is measured by dividing the unloaded-to-loaded voltage difference by the load current at the onset of each rising load step (Fig. 5). Internal series resistor RInt increases with de-creasing SOC and decreases with increasing discharge current. As mentioned in Section III, open-circuit voltage VOC increas-es with decreasing SOC because lower concentration (i.e., low SOC) yields less methanol crossover and therefore a smaller voltage drop is lost across the membrane.
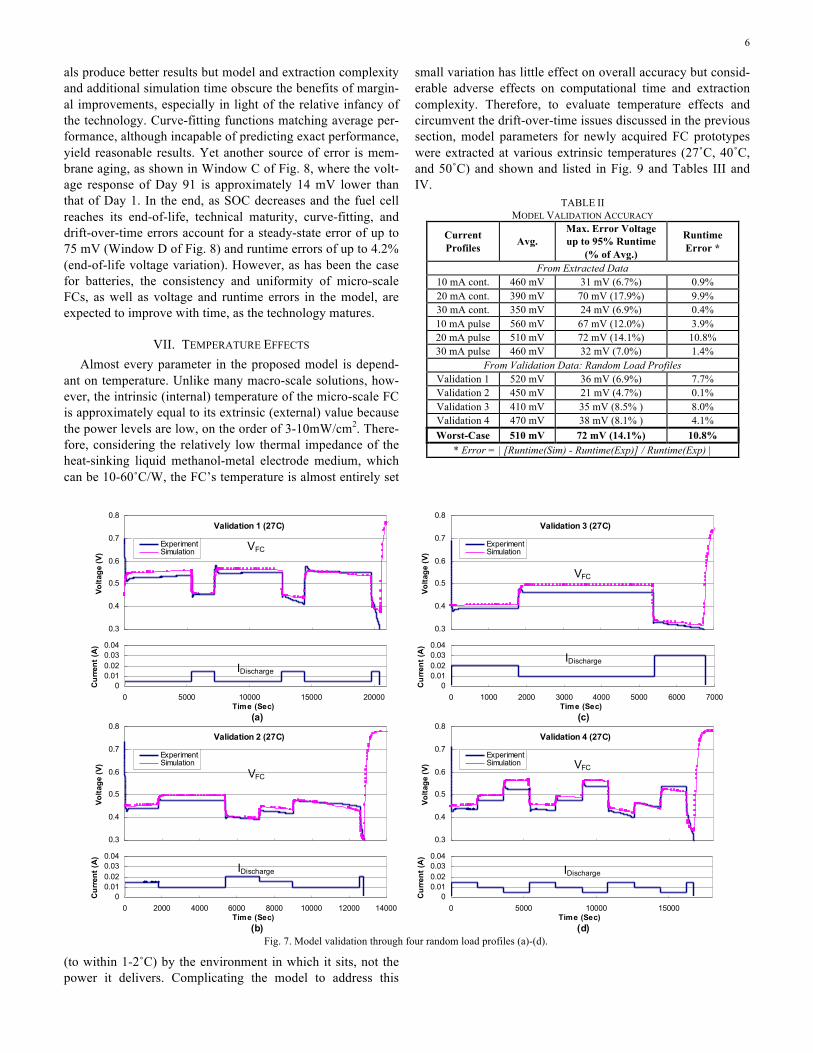
CTranR and CTranF set the rise- and fall-time responses of the FC to transient load-current events, and Fig. 4(d)-(f) indirectly shows how that response changes with time (with decreasing SOCs). First-order approximations were therefore extracted for each load step (i.e., decreasing SOCs) and shown in Fig. 6. The rising response is more consistent throughout the life of the FC, and slows down almost exponentially when the FC is close to fully drained, whereas the falling response slowly improves with decreasing SOCs. The resulting extracted mod-el parameters and curve-fitted relationships are summarized in Table I.
V. MODEL VALIDATION The proposed model was simulated in Cadence and used to
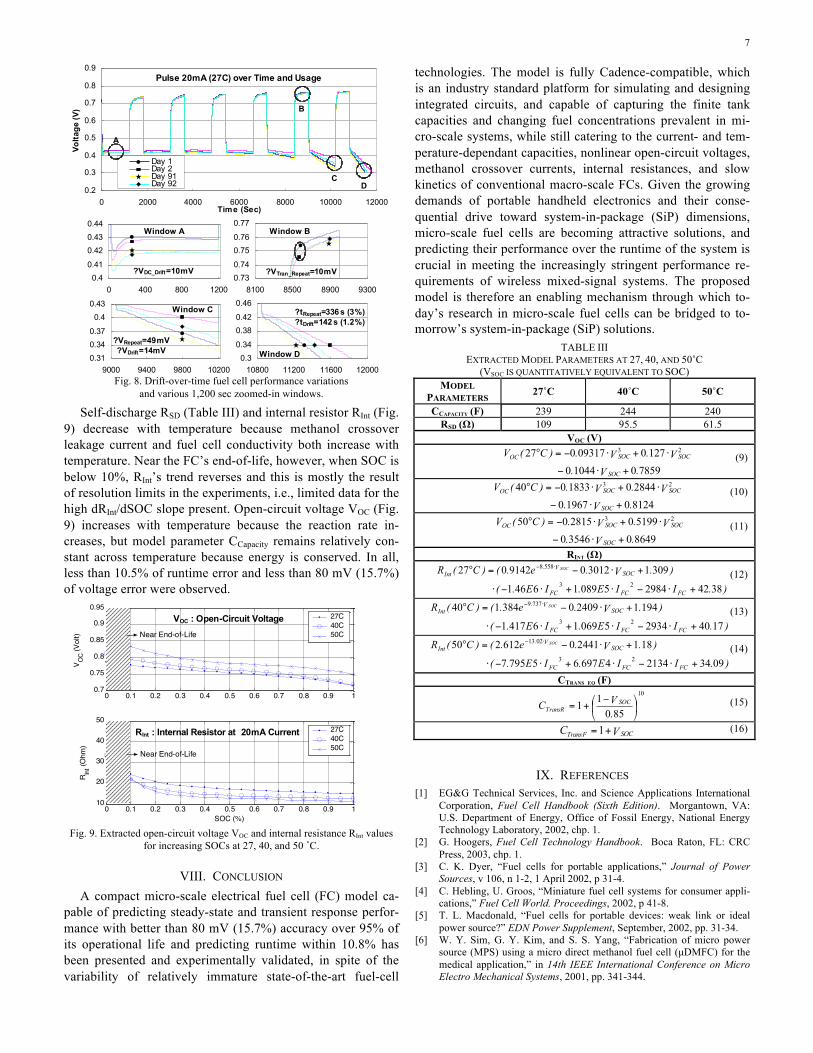
predict the runtime and I-V performance of the FC. To vali-date the model and its ability to predict performance over the operational life of the FC, the prototype was subjected to four random load profiles and compared against their respective simulation results. The testing profiles were designed to em-body various dissimilar duty-cycle and load-current combina-tions not included in the extraction procedure. The measure-ment results, which were conducted at room temperature, are illustrated in Fig. 7 and summarized in Table II. In all, less than 10.8% of runtime error and less than 72 mV of transient and steady-state error were observed for up to 95% of the op-erational life of the prototype, amounting to 14.1% mismatch error when normalized to its average voltage.
For conventional fuel cell systems with constant fuel sup-ply, the proposed model is still valid and relevant. In these cases, RSD, CCapacity, and IFC, which constitute the SOC portion of the model, are not necessary because SOC (i.e., fuel pres-sure and fuel concentration) remains unchanged and inde-pendent of load current. All other model parameters are there-fore independent of VSOC, yielding a model that is similar to the one presented in [21].
0 0.1 0.2 0.3 0.4 0.5 0.6 0.7 0.8 0.9 10
20
40
60
80
SOC (%)
R Int (O
hm)
0 0.1 0.2 0.3 0.4 0.5 0.6 0.7 0.8 0.9 10.7
0.72
0.74
0.76
0.78
0.8
V OC (V
olt)
FittingExp.10mAExp.20mAExp.30mA
VOC : Open-Circuit Voltage at 27°C
RInt : Internal Resistor at 27°C
Fig. 5. Extracted and curve-fitted open-circuit voltage VOC and
internal resistance RInt curves for increasing SOCs at 27˚C.
0 0.1 0.2 0.3 0.4 0.5 0.6 0.7 0.8 0.9 10
5
10
15
C Tran
sR (F
arad
)
0 0.1 0.2 0.3 0.4 0.5 0.6 0.7 0.8 0.9 11
1.2
1.4
1.6
1.8
2
SOC (%)
C Tran
sF (F
arad
)
CTransR : Rising Transient Capacitor
CTransF : Falling Transient Capacitor
Fig. 6. Transient response parameter (a) CTransR and (b) CTransF
dependence to SOC.
VI. DISCUSSION Errors during fast load-dump events result because the
methanol concentration of the fuel across the tank changes with time and load variations; that is to say, methanol diffu-sion rate at the side of the tank furthest away from the fuel cell membrane does not track the near-side rate, which responds more readily to abrupt variations in current. This transient concentration gradient violates the uniform concentration as-sumption of the model. Further dissimilar time-constants in the form of additional parallel RC network combinations can mitigate these errors, but they increase model complexity and complicate the extraction procedure, neither of which are ap-pealing side-effects. Micro-scale fuel cell technology, howev-er, is still relatively immature, and these improvements lose their effectiveness in the face of changing, inconsistent proto-type performance (i.e., same experiments conducted at differ-ent times produce results with mismatches of up to 10 mV, as verified in Window B of Fig. 8).
The maturity of the technology is also a major cause of steady-state errors in the model. The voltage mismatch be-tween Days 1 and 2 in Window C of Fig. 8, for instance, can be as much as 49 mV. After that, curve-fitting error is the next dominant error source. Higher order multi-variable polynomi-
TABLE I EXTRACTED MODEL PARAMETERS AT 27˚C (VSOC IS EQUIVALENT TO SOC)
FCCapacity 240= (3)
Ω= 268SDR (4)
79680118901463011390 23 .V.V.V.V SOCSOCSOCOC +⋅−⋅+⋅−= (5)
).IIE.IE.(
).V.e.(R
FCFCFC
SOCV.
IntSOC
535548695082260963
228130660488123
2268
+⋅−⋅+⋅−⋅
+⋅−= ⋅− (6)
10
85011 ⎟⎟
⎠
⎞⎜⎜⎝
⎛ −+=
.VC SOC
TransR (7)
VC SOCTransF +=1 (8)
6
als produce better results but model and extraction complexity and additional simulation time obscure the benefits of margin-al improvements, especially in light of the relative infancy of the technology. Curve-fitting functions matching average per-formance, although incapable of predicting exact performance, yield reasonable results. Yet another source of error is mem-brane aging, as shown in Window C of Fig. 8, where the volt-age response of Day 91 is approximately 14 mV lower than that of Day 1. In the end, as SOC decreases and the fuel cell reaches its end-of-life, technical maturity, curve-fitting, and drift-over-time errors account for a steady-state error of up to 75 mV (Window D of Fig. 8) and runtime errors of up to 4.2% (end-of-life voltage variation). However, as has been the case for batteries, the consistency and uniformity of micro-scale FCs, as well as voltage and runtime errors in the model, are expected to improve with time, as the technology matures.
VII. TEMPERATURE EFFECTS Almost every parameter in the proposed model is depend-
ant on temperature. Unlike many macro-scale solutions, how-ever, the intrinsic (internal) temperature of the micro-scale FC is approximately equal to its extrinsic (external) value because the power levels are low, on the order of 3-10mW/cm2. There-fore, considering the relatively low thermal impedance of the heat-sinking liquid methanol-metal electrode medium, which can be 10-60˚C/W, the FC’s temperature is almost entirely set
(to within 1-2˚C) by the environment in which it sits, not the power it delivers. Complicating the model to address this
small variation has little effect on overall accuracy but consid-erable adverse effects on computational time and extraction complexity. Therefore, to evaluate temperature effects and circumvent the drift-over-time issues discussed in the previous section, model parameters for newly acquired FC prototypes were extracted at various extrinsic temperatures (27˚C, 40˚C, and 50˚C) and shown and listed in Fig. 9 and Tables III and IV.
TABLE II MODEL VALIDATION ACCURACY
Current Profiles Avg.
Max. Error Voltage up to 95% Runtime
(% of Avg.)
Runtime Error *
From Extracted Data 10 mA cont. 460 mV 31 mV (6.7%) 0.9% 20 mA cont. 390 mV 70 mV (17.9%) 9.9% 30 mA cont. 350 mV 24 mV (6.9%) 0.4% 10 mA pulse 560 mV 67 mV (12.0%) 3.9% 20 mA pulse 510 mV 72 mV (14.1%) 10.8% 30 mA pulse 460 mV 32 mV (7.0%) 1.4%
From Validation Data: Random Load Profiles Validation 1 520 mV 36 mV (6.9%) 7.7% Validation 2 450 mV 21 mV (4.7%) 0.1% Validation 3 410 mV 35 mV (8.5% ) 8.0% Validation 4 470 mV 38 mV (8.1% ) 4.1% Worst-Case 510 mV 72 mV (14.1%) 10.8%
* Error = | [Runtime(Sim) - Runtime(Exp)] / Runtime(Exp) |
VFC
IDischarge
VFC
IDischarge
VFC
IDischarge
(a)
(b)
(c)
(d)
Validation 4 (27C)
0.3
0.4
0.5
0.6
0.7
0.8
Volta
ge (V
)
ExperimentSimulation
00.010.020.030.04
0 5000 10000 15000Time (Sec)
Cur
rent
(A)
VFC
IDischarge
Validation 3 (27C)
0.3
0.4
0.5
0.6
0.7
0.8
Volta
ge (V
)
ExperimentSimulation
00.010.020.030.04
0 1000 2000 3000 4000 5000 6000 7000Time (Sec)
Cur
rent
(A)
Validation 1 (27C)
0.3
0.4
0.5
0.6
0.7
0.8
Volta
ge (V
)
ExperimentSimulation
00.010.020.030.04
0 5000 10000 15000 20000Time (Sec)
Cur
rent
(A)
Validation 2 (27C)
0.3
0.4
0.5
0.6
0.7
0.8
Volta
ge (V
)
ExperimentSimulation
00.010.020.030.04
0 2000 4000 6000 8000 10000 12000 14000Time (Sec)
Cur
rent
(A)
Fig. 7. Model validation through four random load profiles (a)-(d).
7
Pulse 20mA (27C) over Time and Usage
0.2
0.3
0.4
0.5
0.6
0.7
0.8
0.9
0 2000 4000 6000 8000 10000 12000Time (Sec)
Volta
ge (V
)
Day 1Day 2Day 91Day 92
0.40.41
0.420.430.44
0 400 800 12000.730.74
0.750.76
0.77
8100 8500 8900 9300
0.310.340.37
0.40.43
9000 9400 9800 102000.3
0.34
0.380.42
0.46
10800 11200 11600 12000
A
B
CD
Window A
Window C
Window B
Window D?VRepeat=49mV?VDrift=14mV
?tRepeat=336 s (3%)?tDrift=142 s (1.2%)
?VTran_Repeat=10mV?VDC_Drift=10mV
Fig. 8. Drift-over-time fuel cell performance variations
and various 1,200 sec zoomed-in windows. Self-discharge RSD (Table III) and internal resistor RInt (Fig.
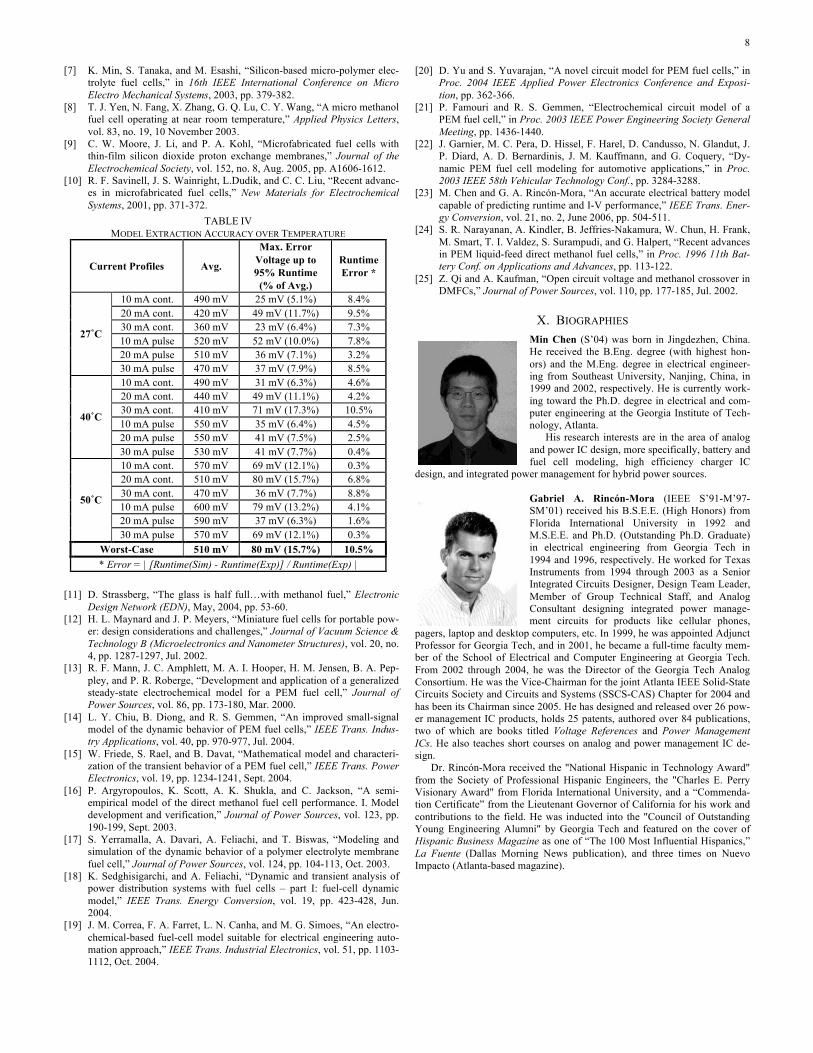
9) decrease with temperature because methanol crossover leakage current and fuel cell conductivity both increase with temperature. Near the FC’s end-of-life, however, when SOC is below 10%, RInt’s trend reverses and this is mostly the result of resolution limits in the experiments, i.e., limited data for the high dRInt/dSOC slope present. Open-circuit voltage VOC (Fig. 9) increases with temperature because the reaction rate in-creases, but model parameter CCapacity remains relatively con-stant across temperature because energy is conserved. In all, less than 10.5% of runtime error and less than 80 mV (15.7%) of voltage error were observed.
0 0.1 0.2 0.3 0.4 0.5 0.6 0.7 0.8 0.9 10.7
0.75
0.8
0.85
0.9
0.95
V OC (V
olt)
27C40C50C
0 0.1 0.2 0.3 0.4 0.5 0.6 0.7 0.8 0.9 110
20
30
40
50
SOC (%)
R Int (O
hm)
27C40C50C
VOC : Open-Circuit Voltage
RInt : Internal Resistor at 20mA Current
Near End-of-Life
Near End-of-Life
Fig. 9. Extracted open-circuit voltage VOC and internal resistance RInt values
for increasing SOCs at 27, 40, and 50 ˚C.
VIII. CONCLUSION A compact micro-scale electrical fuel cell (FC) model ca-
pable of predicting steady-state and transient response perfor-mance with better than 80 mV (15.7%) accuracy over 95% of its operational life and predicting runtime within 10.8% has been presented and experimentally validated, in spite of the variability of relatively immature state-of-the-art fuel-cell
technologies. The model is fully Cadence-compatible, which is an industry standard platform for simulating and designing integrated circuits, and capable of capturing the finite tank capacities and changing fuel concentrations prevalent in mi-cro-scale systems, while still catering to the current- and tem-perature-dependant capacities, nonlinear open-circuit voltages, methanol crossover currents, internal resistances, and slow kinetics of conventional macro-scale FCs. Given the growing demands of portable handheld electronics and their conse-quential drive toward system-in-package (SiP) dimensions, micro-scale fuel cells are becoming attractive solutions, and predicting their performance over the runtime of the system is crucial in meeting the increasingly stringent performance re-quirements of wireless mixed-signal systems. The proposed model is therefore an enabling mechanism through which to-day’s research in micro-scale fuel cells can be bridged to to-morrow’s system-in-package (SiP) solutions.
IX. REFERENCES [1] EG&G Technical Services, Inc. and Science Applications International
Corporation, Fuel Cell Handbook (Sixth Edition). Morgantown, VA: U.S. Department of Energy, Office of Fossil Energy, National Energy Technology Laboratory, 2002, chp. 1.
[2] G. Hoogers, Fuel Cell Technology Handbook. Boca Raton, FL: CRC Press, 2003, chp. 1.
[3] C. K. Dyer, “Fuel cells for portable applications,” Journal of Power Sources, v 106, n 1-2, 1 April 2002, p 31-4.
[4] C. Hebling, U. Groos, “Miniature fuel cell systems for consumer appli-cations,” Fuel Cell World. Proceedings, 2002, p 41-8.
[5] T. L. Macdonald, “Fuel cells for portable devices: weak link or ideal power source?” EDN Power Supplement, September, 2002, pp. 31-34.
[6] W. Y. Sim, G. Y. Kim, and S. S. Yang, “Fabrication of micro power source (MPS) using a micro direct methanol fuel cell (µDMFC) for the medical application,” in 14th IEEE International Conference on Micro Electro Mechanical Systems, 2001, pp. 341-344.
TABLE III EXTRACTED MODEL PARAMETERS AT 27, 40, AND 50˚C
(VSOC IS QUANTITATIVELY EQUIVALENT TO SOC) MODEL
PARAMETERS 27˚C 40˚C 50˚C
CCAPACITY (F) 239 244 240 RSD (Ω) 109 95.5 61.5
VOC (V)
7859010440127009317027 23
.V.V.V.)C(V
SOC
SOCSOCOC
+⋅−
⋅+⋅−=° (9)
8124019670284401833040 23
.V.V.V.)C(V
SOC
SOCSOCOC
+⋅−
⋅+⋅−=° (10)
8649035460519902815050 23
.V.V.V.)C(V
SOC
SOCSOCOC
+⋅−
⋅+⋅−=° (11)
RINT (Ω)
).IIE.IE.(
).V.e.()C(R
FCFCFC
SOCV.
IntSOC
38422984508916461
309130120914202723
5588
+⋅−⋅+⋅−⋅
+⋅−=° ⋅− (12)
).IIE.IE.(
).V.e.()C(R
FCFCFC
SOCV.
IntSOC
174029345069164171
19412409038414023
7379
+⋅−⋅+⋅−⋅
+⋅−=° ⋅−(13)
).IIE.IE.(
).V.e.()C(R
FCFCFC
SOCV.
IntSOC
093421344697657957
1812441061225023
0213
+⋅−⋅+⋅−⋅
+⋅−=° ⋅−(14)
CTRANS_EQ (F) 10
85011 ⎟
⎠
⎞⎜⎝
⎛ −+=
.VC SOC
TransR (15)
VC SOCTransF +=1 (16)
8
[7] K. Min, S. Tanaka, and M. Esashi, “Silicon-based micro-polymer elec-trolyte fuel cells,” in 16th IEEE International Conference on Micro Electro Mechanical Systems, 2003, pp. 379-382.
[8] T. J. Yen, N. Fang, X. Zhang, G. Q. Lu, C. Y. Wang, “A micro methanol fuel cell operating at near room temperature,” Applied Physics Letters, vol. 83, no. 19, 10 November 2003.
[9] C. W. Moore, J. Li, and P. A. Kohl, “Microfabricated fuel cells with thin-film silicon dioxide proton exchange membranes,” Journal of the Electrochemical Society, vol. 152, no. 8, Aug. 2005, pp. A1606-1612.
[10] R. F. Savinell, J. S. Wainright, L.Dudik, and C. C. Liu, “Recent advanc-es in microfabricated fuel cells,” New Materials for Electrochemical Systems, 2001, pp. 371-372.
[11] D. Strassberg, “The glass is half full…with methanol fuel,” Electronic
Design Network (EDN), May, 2004, pp. 53-60. [12] H. L. Maynard and J. P. Meyers, “Miniature fuel cells for portable pow-
er: design considerations and challenges,” Journal of Vacuum Science & Technology B (Microelectronics and Nanometer Structures), vol. 20, no. 4, pp. 1287-1297, Jul. 2002.
[13] R. F. Mann, J. C. Amphlett, M. A. I. Hooper, H. M. Jensen, B. A. Pep-pley, and P. R. Roberge, “Development and application of a generalized steady-state electrochemical model for a PEM fuel cell,” Journal of Power Sources, vol. 86, pp. 173-180, Mar. 2000.
[14] L. Y. Chiu, B. Diong, and R. S. Gemmen, “An improved small-signal model of the dynamic behavior of PEM fuel cells,” IEEE Trans. Indus-try Applications, vol. 40, pp. 970-977, Jul. 2004.
[15] W. Friede, S. Rael, and B. Davat, “Mathematical model and characteri-zation of the transient behavior of a PEM fuel cell,” IEEE Trans. Power Electronics, vol. 19, pp. 1234-1241, Sept. 2004.
[16] P. Argyropoulos, K. Scott, A. K. Shukla, and C. Jackson, “A semi-empirical model of the direct methanol fuel cell performance. I. Model development and verification,” Journal of Power Sources, vol. 123, pp. 190-199, Sept. 2003.
[17] S. Yerramalla, A. Davari, A. Feliachi, and T. Biswas, “Modeling and simulation of the dynamic behavior of a polymer electrolyte membrane fuel cell,” Journal of Power Sources, vol. 124, pp. 104-113, Oct. 2003.
[18] K. Sedghisigarchi, and A. Feliachi, “Dynamic and transient analysis of power distribution systems with fuel cells – part I: fuel-cell dynamic model,” IEEE Trans. Energy Conversion, vol. 19, pp. 423-428, Jun. 2004.
[19] J. M. Correa, F. A. Farret, L. N. Canha, and M. G. Simoes, “An electro-chemical-based fuel-cell model suitable for electrical engineering auto-mation approach,” IEEE Trans. Industrial Electronics, vol. 51, pp. 1103-1112, Oct. 2004.
[20] D. Yu and S. Yuvarajan, “A novel circuit model for PEM fuel cells,” in Proc. 2004 IEEE Applied Power Electronics Conference and Exposi-tion, pp. 362-366.
[21] P. Famouri and R. S. Gemmen, “Electrochemical circuit model of a PEM fuel cell,” in Proc. 2003 IEEE Power Engineering Society General Meeting, pp. 1436-1440.
[22] J. Garnier, M. C. Pera, D. Hissel, F. Harel, D. Candusso, N. Glandut, J. P. Diard, A. D. Bernardinis, J. M. Kauffmann, and G. Coquery, “Dy-namic PEM fuel cell modeling for automotive applications,” in Proc. 2003 IEEE 58th Vehicular Technology Conf., pp. 3284-3288.
[23] M. Chen and G. A. Rincón-Mora, “An accurate electrical battery model capable of predicting runtime and I-V performance,” IEEE Trans. Ener-gy Conversion, vol. 21, no. 2, June 2006, pp. 504-511.
[24] S. R. Narayanan, A. Kindler, B. Jeffries-Nakamura, W. Chun, H. Frank, M. Smart, T. I. Valdez, S. Surampudi, and G. Halpert, “Recent advances in PEM liquid-feed direct methanol fuel cells,” in Proc. 1996 11th Bat-tery Conf. on Applications and Advances, pp. 113-122.
[25] Z. Qi and A. Kaufman, “Open circuit voltage and methanol crossover in DMFCs,” Journal of Power Sources, vol. 110, pp. 177-185, Jul. 2002.
X. BIOGRAPHIES Min Chen (S’04) was born in Jingdezhen, China. He received the B.Eng. degree (with highest hon-ors) and the M.Eng. degree in electrical engineer-ing from Southeast University, Nanjing, China, in 1999 and 2002, respectively. He is currently work-ing toward the Ph.D. degree in electrical and com-puter engineering at the Georgia Institute of Tech-nology, Atlanta.
His research interests are in the area of analog and power IC design, more specifically, battery and fuel cell modeling, high efficiency charger IC
design, and integrated power management for hybrid power sources.
Gabriel A. Rincón-Mora (IEEE S’91-M’97-SM’01) received his B.S.E.E. (High Honors) from Florida International University in 1992 and M.S.E.E. and Ph.D. (Outstanding Ph.D. Graduate) in electrical engineering from Georgia Tech in 1994 and 1996, respectively. He worked for Texas Instruments from 1994 through 2003 as a Senior Integrated Circuits Designer, Design Team Leader, Member of Group Technical Staff, and Analog Consultant designing integrated power manage-ment circuits for products like cellular phones,
pagers, laptop and desktop computers, etc. In 1999, he was appointed Adjunct Professor for Georgia Tech, and in 2001, he became a full-time faculty mem-ber of the School of Electrical and Computer Engineering at Georgia Tech. From 2002 through 2004, he was the Director of the Georgia Tech Analog Consortium. He was the Vice-Chairman for the joint Atlanta IEEE Solid-State Circuits Society and Circuits and Systems (SSCS-CAS) Chapter for 2004 and has been its Chairman since 2005. He has designed and released over 26 pow-er management IC products, holds 25 patents, authored over 84 publications, two of which are books titled Voltage References and Power Management ICs. He also teaches short courses on analog and power management IC de-sign.
Dr. Rincón-Mora received the "National Hispanic in Technology Award" from the Society of Professional Hispanic Engineers, the "Charles E. Perry Visionary Award" from Florida International University, and a “Commenda-tion Certificate” from the Lieutenant Governor of California for his work and contributions to the field. He was inducted into the "Council of Outstanding Young Engineering Alumni" by Georgia Tech and featured on the cover of Hispanic Business Magazine as one of “The 100 Most Influential Hispanics,” La Fuente (Dallas Morning News publication), and three times on Nuevo Impacto (Atlanta-based magazine).
TABLE IV MODEL EXTRACTION ACCURACY OVER TEMPERATURE
Current Profiles Avg.
Max. Error Voltage up to 95% Runtime
(% of Avg.)
Runtime Error *
27˚C
10 mA cont. 490 mV 25 mV (5.1%) 8.4% 20 mA cont. 420 mV 49 mV (11.7%) 9.5% 30 mA cont. 360 mV 23 mV (6.4%) 7.3% 10 mA pulse 520 mV 52 mV (10.0%) 7.8% 20 mA pulse 510 mV 36 mV (7.1%) 3.2% 30 mA pulse 470 mV 37 mV (7.9%) 8.5%
40˚C
10 mA cont. 490 mV 31 mV (6.3%) 4.6% 20 mA cont. 440 mV 49 mV (11.1%) 4.2% 30 mA cont. 410 mV 71 mV (17.3%) 10.5% 10 mA pulse 550 mV 35 mV (6.4%) 4.5% 20 mA pulse 550 mV 41 mV (7.5%) 2.5% 30 mA pulse 530 mV 41 mV (7.7%) 0.4%
50˚C
10 mA cont. 570 mV 69 mV (12.1%) 0.3% 20 mA cont. 510 mV 80 mV (15.7%) 6.8% 30 mA cont. 470 mV 36 mV (7.7%) 8.8% 10 mA pulse 600 mV 79 mV (13.2%) 4.1% 20 mA pulse 590 mV 37 mV (6.3%) 1.6% 30 mA pulse 570 mV 69 mV (12.1%) 0.3%
Worst-Case 510 mV 80 mV (15.7%) 10.5% * Error = | [Runtime(Sim) - Runtime(Exp)] / Runtime(Exp) |