Embed Size (px)
Citation preview
Biol. Lett. (2008) 4, 430–433
doi:10.1098/rsbl.2008.0166
Published online 29 May 2008
Population genetics
A coalescent frameworkfor comparing alternativemodels of populationstructure with genetic data:evolution of Celebes toadsBen J. Evans1,*, Jimmy A. McGuire2,Rafe M. Brown3, Noviar Andayani4
and Jatna Supriatna4
1Department of Biology, Life Sciences Building Room 328, McMasterUniversity, 1280 Main Street West, Hamilton, Ont., Canada L8S 4K12Department of Integrative Biology, 3101 Valley Life Sciences Building,University of California, Berkeley, CA 94720-3160, USA3Department of Ecology and Evolutionary Biology, Dyche Hall,University of Kansas, 1345 Jayhawk Boulevard, Lawrence,KS 66045-7561, USA4Departmen Biologi, FMIPA, University of Indonesia, Depok,Java 16424, Indonesia*Author for correspondence ([email protected]).
Isolation of populations eventually leads todivergence by genetic drift, but if connectivityvaries over time, its impact on diversificationmay be difficult to discern. Even when thehabitat patches of multiple species overlap,differences in their demographic parameters,molecular evolution and stochastic eventscontribute to differences in the magnitude anddistribution of their genetic variation. The Indo-nesian island of Sulawesi, for example, harboursa suite of endemic species whose intraspecificdifferentiation or interspecific divergence mayhave been catalysed by habitat fragmentation.To further test this hypothesis, we have per-formed phylogenetic and coalescent-basedanalyses on molecular variation in mito-chondrial and nuclear DNA of the Celebes toad(Bufo celebensis). Results support a role forhabitat fragmentation that led to a populationstructure in these toads that closely matchesdistributions of Sulawesi macaque monkeys.Habitat fragmentation, therefore, may also haveaffected other groups on this island.
Keywords: coalescence; rejection sampling;demography
1. INTRODUCTIONFragmentation of populations can cause divergenceby genetic drift depending on their effective popu-lation sizes, mutation rate, the duration of isolation,and the level of gene flow between them. However,the role of fragmentation in causing populationstructure may be subtle after what we call ‘crypticfragmentation’, in which a barrier to gene flow iseither not apparent or no longer present. Crypticfragmentation may have affected, for example, faunaof the island of Cuba (Glor et al. 2004) and the Baja
California Peninsula (Leache et al. 2007). In contrastto diversification caused by enduring barriers todispersal, the genetic signature of cryptic fragmenta-tion might fade over time if the margins of thesubdivided populations move, or if recent gene flowcauses populations to amalgamate.
Cryptic fragmentation has been proposed on theIndonesian island of Sulawesi based on similar patternsof diversity in multiple groups, including the Celebestoad (Evans et al. 2003c), monkeys (Evans et al.2003b), fanged frogs (Evans et al. 2003a) and flyinglizards (McGuire et al. 2007). However, the validity ofa demographic model of isolation by distance (IBD)plus fragmentation as opposed to a model ofexclusively IBD has been questioned (Bridle et al.2004). To further explore this, we used a coalescent-based approach to compare the fit of models thatapproximate each of these demographic scenarios forthe Celebes toad, Bufo celebensis.
2. MATERIAL AND METHODS(a) Molecular data, genealogies, networksand population subdivisionNew data were collected from mitochondrial DNA (mtDNA) andtwo nuclear loci (nDNA) from throughout the range of the Celebestoad, including sequences from up to 166 individual toads from upto 56 localities (figures 1a and 2a; see the electronic supplementarymaterial). MtDNA sequences are from the 12S rDNA gene andnuclear sequences are from the recombination activation gene 1(RAG ) and intron 3 of the rhodopsin gene (RHO). A phylogenywas estimated from the mtDNA data under a doublet model forribosomal genes using MRBAYES v. 3.1.2 (Huelsenbeck & Ronquist2001) with secondary structure inferred from a model for Xenopuslaevis (Cannone et al. 2002). Networks were estimated frominferred alleles for the nuclear loci (see the electronic supple-mentary material).
(b) Coalescent comparison of alternativedemographic modelsFor computational efficiency (Wilkins 2004), we used a latticemodel to approximate an IBD model (IBDL), and compared itwith an alternative model that also has simultaneous fragmentation(IBDLCF) at the sites of each macaque contact zone, except adisplaced location of the margin in toads between the NW and WCareas of endemism (AOEs; figure 2a). The locations of macaquecontact zones are well characterized (Evans et al. 2003b andreferences therein). Both models assume mutation–drift equili-brium, constant population size over time and symmetricalmigration between connected neighbouring demes.
The IBDL model has three parameters: the effective populationsize of the locus in each deme (Ne-nDNA-deme), the mutation rateper sequence (m) and the fraction of subpopulation i in eachgeneration that are migrants from subpopulation j (mij). TheIBDLCF model has an additional parameter (t), which is the timein 4Ne-nDNA-deme generations from the present that fragmentationstarted simultaneously at all boundaries between AOEs (figure 2a).
Model likelihood was estimated using rejection sampling ofcoalescent simulations (Weiss & von Haeseler 1998) based on threesummary statistics: the average pairwise nucleotide divergence persequence (p), the number of segregating sites (S ) and FST
(table 1). p and S were calculated for simulated data usingsample_stat (Hudson 2002) and for the observed data usingDNASP v. 4.10.9 (Rozas et al. 2003). FST was calculated using Perlscripts according to: FSTZ(pbetweenKpwithin)/pbetween where pbetween
and pwithin are the average number of pairwise differences betweenand within AOEs, respectively (Hudson et al. 1992). To avoid biasdue to differences in sample size, the average pwithin of each AOEwas used in this calculation. FST was transformed according toFST/(1KFST) (Rousset 1997) before rejection sampling. Modellikelihood for each locus was estimated as the proportion of100 000 simulations whose summary statistics were G10% of theobserved values for all three statistics; multilocus likelihoods are theproduct of the likelihood of each locus. Simulations were performedwith the program ms (Hudson 2002) under an approximation ofthe finite sites model by using the total mutation rate foreach sequence instead of the mutation rate per site, which isappropriate when 4Nem/site is small. Scaling factors were appliedto Ne-nDNA-deme and m as a coarse measure to accommodate
Electronic supplementary material is available at http://dx.doi.org/10.1098/rsbl.2008.0166 or via http://journals.royalsociety.org.
Received 23 March 2008Accepted 14 May 2008
430 This journal is q 2008 The Royal Society
differences in uniparental or biparental inheritance, ploidy,mutation rate per nucleotide, and the number of nucleotidessequenced per locus (table 2).
Nested evolutionary models can be compared by assuming thattwice the difference of the natural logarithm of their likelihoods ofeach model (2d) follows a c2 distribution with degrees of freedomequal to the number of free parameters (Goldman 1993). However,because the IBDL model is equivalent to the IBDLCF model witht equal to a boundary of zero, in our case this distribution can beexpressed as a 50 : 50 mixture of c0
2 and c12 distributions (Self &
Liang 1987). This is equal to half of the probability of a c2
distribution with degrees of freedom equal to 1 (Goldman &Whelan 2000).
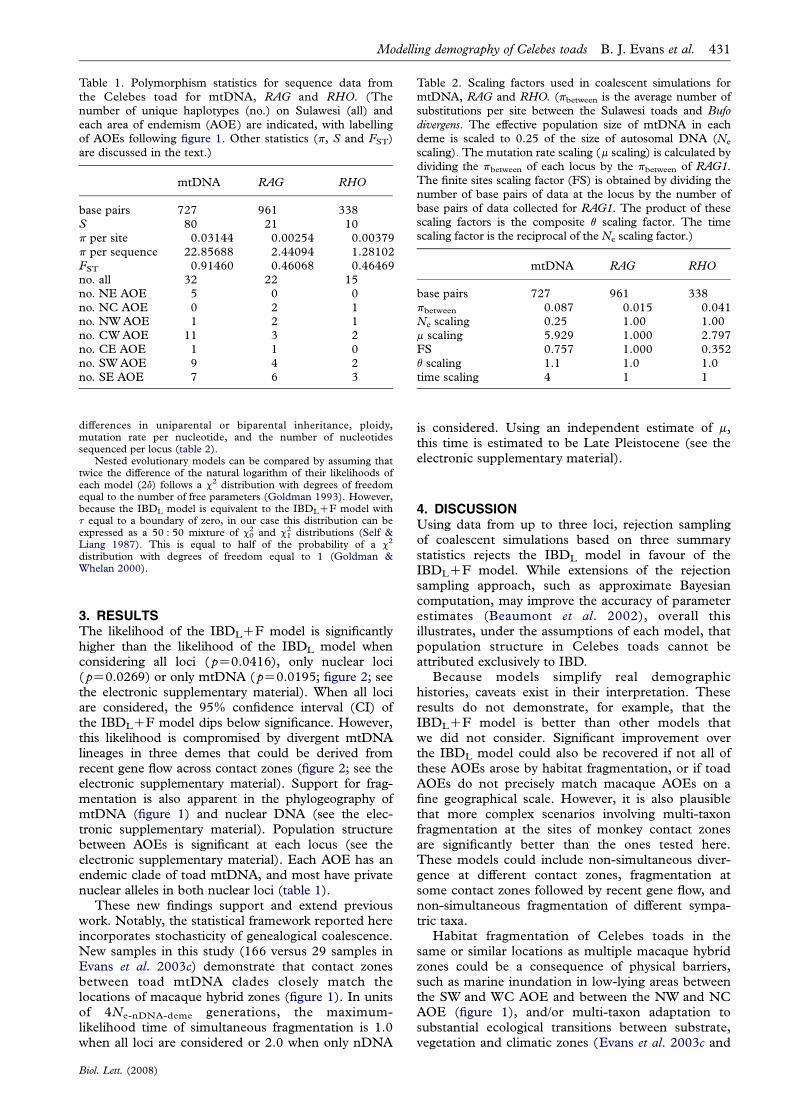
3. RESULTSThe likelihood of the IBDLCF model is significantlyhigher than the likelihood of the IBDL model whenconsidering all loci (pZ0.0416), only nuclear loci(pZ0.0269) or only mtDNA (pZ0.0195; figure 2; seethe electronic supplementary material). When all lociare considered, the 95% confidence interval (CI) ofthe IBDLCF model dips below significance. However,this likelihood is compromised by divergent mtDNAlineages in three demes that could be derived fromrecent gene flow across contact zones (figure 2; see theelectronic supplementary material). Support for frag-mentation is also apparent in the phylogeography ofmtDNA (figure 1) and nuclear DNA (see the elec-tronic supplementary material). Population structurebetween AOEs is significant at each locus (see theelectronic supplementary material). Each AOE has anendemic clade of toad mtDNA, and most have privatenuclear alleles in both nuclear loci (table 1).
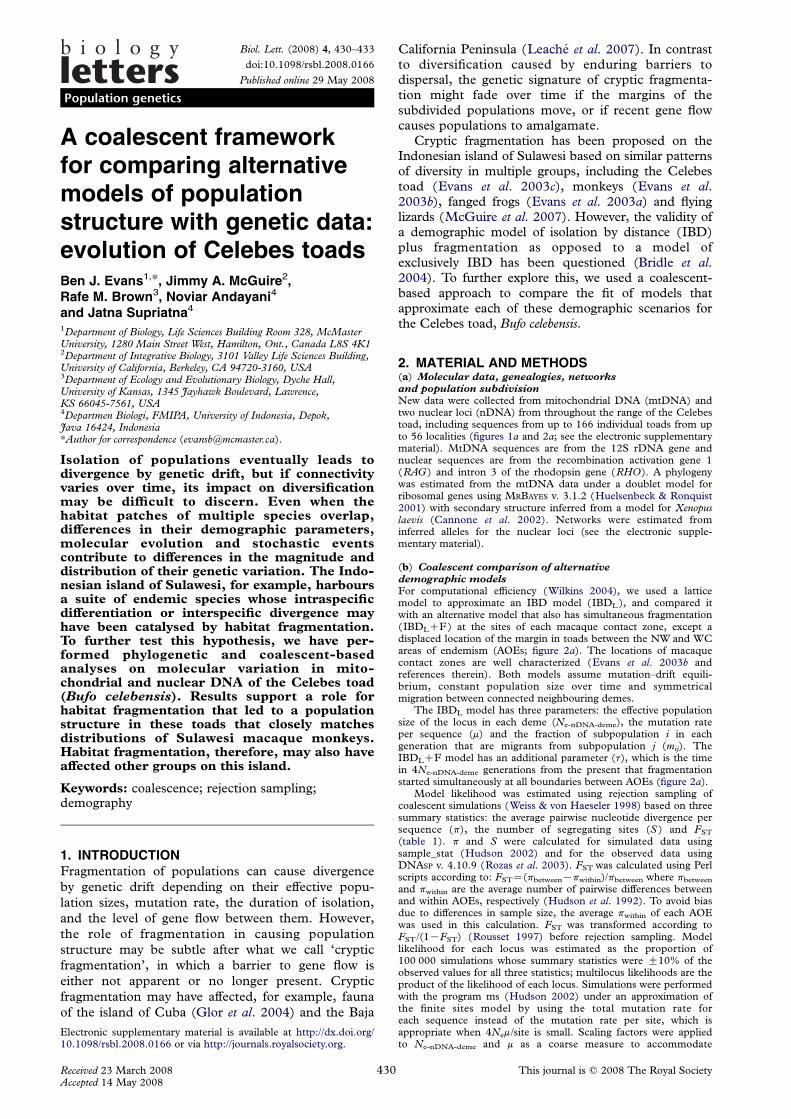
These new findings support and extend previouswork. Notably, the statistical framework reported hereincorporates stochasticity of genealogical coalescence.New samples in this study (166 versus 29 samples inEvans et al. 2003c) demonstrate that contact zonesbetween toad mtDNA clades closely match thelocations of macaque hybrid zones (figure 1). In unitsof 4Ne-nDNA-deme generations, the maximum-likelihood time of simultaneous fragmentation is 1.0when all loci are considered or 2.0 when only nDNA
is considered. Using an independent estimate of m,this time is estimated to be Late Pleistocene (see theelectronic supplementary material).
4. DISCUSSIONUsing data from up to three loci, rejection samplingof coalescent simulations based on three summarystatistics rejects the IBDL model in favour of theIBDLCF model. While extensions of the rejectionsampling approach, such as approximate Bayesiancomputation, may improve the accuracy of parameterestimates (Beaumont et al. 2002), overall thisillustrates, under the assumptions of each model, thatpopulation structure in Celebes toads cannot beattributed exclusively to IBD.
Because models simplify real demographichistories, caveats exist in their interpretation. Theseresults do not demonstrate, for example, that theIBDLCF model is better than other models thatwe did not consider. Significant improvement overthe IBDL model could also be recovered if not all ofthese AOEs arose by habitat fragmentation, or if toadAOEs do not precisely match macaque AOEs on afine geographical scale. However, it is also plausiblethat more complex scenarios involving multi-taxonfragmentation at the sites of monkey contact zonesare significantly better than the ones tested here.These models could include non-simultaneous diver-gence at different contact zones, fragmentation atsome contact zones followed by recent gene flow, andnon-simultaneous fragmentation of different sympa-tric taxa.
Habitat fragmentation of Celebes toads in thesame or similar locations as multiple macaque hybridzones could be a consequence of physical barriers,such as marine inundation in low-lying areas betweenthe SW and WC AOE and between the NW and NCAOE (figure 1), and/or multi-taxon adaptation tosubstantial ecological transitions between substrate,vegetation and climatic zones (Evans et al. 2003c and
Table 1. Polymorphism statistics for sequence data fromthe Celebes toad for mtDNA, RAG and RHO. (Thenumber of unique haplotypes (no.) on Sulawesi (all) andeach area of endemism (AOE) are indicated, with labellingof AOEs following figure 1. Other statistics (p, S and FST)are discussed in the text.)
mtDNA RAG RHO
base pairs 727 961 338S 80 21 10p per site 0.03144 0.00254 0.00379p per sequence 22.85688 2.44094 1.28102FST 0.91460 0.46068 0.46469no. all 32 22 15no. NE AOE 5 0 0no. NC AOE 0 2 1no. NWAOE 1 2 1no. CWAOE 11 3 2no. CE AOE 1 1 0no. SWAOE 9 4 2no. SE AOE 7 6 3
Table 2. Scaling factors used in coalescent simulations formtDNA, RAG and RHO. (pbetween is the average number ofsubstitutions per site between the Sulawesi toads and Bufodivergens. The effective population size of mtDNA in eachdeme is scaled to 0.25 of the size of autosomal DNA (Ne
scaling). The mutation rate scaling (m scaling) is calculated bydividing the pbetween of each locus by the pbetween of RAG1.The finite sites scaling factor (FS) is obtained by dividing thenumber of base pairs of data at the locus by the number ofbase pairs of data collected for RAG1. The product of thesescaling factors is the composite q scaling factor. The timescaling factor is the reciprocal of the Ne scaling factor.)
mtDNA RAG RHO
base pairs 727 961 338pbetween 0.087 0.015 0.041Ne scaling 0.25 1.00 1.00m scaling 5.929 1.000 2.797FS 0.757 1.000 0.352q scaling 1.1 1.0 1.0time scaling 4 1 1
Modelling demography of Celebes toads B. J. Evans et al. 431
Biol. Lett. (2008)
12
23
8
52452
22
(a) (b)
210
9
2
2
2
22
6
32
2
11
3
36 2
3
4
3
9 3
2
4
2
B. divergensB. melanostictus
0.01 substitutions/site
*
*
*
*
81*
88
82
90
*
81
*
*
*
*94
*
NWNC
NE
WC
EC
SW
SE
NW
NC
NE
WC
EC
SW
SE
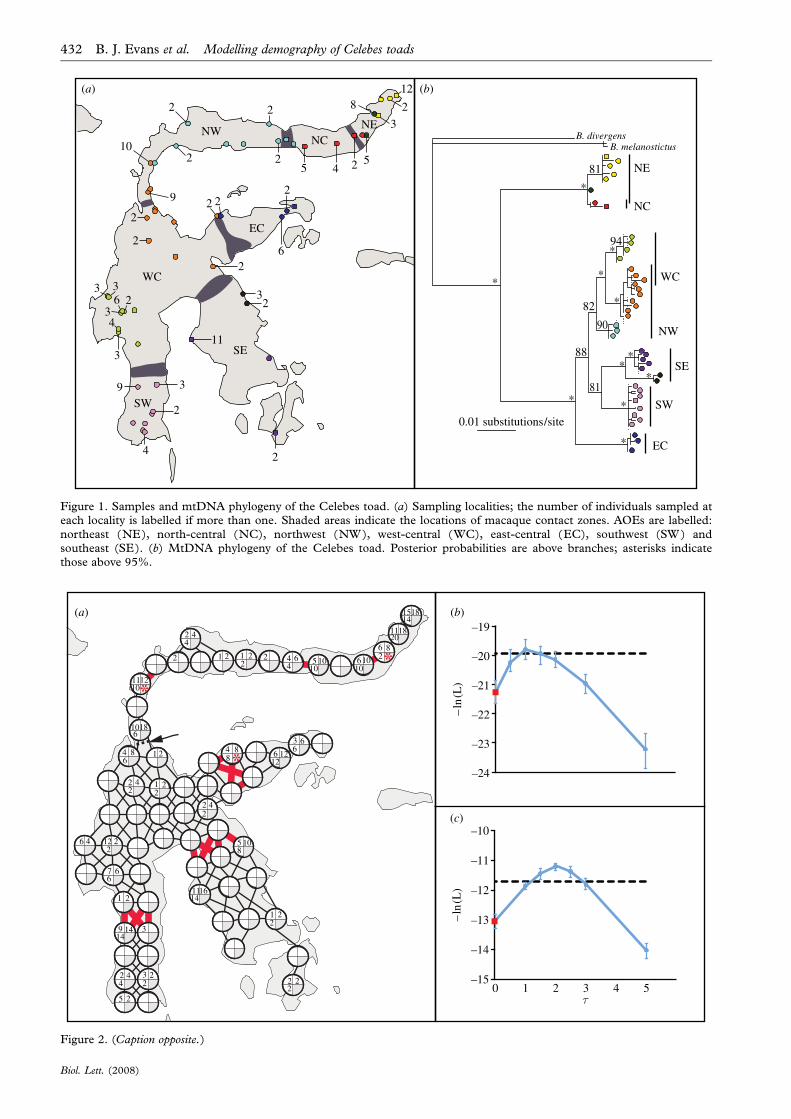
Figure 1. Samples and mtDNA phylogeny of the Celebes toad. (a) Sampling localities; the number of individuals sampled ateach locality is labelled if more than one. Shaded areas indicate the locations of macaque contact zones. AOEs are labelled:northeast (NE), north-central (NC), northwest (NW), west-central (WC), east-central (EC), southwest (SW) andsoutheast (SE). (b) MtDNA phylogeny of the Celebes toad. Posterior probabilities are above branches; asterisks indicatethose above 95%.
0 21 3 4 5
–23
–22
–21
–20
–19
–ln
(L)
–24
(b)(a)
–14
–13
–12
–11
–10
–ln
(L)
–15
(c)
Figure 2. (Caption opposite.)
432 B. J. Evans et al. Modelling demography of Celebes toads
Biol. Lett. (2008)
references therein). These processes probably affectedmany other species and therefore provide scientificrationale for geographically dispersed conservationareas on Sulawesi.
We thank P. Andolfatto, J. Bridle, R. Butlin, B. Golding,N. Goldman, R. Hudson, J. Wilkins and S. Wright andmembers of the McGuire lab for their advice and com-ments. This research was supported by the NationalScience Foundation, Canadian Foundation for Innovation,National Science and Engineering Research Council andMcMaster University.
Beaumont, M. A., Zhang, W. & Balding, D. J. 2002Approximate Bayesian computation in populationgenetics. Genetics 162, 2025–2035.
Bridle, J. R., Pedro, P. M. & Butlin, R. K. 2004 Habitatfragmentation and biodiversity: testing for the evolution-ary effects of refugia. Evolution 58, 1394–1396. (doi:10.1111/j.0014-3820.2004.tb01718.x)
Cannone, J. J. et al. 2002 The comparative RNA web(CRW) site: an online database of comparative sequenceand structure information for ribosomal, intron, andother RNAs. BMC Bioinform. 3, 2. (doi:10.1186/1471-2105-3-2)
Evans, B. J., Brown, R. M., McGuire, J. A., Supriatna, J.,Andayani, N., Diesmos, A., Iskandar, D. T., Melnick,D. J. & Cannatella, D. C. 2003a Phylogenetics of fangedfrogs (Anura; Ranidae; Limnonectes): testing biogeogra-phical hypotheses at the Asian–Australian faunal zoneinterface. Syst. Biol. 52, 794–819. (doi:10.1080/10635150390251063)
Evans, B. J., Supriatna, J., Andayani, N. & Melnick, D. J.2003b Diversification of Sulawesi macaque monkeys:decoupled evolution of mitochondrial and autosomalDNA. Evolution 57, 1931–1946. (doi:10.1111/j.0014-3820.2003.tb00599.x)
Evans, B. J., Supriatna, J., Andayani, N., Setiadi, M. I.,Cannatella, D. C. & Melnick, D. J. 2003c Monkeys andtoads define areas of endemism on Sulawesi. Evolution 57,1436–1443. (doi:10.1111/j.0014-3820.2003.tb00350.x)
Glor, R. E., Gifford, M. E., Larson, A., Losos, J. B.,Schettino, L. R., Lara, A. R. C. & Jackman, T. R. 2004
Partial island submergence and speciation in an adaptiveradiation: a multilocus analysis of the Cuban greenanoles. Proc. R. Soc. B 271, 2257–2265. (doi:10.1098/rspb.2004.2819)
Goldman, N. 1993 Statistical tests of models of DNAsubstitution. J. Mol. Evol. 36, 182–198. (doi:10.1007/BF00166252)
Goldman, N. & Whelan, S. 2000 Statistical tests of gamma-distributed rate heterogeneity in models of sequenceevolution in phylogenetics. Mol. Biol. Evol. 17, 975–978.
Hudson, R. R. 2002 Generating samples under a Wright–Fisher neutral model of genetic variation. Bioinformatics18, 337–338. (doi:10.1093/bioinformatics/18.2.337)
Hudson, R. R., Slatkin, M. & Maddison, W. P. 1992Estimation of levels of gene flow from DNA sequencedata. Genetics 132, 583–589.
Huelsenbeck, J. P. & Ronquist, F. 2001 MRBAYES: Bayesianinference of phylogenetic trees. Bioinformatics 17,754–755. (doi:10.1093/bioinformatics/17.8.754)
Leache, A., Crews, S. C. & Hickerson, M. J. 2007 Twowaves of diversification in mammals and reptiles of BajaCalifornia revealed by hierarchical Bayesian analysis.Biol. Lett. 3, 646–650. (doi:10.1098/rsbl.2007.0368)
McGuire, J. A., Brown, R. M., Mumpuni, Riyanto, A. &Andayani, N. 2007 The flying lizards of the Dracolineatus group (Squamata: Iguania: Agamidae): a taxo-nomic revision with descriptions of two new species.Herpetol. Monogr. 21, 179–212. (doi:10.1655/07-012.1)
Rousset, F. 1997 Genetic differentiation and estimation ofgene flow from F-statistics under isolation by distance.Genetics 145, 1219–1228.
Rozas, J., Sanchez-DelBarrio, J. C., Messegyer, X. & Rozas,R. 2003 DNASP, DNA polymorphism analyses by thecoalescent and other methods. Bioinformatics 19,2496–2497. (doi:10.1093/bioinformatics/btg359)
Self, S. G. & Liang, K.-Y. 1987 Asymptotic properties ofmaximum likelihood estimators and likelihood ratio testsunder nonstandard conditions. J. Am. Stat. Assoc. 82,605–610. (doi:10.2307/2289471)
Weiss, G. & von Haeseler, A. 1998 Inference of populationhistory using a likelihood approach. Genetics 149,1539–1546.
Wilkins, J. F. 2004 A separation-of-timescales approach tothe coalescent in a continuous population. Genetics 168,2227–2244. (doi:10.1534/genetics.103.022830)
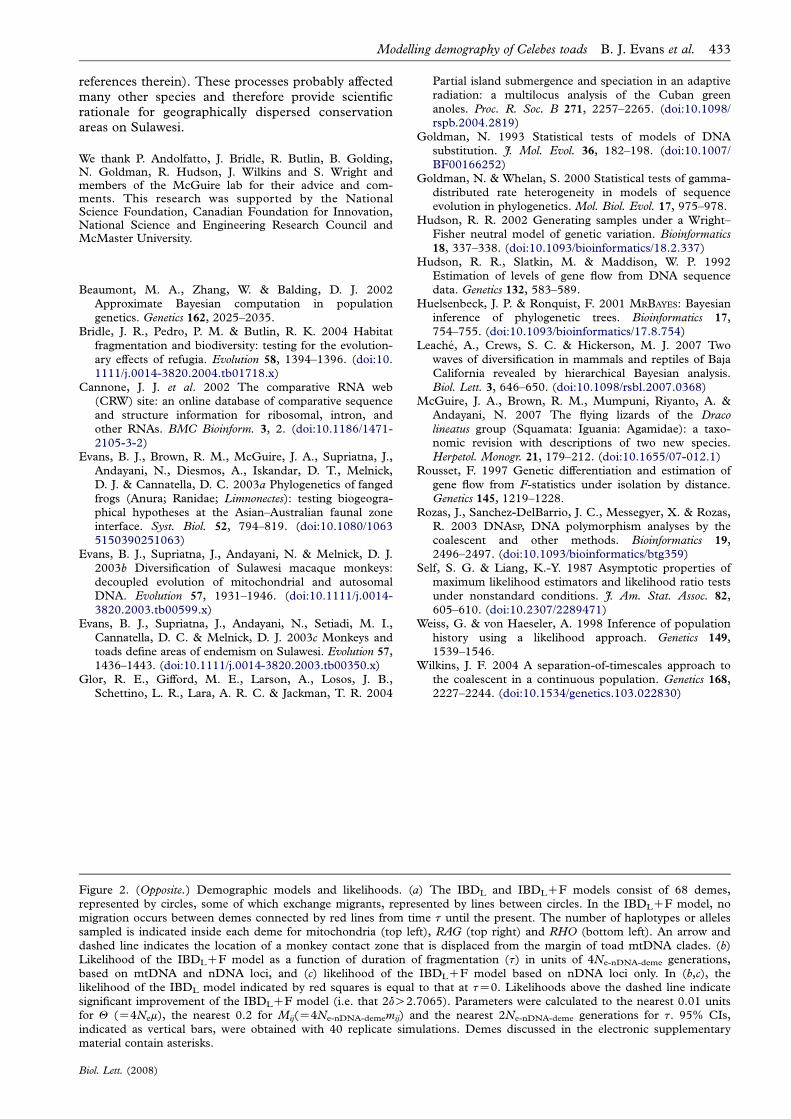
Figure 2. (Opposite.) Demographic models and likelihoods. (a) The IBDL and IBDLCF models consist of 68 demes,represented by circles, some of which exchange migrants, represented by lines between circles. In the IBDLCF model, nomigration occurs between demes connected by red lines from time t until the present. The number of haplotypes or allelessampled is indicated inside each deme for mitochondria (top left), RAG (top right) and RHO (bottom left). An arrow anddashed line indicates the location of a monkey contact zone that is displaced from the margin of toad mtDNA clades. (b)Likelihood of the IBDLCF model as a function of duration of fragmentation (t) in units of 4Ne-nDNA-deme generations,based on mtDNA and nDNA loci, and (c) likelihood of the IBDLCF model based on nDNA loci only. In (b,c), thelikelihood of the IBDL model indicated by red squares is equal to that at tZ0. Likelihoods above the dashed line indicatesignificant improvement of the IBDLCF model (i.e. that 2dO2.7065). Parameters were calculated to the nearest 0.01 unitsfor Q (Z4Nem), the nearest 0.2 for Mij(Z4Ne-nDNA-dememij) and the nearest 2Ne-nDNA-deme generations for t. 95% CIs,indicated as vertical bars, were obtained with 40 replicate simulations. Demes discussed in the electronic supplementarymaterial contain asterisks.
Modelling demography of Celebes toads B. J. Evans et al. 433
Biol. Lett. (2008)
There are five sections to the additional material: S1. Estimation of divergence time S2. Supplementary figure 1 S3. Supplementary table 1. S4. Supplementary table 2. S5. Supplementary references
S1. Estimation of divergence time The mutation rate (µ) of mtDNA ribosomal genes has been estimated to be 0.00249 substitutions per site per million years (Evans et al., 2004). This can be scaled to a mutation rate for RAG of 4.20 x 10⁻¹⁰ substitutions per site per year at this locus, based on statistics in Table 2. Because 961 bp of RAG1 sequence were analyzed in this study, this translates to a mutation rate of 4.04 x 10⁻⁷ substitutions per RAG sequence per year (µRAG). Given the relationship θ = 4Ne-nDNA-deme µ, dividing the ML estimate of θ when all loci are considered (0.037) by µRAG, and assuming one toad generation per year, yields an ML estimate of the estimate of the time of simultaneous fragmentation (τ = 1*4Ne-
nDNA-deme generations) of ~92,000 years ago. Use of the ML estimate of θ when just nDNA are considered (0.044), provides an estimated time of simultaneous fragmentation (τ = 2*4Ne-nDNA-deme generations) of ~218,000 years ago. Of course, confidence intervals on these estimates are large if one incorporates uncertainty in parameter estimates. For example, consideration of values of τ that are two units of support away from the ML estimate provides a confidence interval analogous to that derived from two standard deviations away from the mean (Edwards, 1992). This interval ranges from 0 to about 340,000 years ago for all loci, and 0 to about 460,000 years ago for just nDNA. Recent gene flow, which is not incorporated in the IBDL+F model, probably decreases the multilocus likelihood of this model. For example, in three locations indicated by red asterisks in Fig. 2, two divergent mtDNA lineages were sampled and therefore were included in the same deme for the coalescent simulations. Variation the ML estimate of τ among loci also reduces the multilocus likelihood of the IBDL+F model: the ML estimate of τ from only mtDNA is older (4*4Ne-nDNA-deme generations, data not shown) than the estimate from the nuclear loci (figure 2). This could be because of inaccuracies in the scaling factors used (Table 2) and/or stochastic variation among loci in coalescent times. But despite these limitations, the IBDL+F model is still preferred. Under a scenario of non-simultaneous fragmentation, some contact zones could have experienced fragmentation more recently or not at all, whereas fragmentation at other contact zones could be older than τ. We did not explore these and other more complex demographic models here because of computational difficulty of estimating the maximum likelihood of more parameterized models. Furthermore, additional zones of fragmentation may exist in other species that either do not exist in Sulawesi toads or monkeys, or that are displaced from the ones in these species (Bridle et al., 2001). On a fine geographic scale, then, no single demographic model will account for all species on Sulawesi. It is this reality that makes the similar distributions of genetic variation of toads and monkeys remarkable, and suggestive of cryptic fragmentation that could have impacted diversification of multiple species on this island.
S2. Supplementary figure 1
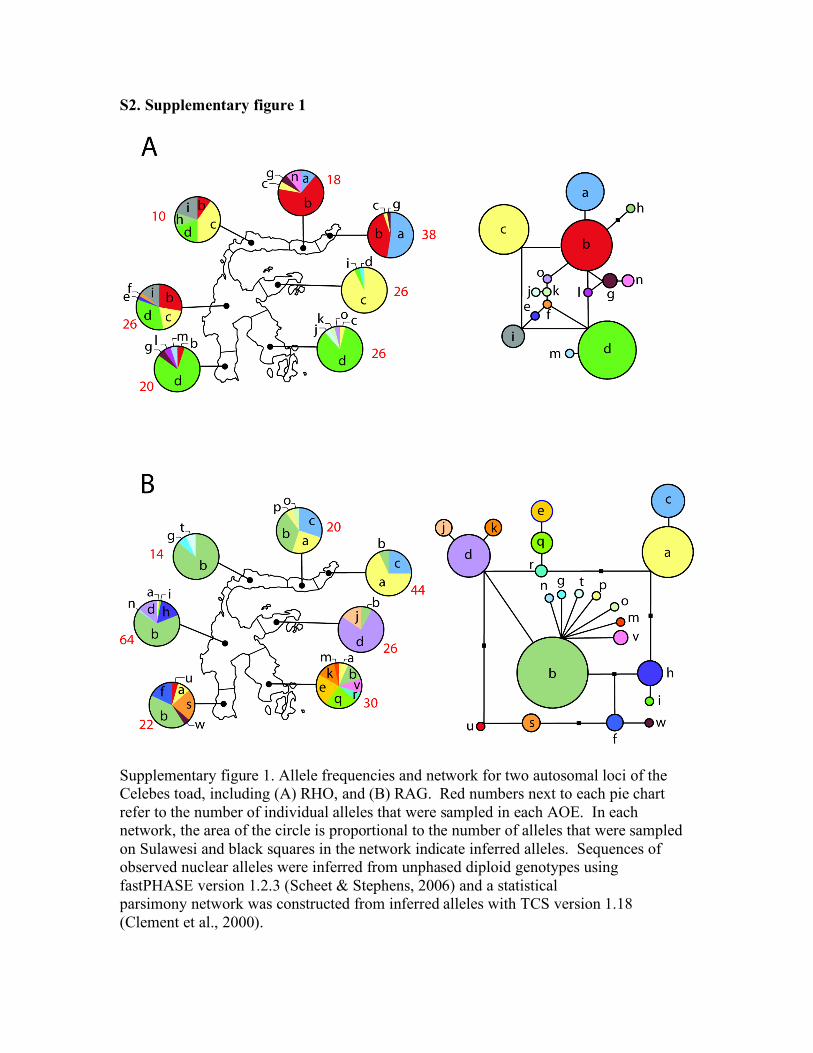
Supplementary figure 1. Allele frequencies and network for two autosomal loci of the Celebes toad, including (A) RHO, and (B) RAG. Red numbers next to each pie chart refer to the number of individual alleles that were sampled in each AOE. In each network, the area of the circle is proportional to the number of alleles that were sampled on Sulawesi and black squares in the network indicate inferred alleles. Sequences of observed nuclear alleles were inferred from unphased diploid genotypes using fastPHASE version 1.2.3 (Scheet & Stephens, 2006) and a statistical parsimony network was constructed from inferred alleles with TCS version 1.18 (Clement et al., 2000).
S3. Supplementary Table 1 (page 1 of 6).
Field Number monkeyAOE Species Locality Latitude Longitude RAG RHO
AMNH16001 Not applicable melanostictus
Java Island, Java Barat,
Depok -6.3739 106.8255 + +
AMNH16059 SE (introduced) melanostictus
Sulawesi Island, Sulawesi
Tengarra, Kendari -3.9695 122.5733 + +
AMNH16064 Not applicable melanostictus
Sumatra Island, Sumatra
Barat, Padang -0.9500 100.3500 + +
AMNH16179 Not applicable divergens
Borneo Island,
Kalimantan Timor, Kutai
National Park 0.3696 117.4730 + +
AMNH16002 NE celebensis Manado 1.4897 124.8420 + +
AMNH16008 NE celebensis Tangkoko N. P. 1.5701 125.1569 + +
AMNH16009 NE celebensis Tangkoko N. P. 1.5701 125.1569 + +
AMNH16010 NE celebensis Tangkoko N. P. 1.5701 125.1569 + +
AMNH16011 NE celebensis Tangkoko N. P. 1.5701 125.1569 + +
AMNH16018 NC celebensis Kotamobagu 0.7292 124.2830 + +
AMNH16023 NC celebensis
Toraut, Bogani Nani
Wartabone N. P. 0.5625 123.9038 + +
AMNH16028 NC celebensis
Toraut, Bogani Nani
Wartabone N. P. 0.5625 123.9038 + +
AMNH16041 WC celebensis Lore Lindu N.P. -1.4503 119.9899 + +
AMNH16048 WC celebensis Kolonodale -1.9866 121.3390 + +
AMNH16056 SE celebensis Kendari, Soropia -3.9072 122.5046 + +
AMNH16068 SW celebensis Malino -5.2594 119.9260 + +
AMNH16069 SW celebensis Bantimurung -5.2520 119.6730 + +
AMNH16082 WC celebensis Gunung Karua -2.9022 119.6973 + +
AMNH16091 EC celebensis Luwuk -0.9509 122.7916 + +
AMNH16133 WC celebensis Parigi -0.7884 120.1270 + +
AMNH16137 WC celebensis Lemo -0.4408 119.9820 + +
AMNH16146 NW celebensis Marisa 0.5516 121.9690 + +
AMNH16147 NW celebensis Paguyaman 0.6291 122.6927 + +
AMNH16150 NC celebensis Tolabulu 0.5134 123.2428 + +
AMNH16151 NE celebensis Mooat 0.7515 124.4492 + +
AMNH16154 SE celebensis Buton Island -5.4502 122.6419 + +
AMNH16163 SE celebensis Lasusua -3.5101 120.8819 +
AMNH16169 WC celebensis Enrekang -3.6024 119.7664 +
AMNH16173 SW celebensis Barru -4.4941 119.7666 + +
BSI0119 NE celebensis Klabat Mt. 1.5097 125.0183 + +
BSI0135 NE celebensis Klabat Mt. 1.5111 125.0178 + +
BSI0140 NE celebensis
Soputan, Kabupaten
Minahasa, Sulawesi Utara
Prov 1.1447 124.7556 + +
BSI0141 NE celebensis Soputan 1.1447 124.7556 + +
BSI0142 NE celebensis Soputan 1.1447 124.7556 + +
BSI0143 NE celebensis Soputan 1.1447 124.7556 + +
BSI0144 NE celebensis
Soputan, Kabupaten
Minahasa, Sulawesi Utara
Prov 1.1447 124.7556 + +
BSI0145 NE celebensis
Soputan, Kabupaten
Minahasa, Sulawesi Utara
Prov 1.1447 124.7556 + +
BSI0148 NE celebensis
Soputan, Kabupaten
Minahasa, Sulawesi Utara
Prov 1.1447 124.7556 + +
BSI0150 NE celebensis
Soputan, Kabupaten
Minahasa, Sulawesi Utara
Prov 1.1447 124.7556 +
BSI0151 NE celebensis
Soputan, Kabupaten
Minahasa, Sulawesi Utara
Prov 1.1447 124.7556 + +
BSI0152 NE celebensis Soputan 1.1483 124.7789
BSI0153 NE celebensis Soputan 1.1483 124.7789 + +
BSI0748 NW celebensis
Desa Buladu, Kabupaten
Gorontalo, Gorontalo
Prov 0.9759 122.5058
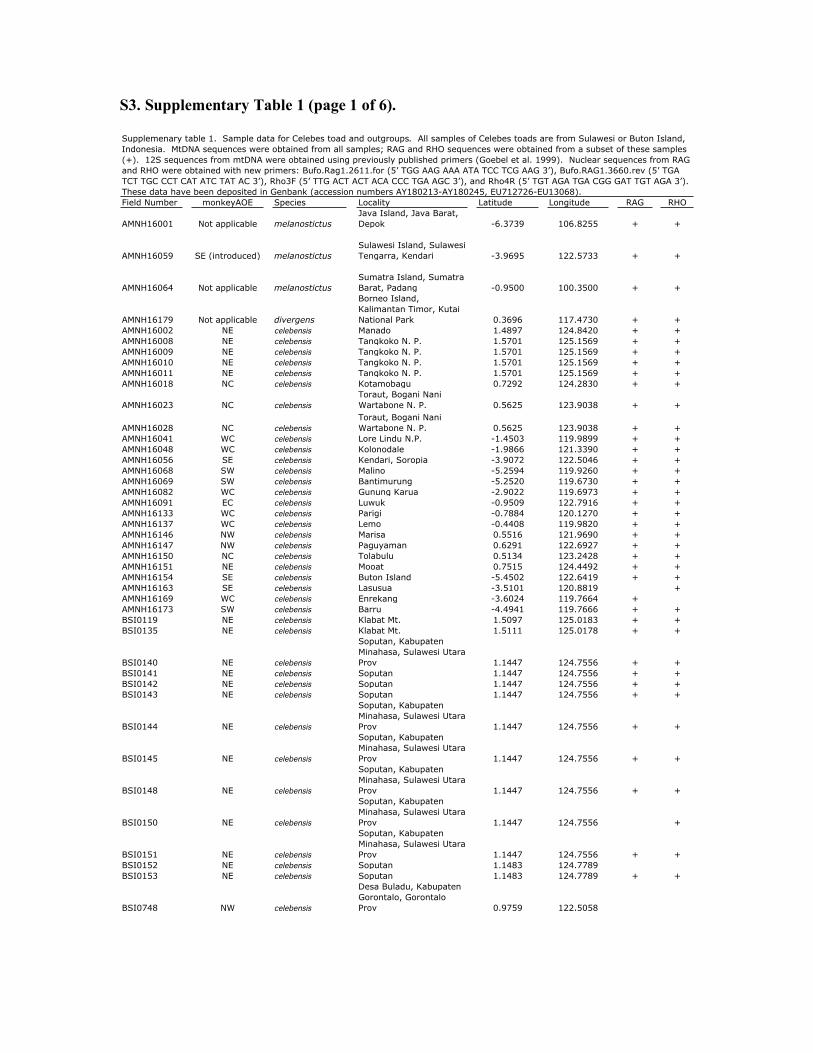
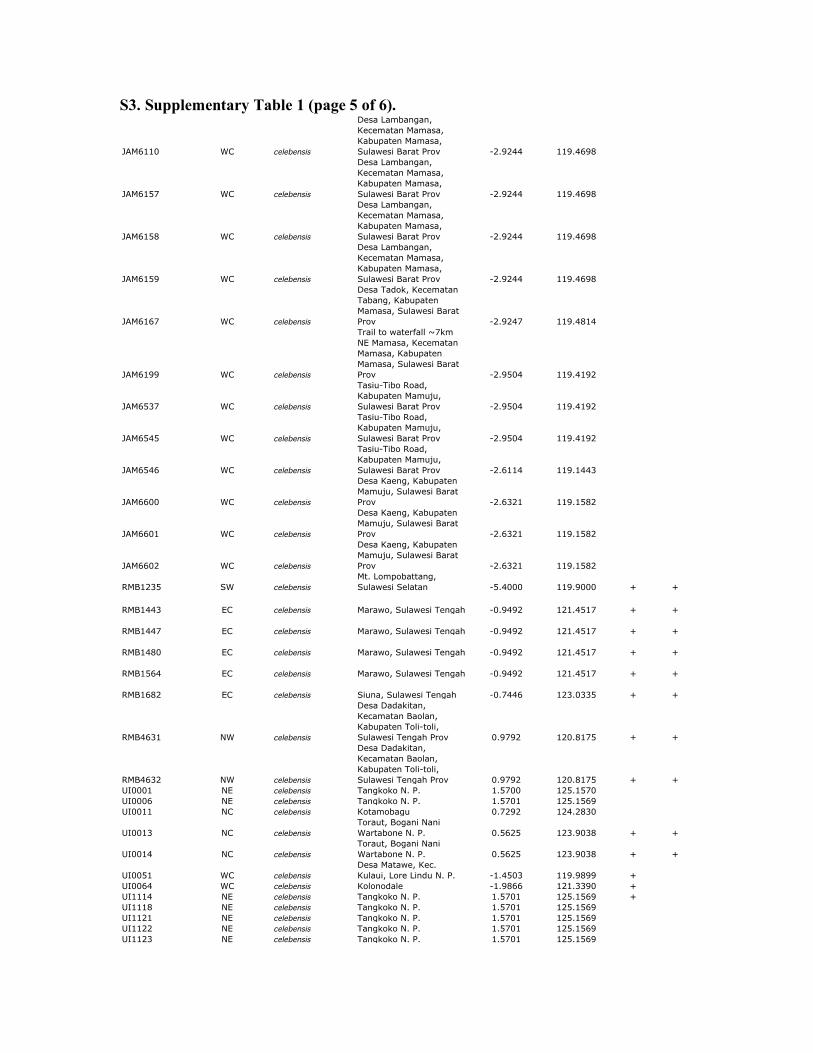
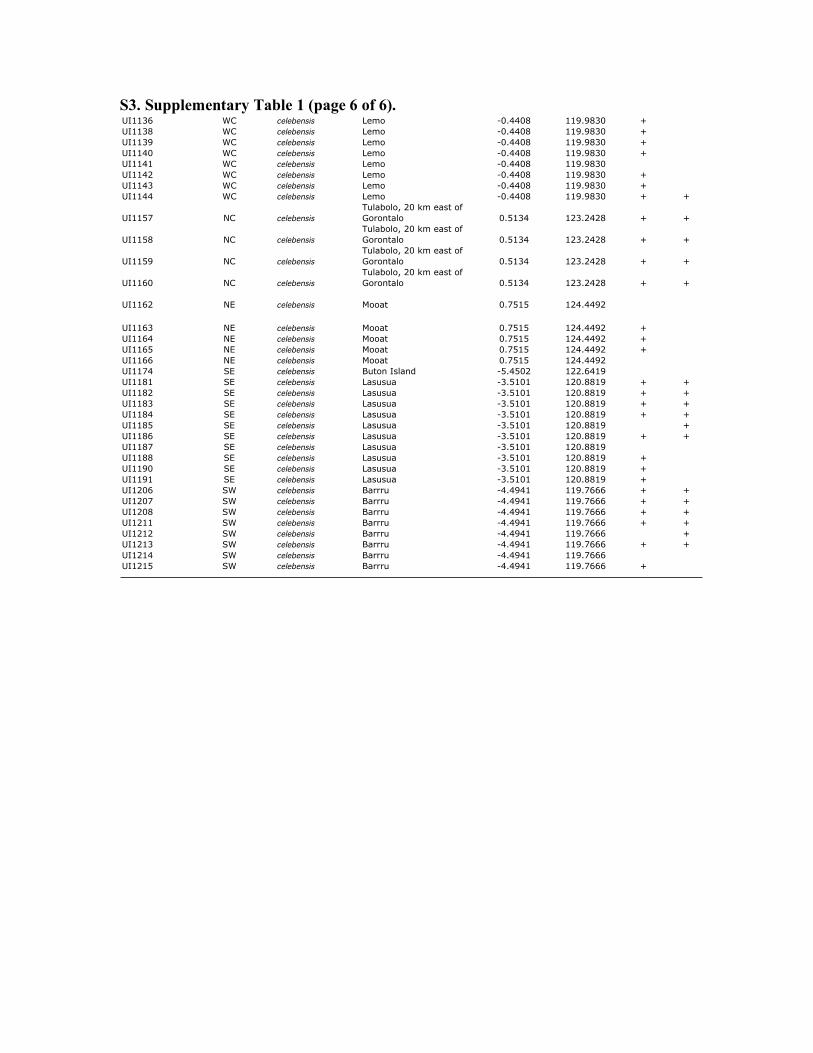
Supplemenary table 1. Sample data for Celebes toad and outgroups. All samples of Celebes toads are from Sulawesi or Buton Island,
Indonesia. MtDNA sequences were obtained from all samples; RAG and RHO sequences were obtained from a subset of these samples
(+). 12S sequences from mtDNA were obtained using previously published primers (Goebel et al. 1999). Nuclear sequences from RAG
and RHO were obtained with new primers: Bufo.Rag1.2611.for (5’ TGG AAG AAA ATA TCC TCG AAG 3’), Bufo.RAG1.3660.rev (5’ TGA
TCT TGC CCT CAT ATC TAT AC 3’), Rho3F (5’ TTG ACT ACT ACA CCC TGA AGC 3’), and Rho4R (5’ TGT AGA TGA CGG GAT TGT AGA 3’).
These data have been deposited in Genbank (accession numbers AY180213-AY180245, EU712726-EU13068).
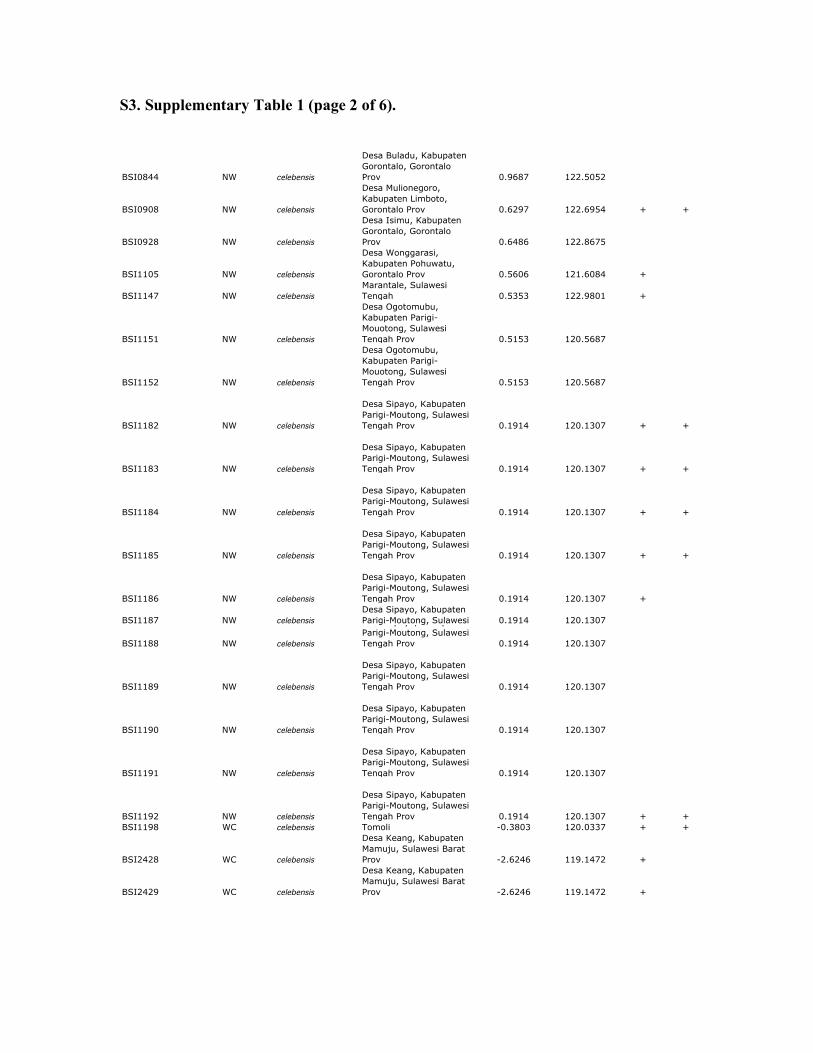
S3. Supplementary Table 1 (page 2 of 6).
BSI0844 NW celebensis
Desa Buladu, Kabupaten
Gorontalo, Gorontalo
Prov 0.9687 122.5052
BSI0908 NW celebensis
Desa Mulionegoro,
Kabupaten Limboto,
Gorontalo Prov 0.6297 122.6954 + +
BSI0928 NW celebensis
Desa Isimu, Kabupaten
Gorontalo, Gorontalo
Prov 0.6486 122.8675
BSI1105 NW celebensis
Desa Wonggarasi,
Kabupaten Pohuwatu,
Gorontalo Prov 0.5606 121.6084 +
BSI1147 NW celebensis
Marantale, Sulawesi
Tengah 0.5353 122.9801 +
BSI1151 NW celebensis
Desa Ogotomubu,
Kabupaten Parigi-
Mouotong, Sulawesi
Tengah Prov 0.5153 120.5687
BSI1152 NW celebensis
Desa Ogotomubu,
Kabupaten Parigi-
Mouotong, Sulawesi
Tengah Prov 0.5153 120.5687
BSI1182 NW celebensis
Desa Sipayo, Kabupaten
Parigi-Moutong, Sulawesi
Tengah Prov 0.1914 120.1307 + +
BSI1183 NW celebensis
Desa Sipayo, Kabupaten
Parigi-Moutong, Sulawesi
Tengah Prov 0.1914 120.1307 + +
BSI1184 NW celebensis
Desa Sipayo, Kabupaten
Parigi-Moutong, Sulawesi
Tengah Prov 0.1914 120.1307 + +
BSI1185 NW celebensis
Desa Sipayo, Kabupaten
Parigi-Moutong, Sulawesi
Tengah Prov 0.1914 120.1307 + +
BSI1186 NW celebensis
Desa Sipayo, Kabupaten
Parigi-Moutong, Sulawesi
Tengah Prov 0.1914 120.1307 +
BSI1187 NW celebensis
Desa Sipayo, Kabupaten
Parigi-Moutong, Sulawesi 0.1914 120.1307
BSI1188 NW celebensis
Desa Sipayo, Kabupaten
Parigi-Moutong, Sulawesi
Tengah Prov 0.1914 120.1307
BSI1189 NW celebensis
Desa Sipayo, Kabupaten
Parigi-Moutong, Sulawesi
Tengah Prov 0.1914 120.1307
BSI1190 NW celebensis
Desa Sipayo, Kabupaten
Parigi-Moutong, Sulawesi
Tengah Prov 0.1914 120.1307
BSI1191 NW celebensis
Desa Sipayo, Kabupaten
Parigi-Moutong, Sulawesi
Tengah Prov 0.1914 120.1307
BSI1192 NW celebensis
Desa Sipayo, Kabupaten
Parigi-Moutong, Sulawesi
Tengah Prov 0.1914 120.1307 + +
BSI1198 WC celebensis Tomoli -0.3803 120.0337 + +
BSI2428 WC celebensis
Desa Keang, Kabupaten
Mamuju, Sulawesi Barat
Prov -2.6246 119.1472 +
BSI2429 WC celebensis
Desa Keang, Kabupaten
Mamuju, Sulawesi Barat
Prov -2.6246 119.1472 +
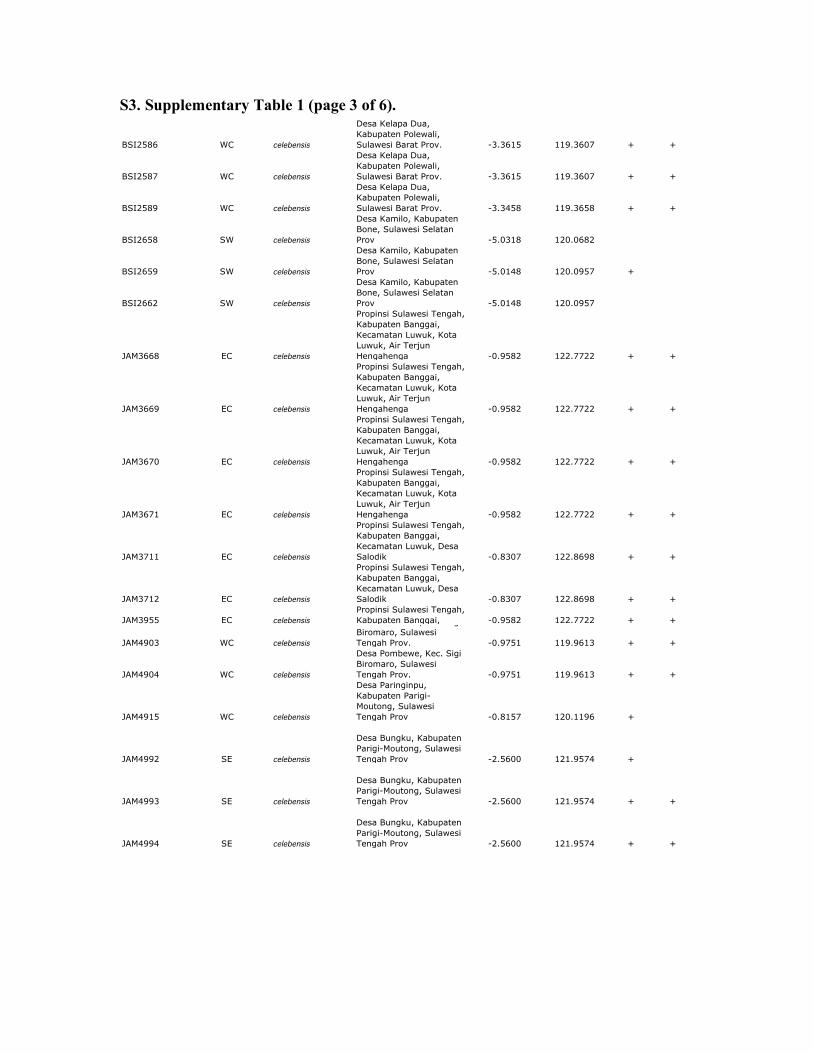
S3. Supplementary Table 1 (page 3 of 6).
BSI2586 WC celebensis
Desa Kelapa Dua,
Kabupaten Polewali,
Sulawesi Barat Prov. -3.3615 119.3607 + +
BSI2587 WC celebensis
Desa Kelapa Dua,
Kabupaten Polewali,
Sulawesi Barat Prov. -3.3615 119.3607 + +
BSI2589 WC celebensis
Desa Kelapa Dua,
Kabupaten Polewali,
Sulawesi Barat Prov. -3.3458 119.3658 + +
BSI2658 SW celebensis
Desa Kamilo, Kabupaten
Bone, Sulawesi Selatan
Prov -5.0318 120.0682
BSI2659 SW celebensis
Desa Kamilo, Kabupaten
Bone, Sulawesi Selatan
Prov -5.0148 120.0957 +
BSI2662 SW celebensis
Desa Kamilo, Kabupaten
Bone, Sulawesi Selatan
Prov -5.0148 120.0957
JAM3668 EC celebensis
Propinsi Sulawesi Tengah,
Kabupaten Banggai,
Kecamatan Luwuk, Kota
Luwuk, Air Terjun
Hengahenga -0.9582 122.7722 + +
JAM3669 EC celebensis
Propinsi Sulawesi Tengah,
Kabupaten Banggai,
Kecamatan Luwuk, Kota
Luwuk, Air Terjun
Hengahenga -0.9582 122.7722 + +
JAM3670 EC celebensis
Propinsi Sulawesi Tengah,
Kabupaten Banggai,
Kecamatan Luwuk, Kota
Luwuk, Air Terjun
Hengahenga -0.9582 122.7722 + +
JAM3671 EC celebensis
Propinsi Sulawesi Tengah,
Kabupaten Banggai,
Kecamatan Luwuk, Kota
Luwuk, Air Terjun
Hengahenga -0.9582 122.7722 + +
JAM3711 EC celebensis
Propinsi Sulawesi Tengah,
Kabupaten Banggai,
Kecamatan Luwuk, Desa
Salodik -0.8307 122.8698 + +
JAM3712 EC celebensis
Propinsi Sulawesi Tengah,
Kabupaten Banggai,
Kecamatan Luwuk, Desa
Salodik -0.8307 122.8698 + +
JAM3955 EC celebensis
Propinsi Sulawesi Tengah,
Kabupaten Banggai, -0.9582 122.7722 + +
JAM4903 WC celebensis
Desa Pombewe, Kec. Sigi
Biromaro, Sulawesi
Tengah Prov. -0.9751 119.9613 + +
JAM4904 WC celebensis
Desa Pombewe, Kec. Sigi
Biromaro, Sulawesi
Tengah Prov. -0.9751 119.9613 + +
JAM4915 WC celebensis
Desa Paringinpu,
Kabupaten Parigi-
Moutong, Sulawesi
Tengah Prov -0.8157 120.1196 +
JAM4992 SE celebensis
Desa Bungku, Kabupaten
Parigi-Moutong, Sulawesi
Tengah Prov -2.5600 121.9574 +
JAM4993 SE celebensis
Desa Bungku, Kabupaten
Parigi-Moutong, Sulawesi
Tengah Prov -2.5600 121.9574 + +
JAM4994 SE celebensis
Desa Bungku, Kabupaten
Parigi-Moutong, Sulawesi
Tengah Prov -2.5600 121.9574 + +
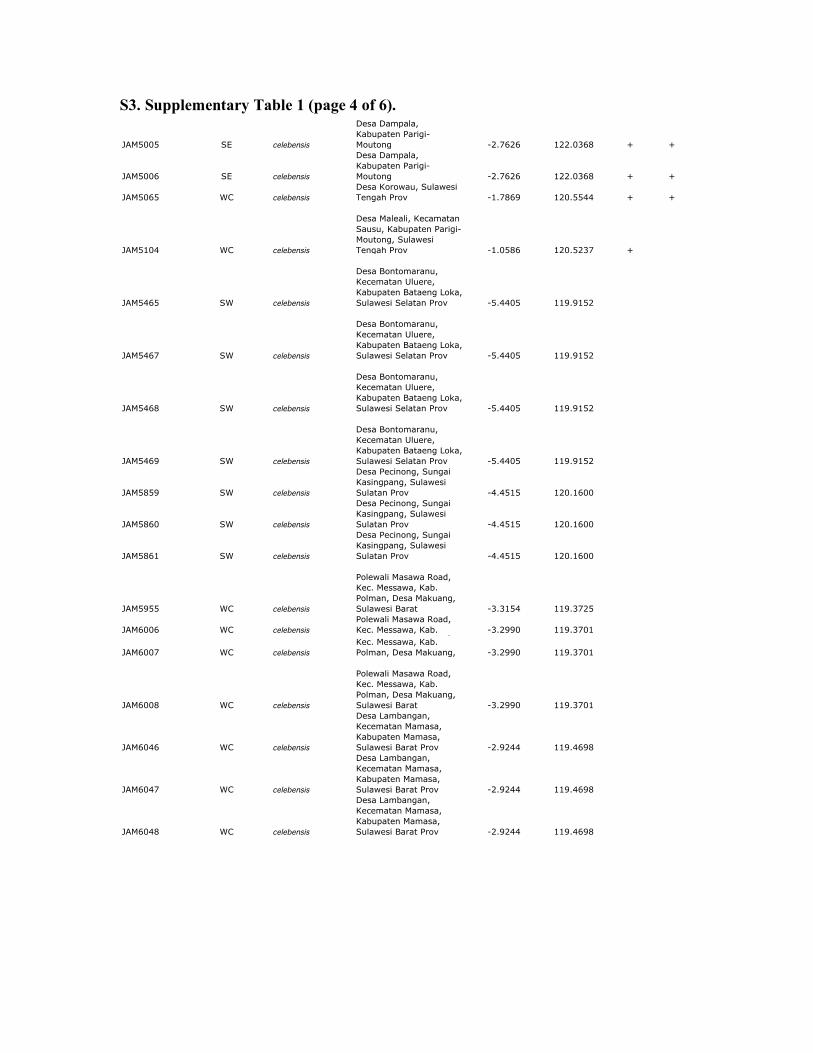
S3. Supplementary Table 1 (page 4 of 6).
JAM5005 SE celebensis
Desa Dampala,
Kabupaten Parigi-
Moutong -2.7626 122.0368 + +
JAM5006 SE celebensis
Desa Dampala,
Kabupaten Parigi-
Moutong -2.7626 122.0368 + +
JAM5065 WC celebensis
Desa Korowau, Sulawesi
Tengah Prov -1.7869 120.5544 + +
JAM5104 WC celebensis
Desa Maleali, Kecamatan
Sausu, Kabupaten Parigi-
Moutong, Sulawesi
Tengah Prov -1.0586 120.5237 +
JAM5465 SW celebensis
Desa Bontomaranu,
Kecematan Uluere,
Kabupaten Bataeng Loka,
Sulawesi Selatan Prov -5.4405 119.9152
JAM5467 SW celebensis
Desa Bontomaranu,
Kecematan Uluere,
Kabupaten Bataeng Loka,
Sulawesi Selatan Prov -5.4405 119.9152
JAM5468 SW celebensis
Desa Bontomaranu,
Kecematan Uluere,
Kabupaten Bataeng Loka,
Sulawesi Selatan Prov -5.4405 119.9152
JAM5469 SW celebensis
Desa Bontomaranu,
Kecematan Uluere,
Kabupaten Bataeng Loka,
Sulawesi Selatan Prov -5.4405 119.9152
JAM5859 SW celebensis
Desa Pecinong, Sungai
Kasingpang, Sulawesi
Sulatan Prov -4.4515 120.1600
JAM5860 SW celebensis
Desa Pecinong, Sungai
Kasingpang, Sulawesi
Sulatan Prov -4.4515 120.1600
JAM5861 SW celebensis
Desa Pecinong, Sungai
Kasingpang, Sulawesi
Sulatan Prov -4.4515 120.1600
JAM5955 WC celebensis
Polewali Masawa Road,
Kec. Messawa, Kab.
Polman, Desa Makuang,
Sulawesi Barat -3.3154 119.3725
JAM6006 WC celebensis
Polewali Masawa Road,
Kec. Messawa, Kab. -3.2990 119.3701
JAM6007 WC celebensis
Polewali Masawa Road,
Kec. Messawa, Kab.
Polman, Desa Makuang, -3.2990 119.3701
JAM6008 WC celebensis
Polewali Masawa Road,
Kec. Messawa, Kab.
Polman, Desa Makuang,
Sulawesi Barat -3.2990 119.3701
JAM6046 WC celebensis
Desa Lambangan,
Kecematan Mamasa,
Kabupaten Mamasa,
Sulawesi Barat Prov -2.9244 119.4698
JAM6047 WC celebensis
Desa Lambangan,
Kecematan Mamasa,
Kabupaten Mamasa,
Sulawesi Barat Prov -2.9244 119.4698
JAM6048 WC celebensis
Desa Lambangan,
Kecematan Mamasa,
Kabupaten Mamasa,
Sulawesi Barat Prov -2.9244 119.4698
S3. Supplementary Table 1 (page 5 of 6).
JAM6110 WC celebensis
Desa Lambangan,
Kecematan Mamasa,
Kabupaten Mamasa,
Sulawesi Barat Prov -2.9244 119.4698
JAM6157 WC celebensis
Desa Lambangan,
Kecematan Mamasa,
Kabupaten Mamasa,
Sulawesi Barat Prov -2.9244 119.4698
JAM6158 WC celebensis
Desa Lambangan,
Kecematan Mamasa,
Kabupaten Mamasa,
Sulawesi Barat Prov -2.9244 119.4698
JAM6159 WC celebensis
Desa Lambangan,
Kecematan Mamasa,
Kabupaten Mamasa,
Sulawesi Barat Prov -2.9244 119.4698
JAM6167 WC celebensis
Desa Tadok, Kecematan
Tabang, Kabupaten
Mamasa, Sulawesi Barat
Prov -2.9247 119.4814
JAM6199 WC celebensis
Trail to waterfall ~7km
NE Mamasa, Kecematan
Mamasa, Kabupaten
Mamasa, Sulawesi Barat
Prov -2.9504 119.4192
JAM6537 WC celebensis
Tasiu-Tibo Road,
Kabupaten Mamuju,
Sulawesi Barat Prov -2.9504 119.4192
JAM6545 WC celebensis
Tasiu-Tibo Road,
Kabupaten Mamuju,
Sulawesi Barat Prov -2.9504 119.4192
JAM6546 WC celebensis
Tasiu-Tibo Road,
Kabupaten Mamuju,
Sulawesi Barat Prov -2.6114 119.1443
JAM6600 WC celebensis
Desa Kaeng, Kabupaten
Mamuju, Sulawesi Barat
Prov -2.6321 119.1582
JAM6601 WC celebensis
Desa Kaeng, Kabupaten
Mamuju, Sulawesi Barat
Prov -2.6321 119.1582
JAM6602 WC celebensis
Desa Kaeng, Kabupaten
Mamuju, Sulawesi Barat
Prov -2.6321 119.1582
RMB1235 SW celebensis
Mt. Lompobattang,
Sulawesi Selatan -5.4000 119.9000 + +
RMB1443 EC celebensis Marawo, Sulawesi Tengah -0.9492 121.4517 + +
RMB1447 EC celebensis Marawo, Sulawesi Tengah -0.9492 121.4517 + +
RMB1480 EC celebensis Marawo, Sulawesi Tengah -0.9492 121.4517 + +
RMB1564 EC celebensis Marawo, Sulawesi Tengah -0.9492 121.4517 + +
RMB1682 EC celebensis Siuna, Sulawesi Tengah -0.7446 123.0335 + +
RMB4631 NW celebensis
Desa Dadakitan,
Kecamatan Baolan,
Kabupaten Toli-toli,
Sulawesi Tengah Prov 0.9792 120.8175 + +
RMB4632 NW celebensis
Desa Dadakitan,
Kecamatan Baolan,
Kabupaten Toli-toli,
Sulawesi Tengah Prov 0.9792 120.8175 + +
UI0001 NE celebensis Tangkoko N. P. 1.5700 125.1570
UI0006 NE celebensis Tangkoko N. P. 1.5701 125.1569
UI0011 NC celebensis Kotamobagu 0.7292 124.2830
UI0013 NC celebensis
Toraut, Bogani Nani
Wartabone N. P. 0.5625 123.9038 + +
UI0014 NC celebensis
Toraut, Bogani Nani
Wartabone N. P. 0.5625 123.9038 + +
UI0051 WC celebensis
Desa Matawe, Kec.
Kulaui, Lore Lindu N. P. -1.4503 119.9899 +
UI0064 WC celebensis Kolonodale -1.9866 121.3390 +
UI1114 NE celebensis Tangkoko N. P. 1.5701 125.1569 +
UI1118 NE celebensis Tangkoko N. P. 1.5701 125.1569
UI1121 NE celebensis Tangkoko N. P. 1.5701 125.1569
UI1122 NE celebensis Tangkoko N. P. 1.5701 125.1569
UI1123 NE celebensis Tangkoko N. P. 1.5701 125.1569
S3. Supplementary Table 1 (page 6 of 6). UI1136 WC celebensis Lemo -0.4408 119.9830 +
UI1138 WC celebensis Lemo -0.4408 119.9830 +
UI1139 WC celebensis Lemo -0.4408 119.9830 +
UI1140 WC celebensis Lemo -0.4408 119.9830 +
UI1141 WC celebensis Lemo -0.4408 119.9830
UI1142 WC celebensis Lemo -0.4408 119.9830 +
UI1143 WC celebensis Lemo -0.4408 119.9830 +
UI1144 WC celebensis Lemo -0.4408 119.9830 + +
UI1157 NC celebensis
Tulabolo, 20 km east of
Gorontalo 0.5134 123.2428 + +
UI1158 NC celebensis
Tulabolo, 20 km east of
Gorontalo 0.5134 123.2428 + +
UI1159 NC celebensis
Tulabolo, 20 km east of
Gorontalo 0.5134 123.2428 + +
UI1160 NC celebensis
Tulabolo, 20 km east of
Gorontalo 0.5134 123.2428 + +
UI1162 NE celebensis Mooat 0.7515 124.4492
UI1163 NE celebensis Mooat 0.7515 124.4492 +
UI1164 NE celebensis Mooat 0.7515 124.4492 +
UI1165 NE celebensis Mooat 0.7515 124.4492 +
UI1166 NE celebensis Mooat 0.7515 124.4492
UI1174 SE celebensis Buton Island -5.4502 122.6419
UI1181 SE celebensis Lasusua -3.5101 120.8819 + +
UI1182 SE celebensis Lasusua -3.5101 120.8819 + +
UI1183 SE celebensis Lasusua -3.5101 120.8819 + +
UI1184 SE celebensis Lasusua -3.5101 120.8819 + +
UI1185 SE celebensis Lasusua -3.5101 120.8819 +
UI1186 SE celebensis Lasusua -3.5101 120.8819 + +
UI1187 SE celebensis Lasusua -3.5101 120.8819
UI1188 SE celebensis Lasusua -3.5101 120.8819 +
UI1190 SE celebensis Lasusua -3.5101 120.8819 +
UI1191 SE celebensis Lasusua -3.5101 120.8819 +
UI1206 SW celebensis Barrru -4.4941 119.7666 + +
UI1207 SW celebensis Barrru -4.4941 119.7666 + +
UI1208 SW celebensis Barrru -4.4941 119.7666 + +
UI1211 SW celebensis Barrru -4.4941 119.7666 + +
UI1212 SW celebensis Barrru -4.4941 119.7666 +
UI1213 SW celebensis Barrru -4.4941 119.7666 + +
UI1214 SW celebensis Barrru -4.4941 119.7666
UI1215 SW celebensis Barrru -4.4941 119.7666 +
S4. Supplementary Table 2
NE NC NW CW CE SW SE
NE -
NC 0.50131 -
NW 0.88768 0.85921 -
CW 0.81706 0.79392 0.33052 -
CE 0.92242 0.92091 0.62599 0.52121 -
SW 0.95728 0.98035 0.67503 0.59241 0.86597 -
SE 0.92764 0.92818 0.64889 0.5322 0.74396 0.8087 -
NE NC NW CW CE SW SE
NE - 0.2688 0.8220 0.7282 0.7863 0.6022 0.5563
NC 0.1688 - 0.4109 0.3482 0.4380 0.1737 0.2370
NW 0.4803 0.3083 - 0.0704 0.6988 0.1909 0.3898
CW 0.4299 0.2828 0.01815* - 0.4391 0.1237 0.4050
CE 0.7140 0.6424 0.2815 0.4256 - 0.3453 0.3007
SW 0.6523 0.5560 0.4225 0.2218 0.8271 - 0.2663
SE 0.6610 0.5793 0.4269 0.2267 0.8095 0.01431* -
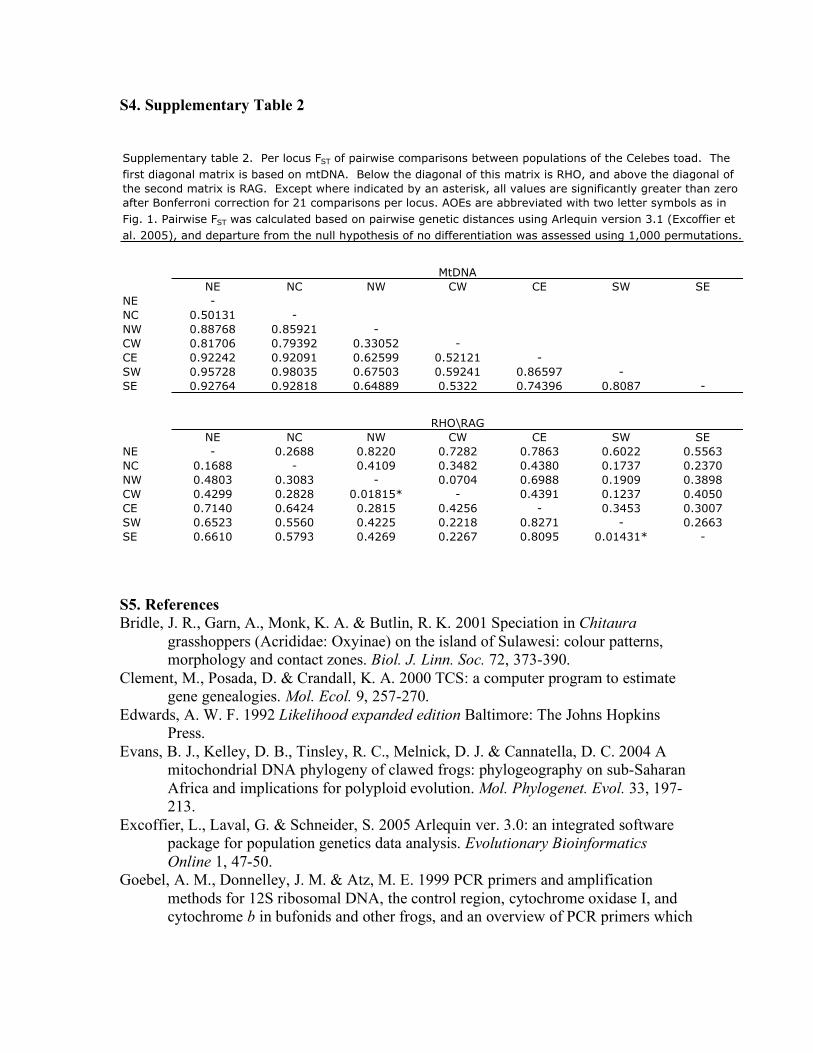
Supplementary table 2. Per locus FST of pairwise comparisons between populations of the Celebes toad. The
first diagonal matrix is based on mtDNA. Below the diagonal of this matrix is RHO, and above the diagonal of
the second matrix is RAG. Except where indicated by an asterisk, all values are significantly greater than zero
after Bonferroni correction for 21 comparisons per locus. AOEs are abbreviated with two letter symbols as in
Fig. 1. Pairwise FST was calculated based on pairwise genetic distances using Arlequin version 3.1 (Excoffier et
al. 2005), and departure from the null hypothesis of no differentiation was assessed using 1,000 permutations.
MtDNA
RHO\RAG
S5. References Bridle, J. R., Garn, A., Monk, K. A. & Butlin, R. K. 2001 Speciation in Chitaura
grasshoppers (Acrididae: Oxyinae) on the island of Sulawesi: colour patterns, morphology and contact zones. Biol. J. Linn. Soc. 72, 373-390.
Clement, M., Posada, D. & Crandall, K. A. 2000 TCS: a computer program to estimate gene genealogies. Mol. Ecol. 9, 257-270.
Edwards, A. W. F. 1992 Likelihood expanded edition Baltimore: The Johns Hopkins Press.
Evans, B. J., Kelley, D. B., Tinsley, R. C., Melnick, D. J. & Cannatella, D. C. 2004 A mitochondrial DNA phylogeny of clawed frogs: phylogeography on sub-Saharan Africa and implications for polyploid evolution. Mol. Phylogenet. Evol. 33, 197-213.
Excoffier, L., Laval, G. & Schneider, S. 2005 Arlequin ver. 3.0: an integrated software package for population genetics data analysis. Evolutionary Bioinformatics Online 1, 47-50.
Goebel, A. M., Donnelley, J. M. & Atz, M. E. 1999 PCR primers and amplification methods for 12S ribosomal DNA, the control region, cytochrome oxidase I, and cytochrome b in bufonids and other frogs, and an overview of PCR primers which

have amplified DNA in amphibians successfully. Mol. Phylogenet. Evol. 11, 163-199.
Scheet, P. & Stephens, M. 2006 A fast and flexible statistical model for large-scale population genotype data: Applications to inferring missing genotypes and haplotypic phase. Am. J. Hum. Gen. 78, 629-644.