Embed Size (px)
Citation preview
Copyright 0 1993 by the Genetics Society of America
Empirical Tests of Some Predictions From Coalescent Theory With Applications to Intraspecific Phylogeny Reconstruction
Keith A. Crandall**? and Alan R. Templeton"
*Department of Biology and +Department of Mathematics, Washington University, S t . Louis, Missouri 63130-4899 Manuscript received September 15, 1992 Accepted for publication March 18, 1993
ABSTRACT Empirical data sets of intraspecific restriction site polymorphism in Drosophila have been gathered
in order to test hypotheses derived from coalescent theory. Three main ideas are tested: ( 1 ) haplotype frequency in the sample contains information on the topological position of a given haplotype in a cladogram, (2) the frequency of a haplotype is related to the number of mutational connections to other haplotypes in the cladogram and (3) geographic location can be used to infer topological positioning of haplotypes in a cladogram. These relationships can then be used to better estimate intraspecific phylogenies in two ways: ( 1 ) rooting the phylogeny and (2) resolving ambiguities in a cladogram. This information will allow one to reduce the number of alternative phylogenies and incorporate the uncertainties involved in reconstructing intraspecific phylogenies into subsequent analyses that depend heavily on the topology of the
R ECENTLY, there has been interest in estimating phylogenies within-species for purposes as di-
verse as the calculation of migration rates (SLATKIN and MADDISON 1989) and the examination of associ- ations between phenotype and biochemical/physiolog- ical functions (TEMPLETON, BOERWINKLE and SING 1987). Yet the theoretical tools for intraspecific phy- logeny reconstruction are scarce. Most empirical anal- yses rely on methods designed for estimating between- species phylogenies. Subsequent analyses based on the phylogenetic relationships can be handicapped by the lack of resolving power of between-species methods. Here we test hypotheses relating to haplotype fre- quency and the topological relationship of haplotypes in order to refine estimates of intraspecific phylog- enies. T o d o this, we utilize ideas from coalescent theory.
Coalescent theory was formally put forth in two seminal papers by KINCMAN (1982a,b). In these pa- pers, KINGMAN derives a mathematical theory that describes the genealogical process of a sample of se- lectively neutral genes from a population, looking backward in time. This work has generated much subsequent discussion of the properties and applica- tions of coalescent theory [for reviews, see TAVAR~ (1984), EWENS (1990) and HUDSON (1990)l. Coinci- dent with the development of coalescent theory, there has been an increase in within-species molecular data sets resulting from the development and availability of recombinant DNA technologies. For example, KREITMAN'S (1 983) classic paper gave DNA sequence variants at the population level. While within-species sequence data are still scarce, restriction site data are
Genetics 134: 959-969 (July, 1993)
tree.
abundant (e .g . , see Table 2). These studies and others have described levels of genetic variation in Drosoph- ila at a number of loci. This study utilizes this wealth of empirical data to test some predictions of coalescent theory.
Three main questions will be addressed. (1) Can we use haplotype frequency information to refine the topological position of a given haplotype in a clado- gram? (2) Is the frequency of a haplotype related to the number of mutational connections to other hap- lotypes within the cladogram? (3) Can geographic location be used to infer the topological position of a rare haplotype in a cladogram? Our results, in addition to other predictions from population genetic theory, have implications in allelic phylogeny reconstruction in two major areas: (1) in rooting the phylogeny and (2) in resolving ambiguities in the phylogeny. The predictions discussed above and the a posteriori prob- abilities that we establish can be used as a priori probabilities in these two areas of intraspecific phylo- geny reconstruction. This will allow one to reduce the number of alternative phylogenies and incorporate the uncertainties involved in reconstructing intraspe- cific phylogenies into subsequent analyses which de- pend heavily on the topology of the tree.
THEORY
T o test predictions of coalescent theory, we first describe the general theory of the n-coalescent with mutation. We then derive certain expectations relat- ing to this process. Consider a Fisher-Wright model of evolution for a sample of n neutral genes from a population (by n genes we mean n samples from a
960
a) Genealogy
K. A. Crandall a] nd A. R. Templeton
Past
* I 2 3 4 5 6 7 8 Y IO 11 12 I3 14 15
A B C D E F G H
b) Lines of Descent
A * h h h i I I 2 3 B 4 5 6 c 7 8 D E Y 10 11 A F 12 13 hi 1 4 1 5
G H
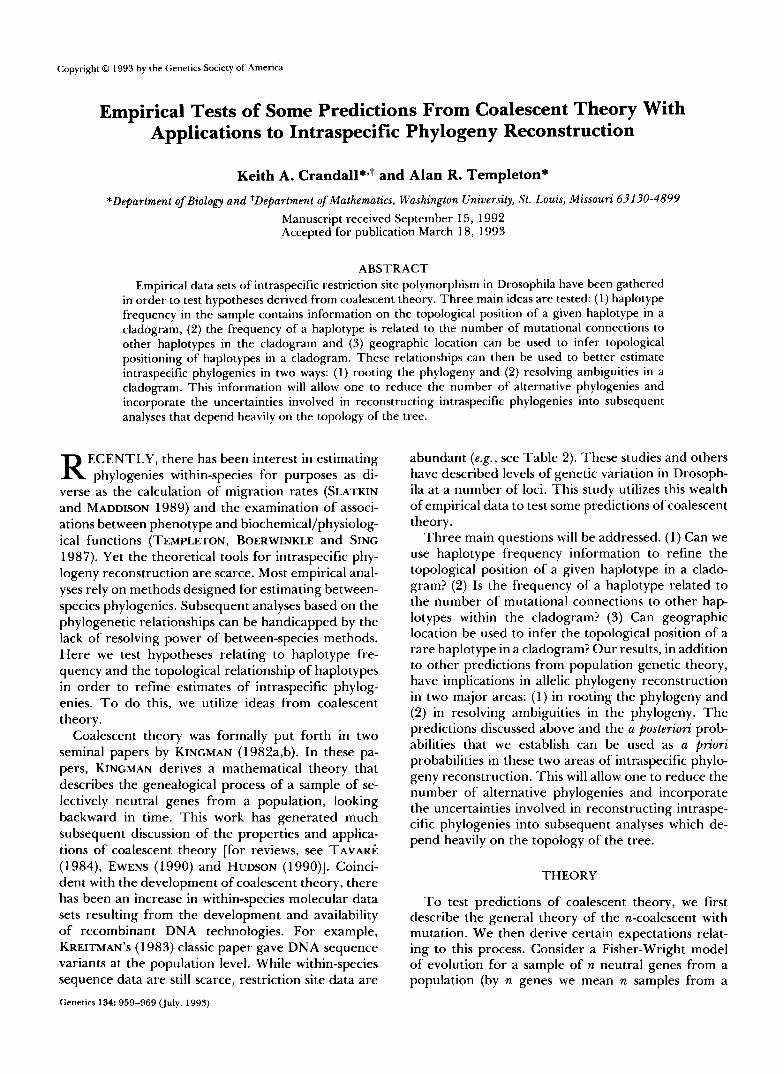
FIGURE 1.-The partitioning of coalescent events: (a) the ge- nealogy and (b) the lines of descent. * represents a defining muta- tion and % represents previous mutations that are not defining events but are important in establishing the allelic phylogeny. Genes are represented by the numbers 1-15 and alleles (or haplotypes) are represented by the letters A-H.
particular gene region). Assume that n << 2N where N is the inbreeding effective size of the population and N >> 1. These assumptions imply that the proba- bility [ 1/(2N)] of any particular pair of genes coalesc- ing in a given generation is very small. In particular, multiple coalescent events and multiple mutational events in the same generation in the ancestry of a sample of n genes can be ignored (KINGMAN 1982b).
Under this model, there are two possible defining events in the coalescent process: either a coalescence or a mutation. By a defining event, we mean either an event that results in a reduction in the number of genes looking back in time, ie., a coalescence, or a reduction in the number of allelic states looking back in time, i . e . , the first mutation going back in time. Throughout this paper we use the terms allele, allelic class, and haplotype synonymously to mean a set of cn genes within which there is no observable varia- tion. Figure l a gives an example of genes (labeled 1- 15) and the defining events in their ancestors. Figure l b shows the lines of descent of the allelic classes (labeled A-H) and their originating mutations. Any mutation is assumed to produce a completely novel haplotype ( i e . , the infinite alleles model) as is reason-
T(3) 5 = 2
T(Z) 5 = 3
Present 1 2 3 4 5
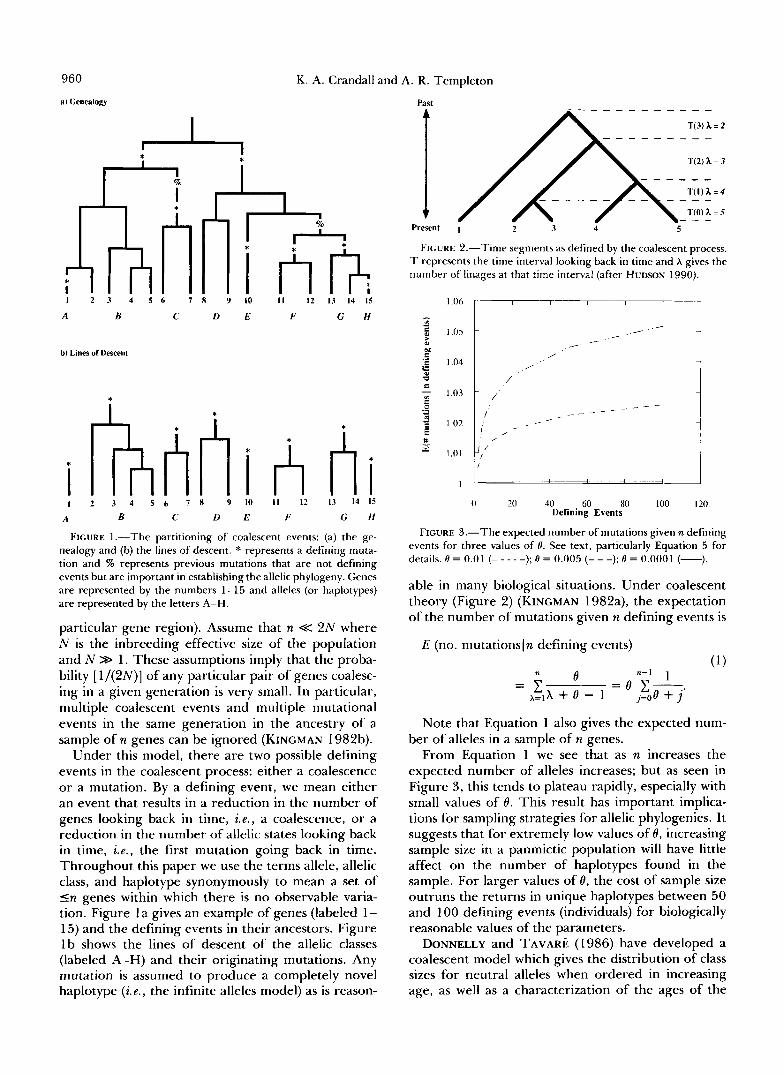
FIGURE 2.-Time segments as defined by the coalescent process. T represents the time interval looking back in time and h gives the number of linages at that time interval (after HUDSON 1990).
1 .Oh I I I I I 1
F g " 1.04
U
It 1 . 0 1
0 20 40 60 80 100 120 Defining Events
FIGURE 3.-The expected number of mutations given n defining events for three values of 8. See text, particularly Equation 5 for details. 8 = 0.01 (- - - - -); 8 = 0.005 (- - -); 8 = 0,0001 (-).
able in many biological situations. Under coalescent theory (Figure 2) (KINGMAN 1982a), the expectation of the number of mutations given n defining events is
E (no. mutationsln defining events) (1)
" 8 n- 1 1 = c = 8 E-. x=lx + 8 - 1 j=oe
Note that Equation 1 also gives the expected num- ber of alleles in a sample of n genes.
From Equation 1 we see that as n increases the expected number of alleles increases; but as seen in Figure 3, this tends to plateau rapidly, especially with small values of 8. This result has important implica- tions for sampling strategies for allelic phylogenies. It suggests that for extremely low values of 8, increasing sample size in a panmictic population will have little affect on the number of haplotypes found in the sample. For larger values of 8, the cost of sample size outruns the returns in unique haplotypes between 50 and 100 defining events (individuals) for biologically reasonable values of the parameters.
DONNELLY and T A V A R ~ (1986) have developed a coalescent model which gives the distribution of class sizes for neutral alleles when ordered in increasing age, as well as a characterization of the ages of the
Applications of Coalescent Theory 96 1
alleles. The results give specific relationships between ages of alleles and allele frequencies. Two main results follow from their discussion which are of particular interest. The first is the well established relationship (WATTERSON 1976; KELLY 1977; WATTERSON and GUESS 1977; DONNELLY and TAVARE 1986) that the probability that an allele represented ni times in a sample of size n is the oldest allele in the sample is niln,
P (allele i is the oldest allele) = ni/n. (2)
A second result of DONNELLY and TAVAR~ (1986) is that the expected rank of alleles by age is equal to the rank of alleles by frequency; that is,
E (rank in age of allele i) = C(ni/n), (3)
where C is a normalizing constant depending on the number of alleles. An interesting note by TAVAR~ (1984; due to KELLY 1977) is that the absolute age of the oldest allele is independent of its frequency. We will now show how these results can lead to a more probabilistic framework from which one can refine estimates of intraspecific phylogenies.
MATERIALS AND METHODS
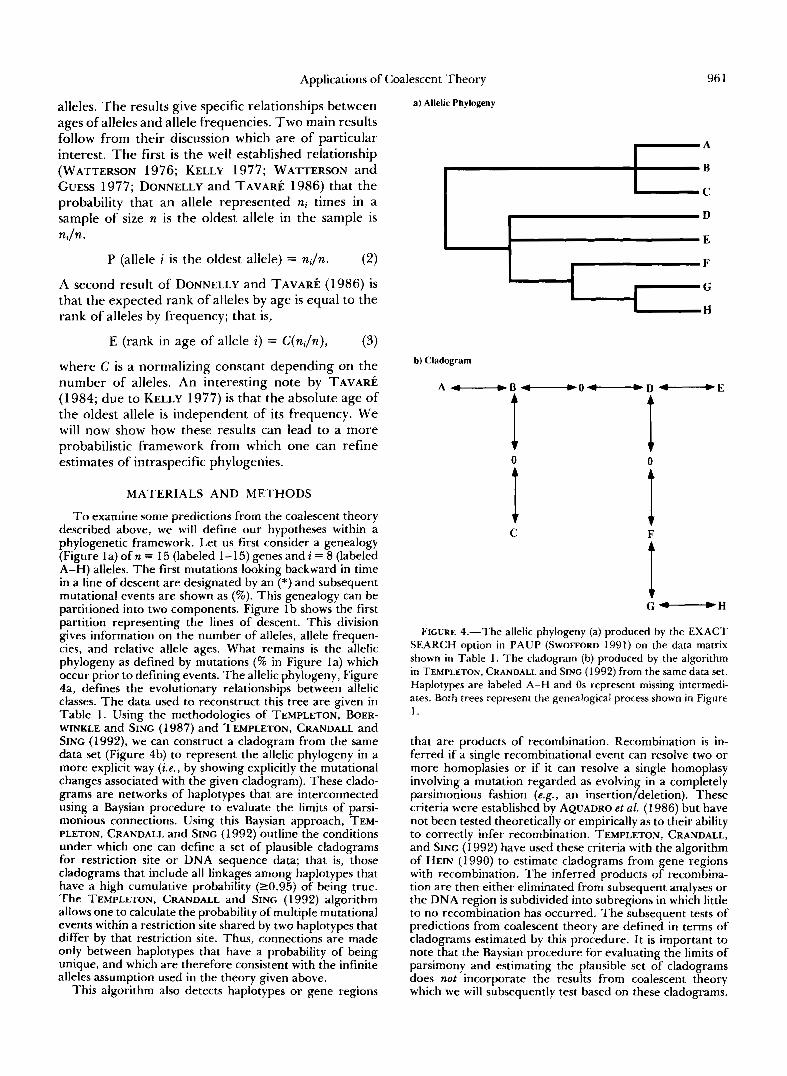
To examine some predictions from the coalescent theory described above, we will define our hypotheses within a phylogenetic framework. Let us first consider a genealogy (Figure la) of n = 15 (labeled 1-1 5) genes and i = 8 (labeled A-H) alleles. The first mutations looking backward in time in a line of descent are designated by an (*) and subsequent mutational events are shown as (%). This genealogy can be partitioned into two components. Figure l b shows the first partition representing the lines of descent. This division gives information on the number of alleles, allele frequen- cies, and relative allele ages. What remains is the allelic phylogeny as defined by mutations (% in Figure la) which occur prior to defining events. The allelic phylogeny, Figure 4a, defines the evolutionary relationships between allelic classes. The data used to reconstruct this tree are given in Table 1. Using the methodologies of TEMPLETON, BOER- WINKLE and SING (1 987) and TEMPLETON, CRANDALL and SING (1992), we can construct a cladogram from the same data set (Figure 4b) to represent the allelic phylogeny in a more explicit way ( i e . , by showing explicitly the mutational changes associated with the given cladogram). These clado- grams are networks of haplotypes that are interconnected using a Baysian procedure to evaluate the limits of parsi- monious connections. Using this Baysian approach, TEM- PLETON, CRANDALL and SING (1992) outline the conditions under which one can define a set of plausible cladograms for restriction site or DNA sequence data; that is, those cladograms that include all linkages among haplotypes that have a high cumulative probability (20.95) of being true. The TEMPLETON, CRANDALL and SING (1992) algorithm allows one to calculate the probability of multiple mutational events within a restriction site shared by two haplotypes that differ by that restriction site. Thus, connections are made only between haplotypes that have a probability of being unique, and which are therefore consistent with the infinite alleles assumption used in the theory given above.
This algorithm also detects haplotypes or gene regions
a) Allelic Phylogeny
IA IC
D
E
F
G
H I i
b) Cladogram
0 0
c F
t FIGURE 4.-The allelic phylogeny (a) produced by the EXACT
SEARCH option in PAUP (SWOFFORD 1991) on the data matrix shown in Table 1 . The cladogram (b) produced by the algorithm in TEMPLETON, CRANDALL and SING ( 1 992) from the same data set. Haplotypes are labeled A-H and Os represent missing intermedi- ates. Both trees represent the genealogica1 process shown in Figure 1.
that are products of recombination. Recombination is in- ferred if a single recombinational event can resolve two or more homoplasies or if it can resolve a single homoplasy involving a mutation regarded as evolving in a completely parsimonious fashion (e.g., an insertion/deletion). These criteria were established by AQUADRO et al. (1 986) but have not been tested theoretically or empirically as to their ability to correctly infer recombination. TEMPLETON, CRANDALL, and SING (1 992) have used these criteria with the algorithm of HEIN (1 990) to estimate cladograms from gene regions with recombination. The inferred products of recombina- tion are then either eliminated from subsequent analyses or the DNA region is subdivided into subregions in which little to no recombination has occurred. The subsequent tests of predictions from coalescent theory are defined in terms of cladograms estimated by this procedure. It is important to note that the Baysian procedure for evaluating the limits of parsimony and estimating the plausible set of cladograms does not incorporate the results from coalescent theory which we will subsequently test based on these cladograms.
962 K. A. Crandall and A. R. Templeton
TABLE 1
Data matrix for Figure 4
Haplotype Restriction site profile
A 1 1 0 0 0 0 0 0 0 0 B 0 1 0 0 0 0 0 0 0 0 C 0 1 1 1 0 0 0 0 0 0 D 0 0 0 0 1 0 0 0 0 0 E 0 0 0 0 1 1 0 0 0 0 F 0 0 0 0 1 0 1 0 0 1 G 0 0 0 0 1 0 1 1 0 1 H 0 0 0 0 1 0 1 1 1 1
Hypothetical data set used to calculate the trees in Figure 4. The data matrix describes the genealogy shown in Figure 1.
Also, to the extent that recombinational events are not detected through this procedure, the predictions of coales- cent theory will be weakened because recombination de- stroys historical associations. Hence, our subsequent tests are conservative with respect to the possibility of undetected recombination.
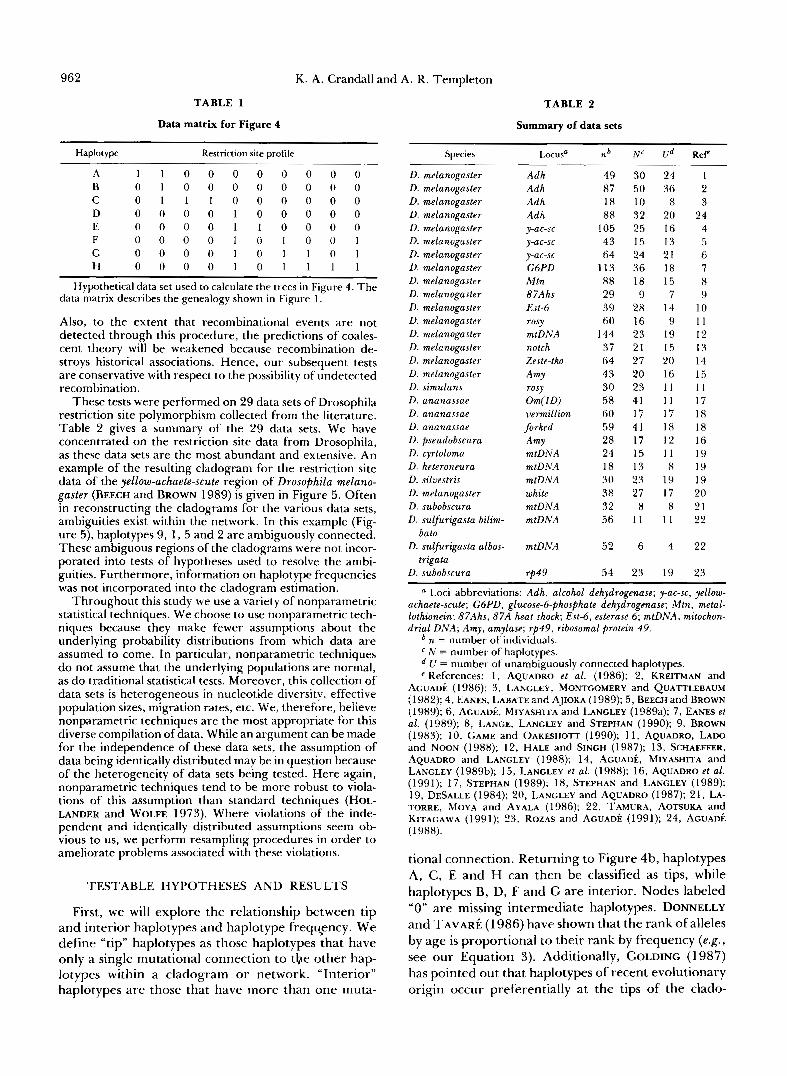
These tests were performed on 29 data sets of Drosophila restriction site polymorphism collected from the literature. Table 2 gives a summary of the 29 data sets. We have concentrated on the restriction site data from Drosophila, as these data sets are the most abundant and extensive. An example of the resulting cladogram for the restriction site data of the yellow-achaete-scute region of Drosophila melano- gaster (BEECH and BROWN 1989) is given in Figure 5. Often in reconstructing the cladograms for the various data sets, ambiguities exist within the network. In this example (Fig- ure 5) , haplotypes 9, 1 , 5 and 2 are ambiguously connected. These ambiguous regions of the cladograms were not incor- porated into tests of hypotheses used to resolve the ambi- guities. Furthermore, information on haplotype frequencies was not incorporated into the cladogram estimation.
Throughout this study we use a variety of nonparametric statistical techniques. We choose to use nonparametric tech- niques because they make fewer assumptions about the underlying probability distributions from which data are assumed to come. In particular, nonparametric techniques do not assume that the underlying populations are normal, as do traditional statistical tests. Moreover, this collection of data sets is heterogeneous in nucleotide diversity, effective population sizes, migration rates, etc. We, therefore, believe nonparametric techniques are the most appropriate for this diverse compilation of data. While an argument can be made for the independence of these data sets, the assumption of data being identically distributed may be in question because of the heterogeneity of data sets being tested. Here again, nonparametric techniques tend to be more robust to viola- tions of this assumption than standard techniques (HOL- LANDER and WOLFE 1973). Where violations of the inde- pendent and identically distributed assumptions seem ob- vious to us, we perform resampling procedures in order to ameliorate problems associated with these violations.
TESTABLE HYPOTHESES AND RESULTS
First, we will explore the relationship between tip and interior haplotypes and haplotype frequpcy. We define “tip” haplotypes as those haplotypes that have only a single mutational connection to the other hap- lotype~ within a cladogram or network. “Interior” haplotypes are those that have more than one muta-
TABLE 2
Summary of data sets
-
D. subobscura rp49
Species
D. melanogaster D . melanogaster D. melanogaster D. melanogaster D. melanogaster D. melanogaster D. melanogaster D. melanogaster D. melanogaster D . melanogaster D . melanogaster D. melanogaster D. melanogaster D. melanogaster D. melanogaster D. melanogaster D. simulans D. ananassae D. ananassae D . ananassae D . pseudobscura D. cyrtoloma D. heteroneura D. silvestris D. melanogaster D. subobscura D. sulfurigasta bilim-
D. sulfurigasta albos- bata
trigata
LOCUSQ -~
Adh Adh Adh Adh y-ac-sc y-ac-st y-ac-sc C6PD Mtn 87Ahs Est-6 rosy mtDNA notch Zeste-tko Amy rosy Om(1D) vermillion forked
mtDNA mtDNA mtDNA white mtDNA mtDNA
mtDNA
Amy
rlb
49 87 18 88
105 43 64
I I 3 88 29 39 60
144 37 64 43 30 58 60 59 28 24 18 30 38 32 56
-
52
54
NC
30 50 10 32 25 15 24 36 18 9
28 16 23 21 27 20 23 41 1 7 41 17 15 13 23 27
8 11
-
6
23
U d
24 36
8 2 0 I6 13 21 18 15 7
14 9
19 15 20 16 11 1 1 17 18 12 11 8
19 17 8
1 1
-
4
19
- Rep
1 2 3
24 4 5 6 7 8 9
10 11 12 13 14 15 11 17 18 18 16 19 19 19 20 21 22
22
23
a Loci abbreviations: Adh, alcohol dehydrogenase; y-ac-sc, yellow- achaete-scute; M P D , glucose-6-phosphate dehydrogenase; Mtn, metal- lothionein; 87Ahs, 87A heat shock; Est-4, esterase 6; mtDNA, mitochon- drial DNA; Amy, amylase; rp49, ribosomal protein 49.
n = number of individuals. N = number of haplotypes. U = number of unambiguously connected haplotypes.
e References: 1, AQUADRO et el. (1986); 2 , KREITMAN and AGUADE (1986); 3, LANGLEY, MONTGOMERY and QUATTLEBAUM (1982); 4, EANES, LABATE and AJIOKA (1989); 5 , BEECH and BROWN (1989); 6, A G U A D ~ , MIYASHITA and LANGLEY (1989a); 7, EANES et al. (1989); 8, LANCE, LANGLEY and STEPHAN (1990); 9, BROWN (1983); 10, GAME and OAKESHOTT (1990); 11, AQUADRO, LAD^ and NOON (1988); 12, HALE and SINGH (1987); 13, SCHAEFFER, AQUADRO and LANGLEY (1 988); 14, AGUADE, MIYASHITA and LANGLEY (1989b); 15, LANGLEY et al. (1 988); 16, AQUADRO et al. (1991); 17, STEPHAN (1989); 18, STEPHAN and LANGLEY (1989); 19, DESALLE (1984); 20, LANGLEY and AQUADRO (1987); 21, LA- TORRE, MOYA and AYALA (1 986); 22, TAMURA, AOTSUKA and KITAGAWA (1991); 23, ROZAS and A G U A D ~ (1991); 24, A G U A D ~ (1 988).
tional connection. Returning to Figure 4b, haplotypes A, C , E and H can then be classified as tips, while haplotypes B, D, F and G are interior. Nodes labeled “0” are missing intermediate haplotypes. DONNELLY and T A V A R ~ (1 986) have shown that the rank of alleles by age is proportional to their rank by frequency (e.g., see our Equation 3). Additionally, GOLDING (1987) has pointed out that haplotypes of recent evolutionary origin occur preferentially at the tips of the clado-
Applications of Coalescent Theory 963
13
" T 4 I 1 1 2 f r o m 4 a n d S
0 -10
Haplotype Frequency Location
1 0.19 2
Spain, N. Carolina 0.02
3 0.02 N. Carolina
4 N. Carolina
0.12 N. Carolina 5 0.05 6
N. Carolina 0.05 N. Carolina
7 0.02 N. Carolina 0.07 Spain. N. Carolina
9 0.33 10
Spain, N. Carolina 0.02 N. Carolina
I I 0.02 I2
N. Carolina
13 0.02 N. Carolina
14 0.05 0.02
Spain
15 Spain
x
0.02 Spain
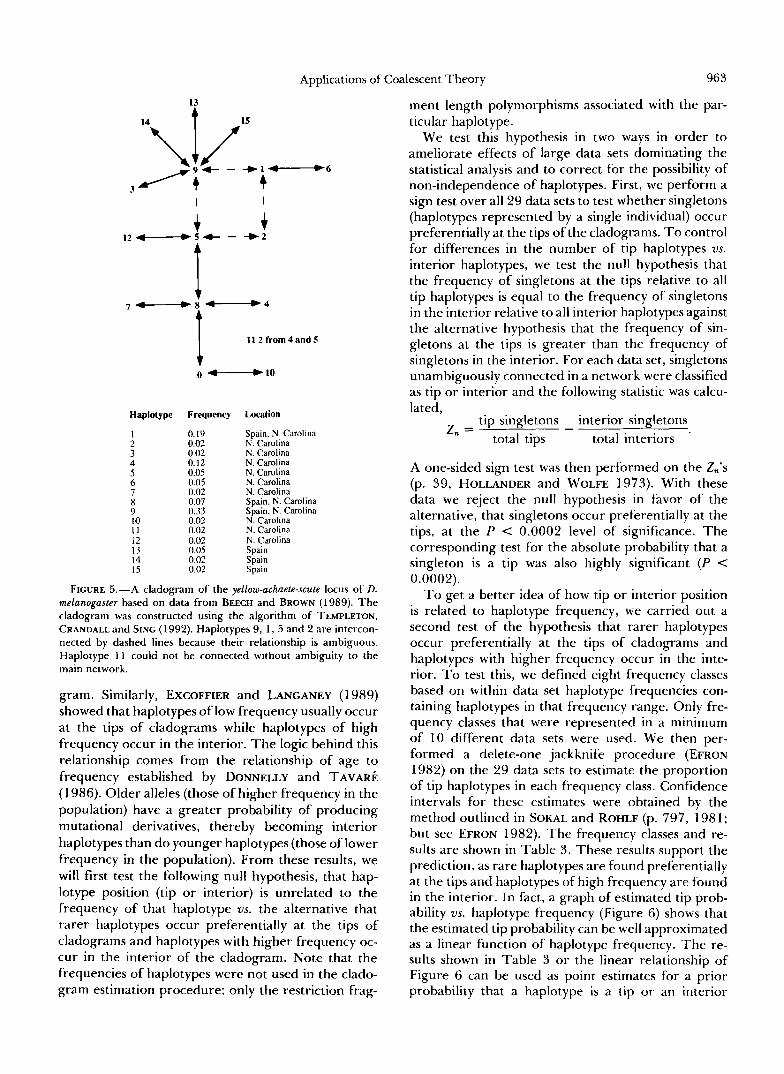
FIGURE 5.-A cladogram of the yellow-achaete-scute locus of D. melanogaster based on data from BEECH and BROWN (1 989). The cladogram was constructed using the algorithm of TEMPLETON, CRANDALL and SING ( 1 992). Haplotypes 9, 1, 5 and 2 are intercon- nected by dashed lines because their relationship is ambiguous. Haplotype 1 1 could not be connected without ambiguity to the main network.
gram. Similarly, EXCOFFIER and LANCANEY (1989) showed that haplotypes of low frequency usually occur at the tips of cladograms while haplotypes of high frequency occur in the interior. The logic behind this relationship comes from the relationship of age to frequency established by DONNELLY and TAVAR~ (1 986). Older alleles (those of higher frequency in the population) have a greater probability of producing mutational derivatives, thereby becoming interior haplotypes than do younger haplotypes (those of lower frequency in the population). From these results, we will first test the following null hypothesis, that hap- lotype position (tip or interior) is unrelated to the frequency of that haplotype vs. the alternative that rarer haplotypes occur preferentially at the tips of cladograms and haplotypes with higher frequency oc- cur in the interior of the cladogram. Note that the frequencies of haplotypes were not used in the clado- gram estimation procedure; only the restriction frag-
ment length polymorphisms associated with the par- ticular haplotype.
We test this hypothesis in two ways in order to ameliorate effects of large data sets dominating the statistical analysis and to correct for the possibility of non-independence of haplotypes. First, we perform a sign test over all 29 data sets to test whether singletons (haplotypes represented by a single individual) occur preferentially at the tips of the cladograms. To control for differences in the number of tip haplotypes vs. interior haplotypes, we test the null hypothesis that the frequency of singletons at the tips relative to all tip haplotypes is equal to the frequency of singletons in the interior relative to all interior haplotypes against the alternative hypothesis that the frequency of sin- gletons at the tips is greater than the frequency of singletons in the interior. For each data set, singletons unambiguously connected in a network were classified as tip or interior and the following statistic was calcu- lated,
tip singletons interior singletons total tips total interiors '
z, = -
A one-sided sign test was then performed on the Z,'s (p. 39, HOLLANDER and WOLFE 1973). With these data we reject the null hypothesis in favor of the alternative, that singletons occur preferentially at the tips, at the P < 0.0002 level of significance. The corresponding test for the absolute probability that a singleton is a tip was also highly significant ( P <
T o get a better idea of how tip or interior position is related to haplotype frequency, we carried out a second test of the hypothesis that rarer haplotypes occur preferentially at the tips of cladograms and haplotypes with higher frequency occur in the inte- rior. T o test this, we defined eight frequency classes based on within data set haplotype frequencies con- taining haplotypes in that frequency range. Only fre- quency classes that were represented in a minimum of 10 different data sets were used. We then per- formed a delete-one jackknife procedure (EFRON 1982) on the 29 data sets to estimate the proportion of tip haplotypes in each frequency class. Confidence intervals for these estimates were obtained by the method outlined in SOKAL and ROHLF (p. 797, 1981; but see EFRON 1982). The frequency classes and re- sults are shown in Table 3. These results support the prediction, as rare haplotypes are found preferentially at the tips and haplotypes of high frequency are found in the interior. In fact, a graph of estimated tip prob- ability vs. haplotype frequency (Figure 6) shows that the estimated. tip probability can be well approximated as a linear function of haplotype frequency. The re- sults shown in Table 3 or the linear relationship of Figure 6 can be used as point estimates for a prior probability that a haplotype is a tip or an interior
0.0002).
964 K. A. Crandall and A. R. Templeton
TABLE 3
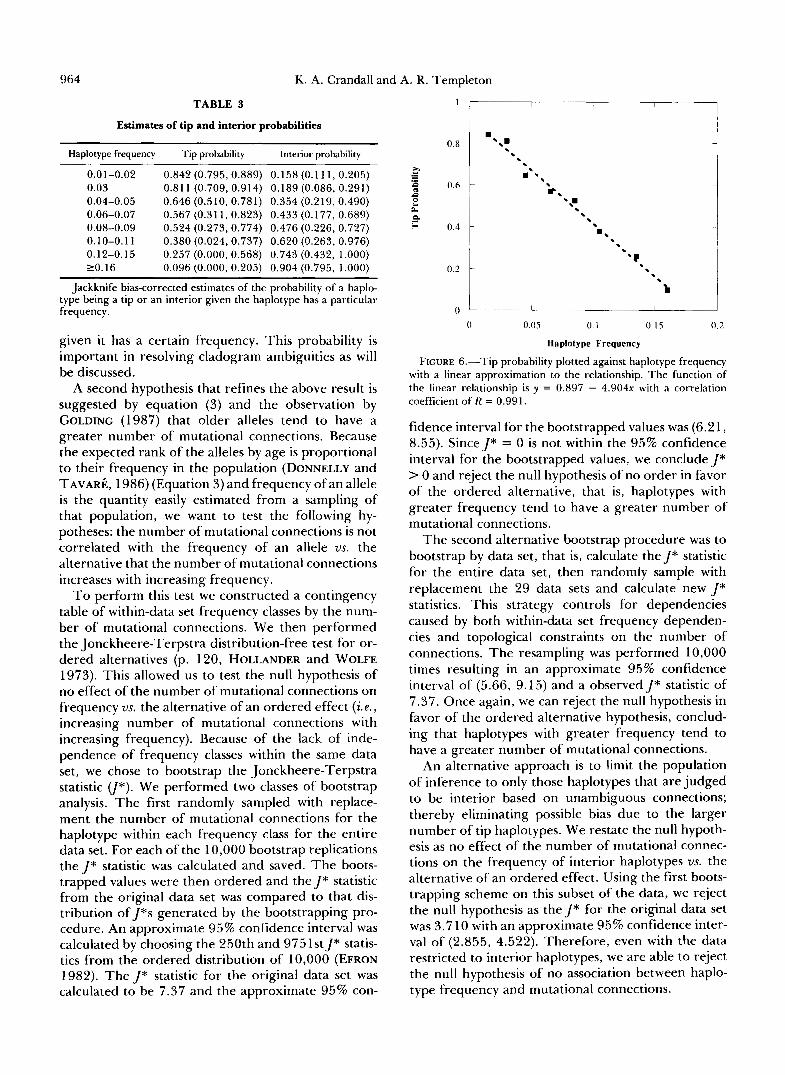
Estimates of tip and interior probabilities
Haplotype frequency Tip probability Interior probability
0.01-0.02 0.842(0.795,0.889) 0.158(0.111,0.205) 0.03 0.811 (0.709, 0.914) 0.189 (0.086, 0.291) 0.04-0.05 0.646 (0.510, 0.781) 0.354 (0.219, 0.490) 0.06-0.07 0.567 (0.31 1, 0.823) 0.433 (0.177, 0.689) 0.08-0.09 0.524 (0.273, 0.774) 0.476 (0.226, 0.727) 0.10-0.1 1 0.380 (0.024, 0.737) 0.620 (0.263, 0.976) 0.12-0.15 0.257 (0.000. 0.568) 0.743 (0.432, 1.000) 20.16 0.096 (0.000, 0.205) 0.904 (0.795, 1.000)
Jackknife bias-corrected estimates of the probability of a haplo- type being a tip or an interior given the haplotype has a particular frequency.
given it has a certain frequency. This probability is important in resolving cladogram ambiguities as will be discussed.
A second hypothesis that refines the above result is suggested by equation (3) and the observation by GOLDINC (1987) that older alleles tend to have a greater number of mutational connections. Because the expected rank of the alleles by age is proportional to their frequency in the population (DONNELLY and TAVAR~, 1986) (Equation 3) and frequency of an allele is the quantity easily estimated from a sampling of that population, we want to test the following hy- potheses: the number of mutational connections is not correlated with the frequency of an allele us. the alternative that the number of mutational connections increases with increasing frequency.
T o perform this test we constructed a contingency table of within-data set frequency classes by the num- ber of mutational connections. We then performed the Jonckheere-Terpstra distribution-free test for or- dered alternatives (p. 120, HOLLANDER and WOLFE 1973). This allowed us to test the null hypothesis of no effect of the number of mutational connections on frequency us. the alternative of an ordered effect (i.e., increasing number of mutational connections with increasing frequency). Because of the lack of inde- pendence of frequency classes within the same data set, we chose to bootstrap the Jonckheere-Terpstra statistic (I*). We performed two classes of bootstrap analysis. The first randomly sampled with replace- ment the number of mutational connections for the haplotype within each frequency class for the entire data set. For each of the 10,000 bootstrap replications the J* statistic was calculated and saved. The boots- trapped values were then ordered and the J* statistic from the original data set was compared to that dis- tribution ofJ*s generated by the bootstrapping pro- cedure. An approximate 95% confidence interval was calculated by choosing the 250th and 975 1 st J* statis- tics from the ordered distribution of 10,000 (EFRON 1982). The J* statistic for the original data set was calculated to be 7.37 and the approximate 95% con-
o 0.05 n. 1 0.1s 0.2
Haplotype Frequency
FIGURE 6.-Tip probability plotted against haplotype frequency with a linear approximation to the relationship. The function of the linear relationship is y = 0.897 - 4 . 9 0 4 ~ with a correlation coefficient of R = 0.991.
fidence interval for the bootstrapped values was (6.2 1, 8.55). Since J* = 0 is not within the 95% confidence interval for the bootstrapped values, we conclude J* > 0 and reject the null hypothesis of no order in favor of the ordered alternative, that is, haplotypes with greater frequency tend to have a greater number of mutational connections.
The second alternative bootstrap procedure was to bootstrap by data set, that is, calculate the J* statistic for the entire data set, then randomly sample with replacement the 29 data sets and calculate new J* statistics. This strategy controls for dependencies caused by both within-data set frequency dependen- cies and topological constraints on the number of connections. The resampling was performed 10,000 times resulting in an approximate 95% confidence interval of (5.66, 9.15) and a observed J* statistic of 7.37. Once again, we can reject the null hypothesis in favor of the ordered alternative hypothesis, conclud- ing that haplotypes with greater frequency tend to have a greater number of mutational connections.
An alternative approach is to limit the population of inference to only those haplotypes that are judged to be interior based on unambiguous connections; thereby eliminating possible bias due to the larger number of tip haplotypes. We restate the null hypoth- esis as no effect of the number of mutational connec- tions on the frequency of interior haplotypes us. the alternative of an ordered effect. Using the first boots- trapping scheme on this subset of the data, we reject the null hypothesis as the J* for the original data set was 3.710 with an approximate 95% confidence inter- val of (2.855, 4.522). Therefore, even with the data restricted to interior haplotypes, we are able to reject the null hypothesis of no association between haplo- type frequency and mutational connections.
Applications of Coalescent Theory 965
I I
0 5 10 15 Mutational Connections
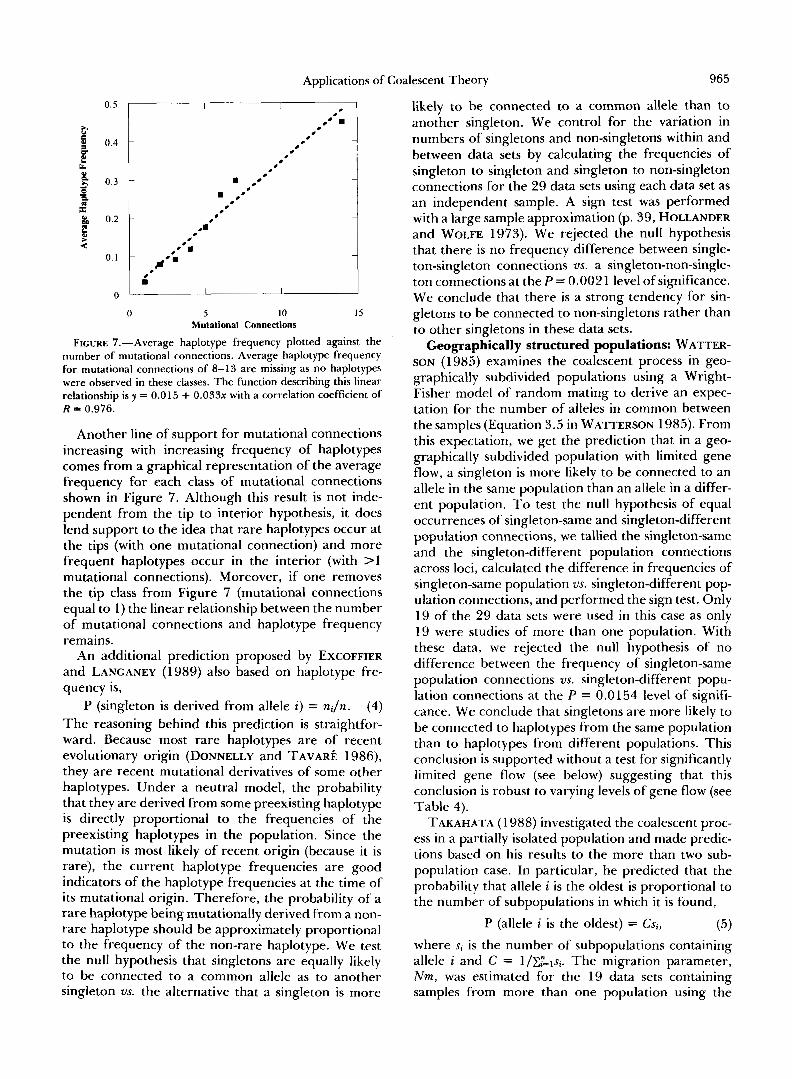
FIGURE 7.-Average haplotype frequency plotted against the number of mutational connections. Average haplotype frequency for mutational connections of 8-13 are missing as no haplotypes were observed in these classes. The function describing this linear relationship is y = 0.015 + 0 . 0 3 3 ~ with a correlation coefficient of R = 0.976.
Another line of support for mutational connections increasing with increasing frequency of haplotypes comes from a graphical representation of the average frequency for each class of mutational connections shown in Figure 7. Although this result is not inde- pendent from the tip to interior hypothesis, it does lend support to the idea that rare haplotypes occur at the tips (with one mutational connection) and more frequent haplotypes occur in the interior (with >1 mutational connections). Moreover, if one removes the tip class from Figure 7 (mutational connections equal to 1) the linear relationship between the number of mutational connections and haplotype frequency remains.
An additional prediction proposed by EXCOFFIER and LANCANEY (1989) also based on haplotype fre- quency is,
P (singleton is derived from allele i) = nJn. (4) The reasoning behind this prediction is straightfor- ward. Because most rare haplotypes are of recent evolutionary origin (DONNELLY and T A V A R ~ 1986), they are recent mutational derivatives of some other haplotypes. Under a neutral model, the probability that they are derived from some preexisting haplotype is directly proportional to the frequencies of the preexisting haplotypes in the population. Since the mutation is most likely of recent origin (because it is rare), the current haplotype frequencies are good indicators of the haplotype frequencies at the time of its mutational origin. Therefore, the probability of a rare haplotype being mutationally derived from a non- rare haplotype should be approximately proportional to the frequency of the non-rare haplotype. We test the null hypothesis that singletons are equally likely to be connected to a common allele as to another singleton us. the alternative that a singleton is more
likely to be connected to a common allele than to another singleton. We control for the variation in numbers of singletons and non-singletons within and between data sets by calculating the frequencies of singleton to singleton and singleton to non-singleton connections for the 29 data sets using each data set as an independent sample. A sign test was performed with a large sample approximation (p. 39, HOLLANDER and WOLFE 1973). We rejected the null hypothesis that there is no frequency difference between single- ton-singleton connections us. a singleton-non-single- ton connections at the P = 0.002 1 level of significance. We conclude that there is a strong tendency for sin- gletons to be connected to non-singletons rather than to other singletons in these data sets.
Geographically structured populations: WATTER- SON (1985) examines the coalescent process in geo- graphically subdivided populations using a Wright- Fisher model of random mating to derive an expec- tation for the number of alleles in common between the samples (Equation 3.5 in WATTERSON 1985). From this expectation, we get the prediction that in a geo- graphically subdivided population with limited gene flow, a singleton is more likely to be connected to an allele in the same population than an allele in a differ- ent population. To test the null hypothesis of equal occurrences of singleton-same and singleton-different population connections, we tallied the singleton-same and the singleton-different population connections across loci, calculated the difference in frequencies of singleton-same population os. singleton-different pop- ulation connections, and performed the sign test. Only 19 of the 29 data sets were used in this case as only 19 were studies of more than one population. With these data, we rejected the null hypothesis of no difference between the frequency of singleton-same population connections us. singleton-different popu- lation connections at the P = 0.0154 level of signifi- cance. We conclude that singletons are more likely to be connected to haplotypes from the same population than to haplotypes from different populations. This conclusion is supported without a test for significantly limited gene flow (see below) suggesting that this conclusion is robust to varying levels of gene flow (see Table 4).
TAKAHATA (1 988) investigated the coalescent proc- ess in a partially isolated population and made predic- tions based on his results to the more than two sub- population case. In particular, he predicted that the probability that allele i is the oldest is proportional to the number of subpopulations in which it is found,
P (allele i is the oldest) = Csj, ( 5 )
where si is the number of subpopulations containing allele i and C = l / ~ ~ = ~ s , . The migration parameter, Nm, was estimated for the 19 data sets containing samples from more than one population using the
966 K. A. Crandall and A. R. Templeton
TABLE 4
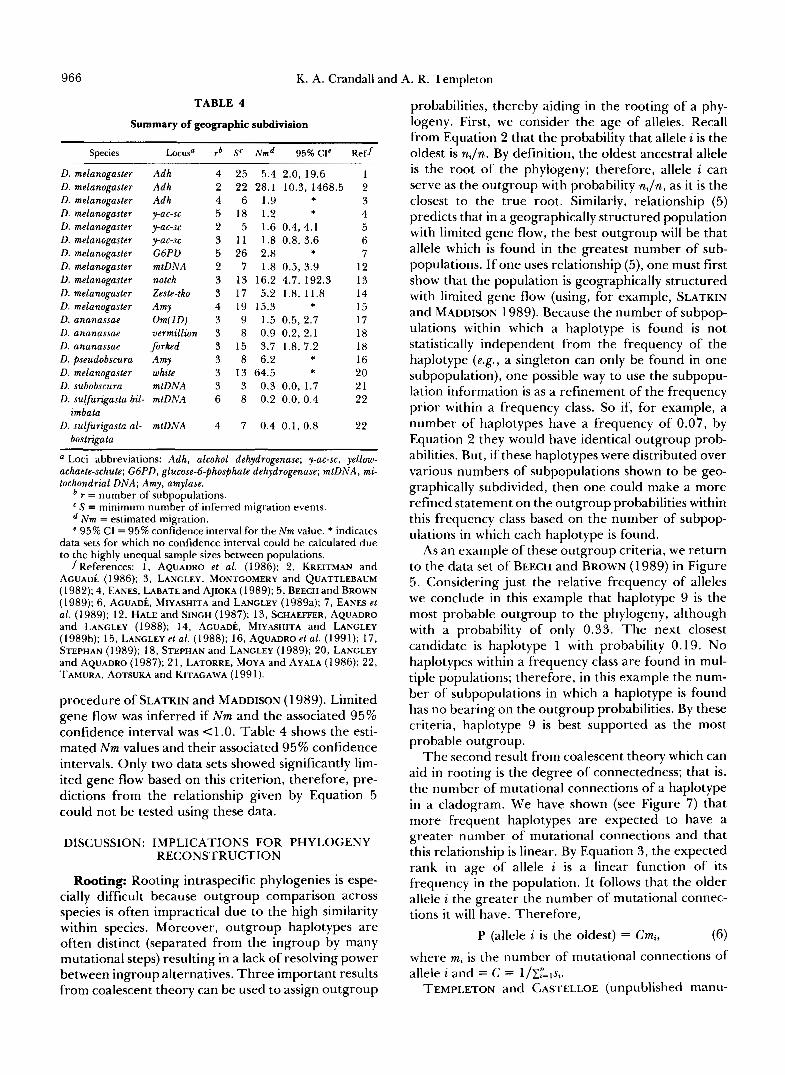
Summary of geographic subdivision
Species Locusa r b Sc Nmd 95% CI' Reff
D. melanogaster D. melanogaster D. melanogaster D. melanogaster D. melanogaster D. melanogaster D. melanogaster D. melanogaster D. melanogaster D. melanogaster D. melanogaster D. ananassae D. ananassae D. ananassae D. pseudobscura D. melanogaster D. subobscura D. suljiurigasta bil-
D. suljiurigasta al- imbata
bostrigata
Adh Adh Adh y-ac-sc y-ac-sc y-ac-sc G6PD mtDNA notch Zeste-tko
Om(1D) vermillion forked
white mtDNA mtDNA
Amy
Amy
mtDNA
4 25 5.4 2.0, 19.6 1 2 22 28.1 10.3, 1468.5 2 4 6 1.9 * 3 5 18 1.2 * 4 2 5 1.6 0.4, 4.1 5 3 1 1 1.8 0.8, 3.6 6 5 26 2.8 * 7 2 7 1.8 0.5, 3.9 12 3 13 16.2 4.7, 192.3 13 3 17 5.2 1.8, 11.8 14 4 19 15.3 * 15 3 9 1.5 0.5, 2.7 17 3 8 0.9 0.2, 2.1 18 3 15 3.7 1.8, 7.2 18 3 8 6.2 * 16 3 13 64.5 * 20 3 3 0.3 0.0, 1.7 21 6 8 0.2 0.0, 0.4 22
4 7 0.4 0.1, 0.8 22
a Loci abbreviations: Adh, alcohol dehydrogenase; y-ac-sc, yellow- achaete-schute; G6PD, glucose-6-phosphate dehydrogenase; mtDNA, mi- tochondrial DNA; Amy, amylase.
r = number of subpopulations. S = minimum number of inferred migration events. Nm = estimated migration. ' 95% CI = 95% confidence interval for the Nm value. * indicates
data sets for which no confidence interval could be calculated due to the highly unequal sample sizes between populations.
f References: 1 , AQUADRO et al. (1986); 2, KREITMAN and A G U A D ~ (1986); 3, LANGLEY, MONTGOMERY and QUATTLEBAUM (1982); 4, EANES, LABATE and AJIOKA ( 1 989); 5, BEECH and BROWN (1989); 6, AGUAD~, MIYASHITA and LANGLEY (1989a); 7, EANES et al. (1 989); 12, HALE and SINGH (1987); 13, SCHAEFFER, AQUADRO and LANGLEY (1988); 14, AGUAD~, MIYASHITA and LANGLEY (1989b); 15, LANGLEY et al. (1988); 16, AQUADRO et al. (1991); 17, STEPHAN (1989); 18, STEPHAN and LANGLEY ( 1 989); 20, LANGLEY and AQUADRO (1987); 2 1 , LATORRE, MOYA and AYALA (1986); 22, TAMURA, AOTSUKA and KITAGAWA ( 1 99 1) .
procedure of SLATKIN and MADDISON (1989). Limited gene flow was inferred if N m and the associated 95% confidence interval was <1.0. Table 4 shows the esti- mated N m values and their associated 95% confidence intervals. Only two data sets showed significantly lim- ited gene flow based on this criterion, therefore, pre- dictions from the relationship given by Equation 5 could not be tested using these data.
DISCUSSION: IMPLICATIONS FOR PHYLOGENY RECONSTRUCTION
Rooting: Rooting intraspecific phylogenies is espe- cially difficult because outgroup comparison across species is often impractical due to the high similarity within species. Moreover, outgroup haplotypes are often distinct (separated from the ingroup by many mutational steps) resulting in a lack of resolving power between ingroup alternatives. Three important results from coalescent theory can be used to assign outgroup
probabilities, thereby aiding in the rooting of a phy- logeny. First, we consider the age of alleles. Recall from Equation 2 that the probability that allele i is the oldest is n;/n. By definition, the oldest ancestral allele is the root of the phylogeny; therefore, allele i can serve as the outgroup with probability n,/n, as it is the closest to the true root. Similarly, relationship ( 5 ) predicts that in a geographically structured population with limited gene flow, the best outgroup will be that allele which is found in the greatest number of sub- populations. If one uses relationship (5 ) , one must first show that the population is geographically structured with limited gene flow (using, for example, SLATKIN and MADDISON 1989). Because the number of subpop- ulations within which a haplotype is found is not statistically independent from the frequency of the haplotype (e.g., a singleton can only be found in one subpopulation), one possible way to use the subpopu- lation information is as a refinement of the frequency prior within a frequency class. So if, for example, a number of haplotypes have a frequency of 0.07, by Equation 2 they would have identical outgroup prob- abilities. But, if these haplotypes were distributed over various numbers of subpopulations shown to be geo- graphically subdivided, then one could make a more refined statement on the outgroup probabilities within this frequency class based on the number of subpop- ulations in which each haplotype is found.
As an example of these outgroup criteria, we return to the data set of BEECH and BROWN (1 989) in Figure 5. Considering just the relative frequency of alleles we conclude in this example that haplotype 9 is the most probable outgroup to the phylogeny, although with a probability of only 0.33. The next closest candidate is haplotype 1 with probability 0.19. No haplotypes within a frequency class are found in mul- tiple populations; therefore, in this example the num- ber of subpopulations in which a haplotype is found has no bearing on the outgroup probabilities. By these criteria, haplotype 9 is best supported as the most probable outgroup.
The second result from coalescent theory which can aid in rooting is the degree of connectedness; that is, the number of mutational connections of a haplotype in a cladogram. We have shown (see Figure 7) that more frequent haplotypes are expected to have a greater number of mutational connections and that this relationship is linear. By Equation 3 , the expected rank in age of allele i is a linear function of its frequency in the population. It follows that the older allele i the greater the number of mutational connec- tions it will have. Therefore,
P (allele i is the oldest) = Cmi, (6) where mi is the number of mutational connections of allele i and = C = l/C;='=ls;.
TEMPLETON and CASTELLOE (unpublished manu-
Applications of Coalescent Theory 967
script) have supported this relationship by using a computer program by GRIFFITHS (1 989) to show that the probability of allele i being the oldest allele in the population increases with increasing mutational con- nectedness. They also show that this probability is robust over a 30-fold range of biologically relevant 8 values. Relationship (6) can be used as an additional criterion for refining outgroup probabilities for the allelic phylogeny. Returning to our example (Figure 5 ) , we see that once again haplotype 9 is best sup- ported by this criterion as it has four unambiguous connections and at least one more connection when the ambiguous block is resolved. Haplotype 8 has four unambiguous connections and haplotype 5 has two unambiguous connections plus at least one more upon resolution of the ambiguous block.
A third method of rooting is to use a genetic dis- tance approach. From the theory described above, we know the expected time to total coalescence is equal to 4N(1 - n”) or 4N for large n as in the infinite alleles case (KINGMAN 1982b), so
E (largest genetic distance) = 2~ 4N = 28.
This result implies that mid-point rooting is yet an- other criterion with which to refine outgroup proba- bilities. One can simply calculate the distance of each haplotype from the mid-point of the cladogram and normalize these distances for all haplotypes to estab- lish the probabilities of outgroup based on distance from the mid-point. Using mid-point rooting we found that once again haplotype 9 has the highest outgroup probability as it is closest to the mid-point. We point out that these rooting criteria are not evo- lutionarily independent of one another and are not expected to be. But they are statistically independent of one another as they sample independent sources of information (frequency, number of subpopulations, number of mutational connections, and distance from the mid-point) and can therefore be used to obtain overall outgroup probabilities for each haplotype. We are currently exploring possible ways of using this diverse set of information, as well as additional infor- mation, to assign statistically rigorous outgroup prob- abilities.
Resolving ambiguities: Our results also have im- portant implications for resolving cladogram ambi- guities. Ambiguities can arise in one of two ways. The first type, internal ambiguity, occurs when haplotypes are interconnected on the cladogram forming a closed loop which can be broken at any place. Figure 5 shows a cladogram from the yellow-achaete-scute locus of D. melanogaster. We can see that haplotypes 9, 1, 2 and 5 are interconnected, thereby forming an ambiguous portion of the cladogram. The second form of ambi- guity, external ambiguity, arises with tip haplotypes that have alternative connections to a number of haplotypes. Haplotype 11 is an example of external
5 2
9-1
5-2
9 1 9-1
5-2 5-2
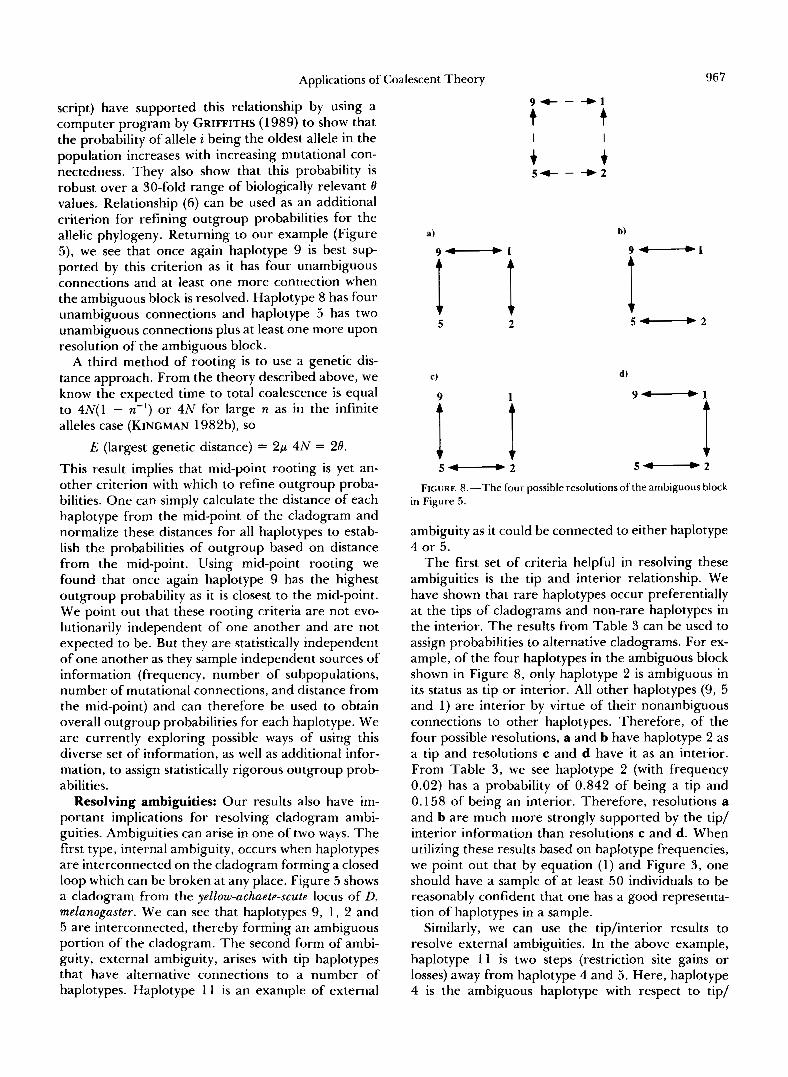
FIGURE %--The four possible resolutions of the ambiguous block in Figure 5 .
ambiguity as it could be connected to either haplotype 4 or 5.
The first set of criteria helpful in resolving these ambiguities is the tip and interior relationship. We have shown that rare haplotypes occur preferentially at the tips of cladograms and non-rare haplotypes in the interior. The results from Table 3 can be used to assign probabilities to alternative cladograms. For ex- ample, of the four haplotypes in the ambiguous block shown in Figure 8, only haplotype 2 is ambiguous in its status as tip or interior. All other haplotypes (9, 5 and 1) are interior by virtue of their nonambiguous connections to other haplotypes. Therefore, of the four possible resolutions, a and b have haplotype 2 as a tip and resolutions c and d have it as an interior. From Table 3, we see haplotype 2 (with frequency 0.02) has a probability of 0.842 of being a tip and 0.158 of being an interior. Therefore, resolutions a and b are much more strongly supported by the tip/ interior information than resolutions c and d. When utilizing these results based on haplotype frequencies, we point out that by equation (1) and Figure 3, one should have a sample of at least 50 individuals to be reasonably confident that one has a good representa- tion of haplotypes in a sample.
Similarly, we can use the tip/interior results to resolve external ambiguities. In the above example, haplotype 11 is two steps (restriction site gains or losses) away from haplotype 4 and 5. Here, haplotype 4 is the ambiguous haplotype with respect to tip/
968 K. A. Crandall and A. R. Templeton
5 4- - +I1
1 1 t
8-4
5 -11 5 I1
8-4 8-4
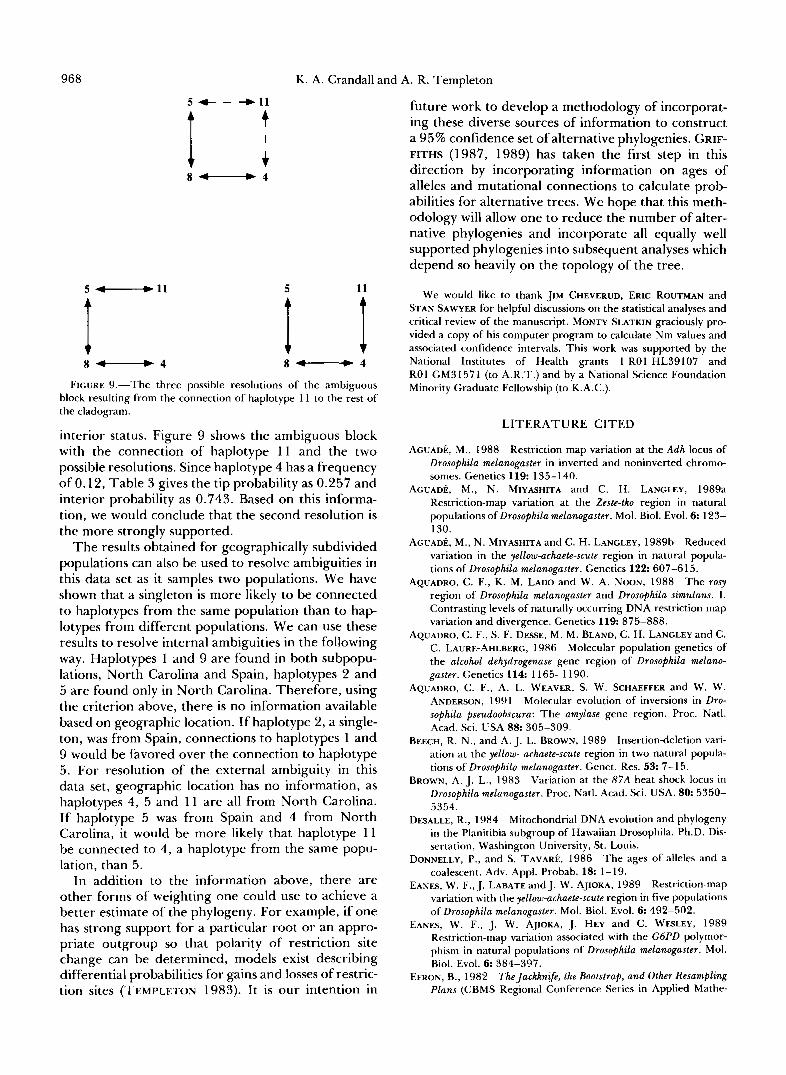
FIGURE 9.-The three possible resolutions of the ambiguous block resulting from the connection of haplotype 11 to the rest of the cladogram.
interior status. Figure 9 shows the ambiguous block with the connection of haplotype 11 and the two possible resolutions. Since haplotype 4 has a frequency of 0.12, Table 3 gives the tip probability as 0.257 and interior probability as 0.743. Based on this informa- tion, we would conclude that the second resolution is the more strongly supported.
The results obtained for geographically subdivided populations can also be used to resolve ambiguities in this data set as it samples two populations. We have shown that a singleton is more likely to be connected to haplotypes from the same population than to hap- lotypes from different populations. We can use these results to resolve internal ambiguities in the following way. Haplotypes 1 and 9 are found in both subpopu- lations, North Carolina and Spain, haplotypes 2 and 5 are found only in North Carolina. Therefore, using the criterion above, there is no information available based on geographic location. If haplotype 2, a single- ton, was from Spain, connections to haplotypes 1 and 9 would be favored over the connection to haplotype 5. For resolution of the external ambiguity in this data set, geographic location has no information, as haplotypes 4, 5 and 11 are all from North Carolina. If haplotype 5 was from Spain and 4 from North Carolina, it would be more likely that haplotype 11 be connected to 4, a haplotype from the same popu- lation, than 5.
In addition to the information above, there are other forms of weighting one could use to achieve a better estimate of the phylogeny. For example, if one has strong support for a particular root or an appro- priate outgroup so that polarity of restriction site change can be determined, models exist describing differential probabilities for gains and losses of restric- tion sites (TEMPLETON 1983). It is our intention in
future work to develop a methodology of incorporat- ing these diverse sources of information to construct a 95% confidence set of alternative phylogenies. GRIF- FITHS (1987, 1989) has taken the first step in this direction by incorporating information on ages of alleles and mutational connections to calculate prob- abilities for alternative trees. We hope that this meth- odology will allow one to reduce the number of alter- native phylogenies and incorporate all equally well supported phylogenies into subsequent analyses which depend so heavily on the topology of the tree.
We would like to thank JIM CHEVERUD, ERIC ROUTMAN and STAN SAWYER for helpful discussions on the statistical analyses and critical review of the manuscript. MONTY SLATKIN graciously pro- vided a copy of his computer program to calculate Nm values and associated confidence intervals. This work was supported by the National Institutes of Health grants 1 R01 HL39107 and R01 GM31571 (to A.R.T.) and by a National Science Foundation Minority Graduate Fellowship (to K.A.C.).
LITERATURE CITED
AGUADE, M., 1988 Restriction map variation at the Adh locus of Drosophila melanogaster in inverted and noninverted chromo- somes. Genetics 119: 135-140.
AGUADE, M., N. MIYASHITA and C. H. LANGLEY, 1989a Restriction-map variation at the Zeste-tko region in natural populations of Drosophila melanogaster. Mol. Biol. Evol. 6: 123- 130.
AGUADE, M., N. MIYASHITA and C. H. LANGLEY, 1989b Reduced variation in the yellow-achaete-scute region in natural popula- tions of Drosophila melanogaster. Genetics 122: 607-615.
AQUADRO, C. F., K. M. LADO and W. A. NOON, 1988 The rosy region of Drosophila melanogaster and Drosophila simulans. 1. Contrasting levels of naturally occurring DNA restriction map variation and divergence. Genetics 119 875-888.
AQUADRO, C. F., S. F. DESSE, M. M. BLAND, C. H. LANGLEY and C. C. LAURE-AHLBERG, 1986 Molecular population genetics of the alcohol dehydrogenase gene region of Drosophila melano- gaster. Genetics 114: 1 165- 1190.
AQUADRO, C. F., A. L. WEAVER, S. W. SCHAEFFER and W. W. ANDERSON, 1991 Molecular evolution of inversions in Dro- sophila pseudoobscura: The amylase gene region. Proc. Natl. Acad. Sci. USA 88: 305-309.
BEECH, R. N., and A. J. L. BROWN, 1989 Insertion-deletion vari- ation at the yellow- achaete-scute region in two natural popula- tions of Drosophila melanogaster. Genet. Res. 53: 7-15.
BROWN, A. J. L., 1983 Variation at the 87A heat shock locus in Drosophila melanogaster. Proc. Natl. Acad. Sci. USA. 8 0 5350- 5354.
DESALLE, R., 1984 Mitochondrial DNA evolution and phylogeny in the Planitibia subgroup of Hawaiian Drosophila. Ph.D. Dis- sertation, Washington University, St. Louis.
DONNELLY, P., and S. TAVARE, 1986 The ages of alleles and a coalescent. Adv. Appl. Probab. 18: 1-19.
EANES, W. F., J. LABATE and J. W. AJIOKA, 1989 Restriction-map variation with the yellow-achaete-scute region in five populations of Drosophila melanogaster. Mol. Biol. Evol. 6: 492-502.
EANES, W. F., J. W. AJIOKA, J. HEY and C . WESLEY, 1989 Restriction-map variation associated with the G6PD polymor- phism in natural populations of Drosophila melanogaster. Mol. Biol. Evol. 6: 384-397.
EFRON, B., 1982 The Jackknqe, the Bootstrap, and Other Resampling Plans (CBMS Regional Conference Series in Applied Mathe-
Applications of Coalescent Theory 969
matics, Vol. 38). Society for Industrial & Applied Mathematics, Philadelphia.
EWENS, W., 1990 Population genetics theory-the past and the future, pp. 177-227 in Mathematical and Statistical Developments ofEuolutionary Theory, edited by S. LESSARD. Kluwer Academic Publishers, New York.
EXCOFFIER, L., and A. LANGANEY, 1989 Origin and differentia- tion of human mitochondrial DNA. Am. J. Hum. Genet. 44:
GAME, A. Y., and J. G. OAKESHOTT, 1990 Associations between restriction site polymorphism and enzyme activity variation for esterase 6 in Drosophila melanogaster. Genetics 1 2 6 102 1- 103 1 .
GOLDING, G . B., 1987 The detection of deleterious selection using ancestors inferred from a phylogenetic history. Genet. Res. 4 9 71-82.
GRIFFITHS, R. C., 1987 Counting genealogical trees. J. Math. Biol.
GRIFFITHS, R. C., 1989 Genealogical-tree probabilities in the in- finitely-many-site model. J. Math. Biol. 27: 667-680.
HALE, L. R., and R. S. SINGH, 1987 Mitochondrial DNA variation and genetic structure in populations of Drosophila melanogaster. Mol. Biol. Evol. 4: 622- 637.
HEIN, J., 1990 Reconstructing evolution of sequences subject to recombination using parsimony. Math. Biosci. 98: 185-200.
HOLLANDER, M., and D. A. WOLFE, 1973 NonParametricStatistical Methods. John Wiley & Sons, New York.
HUDSON, R. R., 1990 Gene genealogies and the coalescent proc- ess, pp. 1-42 in Oxford Surveys in Evolutionary Biology, Vol. 7, edited by D. FUTUYMA and J. ANTONOVICS. Oxford University Press, Oxford.
KELLY, F. P., 1977 Exact results for the Moran neutral allele model. Adv. Appl. Prob. 9 197-201.
73-85.
25: 423-431.
KINGMAN, J. F. C., 1982a The coalescent. Stochastic Processes
KINGMAN, J. F. C., 1982b On the genealogy of large populations. J. Appl. Probab. 19A: 27-43.
KREITMAN, M., 1983 Nucleotide polymorphism at the alcohol dehydrogenase locus of Drosophila melanogaster. Nature 304:
KREITMAN, M., and M. AGUAD~, 1986 Genetic uniformity in two populations of Drosophila melanogaster as revealed by filter hybridization of four-nucleotide-recognizing restriction en- zyme digests. Proc. Natl. Acad. Sci. USA 83: 3562-3566.
LANCE, B. W., C. H. LANGLEY and W. STEPHAN, 1990 Molecular evolution of Drosophila metallothionein genes. Genetics 126:
LANGLEY, C. H., and C. F. AQUADRO, 1987 Restriction-map var- iation in natural populations of Drosophila melanogaster: White- locus region. Mol. Biol. Evol. 4: 651-663.
LANGLEY, C. H., E. MONTGOMERY and W. F. QUATTLEBAUM, 1982 Restriction map variation in the Adh region of Drosoph- ila. Proc. Natl. Acad. Sci. USA 79: 5631-5635.
LANGLEY, C. H., A. E. SHRIMPTON, T. YAMAZAKI, N. MIYASHITA, Y. MATSUO and C. F. AQUADRO, 1988 Naturally occurring
Appl. 13: 235-248.
412-417.
921-932.
variation in the restriction map of the Amy region of Drosophila melanogaster. Genetics 1 1 9 619-629.
LATORRE, A,, A. MOYA and F. AYALA, 1986 Evolution of mito- chondrial DNA in Drosophila subobscura. Proc. Natl. Acad. Sci.
ROZAS, J., and M. AGUAD~, 1991 Study of an isolated population at the nucleotide level: rp49 region of a Canarian population of Drosophila subobscura. Mol. Biol. Evol. 8: 202-21 1.
SCHAEFFER, S. W., C. F. AQUADRO and C. H. LANGLEY, 1988 Restriction-map variation in the Notch region of Drosophila melanogaster. Mol. Biol. Evol. 5: 30-40.
SLATKIN, M., and W. MADDISON, 1989 A cladistic measure of gene flow inferred from the phylogenies of alleles. Genetics
SOKAL, R. R., and F. J. ROHLF, 1981 Biometry. W. H. Freeman, New York.
STEPHAN, W., 1989 Molecular genetic variation in the centrom- eric region of the X chromosome in three Drosophila ananassae populations. 11. The Om(lD) locus. Mol. Biol. Evol. 6: 624- 635.
STEPHAN, W., and C. H. LANGLEY, 1989 Molecular genetic vari- ation in the centromeric region of the X chromosome in three Drosophila ananassae populations. I. Contrasts between the vermilion andforked loci. Genetics 121: 89-99.
SWOFFORD, D. L., 1991 PAUP: Phylogenetic Analysis Using Parsi- mony, Version ?.Or. Computer program distributed by the Illi- nois Natural History Survey, Champaign, Ill.
TAKAHATA, N., 1988 The coalescent in two partially isolated diffusion populations. Genet. Res. 52: 213-222.
TAMURA, K., T . A O T S U K A ~ ~ ~ 0. KITAGAWA, 1991 Mitochondrial DNA polymorphism in the two subspecies of Drosophila sulfi- rigaster: relationship between geographic structure of popula- tion and nucleotide diversity. Mol. Biol. Evol. 8: 104-1 14.
TAVAR~, S., 1984 Line-of-descent and genealogical processes, and their applications in population genetics models. Theor. Popul. Biol. 2 6 119-164.
TEMPLETON, A. R., 1983 Convergent evolution and nonparamet- ric inferences from restriction data and DNA sequences, pp. 1 5 1 - 179 in Statistical Analysis of DNA Sequence Data, edited by B. S. WEIR. Marcel Dekker, New York.
TEMPLETON, A. R., E. BOERWINKLE and C. F. SING, 1987 A cladistic analysis of phenotypic associations with haplotypes inferred from restriction endonuclease mapping. I. Basic the- ory and an analysis of alcohol dehydrogenase activity in Dro- sophila. Genetics 117: 343-351.
TEMPLETON, A. R., K. A. CRANDALL and C. F. SING, 1992 A cladistic analysis of phenotypic associations with haplotypes inferred from restriction endonuclease mapping. 111. Clado- gram estimation. Genetics 132: 619-633.
WATTERSON, G. A., 1976 Reversibility and the age of an allele. I . Moran’s infinitely many neutral alleles model. Theor. Popul. Biol. 10: 239-253.
WATTERSON, G. A., 1985 The genetic divergence of two popu- lations. Theor. Popul. Biol. 27: 298-317.
WATTERSON, G . A., and H. A. GUESS, 1977 Is the most frequent allele the oldest? Theor. Popul. Biol. 11: 141-160.
USA 83: 8649-8653.
123: 603-613.
Communicating editor: A. G. CLARK