Embed Size (px)
Citation preview
Environmental and Ecological Statistics 6, 197-209 (1999)
A closure test for time-specific capture-recapture data
THOMAS R. STANLEY 1 and KENNETH P. BURNHAM 2
IU.S. Geological Survey, Midcontinent Ecological Science Center, 4512 McMurry Avenue, Fort Cot/ins, Colorado 80525, U.S.A. 2Colorado Cooperarive Fish alld Wildlife Research Unit, Colorado State University, Fort Cot/ins, Colorado 80523, U.S.A.
Received July 1988; revised November 1998
The assumption of demographic closure in the analysis of capture-recapture data under closed-population models is of fundamental importance. Yet. linle progress has been made in the development of omnibus tests of the closure assumption. We present a closure test for time-specific data that. in principle, tests the null hypothesis of closed-population model M, against the open-population Jolly-Seber model as a specific alternative. This test is chi-square, and can be decomposed int.o informative components that can be interpreted to determiue the nature of closure violations. The test is most sensitive to pennanent emigration and least sensitive to temporary emigration, and is of intermediate sensitivity to permanent or temporary immigration. This test is a versatile tool for testiug the assumprion of demographic closure in the analysis of capture-recapture data.
Ke)words: Darroch's model, Jolly-Seber model, model M" population estimation
1352-8305 (~ J999 .. Kluwer AcademIC Publishers
1. Introduction
The assumption of demographic closure in capture-recapture studies (i.e., emigration, immigration, mortality or recruitment do not occur during the period of study) is of fundamental importance in the analysis of capture-recapture data under closed-population models for estimating population size (Otis et af., 1978; Seber, 1982, 1992). Despite the importance of this assumption, little progress has been made in the development of an omnibus test for demographic closure. This is largely due to the fact that behavioral variation in capture probabilities is indistinguishable from failure of demographic or geographic closure (Otis et al., 1978, p. 66; White et al., 1982, p. 96).
Nonetheless, a number of partial tests of the closure assumption have been developed for capture-recapture data. For the open-population Jolly-Seber model, Balser (unpublished Ph.D. thesis, Cornell University, 1981) provided a test for temporary emigration that is asymptotically equivalent to the test suggested by Jolly (1982). For closed-population models, data on size distribution (e.g., length or weight) can be used in a Wilcoxon rank-sum test to test whether recruitment of young into a population has occurred, and this test can be extended to estimate the amount of recruitment that has occurred, thereby allowing recruits to be culled from the sample
1352-8~05 ~, 1999 .. Kluwer AcademIC Publi,her>

198 Stanley, Burnham
(Robson and Flick, 1965) Robson and Regier (1968) describe a different. simpler test for recl1litment based on contingency tables.
Probably the most widely used test for closure is one given by Otis ef al. (1978). This test is implemented in CAPTURE, a computer program for analyzing closed-population capturerecapture data (White ef al., 1982), and is unaffected by heterogeneity in capture probabilities. However, Type I error rates for this test exceed nominal rates in the presence of tjme or behavioral variation in capture probabilities (White et al., 1982). and the test is insensitive to
temporary violation of closure occurring during the middle of the study (Otis ef al., 1978). Pollock ef at. (1974), using a general approach, developed a set of three teMs for detecting
mortality or recruitment in the presence of time variation in capture probabilities. Specifically, they present a test for recruitment allowing mortality, a test for mortality assuming no recruitment, and a test for mortality allowing recruitment. The test statistic for mortality assuming no recruitment is computationally intensive, so Pollock el a1. (1974) derive a simplified (though less powerful) statistic based on asymptotic and distributional approximations. A test statistic for recruitment assuming no mortality was not presented, though they note one can be derived, and an overall test statistic for mortality and recruitment (i.e., closure) was not given.
in this paper we present a new test for closure developed under a null model allowing for time variation in capture probabilities that, in principle. builds on the work of Pollock et al. (1974). This test is chi-square. can be partitioned into infoill13tive components, and is a subset of the goodness-of-fit test for closed-population capture-recapture model M( developed by Stanley and Burnham (1999). The power of the test in the presence of pennanent or temporary emigration or immigration, and under stochastic time variation in capture probabilities. is evaluated empirically using Monte Carlo simulations.
2. Definitions
vVe assume a k-sample capture-recapture study where known losses on capture are pennitted. On tbe jth capture occasion (j = 1. .... k). unmarked individuals are marked before release and marked individuals have their marks recorded before release. The record of captures for a marked individual over k occasions 1S referred to as a capture history. A matrix of capture histories, where each row represents the capture history of a marked individual in the population, is referred LO as a capture history matrix. The set of marked individuals released on the jth occasion constitute a cohort. The following notation, which is standard in the capture-recapture literature (Darroch, 1958: Jolly, ]965; Bumham ef at., 1987), is used in this paper:
N number of animals at risk of capture on the first capture occasion. R, number of animals released on the ith occasion (i = 1. ... ,k - 1). mi number of recaptures on the ith occasion (i = 2, .... k), ml = O. r, number of animals released on the ith occasion that were ever recaptured (i = I, ... , k - 1). =, number of recaptures of animals in cohorts released prior to the ith occasion that were
subsequently recaptured after capture occasion i. but not recaptured on occasion i (i = 2.... 1 k - 1).
Ti number of recaptures of animals in cohorts released prior to or at release occasion i-I that were subsequently recaptured at or after capture occasion i (i = 2, .... k - I). Ti = mj + Z,.
u; number of unmarked individuals captured on the ith occasion (i = 1, ... , k).
A closure tesl 199
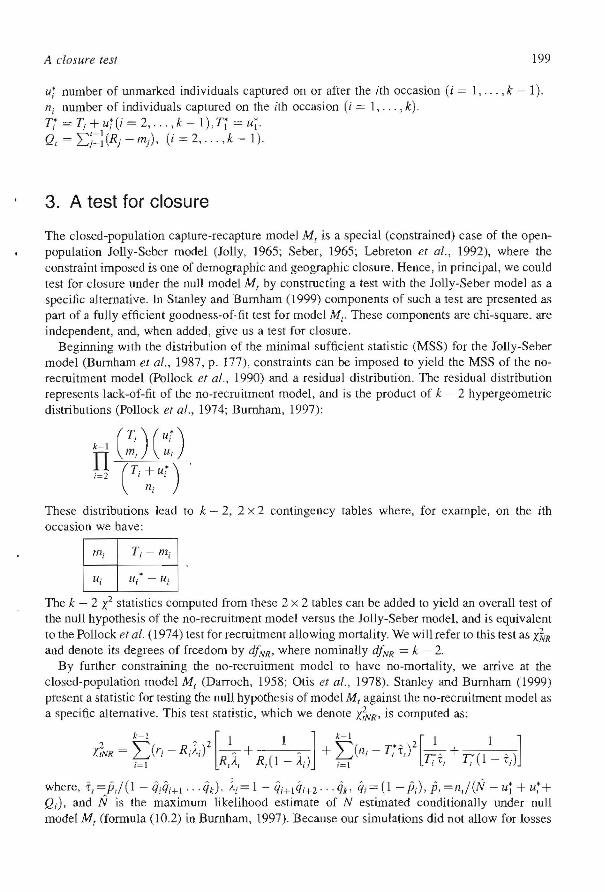
ui number of unmarked individuals captured on or after the ith occasion (i = 1, ... , k - 1).11; number of individuals captured on the lin occasion (i = 1, ... , k). Tt = Ti + uj (i = 2, ... , k - I); Tr = ul' Q, = L;=:(Rj - m i ), (i = 2, ... ,k - 1).
3. A test for closure
The closed-population capture-recapture model M[ is a special (constrained) case of the openpopulation Jolly-Seber model (Jolly, 1965; Seber, 1965; Lebreton et aI., 1992), where the constraint imposed is one of demographic and geographic closure. Hence, in principal, we could test for closure under the null model M t by constructing a test with the Jolly-Seber model as a specific alternative. In Stanley and Burnham (1999) components of such a test are presented as part of a fully efficient goodness-of-fit test for model MI' These components are chi-square. are independent, and, when added, give us a test for closure.
Beginning with the distribution of the minimal sufficient statistic (MSS) for the Jolly-Seber model (Bumham el al., 1987, p. 177), constraints can be imposed to yield the MSS of the norecruitment model (Pollock ef al., 1990) and a residual distribution. The residual distribution represents lack-of-fit of the no-recruitment model, and is the product of k - 2 hypergeometric distributions (Pollock ef al., 1974; Burnham, 1997):
( T1 ) (ut )IT ~itn,
i=2 (Ti+Ui)11·I
These distributions lead to k - 2, 2 x 2 contingency tables where, for example, on the ith occasion we have:
The k - 2 X2 statistics computed from these 2 x 2 tables can be added to yield an overall test of the null hypothesis of the no-recruitment model versus Ine Jolly-Seber model, and is equivalent to the Pollock ef al. (1974) test for recruitment allowing mortality. We will refer to this test as XJ~R
and denote its degrees of freedom by dj~'R' where nominally dfNR = k - 2. By further constraining the no-recruitment model to have no-mortality, we amve at the
closed-population model M1 (Darroch, 1958; Otis et at., 1978). Stanley and Burnham (1999) present a statistic for testing the null hypothesis of model M t against the no-recruitment model as a specific alternative. This test statistic, which we denote X;NR' is computed as:
k-l _ k-l [[1 1] 1 1]dNR = 2=Cri- Ri ),J2 R J. +R ( _ i) + 2:)11; - T,'iY ri + r(1 - i)
1=1 I I t 1 ,p=l ttl'
where, i,=/3,/(1 - ii/i;+I" ·(h), 1;= 1 - Qj+1Q,+2" ·Qk' Q;= (1 - Pi), 13, =I1J(N - uj + ui+ Qi), and N is the maximum likelihood estimate of N estimated conditionally under null model M, (fOlillula (10.2) in Burnham, 1997). Because our simulations did not allow for losses
200 Stanley, Burnham
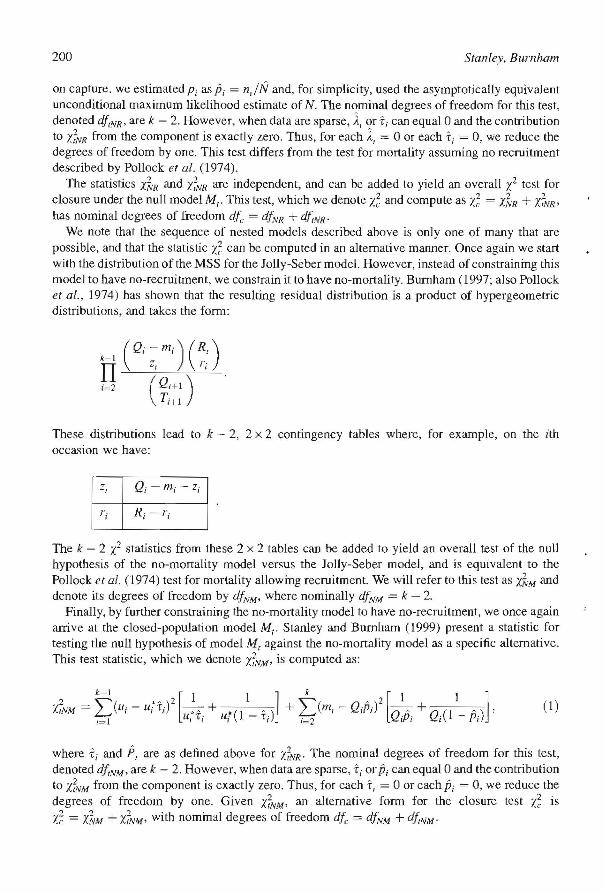
on capture. we estimated Pi as Pi = n,/N and, for simplicity, used the asymptotically equivalent unconditional maximum likelihood estimate of N. The nominal degrees of freedom for this test, denoted d/(NR, are k - 2. However, when data are sparse, A, or Ti can equal 0 and the contribution to Y.~VR from the component is exactly zero. Thus, for each ;'1 = 0 or each ii = 0, we reduce the degrees of freedom by one. This test differs from the test for mortality assuming no recruitment described by Pollock et al. (1974).
The statistics X}R and Y.~VR are independent, and can be added to yield an overall y' 2 test for closure under the null model M(. This test, which we denote XZ- and compute as y.~ = XkR + Xf.~'R' has nominal degrees of freedom dIe = df.vR + dI(NR'
We note that the sequence of nested models described above is only one of many that are possible, and that the statistic y.~ can be computed in an alternative malll1er. Once again we start with tne distribution of the MSS for the Jolly-Seber modeL However, instead of constraining this model to have no-recruitment, we constrain it to have no-mortality. Burnham (1997; also Pollock et al., 1974) has shown that the resulting residual distribution is a product of hypergeometric distributions, and takes the form:
_ (Qi - (R Im i ) )k I 'T / .•II ~l i
i=2 (QI+I)TH1
These distributions lead to k - 2, 2 x 2 contingency tables where, for ex.ample, on the ith occasion we have:
The k - 2 i statistics from these 2 x 2 tables can be added to yield an overall test of the null hypothesis of the no-mortality model versus the Jolly-Seber model, and is equivalent to the Pollock et al. (1974) test for mortality allowing recruitment. We will refer to this test as Xk'M and denote its degrees of freedom by d/'VM' where nominally dINM = k - 2.
Finally, by further constraining the no-mortality model to have no-reclUitment, we once again arrive at the closed-population model M(. Stanley and BurnlIam (1999) present a statistic for testing tlIe null hypothesis of model M, against the no-mortality model as a specific alternative. This test statistic, which we denote X~'VM' is computed as:
2 ~( .' )2 [ 1 I] ~( , )2 [ I I] (1)X,NM = ~ U i - Ui'i ~+ ~(1- '.) + ~ m, - QiPi Q '+Q.(l _ '.) , 1=1 /.(., " U, "i=2 ,P" P,
where Ti and P, are as defined above for Xf.'VR' The nominal degrees of freedom for this test, denoted df,NM' are k - 2. However, when data are sparse, Ti or Pi can equal 0 and the contribution to X~VM from the component is exactly zero. Thus, for each T, = 0 or each Pi = 0, we reduce the degrees of freedom by one. Given X'fNM' an alternative fom) for the closure test 1.~ is I.; = X~M +d"lM' with nominal degrees of freedom dIe = df,vM + dftNM'
A closure test 20l
4. A simulation study of power
The power of the test statistic X~ to detect violation of demographic closure was evaluated empirically using Monte Carlo simulations. The basic procedure was to first specify the timespecific structure on the k capture probabilities, and second to superimpose permanent or temporary emigration or immigration. Once the time-specific structure and form of migration were specified, 1,000 N x k capture history matrices were simulated and X~ computed. We note that in the context of losses, mortality and pennanent emigration are equivalent, and in the context of additions, recruitment and permanent or temporary immigration are equivalent. Hence, we did not do separate simulations for mortality and recruitment.
Models assigning a capture probability (p) to the ith individual on the jth occasion (i = I, ... ,N;j = I, ... , k), took the fonn P,] = [I + exp(-Po - p;)r l
, where Po is a scaling factor and Pj introduces stochastic time variation and is iid N(O, (J~). The random nature of Pj
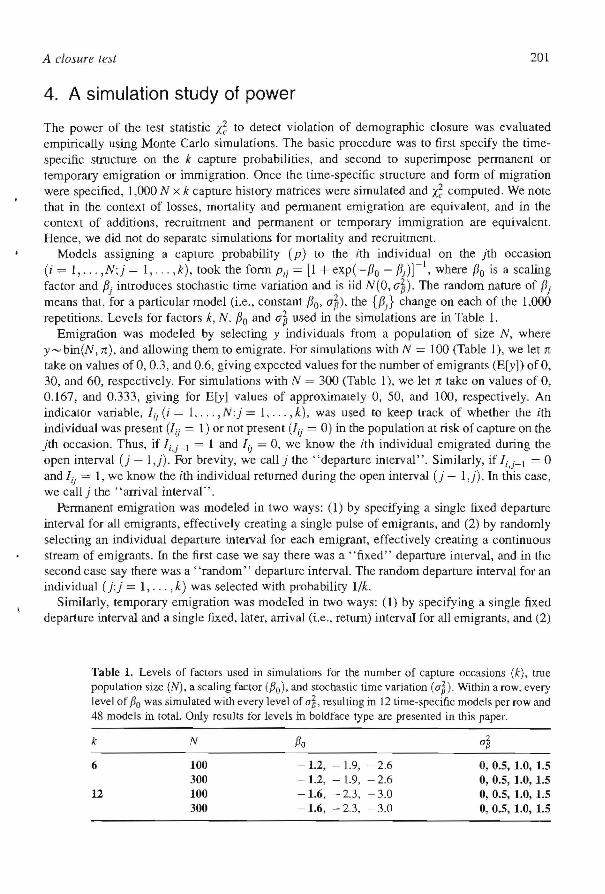
means that, for a particular model (i.e., constant Po' (J~), the {PJ} change on each of the 1,000 repetitions. Levels for factors k, N. ~o and (J~ used in the simulations are in Table 1.
Emigration was modeled by selecting y individuals from a population of size N, where y ~ bin(N 1 n), and allowing them to emigrate. For simulations with N = 100 (Table 1), we let n take on values of 0,0.3, and 0.6, giving expected values for the number of emigrants (E[y]) of 0, 30, and 60, respectively. For simulations with N = 300 (Table 1), we let n take on values of 0, 0.167, and 0.333, giving for E[y] values of approximately 0, 50, and 100, respectively. An indicator variable, Ii! (i = L ... ,N;j = L ... ,k), was used to keep track of whether the ith individual was present (Iii = 1) or not present (Iij = 0) in the population at risk of capture on the jth occasion. Thus, if Ii,;_1 = 1 and I,) = 0, we know the ith individual emigrated during the open interval (j - 1,j). For brevity, we call j the "departure interval". Similarly, if Ii,j-l = 0 and Ii; = 1, we know the ith individual returned during the open interval (j - 1,j). In this case, we callj the "arrival interval".
Pennanent emigration was modeled in two ways: (1) by specifying a single fixed departure interval for all emigrants, effectively creating a single pulse of emigrants, and (2) by randomly selecting an individual departure interval for each emigrant, effectively creating a continuous stream of emigrants. In the first case we say there was a "fixed" departure interval, and in the second case say there was a "random" departure interval. The random departure interval for an individual (j;j = 1, ... ,k) was selected with probability 11k.
Similarly, temporary emigration was modeled in two ways: (1) by specifying a single fixed departure interval and a single fixed, later, arrival (i.e., return) interval for all emigrants, and (2)
Table 1. Levels of fact.ors used in simulations for the number of capture occasions (k), true population size (N), a scaling factor ({Jo), and stochastic time variation (a~). Within a row, every level of Po was simulated wit.h every level of (J~, resulting in 12 time-specific models per row and 48 models in total. Only results for levels in boldface type are presented in this paper.
k N flo a~
6 100 -1.2, -1.9, - 2.6 0, 0.5, 1.0, 1.5 300 -1.2, - 1.9, -2.6 0, 0.5, 1.0, 1.5
12 100 -1.6, -2.3, -3.0 0, 0.5, 1.0, 1.5 300 -1.6, -2.3, -3.0 0, 0.5, 1.0, 1.5
202 Stanley. Burnham
by randomly selecting an individual departure interval and an individual arrival (i.e., return) interval for each emigrant. The random departure interval of an individual (j;j = 1, ... , k - 1) was selected with probability l/(k - 1), and the random an'ival (return) interval of the same individual (j';j' = j + 1, ... , k) was selected with probability l/(k - j).
Note that for both pennanent and temporary emigration, a departure interval of j = 1 means emigration occurred before the first sampling occasion. We modeled emigration in this manner to emulate the biologically realistic situation where disturbance from setting up the trapping grid causes animals to emigrate.
In this study, for the y individuals selected to emigrate, the {Iij} for pennanent emigration with a fixed departure interval was Iii = Iil = l,Ii3 = ... = 1'6 = 0 for k = 6, and III = ... = 1'4 = 1: I i5 = ... = Ijl2 = 0 for k = 12. For temporary emigration with fixed
departure and fixed arrival intervals, the gj} was III = I'l = 1,113 = 1'4 = 0,1'5 = 1,6 = I for k = 6, and Ii] = ... = 1'4 = 1J i5 = ... = Ii8 = 0,1'9 = ... = I!l2 = I for k = 12. For the (N - y) individuals that did not emigrate, the {I'i} was Iil = ... = 1;6 = I for k = 6, and It! = ... = = 1 for k = 12. .I il2
Immigration was modeled by selecting y individuals from a "source" population of size 100, where y ~ bin(1 00,11:), and allowing them to immigrate into a "sink" population of size N. For N = 100 (Table 1), weIet 11: take on values of 0,0.3, and 0.6, giving for Ely] values of 0,30, and 60, respectively. For N = 300 (Table 1), we let 11: take on values of 0,0.5, and 1, giving for E[y] values of 0, 50, and 100, respectively. As was done for emigration, an indicator variable, Iij (i = 1, .... N;j = 1. .... k), was used to keep track of whether the ith individual on the jth occasion was present (Iij = 1) or not present (Iii = 0) in the population at risk of capture.
Pennanent immigration was modeled in two ways: (1) by specifying a single fixed arrival interval for aU immigrants, effectively creating a single pulse of immigrants, and (2) by randomly selecting an individual arrival interval for each immigrant, effectively creating a continuous stream of immigrants. The random arrival interval for an individual (J:j = 1, .... k) was selected with probability Uk.
Temporary immigration was also modeled in two ways: (1) by specifying a single fixed arrival interval and a single fixed departure interval for all immigrants, and (2) by randomly selecting an individual arrival interval and an individual departure interval for each immigrant. The random arrival interval of an individual (j;j = 1, .... k - 1) was selected with probability l/(k -1), and the random departure interval of the same individual U:/ = j + 1. ... ,k) was selected with probability l/(k - j).
Note that for both permanent and temporary immigration, a random arrival interval of j = 1 means immigration occurred before the first sampling occasion. We modeled immigration in this manner to emulate the biologically realistic situation where, for example, baiting traps or other activities associated with setting up the trapping grid causes animals to immigrate.
In this study, for the y individuals selected to immigrate, the {I,]} for permanent immigration with a fixed arrival interval was Ii[ = 0, Ii3 = ... = 1,6 = 1 for k = 6, and= I il Ii] = ... = = 0, liS = ... = It!2 = 1 for k = 12. For temporary immigration with fixedIi4 arrival and fix.ed departure intervals, the {Iij } was Iii = Ii2 = 0,1i3 = Ii4 = l,1i5 = Ii6 = 0 for k = 6, and Ii[ = ... =1"4 =0,1,5 = ... =Ii8 = 1,1;9 = ... =Iil2 = 0 for k = 12. For the (100 - y) individuals in the source population that did not migrate into the sink population, the {Iij} was III = ... = 1;6 = 0 for k = 6, and IiI = ... = 1'12 = 0 for k = 12. For the N individuals in the sink population, the {Iij} was Iii = ... = 1,6 = 1 for k = 6, and It! = ... = Ii12 = 1 for k = 12.
Once the time-specific structure (i.e., {pjj}) and fonn of migration (i.e., {Iij}) were specified,
A closure test 203
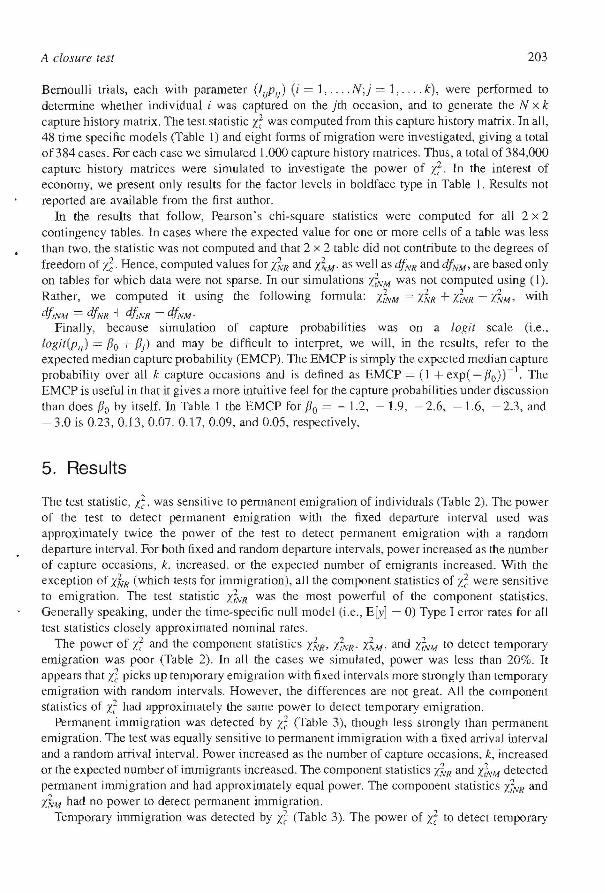
Bernoulli trials, each with parameter (iI/PI}) (i = 1, .... N;j = 1, .... k), were performed to detemline whether individual i was captured on the jth occasion, and to generate the N x k capture history matrix. The test statistic X~ was computed from this capture history matrix. In all, 48 time specific models (Table 1) and eight fOlms of migration were investigated, giving a total of 384 cases. For each case we simulared 1.000 capture history matrices. Thus, a total of 384,000 capture history matrices were simulated to investigate the power of /.~. In the interest of economy, we present only results for the factor levels in boldface type in Table 1. Results not reported are available from the first author.
In the results that follow, Pearson's chi-square statistics were computed for all 2 x 2 contingency tables. In cases where the expected value for one or more cells of a table was less than two. the statistic was not computed and that 2 x 2 table did not contribute to the degrees of freedom of Z~. Hence, computed values for l.~R and X;M' as well as df,,/? and diNM' are based only on tables for which data were not sparse. In our simulations ;}VM was not computed using (1). Rather, we computed it using the following fOlmula: Xi.tvM = /..~R + X7,vR - I..~M' with dfrNM = df,VR + dj"VR - df,vM'
Finally, because simulation of capture probabilities was on a IOfiit scale (i.e .. log it(PI/ ) = flo + Pj ) and may be difficult to interpret, we will, in the results, refer to the expected median capture probability (EMCP). The EMCP is simply the expected median capture probability over all k capture occasions and is defined as EMCP = (I + exp( - 110)) -I. The EMCP is useful in that it gives a more intuitive feel for the capture probabilities under discussion than does Po by itself. In Table 1 the EMCP for flo = - 1.2, - 1.9, - 2.6, - 1.6, - 23, and -3.0 is 0.23, 0.13, 0.07. 0.17, 0.09, and 0.05, respectively.
5. Results
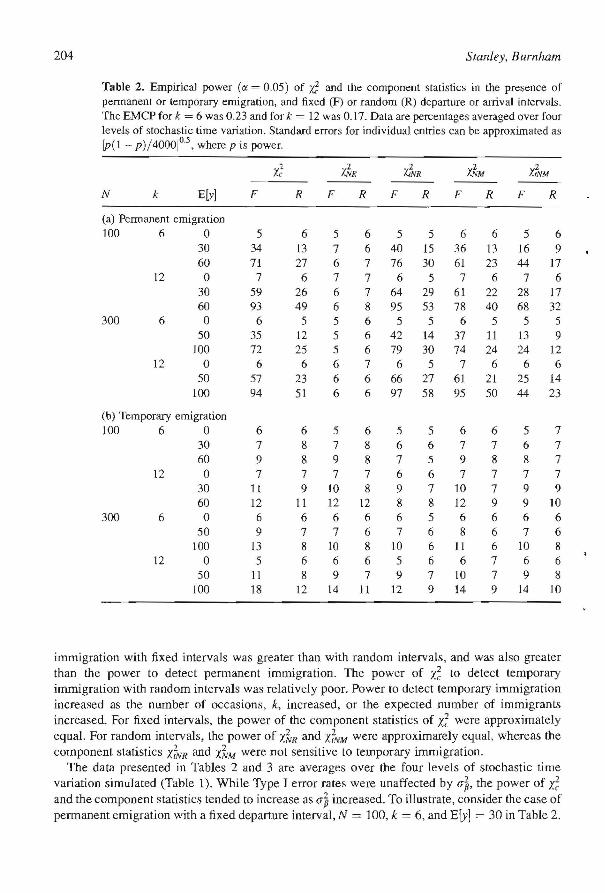
The test statistic, X~, was sensiti ve to permanent emigration of individuals (Table 2). The power of the test to detect permanent emigration with the fixed departure interval used was approximately twice the power of the test to detect pennanent emigration with a random departure interval. For both fixed and random departure intervals, power increased as the number of capture occasions, k. increased. or the expected number of emigrants increased. With the exception of Xk'R (which tests for immigration), all the component statistics of 1..; were sensitive to emigration. The test statistic 1.;VR was the most powerful of the component statistics. Generally speaking, under the time-specific null model (i.e., ElY] = 0) Type I error rates for all test statistics closely approximated nominal rates.
The power of /.~ and the component statistics X..~R' Y";VR' X~M' and d'YM to detect temporary emigration was poor (Table 2). In all the cases we simulated, power was less than 20%. It appears that X~ picks up temporary emigralion with fixed intervals more strongly than temporary emigration with random intervals. However, the differences are not great. All the component statistics of £ had approximately Ihe same power to detect temporary emigration.
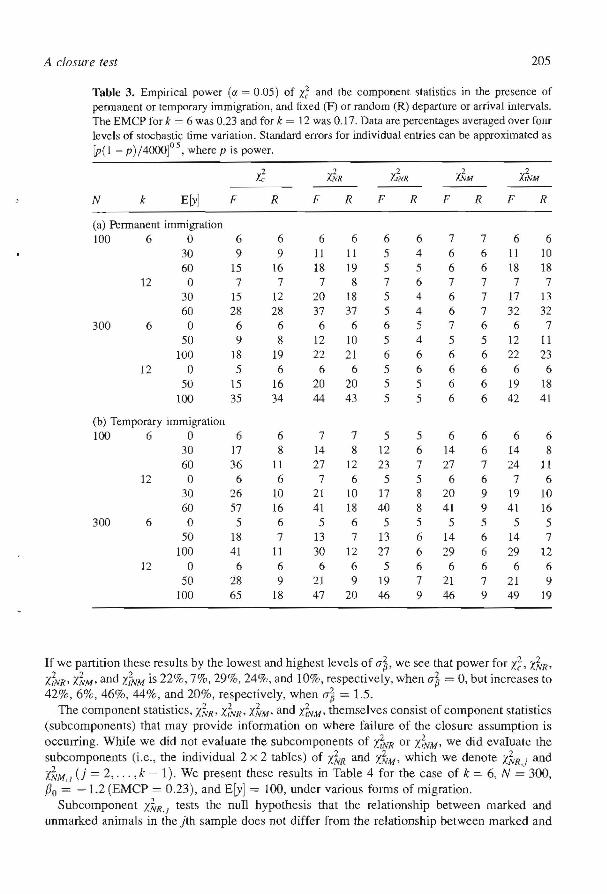
Permanent immigration was detected by X; (Table 3), though less strongly than permanent emigration. The test was equally sensitive to pelmanent immigration with a fixed arrival interval and a random arrival interval. Power increased as the number of capture occasions, k, increased or the expected number of immigrants increased. The component statistics X~R and Xi'VM detected permanent immigration and had approximately equal power. The component statistics Y.~VR and Y.~',w had no power 10 detect permanent immigration.
Temporary immigration was detected by X~ (Table 3). The power of /.~ to delect temporary
204 Stanley, Burnham
Table 2. Empirical power (IX = 0.05) of if: and the component statistics in the presence of permanent or temporary emigration, and fixed (F) or random (R) departure or arrival intervals. The EMCP for k = 6 was 0.23 and for k = 12 was 0.17. Data are percentages averaged over four levels of stochastic time variation. Standard errors for individual entries can be approximated as [P( 1 - p)!4000]°·5, where p is power.
Xc0
Z'~R ifNR X.~M 'x';VM
N k ElY] F R F R F R F R F R
(a) Permanent emigration 100 6 a 5 6 5 6 5 5 6 6 5 6
30 34 13 7 6 40 15 36 13 16 9 60 71 27 6 7 76 30 61 23 44 17
12 0 7 6 7 7 6 5 7 6 7 6 30 59 26 6 7 64 29 61 22 28 17 60 93 49 6 8 95 53 78 40 68 32
300 6 0 6 5 5 6 5 5 6 5 5 5 50 35 12 5 6 42 14 37 11 13 9
100 72 25 5 6 79 30 74 24 24 12 12 0 6 6 6 7 6 5 7 6 6 6
50 57 23 6 6 66 27 61 21 25 14 100 94 51 6 6 97 58 95 50 44 23
(b) Temporary emigmtion 100 6 0 6 6 5 6 5 5 6 6 5 7
30 7 8 7 8 6 6 7 7 6 7 60 9 8 9 8 7 5 9 8 8 7
12 a 7 7 7 7 6 6 7 7 7 7 30 11 9 IO 8 9 7 10 7 9 9 60 12 11 12 12 8 8 12 9 9 10
300 6 0 6 6 6 6 6 5 6 6 6 6 50 9 7 7 6 7 6 8 6 7 6
100 13 8 10 8 10 6 11 6 10 8 12 0 5 6 6 6 5 6 6 7 6 6
50 11 8 9 7 9 7 10 7 9 8 100 18 12 14 11 12 9 14 9 14 10
immigration with fixed intervals was greater than with random intervals, and was also greater than the power to detect permanent immigration, The power of X; to detect temporary immigration with random intervals was relatively poor. Power to detect temporary immigration increased as the nwnber of occasions, k, increased, or the expected number of immigrants increased, For fixed intervals, the power of the component statistics of XZ were approximately equal. For random intervals, the power of X~R and XZ¥M were approximarely equal, whereas the component statistics X~NR and X~M were not sensitive to temporary immigration.
The data presented in Tables 2 and 3 are averages over the four levels of stochastic time variation simulated (Table 1), While Type I error rates were unaffected by aj, the power of X~
and the component statistics tended to increase as a~ increased, To illustrate, consider the case of permanent emigration with a fixed departure interval, N = 100, k = 6, and ElY] = 30 in Table 2,
A closure test 205
Table 3. Empirical power (Cf. = 0.05) of X~ and the component statistics in the presence of peonanent or temporary immigration, and fixed (F) or random (R) departure or arrival intervals. The EMCP for k = 6 was 0.23 and for k = 12 was 0.17. Data are percentages averaged over foOf levels of stochastic time variation. Standard errors for individual entries can be approximated as [PC 1 - p) /4000]° 5, where p is power.
0
X~ l.FoIR X~VR 'I.~M i;;"'M N k Ery] F R F R F R F R F R
(a) Permanent immigration 100 6 0 6 6 6 6 6 6 7 7 6 6
30 9 9 11 II 5 4 6 6 11 10 60 15 16 18 19 5 5 6 6 18 18
12 0 7 7 7 8 7 6 7 7 7 7 30 15 12 20 18 5 4 6 7 17 13 60 28 28 37 37 5 4 6 7 32 32
300 6 0 6 6 6 6 6 5 7 6 6 7 50 9 8 12 10 5 4 5 5 12 11
100 18 19 22 21 6 6 6 6 22 23 12 a 5 6 6 6 5 6 6 6 6 6
50 15 16 20 20 5 5 6 6 19 18 100 35 34 44 43 5 5 6 6 42 41
(b) Temporary immigration 100 6 0 6 6 7 7 5 5 6 6 6 6
30 17 8 14 8 12 6 14 6 14 8 60 36 11 27 12 23 7 27 7 24 11
12 0 6 6 7 6 5 5 6 6 7 6 30 26 10 21 10 17 8 20 9 19 10 60 57 16 41 18 40 8 41 9 41 16
300 6 0 5 6 5 6 5 5 5 5 5 5 50 18 7 13 7 13 6 14 6 14 7
100 41 11 30 12 27 6 29 6 29 12 12 0 6 6 6 6 5 6 6 6 6 6
50 28 9 21 9 19 7 21 7 21 9 100 65 18 47 20 46 9 46 9 49 19
If we partition these results by the lowest and highest levels of (}~, we see that power for ;d, Z1R' X~VR' l.~·M' and r..'fNM is 22%, 7%, 29%, 24%, and 10%, respectively, when (}~ = 0, but increases to 42%,6%,46%, 44%, and 20%, respectively, when (}'~ = 1.5.
The componenl statistics. X~R' 'd'lR, X~M' and X7.'1M' themselves consist of component statislics (subcomponents) that may provide information on where failure of the closure assumption is occurring. While we did not evaluate the subcomponents of d'lR or X~'1M' we did evaluate the subcomponents (i.e., the individual 2 x 2 tables) of X~R and X~M' which we denote X~R,.i and !.~'M'I (j = 2, ... , k - 1). We present these results in Table 4 for the case of k = 6, N = 300, 130 = -1.2 (EMCP = 0.23), and ElY] = 100, under various fOims of migration.
Subcomponent Y.~R'I tests the null hypothesis that the relationship between marked and unmarked animals in the jth sample does not differ from the relationship between marked and
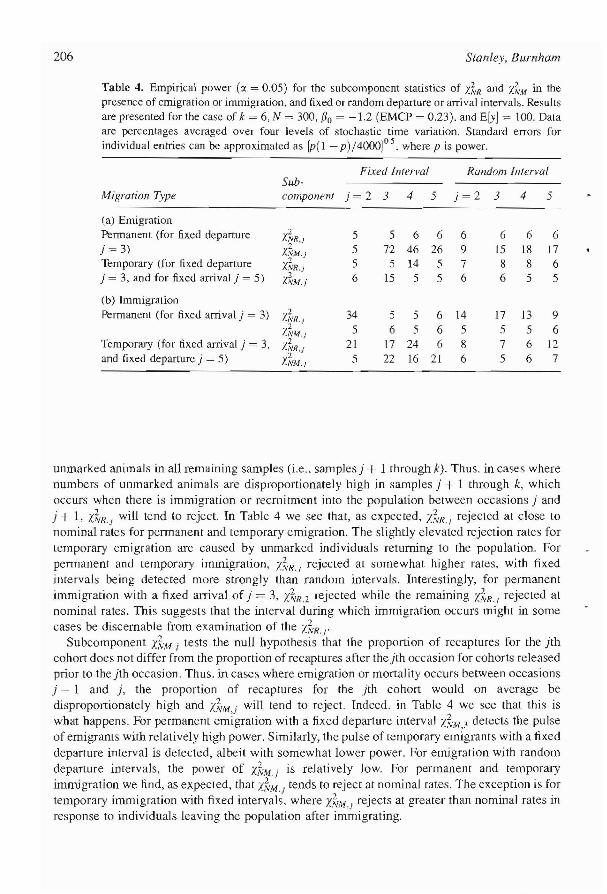
unmarked animals in all remaining samples (i.e.. samples) + 1 through k). Thus. in cases where numbers of unmarked animals are disproportionately high in samples) + 1 through k, which occurs when there is immigration or recrnitment into the population between occasions) and j + 1, X~R.I will tend to reject. In Table 4 we see that, as expected, J.~'R./ rejected at close to nominal rates for permanent and temporary emigration. The slightly elevated rejection rates for temporary emigration are caused by unmarked individuals returning to the population. For permanent and temporary immigration, X~'R., rejected at somewhat higher rates. with fixed intervals being detected more strongly than random intervals. Interestingly, for permanent immigration with a fixed arrival of j = 3, X~R.2 rejected while the remaining /..~'R., rejected at nominal rates. This suggests that the interval during which immigration occurs might in some cases be discernable from examination of the X~'R.r
Subcomponent X~"\'f i tests the null hypothesis that the proportion of recaptures for the )th cohort does not differ from the proportion of recaptures after the jth occasion for cohorts released prior to the jth occasion. Thus. in cases where emigration or mortality occurs between occasions j - 1 and j, the proportion of recaptures for the jth cohort would on average be disproportionately high and X~/M,j will tend to reject. Indeed. in Table 4 we see that this is what happens. For permanent emigration with a fixed departure interval X~'M,~ detects the pulse of emigrants with relatively high power. Similarly, the pulse of temporary emigrants with a fixed departure interval is detected, albeit with somewhat lower power. For emigration with random departure intervals, the power of x-k.w.j is relatively low. For permanent and temporary immigration we lind, as expected, that X~M.I tends to reject at nominal rates. The exception is for temporary immigration with fixed intervals. where Y.'~/M.I rejects at greater than nominal rates in response to individuals leaving the population after immigrating.
A closure rest 207
6. Discussion
The closure test we present is very versatile, and provides researchers with a new tool for testing demographic closure in the presence of time-specific variation in capture probabilities. The test is developed in a framework unifying open- and closed-population models. and uses partitions of the residual distribution for model M that, in the spirit of Pollock el al. (1974), can be used tor
select an appropriate model or submodel for estimation. While we present only two partitions of this residual distribution, one resulting in the no-recruitment model and one resul ting in Lhe nomortality model (Pollock et al.,J990), other less appealing partitions are possible (e.g., constraining recruitment or mortality over only some of the capture occasions to give' 'partial recruitment" or "partial mortality" models).
Our simulation results demonstrate the test statistic X~ is sensitive to pemlanent and temporary emigration and immigration. For fixed intervals. which we used to model a "pulse" of migrants, the relative power of X~ for the forms of migration investigated was: permanent emigration> temporary immigration> permanent immigration> temporary emigration. For random inLervals, which we used Lo model a "continuous flow" of migrants, the relative power was: permanent emigration> permanent immigration> temporary immigration> temporary emigration. Thus, in general the test was most sensitive to permanent emigration and least sensitive to temporary emigration.
For populations consisting of 100 individuals, the overall power of :d to detect closure violation was moderate to low. Even in cases where 60% of the population migrated, only permanent emigration and temporary immigration were detected with reasonable power. For populations of 300 individuals power improved somewhat. but for temporary emigration and pemlanent and temporary immigration power was stilJ somewhat low even when as many as 100 individuals migrated. Thus, X~ will be of greatest value to researchers when the number of migrating individuals is relatively large and there is permanent emigration.
Of some concern to ecologists is how robust the estimator for model lvi, is when closure is violated, but is not detected by the closure test-for example, Lemporary emigration where the power of the test is low. If the estimator is robust to such violations, then our inability to detect them may be of no consequence. However, if bias is high. then our inability to detect closure violations, such as temporary emigration. are more significant. To our knowledge. studies evaluating the robustness of the closed-population models to violation of the closure assumption have not been conducted. and we did not do so in this study. Rather, our focus was on the performance and power of the proposed closure test under a wide array of biologically realistic fomls of closure violation. Nonetheless, we think studies evaluating estimator robustness under closure violation are of value and merit future research.
A useful feature of the test we present is that it can be decomposed into informative components. Examination of these components can lead to greater understanding of the nature of the closure violation. To illnstrate. we found that for permanent emigration Y..l..../R. Y..~'M' and Y..~\'M
tend to reject, while X~'R does not. In contrast, for pemmnenL immigration, X~'R and l.Z\'M lend to reject while XZVR and X~M do noL. Finally, for temporary emigration and temporary immigration, all the component statistics reject to a greater or lesser degree. Thus, in principle, it is possible to distinguish between closure violation due to pemlanent emigrat.ion, pennanent immigration, and temporary emigration or immigration using the pattern of rejection of the component statistics. In a similar manner, examination of the subcomponent statistics of X~R and X~M' in conjnnction with an understanding of the specific hypotheses being tested, can provide insights into the
208 Stanley, Burnham
intervals during which migration is occurring. This is particularly true in the case of permanent emigration or permanent immigration, where migration occurs as a "pulse".
The closure test presented in this paper was developed under a null model allowing for timespecific variation in capture probabilities in the absence of behavioral variation or heterogeneity in capture probabilities. Indeed, in the presence of behavioral variation or heterogeneity in capture probabilities and no migration, the test rejects at rates greater than the nominal error rates (Stanley and Burnham, 1999). Thus, the test is not intended to replace the closure test of Otis et af. (1978) in which the null model allows for heterogeneity in capture probabilities but is sensitive to time or behavioral variation in capture probabilities. We see this test as a tool to be used in conjunction with the Otis et al. (1978) test, to better detect closure violations in a capture-recapture data set. Like the Otis et ai. (1978) test, our overall test, X~, rejects in the presence of behavioral variation in capture probabilities (Stanley and Burnham, 1999). However, examination of the component statistics reveals that, in me presence of behavioral variation in capture probabilities and no migration, X~R and XZVM reject but X~R and X~M do not. Thus, certain forms of closure violation, such as permanent emigration and temporary immigration where XZVR and X~M tend to reject, may be detectable even in the presence of behavioral variation in capture probabilities. For this reason, the four component statistics of X~
will need to be reported in any implementation of this test.
References
Burnham, K.P. (1997) Distributional results for special cases of the Jolly-Seber model. Communications ill Statistics, 26, 1395-409.
Burnham, K.P., Anderson, D.R., White, G.c., Brownie, C., and Pollock, K.H. (1987) Design and analysis methods for fish survival experiments based on release-recapture. American Fisheries Society Monograph. 5.
Darroch, J.N. (1958) The multiple-recapture census: 1. Estimation of a closed population. Biometrika, 45, 343-59.
Jolly, G.M. (1965) Explicit estimates from capture-recapture data with both death and immigrationstochastic model. Biometrika, 52, 225-47.
Jolly, G.M. (1982) Mark-recapture models with parameters constant in time. Biometrics, 38, 301-21. Lebreton, J.-D., Burnham, K.P., Clobcn, J., and Anderson, D.R. (1992) Modeling survival and testing
biological hypotheses using marked animals: a unified approach with case studies. Ecological Monographs, 62,67-118.
Otis, D.L., Burnham, K.P., White, G.C, and Anderson, D.R. (1978) Statistical inference from capture data on closed populations. Wildlife Monographs, 62.
Pollock, K.H., Solomon. D.L., and Robson, D.S. (1974) Tests for mortality and recruitment in a K-sample tag-recapture experiment. Biometrics, 30, 77-87.
Pollock, K.H., Nichols, J.D.. Brownie, C, and Hines. J.E. (1990) Statistical inference for capture-recapture experiments. Wildlife Monographs. 107.
Robson, D-S. and Flick, W.A. (1965) A non-parametric statistical method for culling recruits from a markrecapture experiment. Biometrics, 21, 936-47.
Robson, D.S. and Regier, H.A. (1968) Estimation of population number and mortality rates. In Methods for Assessment ofFish Production in Fresh Waters, IBP Handbook No.3, W.E. Ricker (ed), Blackwell Scientific Publications: Oxford. pp. 124--58.
Seber, G.A.F. (1965) A note on the multiple recapture census. Biometrika, 52,249-59. Seber, G.A.F. (1982) The estimation of animal abundance and related parameters, Second edition.
Macmillan. New York, New York, USA.

A closure lesc 209
Seber, G.A.F. (1992) A review of estimating animal abundance II. 1l1lerrullionol SIOlistical Reviews, 60, 129-66.
Stanley, T.R. and Burnham, K.P. (1999). A goodness-of-fit test for capture-recapture model M( under closure. Biometrics, 55, 127-38.
White, G.c., Anderson, D.R., Burnham, K.P., and Otis, D.L. (1982) Capture-recapture and removal methods for sampling closed populations. Los Alamos National Laboratory, LA-8787-NERP, Los Alamos, New Mexico, USA.
Biographical sketches
Thomas R. Stanley has a B.S. in Conservation, an M.S. in Zoology, and a Ph.D. in Wildlife Biology from Colorado State University (1997). He is currently a Wildlife Research Biologist in the Vertebrate Ecology Section of the USGS Midcontinent Ecological Science Center in Fort Collins, Colorado. His research interests are in the areas of vertebrate population biology, biostatistics, and wildlife-habitat relations. He has published papers on model selection for closed-population capture-recapture studies, the effects of environmental contaminants on avian survival and reproduction, and ecosystem management.
Kenneth P. Burnham has a B.S. in biology (1966) and an M.S. (1969) and Ph.D. (1972) in statistics. After having worked in Oregon, Alaska, Maryland and North Carolina, Ken is now part of the Colorado Cooperative Fish and Wildlife Research Unit at Colorado State University. Ken's professional interests are in design of wildlife research, statistical methods for caprurerecapture and distance sampling, and data analysis in general for estimation of biological abundance and demographic parameters. A more recent research emphasis has been theory and application of information theoretic model selection (i.e., "AlC"); he is a coauthor of a recent book on this subject. Ken is a Fellow of the American Statistical Association.

"