Embed Size (px)
Citation preview
A CLASSICAL APPROACH TO SCIENCE: SOCRATIC SEMINARS AND DATA
ANALYSIS AND INTERPRETATION
by
Jennifer Anne Smith
A professional paper submitted in partial fulfillment of the requirements for the degree
of
Master of Science
in
Science Education
MONTANA STATE UNIVERSITY Bozeman, Montana
July 2014
ii
STATEMENT OF PERMISSION TO USE
In presenting this professional paper in partial fulfillment of the requirements for
a master’s degree at Montana State University, I agree that the MSSE Program shall
make it available to borrowers under rules of the program.
Jennifer Anne Smith
July 2014
iii
TABLE OF CONTENTS
INTRODUCTION AND BACKGROUND ........................................................................1
CONCEPTUAL FRAMEWORK ........................................................................................5
METHODOLOGY ............................................................................................................13
DATA AND ANALYSIS ..................................................................................................20
INTERPRETATION AND CONCLUSION .....................................................................35
VALUE ..............................................................................................................................38
REFERENCES CITED ......................................................................................................42
APPENDICES ...................................................................................................................46
APPENDIX A: Montana State University’s Institutional Review Board Exemption ..............................................................................................................47 APPENDIX B: Heat Transfer and Specific Heat Seminar ....................................49 APPENDIX C: Heating Curve of Water Seminar .................................................55 APPENDIX D: Cooling Water Lab .......................................................................60 APPENDIX E: How to Read and Make a Graph ..................................................64 APPENDIX F: Climate Change Seminar ..............................................................67 APPENDIX G: Data Analysis and Interpretation Assessment ..............................74 APPENDIX H: Data Analysis and Interpretation Assessment Rubric ..................79 APPENDIX I: Cooling Water Lab Rubric.............................................................83 APPENDIX J: Participation Tally Sheet ...............................................................86 APPENDIX K: Reaction in a Bag Lab ..................................................................88 APPENDIX L: Seminar Reflection Questions ......................................................93 APPENDIX M: Homework Grading Rubric .........................................................95 APPENDIX N: Confidence Survey: Data Analysis and Interpretation .................97 APPENDIX O: Confidence Interview Questions ..................................................99
iv
LIST OF TABLES
1. Socratic Seminar Timeline ............................................................................................16
2. Data Triangulation Matrix ............................................................................................20
3. Homework Responses with Correct Summary of Data ................................................26
4. Homework Responses Containing Common Misconceptions Post-Seminar ...............27
5. Percentage of Students Participating by Number of Questions and Comments in the Non-treatment Discussion and Treatment Seminars..............................................29
6. Data Analysis and Interpretation Skills and Changes in Confidence and
Achievement ..........................................................................................................34
v
LIST OF FIGURES
1. Average Topic Score for Questions 1, 2, and 3 on Pre and Post-Data Analysis and Interpretation Assessment. .....................................................................................21
2. Topic Averages for Questions 7 and 9-13 on Cooling Water Post-Lab .......................23 3. Normalized Gain by Topic and Question on Cooling Water Post-Lab ........................24
4. Average response to Data Analysis and Interpretation Confidence Survey .................33
vi
ABSTRACT
In this study, Socratic seminars were implemented in chemistry classes for the purpose of promoting data analysis and interpretation. Socratic seminars are deliberate discussions surrounding a text. Students engaged in four separate seminars using a set of data as their text. The effectiveness of Socratic seminars in increasing student confidence, performance and frequency of scientific communication in relation to data analysis and interpretation was analyzed. The study revealed mixed results, especially with relation to achievement in data analysis and interpretation skills. Confidence levels generally increased. The greatest gains were made in student participation and the frequency and value of comments.
1
INTRODUCTION AND BACKGROUND
The Classical Academy (TCA) High School in Colorado Springs proudly ranks
fifth in the state of Colorado based on advanced placement opportunities (U.S. News,
2013). Additionally, in 2013, 83.6% of TCA’s tenth grade students scored proficient or
advanced on the Transitional Colorado Assessment Program (TCAP) science tests,
compared to the district’s result of 68.9% and the state’s result of 51.3% (Colorado
Department of Education, 2013). Even though performing well on those exams and
winning awards are not the goals of the school’s educational philosophy, they do lend
credence to its educational model. TCA serves as a K-12 public charter school with an
emphasis on classical pedagogy, such as focusing on the trivium subjects of grammar,
logic, and rhetoric. Some educational methods encouraged by this philosophy are
cooperative group work and Socratic seminars because they promote students doing the
work of learning.
The predominantly conservative community surrounding the school comprises a
large retired military population and many religious organizations within a short drive of
the school. According to the Colorado Department of Education (CDE, 2013), the high
school serves a student population of 618 students with a 13% minority population.
TCA’s mission statement values parental involvement at the school: “The Classical
Academy exists to assist parents in their mission to develop exemplary citizens equipped
with analytical thinking skills, virtuous character, and a passion for learning, all built
upon a solid foundation of knowledge” (The Classical Academy, 2010). In addition to the
2
specific instructional philosophy and parental support, TCA distinguishes itself from
other public schools in the district by promoting small class sizes, a dress code, and
character education (The Classical Academy, 2012). Although TCA boasts high
academic achievement, the school has been hindered in the past few years by a huge
turnover in staff, devastating wildfires, and low school spirit. The administration
currently strives to improve morale among staff and students, targeting the alleged
imbalance of the homework load experienced by the students.
Academics and school involvement remain as high priorities at TCA. The school
offers college preparatory, honors, and Advanced Placement (AP) level studies, including
five different AP sciences. Ninety-eight percent of our 2012 graduates pursued further
education at two or four year colleges (Peters, 2012). The majority of students participate
in extra-curricular activities such as sports, the arts, and speech and debate. In addition,
all high school students must serve at least 40 hours of community service in order to
graduate.
For the past six years, I have taught a variety of chemistry and physics classes at
TCA. For the 2013-14 school year, I had 69 students in 4 sections of chemistry and 1 AP
Physics B class with 11 students, making my average class size 16 students. Furthermore,
this group of students was the most highly motivated students I have ever had in my
career. I conduct lessons in a hybrid classroom that can be converted from class to
laboratory as necessary. While this introduces safety challenges during labs, I appreciate
the ease that I can move around the tables and chairs for discussion-based lessons.
3
Despite the documented academic successes of TCA, many students still face
challenges in the areas of data analysis and scientific communication. Forty percent of the
science TCAP test questions cover the topics of scientific investigations, the nature of
science, and results and data analysis (CDE, 2011). Many students struggle with
interpreting graphically represented scientific data. There exists a noticeable lack of
engagement and confidence whenever students are faced with a chart or graph and asked
to interpret the information. Students often leave large portions of analysis sections of lab
reports unfinished due to a lack of understanding and the inability to communicate their
findings effectively. Interpreting scientific data and communicating scientific findings
function as essential skills students carry with them beyond high school as they seek to
make sense of the deluge of information provided by modern society.
The National Research Council (NRC) challenges teachers to follow the
Framework for K-12 Science Education for promoting student understanding and ability
to communicate science. Among other things, the Framework encourages data analysis
and scientific communication. For example, by the time a student graduates high school,
the student “should be able to…construct a scientific argument showing how data support
a claim” and “ read scientific and engineering text, including tables, diagrams, and
graphs, … and explain the key ideas” (NRC, 2012, p.72, 76). Underlying these goals is
the ability to communicate the scientific understanding in a meaningful way just as
scientists and engineers must do to further their discoveries. Writers of the Framework
identified eight overarching practices for K-12 science classroom. The list includes
4
analyzing and interpreting data, constructing explanations, engaging in argument from
evidence, and obtaining, evaluating, and communicating information. The Framework for
K-12 Science Education requires teachers to vary their teaching methods to reach these
goals and implement these practices.
Traditional classroom methods, such as lectures, do not promote metacognitive
practices necessary to carry out the goals in the Framework (Overholser, 1992). Effective
instruction necessitates high level thinking and clear communication skills. In particular,
Socratic seminars promote critical thinking, communication skills, and a passion for
learning (Chowning, 2009; Le & DeFilippo, 2008). Socratic (or Paideia) seminars consist
of “collaborative, intellectual dialogue facilitated with open-ended questions about a text”
(Billings & Roberts, 2003, p.16). According to Tredway (1995), the acquisition of
knowledge in a seminar happens at a higher level of thinking than less active methods. If
science teachers wish to achieve the conceptual, analytical, and relational goals in the
Framework for K-12 Science Education, Socratic seminar proves to be a powerful tool.
Three professional development days in the past two school years were devoted to
learning how to implement Socratic seminars and higher level questioning in the
classroom. As a whole, however, the science department at TCA refuses to embrace this
aspect of TCA’s educational philosophy either due to lack of time or skepticism. While
not being forced to implement seminars, TCA strongly encourages teachers to try them.
The necessity of improving data analysis and communication skills and the charge to
conduct Socratic seminars in my classes led me to my research question: Do Socratic
5
seminars increase student achievement in data analysis and interpretation? In addition, I
wanted to know
1) Do Socratic seminars increase student confidence in analyzing and interpreting data?
2) Do Socratic seminars encourage more frequent and informed scientific communication
among students in the classroom and in written responses to the teacher?
CONCEPTUAL FRAMEWORK
Socratic seminar gets its name from the Greek philosopher, Socrates (470-399
BCE). Socrates inspired his students to take an active role in their learning. He used
probing questions to draw knowledge out of his students as a mid-wife aids in the birth of
a child (Koellner-Clark, Stallings, & Hoover, 2002; Myers, L.L., 1988). The purpose of
his questions was to prompt his students to think analytically so they could identify
fallacies in their argument (Chowning, 2009; Overholser, 1992). Socratic seminars
employ this active learning style which dates back to ancient Greece.
John Dewey and Mortimer Adler, both educational progressivists of the 20th
century, advanced the educational philosophy supporting Socratic seminars. According to
Koellner-Clark, Stallings, and Hoover (2002), Dewey believed classroom discussions
should start with a new problem to which students may apply previous knowledge.
Teachers follow up with a line of questioning to lead to the specific understanding
desired. The focus for teachers and students should be as much on the process as it is on
the knowledge obtained. Socrates’ legacy of teaching through questions continued
through Dewey’s constructivist views.
6
Adler promoted Socratic (Paideia) seminars as a means of higher level student
learning (Chowning, 2009). Adler (1982) believed there were three components to
education: the “acquisition of knowledge,” the “development of intellectual skills,” and
the “enlarged understanding of ideas and knowledge” (p.22). The latter goal, he argued,
could be achieved through Socratic seminar. According to the following research across
the United States, Adler was correct.
Socratic seminars have been implemented in elementary and middle school
classrooms across the United States with much success. At Hunters Woods Elementary
School in Reston, Virginia, Socratic seminars were used to enhance the reading
curriculum for kindergarten and first grade students (Le & DeFilippo, 2008). Teachers at
Lookout Valley Middle School in Chattanooga, Tennessee, implement about 20 Socratic
seminars per year. A two-year study revealed the seminars improved students’ critical
thinking skills and sparked an interest in learning (Polite & Adams, 1997).
College educators are also employing Socratic style methods. In one study,
Holme (1992) describes the utilization of Socratic style questioning and small discussion
groups as a way of increasing student involvement and interest in first year chemistry
classes at the University of South Dakota. The questions allow the professor to draw the
information out of the students rather than delivering the information via lecture. The
study reveals an improved attitude towards class and higher test scores for the students.
At Trinity College, Heeren (1990) used Socratic questioning and dialogue to
engage students in general and organic chemistry courses. Because the students read the
7
material for comprehension before coming to class, the discussions were richer and
students’ understanding and attitude towards the class improved. A significant increase in
test scores and improved scientific communication occurred when professors at Campbell
University School of Pharmacy in North Carolina started using Socratic methods in their
classes (Junker, Waterhouse, & Garrett, 1993). A final study conducted in a genetics
course at the University of Colorado (Smith, et al., 2009) found that peer discussion not
only increased the frequency of the correct answer, it actually improved understanding of
the material. Socratic questioning and peer discussion, components of Socratic seminars,
increase student scores and improve student attitudes in college level science courses.
The following two studies focused on Socratic seminars in the secondary math
classroom. The first study reported using Socratic seminar in an attempt to fulfill a
national mathematics standard involving students communicating math strategies, similar
to goals found in the Framework for K-12 science. Socratic seminars improved students’
attitudes toward reading math, increased student participation in the class, and enhanced
the use of proper mathematical vocabulary. The researcher acknowledged the value of
this technique in getting students to think critically and share in the learning (Tanner and
Casados, 1998).
The study at Forest Park High School in Forest Park, Georgia focused on a
Socratic seminar used to teach the concept of functions. For example, students were
asked which graph in a group of four represented the vertical movement of a Ferris wheel
over time. The discussion developed from the students disagreeing about the correct
8
answer and defending their ideas to their peers. They reported all of the students found
the seminars to be fun and showed increased mathematical reasoning. Furthermore, those
classes which engaged in Socratic seminar scored higher on achievement tests than the
control classes. This study offers hope for the use of Socratic seminar in data analysis,
particularly graph and chart interpretations (Koellner-Clark et al., 2002).
The literature is rather limited about the implementation of Socratic seminars in
high school science classes. Tredway (1995) expresses shock at its absence from science
classrooms and from research in spite of the overwhelming success. As McComas (2004)
points out, much of true science is subjective and lends itself to the open-ended dialogue
of Socratic seminars. Chowning (2009) reported a Socratic seminar about a controversial
genetic treatment promoted deeper understanding of a complex idea. Additionally, the
participants appreciated the inclusion of all of the students in the discussion and felt the
support of the entire class when trying to understand a difficult text. The seminar
promoted self-discovery of the material which translates to deeper understanding for the
student and practice in critical thinking (Overholser, 1992). For these reasons, science
classes are a perfect forum for these discussions.
Besides increased love of learning and critical thinking skills, communication
skills and confidence flourish through Socratic seminars. In another case study, the
teachers reported the students with Socratic seminar experience exhibit more respect,
better eye contact, and more patience than students who have not had the benefit of
participating in these seminars. Socratic seminar boosted confidence and self-esteem
9
because the students were viewed as capable of constructing meaning from difficult texts
(Tredway, 1995).
For all of its benefits, Socratic seminar is not without its downfalls. Lower level
science courses typically ask students questions which have right or wrong answers,
eliminating the open-endedness of Socratic questioning (Holme, 1992). The difference in
expectations between the normal classroom and a seminar class causes difficulties for
some students (Polite & Adams, 1997). Furthermore, some students just prefer the
traditional classroom setting to one where the onus of learning is on them (Polite &
Adams, 1997). According to Chowning (2009), the Socratic seminar balances
precariously between collaboration and lack of control. The need to cover material and
the differences between seminar class and normal class can make Socratic seminar a
challenging technique for both instructor and student.
Some of these challenges may be overcome with proper training and proper focus.
Teachers must prepare their students, set clear expectations, and give structure to the
discussion. Teachers must be willing to learn a new technique with aspects unlike their
normal teacher role (Phanstiel, 1996). With a detailed plan and clearly communicated
expectations of roles and rules, Socratic seminars may aid in the development of critical
thinking, communication skills, and passion for learning.
The primary goal of a Socratic seminar is to achieve a deeper understanding of a
text through discussion (Chowning, 2009; Roberts & Billings, 2008). A teacher must
select a thought provoking and relevant text (Koellner-Clark, et al., 2002; Polite &
10
Adams, 1997; Tredway, 1995). In science courses, the text could include the periodic
table, an article, a film clip, an artifact, an essay, a biographical sketch of a scientist, or a
scientific demonstration (Billings & Roberts, 2012; Chowning, 2009; Phanstiel, 1996;
Roberts & Billings, 2008; Tredway, 1995). For best results, Roberts and Billings (2008)
suggest teachers provide strategies to interpret the text before the discussion. For
example, students could identify key words in the text, summarize the text, or organize
the information in the text using a graphic organizer.
Other preliminary tasks include setting up the room and recording goals. Since
Socratic seminar is a discussion among students, the seating should allow for students to
look at each other, such as a circle (Chowning, 2009; Phanstiel, 1996). Chowning also
says the rules or norms for Socratic seminar should be posted prominently in the
classroom. As practiced by Tanner and Casados (1998), students may come up with a
personal goal for the discussion such as how many times and in which way they will
contribute to the discussion. After the teacher and students establish the text,
expectations, and goals, the seminar may commence.
A Socratic seminar begins with the teacher asking a question; in this way, the
teacher acts as a “catalyst” for the discussion (Overholser, 1992, p.14). The questions
posed at the start and throughout the seminar follow the form of all good Socratic
questions. According to Overholser (1992) and Chowning (2009), Socratic questions are
open-ended questions which cause students to articulate a view of the text, formulate
creative ideas, and evaluate the text’s values. Teachers should avoid questions with
11
merely correct or factual answers; questions with unclear or ambiguous answers work
best (Chowning, 2009). Subsequent questions in the seminar should be based on students’
comments to the original question (Tredway, 1995).
In a class where a specific skill is necessary or a correct answer is sought, the
initial question can start students down the problem-solving path. Then the following
questions can open the students to alternative methods to solve the problem (Overholser,
1992). Tanner and Casados (1998) focused the starting questions on an issue in the text or
a strategy for solving a word problem. The proceeding questions, then, clarify the steps in
a student’s thought process. In the study conducted by Koellner-Clark et al. (2002), the
questions had specific correct answers but were challenging and required complex
thinking so as to fit well in the Socratic seminar model.
The roles of teacher and student blend together in a Socratic seminar. A teacher
assumes an active participant role and, thereby, becomes an equal to the students (Adler,
1982; Roberts & Billings, 2008). All participants contribute by drawing comments from
the texts, sharing insights, asking clarifying questions, and requesting textual evidence
(Chowning, 2009; Tredway, 1995). Phanstiel (1996) recommends the seminar teacher not
provide positive feedback to students. Teachers also employ wait time and do not save
the discussion from awkward silences (Chowning, 2009; Wiggins, 2011). The students
have a lot of responsibility in a seminar. They are expected to drive the discussion while
staying attentive to the posted expectations and rules. After the seminar, the teacher leads
the class in a debriefing session which includes evaluating how well the class and
12
individuals achieved their goals (Chowning, 2009). Roberts and Billings (2008) also
encourage a written piece reflecting on the seminar process. Since a teacher does not
comment on the correctness of students’ viewpoints during a seminar, the following class
period may be a time to revisit misconceptions brought to light during the seminar
(Koellner-Clark, 2002). Proper preparation, implementation, and follow-up improve
success for Socratic seminar participants.
Socratic seminar is not a new educational technique, and it works to fulfill
standards already in place. Both the Colorado State Standards and the K-12 Framework
for Science Education emphasize data analysis and communication skills. State tests rank
students below proficient or proficient or above in the category of results and data
analysis. The CDE says this category is where a “student organizes, analyzes, interprets,
and predicts from scientific data in order to communicate the results of investigations”
(2010, p.12). As one of the eight scientific and engineering practices of the K-12
Framework, analyzing and interpreting data is “the process of assigning meaning to
collected information and determining conclusions, significance, and implications”
(Rivet, 2012). According to this definition, analyzing and interpreting data carries over
into other scientific practices listed in the framework such as using mathematics and
computational thinking and constructing explanations. When paired with Socratic
seminars, the students also fulfill the last two scientific practices of engaging in argument
from evidence and obtaining, evaluating, and communicating information. “Science
cannot advance if scientists are unable to communicate their findings clearly and
13
persuasively or to learn about the findings of others” (NRC, 2012, p.53). As students
work through a seminar, they also learn the art of scientific communication and,
hopefully, refine their analysis skills.
Socratic seminar offers a structured, challenging, and enriching form of
discussion which improves student attitudes, achievement, and scientific communication.
While more research is needed in science classes, recent studies show the seminar’s
usefulness in data analysis and the development of other critical thinking skills. These
skills, along with the communication skills and increased confidence in science, prepare
students to become active citizens and lifelong learners.
METHODOLOGY
The treatment of this study involved implementing Socratic seminars in the
regular chemistry curriculum. During the Socratic seminars, students were expected to
analyze data presented in the form of observations, tables, or graphs. The Socratic
seminars were conducted in 4 college-preparatory chemistry classes with 69 students. Of
the 69 students, 32 were male and 37 were female. Only nine percent were juniors or
seniors, while the rest of the students were sophomores. The racial breakdown of the
classes reflected TCA’s demographics as a whole: 89% white, 7% Hispanic/Latino, 3%
Asian, and 1% black (Race ethnicity, 2014). I implemented four seminars over the course
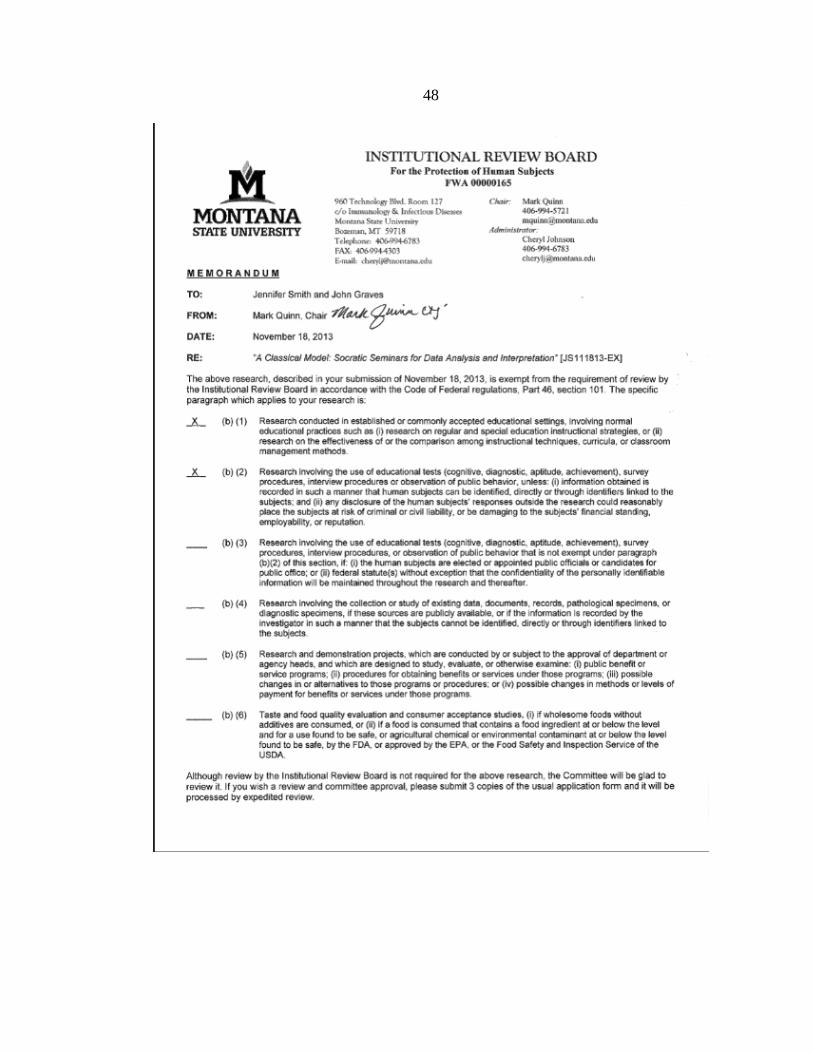
of three months. The research methodology for this project received an exemption by
Montana State University’s Institutional Review Board and compliance for working with
human subjects was maintained (Appendix A).
14
I arranged the chemistry classroom to allow for seating conducive to Socratic
seminars. I assigned students seats in an outer and an inner circle of desks. Expectations
and rules for Socratic seminar were posted on the screen since they are slightly different
than for a normal class period. The adapted rules were
• Do not raise your hand
• Pay attention and listen well
• Do not interrupt
• Refer to the previous speaker by name
• Look at each other when speaking
• Base comments on the text and refer to the text often
• All conversation is directed towards the group
• Be willing to participate, but do not monopolize the conversation
• Be flexible in your position as others share their ideas
• No sarcasm (Chowning, 2009; Phanstiel, 1996)
After reviewing the expectations, students were asked to record two personal goals in
their journals and the discussion was set to begin. In one case, the text discussed was data
from a previous laboratory experiment. In other cases, the text was data from previous
scientist’s research in an article, graph or table. During the course of the seminar, I
expected students to share comments, interpretations, and questions about the
information. A document camera was also made available to students to use during each
seminar for help sharing graphs or articles with the class.
15
Only the inner circle was allowed to participate in the discussion although the
students in the outer circle participated through note taking and keeping track of their
partners’ participation. The only exception was the introduction of a hot seat which
allowed students in the outer circle to jump into the discussion with a quick comment or
question. With a few minutes left for the inner circle, I allowed the students to meet one-
on-one with their partners to receive encouragement and continue the discussion in a
smaller group. The inner circle reconvened for a few more minutes to share any questions
or comments from the coaching session. Then, the inner and outer circles switched and
the seminar continued with a new question. At the end of the seminar, students were
asked to reflect on the data analysis process in which they just participated and complete
a summary of the discussion for homework. The Socratic Seminar Timeline summarizes
the sequence of events during the treatment (Table 1).
16
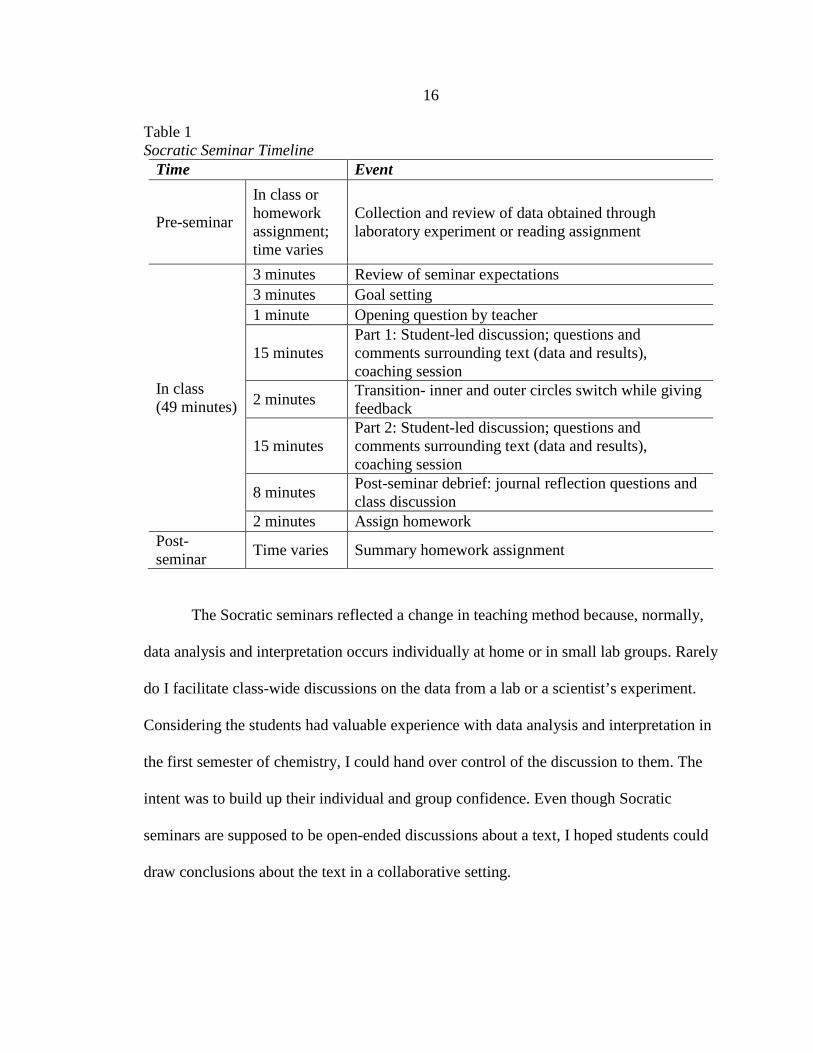
Table 1 Socratic Seminar Timeline
Time Event
Pre-seminar
In class or homework assignment; time varies
Collection and review of data obtained through laboratory experiment or reading assignment
In class (49 minutes)
3 minutes Review of seminar expectations 3 minutes Goal setting 1 minute Opening question by teacher
15 minutes Part 1: Student-led discussion; questions and comments surrounding text (data and results), coaching session
2 minutes Transition- inner and outer circles switch while giving feedback
15 minutes Part 2: Student-led discussion; questions and comments surrounding text (data and results), coaching session
8 minutes Post-seminar debrief: journal reflection questions and class discussion
2 minutes Assign homework Post-seminar Time varies Summary homework assignment
The Socratic seminars reflected a change in teaching method because, normally,
data analysis and interpretation occurs individually at home or in small lab groups. Rarely
do I facilitate class-wide discussions on the data from a lab or a scientist’s experiment.
Considering the students had valuable experience with data analysis and interpretation in
the first semester of chemistry, I could hand over control of the discussion to them. The
intent was to build up their individual and group confidence. Even though Socratic
seminars are supposed to be open-ended discussions about a text, I hoped students could
draw conclusions about the text in a collaborative setting.
17
The seminars took place during different units. A practice seminar occurred after
students completed a chemical reactions lab. The seminar focused on determining the
missing parts of six chemical equations as well as determining the reaction type. The first
official Socratic seminar, called Heat Transfer and Specific Heat, took place during the
Thermodynamics unit with a focus on collecting and interpreting data from a
demonstration and graphs and tables concerning specific heat capacity of common
materials (Appendix B). A second seminar during the Thermodynamics unit had students
interpreting a Heating Curve of Water and a demonstration (Appendix C). The final two
seminars happened during the Phases and Gas Laws unit. The first focused on completing
post-laboratory analysis on quantitative data in the Cooling Water Lab (Appendix D).
This seminar was assisted by the How to Read and Make a Graph handout (Appendix E).
The final seminar, Climate Change Seminar, focused on climate change data from tables
and graphs compiled by the students (Appendix F).
Three data collection techniques, which targeted ability to interpret data, were
used to assess the effect of the Socratic seminars. The Data Analysis and Interpretation
Assessment established a baseline of students’ abilities in data analysis (Appendix G). I
drew the questions for this assessment from released state standardized science tests. This
was then compared to the same assessment given after the treatment by analyzing the
mean of the score for all students and the normalized gain, graded according to the Data
Analysis and Interpretation Assessment Rubric (Appendix H). For the Cooling Water
Lab, I collected a graph and post-lab questions prior to the treatment, and a revised
18
version of both completed post-seminar. I graded each according to the Cooling Water
Lab Rubric (Appendix I). Student scores from the assignment prior to the treatment were
compared to their graphs after the seminar by comparing the group’s average and the
normalized gain for each question. In addition, as I implemented the Socratic seminars, I
monitored the quality of comments made during seminars using field notes and the
students’ post-seminar homework assignment.
The data collection tool Participation Tally Sheet was used to determine the
frequency and significance of scientific communication (Appendix J). I kept track of who
participated, how much, and of what type. This tally sheet was first implemented prior to
the treatment to collect baseline data on a post-lab discussion of the Reaction in a Bag
Lab facilitated without the Socratic seminar guidelines (Appendix K). Once the treatment
concluded, the tally sheets were compared by counting the frequency and type of
communication for each student. Also, contained in the Seminar Reflection Questions
was a self-assessment of the number, types, and value of contributions made to the
discussion (Appendix L). This self-assessment and video recordings of the seminars
helped to validate the results of the Participation Tally Sheet. Homework assignments
after seminars served as a window into the continued development of scientific
communication skills. The homework assignments required written responses about a
data set and were graded using the Homework Grading Rubric (Appendix M).
The last purpose of the study was to see the effect of Socratic seminars on student
confidence in data analysis. Prior to treatment, all of the students were asked to
19
participate in a Confidence Survey: Data Analysis and Interpretation using an interval
scale of not at all confident (1), not very confident (2), somewhat confident (3), and very
confident (4), with respect to different aspects of the data analysis process (Appendix N).
Post treatment, students took the same survey and data was compared to note any
changes to their overall confidence using the mean of the rankings. To collect some
qualitative responses linked to student confidence, I conducted eight student interviews
pre- and post- treatment using the Confidence Interview Questions (Appendix O). The
eight students came from a random sampling of my four classes, and the same students
were interviewed both before and after the seminar.
Throughout the treatment, students monitored their own improvement and
confidence through journal entries. Students answered Seminar Reflection Questions
after each seminar, with questions relating directly to the students’ perceptions of their
understanding of the text they interpreted. (Appendix L). Lastly, I observed student
confidence levels through teacher observations and field notes during Socratic seminars.
A summary of the data collection tools for this project may be found in the Data
Triangulation Matrix (Table 2).
20
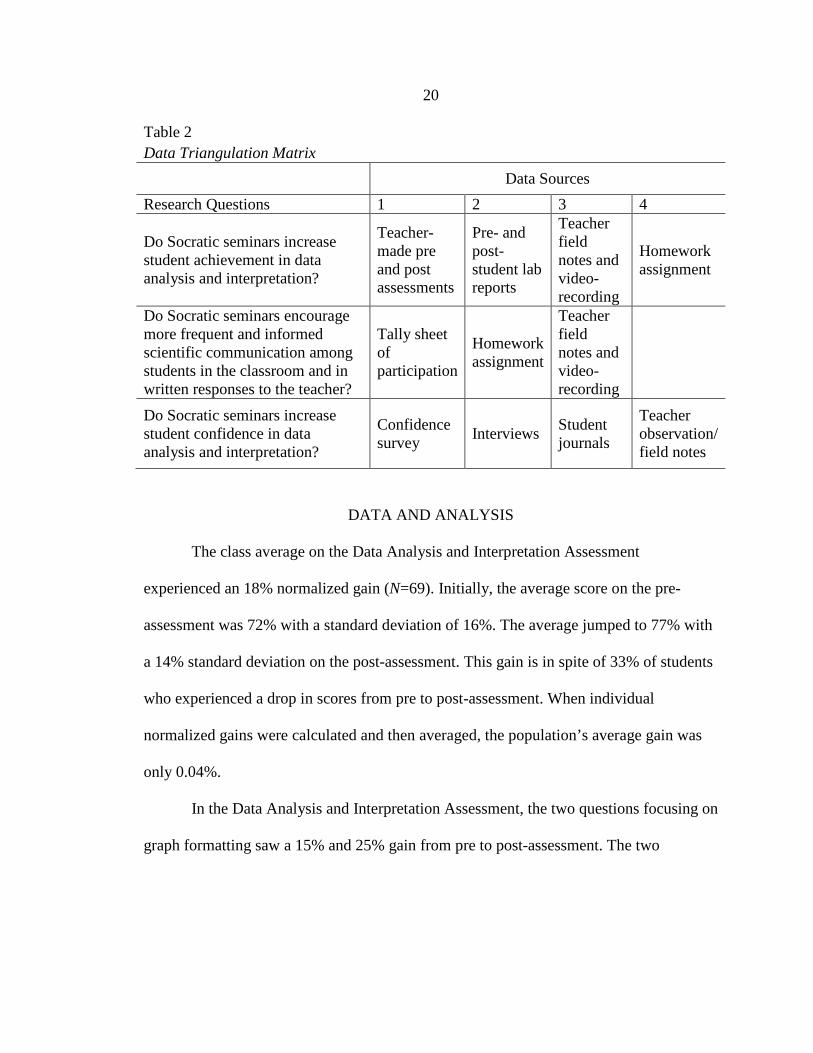
Table 2 Data Triangulation Matrix Data Sources Research Questions 1 2 3 4
Do Socratic seminars increase student achievement in data analysis and interpretation?
Teacher-made pre and post assessments
Pre- and post- student lab reports
Teacher field notes and video-recording
Homework assignment
Do Socratic seminars encourage more frequent and informed scientific communication among students in the classroom and in written responses to the teacher?
Tally sheet of participation
Homework assignment
Teacher field notes and video-recording
Do Socratic seminars increase student confidence in data analysis and interpretation?
Confidence survey Interviews Student
journals
Teacher observation/ field notes
DATA AND ANALYSIS
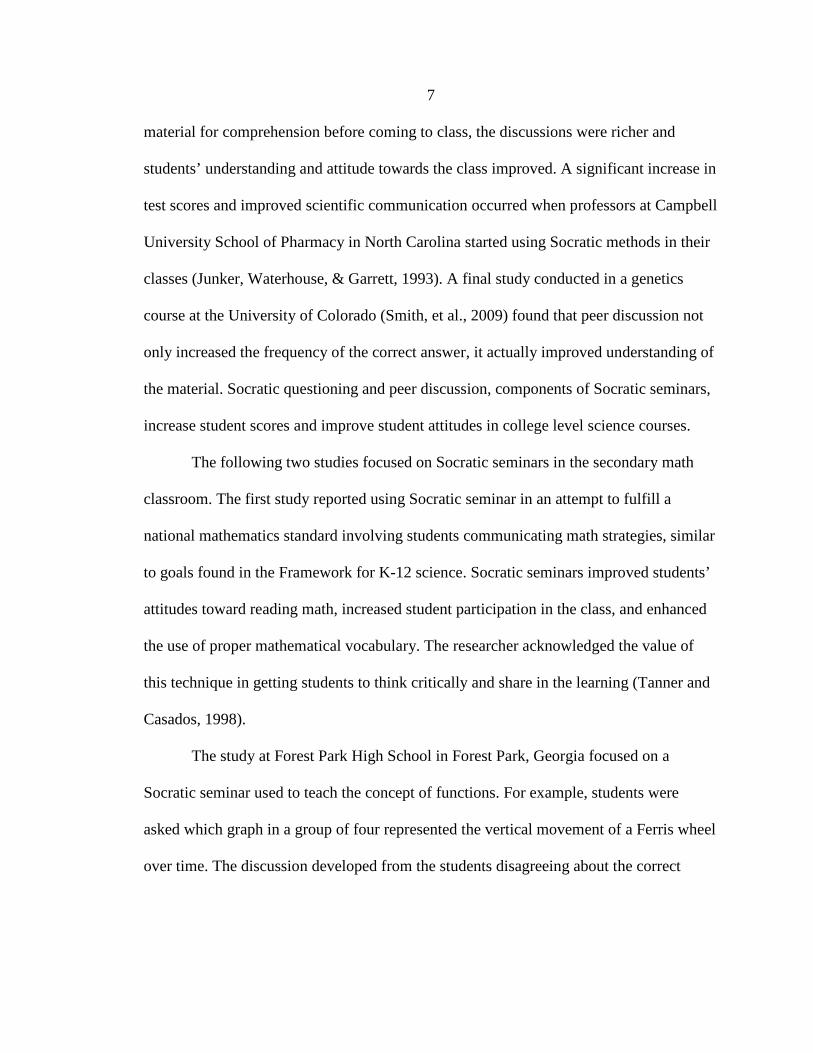
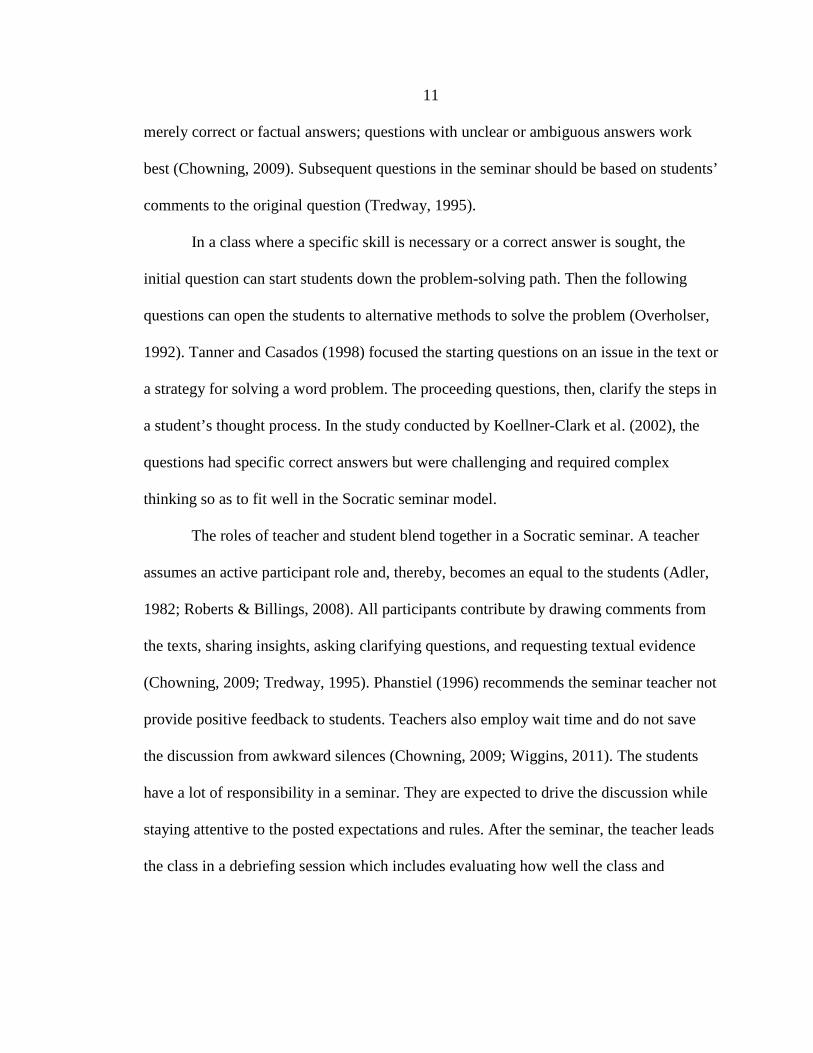
The class average on the Data Analysis and Interpretation Assessment
experienced an 18% normalized gain (N=69). Initially, the average score on the pre-
assessment was 72% with a standard deviation of 16%. The average jumped to 77% with
a 14% standard deviation on the post-assessment. This gain is in spite of 33% of students
who experienced a drop in scores from pre to post-assessment. When individual
normalized gains were calculated and then averaged, the population’s average gain was
only 0.04%.
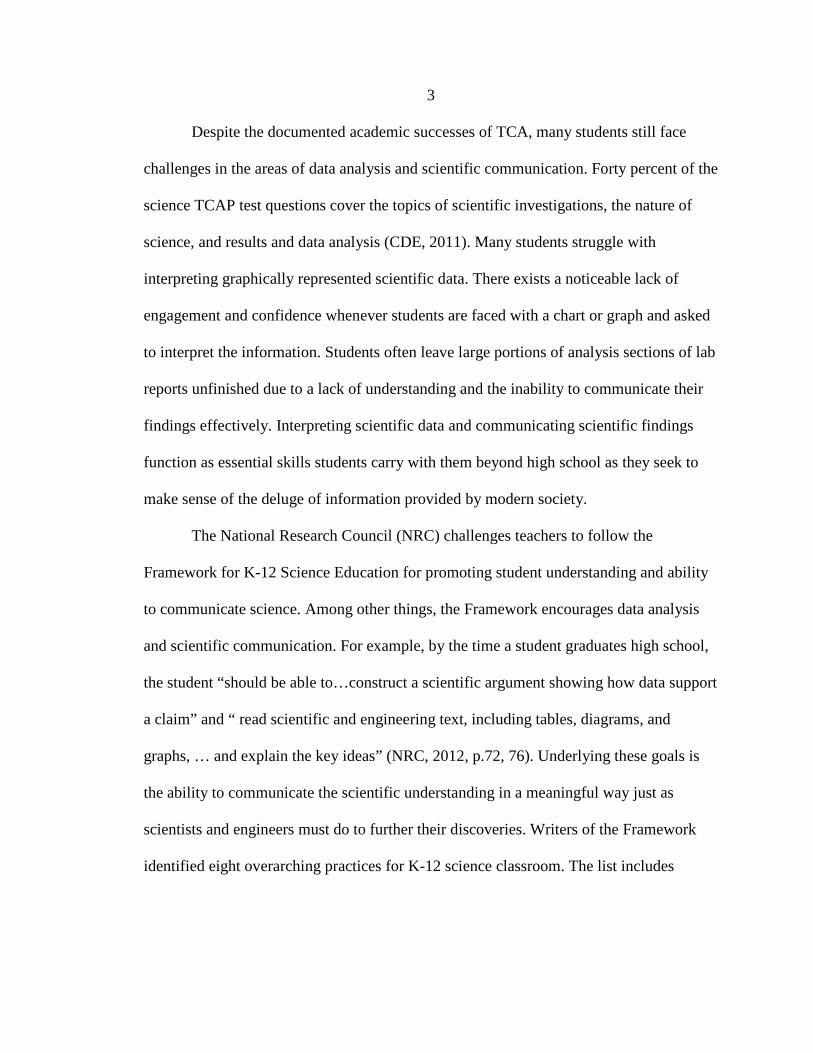
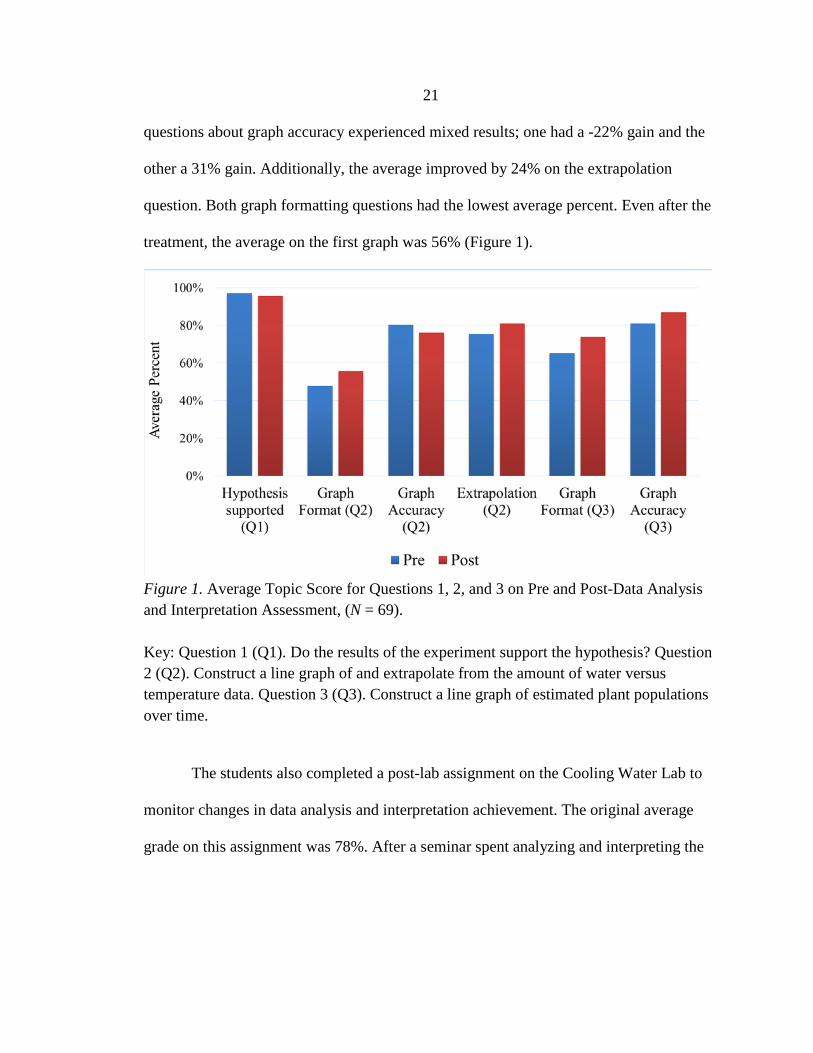
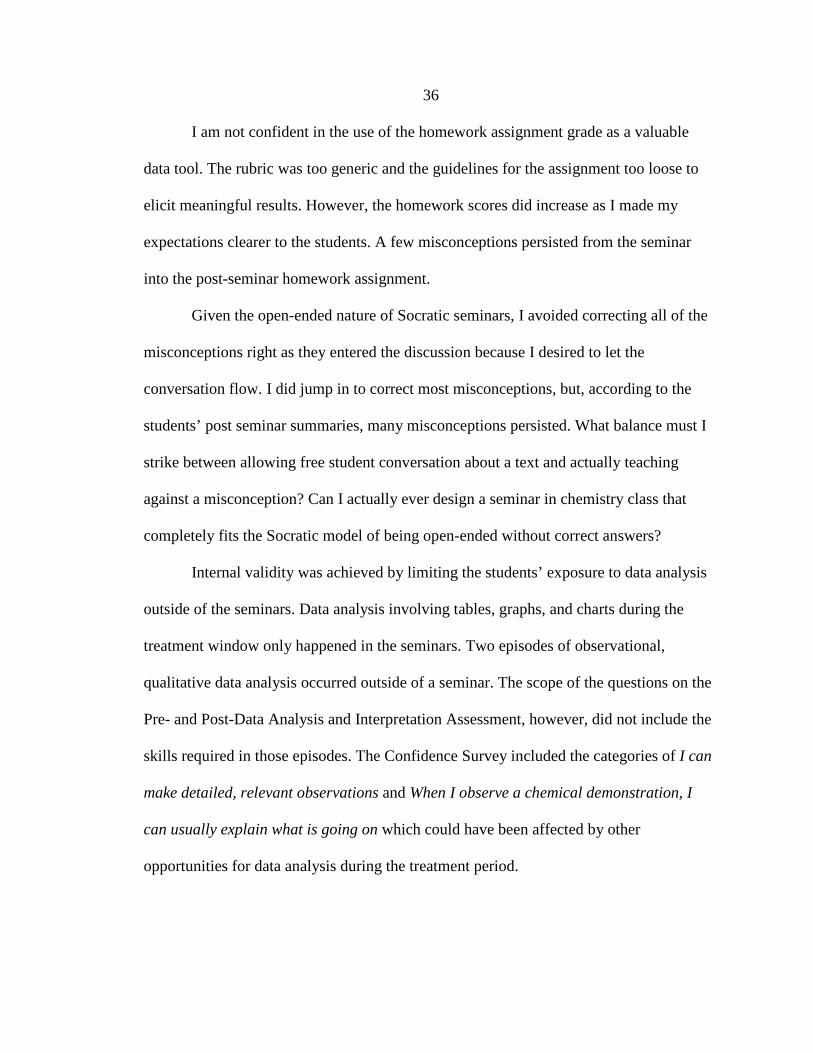
In the Data Analysis and Interpretation Assessment, the two questions focusing on
graph formatting saw a 15% and 25% gain from pre to post-assessment. The two
21
questions about graph accuracy experienced mixed results; one had a -22% gain and the
other a 31% gain. Additionally, the average improved by 24% on the extrapolation
question. Both graph formatting questions had the lowest average percent. Even after the
treatment, the average on the first graph was 56% (Figure 1).
Figure 1. Average Topic Score for Questions 1, 2, and 3 on Pre and Post-Data Analysis and Interpretation Assessment, (N = 69). Key: Question 1 (Q1). Do the results of the experiment support the hypothesis? Question 2 (Q2). Construct a line graph of and extrapolate from the amount of water versus temperature data. Question 3 (Q3). Construct a line graph of estimated plant populations over time.
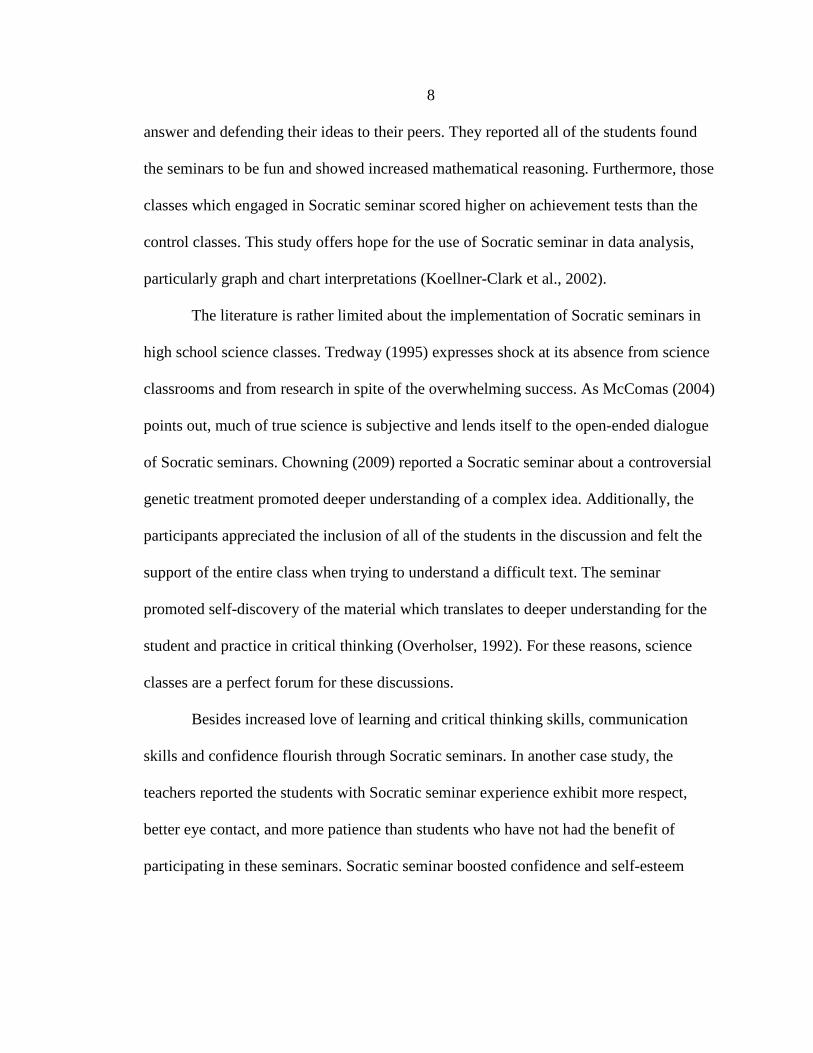
The students also completed a post-lab assignment on the Cooling Water Lab to
monitor changes in data analysis and interpretation achievement. The original average
grade on this assignment was 78%. After a seminar spent analyzing and interpreting the
22
data as a class, the students improved their post-lab average to 88%, representing a 46%
normalized gain. None of the students experienced a decrease in their revised post-lab
score. Twenty-five percent of students’ scored remained the same. One percent of
students scored a perfect on the post-lab prior to the seminar. Post-seminar, 17% of
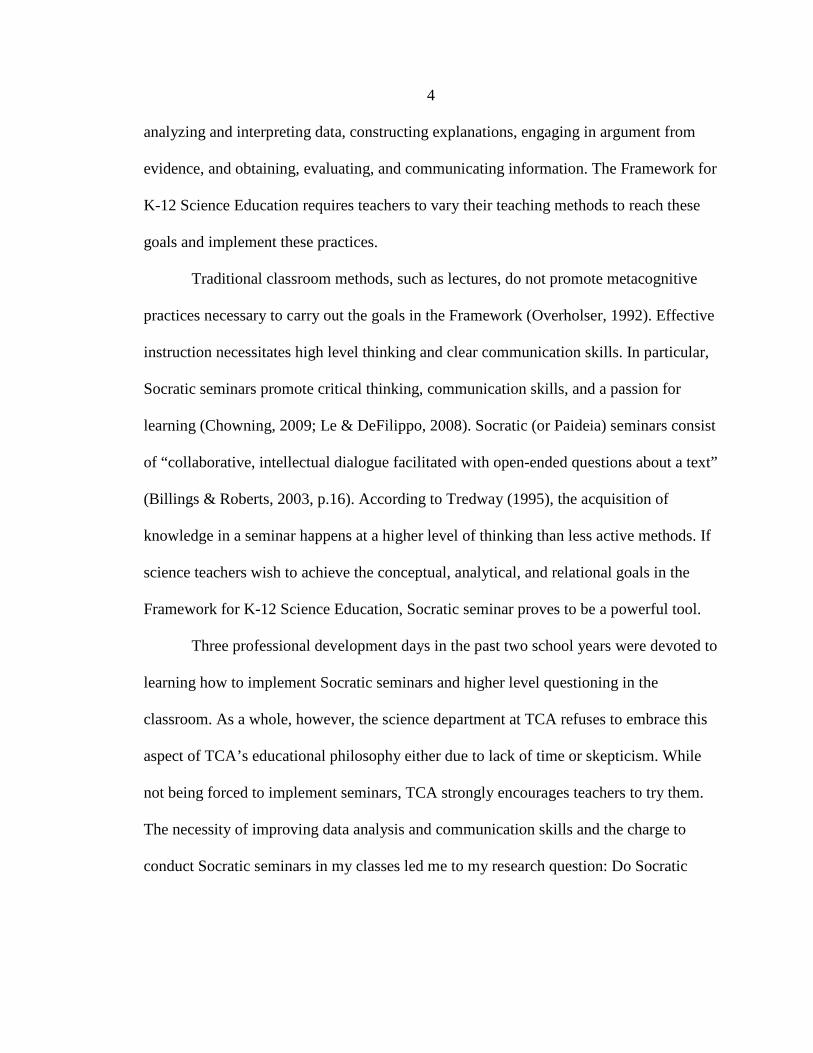
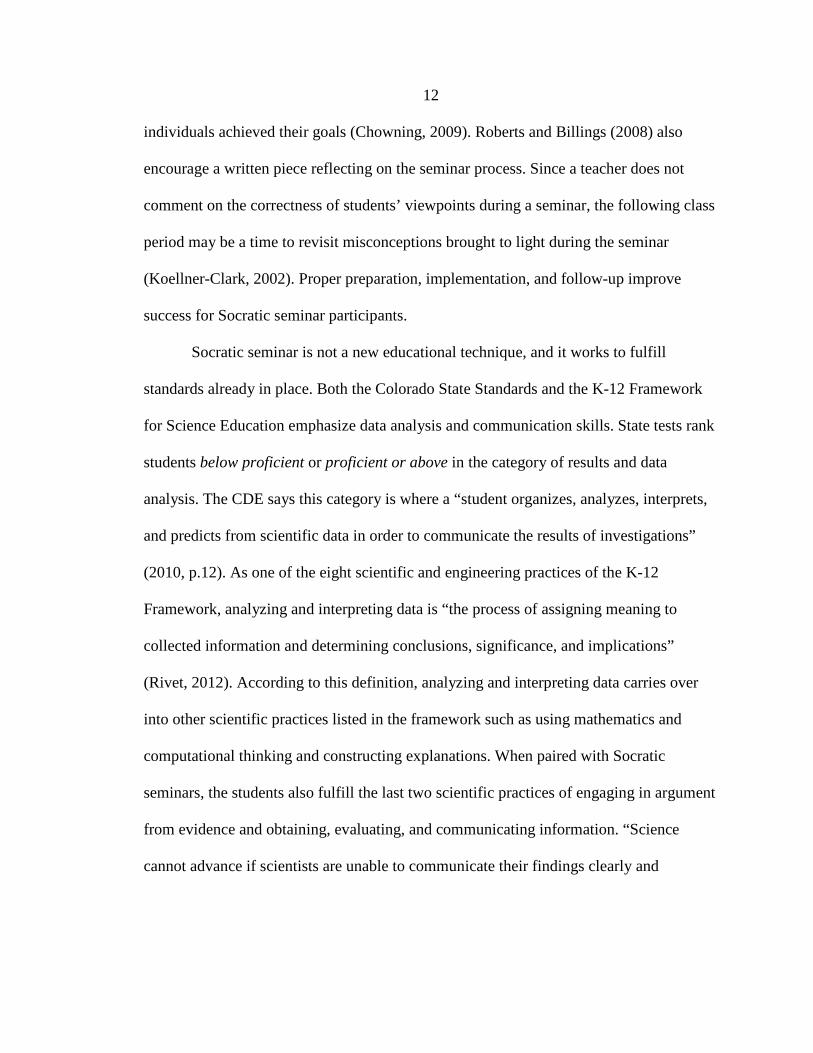
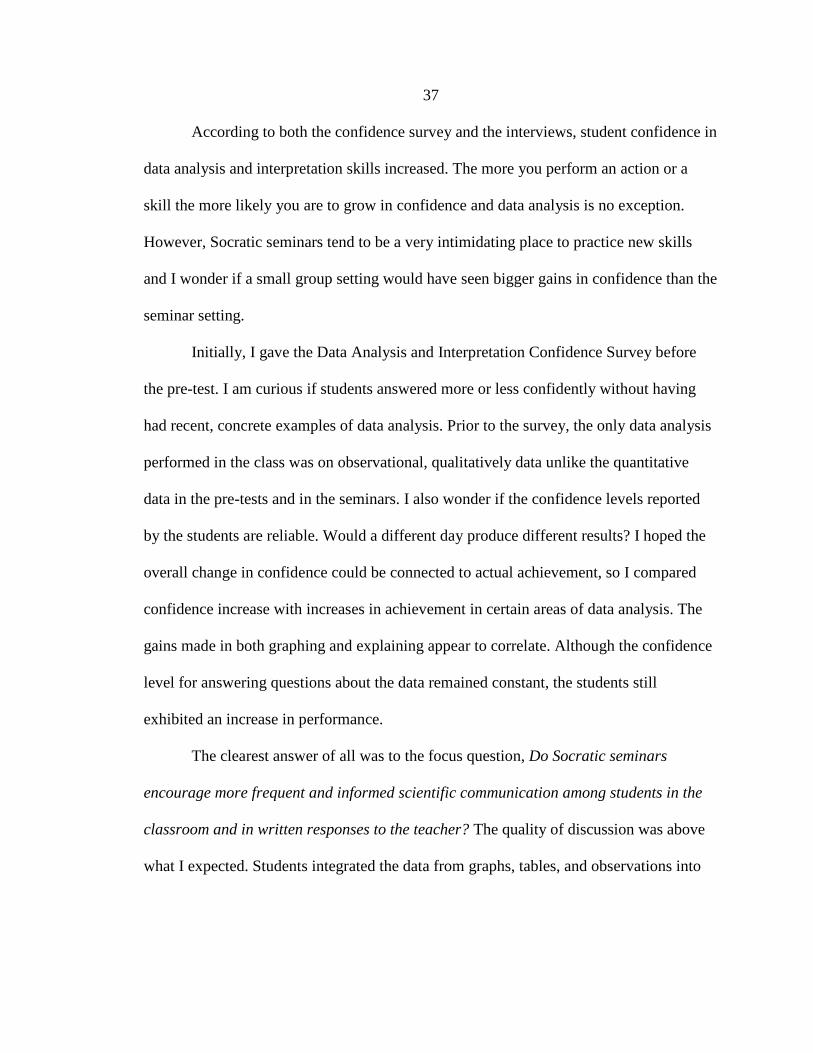
students scored a perfect. Every question saw an increase in the class average (Figure 2).
Additionally, as the average score improved, the range of the majority of student scores
on the lab narrowed. Out of 19 points possible for the assignment, the standard deviation
changed from 2.5 to 1.9.
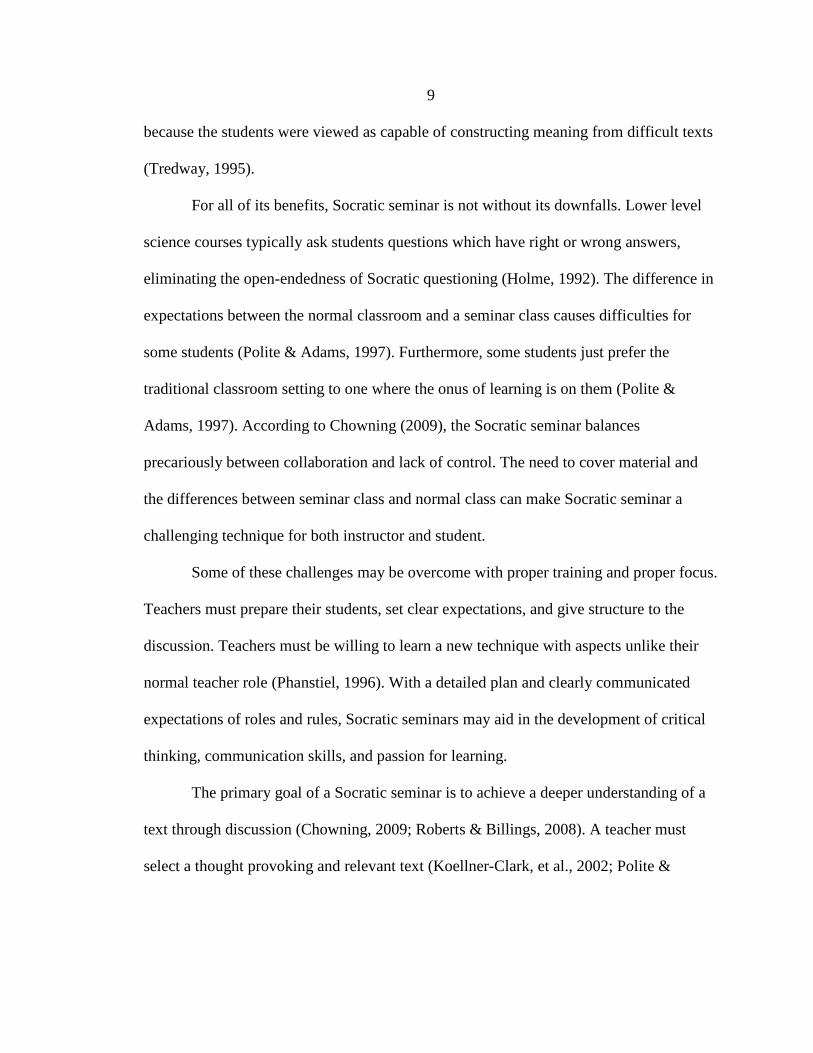
The biggest improvements, according to normalized gain, occurred in the area of
Data Explanation, Extrapolation Prediction and the Graph. “I understood what I did
wrong in terms of my graph and my answers. I also learned how to estimate the future
temperatures,” wrote one student in reflection about extrapolating the graph. Another
improved upon her explanation of what causes the temperature difference between the
water in the two different tubes. Initially, she mentioned the wet newspaper acted as a
conductor and the dry newspaper acted as an insulator. After the seminar, she added,
“When the water evaporated off of the wet newspaper, it took the heat with it,” which
correctly incorporated the role that evaporation played in this lab.

23
Figure 2. Topic Averages for Questions 7 and 9-13 on Cooling Water Post-Lab, (N=69). Key: Question 7 (Q7). Construct a line graph of your data. Question 9 (Q9). From your graph, what is the temperature of the water in both the wet and dry test tubes? Question 10 (Q10). Use your graph to predict what the temperature would be in the dry tube after 15 minutes. Question 11 (Q11). Explain what causes the differences in water temperature between the water in the two tubes. Question 12 (Q12). Explain what causes the differences in water temperature between the water in the two tubes. Question 13 (Q13). Describe what comparison you can make between the effect of perspiration on the skin of the human body and the newspaper on the wet test tube. Relate your answer to temperature control.
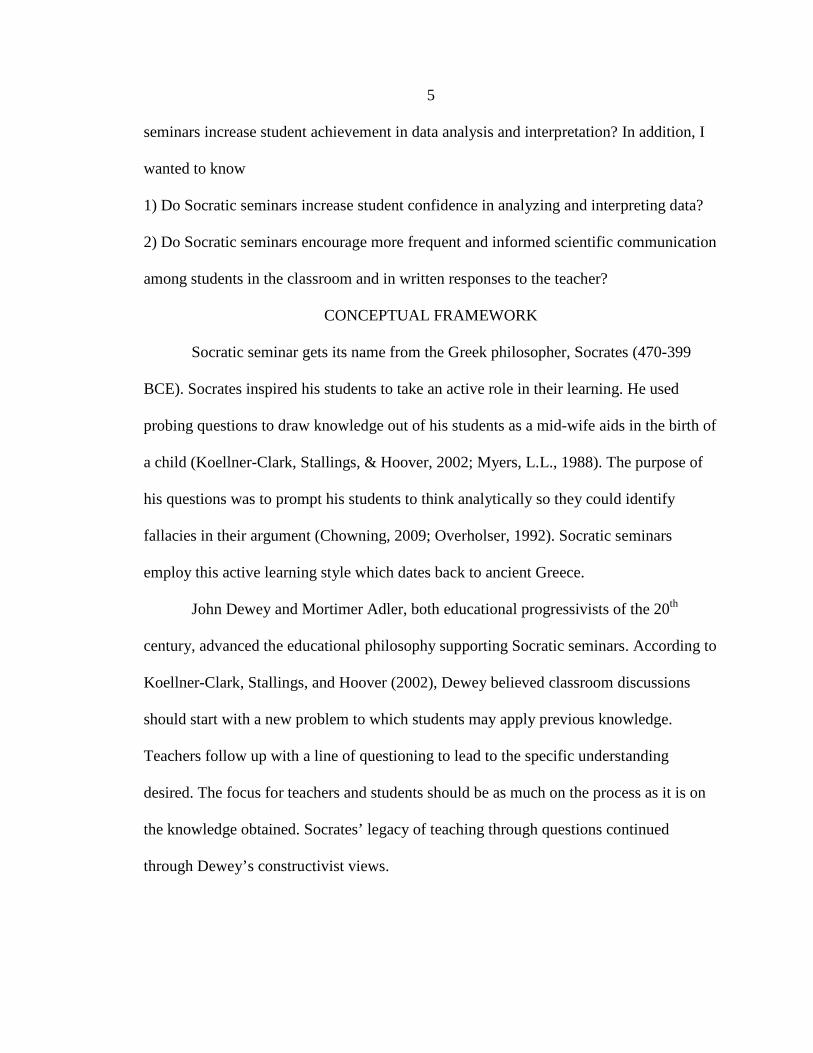
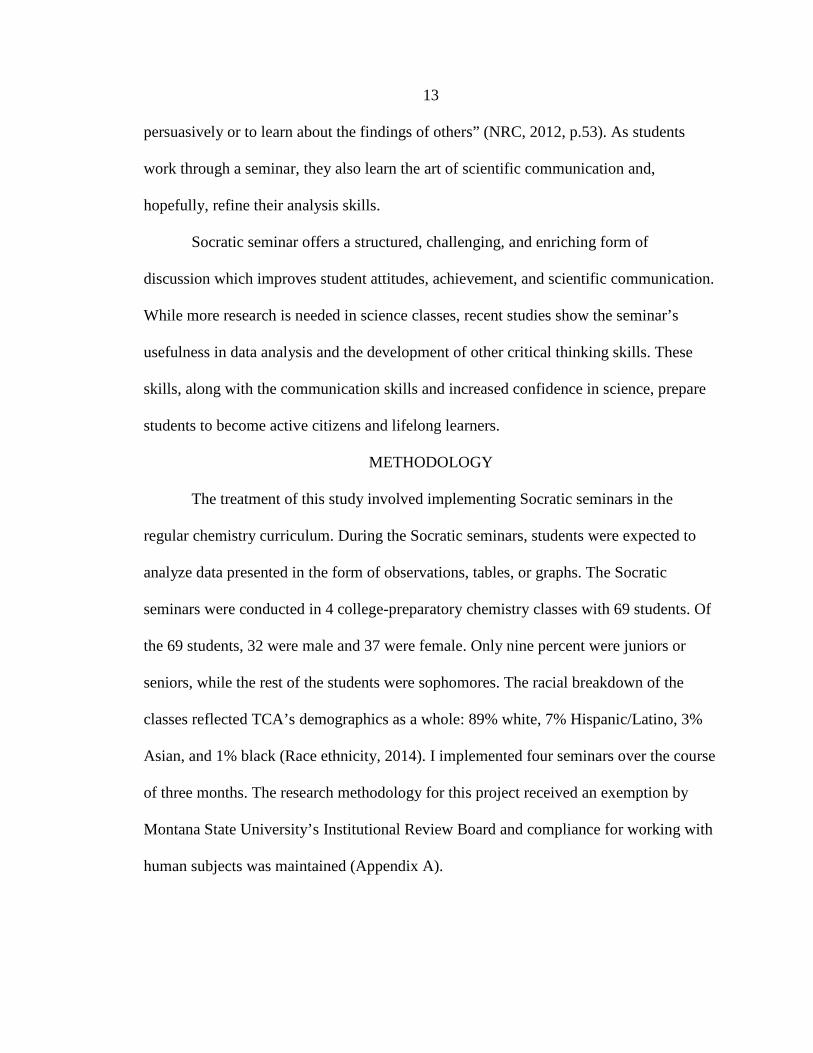
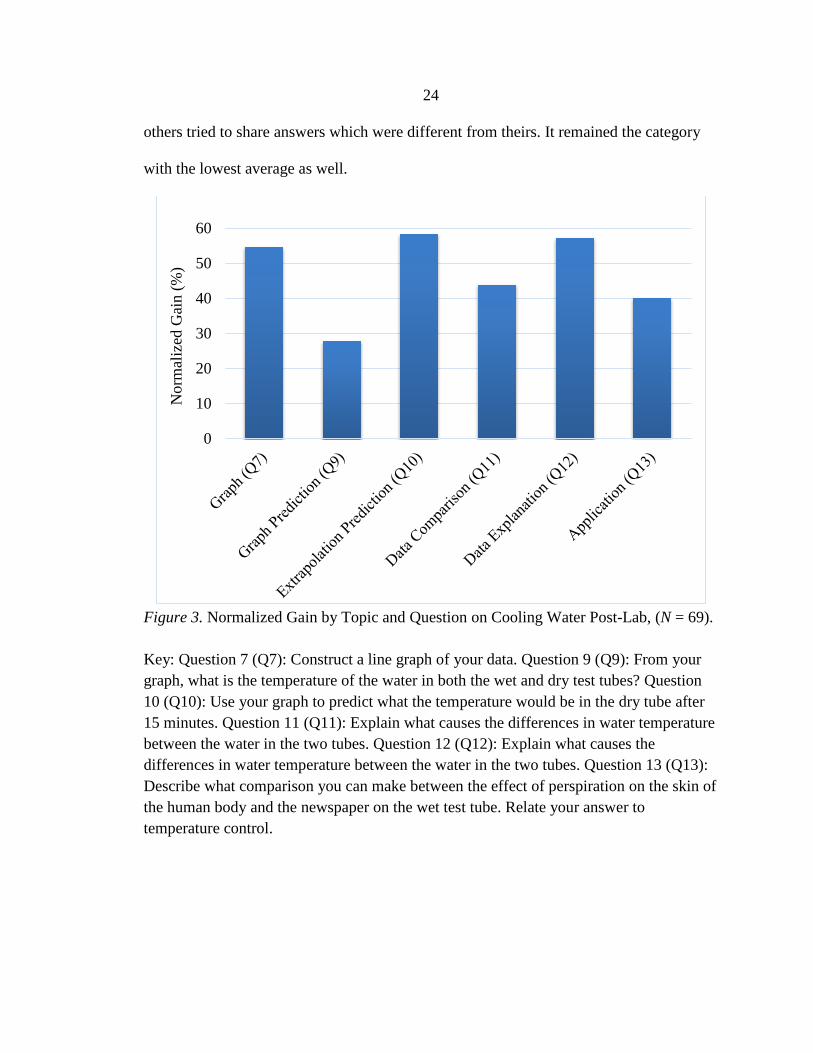
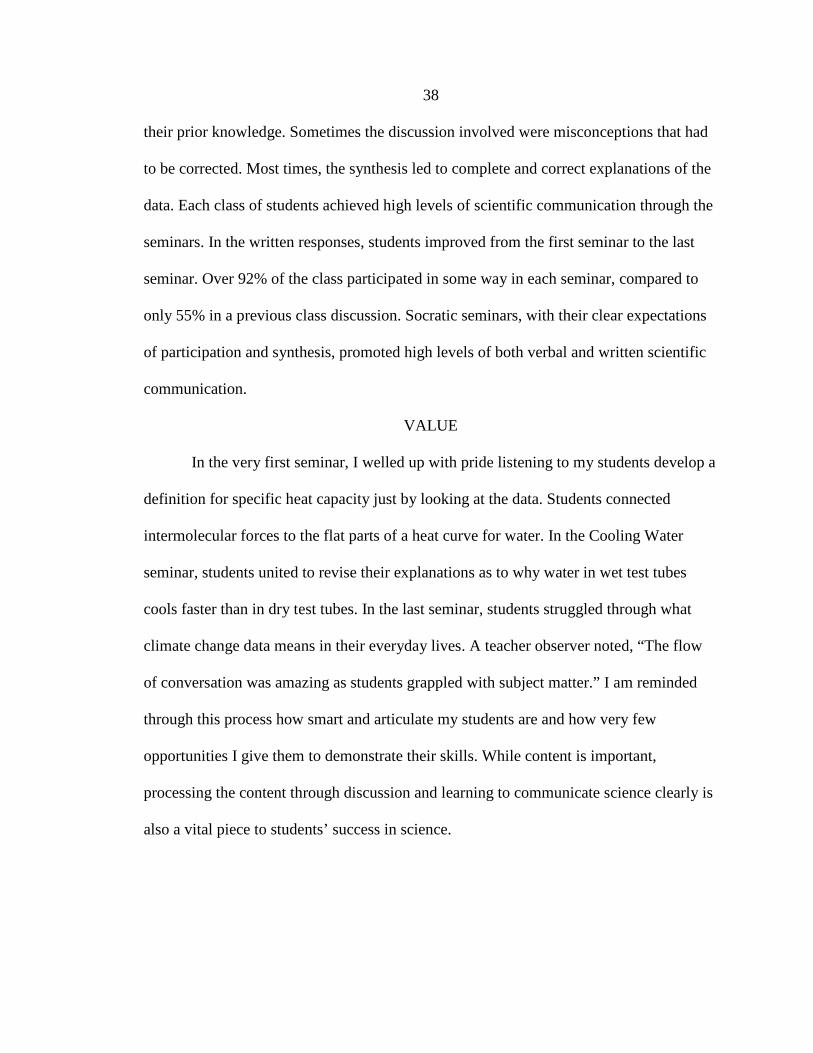
The smallest gain occurred in the category of Graph Interpretation and Prediction
(Figure 3). This question asked students to interpolate their graph. During the seminar
students rarely brought up this question in discussion, and appeared confused when
0
20
40
60
80
100Av
erag
e Pe
rcen
t
Pre Post
24
others tried to share answers which were different from theirs. It remained the category
with the lowest average as well.
Figure 3. Normalized Gain by Topic and Question on Cooling Water Post-Lab, (N = 69). Key: Question 7 (Q7): Construct a line graph of your data. Question 9 (Q9): From your graph, what is the temperature of the water in both the wet and dry test tubes? Question 10 (Q10): Use your graph to predict what the temperature would be in the dry tube after 15 minutes. Question 11 (Q11): Explain what causes the differences in water temperature between the water in the two tubes. Question 12 (Q12): Explain what causes the differences in water temperature between the water in the two tubes. Question 13 (Q13): Describe what comparison you can make between the effect of perspiration on the skin of the human body and the newspaper on the wet test tube. Relate your answer to temperature control.
0
10
20
30
40
50
60
Nor
mal
ized
Gai
n (%
)
25
I also monitored written homework summaries for quality of comments. Since not
all of the students were present for each seminar and, therefore, did not have to complete
this homework assignment, my subgroups are as follows: Heat Transfer and Specific
Heat Seminar, (n=66); Heat Curve Seminar, (n=62); Cooling Water Post-Lab, (n=66);
Climate Change, (n=67). In the first seminar on heat transfer, the average homework
score was a 2.1 out of 4 which was indicative of a somewhat complete and correct
response (n=66). For example, one correct conclusion was, “Block one was a better heat
conductor than Block two [t]hus allowing the ice cube to melt almost instantly.”
However, this student’s response received 2 out of 4 because it was lacking any
discussion about the specific heat capacity data. In the second and fourth seminar, the
homework grade average was 3.1 out of 4, which corresponds to a mostly complete and
correct explanation (n=66, 67). For the Climate Change Seminar, one student wrote,
We agreed that the Earth’s temperature is increasing due to the increased
production of CO2. I agree that is a problem that we need to pay more attention to.
Disagreements arose about if it was really a huge problem or if scientists are just
hyping it. Also we disagreed for a while if the temperature was really rising
because the graphs show it increasing and decreasing. Some questions that I have
are what could you do to really stop global warming by greenhouse gases.
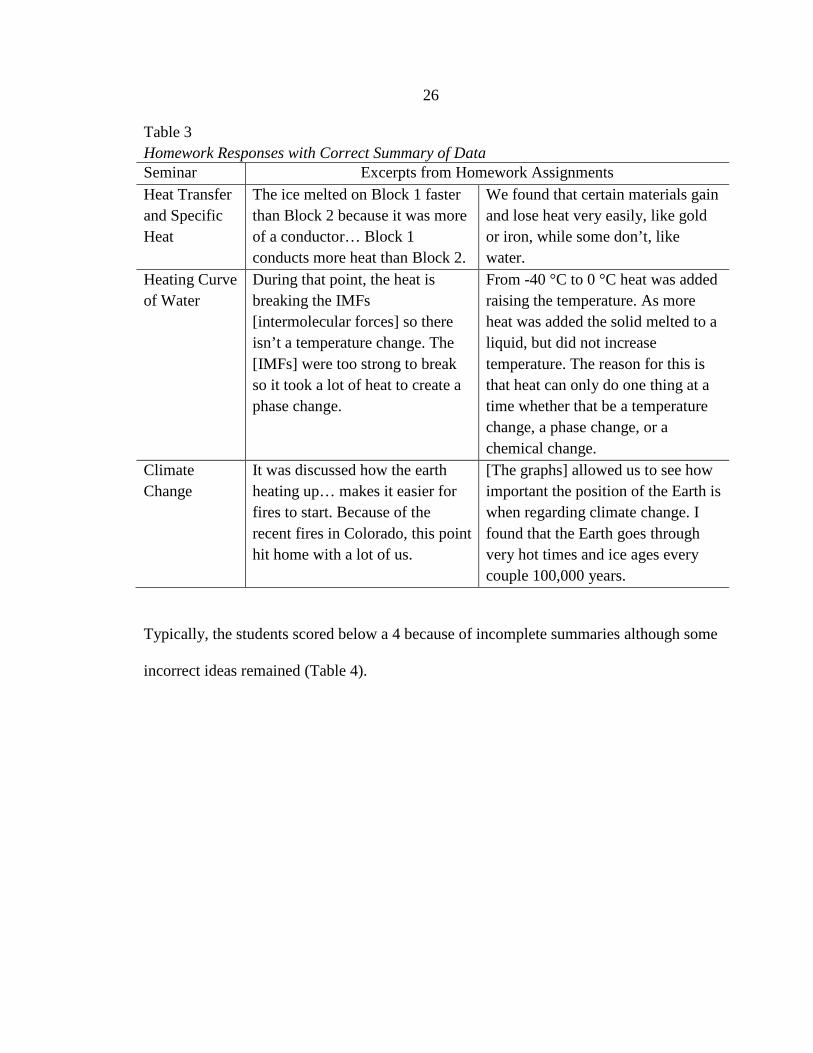
Other quotes from the homework assignments can be found in Table 3. No summary
paragraph was assigned for the Cooling Water Post-Lab because of requiring revisions to
the post-lab.
26
Table 3 Homework Responses with Correct Summary of Data Seminar Excerpts from Homework Assignments Heat Transfer and Specific Heat
The ice melted on Block 1 faster than Block 2 because it was more of a conductor… Block 1 conducts more heat than Block 2.
We found that certain materials gain and lose heat very easily, like gold or iron, while some don’t, like water.
Heating Curve of Water
During that point, the heat is breaking the IMFs [intermolecular forces] so there isn’t a temperature change. The [IMFs] were too strong to break so it took a lot of heat to create a phase change.
From -40 °C to 0 °C heat was added raising the temperature. As more heat was added the solid melted to a liquid, but did not increase temperature. The reason for this is that heat can only do one thing at a time whether that be a temperature change, a phase change, or a chemical change.
Climate Change
It was discussed how the earth heating up… makes it easier for fires to start. Because of the recent fires in Colorado, this point hit home with a lot of us.
[The graphs] allowed us to see how important the position of the Earth is when regarding climate change. I found that the Earth goes through very hot times and ice ages every couple 100,000 years.
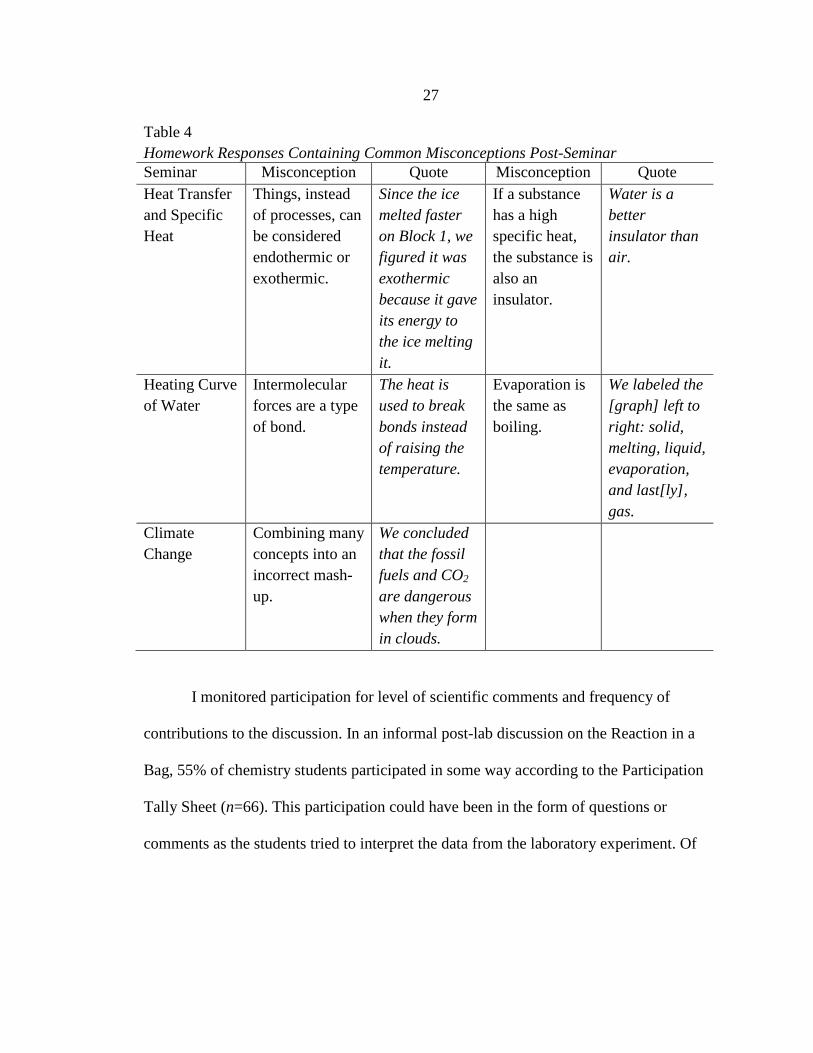
Typically, the students scored below a 4 because of incomplete summaries although some
incorrect ideas remained (Table 4).
27
Table 4 Homework Responses Containing Common Misconceptions Post-Seminar Seminar Misconception Quote Misconception Quote Heat Transfer and Specific Heat
Things, instead of processes, can be considered endothermic or exothermic.
Since the ice melted faster on Block 1, we figured it was exothermic because it gave its energy to the ice melting it.
If a substance has a high specific heat, the substance is also an insulator.
Water is a better insulator than air.
Heating Curve of Water
Intermolecular forces are a type of bond.
The heat is used to break bonds instead of raising the temperature.
Evaporation is the same as boiling.
We labeled the [graph] left to right: solid, melting, liquid, evaporation, and last[ly], gas.
Climate Change
Combining many concepts into an incorrect mash-up.
We concluded that the fossil fuels and CO2 are dangerous when they form in clouds.
I monitored participation for level of scientific comments and frequency of
contributions to the discussion. In an informal post-lab discussion on the Reaction in a
Bag, 55% of chemistry students participated in some way according to the Participation
Tally Sheet (n=66). This participation could have been in the form of questions or
comments as the students tried to interpret the data from the laboratory experiment. Of
28
the students who asked questions, 23% of them asked simple clarifying questions. For
example, two typical questions were, “Can you repeat that?” or “What was that?” Other
students questioned the ambiguity of others’ observations on the overhead. In one
instance, a student asked, “Who did #3? Does transfer of energy mean heat was
released?” Eight percent of students made four or more comments during the discussion.
In a couple cases, students had to defend their observations when other students did not
believe that could possibly have happened. “It definitely turned yellow,” defended one
student when questioned about his observational skills. One student in their lab report
stated, “More people should have talked during the discussion.”
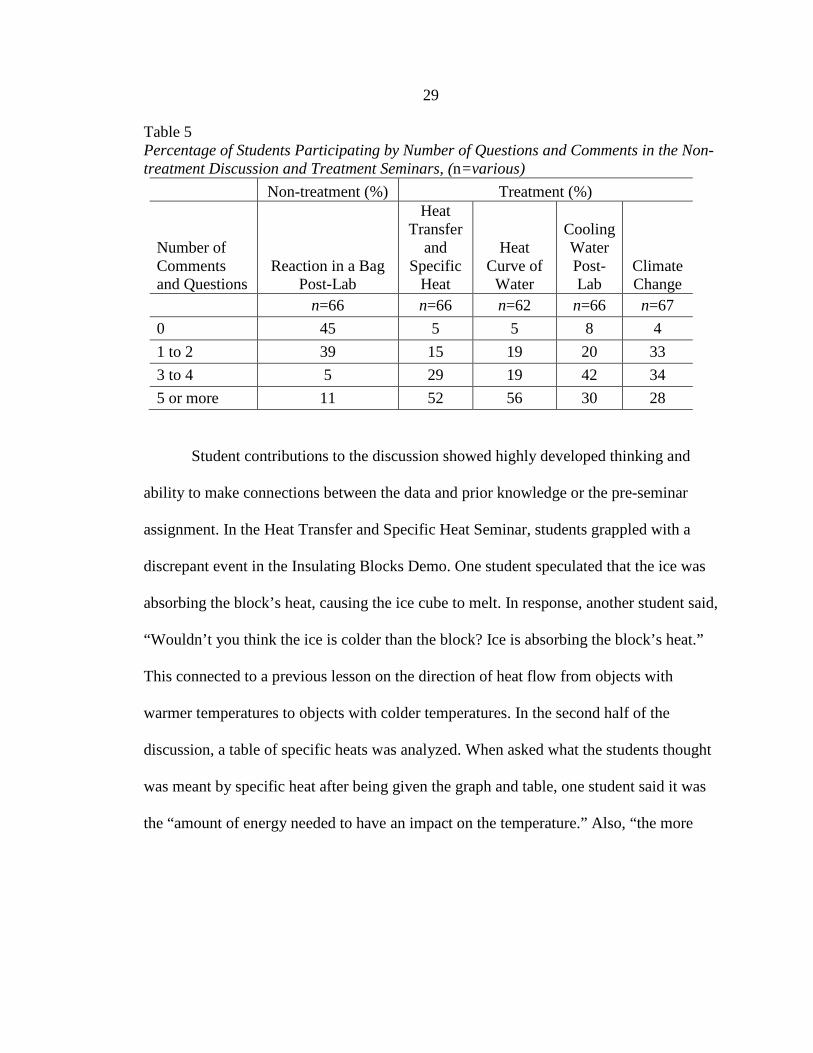
Compared to the informal discussion above, the Socratic seminars’ participation
was much greater. After the Heat Transfer and Specific Heat seminar, a student wrote,
“Everyone was participating in the seminar, adding good information to the
conversation.” The rates of students contributing at least one question or comment in the
four seminars were 95%, 95%, 92%, and 96%, respectively (n=66, 62, 66, 67). In the
Heat Curve Seminar alone, 56% of students made five or more contributions to the
discussion (Table 5). The majority of students contributed more than two questions and
comments to each seminar. Since the time spent in the center circle was approximately 15
minutes, the majority of students made at least one comment every five minutes.
29
Table 5 Percentage of Students Participating by Number of Questions and Comments in the Non-treatment Discussion and Treatment Seminars, (n=various)
Non-treatment (%) Treatment (%)
Number of Comments and Questions
Reaction in a Bag Post-Lab
Heat Transfer
and Specific
Heat
Heat Curve of
Water
Cooling Water Post-Lab
Climate Change
n=66 n=66 n=62 n=66 n=67 0 45 5 5 8 4 1 to 2 39 15 19 20 33 3 to 4 5 29 19 42 34 5 or more 11 52 56 30 28
Student contributions to the discussion showed highly developed thinking and
ability to make connections between the data and prior knowledge or the pre-seminar
assignment. In the Heat Transfer and Specific Heat Seminar, students grappled with a
discrepant event in the Insulating Blocks Demo. One student speculated that the ice was
absorbing the block’s heat, causing the ice cube to melt. In response, another student said,
“Wouldn’t you think the ice is colder than the block? Ice is absorbing the block’s heat.”
This connected to a previous lesson on the direction of heat flow from objects with
warmer temperatures to objects with colder temperatures. In the second half of the
discussion, a table of specific heats was analyzed. When asked what the students thought
was meant by specific heat after being given the graph and table, one student said it was
the “amount of energy needed to have an impact on the temperature.” Also, “the more
30
mass [an object has, the] more energy it takes to heat up the substance,” added a different
student.
The students faced another discrepant event in the Heating Curve of Water
Seminar. Students could see a heating curve developing as I heated water from ice to
boiling. The flat parts of the graph were determined to be the areas of phase changes.
“I’m confused on why when it’s melting it isn’t rising in temperature,” pleaded one
student. In all of the classes, the students finally came to the conclusion that this student
did when she said, “Heat is being added and breaking the IMFs [intermolecular forces].”
The middle part of the graph was easily explained as the region where water was rising in
temperature before reaching the next phase change.
In the Cooling Water Post-Lab seminar, students struggled with explaining why
two test tubes cooled at different rates. When one student asked why there was a huge
temperature difference between the two test tubes, another student volunteered an
explanation. “The wet test tube allowed the temperature to drop lower, because the
outside water evaporating from the newspaper…takes energy to evaporate, so it draws
energy from the water allowing it to cool.” Next the students moved on to extrapolating
the data. “I don’t think [the temperature] would drop super low because it would
eventually reach room temperature.” The students proceeded to discuss how to find it,
either by drawing an extended line on the graph or using math.
In the Climate Change seminar, one student reported, “We see the increase in
temperature according to the graphs. The more carbon dioxide that we produce leads to,
31
basically, it’s getting trapped in the atmosphere which traps the heat raising the
temperature more.” This connected a prior homework assignment about greenhouse gases
to the current text of a carbon dioxide emission graph. During the same seminar, another
student summarized the discussion up to that point:
Fossil fuels are coal, oil, gasoline. And what happens is when you burn fossil
fuels, you create CO2. That is a carbon emission. As we have increased our carbon
gas emissions, there are consequences of that. The Earth has been warmer and
those warmer conditions lead to more evaporation and precipitation. The sea level
is rising because glaciers are melting releasing water into the ocean… In general,
I would say that, yes, we see a cycle, yes, we know that temperature fluctuates,
but the increased role of human activity and increased carbon dioxide emissions
have increased the temperature over the past hundred years.
The discussion in the Climate Change Seminar showed great synthesis of data, prior
knowledge, articles and the pre-seminar assignment.
According to the Data Analysis and Interpretation Confidence Survey, students
grew less confident in being able to explain a chemical demonstration and communicate
results clearly. “I don’t even know what’s going on,” responded a student to the Climate
Change seminar graphs. Another noted why they are not always confident to contribute to
the discussion. “Sometimes, I don’t get it so I don’t want to feel stupid.”
Student confidence stayed the same for I can answer questions about the data no
matter how difficult. This category remained in the lowest spot at an average of 2.7
32
between not very confident (2) and somewhat confident (3). Students were quick to place
conditions on their confidence. When asked about their ability to understand trends in the
data, one student remarked, “I can usually pick them out pretty well unless the numbers
are weird.” Another student felt confident only if “there is a lot of data, like in the
Cooling Water lab, [because] it is easier to see the trends instead of just having a couple
data.”
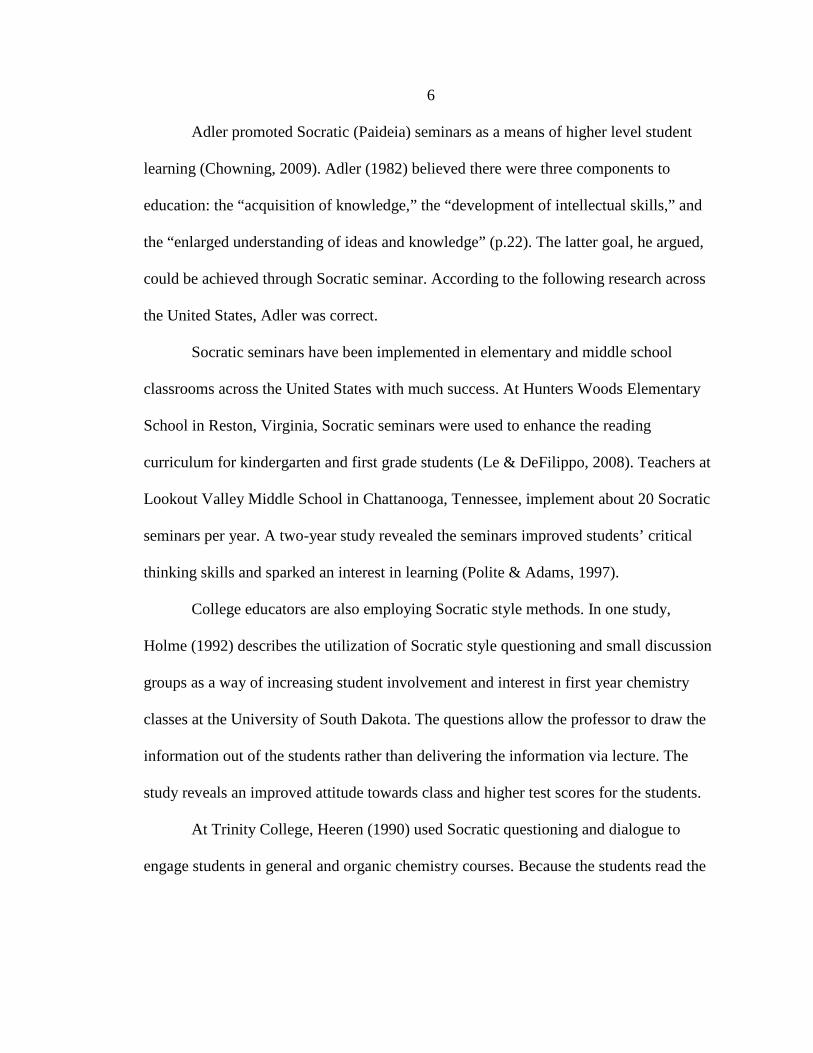
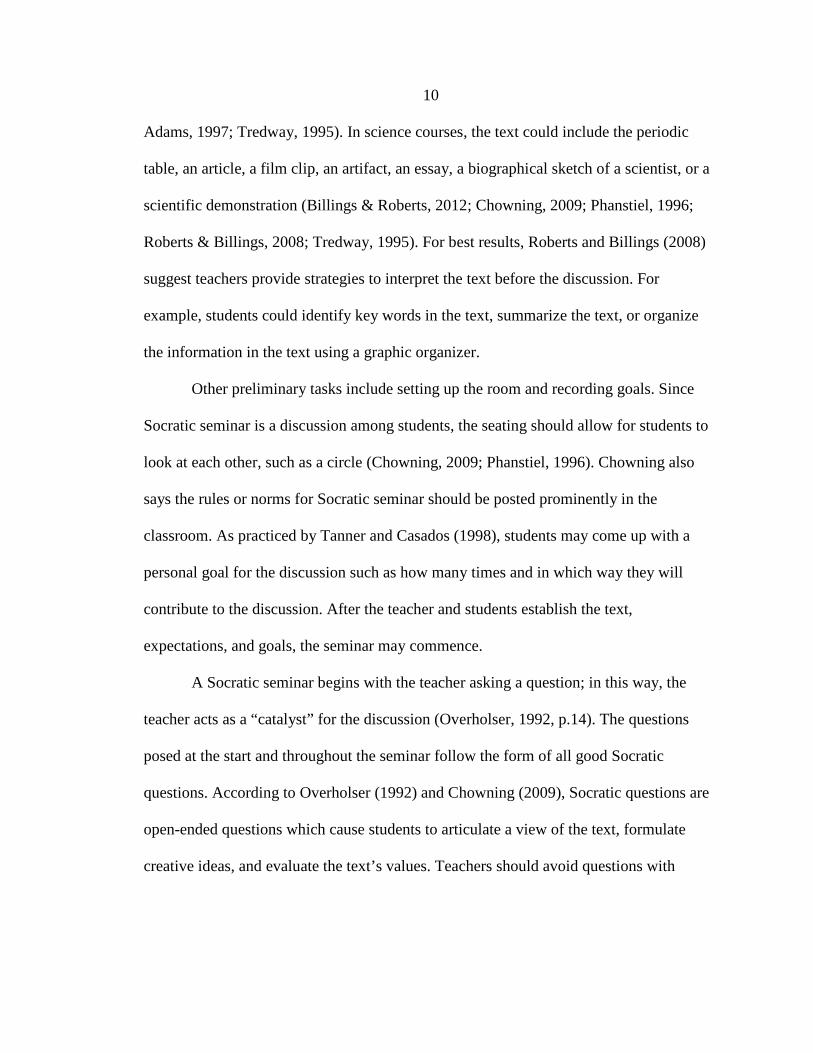
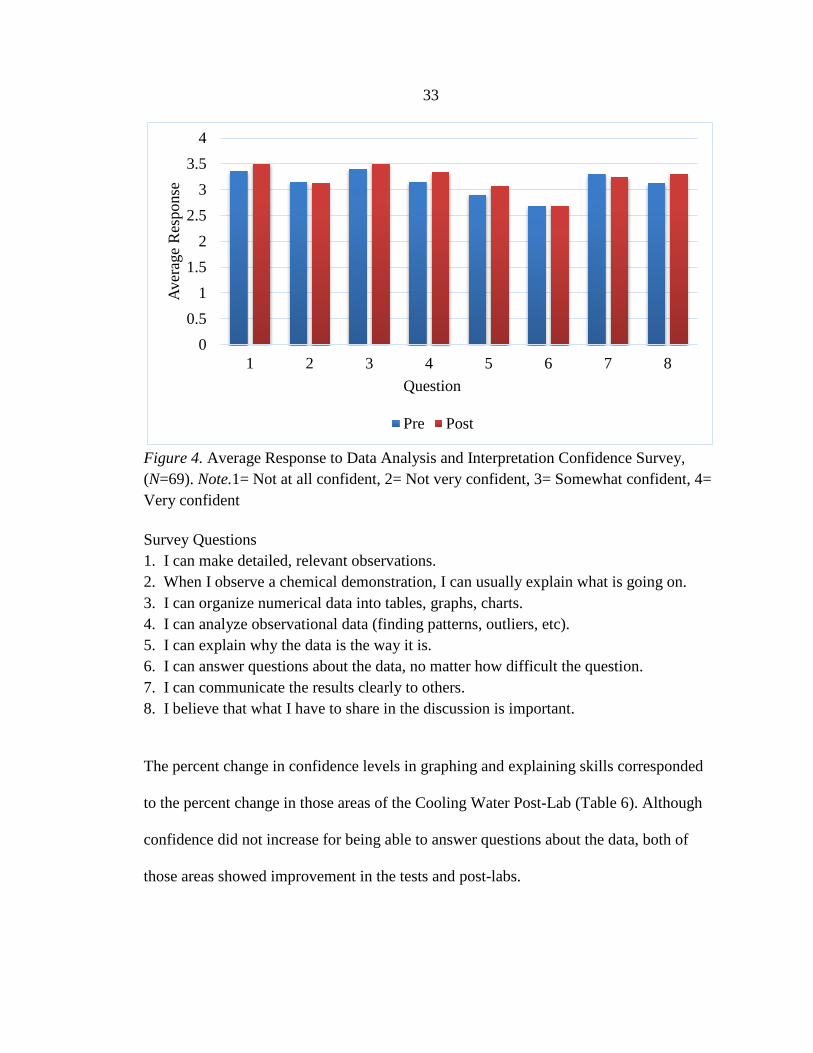
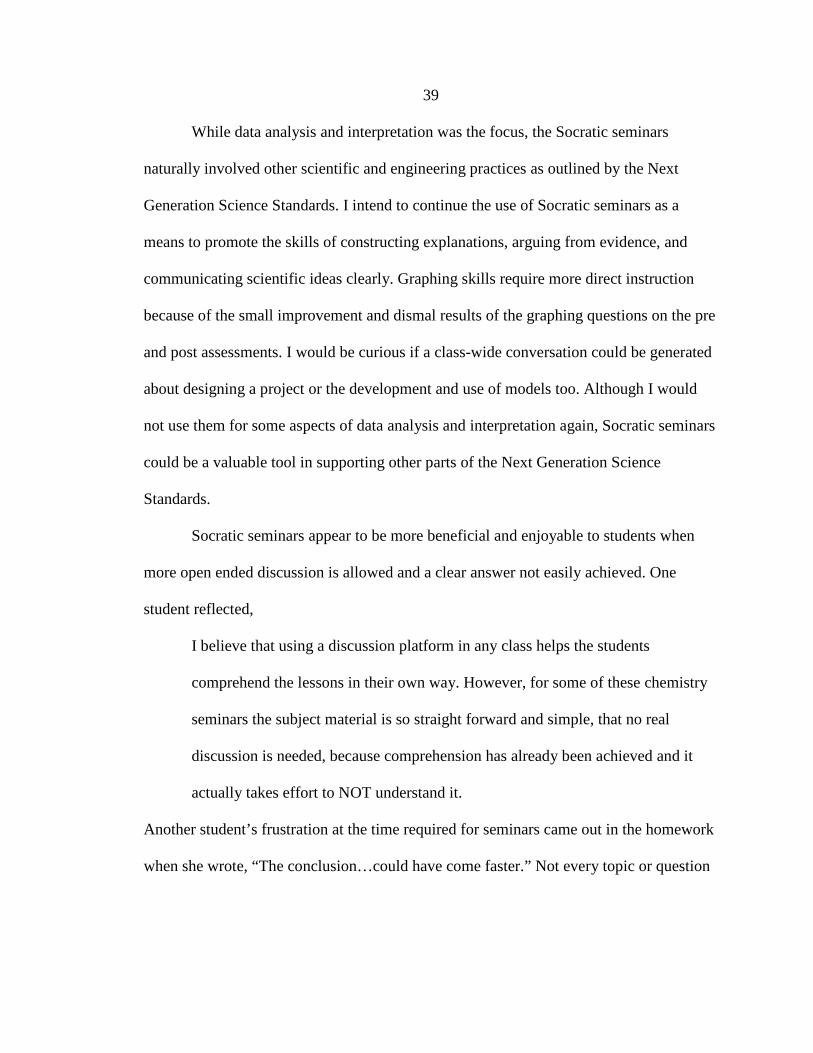
Except for the questions just mentioned, all other categories of data analysis and
interpretation on the survey experienced an increase in confidence levels (Figure 4).
Through the Heat Transfer Seminar a student said, “I understand the graph and data a lot
more because a lot of people explained the data which made it easier to understand.” A
6.0% increase occurred for analyzing observational data followed closely by a 5.6%
change for I believe that what I have to share in the discussion is important. Overall, the
categories in which students felt the most confident were making detailed, relevant
observations and organizing data into tables, charts, and graphs. The average response for
organizing data into tables, charts, and graphs was 3.5 between somewhat confident and
very confident.
33
Figure 4. Average Response to Data Analysis and Interpretation Confidence Survey, (N=69). Note.1= Not at all confident, 2= Not very confident, 3= Somewhat confident, 4= Very confident Survey Questions 1. I can make detailed, relevant observations. 2. When I observe a chemical demonstration, I can usually explain what is going on. 3. I can organize numerical data into tables, graphs, charts. 4. I can analyze observational data (finding patterns, outliers, etc). 5. I can explain why the data is the way it is. 6. I can answer questions about the data, no matter how difficult the question. 7. I can communicate the results clearly to others. 8. I believe that what I have to share in the discussion is important.
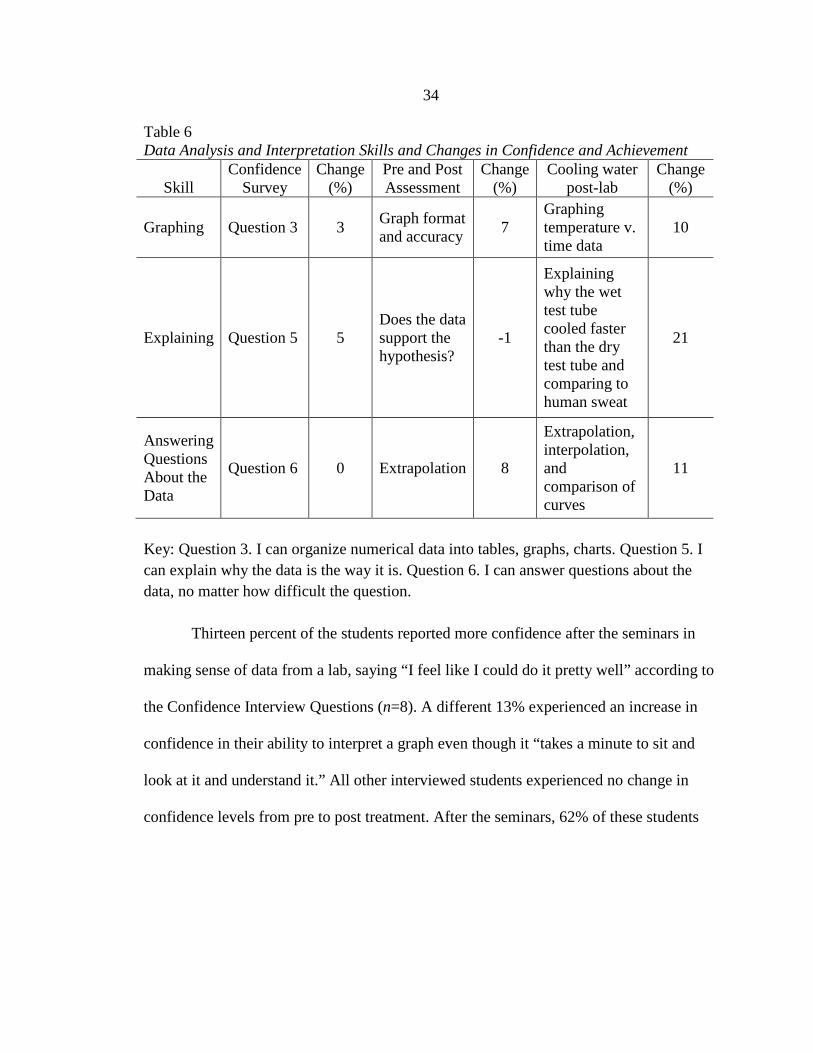
The percent change in confidence levels in graphing and explaining skills corresponded
to the percent change in those areas of the Cooling Water Post-Lab (Table 6). Although
confidence did not increase for being able to answer questions about the data, both of
those areas showed improvement in the tests and post-labs.
00.5
11.5
22.5
33.5
4
1 2 3 4 5 6 7 8
Aver
age
Res
pons
e
Question
Pre Post
34
Table 6 Data Analysis and Interpretation Skills and Changes in Confidence and Achievement
Skill Confidence
Survey Change
(%) Pre and Post Assessment
Change (%)
Cooling water post-lab
Change (%)
Graphing Question 3 3 Graph format and accuracy 7
Graphing temperature v. time data
10
Explaining Question 5 5 Does the data support the hypothesis?
-1
Explaining why the wet test tube cooled faster than the dry test tube and comparing to human sweat
21
Answering Questions About the Data
Question 6 0 Extrapolation 8
Extrapolation, interpolation, and comparison of curves
11
Key: Question 3. I can organize numerical data into tables, graphs, charts. Question 5. I can explain why the data is the way it is. Question 6. I can answer questions about the data, no matter how difficult the question.
Thirteen percent of the students reported more confidence after the seminars in
making sense of data from a lab, saying “I feel like I could do it pretty well” according to
the Confidence Interview Questions (n=8). A different 13% experienced an increase in
confidence in their ability to interpret a graph even though it “takes a minute to sit and
look at it and understand it.” All other interviewed students experienced no change in
confidence levels from pre to post treatment. After the seminars, 62% of these students
35
were confident in making sense of the data, picking out patterns, and interpreting a graph.
The remaining 38% were lacking confidence in one of those areas.
INTERPRETATION AND CONCLUSION
When asked if Socratic seminars increase student achievement in data analysis
and interpretation, the data shows mixed results. The class average on the pre and post-
test improved even though a third of the students dropped their scores. The other 66%
showed huge improvement to make up for the decrease. Does this reveal that this test is
unreliable? Or did misconceptions persist and spread through the treatment? I also
wonder if the students just did not take the second test as seriously as the first since it was
nearing the end of the school year.
With the graphing portion of the test still showing the lowest scores and mixed
improvements, I looked to the other tool measuring graphing skills, the Cooling Water
Post-Lab. In the Post-Lab, the seminar aided the students in improving their graphs.
Without any guidance from me, students revised their post-labs during a seminar and
showed 46% gain in average score. Talking about it and asking pointed questions about
the data helped all of the students refine their explanations, predictions, and graphs.
However, the improvements to that one graph did not translate into overall improved
graphing skills, according to the Pre- and Post-Assessment. I had to prompt each class to
consider the How to Read and Make a Graph handout. Is graphing a portion of data
analysis best done through direct instruction?
36
I am not confident in the use of the homework assignment grade as a valuable
data tool. The rubric was too generic and the guidelines for the assignment too loose to
elicit meaningful results. However, the homework scores did increase as I made my
expectations clearer to the students. A few misconceptions persisted from the seminar
into the post-seminar homework assignment.
Given the open-ended nature of Socratic seminars, I avoided correcting all of the
misconceptions right as they entered the discussion because I desired to let the
conversation flow. I did jump in to correct most misconceptions, but, according to the
students’ post seminar summaries, many misconceptions persisted. What balance must I
strike between allowing free student conversation about a text and actually teaching
against a misconception? Can I actually ever design a seminar in chemistry class that
completely fits the Socratic model of being open-ended without correct answers?
Internal validity was achieved by limiting the students’ exposure to data analysis
outside of the seminars. Data analysis involving tables, graphs, and charts during the
treatment window only happened in the seminars. Two episodes of observational,
qualitative data analysis occurred outside of a seminar. The scope of the questions on the
Pre- and Post-Data Analysis and Interpretation Assessment, however, did not include the
skills required in those episodes. The Confidence Survey included the categories of I can
make detailed, relevant observations and When I observe a chemical demonstration, I
can usually explain what is going on which could have been affected by other
opportunities for data analysis during the treatment period.
37
According to both the confidence survey and the interviews, student confidence in
data analysis and interpretation skills increased. The more you perform an action or a
skill the more likely you are to grow in confidence and data analysis is no exception.
However, Socratic seminars tend to be a very intimidating place to practice new skills
and I wonder if a small group setting would have seen bigger gains in confidence than the
seminar setting.
Initially, I gave the Data Analysis and Interpretation Confidence Survey before
the pre-test. I am curious if students answered more or less confidently without having
had recent, concrete examples of data analysis. Prior to the survey, the only data analysis
performed in the class was on observational, qualitatively data unlike the quantitative
data in the pre-tests and in the seminars. I also wonder if the confidence levels reported
by the students are reliable. Would a different day produce different results? I hoped the
overall change in confidence could be connected to actual achievement, so I compared
confidence increase with increases in achievement in certain areas of data analysis. The
gains made in both graphing and explaining appear to correlate. Although the confidence
level for answering questions about the data remained constant, the students still
exhibited an increase in performance.
The clearest answer of all was to the focus question, Do Socratic seminars
encourage more frequent and informed scientific communication among students in the
classroom and in written responses to the teacher? The quality of discussion was above
what I expected. Students integrated the data from graphs, tables, and observations into
38
their prior knowledge. Sometimes the discussion involved were misconceptions that had
to be corrected. Most times, the synthesis led to complete and correct explanations of the
data. Each class of students achieved high levels of scientific communication through the
seminars. In the written responses, students improved from the first seminar to the last
seminar. Over 92% of the class participated in some way in each seminar, compared to
only 55% in a previous class discussion. Socratic seminars, with their clear expectations
of participation and synthesis, promoted high levels of both verbal and written scientific
communication.
VALUE
In the very first seminar, I welled up with pride listening to my students develop a
definition for specific heat capacity just by looking at the data. Students connected
intermolecular forces to the flat parts of a heat curve for water. In the Cooling Water
seminar, students united to revise their explanations as to why water in wet test tubes
cools faster than in dry test tubes. In the last seminar, students struggled through what
climate change data means in their everyday lives. A teacher observer noted, “The flow
of conversation was amazing as students grappled with subject matter.” I am reminded
through this process how smart and articulate my students are and how very few
opportunities I give them to demonstrate their skills. While content is important,
processing the content through discussion and learning to communicate science clearly is
also a vital piece to students’ success in science.
39
While data analysis and interpretation was the focus, the Socratic seminars
naturally involved other scientific and engineering practices as outlined by the Next
Generation Science Standards. I intend to continue the use of Socratic seminars as a
means to promote the skills of constructing explanations, arguing from evidence, and
communicating scientific ideas clearly. Graphing skills require more direct instruction
because of the small improvement and dismal results of the graphing questions on the pre
and post assessments. I would be curious if a class-wide conversation could be generated
about designing a project or the development and use of models too. Although I would
not use them for some aspects of data analysis and interpretation again, Socratic seminars
could be a valuable tool in supporting other parts of the Next Generation Science
Standards.
Socratic seminars appear to be more beneficial and enjoyable to students when
more open ended discussion is allowed and a clear answer not easily achieved. One
student reflected,
I believe that using a discussion platform in any class helps the students
comprehend the lessons in their own way. However, for some of these chemistry
seminars the subject material is so straight forward and simple, that no real
discussion is needed, because comprehension has already been achieved and it
actually takes effort to NOT understand it.
Another student’s frustration at the time required for seminars came out in the homework
when she wrote, “The conclusion…could have come faster.” Not every topic or question
40
is worth pursuing through a Socratic seminar. I plan to use the Climate Change seminar
again next year and incorporate a Socratic seminar into first semester. I will re-evaluate
the other three seminars and how they would assist my new students in the data analysis
process. I wonder if a different set of students, less motivated students, would be
naturally as curious and could carry on a conversation in the same way. Even if I do not
implement formal Socratic seminars, I plan to continue the use of Socratic questioning
and incorporate more data analysis into the curriculum.
The biggest area of weakness this project exposed in my teaching is my pride. I
am confident in my teaching ability; I was not confident in my ability to plan and lead
Socratic seminars. This lack of confidence coupled with my pride kept me from
collaborating with other teachers early on in the process- the very thing I was trying to
get my students to do in the seminars! As I gained confidence in the process and the
technique, I started sharing more and opened myself up to more critique and other ideas. I
could have saved myself and my students from some mistakes had I only spoken sooner.
Socratic seminar joins the toolbox for promoting scientific communication in my
chemistry classes. Although seminars are used almost exclusively in English and history
classes, science teachers should not fear this method. As one English teacher friend
remarked, “Socratic seminar actually reflects the spirit of scientific inquiry.” The
seminars promote open-ended discussion about data without knowing the conclusion. As
a science teacher, I tend to teach the science concepts without divulging the thought
process and experimentation that went into the law or theory. I also can be arrogant in my
41
position as the teacher. Socratic seminars help put me in my place. “I learn eas[ily] when
other people are talking and it’s not just the teacher because then you hear other
opinions,” testified one student. That is the goal of effective science teaching: giving the
students the tools and confidence to do and discuss science on their own.
42
REFERENCES CITED
Adler, M.J. (1982). The Paideia proposal. New York: MacMillan. Billings, L., & Roberts, T. (2003). The Paideia seminar: Active thinking through
dialogue. Chapel Hill, NC: National Paideia Center. Billings, L., & Roberts, T. (2012). Think like a seminar. Educational Leadership, 70(4),
68-72. The Classical Academy. (2010). TCA Core Values. Retrieved September 30, 2012, from
http://www.tcad20.org/pdf/TCA_Core_Values_Final_12-6-2010.pdf The Classical Academy. (2012). Enrollment. Retrieved October 11, 2012, from
http://www.tcad20.org/apps/pages/?uREC_ID=104259&type=d&pREC_ID=204554
Colorado Department of Education. (2005). 2005-2006 Demonstration Packet: Science
Grade 10. Retrieved October 18, 2013, from http://www.cde.state.co.us/assessment/coassess-released
Colorado Department of Education. (2005). 2005-2006 Demonstration Packet: Science
Grade 8. Retrieved October 24, 2013, from http://www.cde.state.co.us/assessment/coassess-released
Colorado Department of Education. (2013). SY2013-14 Charter School Demographics by
School Name (PK-12). Retrieved June 26, 2014, from http://www.cde.state.co.us/sites/default/files/rptDemographicsAllPK-12%20%282%29.pdf
Colorado Department of Education. (2010). Guide to test interpretation. Retrieved
February 1, 2014, from http://www.cde.state.co.us/sites/default/files/ documents/assessment/documents/cotest/gti_9_10_2011csap.pdf
Colorado Department of Education. (2011). Fact Sheet for Science TCAP – Grades 5, 8
and 10. Retrieved April 11, 2013, from http://www.cde.state.co.us/assessment/documents/factsheets/TCAP_factsheet_sci.pdf
43
Colorado Department of Education. (2013). Science grade 5, 8 and 10. Retrieved February 9, 2014, from http://www.cde.state.co.us/assessment/CoAssess-DataAndResults.asp
Chowning, J.T. (2009). Socratic seminars in science class: providing a structured format
to promote dialogue and understanding. The Science Teacher, 76(7), 36-41. Heeren, J.K. (1990). Teaching chemistry by the Socratic method. Journal of Chemical
Education, 67(4), 330-331. Holme, T.A. (1992). Using the Socratic method in large lecture courses. Journal of
Chemical Education, 69(12), 974-977. Junker, J.L., Waterhouse, G.A.W., & Garrett, R.L. (1993). Improved student performance
following the introduction of Socratic teaching methods for basic science courses in pharmacy school. Annals of the New York Academy of Sciences, 701, 120-121.
Koellner-Clark, K., Stallings, L.L, & Hoover, S.A. (2002). Socratic seminars for
mathematics. The Mathematics Teacher, 95(9), 682-687. Le, K.G., & DeFilippo, C.L. (2008). Little philosophers. Educational Leadership, 66(2),
66-69. McComas, W.F. (2004). Keys to teaching the nature of science. The Science Teacher,
79(9), 24-27. Myers, L.L. (1988). Teachers as models of active learning. College Teaching, 38(2), 43-
45. National Center for Education Statistics. (2011). Estimated average annual salary of
teachers in public elementary and secondary schools, by state: Selected years, 1969-70 through 2010-11. Retrieved April 24, 2013, from http://nces.ed.gov/programs/digest/d11/tables/dt11_084.asp
National Research Council. (2012). A framework for K-12 science education: Practices,
crosscutting concepts, and core ideas.Washington, DC: The National Academies Press.
Overholser, J.C. (1992). Socrates in the classroom. College Teaching, 40(1), 14-19.
44
Peters, J. (2012, August 27). The classical academy high school profile 2012-2013.
Retrieved April 26, 2013, from http://tcad20.enschool.org/ourpages/auto/ 2010/10/14/68460064/High%20School%20Profile%202012-13.pdf
Phanstiel, O. (1996). Paideia seminar. The Science Teacher, 63(9), 57. Polite, V.C., & Adams, A.H. (1997). Critical thinking and values clarification through
Socratic seminars. Urban Education, 32(2), 256-278. Race ethnicity. (2014). Infinite Campus. Retrieved February 1, 2014, from
https://mycampus.asd20.org Rivet, A. (2012). Preparing for NGSS: Analyzing and interpreting data. Retrieved
February 1, 2014, from http://learningcenter.nsta.org/products/symposia_ seminars/Ngss/files/PreparingforNGSS--AnalyzingandInterpretingData_10-23-2012.pdf
Roberts, T., & Billings, L. (2008). Thinking is literacy, literacy thinking. Educational
Leadership, 65(5), 32-36. Smith, M.K., Wood, W.B., Adams, W.K., Wieman, C., Knight, J.K., Guild, N., & Su,
T.T. (2009). Why peer discussion improves student performance on in-class concept questions. Science, 323(5910), 122-124.
Tanner, M.L., & Casados, L. (1998). Promoting and studying discussions in math classes.
Journal of Adolescent & Adult Literacy, 41(5), 342-350. Tredway, L. (1995). Socratic seminars: Engaging students in intellectual discourse.
Educational Leadership, 53(1), 26-29. USA.com. (n.d.). The classical academy high school. Retrieved April 24, 2013, from
http://www.usa.com/public-school/the-classical-academy-high-school-colorado-springs-co-080192001943.html?nv=school-district-0801920

45
U.S. News. (2013). The Classical Academy High School. Retrieved April 11, 2013, from http://www.usnews.com/education/best-high-schools/colorado/districts/academy-school-district-no-20-in-the-county-of-el-paso-an/the-classical-academy-high-school-3959
Wiggins, A. (2011). Not teaching ethics. Phi Delta Kappan, 93(1), 33-35.

46
APPENDICES
47
APPENDIX A
MONTANA STATE UNIVERSITY’S INSTITUTIONAL REVIEW BOARD
EXEMPTION
48
49
APPENDIX B
HEAT TRANSFER AND SPECIFIC HEAT SEMINAR
50
Seminar 1: Heat Transfer and Specific Heat
*Have a hot seat ready for an “outsider” to contribute to the discussion.
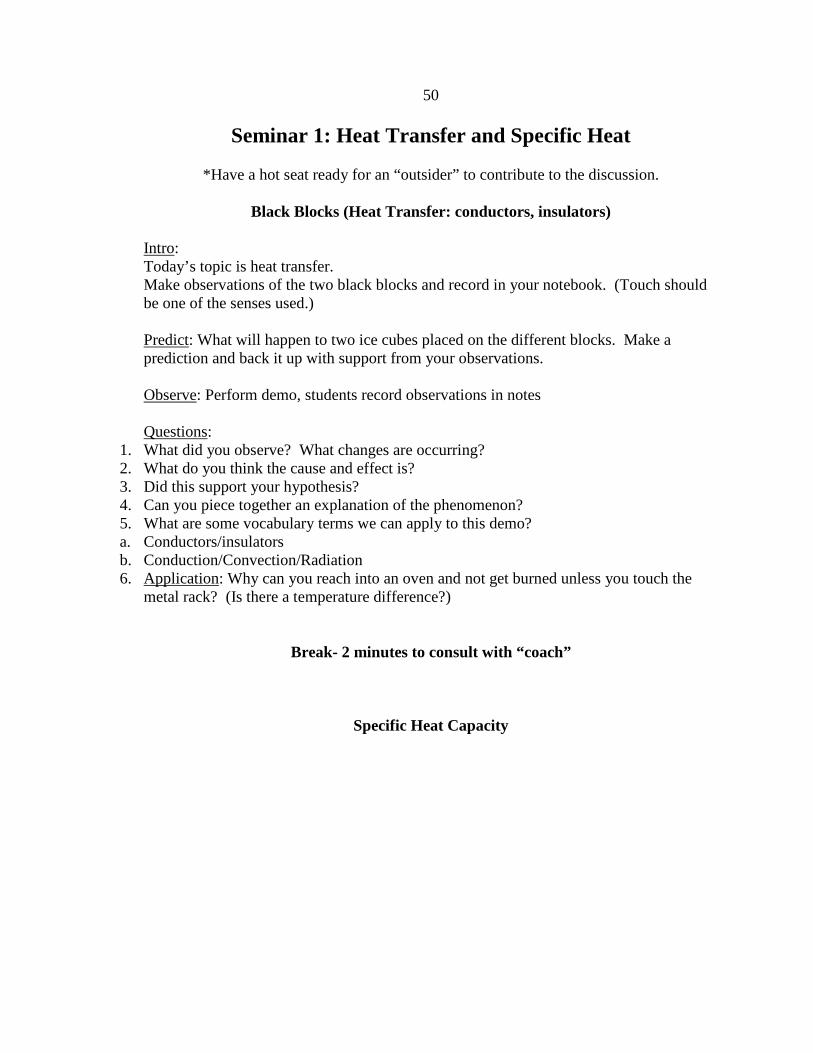
Black Blocks (Heat Transfer: conductors, insulators) Intro: Today’s topic is heat transfer. Make observations of the two black blocks and record in your notebook. (Touch should be one of the senses used.) Predict: What will happen to two ice cubes placed on the different blocks. Make a prediction and back it up with support from your observations. Observe: Perform demo, students record observations in notes Questions:
1. What did you observe? What changes are occurring? 2. What do you think the cause and effect is? 3. Did this support your hypothesis? 4. Can you piece together an explanation of the phenomenon? 5. What are some vocabulary terms we can apply to this demo? a. Conductors/insulators b. Conduction/Convection/Radiation 6. Application: Why can you reach into an oven and not get burned unless you touch the
metal rack? (Is there a temperature difference?)
Break- 2 minutes to consult with “coach”
Specific Heat Capacity
51
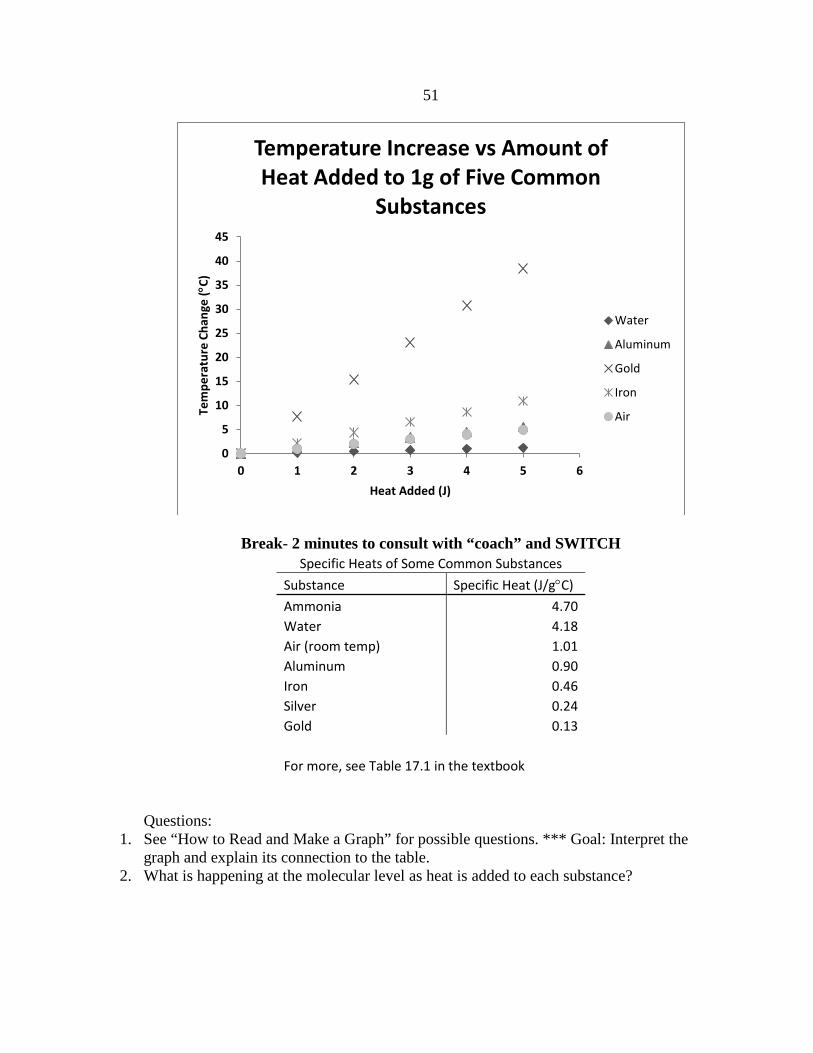
Break- 2 minutes to consult with “coach” and SWITCH Specific Heats of Some Common Substances
Substance Specific Heat (J/g°C) Ammonia 4.70 Water 4.18 Air (room temp) 1.01 Aluminum 0.90 Iron 0.46 Silver 0.24 Gold 0.13
For more, see Table 17.1 in the textbook
Questions: 1. See “How to Read and Make a Graph” for possible questions. *** Goal: Interpret the
graph and explain its connection to the table. 2. What is happening at the molecular level as heat is added to each substance?
0
5
10
15
20
25
30
35
40
45
0 1 2 3 4 5 6
Tem
pera
ture
Cha
nge
(°C)
Heat Added (J)
Temperature Increase vs Amount of Heat Added to 1g of Five Common
Substances
Water
Aluminum
Gold
Iron
Air
52
3. Can you piece together an explanation of the phenomenon? Why are some steeper than others?
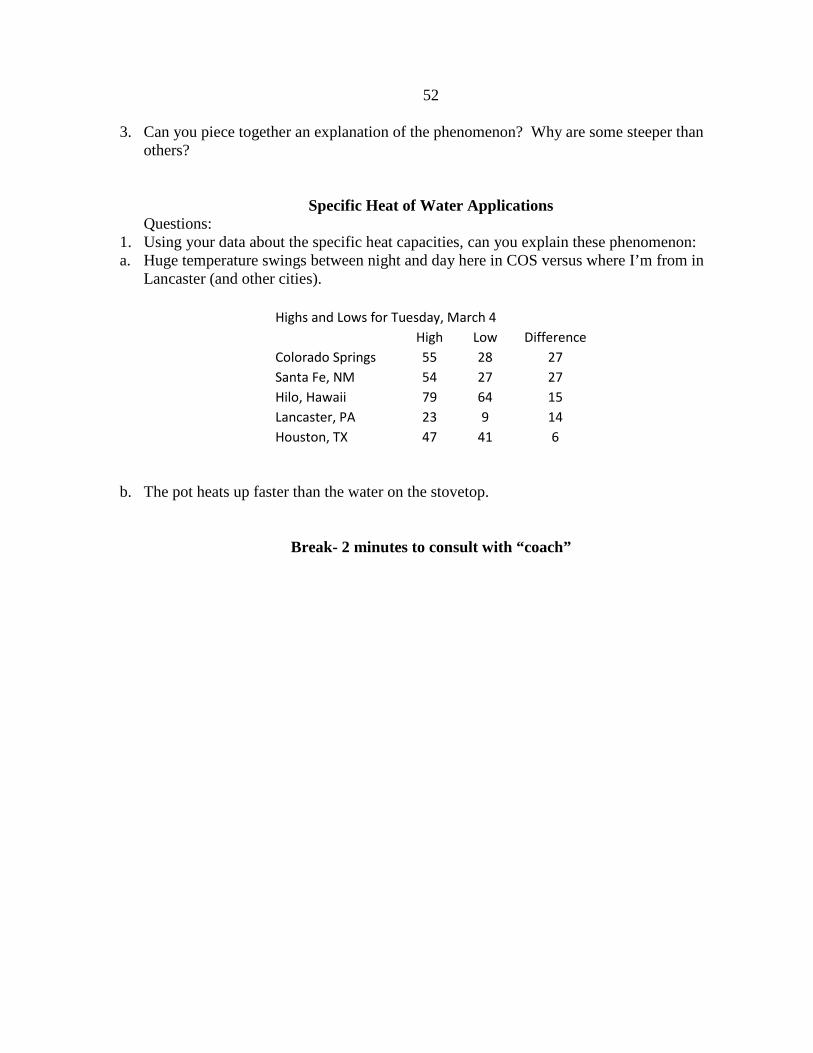
Specific Heat of Water Applications Questions:
1. Using your data about the specific heat capacities, can you explain these phenomenon: a. Huge temperature swings between night and day here in COS versus where I’m from in
Lancaster (and other cities).
Highs and Lows for Tuesday, March 4
High Low Difference
Colorado Springs 55 28 27 Santa Fe, NM 54 27 27 Hilo, Hawaii 79 64 15 Lancaster, PA 23 9 14 Houston, TX 47 41 6
b. The pot heats up faster than the water on the stovetop.
Break- 2 minutes to consult with “coach”
53
-5
0
5
10
15
20
25
30
35
40
45
0 1 2 3 4 5 6
Tem
pera
ture
Cha
nge
(°C)
Heat Added (J)
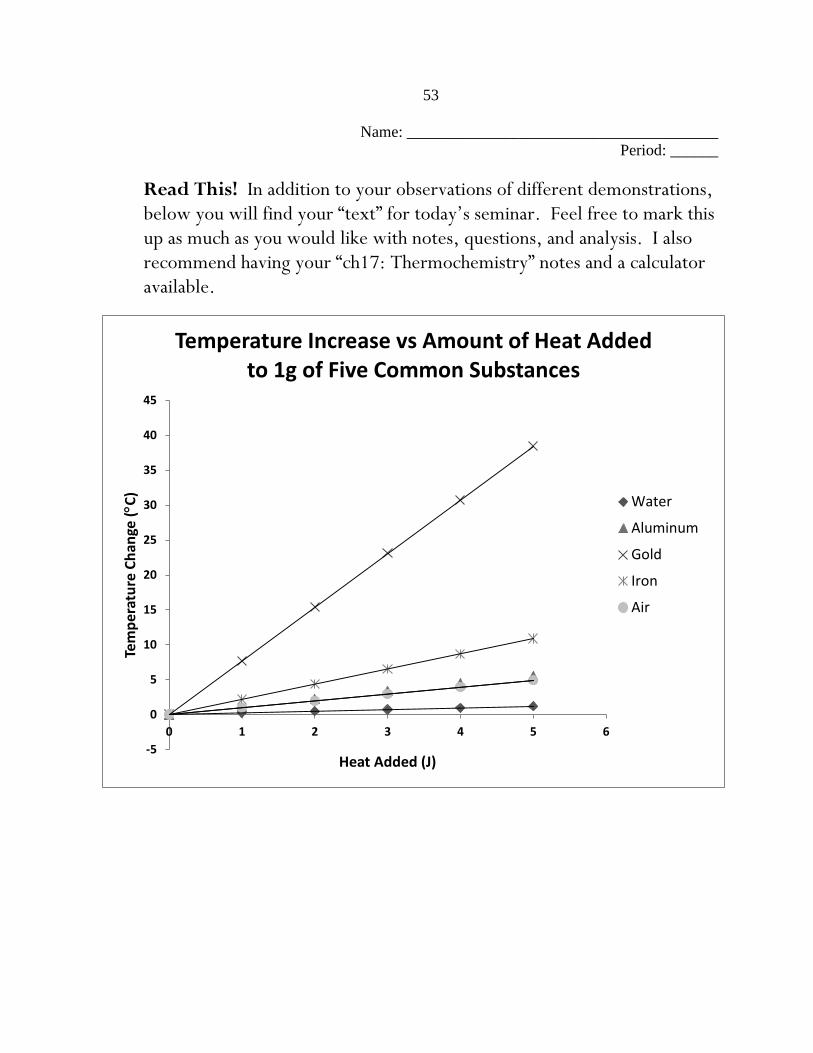
Temperature Increase vs Amount of Heat Added to 1g of Five Common Substances
Water
Aluminum
Gold
Iron
Air
Name: _______________________________________ Period: ______
Read This! In addition to your observations of different demonstrations, below you will find your “text” for today’s seminar. Feel free to mark this up as much as you would like with notes, questions, and analysis. I also recommend having your “ch17: Thermochemistry” notes and a calculator available.
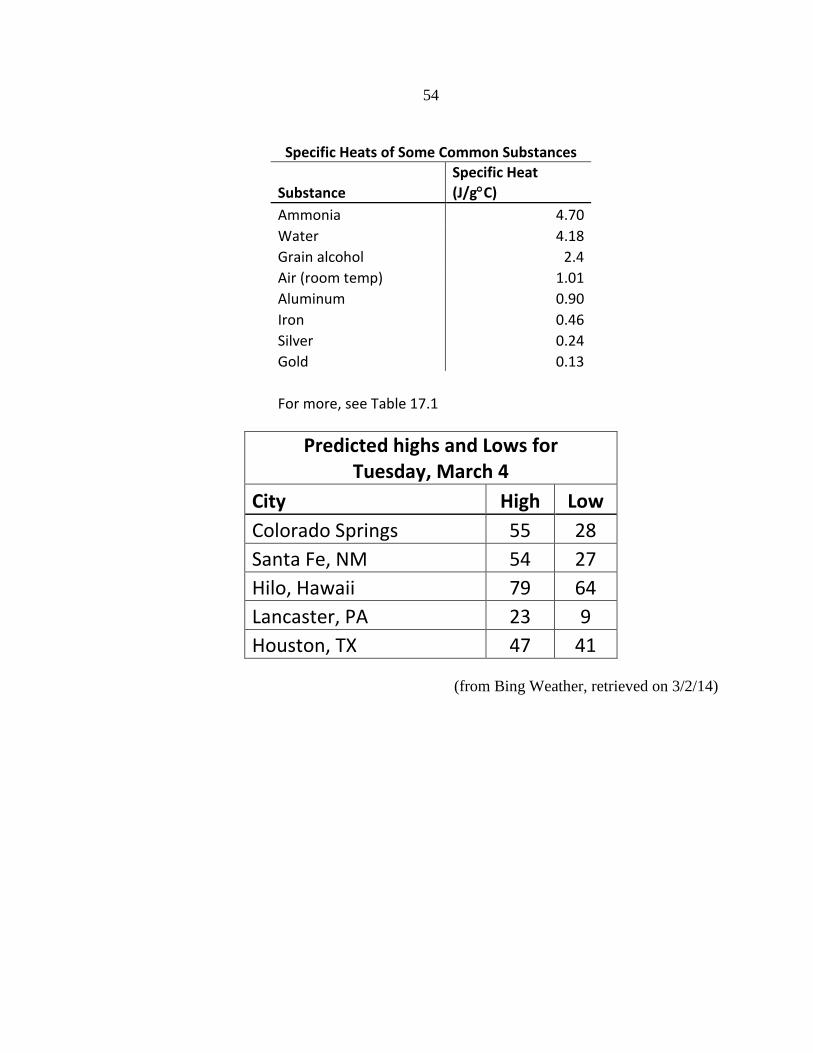
54
Specific Heats of Some Common Substances
Substance Specific Heat (J/g°C)
Ammonia 4.70 Water 4.18 Grain alcohol 2.4 Air (room temp) 1.01 Aluminum 0.90 Iron 0.46 Silver 0.24 Gold 0.13
For more, see Table 17.1
Predicted highs and Lows for Tuesday, March 4
City High Low Colorado Springs 55 28 Santa Fe, NM 54 27 Hilo, Hawaii 79 64 Lancaster, PA 23 9 Houston, TX 47 41
(from Bing Weather, retrieved on 3/2/14)
55
APPENDIX C
HEATING CURVE OF WATER SEMINAR
56
Seminar 2: Heating Curve of Water
Objective: Students will understand how heat and temperature changes are related to phase changes. Students will discover that at phase changes, temperature remains constant. Materials: Heat Curve Handout, Bunsen burner, ring stand, wire mesh, thermometer clamp, document camera, Vernier with temperature probe, ice, beaker tongs, 400-mL beaker, phET simulations on heat and states of matter Starting Question:
1. Describe what this graph is telling us. (Use How to Read a Graph for other leading questions).
2. Why is there different lengths/ different slopes? Demo:
1. Have students draw a blank heating curve: x-axis is “heating time”, y-axis is oC. (If students ask, they can use minutes for the time axis.)
2. Place a beaker of ice water over a Bunsen burner with a thermometer (use the LabPro with overhead projection).
3. Ask student to draw a heating curve or line to depict what they think will happen to the temperature of the water as it is heated with the Bunsen burner. They must label their hypothetical starting temperature. Walk around the class to check.
4. Turn the overhead on and let the students compare the actual starting temperature with their predictions. Have them start a second line/curve to represent the experimental data.
5. Heat the ice water over the Bunsen burner. Suggested questions: a. Why doesn’t the temperature increase very much as long as there is still ice? b. Does the temperature increase seem to be constant once the ice is gone? (optional:
you might point out the slope of the line is something called “heat capacity” of that substance)
c. Have students predict the boiling point. d. Will the boiling point in Colorado Springs be higher or lower than at sea level? Why? e. What happens to the temperature once it starts boiling? Why? f. Why are the numbers fluctuating slightly? (talk about significant figures and errors in
measurement) Connections:
1. How are the graph and demo connected?
57
2. How could we determine the amount of heat needed to: a. Raise the temperature of liquid water from 0-100? q=mcΔT b. Melt 100g of ice c. Go from -10 to 110 ? ΔHfus =6.01 kJ/mol and ΔHvap =40.7 kJ/mol
3. Steam burns versus hot water burns? 4. Looking at the heat curve for iron, what can you tell me about iron?
a. melting point 1538°C b. boiling point 2861°C c. solid at room temperature
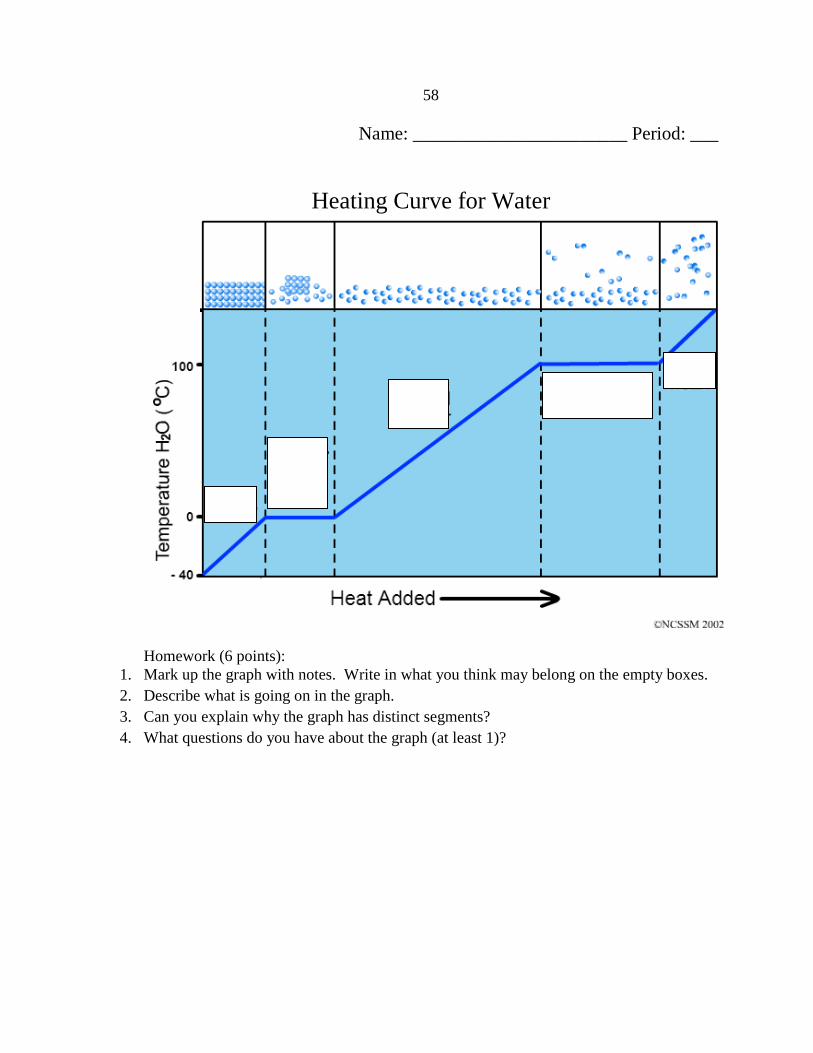
58
Name: _______________________ Period: ___
Heating Curve for Water
Homework (6 points):
1. Mark up the graph with notes. Write in what you think may belong on the empty boxes. 2. Describe what is going on in the graph. 3. Can you explain why the graph has distinct segments? 4. What questions do you have about the graph (at least 1)?
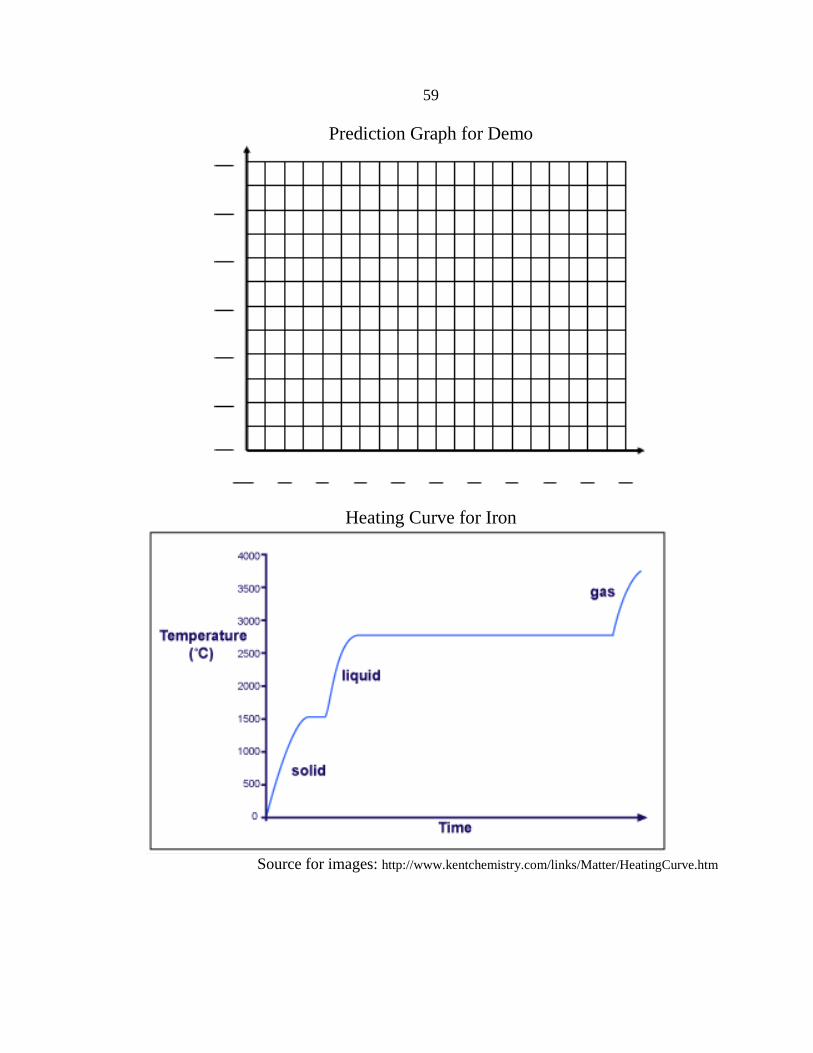
59
Prediction Graph for Demo
Heating Curve for Iron
Source for images: http://www.kentchemistry.com/links/Matter/HeatingCurve.htm

60
APPENDIX D
COOLING WATER LAB
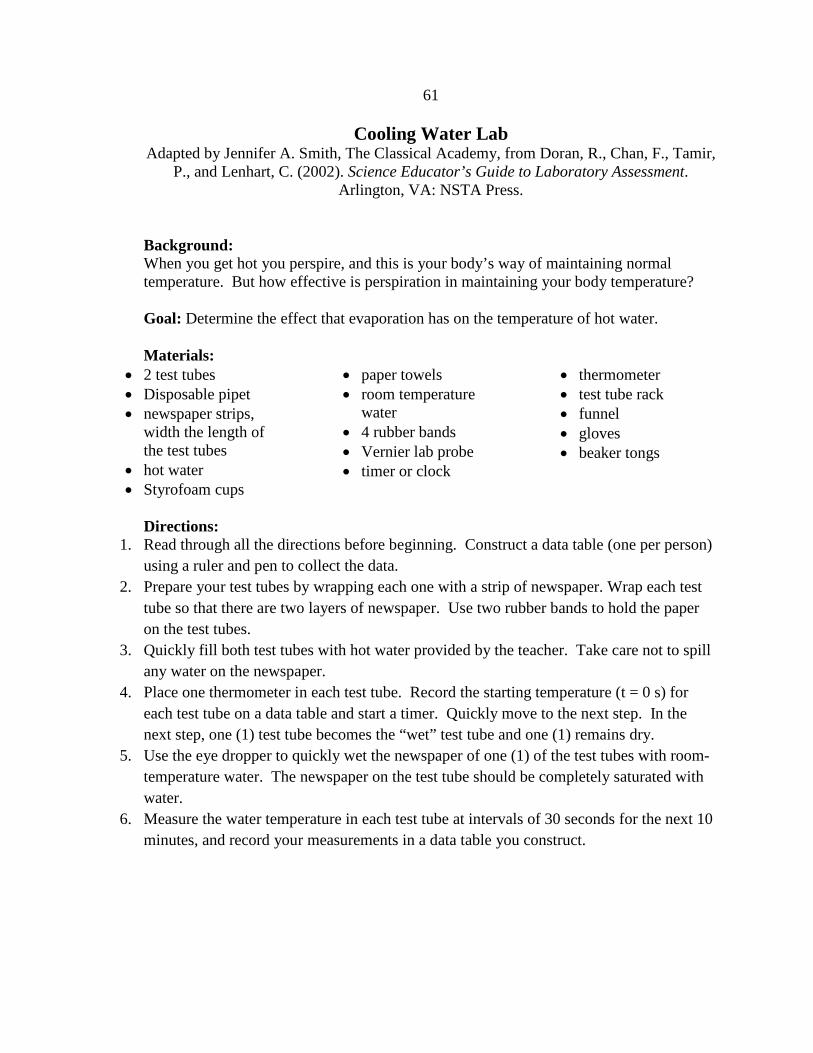
61
Cooling Water Lab Adapted by Jennifer A. Smith, The Classical Academy, from Doran, R., Chan, F., Tamir,
P., and Lenhart, C. (2002). Science Educator’s Guide to Laboratory Assessment. Arlington, VA: NSTA Press.
Background: When you get hot you perspire, and this is your body’s way of maintaining normal temperature. But how effective is perspiration in maintaining your body temperature? Goal: Determine the effect that evaporation has on the temperature of hot water. Materials:
• 2 test tubes • Disposable pipet • newspaper strips,
width the length of the test tubes
• hot water • Styrofoam cups
• paper towels • room temperature
water • 4 rubber bands • Vernier lab probe • timer or clock
• thermometer • test tube rack • funnel • gloves • beaker tongs
Directions:
1. Read through all the directions before beginning. Construct a data table (one per person) using a ruler and pen to collect the data.
2. Prepare your test tubes by wrapping each one with a strip of newspaper. Wrap each test tube so that there are two layers of newspaper. Use two rubber bands to hold the paper on the test tubes.
3. Quickly fill both test tubes with hot water provided by the teacher. Take care not to spill any water on the newspaper.
4. Place one thermometer in each test tube. Record the starting temperature (t = 0 s) for each test tube on a data table and start a timer. Quickly move to the next step. In the next step, one (1) test tube becomes the “wet” test tube and one (1) remains dry.
5. Use the eye dropper to quickly wet the newspaper of one (1) of the test tubes with room-temperature water. The newspaper on the test tube should be completely saturated with water.
6. Measure the water temperature in each test tube at intervals of 30 seconds for the next 10 minutes, and record your measurements in a data table you construct.
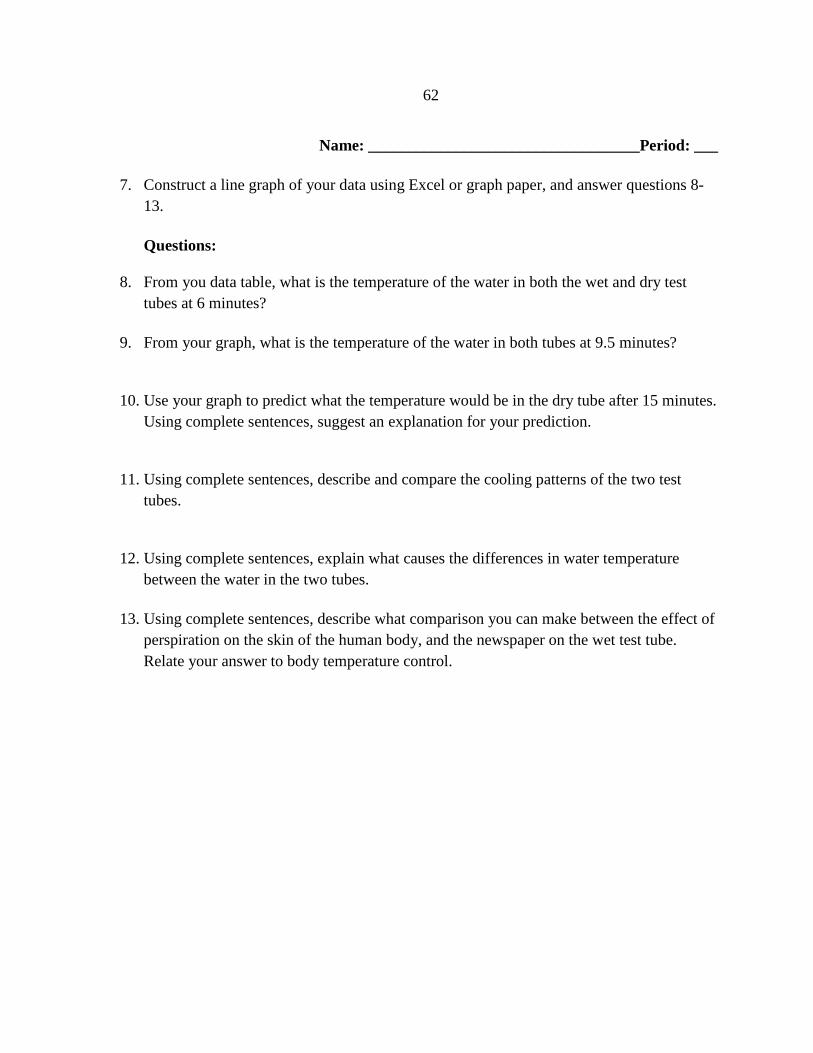
62
Name: __________________________________Period: ___
7. Construct a line graph of your data using Excel or graph paper, and answer questions 8-13. Questions:
8. From you data table, what is the temperature of the water in both the wet and dry test tubes at 6 minutes?
9. From your graph, what is the temperature of the water in both tubes at 9.5 minutes?
10. Use your graph to predict what the temperature would be in the dry tube after 15 minutes. Using complete sentences, suggest an explanation for your prediction.
11. Using complete sentences, describe and compare the cooling patterns of the two test tubes.
12. Using complete sentences, explain what causes the differences in water temperature between the water in the two tubes.
13. Using complete sentences, describe what comparison you can make between the effect of perspiration on the skin of the human body, and the newspaper on the wet test tube. Relate your answer to body temperature control.
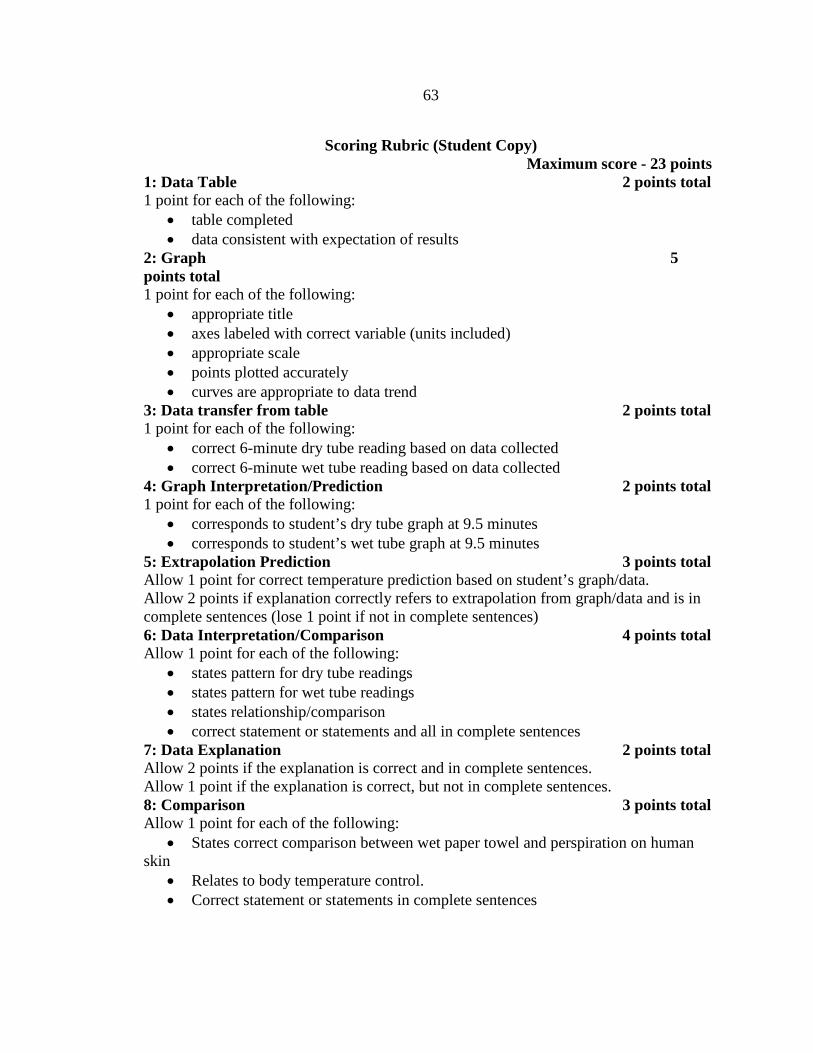
63
Scoring Rubric (Student Copy) Maximum score - 23 points 1: Data Table 2 points total 1 point for each of the following:
• table completed • data consistent with expectation of results
2: Graph 5 points total 1 point for each of the following:
• appropriate title • axes labeled with correct variable (units included) • appropriate scale • points plotted accurately • curves are appropriate to data trend
3: Data transfer from table 2 points total 1 point for each of the following:
• correct 6-minute dry tube reading based on data collected • correct 6-minute wet tube reading based on data collected
4: Graph Interpretation/Prediction 2 points total 1 point for each of the following:
• corresponds to student’s dry tube graph at 9.5 minutes • corresponds to student’s wet tube graph at 9.5 minutes
5: Extrapolation Prediction 3 points total Allow 1 point for correct temperature prediction based on student’s graph/data. Allow 2 points if explanation correctly refers to extrapolation from graph/data and is in complete sentences (lose 1 point if not in complete sentences) 6: Data Interpretation/Comparison 4 points total Allow 1 point for each of the following:
• states pattern for dry tube readings • states pattern for wet tube readings • states relationship/comparison • correct statement or statements and all in complete sentences
7: Data Explanation 2 points total Allow 2 points if the explanation is correct and in complete sentences. Allow 1 point if the explanation is correct, but not in complete sentences. 8: Comparison 3 points total Allow 1 point for each of the following:
• States correct comparison between wet paper towel and perspiration on human skin
• Relates to body temperature control. • Correct statement or statements in complete sentences

64
APPENDIX E
HOW TO READ AND MAKE A GRAPH
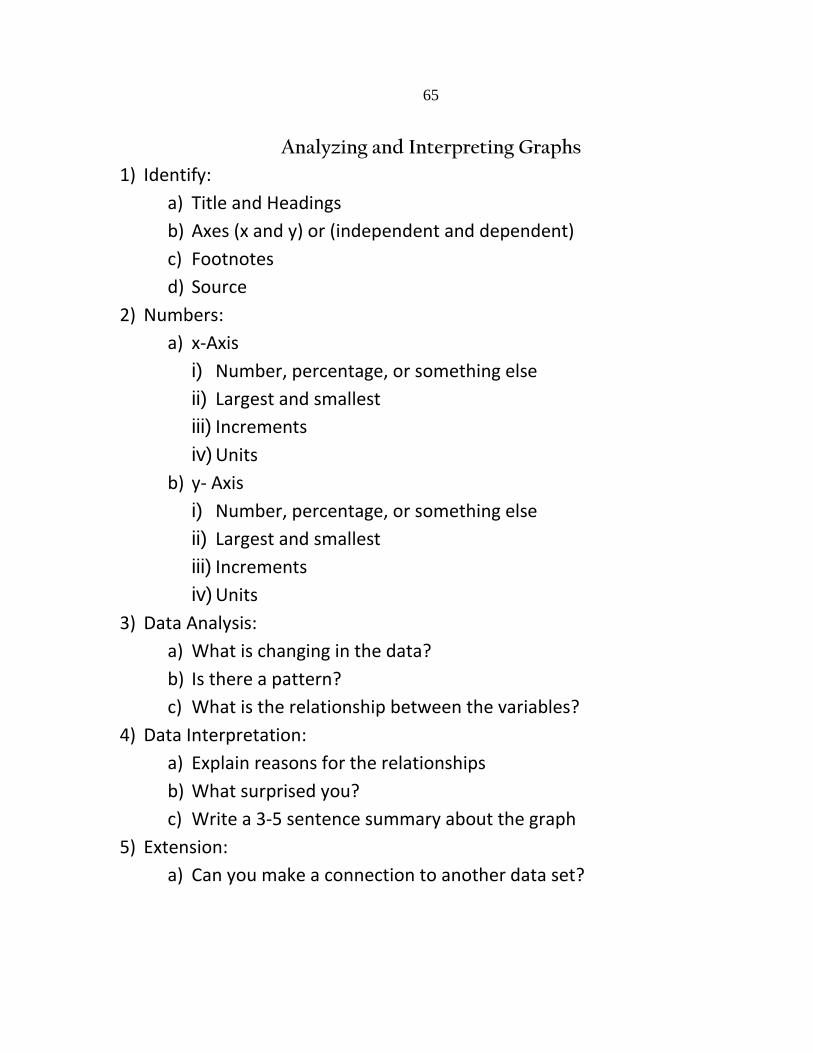
65
Analyzing and Interpreting Graphs
1) Identify: a) Title and Headings b) Axes (x and y) or (independent and dependent) c) Footnotes d) Source
2) Numbers: a) x-Axis
i) Number, percentage, or something else ii) Largest and smallest iii) Increments iv) Units
b) y- Axis i) Number, percentage, or something else ii) Largest and smallest iii) Increments iv) Units
3) Data Analysis: a) What is changing in the data? b) Is there a pattern? c) What is the relationship between the variables?
4) Data Interpretation: a) Explain reasons for the relationships b) What surprised you? c) Write a 3-5 sentence summary about the graph
5) Extension: a) Can you make a connection to another data set?
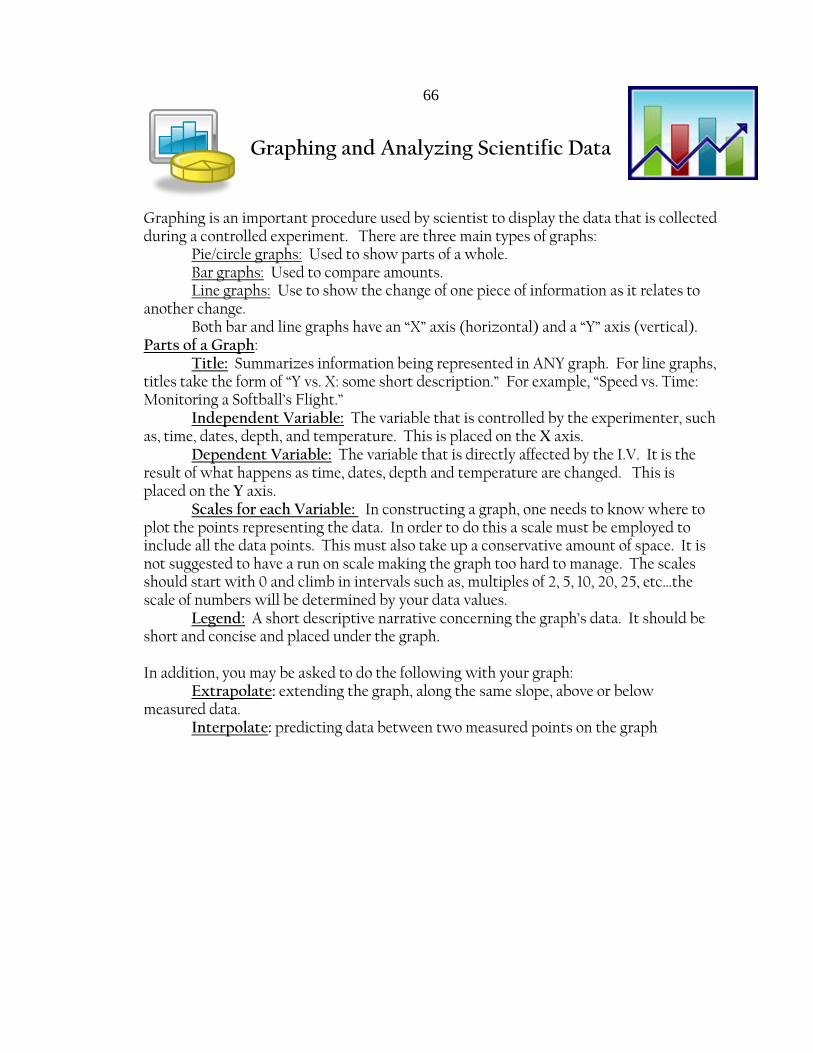
66
Graphing and Analyzing Scientific Data
Graphing is an important procedure used by scientist to display the data that is collected during a controlled experiment. There are three main types of graphs: Pie/circle graphs: Used to show parts of a whole. Bar graphs: Used to compare amounts. Line graphs: Use to show the change of one piece of information as it relates to another change. Both bar and line graphs have an “X” axis (horizontal) and a “Y” axis (vertical). Parts of a Graph: Title: Summarizes information being represented in ANY graph. For line graphs, titles take the form of “Y vs. X: some short description.” For example, “Speed vs. Time: Monitoring a Softball’s Flight.” Independent Variable: The variable that is controlled by the experimenter, such as, time, dates, depth, and temperature. This is placed on the X axis. Dependent Variable: The variable that is directly affected by the I.V. It is the result of what happens as time, dates, depth and temperature are changed. This is placed on the Y axis.
Scales for each Variable: In constructing a graph, one needs to know where to plot the points representing the data. In order to do this a scale must be employed to include all the data points. This must also take up a conservative amount of space. It is not suggested to have a run on scale making the graph too hard to manage. The scales should start with 0 and climb in intervals such as, multiples of 2, 5, 10, 20, 25, etc…the scale of numbers will be determined by your data values.
Legend: A short descriptive narrative concerning the graph’s data. It should be short and concise and placed under the graph. In addition, you may be asked to do the following with your graph: Extrapolate: extending the graph, along the same slope, above or below measured data. Interpolate: predicting data between two measured points on the graph

67
APPENDIX F
CLIMATE CHANGE SEMINAR
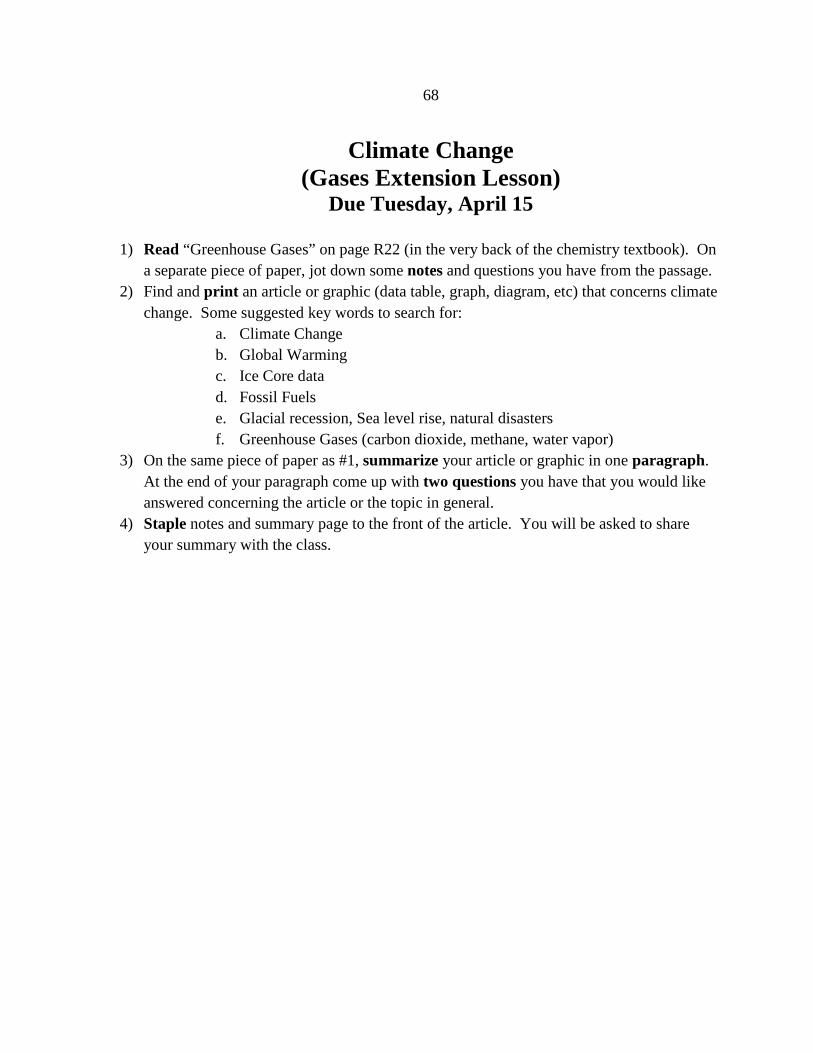
68
Climate Change (Gases Extension Lesson)
Due Tuesday, April 15
1) Read “Greenhouse Gases” on page R22 (in the very back of the chemistry textbook). On a separate piece of paper, jot down some notes and questions you have from the passage.
2) Find and print an article or graphic (data table, graph, diagram, etc) that concerns climate change. Some suggested key words to search for:
a. Climate Change b. Global Warming c. Ice Core data d. Fossil Fuels e. Glacial recession, Sea level rise, natural disasters f. Greenhouse Gases (carbon dioxide, methane, water vapor)
3) On the same piece of paper as #1, summarize your article or graphic in one paragraph. At the end of your paragraph come up with two questions you have that you would like answered concerning the article or the topic in general.
4) Staple notes and summary page to the front of the article. You will be asked to share your summary with the class.
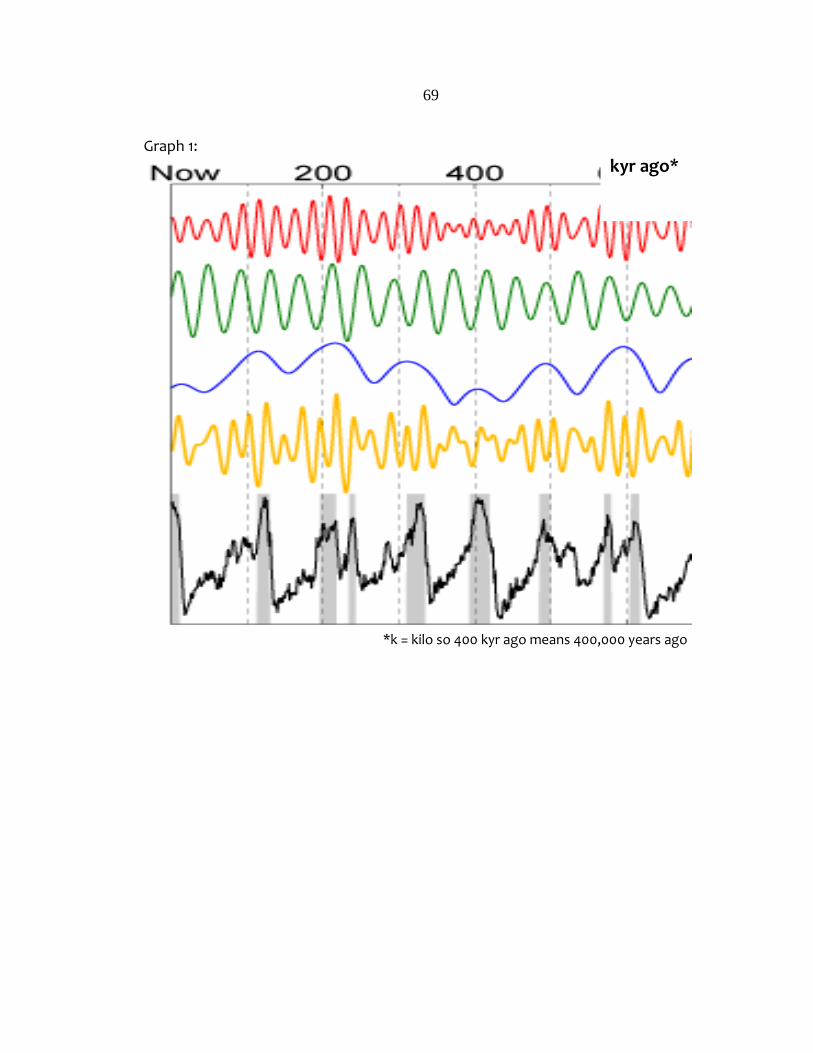
69
Graph 1:
*k = kilo so 400 kyr ago means 400,000 years ago
kyr ago*
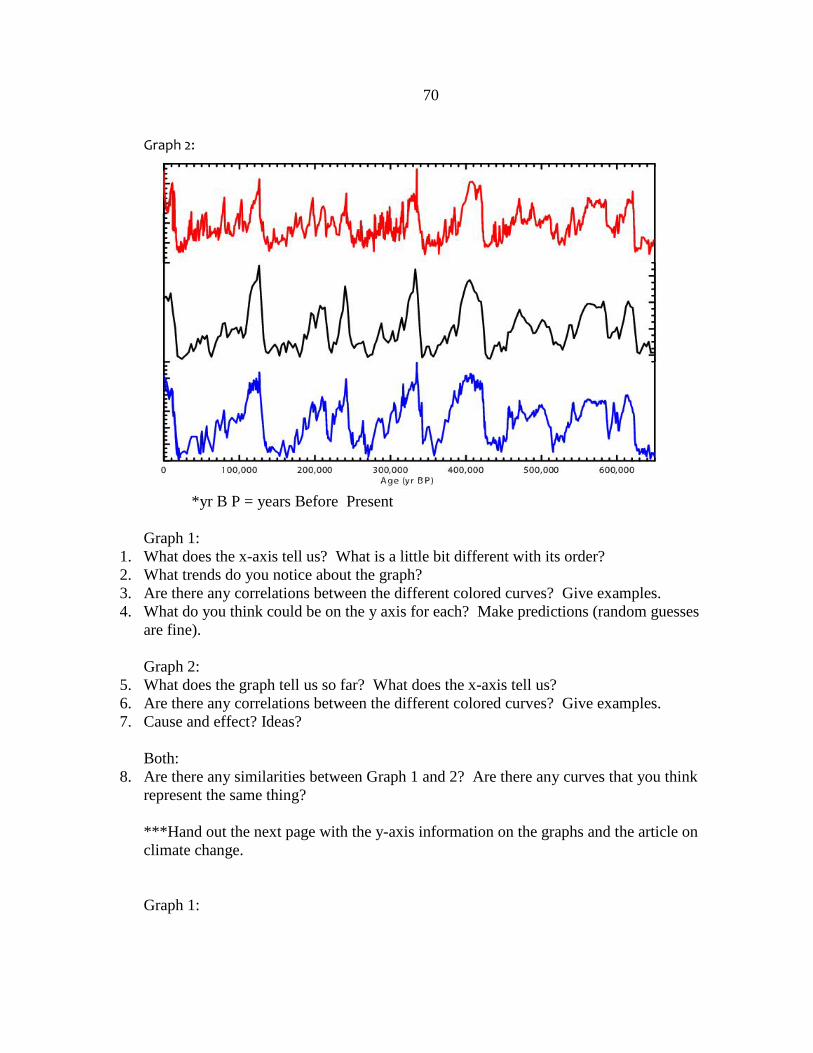
70
Graph 2:
*yr B P = years Before Present
Graph 1:
1. What does the x-axis tell us? What is a little bit different with its order? 2. What trends do you notice about the graph? 3. Are there any correlations between the different colored curves? Give examples. 4. What do you think could be on the y axis for each? Make predictions (random guesses
are fine). Graph 2:
5. What does the graph tell us so far? What does the x-axis tell us? 6. Are there any correlations between the different colored curves? Give examples. 7. Cause and effect? Ideas?
Both:
8. Are there any similarities between Graph 1 and 2? Are there any curves that you think represent the same thing? ***Hand out the next page with the y-axis information on the graphs and the article on climate change. Graph 1:
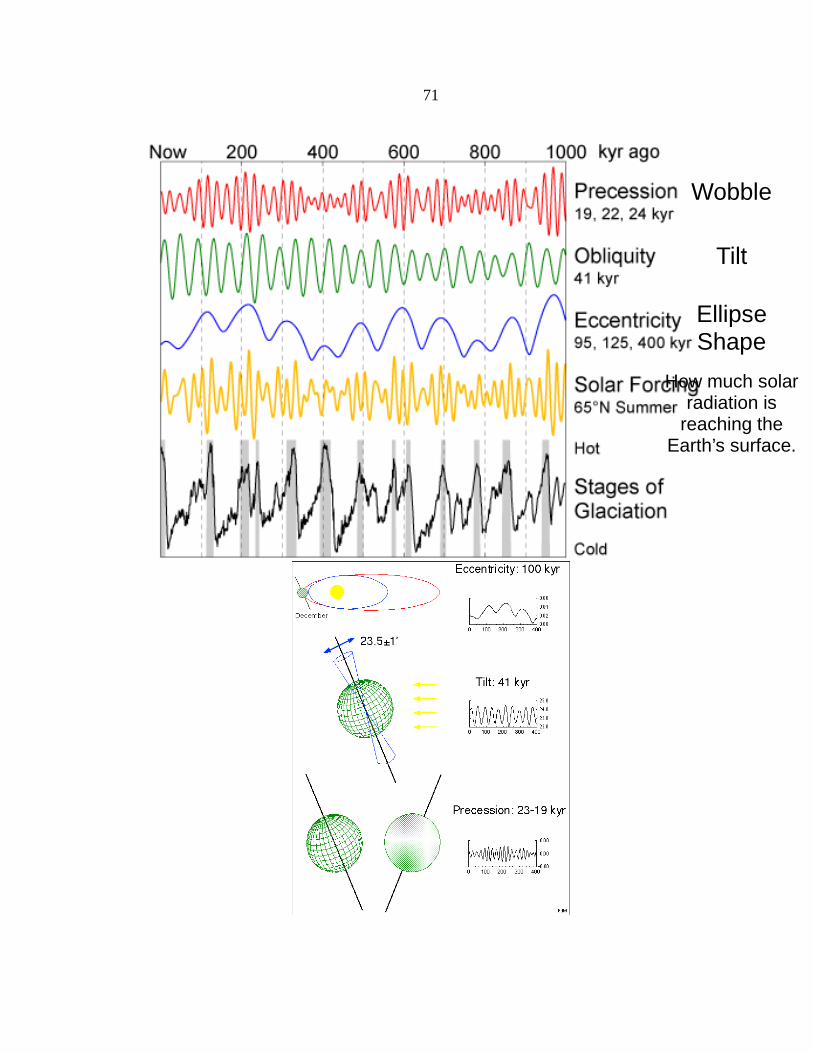
71
Wobble
Tilt
Ellipse Shape
How much solar
radiation is reaching the
Earth’s surface.
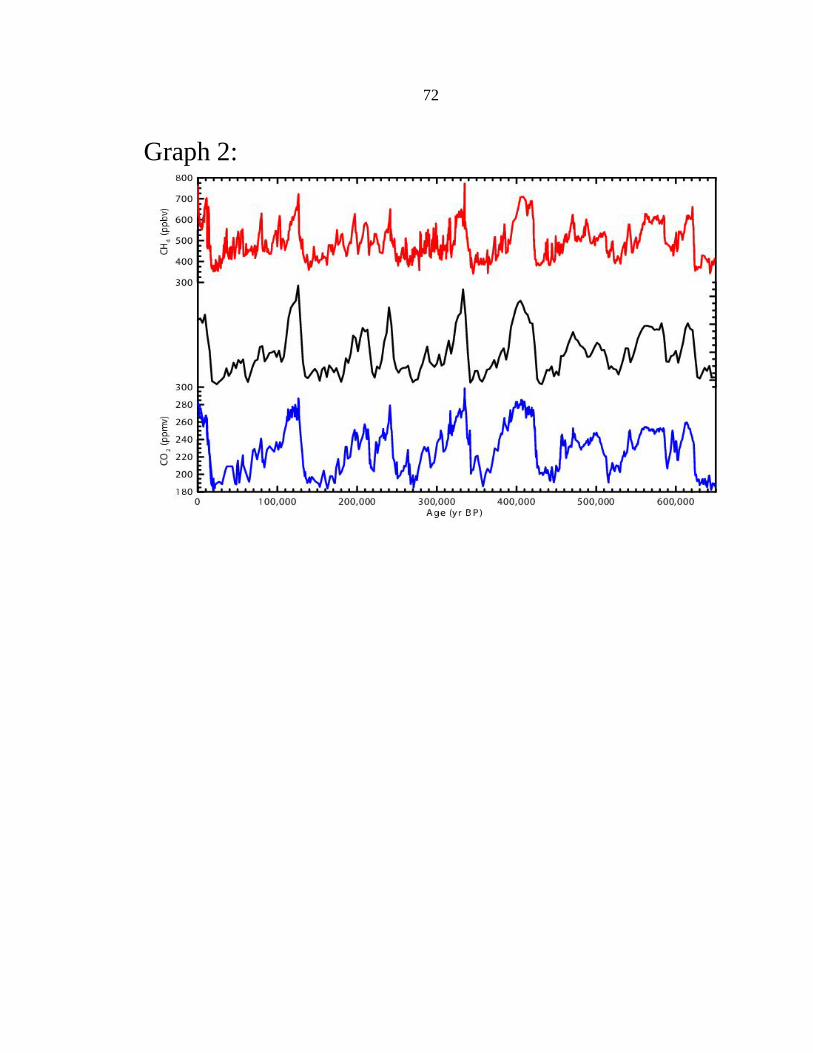
72
Graph 2:
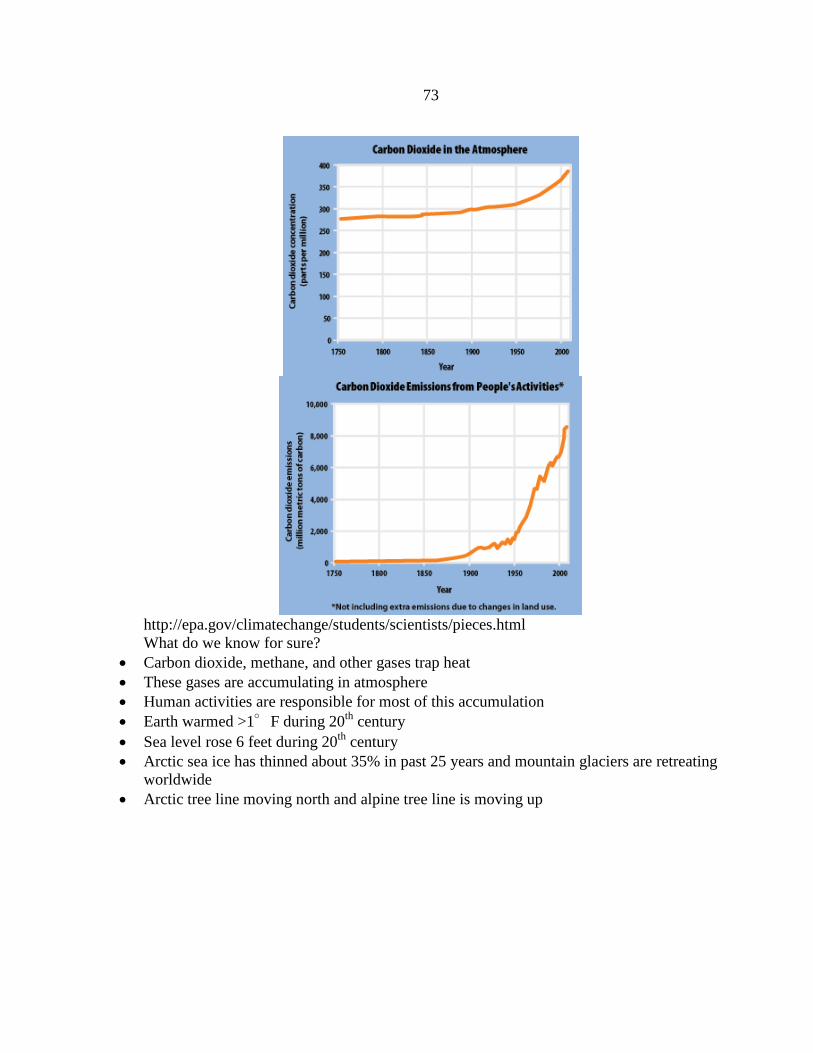
73
http://epa.gov/climatechange/students/scientists/pieces.html What do we know for sure?
• Carbon dioxide, methane, and other gases trap heat • These gases are accumulating in atmosphere • Human activities are responsible for most of this accumulation • Earth warmed >1°F during 20th century • Sea level rose 6 feet during 20th century • Arctic sea ice has thinned about 35% in past 25 years and mountain glaciers are retreating
worldwide • Arctic tree line moving north and alpine tree line is moving up
74
APPENDIX G
DATA ANALYSIS AND INTERPRETATION ASSESSMENT
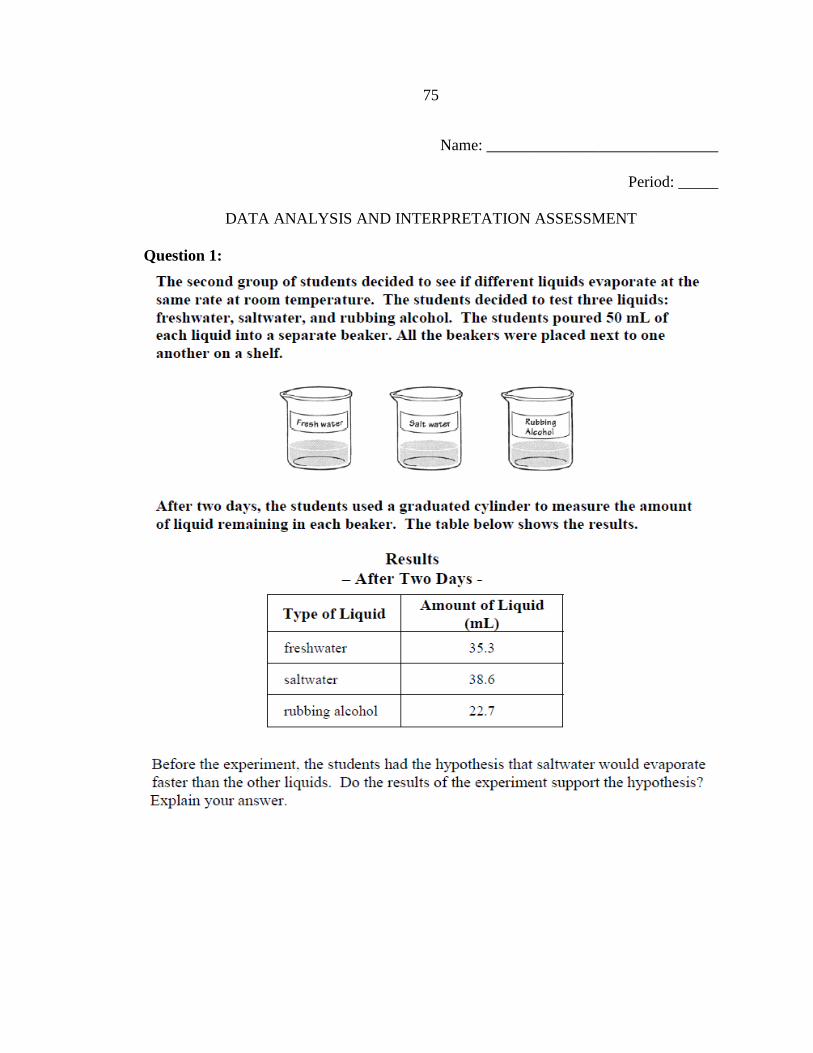
75
Name: _____________________________
Period: _____
DATA ANALYSIS AND INTERPRETATION ASSESSMENT
Question 1:
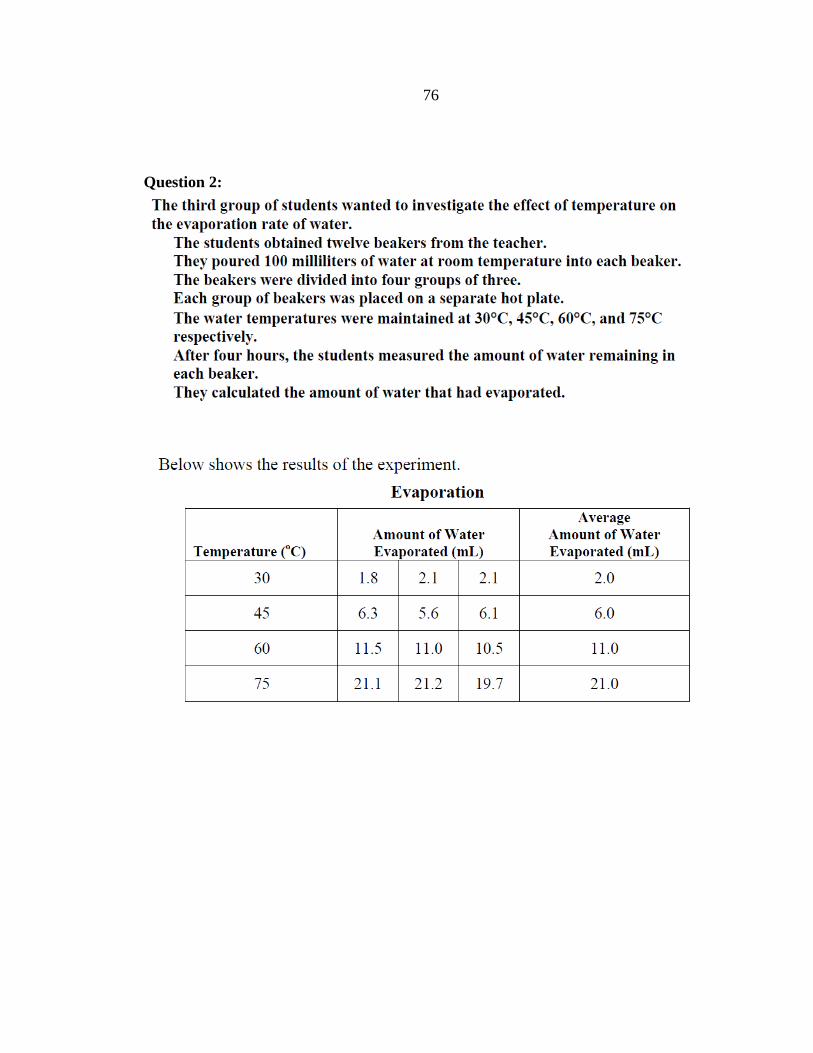
76
Question 2:
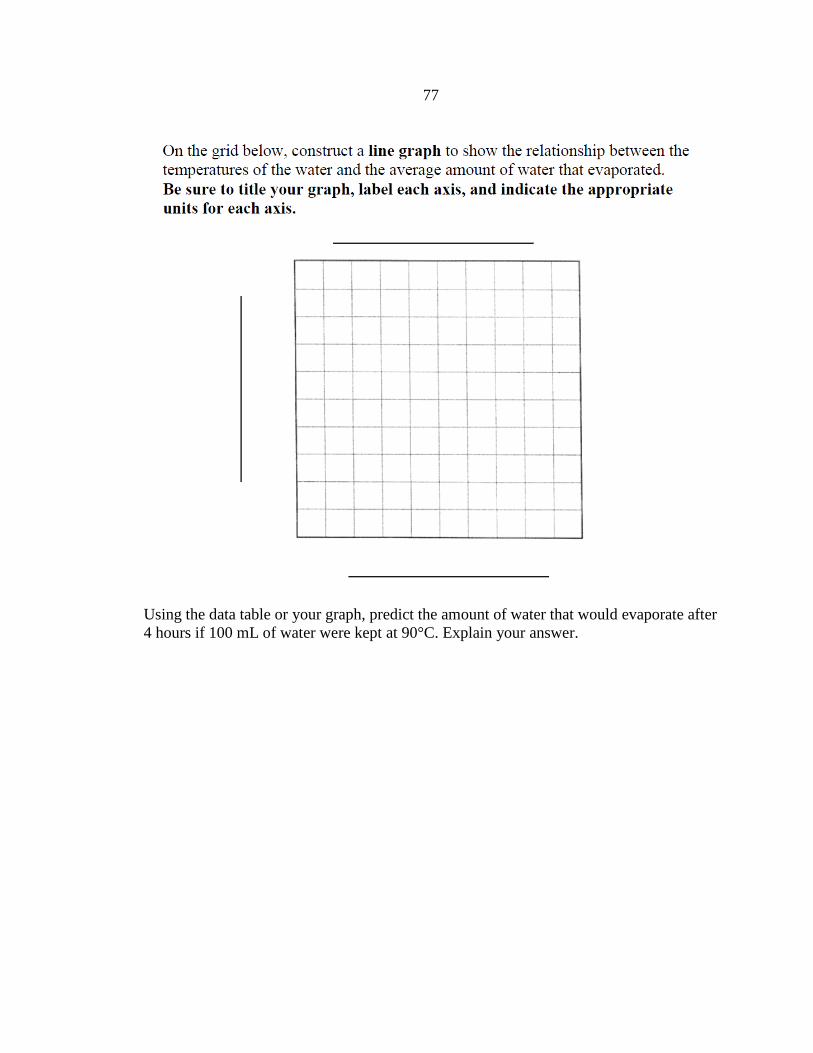
77
Using the data table or your graph, predict the amount of water that would evaporate after 4 hours if 100 mL of water were kept at 90°C. Explain your answer.
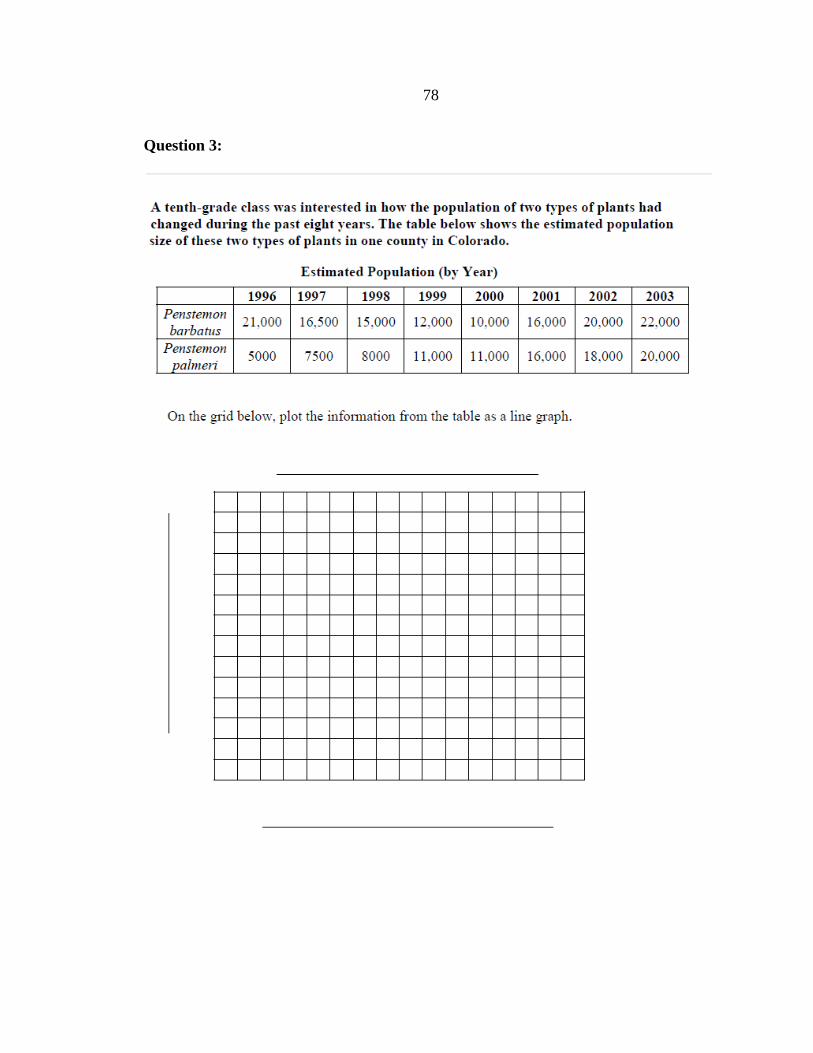
78
Question 3:
79
APPENDIX H
DATA ANALYSIS AND INTERPRETATION ASSESSMENT RUBRIC
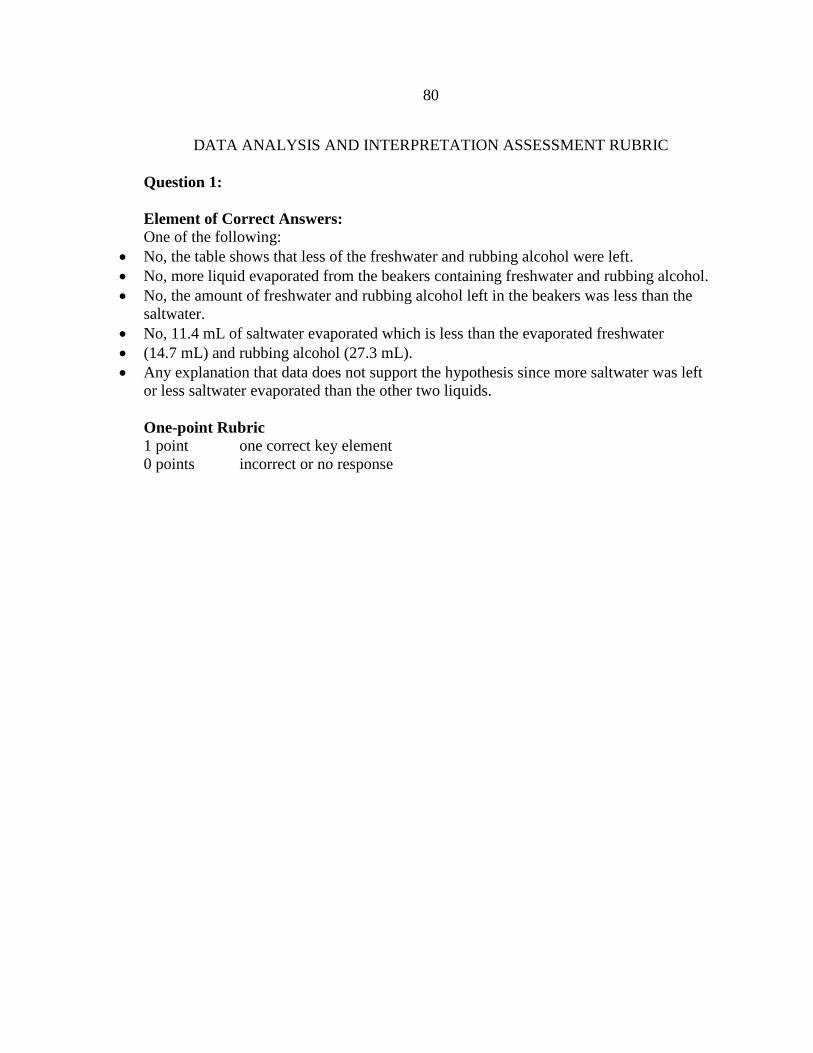
80
DATA ANALYSIS AND INTERPRETATION ASSESSMENT RUBRIC
Question 1: Element of Correct Answers: One of the following:
• No, the table shows that less of the freshwater and rubbing alcohol were left. • No, more liquid evaporated from the beakers containing freshwater and rubbing alcohol. • No, the amount of freshwater and rubbing alcohol left in the beakers was less than the
saltwater. • No, 11.4 mL of saltwater evaporated which is less than the evaporated freshwater • (14.7 mL) and rubbing alcohol (27.3 mL). • Any explanation that data does not support the hypothesis since more saltwater was left
or less saltwater evaporated than the other two liquids. One-point Rubric 1 point one correct key element 0 points incorrect or no response
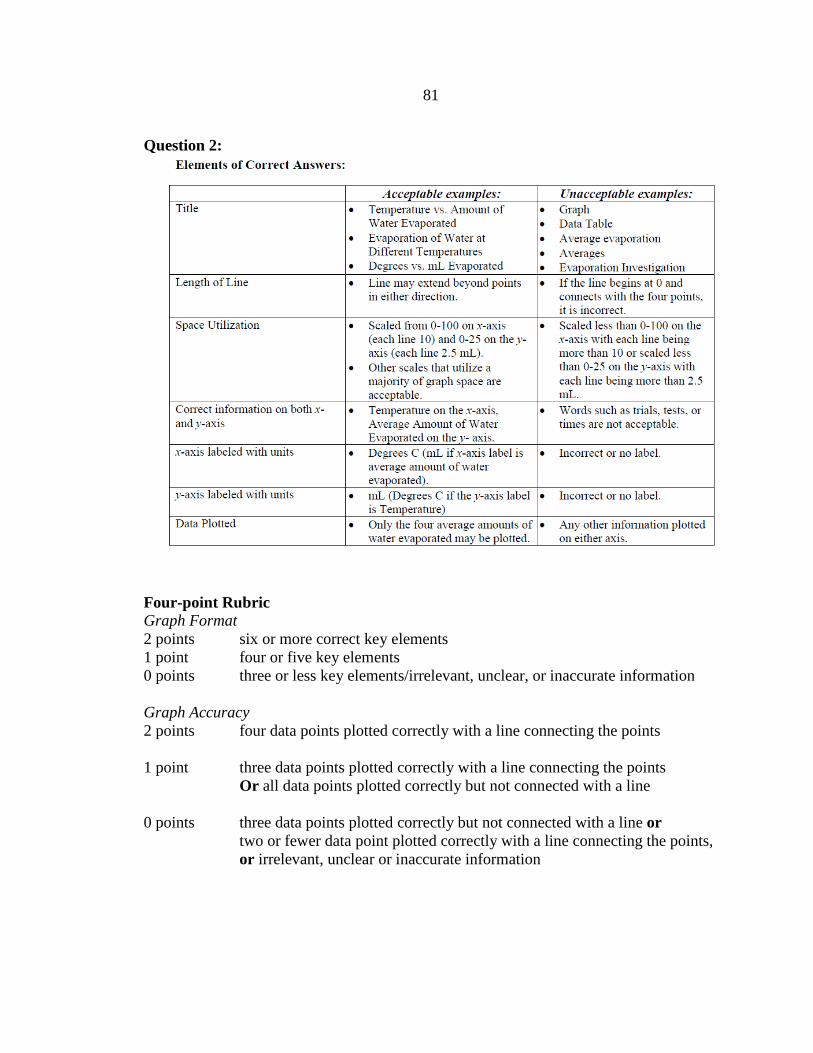
81
Question 2:
Four-point Rubric Graph Format 2 points six or more correct key elements 1 point four or five key elements 0 points three or less key elements/irrelevant, unclear, or inaccurate information Graph Accuracy 2 points four data points plotted correctly with a line connecting the points 1 point three data points plotted correctly with a line connecting the points
Or all data points plotted correctly but not connected with a line 0 points three data points plotted correctly but not connected with a line or
two or fewer data point plotted correctly with a line connecting the points, or irrelevant, unclear or inaccurate information
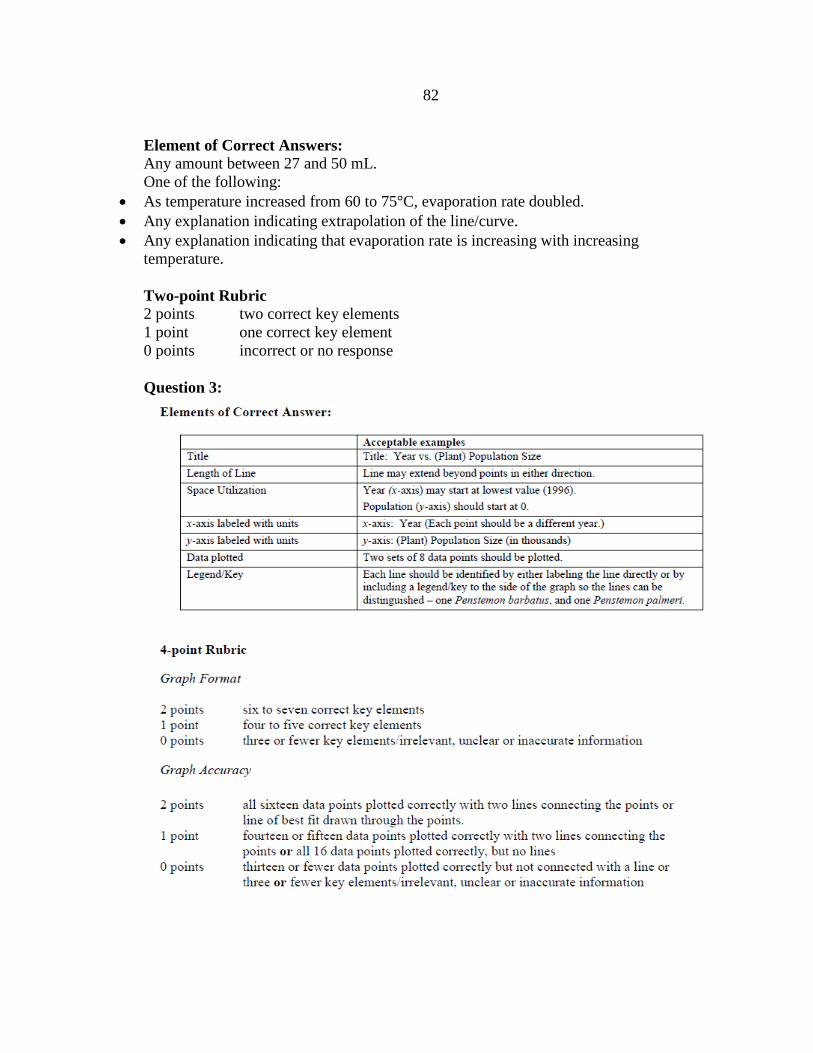
82
Element of Correct Answers: Any amount between 27 and 50 mL. One of the following:
• As temperature increased from 60 to 75°C, evaporation rate doubled. • Any explanation indicating extrapolation of the line/curve. • Any explanation indicating that evaporation rate is increasing with increasing
temperature. Two-point Rubric 2 points two correct key elements 1 point one correct key element 0 points incorrect or no response
Question 3:

83
APPENDIX I
COOLING WATER LAB RUBRIC

84
Scoring Rubric Maximum score - 23 points 1: Data Table 2 points total Allow 1 point for each of the following:
• table completed • data consistent with expectation of results
2: Graph 5 points total Allow 1 point for each of the following:
• appropriate title • axes labeled with correct variable (units included) • appropriate scale • points plotted accurately • curves are appropriate to data trend
3: Data transfer from table 2 points total Allow 1 point for each of the following:
• correct 6-minute dry tube reading based on data collected • correct 6-minute wet tube reading based on data collected
4: Graph Interpretation/Prediction 2 points total Allow 1 point for each of the following:
• corresponds to student’s dry tube graph at 9.5 minutes • corresponds to student’s wet tube graph at 9.5 minutes
5: Extrapolation Prediction 3 points total Allow 1 point for correct temperature prediction based on student’s graph/data. Allow 2 points if explanation refers to extrapolation from graph/data and is in complete sentences. Allow 1 point if explanation refers to extrapolation from graph/data and is not in complete sentences. Allow 0 points if explanation is not correct even if it is in complete sentences. 6: Data Interpretation/Comparison 4 points total Allow 1 point for each of the following:
• states pattern for dry tube readings • states pattern for wet tube readings • states relationship/comparison • correct statement or statements and all in complete sentences
7: Data Explanation 2 points total Allow 2 points if the explanation is correct and in complete sentences. Allow 1 point if the explanation is correct, but not in complete sentences. Allow 0 points if the explanation is incorrect even if it is in complete sentences. Correct statements may include:
• the wet tube is cooled by evaporation, or • heat energy is removed more quickly from water in wet tube, or
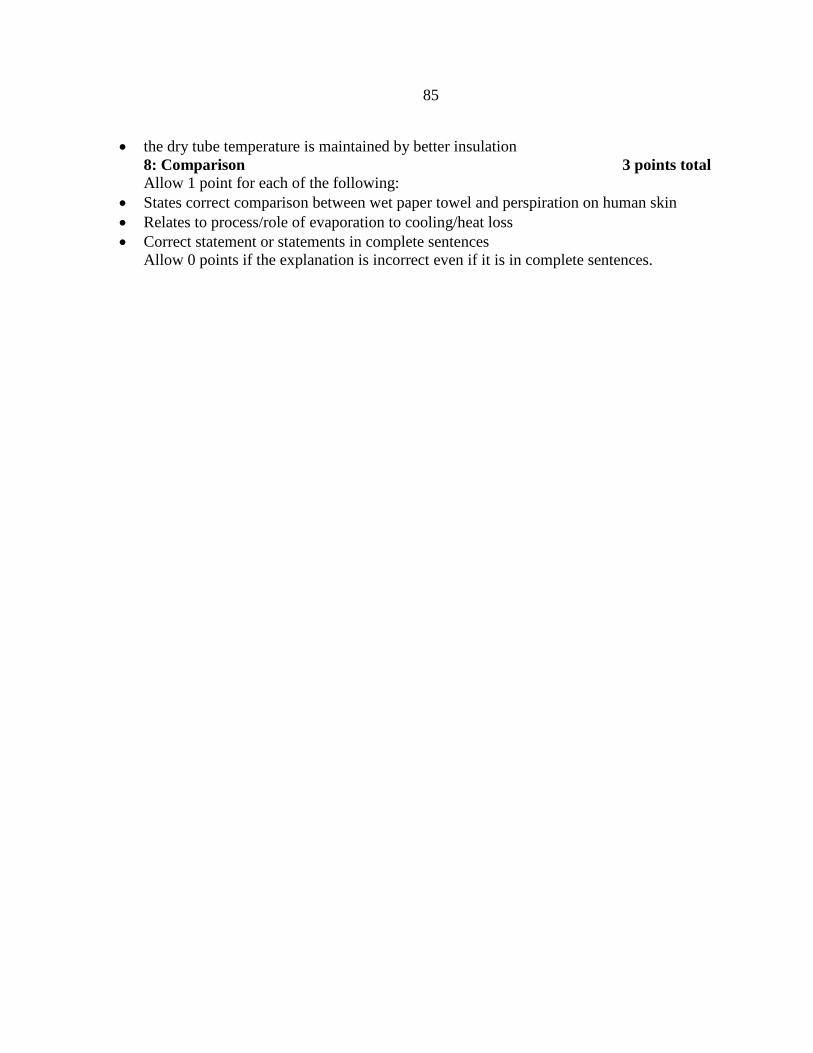
85
• the dry tube temperature is maintained by better insulation 8: Comparison 3 points total Allow 1 point for each of the following:
• States correct comparison between wet paper towel and perspiration on human skin • Relates to process/role of evaporation to cooling/heat loss • Correct statement or statements in complete sentences
Allow 0 points if the explanation is incorrect even if it is in complete sentences.

86
APPENDIX J
PARTICIPATION TALLY SHEET
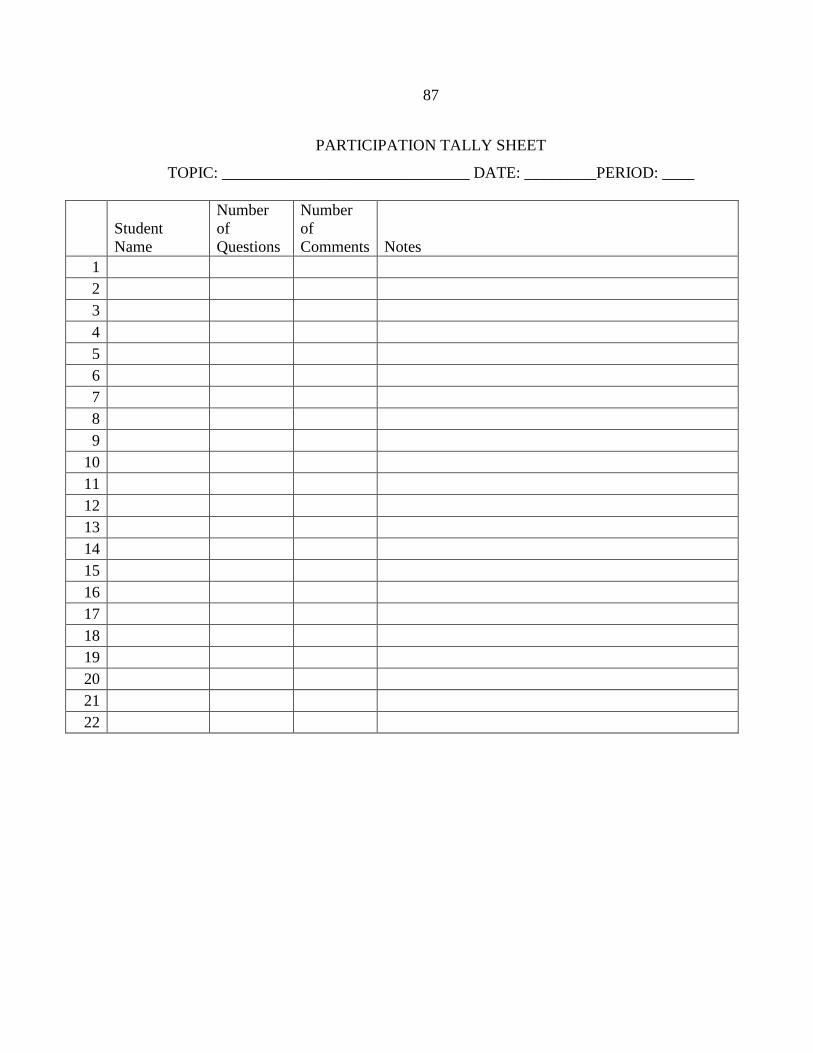
87
PARTICIPATION TALLY SHEET
TOPIC: _______________________________ DATE: _________PERIOD: ____
Student Name
Number of Questions
Number of Comments Notes
1 2 3 4 5 6 7 8 9
10 11 12 13 14 15 16 17 18 19 20 21 22

88
APPENDIX K
REACTION IN A BAG LAB
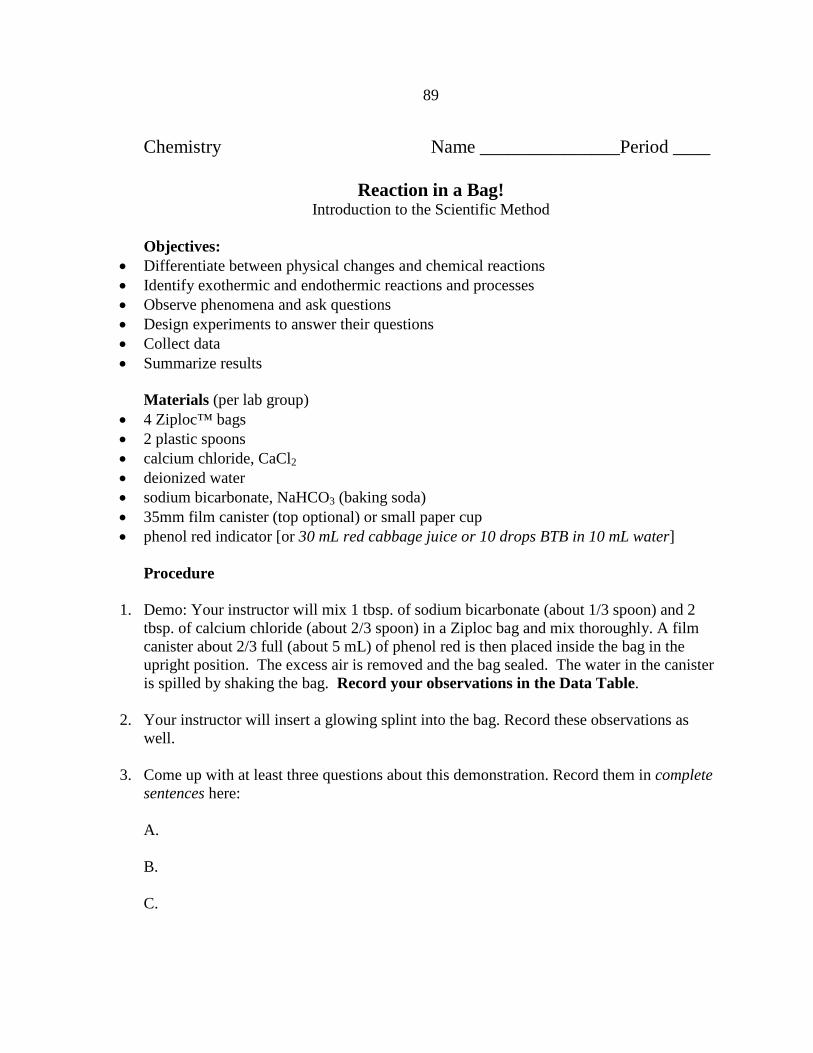
89
Chemistry Name _______________Period ____
Reaction in a Bag! Introduction to the Scientific Method
Objectives:
• Differentiate between physical changes and chemical reactions • Identify exothermic and endothermic reactions and processes • Observe phenomena and ask questions • Design experiments to answer their questions • Collect data • Summarize results
Materials (per lab group)
• 4 Ziploc™ bags • 2 plastic spoons • calcium chloride, CaCl2 • deionized water • sodium bicarbonate, NaHCO3 (baking soda) • 35mm film canister (top optional) or small paper cup • phenol red indicator [or 30 mL red cabbage juice or 10 drops BTB in 10 mL water]
Procedure
1. Demo: Your instructor will mix 1 tbsp. of sodium bicarbonate (about 1/3 spoon) and 2 tbsp. of calcium chloride (about 2/3 spoon) in a Ziploc bag and mix thoroughly. A film canister about 2/3 full (about 5 mL) of phenol red is then placed inside the bag in the upright position. The excess air is removed and the bag sealed. The water in the canister is spilled by shaking the bag. Record your observations in the Data Table.
2. Your instructor will insert a glowing splint into the bag. Record these observations as well.
3. Come up with at least three questions about this demonstration. Record them in complete sentences here: A. B. C.
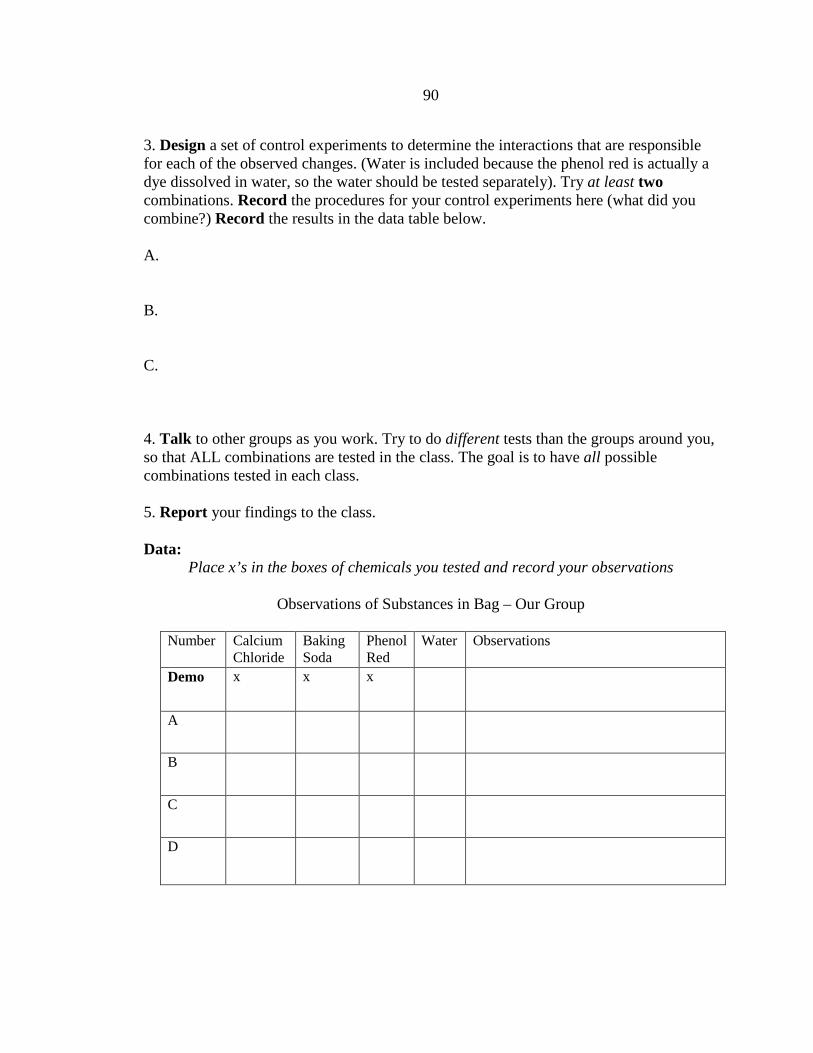
90
3. Design a set of control experiments to determine the interactions that are responsible for each of the observed changes. (Water is included because the phenol red is actually a dye dissolved in water, so the water should be tested separately). Try at least two combinations. Record the procedures for your control experiments here (what did you combine?) Record the results in the data table below. A. B. C. 4. Talk to other groups as you work. Try to do different tests than the groups around you, so that ALL combinations are tested in the class. The goal is to have all possible combinations tested in each class. 5. Report your findings to the class. Data:
Place x’s in the boxes of chemicals you tested and record your observations
Observations of Substances in Bag – Our Group
Number
Calcium Chloride
Baking Soda
Phenol Red
Water Observations
Demo x x x
A
B
C
D
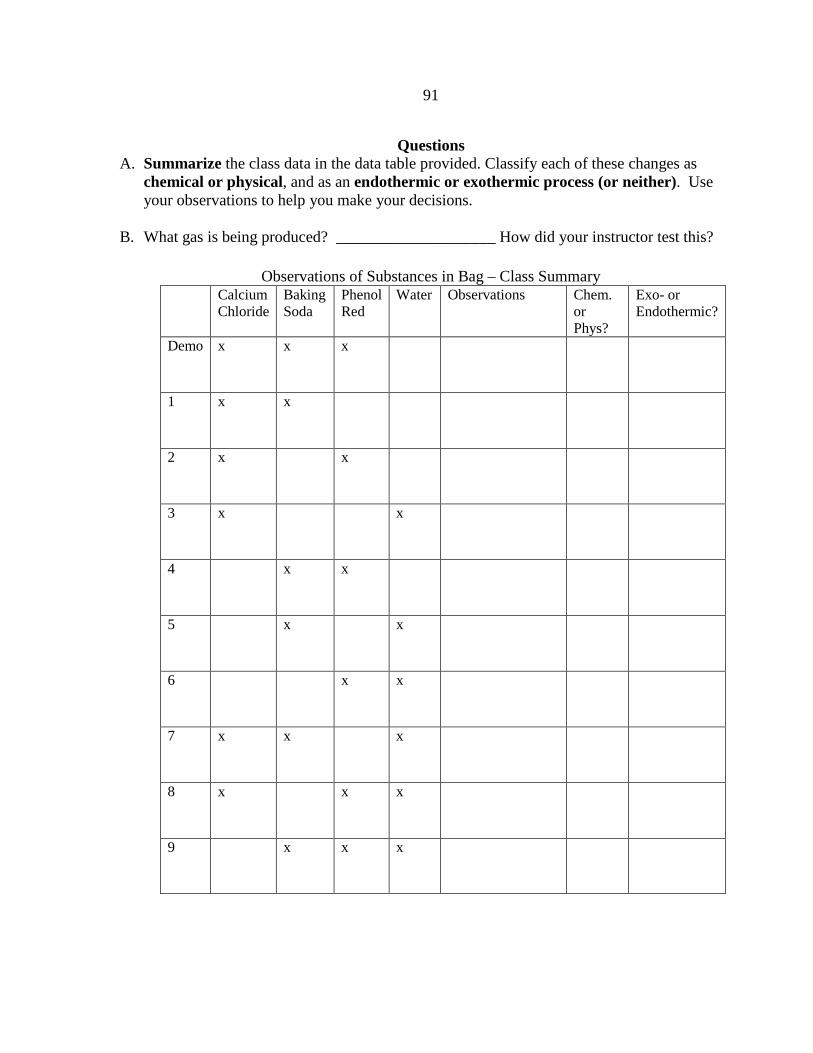
91
Questions A. Summarize the class data in the data table provided. Classify each of these changes as
chemical or physical, and as an endothermic or exothermic process (or neither). Use your observations to help you make your decisions.
B. What gas is being produced? ____________________ How did your instructor test this?
Observations of Substances in Bag – Class Summary Calcium
Chloride Baking Soda
Phenol Red
Water Observations Chem. or Phys?
Exo- or Endothermic?
Demo x x x
1 x x
2 x x
3 x x
4 x x
5 x x
6 x x
7 x x x
8 x x x
9 x x x
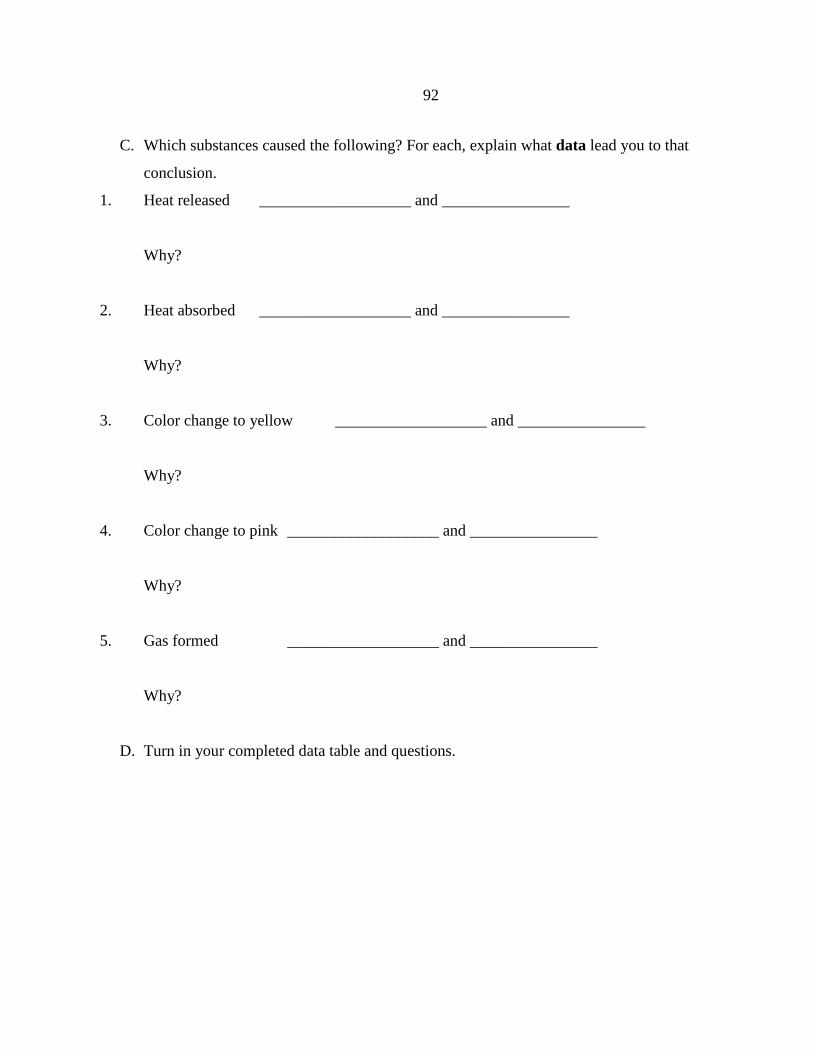
92
C. Which substances caused the following? For each, explain what data lead you to that
conclusion.
1. Heat released ___________________ and ________________
Why?
2. Heat absorbed ___________________ and ________________
Why?
3. Color change to yellow ___________________ and ________________
Why?
4. Color change to pink ___________________ and ________________
Why?
5. Gas formed ___________________ and ________________
Why?
D. Turn in your completed data table and questions.

93
APPENDIX L
SEMINAR REFLECTION QUESTIONS
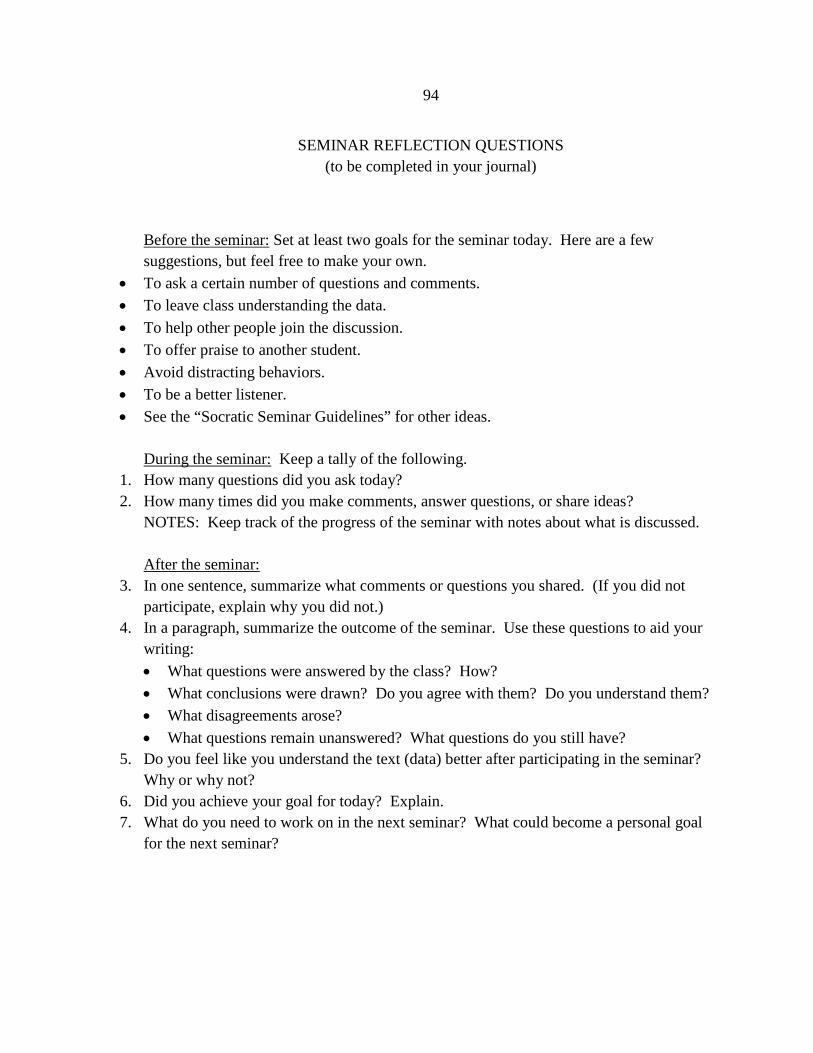
94
SEMINAR REFLECTION QUESTIONS (to be completed in your journal)
Before the seminar: Set at least two goals for the seminar today. Here are a few suggestions, but feel free to make your own.
• To ask a certain number of questions and comments. • To leave class understanding the data. • To help other people join the discussion. • To offer praise to another student. • Avoid distracting behaviors. • To be a better listener. • See the “Socratic Seminar Guidelines” for other ideas.
During the seminar: Keep a tally of the following.
1. How many questions did you ask today? 2. How many times did you make comments, answer questions, or share ideas?
NOTES: Keep track of the progress of the seminar with notes about what is discussed. After the seminar:
3. In one sentence, summarize what comments or questions you shared. (If you did not participate, explain why you did not.)
4. In a paragraph, summarize the outcome of the seminar. Use these questions to aid your writing: • What questions were answered by the class? How? • What conclusions were drawn? Do you agree with them? Do you understand them? • What disagreements arose? • What questions remain unanswered? What questions do you still have?
5. Do you feel like you understand the text (data) better after participating in the seminar? Why or why not?
6. Did you achieve your goal for today? Explain. 7. What do you need to work on in the next seminar? What could become a personal goal
for the next seminar?

95
APPENDIX M
HOMEWORK GRADING RUBRIC
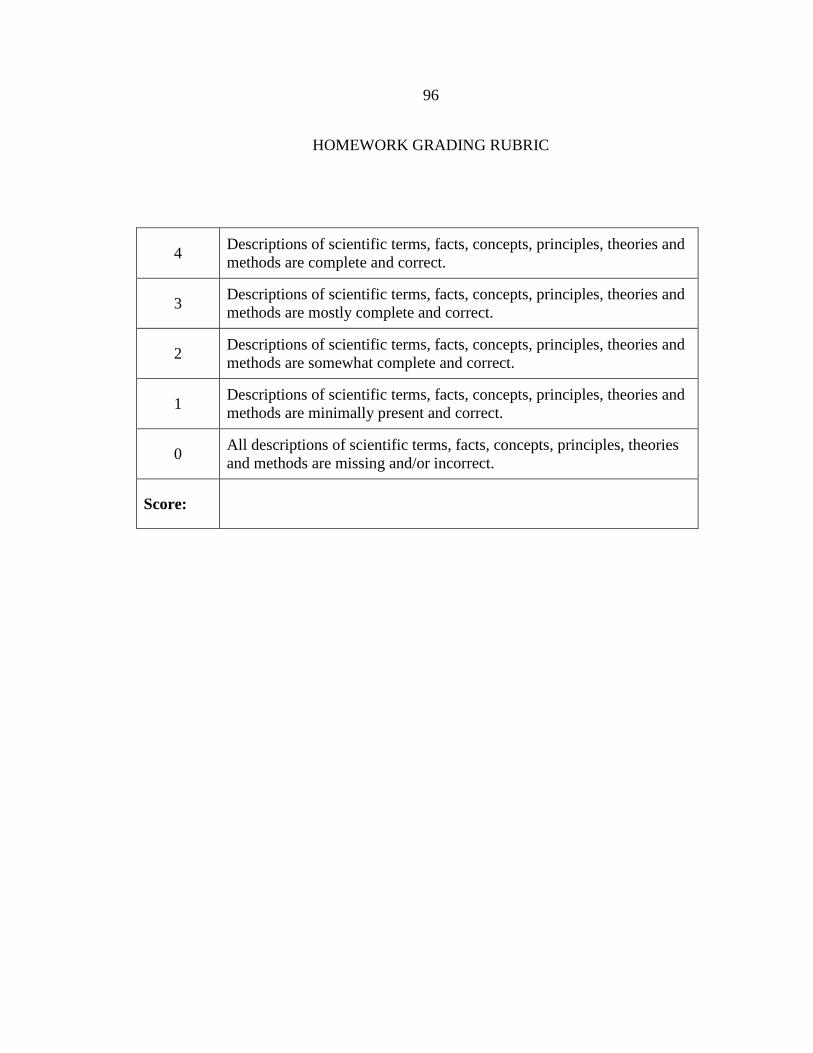
96
HOMEWORK GRADING RUBRIC
4 Descriptions of scientific terms, facts, concepts, principles, theories and methods are complete and correct.
3 Descriptions of scientific terms, facts, concepts, principles, theories and methods are mostly complete and correct.
2 Descriptions of scientific terms, facts, concepts, principles, theories and methods are somewhat complete and correct.
1 Descriptions of scientific terms, facts, concepts, principles, theories and methods are minimally present and correct.
0 All descriptions of scientific terms, facts, concepts, principles, theories and methods are missing and/or incorrect.
Score:
97
APPENDIX N
CONFIDENCE SURVEY: DATA ANALYSIS AND INTERPRETATION
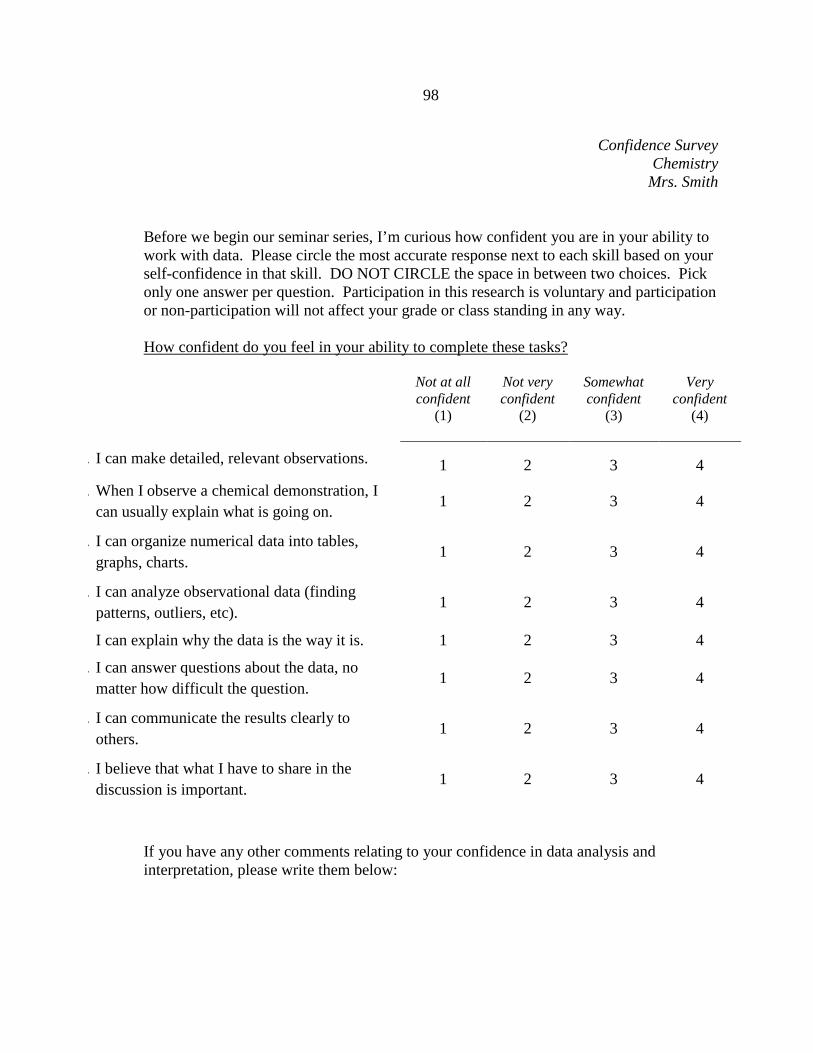
98
Confidence Survey Chemistry
Mrs. Smith Before we begin our seminar series, I’m curious how confident you are in your ability to work with data. Please circle the most accurate response next to each skill based on your self-confidence in that skill. DO NOT CIRCLE the space in between two choices. Pick only one answer per question. Participation in this research is voluntary and participation or non-participation will not affect your grade or class standing in any way. How confident do you feel in your ability to complete these tasks?
Not at all confident
(1)
Not very confident
(2)
Somewhat confident
(3)
Very confident
(4)
. I can make detailed, relevant observations. 1 2 3 4
. When I observe a chemical demonstration, I can usually explain what is going on.
1 2 3 4
. I can organize numerical data into tables, graphs, charts.
1 2 3 4
. I can analyze observational data (finding patterns, outliers, etc).
1 2 3 4
I can explain why the data is the way it is. 1 2 3 4
. I can answer questions about the data, no matter how difficult the question.
1 2 3 4
. I can communicate the results clearly to others.
1 2 3 4
. I believe that what I have to share in the discussion is important.
1 2 3 4
If you have any other comments relating to your confidence in data analysis and interpretation, please write them below:
99
APPENDIX O
CONFIDENCE INTERVIEW QUESTIONS
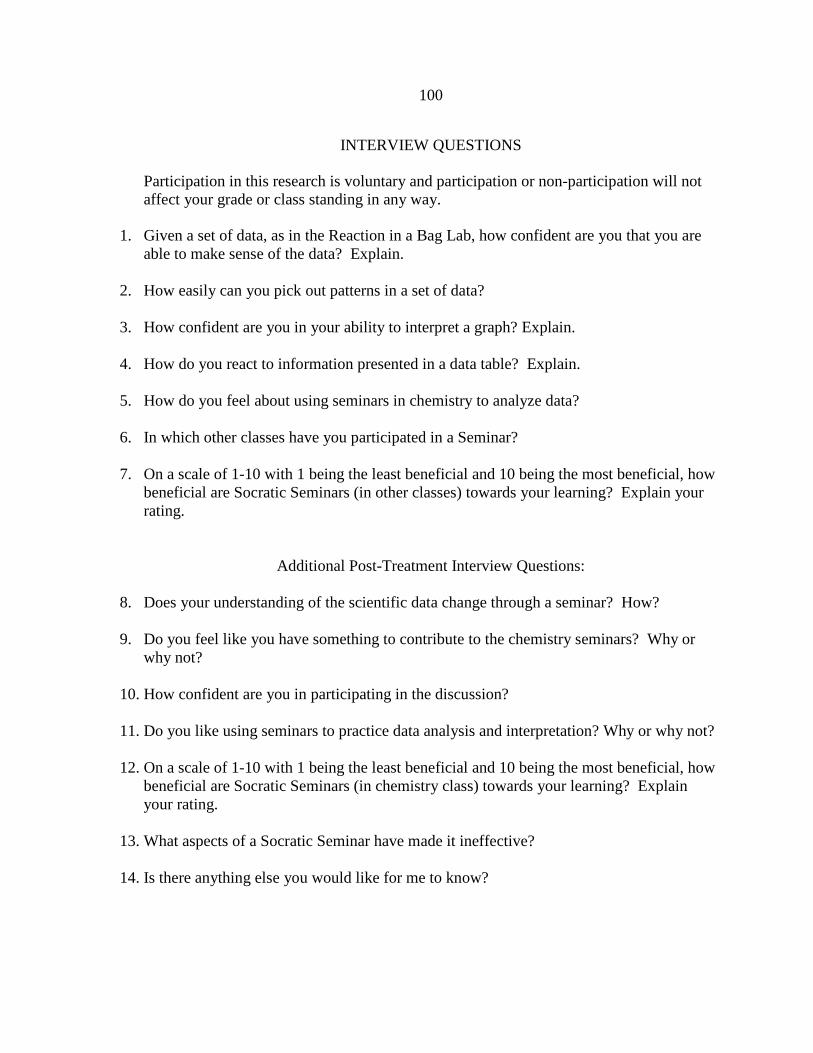
100
INTERVIEW QUESTIONS
Participation in this research is voluntary and participation or non-participation will not affect your grade or class standing in any way.
1. Given a set of data, as in the Reaction in a Bag Lab, how confident are you that you are
able to make sense of the data? Explain.
2. How easily can you pick out patterns in a set of data?
3. How confident are you in your ability to interpret a graph? Explain.
4. How do you react to information presented in a data table? Explain.
5. How do you feel about using seminars in chemistry to analyze data?
6. In which other classes have you participated in a Seminar?
7. On a scale of 1-10 with 1 being the least beneficial and 10 being the most beneficial, how beneficial are Socratic Seminars (in other classes) towards your learning? Explain your rating.
Additional Post-Treatment Interview Questions:
8. Does your understanding of the scientific data change through a seminar? How?
9. Do you feel like you have something to contribute to the chemistry seminars? Why or why not?
10. How confident are you in participating in the discussion?
11. Do you like using seminars to practice data analysis and interpretation? Why or why not?
12. On a scale of 1-10 with 1 being the least beneficial and 10 being the most beneficial, how beneficial are Socratic Seminars (in chemistry class) towards your learning? Explain your rating.
13. What aspects of a Socratic Seminar have made it ineffective?
14. Is there anything else you would like for me to know?