Embed Size (px)
Citation preview
W E L L I N G T O N M A N A G E M E N T
viewpoints
OctOber
2013
A Blueprint for Better Target-Date Portfolios
T A r g e T - D A T e P o r T f o l i o s h A v e r e s h A P e D the defined
contribution (DC) landscape over the past decade. Before these investment options
were widely adopted, the industry’s move toward nearly unconstrained DC menus
often left participants paralyzed by choice or saddled with haphazardly designed
portfolios. Instead, thanks to target-date portfolios, participants can make a single
investment decision and end up with a better diversified, generally age-appropriate
asset allocation.
In our view, however, there is still room for meaningful improvement. For example, many target-date portfolios are dominated by US securities. While this approach has worked well for participants over the past five years given the outperformance of US markets, we think it neglects opportunities to better support participants’ long-term asset accumulation and distribution needs. Specifically, the next genera-tion of target-date portfolios should incorporate:
� Exposure to global equities and global bonds
� A larger, more diversified allocation to inflation-sensitive assets
� Strategies designed to pursue positive total returns in any market environment
� Active management in less efficient asset classes
By
rick Wurster, CfA, CMTAsset Allocation Portfolio Manager
Nick Petrucelli, CfA Asset Allocation Analyst
About the AuthorsRick is portfolio manager for the firm’s life cycle prod-ucts and complementary approaches, including uncon-strained equity and CPI plus 5% strategies.Nick researches long-term asset allocation themes in order to assist clients with strategy and policy issues.
Wellington Management 2 Viewpoints
A Blueprint for Better Target-Date Portfolios
the Case for Global Diversification
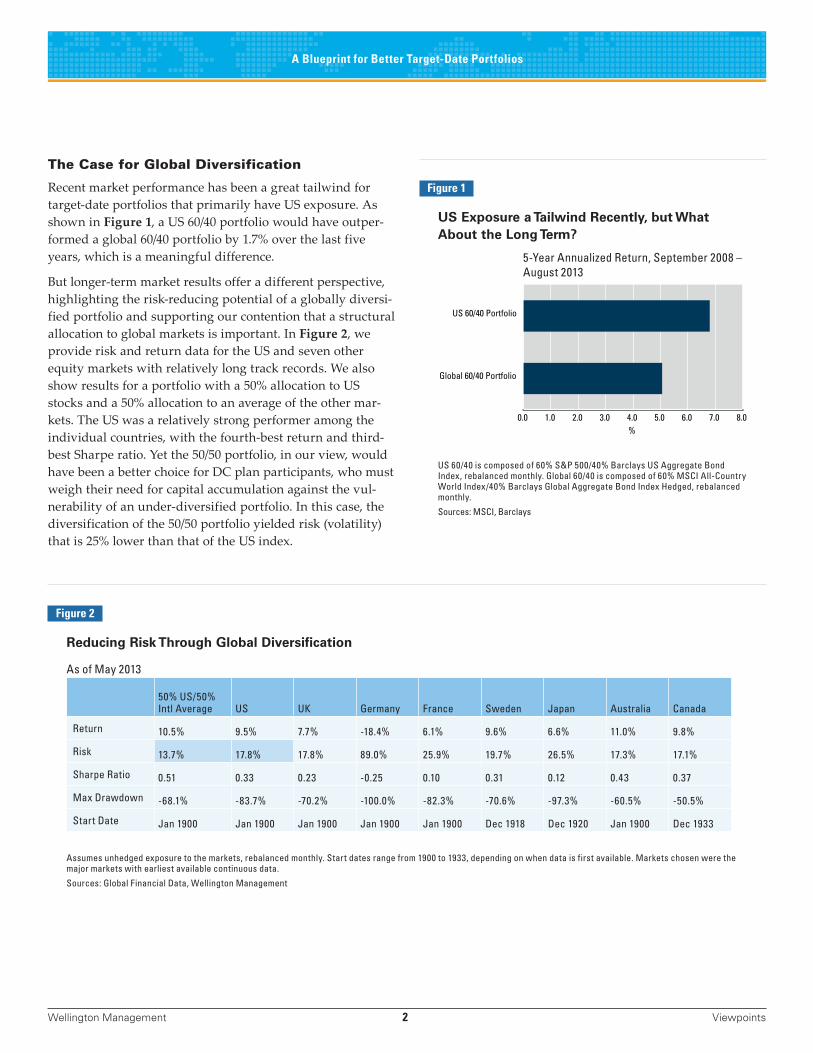
Recent market performance has been a great tailwind for target-date portfolios that primarily have US exposure. As shown in Figure 1, a US 60/40 portfolio would have outper-formed a global 60/40 portfolio by 1.7% over the last five years, which is a meaningful difference.
But longer-term market results offer a different perspective, highlighting the risk-reducing potential of a globally diversi-fied portfolio and supporting our contention that a structural allocation to global markets is important. In Figure 2, we provide risk and return data for the US and seven other equity markets with relatively long track records. We also show results for a portfolio with a 50% allocation to US stocks and a 50% allocation to an average of the other mar-kets. The US was a relatively strong performer among the individual countries, with the fourth-best return and third-best Sharpe ratio. Yet the 50/50 portfolio, in our view, would have been a better choice for DC plan participants, who must weigh their need for capital accumulation against the vul-nerability of an under-diversified portfolio. In this case, the diversification of the 50/50 portfolio yielded risk (volatility) that is 25% lower than that of the US index.
figure 1
US exposure a tailwind recently, but What About the Long term?
5-Year Annualized Return, September 2008 – August 2013
Global 60/40 Portfolio
US 60/40 Portfolio
0.0 1.0 2.0 3.0 4.0 5.0 6.0 7.0 8.0
%
US 60/40 is composed of 60% S&P 500/40% Barclays US Aggregate Bond Index, rebalanced monthly. Global 60/40 is composed of 60% MSCI All-Country World Index/40% Barclays Global Aggregate Bond Index Hedged, rebalanced monthly.
Sources: MSCI, Barclays
figure 2
reducing risk through Global Diversification
As of May 2013
50% US/50% Intl Average US UK Germany France Sweden Japan Australia Canada
Return 10.5% 9.5% 7.7% -18.4% 6.1% 9.6% 6.6% 11.0% 9.8%
Risk 13.7% 17.8% 17.8% 89.0% 25.9% 19.7% 26.5% 17.3% 17.1%
Sharpe Ratio 0.51 0.33 0.23 -0.25 0.10 0.31 0.12 0.43 0.37
Max Drawdown -68.1% -83.7% -70.2% -100.0% -82.3% -70.6% -97.3% -60.5% -50.5%
Start Date Jan 1900 Jan 1900 Jan 1900 Jan 1900 Jan 1900 Dec 1918 Dec 1920 Jan 1900 Dec 1933
Assumes unhedged exposure to the markets, rebalanced monthly. Start dates range from 1900 to 1933, depending on when data is first available. Markets chosen were the major markets with earliest available continuous data.
Sources: Global Financial Data, Wellington Management
Wellington Management 3 Viewpoints
A Blueprint for Better Target-Date Portfolios
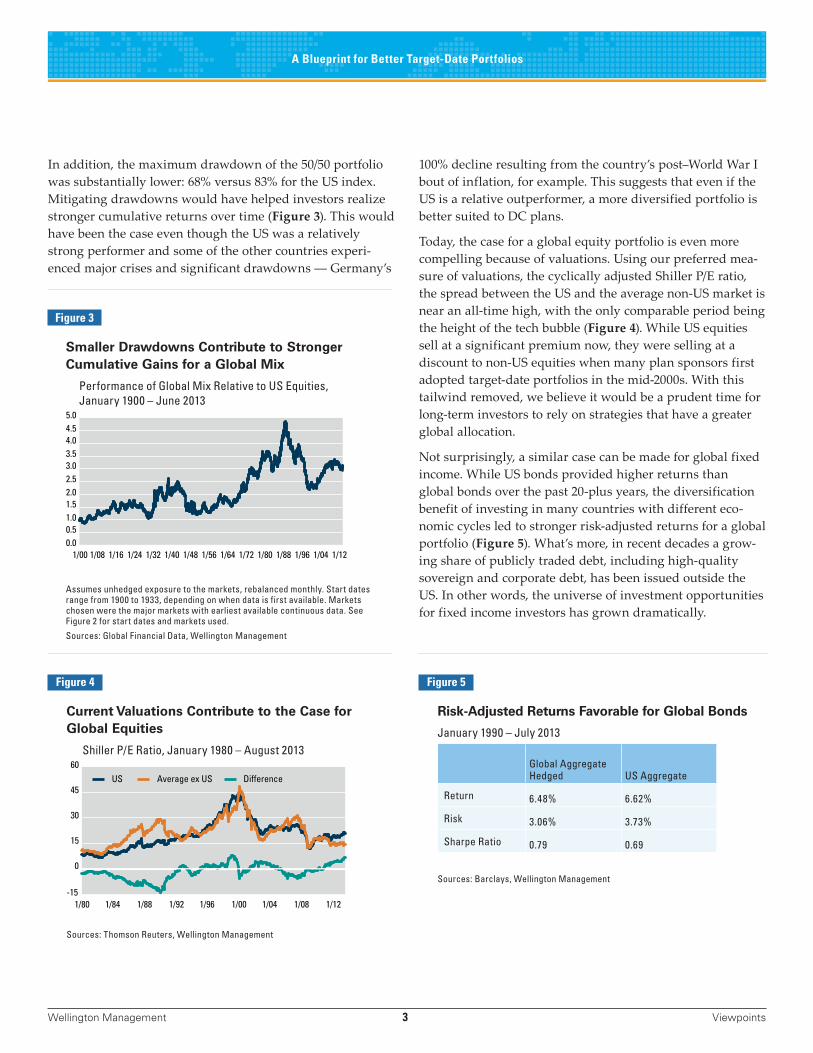
In addition, the maximum drawdown of the 50/50 portfolio was substantially lower: 68% versus 83% for the US index. Mitigating drawdowns would have helped investors realize stronger cumulative returns over time (Figure 3). This would have been the case even though the US was a relatively strong performer and some of the other countries experi-enced major crises and significant drawdowns ― Germany’s
100% decline resulting from the country’s post–World War I bout of inflation, for example. This suggests that even if the US is a relative outperformer, a more diversified portfolio is better suited to DC plans.
Today, the case for a global equity portfolio is even more compelling because of valuations. Using our preferred mea-sure of valuations, the cyclically adjusted Shiller P/E ratio, the spread between the US and the average non-US market is near an all-time high, with the only comparable period being the height of the tech bubble (Figure 4). While US equities sell at a significant premium now, they were selling at a discount to non-US equities when many plan sponsors first adopted target-date portfolios in the mid-2000s. With this tailwind removed, we believe it would be a prudent time for long-term investors to rely on strategies that have a greater global allocation.
Not surprisingly, a similar case can be made for global fixed income. While US bonds provided higher returns than global bonds over the past 20-plus years, the diversification benefit of investing in many countries with different eco-nomic cycles led to stronger risk-adjusted returns for a global portfolio (Figure 5). What’s more, in recent decades a grow-ing share of publicly traded debt, including high-quality sovereign and corporate debt, has been issued outside the US. In other words, the universe of investment opportunities for fixed income investors has grown dramatically.
figure 3
Smaller Drawdowns contribute to Stronger cumulative Gains for a Global Mix
Performance of Global Mix Relative to US Equities, January 1900 – June 2013
1/00 1/08 1/16 1/24 1/32 1/40 1/48 1/56 1/64 1/72 1/80 1/88 1/96 1/04 1/120.00.51.01.52.02.53.03.54.04.55.0
Assumes unhedged exposure to the markets, rebalanced monthly. Start dates range from 1900 to 1933, depending on when data is first available. Markets chosen were the major markets with earliest available continuous data. See Figure 2 for start dates and markets used.
Sources: Global Financial Data, Wellington Management
figure 4
current Valuations contribute to the case for Global equities
Shiller P/E Ratio, January 1980 – August 2013
1/80 1/84 1/88 1/92 1/96 1/00 1/04 1/08 1/12-15
0
15
30
45
60US Average ex US Difference
Sources: Thomson Reuters, Wellington Management
figure 5
risk-Adjusted returns Favorable for Global bonds
January 1990 – July 2013
Global Aggregate Hedged US Aggregate
Return 6.48% 6.62%
Risk 3.06% 3.73%
Sharpe Ratio 0.79 0.69
Sources: Barclays, Wellington Management
Wellington Management 4 Viewpoints
A Blueprint for Better Target-Date Portfolios
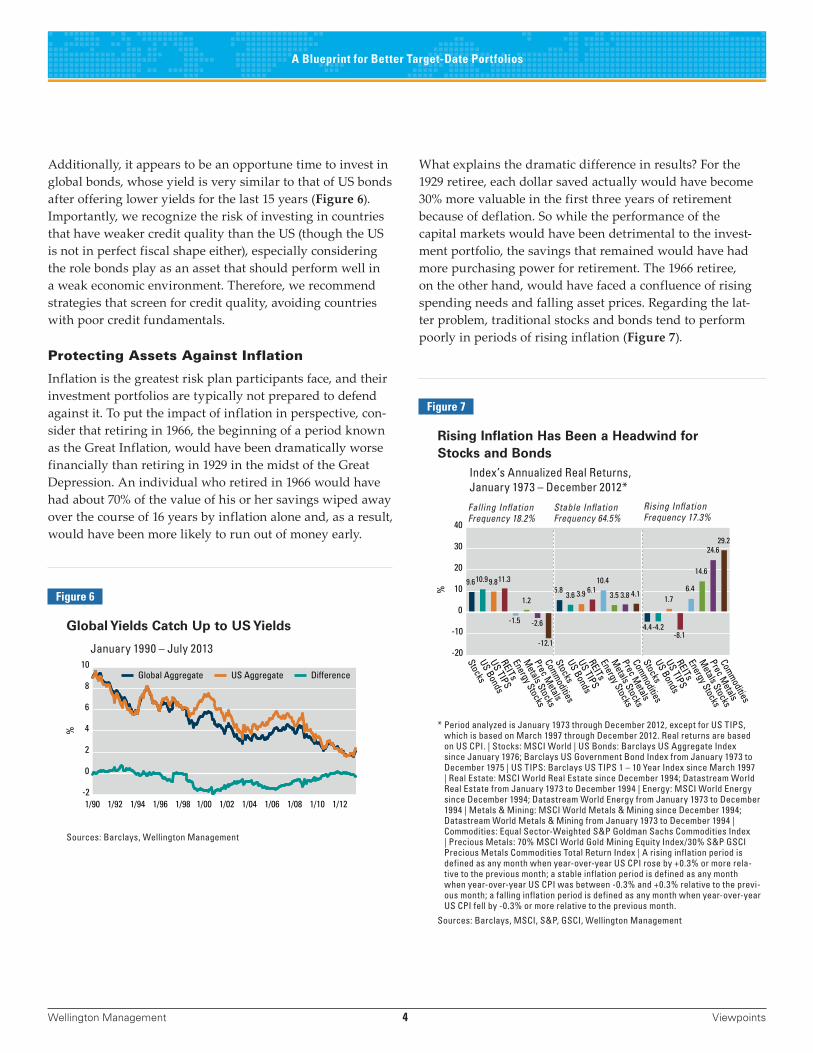
Additionally, it appears to be an opportune time to invest in global bonds, whose yield is very similar to that of US bonds after offering lower yields for the last 15 years (Figure 6). Importantly, we recognize the risk of investing in countries that have weaker credit quality than the US (though the US is not in perfect fiscal shape either), especially considering the role bonds play as an asset that should perform well in a weak economic environment. Therefore, we recommend strategies that screen for credit quality, avoiding countries with poor credit fundamentals.
protecting Assets Against inflation
Inflation is the greatest risk plan participants face, and their investment portfolios are typically not prepared to defend against it. To put the impact of inflation in perspective, con-sider that retiring in 1966, the beginning of a period known as the Great Inflation, would have been dramatically worse financially than retiring in 1929 in the midst of the Great Depression. An individual who retired in 1966 would have had about 70% of the value of his or her savings wiped away over the course of 16 years by inflation alone and, as a result, would have been more likely to run out of money early.
figure 6
Global Yields catch Up to US Yields
January 1990 – July 2013
1/90 1/92 1/94 1/96 1/98 1/00 1/02 1/04 1/06 1/08 1/10 1/12-2
0
2
4
6
8
10
%
Global Aggregate US Aggregate Difference
Sources: Barclays, Wellington Management
What explains the dramatic difference in results? For the 1929 retiree, each dollar saved actually would have become 30% more valuable in the first three years of retirement because of deflation. So while the performance of the capital markets would have been detrimental to the invest-ment portfolio, the savings that remained would have had more purchasing power for retirement. The 1966 retiree, on the other hand, would have faced a confluence of rising spending needs and falling asset prices. Regarding the lat-ter problem, traditional stocks and bonds tend to perform poorly in periods of rising inflation (Figure 7).
figure 7
rising Inflation Has been a Headwind for Stocks and bonds
Index’s Annualized Real Returns, January 1973 – December 2012*
StocksUS BondsUS TIPSREITsEnergy StocksM
etals StocksPrec M
etalsCommoditiesStocksUS BondsUS TIPSREITsEnergy StocksM
etals StocksPrec M
etalsCommoditiesStocksUS BondsUS TIPSREITsEnergy StocksM
etals StocksPrec M
etalsCommodities
-20
-10
0
10
20
30
40
%
9.610.9 9.811.3
-1.5
1.2
-2.6
-12.1
5.83.6 3.9 6.1
10.4
3.5 3.8 4.1
-4.4-4.2
1.7
-8.1
6.4
14.6
24.629.2
Falling Inflation Frequency 18.2%
Stable Inflation Frequency 64.5%
Rising Inflation Frequency 17.3%
* Period analyzed is January 1973 through December 2012, except for US TIPS, which is based on March 1997 through December 2012. Real returns are based on US CPI. | Stocks: MSCI World | US Bonds: Barclays US Aggregate Index since January 1976; Barclays US Government Bond Index from January 1973 to December 1975 | US TIPS: Barclays US TIPS 1 – 10 Year Index since March 1997 | Real Estate: MSCI World Real Estate since December 1994; Datastream World Real Estate from January 1973 to December 1994 | Energy: MSCI World Energy since December 1994; Datastream World Energy from January 1973 to December 1994 | Metals & Mining: MSCI World Metals & Mining since December 1994; Datastream World Metals & Mining from January 1973 to December 1994 | Commodities: Equal Sector-Weighted S&P Goldman Sachs Commodities Index | Precious Metals: 70% MSCI World Gold Mining Equity Index/30% S&P GSCI Precious Metals Commodities Total Return Index | A rising inflation period is defined as any month when year-over-year US CPI rose by +0.3% or more rela-tive to the previous month; a stable inflation period is defined as any month when year-over-year US CPI was between -0.3% and +0.3% relative to the previ-ous month; a falling inflation period is defined as any month when year-over-year US CPI fell by -0.3% or more relative to the previous month.
Sources: Barclays, MSCI, S&P, GSCI, Wellington Management
Wellington Management 5 Viewpoints
A Blueprint for Better Target-Date Portfolios
stabilizing performance Across Market environments
To help create a smoother investment ride for participants over time, we think target-date portfolios should include strategies designed to pursue consistent risk-adjusted returns across a variety of market environments and maintain a low correlation to risk assets.
Let’s look at one example related to target-date portfo-lios’ bond allocations. Target-date portfolios designed for participants near or in retirement generally include bond allocations of 50% ‒ 70%. Historically, bonds have delivered returns 2% – 3% above inflation (consumer price index, or CPI), contributing to a traditionally balanced portfolio’s ability to deliver a compelling long-run real return — one sufficient to support a 5% withdrawal rate during retirement. In addition, high-quality fixed income assets, including nominal government bonds and inflation-linked bonds, have played an important diversification role in portfolios by performing well during periods of weak economic growth, when equities are more likely to struggle.
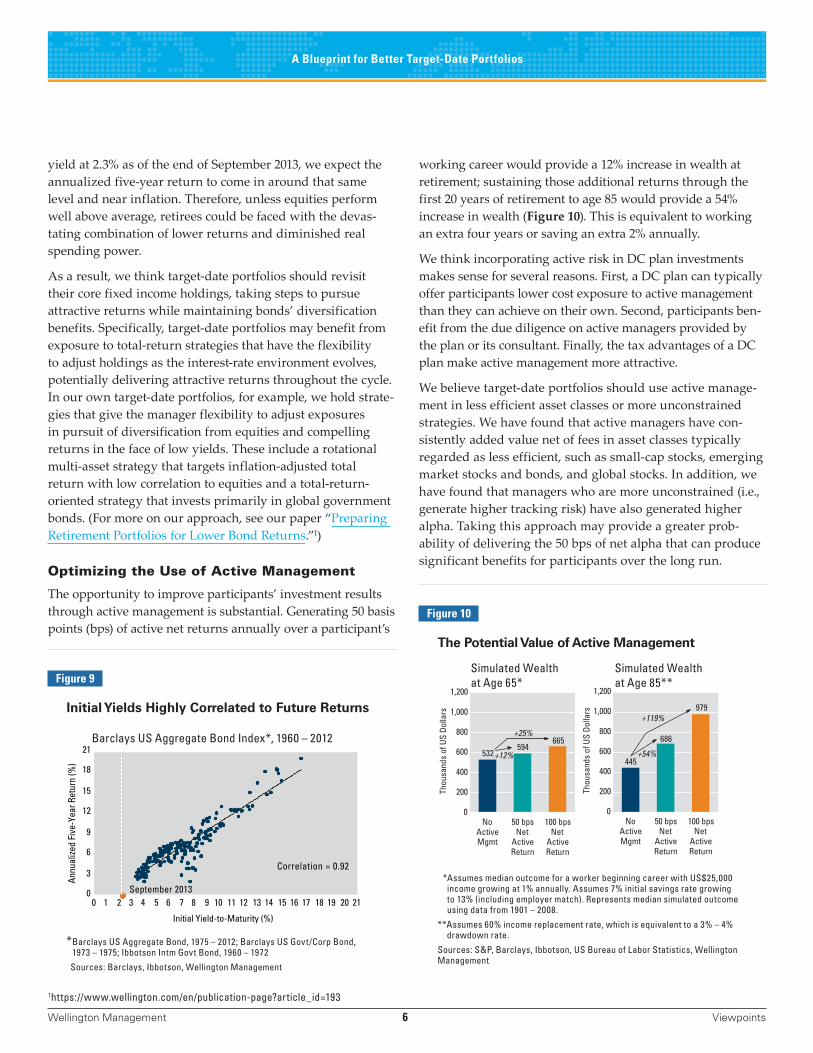
However, while bonds should continue to provide meaning-ful diversification benefits over the long run, we think it is unlikely they will outperform CPI over the next three to five years. The initial yield on the Barclays US Aggregate Bond Index has historically been a good predictor of annualized returns over the following five years (Figure 9). With the
Presently, most target-date portfolios for near-retirees have an allocation of approximately 10% to assets that may per-form better in an inflationary environment, the majority of which are Treasury Inflation-Protected Securities (TIPS). In our view, the inflation-sensitive allocation should be closer to 25%, and should include not just TIPS but commodities and inflation-sensitive equities (e.g., energy and metals stocks) as well.
Each inflation-sensitive asset has trade-offs. TIPS have low volatility and help diversify a traditional portfolio, but have a low expected return and a low beta to inflation. Commodities have a high beta to inflation and a low correla-tion to a traditional portfolio over long periods, and provide an attractive opportunity for active returns. But commodi-ties come with significant volatility and an unclear long-run return. Inflation-sensitive equities offer an attractive long-run return, but higher volatility and higher correlation with a traditional portfolio.
Furthermore, each of these assets performs differently in different types of inflationary environments. TIPS, for example, tend to be effective against the type of inflation that can be particularly damaging to retirees — stagflation. Commodities, on the other hand, may do better than TIPS in a period of inflationary growth, when the economy is over-heating. Commodities are more volatile than TIPS, but they can also be effective diversifiers when combined with other asset classes. Finally, inflation-sensitive equities, like com-modities, may be more effective in an inflationary growth environment while providing greater return opportunities than TIPS.
Although a portfolio with a heavier weighting of inflation-sensitive assets will not perform quite as well in a period of falling inflation, as one would expect, it should perform better in a period of rising inflation and create a more stable portfolio overall. This is important because, as noted earlier, inflation detracts from the purchasing power of a retiree’s entire savings.
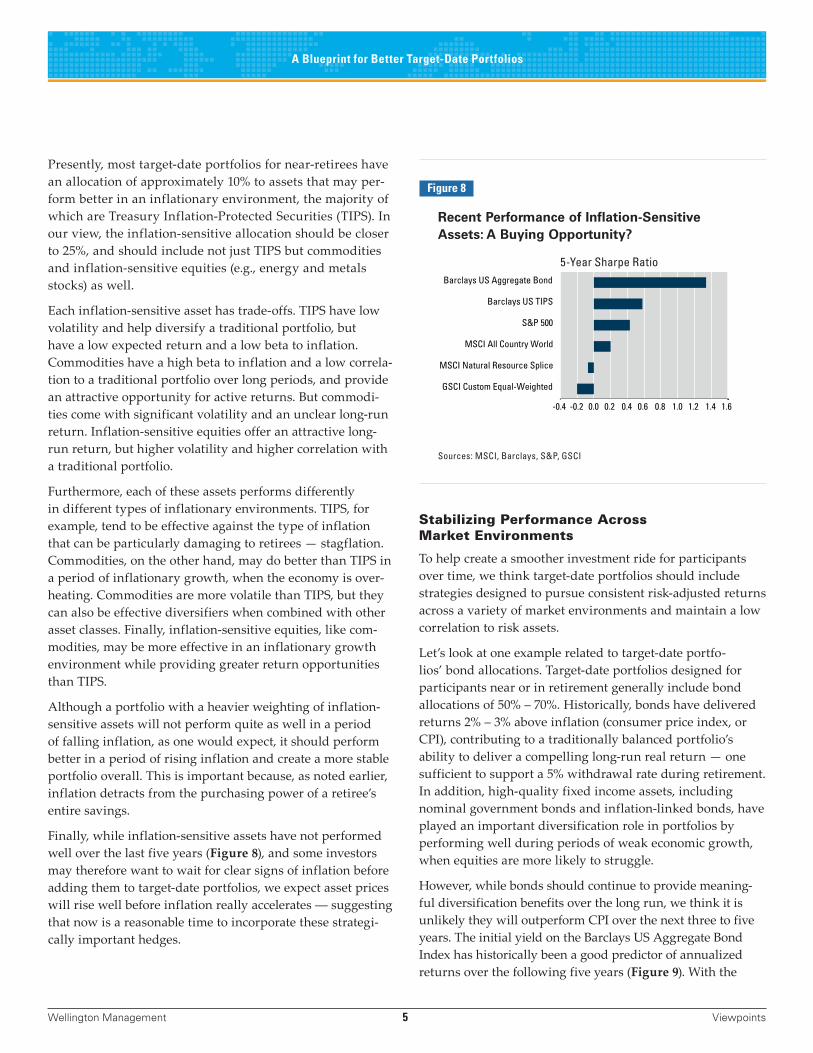
Finally, while inflation-sensitive assets have not performed well over the last five years (Figure 8), and some investors may therefore want to wait for clear signs of inflation before adding them to target-date portfolios, we expect asset prices will rise well before inflation really accelerates ― suggesting that now is a reasonable time to incorporate these strategi-cally important hedges.
figure 8
recent Performance of Inflation-Sensitive Assets: A buying Opportunity?
5-Year Sharpe Ratio
GSCI Custom Equal-Weighted
MSCI Natural Resource Splice
MSCI All Country World
S&P 500
Barclays US TIPS
Barclays US Aggregate Bond
-0.4 -0.2 0.0 0.2 0.4 0.6 0.8 1.0 1.2 1.4 1.6
Sources: MSCI, Barclays, S&P, GSCI
Wellington Management 6 Viewpoints
A Blueprint for Better Target-Date Portfolios
yield at 2.3% as of the end of September 2013, we expect the annualized five-year return to come in around that same level and near inflation. Therefore, unless equities perform well above average, retirees could be faced with the devas-tating combination of lower returns and diminished real spending power.
As a result, we think target-date portfolios should revisit their core fixed income holdings, taking steps to pursue attractive returns while maintaining bonds’ diversification benefits. Specifically, target-date portfolios may benefit from exposure to total-return strategies that have the flexibility to adjust holdings as the interest-rate environment evolves, potentially delivering attractive returns throughout the cycle. In our own target-date portfolios, for example, we hold strate-gies that give the manager flexibility to adjust exposures in pursuit of diversification from equities and compelling returns in the face of low yields. These include a rotational multi-asset strategy that targets inflation-adjusted total return with low correlation to equities and a total-return-oriented strategy that invests primarily in global government bonds. (For more on our approach, see our paper “Preparing Retirement Portfolios for Lower Bond Returns.”1)
optimizing the Use of Active Management
The opportunity to improve participants’ investment results through active management is substantial. Generating 50 basis points (bps) of active net returns annually over a participant’s
figure 9
Initial Yields Highly correlated to Future returns
Barclays US Aggregate Bond Index*, 1960 – 2012
0
3
6
9
12
15
18
21
0 1 2 3 4 5 6 7 8 9 10 11 12 13 14 15 16 17 18 19 20 21
Annu
alize
d Fi
ve-Y
ear R
etur
n (%
)
Initial Yield-to-Maturity (%)
September 2013
Correlation = 0.92
* Barclays US Aggregate Bond, 1975 – 2012; Barclays US Govt/Corp Bond, 1973 – 1975; Ibbotson Intm Govt Bond, 1960 – 1972
Sources: Barclays, Ibbotson, Wellington Management
figure 10
the Potential Value of Active Management
Simulated Wealth at Age 65*
Simulated Wealth at Age 85**
NoActiveMgmt
50 bpsNet
ActiveReturn
100 bpsNet
ActiveReturn
0
200
400
600
800
1,000
1,200
Thou
sand
s of
US
Dolla
rs
532594
665
NoActiveMgmt
50 bpsNet
ActiveReturn
100 bpsNet
ActiveReturn
0
200
400
600
800
1,000
1,200
Thou
sand
s of
US
Dolla
rs
445
686
979
+25%
+12%
+119%
+54%
* Assumes median outcome for a worker beginning career with US$25,000 income growing at 1% annually. Assumes 7% initial savings rate growing to 13% (including employer match). Represents median simulated outcome using data from 1901 – 2008.
**Assumes 60% income replacement rate, which is equivalent to a 3% – 4% drawdown rate.
Sources: S&P, Barclays, Ibbotson, US Bureau of Labor Statistics, Wellington Management
working career would provide a 12% increase in wealth at retirement; sustaining those additional returns through the first 20 years of retirement to age 85 would provide a 54% increase in wealth (Figure 10). This is equivalent to working an extra four years or saving an extra 2% annually.
We think incorporating active risk in DC plan investments makes sense for several reasons. First, a DC plan can typically offer participants lower cost exposure to active management than they can achieve on their own. Second, participants ben-efit from the due diligence on active managers provided by the plan or its consultant. Finally, the tax advantages of a DC plan make active management more attractive.
We believe target-date portfolios should use active manage-ment in less efficient asset classes or more unconstrained strategies. We have found that active managers have con-sistently added value net of fees in asset classes typically regarded as less efficient, such as small-cap stocks, emerging market stocks and bonds, and global stocks. In addition, we have found that managers who are more unconstrained (i.e., generate higher tracking risk) have also generated higher alpha. Taking this approach may provide a greater prob-ability of delivering the 50 bps of net alpha that can produce significant benefits for participants over the long run.
1https://www.wellington.com/en/publication-page?article_id=193
Wellington Management 7 Viewpoints
A Blueprint for Better Target-Date Portfolios
How we Allocate to Active strategies
Our allocations to two Wellington Management approaches, Technical Equity and Global Perspectives, highlight reasons we allocate to active strategies in our target-date portfolios.
Limiting Drawdowns
While DC participants have the benefit of a long time horizon, allowing them to take on significant equity risk, we think target-date portfolios should strive to limit drawdowns. One way to do this is to allocate to active investment strategies with the potential to outperform in weak equity markets. Our allocation to Technical Equity fits this category. Technical Equity is a long-only global equity strategy that employs momentum-based technical analysis. It invests in stocks that have strong price momentum, as this momentum tends to persist more often than not. In addition to avoiding stocks with weak price momentum, Technical Equity will move from equity into cash if very few stocks have a strong techni-cal structure. While this strategy can sometimes lead to underperformance when markets start to sell off and then quickly rebound, it has the potential to outperform dur-ing prolonged market drawdowns, when outperformance is valued most.
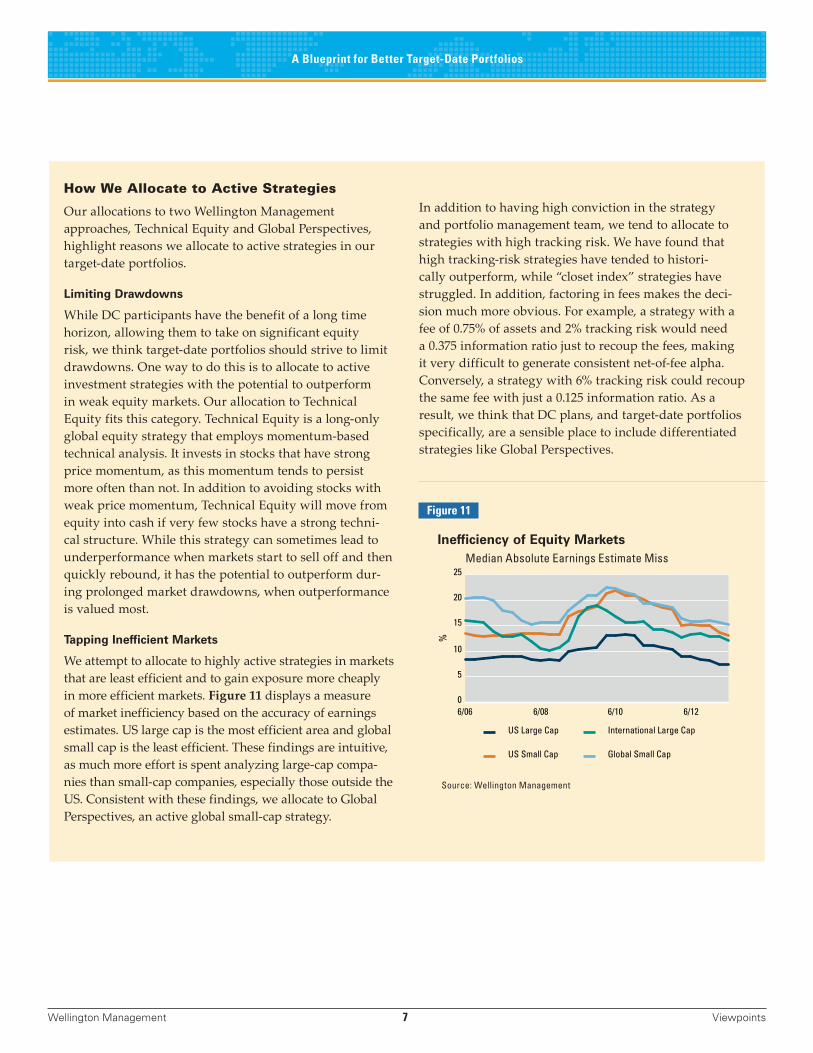
tapping Inefficient Markets
We attempt to allocate to highly active strategies in markets that are least efficient and to gain exposure more cheaply in more efficient markets. Figure 11 displays a measure of market inefficiency based on the accuracy of earnings estimates. US large cap is the most efficient area and global small cap is the least efficient. These findings are intuitive, as much more effort is spent analyzing large-cap compa-nies than small-cap companies, especially those outside the US. Consistent with these findings, we allocate to Global Perspectives, an active global small-cap strategy.
In addition to having high conviction in the strategy and portfolio management team, we tend to allocate to strategies with high tracking risk. We have found that high tracking-risk strategies have tended to histori-cally outperform, while “closet index” strategies have struggled. In addition, factoring in fees makes the deci-sion much more obvious. For example, a strategy with a fee of 0.75% of assets and 2% tracking risk would need a 0.375 information ratio just to recoup the fees, making it very difficult to generate consistent net-of-fee alpha. Conversely, a strategy with 6% tracking risk could recoup the same fee with just a 0.125 information ratio. As a result, we think that DC plans, and target-date portfolios specifically, are a sensible place to include differentiated strategies like Global Perspectives.
figure 11
Inefficiency of equity MarketsMedian Absolute Earnings Estimate Miss
6/06 6/08 6/10 6/120
5
10
15
20
25
%
US Large Cap
US Small Cap
International Large Cap
Global Small Cap
Source: Wellington Management
www.wellington.com
Wellington Management Company, llp | Boston | Chicago | Radnor, PA | San Francisco
Wellington Global Investment Management Ltd | Hong Kong | Beijing Representative Office
Wellington International Management Company Pte Ltd | Singapore | Sydney | Tokyo
Wellington Management International Ltd | London | Frankfurt
AboUt wellinGton MAnAGeMent Tracing our roots to 1928, Wellington Management is one of the largest independent investment management firms in the world. We are a private firm whose sole business is investment management, and we serve as investment adviser for institutional clients in over 50 countries. Our most distinctive strength is our commitment to proprietary, independent research — the foundation upon which our investment approaches are built. Our commitment to investment excellence is evidenced by our significant presence and long-term track records in nearly all sectors of the liquid, global securities markets.
Specific securities discussed are not necessarily representative of securities purchased, sold, or recommended for clients. It should not be assumed that any investment in the securities discussed has been or will be profitable. Actual investments will vary for clients and there is no guarantee that a particular client’s account will hold any or all securities discussed.Wellington Management Company, llp (WMC) is an independently owned investment adviser registered with the US Securities and Exchange Commission (SEC) and commodity trading advi-sor registered with the US Commodity Futures Trading Commission that, along with its subsidiaries and affiliates (collectively, Wellington Management), provides investment management and investment advisory services to institutions around the world. This material is prepared for, and authorized for internal use by, designated institutional and professional investors and their consultants or for such other use as may be authorized by Wellington Management. This material and/or its contents are current at the time of writing and may not be reproduced or distributed in whole or in part, for any purpose, without the express written consent of Wellington Management. This material is not intended to constitute investment advice or an offer to sell, or the solicitation of an offer to purchase shares or other securities. Investors should always obtain and read an up-to-date investment services description or prospectus before deciding whether to appoint an investment manager or to invest in a fund. Any views expressed herein are those of the author(s), are based on available information, and are subject to change without notice. Individual portfolio management teams may hold different views and may make different investment decisions for different clients. In the UK, this material is provided by Wellington Management International Limited (WMIL), a firm authorized and regulated by the Financial Conduct Authority (FCA). This material is directed only at persons (Relevant Persons) who are classified as eligible counterparties or professional clients under the rules of the FCA. This material must not be acted on or relied on by persons who are not Relevant Persons. Any investment or investment service to which this material relates is available only to Relevant Persons and will be engaged in only with Relevant Persons. In Germany, this material is provided by Wellington Management International Limited, Niederlassung Deutschland, the German branch of WMIL, which is authorized and regulated by the FCA and in respect of certain aspects of its activities by the German Federal Financial Supervisory Authority (Bundesanstalt für Finanzdienstleistungsaufsicht - BaFin). This material is directed only at persons (Relevant Persons) who are classified as eligible counterparties or professional clients under the German Securities Trading Act. This material does not constitute investment advice, a solicitation to invest in financial instruments or financial analysis within the meaning of Section 34b of the German Securities Trading Act. It does not meet all legal requirements designed to guarantee the independence of financial analyses and is not subject to any prohibition on dealing ahead of the publication of financial analyses. This material does not constitute a prospectus for the purposes of the German Investment Fund Act, the German Securities Sales Prospectus Act or the German Securities Prospectus Act.In Hong Kong, this material is provided to you by Wellington Global Investment Management Limited (WGIM), a corporation licensed by the Securities and Futures Commission to conduct Type 1 (dealing in securities), Type 2 (dealing in futures contracts), Type 4 (advising on securities), and Type 9 (asset management) regulated activities, on the basis that you are a Professional Investor as defined in the Securities and Futures Ordinance. By accepting this material you acknowledge and agree that this material is provided for your use only and that you will not distribute or otherwise make this material available to any person. In Singapore, this material is provided for your use only by Wellington International Management Company Pte Ltd (WIM) (Registration Number 199504987R), regulated by the Monetary Authority of Singapore with a Capital Markets Services Licence to conduct portfolio management activities. By accepting this material you represent that you are a non-retail investor and that you will not copy, distribute or otherwise make this material available to any person. In Australia, Wellington International Management Company Pte Ltd (WIM) has authorized the issue of this material for use solely by wholesale clients (as defined in the Corporations Act 2001). By accepting this material, you acknowledge and agree that this material is provided for your use only and that you will not distribute or otherwise make this material available to any person. Wellington Management Company, llp is exempt from the requirement to hold an Australian financial services licence (AFSL) under the Corporations Act 2001 in respect of financial services, in reliance on class order 03/1100, a copy of which may be obtained at the web site of the Australian Securities and Investments Commission, http://www.asic.gov.au. The class order exempts a registered investment adviser regulated by the SEC, among others, from the need to hold an AFSL for financial services provided to Australian wholesale clients on certain conditions. Financial services provided by Wellington Management Company, llp are regulated by the SEC under the laws and regulatory requirements of the United States, which are different from the laws applying in Australia.In Japan, Wellington International Management Company Pte Ltd (WIM) has been registered as a Financial Instruments Firm with registered number: Director General of Kanto Local Finance Bureau (Kin-Sho) Number 428. WIM is a member of the Japan Investment Advisers Association (JIAA) and the Investment Trusts Association, Japan (ITA).WMIL, WGIM, and WIM are also registered as investment advisers with the SEC; however, they will comply with the substantive provisions of the US Investment Advisers Act only with respect to their US clients.
©2013 Wellington Management Company, llp. All rights reserved. 351995_7