Embed Size (px)
Citation preview
A. A. Afifi Biostatistics in Public Health 1
Biostatistics in Public Health
Abdelmonem A. Afifi, Ph.D.Dean Emeritus and Professor of Biostatistics UCLA School of Public [email protected]
A. A. Afifi Biostatistics in Public Health 2
What Will I Talk About? Review of Public Health. The role(s) of biostatistics in P.H. Tools available to the biostatistician. Example: bioinformatics.
A. A. Afifi Biostatistics in Public Health 3
Introduction The press frequently quotes scientific articles
about:• Diet• The Environment• Medical care, etc.
Effects are often small and vary greatly from person to person
We need to be familiar with statistics to understand and evaluate conflicting claims
A. A. Afifi Biostatistics in Public Health 4
Public Health

A. A. Afifi Biostatistics in Public Health 5
What Is Public Health?
“Public Health is the science and art of preventing disease, prolonging life and promoting health through the organized efforts of society.”
(World Health Organization)

A. A. Afifi Biostatistics in Public Health 6
The Future of Public Health Report (IOM 1988) The mission of public health is
defined as:“Assuring the conditions in which people can be healthy.”

A. A. Afifi Biostatistics in Public Health 7
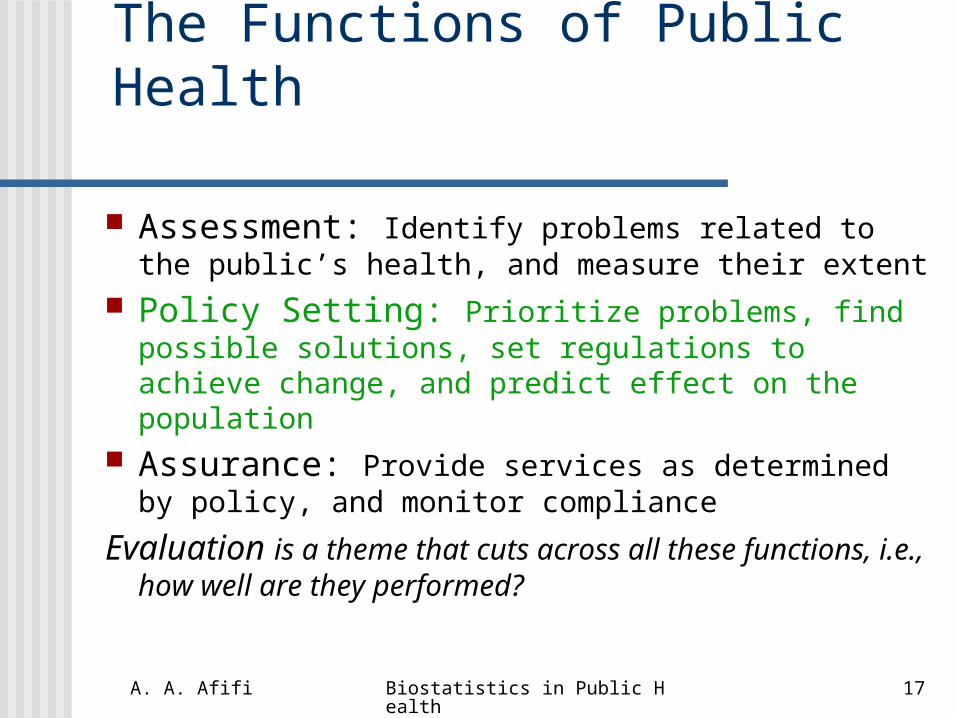
The Functions of Public Health
Assessment: Identify problems related to the public’s health, and measure their extent
Policy Setting: Prioritize problems, find possible solutions, set regulations to achieve change, and predict effect on the population
Assurance: Provide services as determined by policy, and monitor compliance
Evaluation is a theme that cuts across all these functions, i.e., how well are they performed?

A. A. Afifi Biostatistics in Public Health 8
Committee on Assuring the Health of the Public in the 21st Century
Issued: 2002
INSTITUTE OF MEDICINE
OF THE NATIONAL ACADEMIES
THE FUTURE OF
THE PUBLIC’S
HEALTH
in the 21st Century
A. A. Afifi Biostatistics in Public Health 9
In 1988 report: public health refers to the efforts of society, both government and others, to assure the population’s health.
The 2002 report elaborates on the efforts of the other potential public health system actors.
Approach and Rationale
A. A. Afifi Biostatistics in Public Health 10
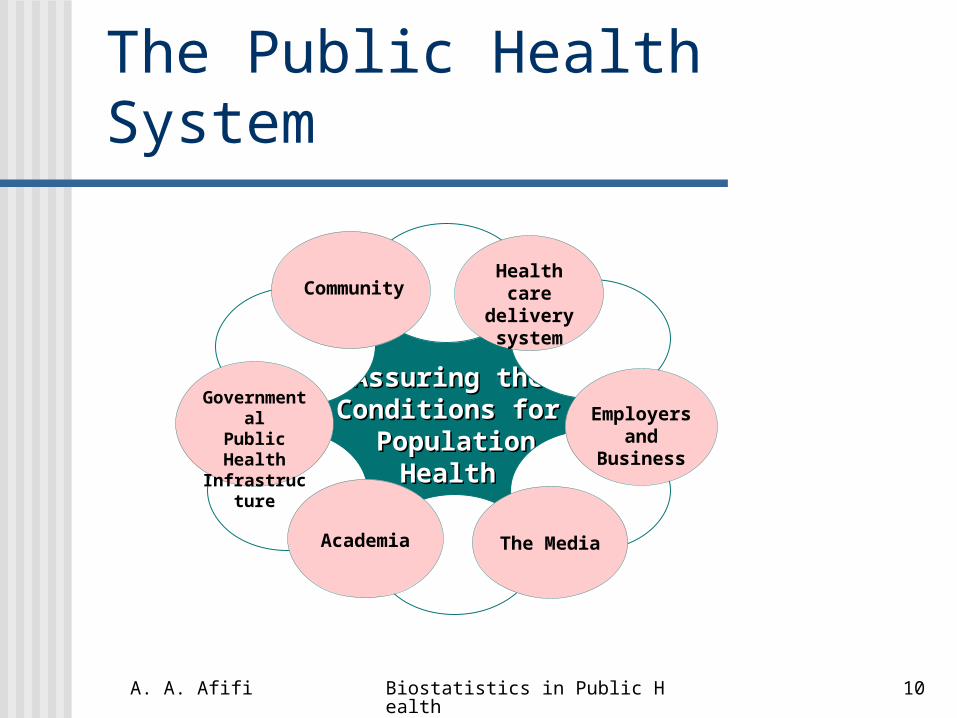
The Public Health System
Assuring the Assuring the Conditions for Conditions for
PopulationPopulationHealthHealth
Employersand Business
Academia
GovernmentalPublic Health Infrastructure
The Media
Healthcare delivery
system
Community

A. A. Afifi Biostatistics in Public Health 11
Areas of Action and Change
Adopt a population-level approach, including multiple determinants of health
Strengthen the governmental public health infrastructure
Build partnerships Develop systems of accountability Base policy and practice on evidence Enhance communication

A. A. Afifi Biostatistics in Public Health 12
Determinants of Population Health
Employment and occupational Biology of disease Education Socioeconomic status Psychosocial factors Environment, natural and built3
Public health services Health care services
Over the lifespan
A. A. Afifi Biostatistics in Public Health 13
Biostatistics

A. A. Afifi Biostatistics in Public Health 14
What is Biostatistics? Statistics is the art and science of
making decisions in the face of uncertainty
Biostatistics is statistics as applied to the life and health sciences

A. A. Afifi Biostatistics in Public Health 15
The Functions of Public Health
Assessment: Identify problems related to the public’s health, and measure their extent
Policy Setting: Prioritize problems, find possible solutions, set regulations to achieve change, and predict effect on the population
Assurance: Provide services as determined by policy, and monitor compliance
Evaluation is a theme that cuts across all these functions, i.e., how well are they performed?
A. A. Afifi Biostatistics in Public Health 16
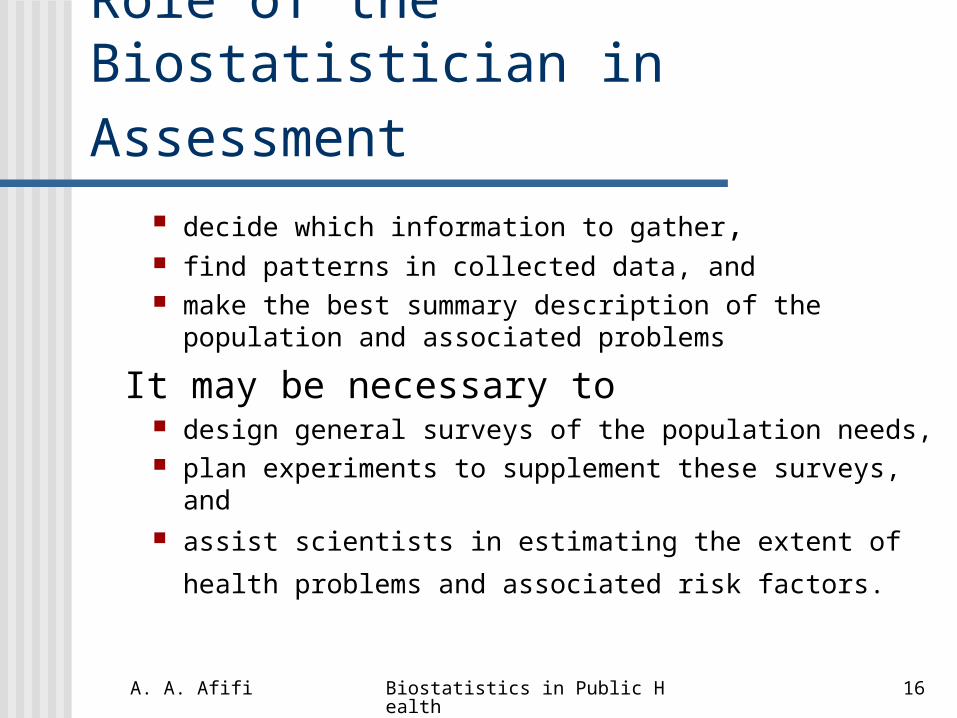
Role of the Biostatistician in Assessment
decide which information to gather, find patterns in collected data, and make the best summary description of the population
and associated problems
It may be necessary to design general surveys of the population needs, plan experiments to supplement these surveys, and assist scientists in estimating the extent of health
problems and associated risk factors.
A. A. Afifi Biostatistics in Public Health 17
The Functions of Public Health
Assessment: Identify problems related to the public’s health, and measure their extent
Policy Setting: Prioritize problems, find possible solutions, set regulations to achieve change, and predict effect on the population
Assurance: Provide services as determined by policy, and monitor compliance
Evaluation is a theme that cuts across all these functions, i.e., how well are they performed?
A. A. Afifi Biostatistics in Public Health 18
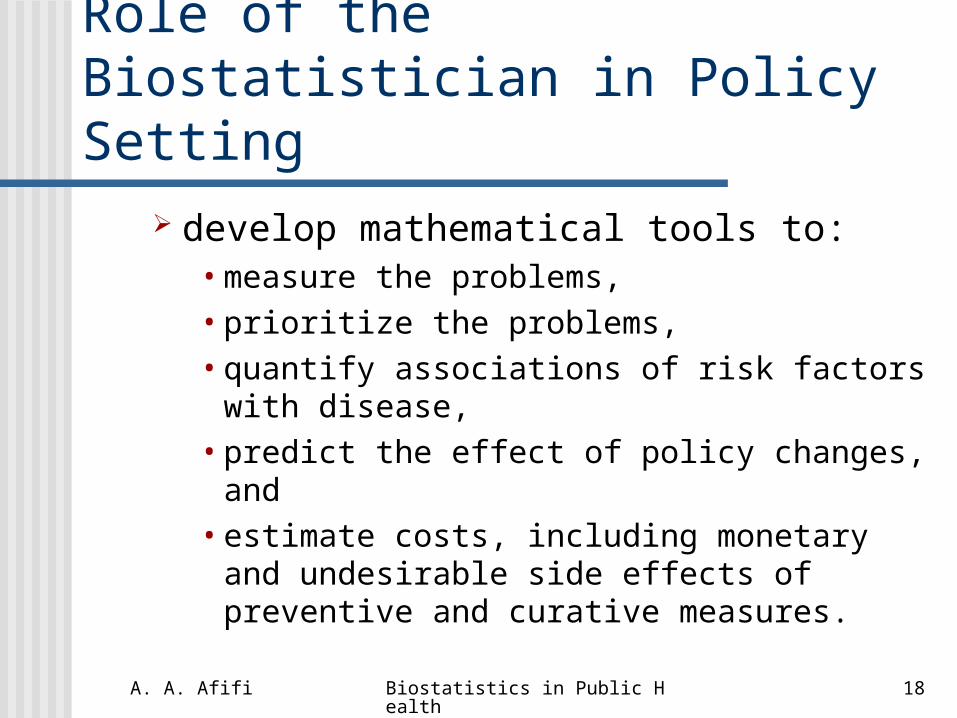
Role of the Biostatistician in Policy Setting
develop mathematical tools to: • measure the problems, • prioritize the problems, • quantify associations of risk factors with
disease,• predict the effect of policy changes, and• estimate costs, including monetary and
undesirable side effects of preventive and curative measures.
A. A. Afifi Biostatistics in Public Health 19
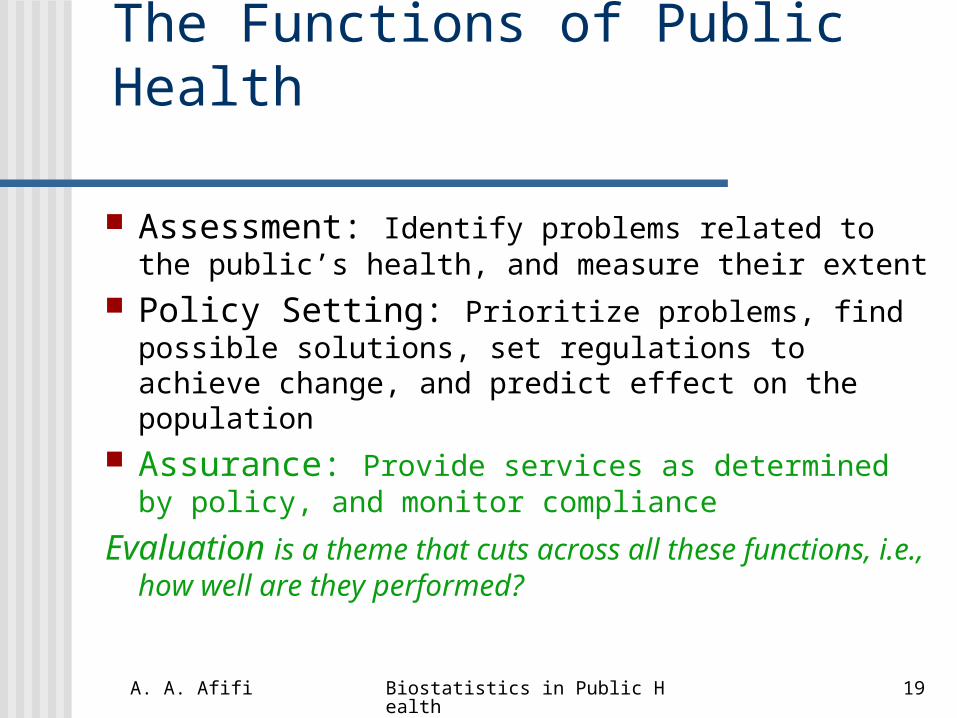
The Functions of Public Health
Assessment: Identify problems related to the public’s health, and measure their extent
Policy Setting: Prioritize problems, find possible solutions, set regulations to achieve change, and predict effect on the population
Assurance: Provide services as determined by policy, and monitor compliance
Evaluation is a theme that cuts across all these functions, i.e., how well are they performed?
A. A. Afifi Biostatistics in Public Health 20
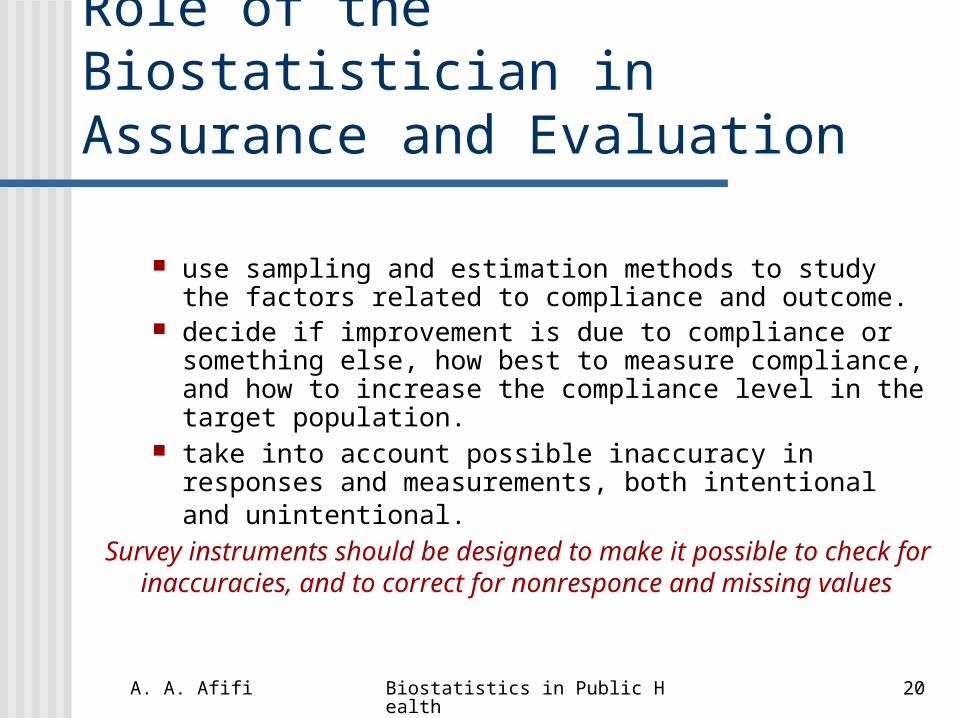
Role of the Biostatistician in Assurance and Evaluation
use sampling and estimation methods to study the factors related to compliance and outcome.
decide if improvement is due to compliance or something else, how best to measure compliance, and how to increase the compliance level in the target population.
take into account possible inaccuracy in responses and measurements, both intentional and unintentional.
Survey instruments should be designed to make it possible to check for inaccuracies, and to correct for nonresponce and missing values
A. A. Afifi Biostatistics in Public Health 21
Examples of Community Public Health Actions

A. A. Afifi Biostatistics in Public Health 22
MADD - Mothers Against Drunk Driving
Organized to involve community leaders, media advocates, legislators and other politicians.
Called attention to lack of legal penalties for drunk driving
A. A. Afifi Biostatistics in Public Health 23
Results of MADD Actions
Decreased public tolerance for drunk driving;
Increased laws and legal enforcement of drunk driving violations;
Decrease in alcohol related fatalities.
Statisticians help gather, analyze and interpret the data necessary for convincing the public and the policy makers.

A. A. Afifi Biostatistics in Public Health 24
Example II : Diesel Exhaust Exposure Among Adolescents Community concerned with impact of diesel
exhaust on youth in light of rising incidence of asthma and other respiratory problems;
Community initiated partnership with School of Public Health and was directly involved with all phases of research development;
A. A. Afifi Biostatistics in Public Health 25
Results: Diesel Exhaust Exposure Among Adolescents
Confirmation of high diesel particulate matter in low-income neighborhood;
Joint community and health professional research.
Statisticians help gather, analyze and interpret the data.
A. A. Afifi Biostatistics in Public Health 26
Public Health Interventions to Foster Community Health
Tobacco Control Initiatives in the US Government regulations to ban
television advertising of tobacco in the 1970s.
Public Health campaigns for smoking cessation increased.
New pharmaceuticals for smoking cessation (patch, Zyban).
A. A. Afifi Biostatistics in Public Health 27
Tobacco control initiatives
Results: Stricter enforcement of under-age sales
with expensive fines Smoking banned in most public places
Statisticians help gather, analyze and interpret the data necessary for convincing the public and the policy makers.

A. A. Afifi Biostatistics in Public Health 28
Motor Cycle Helmets
Since 1975, states started passing laws requiring helmet use
1992: a California state law required safety helmets meeting US Department of Transportation standards

A. A. Afifi Biostatistics in Public Health 29
Evaluation of Law The Southern California Injury
Prevention Research Center conducted study to determine : Change in helmet use with the 1992
helmet law, and Impact of the law on crash fatalities and
injuries
A. A. Afifi Biostatistics in Public Health 30
Results of Center Study Helmet use increased from about 50% in 1991 to
more than 99% throughout 1992 Statewide motorcycle crash fatalities decreased
by 37.5% An estimated 92 to 122 fatalities were prevented The proportion of riders likely to sustain head-
injury related impairments decreased by 34.1%
Statisticians work with epidemiologists to gather, analyze and interpret the data.

A. A. Afifi Biostatistics in Public Health 31
Back to Biostatistics and Biostatisticians
A. A. Afifi Biostatistics in Public Health 32
Understanding Variation in Data
Variation from person to person is ubiquitous, making it difficult to identify the effect of a given factor or intervention on one's health.
For example, a habitual smoker may live to be 90, while someone who never smoked may die at age 30.
The key to sorting out such seeming contradictions is to study properly chosen groups of people (samples).

A. A. Afifi Biostatistics in Public Health 33
Next steps Look for the aggregate effect of something on
one group as compared to another. Identify a relationship, say between lung cancer
and smoking. This does not mean that every smoker will die
from lung cancer, nor that if you stop smoking you will not die from it.
It does mean that the group of people who smoke are more likely than those who do not smoke to die from lung cancer.
A. A. Afifi Biostatistics in Public Health 34
Probability
How can we make statements about groups of people, but cannot do so about any given individual in the group?
Statisticians do this through the ideas of probability.
For example, we can say that the probability that an adult American male dies from lung cancer during one year is 9 in 100,000 for a non-smoker, but is 190 in 100,000 for a smoker.
A. A. Afifi Biostatistics in Public Health 35
Events and their Probabilities
We call dying from lung cancer during a particular year an “event”.
Probability is the science that describes the occurrence of such events.
For a large group of people, we can make quite accurate statements about the occurrence of events, even though for specific individuals the occurrence is uncertain and unpredictable.
A. A. Afifi Biostatistics in Public Health 36
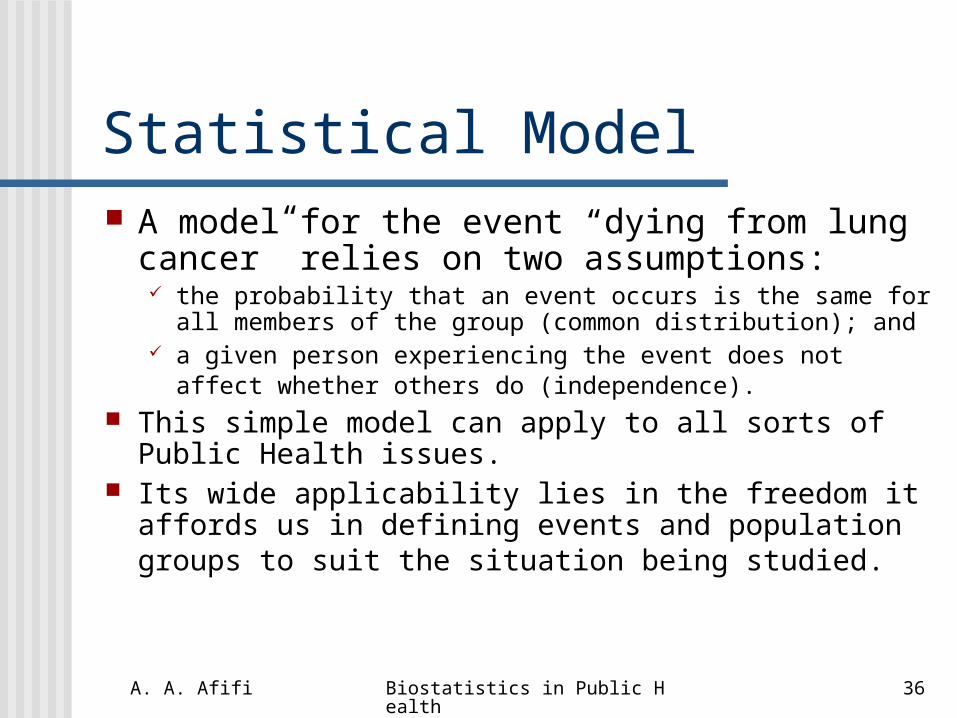
Statistical Model A model for the event “dying from lung
cancer” relies on two assumptions: the probability that an event occurs is the same for all
members of the group (common distribution); and a given person experiencing the event does not affect
whether others do (independence). This simple model can apply to all sorts of Public
Health issues. Its wide applicability lies in the freedom it affords
us in defining events and population groups to suit the situation being studied.
A. A. Afifi Biostatistics in Public Health 37
Example
A. A. Afifi Biostatistics in Public Health 38
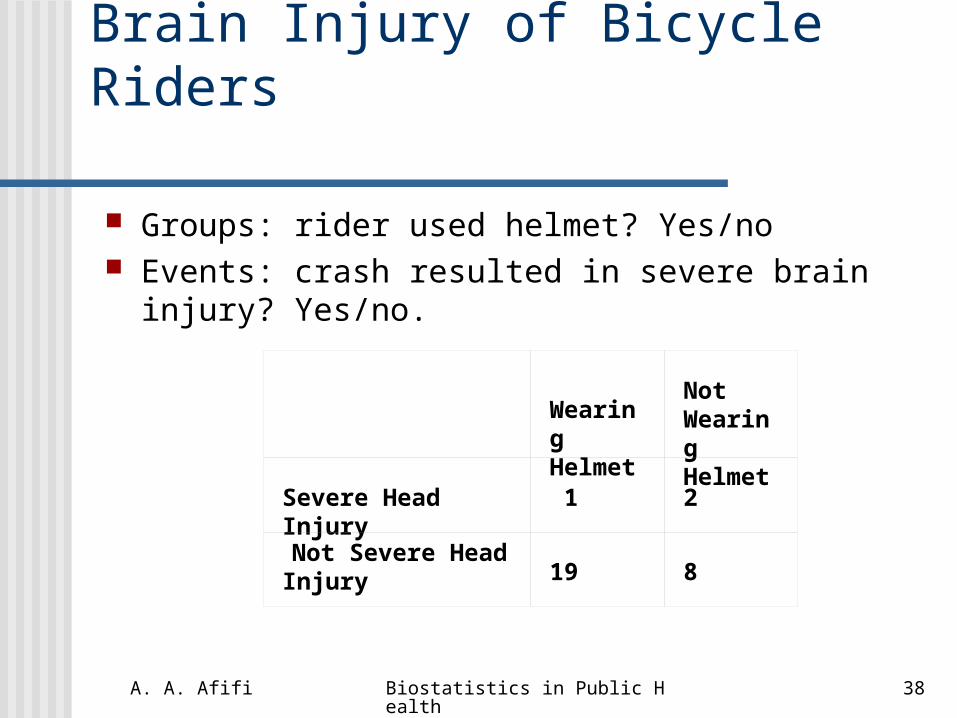
Brain Injury of Bicycle Riders
Groups: rider used helmet? Yes/no Events: crash resulted in severe brain injury?
Yes/no.
Wearing Helmet
NotWearing Helmet
Severe Head Injury
1
2
Not Severe Head Injury
19
8
A. A. Afifi Biostatistics in Public Health 39
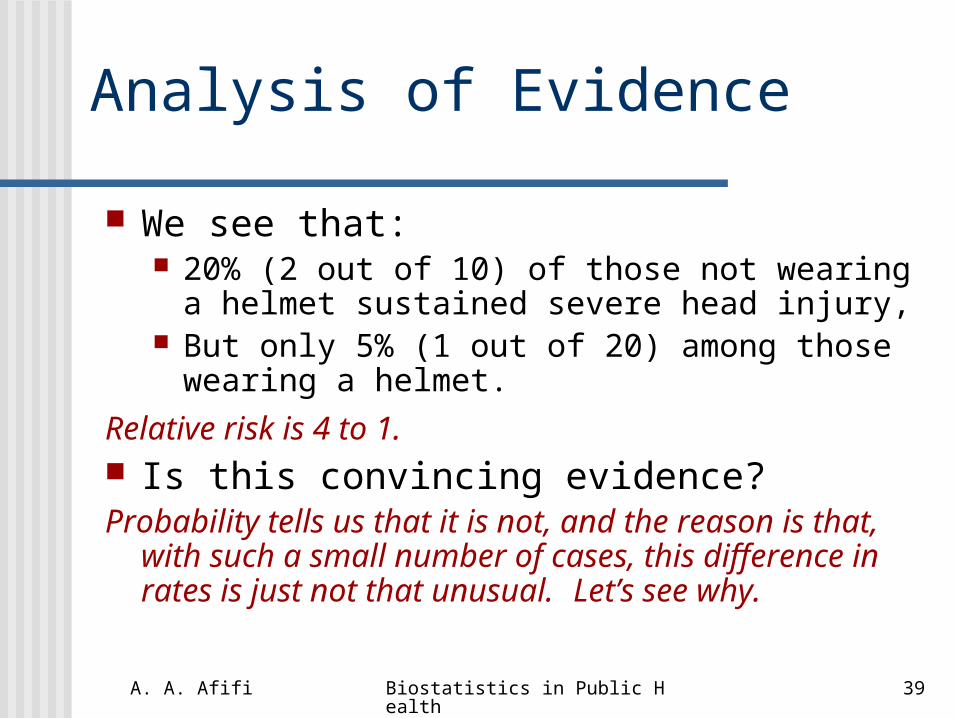
Analysis of Evidence
We see that: 20% (2 out of 10) of those not wearing a
helmet sustained severe head injury, But only 5% (1 out of 20) among those
wearing a helmet.
Relative risk is 4 to 1. Is this convincing evidence? Probability tells us that it is not, and the reason is
that, with such a small number of cases, this difference in rates is just not that unusual. Let’s see why.

A. A. Afifi Biostatistics in Public Health 40
Probability Model: the Binomial Distribution Suppose that the chance of severe head injury
following a bicycle crash is 1 in 10. Use a child's spinner with numbers “1” through
“10”. The dial points to a number from “1” to “10”; every number is equally likely; and the spins are independent.
Let the spin indicate severe head injury if a "1" shows up, and no severe head injury for "2" through "10".
This model is known as the Binomial Distribution.

A. A. Afifi Biostatistics in Public Health 41
Probability of Observed Data
We spin the pointer ten times to see what could happen among ten people not wearing a helmet.
The Binomial distribution says the probability:That we do not see a "1" in ten spins is .349, That we will see exactly one "1" in ten spins is .387, Exactly two “1’s” is .194, Exactly three is .057,
exactly four is .011, with negligible probability for five or more.
So if this is a good model for head injury, the probability of 2 or more people experiencing severe head injury in ten crashes is 0.264.
A. A. Afifi Biostatistics in Public Health 42
Hypothesis Testing
We hypothesize that no difference exists between two groups (called the "null" hypothesis), then use the theory of probability to determine how tenable such an hypothesis is.
In the bicycle crash example, the null hypothesis is that the risk of injury is the same whether or not you wear a helmet.
Probability calculations tell how likely it is under the null hypothesis to observe a risk ratio of four or more in samples of 20 people wearing helmets and ten people not wearing helmets.
A. A. Afifi Biostatistics in Public Health 43
Results of the Test With such a small sample, one will
observe a risk ratio greater than four about 16% of the time, far too large to give us confidence in asserting that wearing helmets prevents head injury.
If the probability were small, say < 5%, we would conclude that there is an effect.
To thoroughly test whether helmet use does reduce the risk of head injury, we need to observe a larger sample.

A. A. Afifi Biostatistics in Public Health 44
2x2 Tables This type of data presentation is
called a 2x2 table The test we used is called the Chi-
square test.
A. A. Afifi Biostatistics in Public Health 45
Relationships Among variables
A. A. Afifi Biostatistics in Public Health 46
Studying Relationships among Variables
A major contribution to our knowledge of Public Health comes from understanding: trends in disease rates and relationships among different predictors
of health. Biostatisticians accomplish these
analyses by fitting mathematical models to data.

A. A. Afifi Biostatistics in Public Health 47
Example: Blood Lead Blood lead levels in children are known to
cause serious brain and neurologic damage at levels as low as ten micrograms per
deciliter. Since the removal of lead from gasoline,
blood levels of lead in children in the United States have been steadily declining, but there is still a residual risk from
environmental pollution.
A. A. Afifi Biostatistics in Public Health 48
Blood Lead versus Soil Lead In a survey, we relate blood lead levels of
children to lead levels from a sample of soil near their residences.
A plot of the blood levels and soil concentrations shows some curvature.
So we use the logarithms to produce an approximately linear relationship.
When plotted, the data show a cloud of points as in the following example for 200 children.
A. A. Afifi Biostatistics in Public Health 49
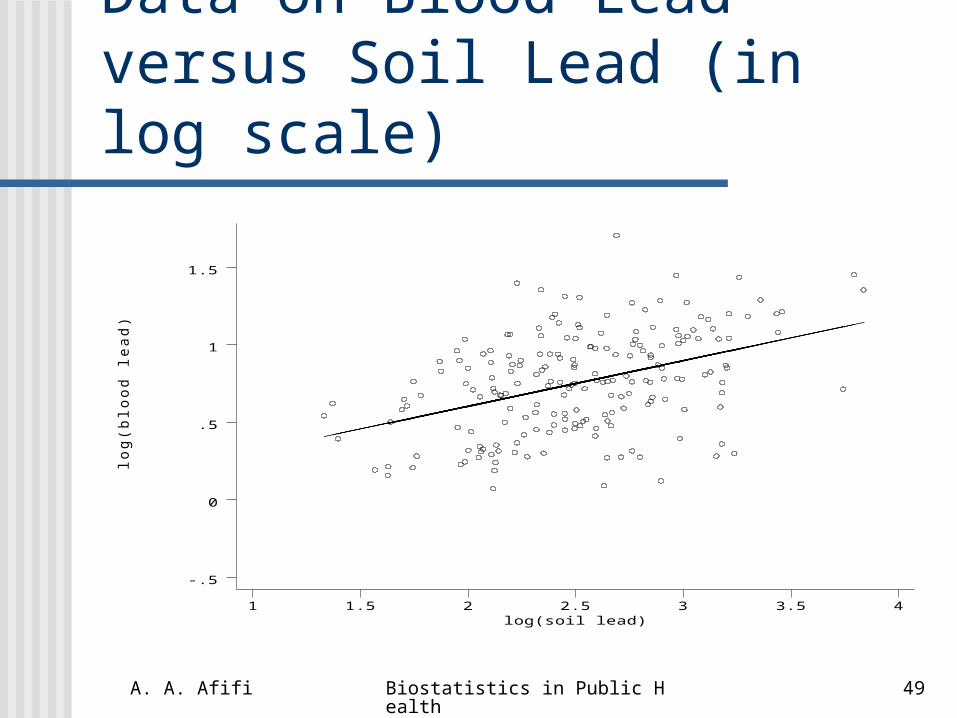
Data on Blood Lead versus Soil Lead (in log scale)
log
(blo
od
lea
d)
log(soil lead)1 1.5 2 2.5 3 3.5 4
-.5
0
.5
1
1.5
A. A. Afifi Biostatistics in Public Health 50
Analysis of Lead Data
The plot was produced by a statistical software program called Stata.
We fitted a straight line to the data, called the regression equation of y on x.
The software also printed out the fitted regression equation: y = .29x + .01 .
It says that an increase of 1 in log(soil-lead) concentration will correspond, on average, to an increase in log(blood-lead) of .29 .
A. A. Afifi Biostatistics in Public Health 51
Interpretation
For example, a soil-lead level of 100 milligrams per kilogram, whose log is two, predicts an average log blood-lead level of .29x2+.01=.59, corresponding to a measured blood
level of 3.8 micrograms per deciliter. For 1000 mg per kg soil-lead level, the
blood lead level is computed to be 7.6 mcg per dL
A. A. Afifi Biostatistics in Public Health 52
Public Health Conclusion From the public health viewpoint,
there is a positive relationship between the level of lead in the soil and blood-lead levels in the population, i.e., soil-lead and blood-lead levels
are positively correlated.

A. A. Afifi Biostatistics in Public Health 53
Correlation To study the degree of the
relationship between two variables, we:
Estimate a quantity called the correlation coefficient, or “r”
This “r” must lie between -1 and +1, and is interpreted as a measure of how
close to a straight line the data lie.
A. A. Afifi Biostatistics in Public Health 54
Correlation Analysis
Values near ±1: nearly perfect line, Values near 0: no linear relationship,
but there may be a non-linear relationship.
For the lead data, r = 0.42 It can be used to test for the statistical
significance of the regression.

A. A. Afifi Biostatistics in Public Health 55
Significance Analysis
Test of correlation r =.42 declares that the regression is significant at the 5% level.
This means that the chance of such a correlation happening by chance alone is less than 1 in 20.
We conclude that the observed association must be real.

A. A. Afifi Biostatistics in Public Health 56
Another Analysis We can use the 2x2 table analysis
discussed earlier. For each child, we measure whether
the soil lead was high or low, and classify a child’s blood lead levels as high and low, choosing appropriate definitions.

A. A. Afifi Biostatistics in Public Health 57
2x2 Table Analysis of Lead Data Choosing a median cutoff value for
low and high produces the following table:
low blood
lead level high blood lead level
low soil lead level
63
37
high soil lead level
37
63

A. A. Afifi Biostatistics in Public Health 58
Interpretation of 2x2 Table Analysis The chi square statistic for this table also
indicates a significant association between blood lead levels and soil lead levels in children.
The conclusion is not as compelling as in the linear regression analysis, and we have lost a lot of information in the data by
simplifying them in this way. One benefit, however, of this simpler analysis is
that we do not have to take logarithms of our data, or worry about the appropriate choice of a regression model.
A. A. Afifi Biostatistics in Public Health 59
Common Biostatistical Methods
A. A. Afifi Biostatistics in Public Health 60
Multiple Regression Analysis Outcome, Y, is continuous. Predictors, or covariates, the X’s, can be
on any scale. Relationship between Y and the X’s is
assumed linear. Objective is to examine and quantify the
relationship between Y and the X’s, and Derive an equation to predict Y from the
X’s.
A. A. Afifi Biostatistics in Public Health 61
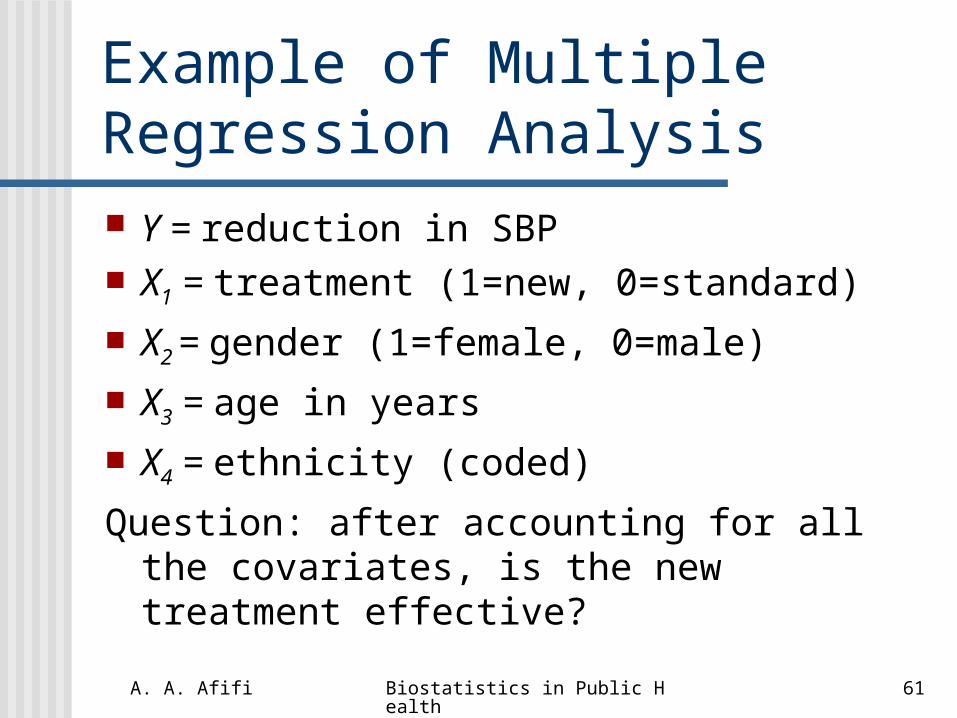
Example of Multiple Regression Analysis Y = reduction in SBP X1 = treatment (1=new, 0=standard)
X2 = gender (1=female, 0=male)
X3 = age in years
X4 = ethnicity (coded)
Question: after accounting for all the covariates, is the new treatment effective?

A. A. Afifi Biostatistics in Public Health 62
Logistic Regression Analysis Outcome, Y, is binary (1 = yes, 0 = no). Predictors, or covariates, the X’s, can be on any
scale. For given X’s, we denote the probability that
Y = 1 by p. The odds are p/(1-p). We assume that the relationship between the
logarithm of the odds and the X’s is linear. Objective is to examine and quantify the
relationship between Y and the X’s, and Derive an equation to predict Y from the X’s.

A. A. Afifi Biostatistics in Public Health 63
Example of Multiple Logistic Regression Analysis Y = patient cured? 1=yes,0=no. X1 = treatment (1=drug, 0=placebo) X2 = gender (1=female, 0=male) X3 = age in years X4 = ethnicity (coded)Question: after accounting for all the
covariates, is the drug effective?
A. A. Afifi Biostatistics in Public Health 64
Survival Analysis The outcome Y is the time till a
specific event occurs (survival time). Other measurements can include
covariates and treatment. We wish to study the survival
distribution, either by itself or as it relates to the covariates.
Several models exist.

A. A. Afifi Biostatistics in Public Health 65
Example of survival Analysis Y = survival in years since onset of cancer X1 = treatment (1=new, 0=standard) X2 = gender (1=female, 0=male) X3 = age in years, X4 = ethnicity (coded) X5 = size of tumorQuestion: after accounting for all the
covariates, is the new treatment effective?
A. A. Afifi Biostatistics in Public Health 66
New Frontiers: Bioinformatics

A. A. Afifi Biostatistics in Public Health 67
Definition of Bioinformatics
“Bioinformatics is the study of the inherent structure of biological information and biological systems. It brings together the avalanche of systematic biological data (e.g. genomes) with the analytic theory and practical tools of mathematics and computer science.” (UCLA Bioinformatics Interdisciplinary Program)
A. A. Afifi Biostatistics in Public Health 68
What Do Physicians Understand by Medical Informatics?
Practitioners will look up Best Practices on-line
Hospital Infosystems will be available 24x7 through the Internet
Clinicians will receive new research information directly relevant to their practice
Physicians will routinely use Computer facilitated diagnostic & therapeutic algorithms
Physicians will manage similar patient problems using computer facilitated tools.

A. A. Afifi Biostatistics in Public Health 69
The Focus of Public Health Informatics
Prevention The health of populations
Example: NHLBI guidelines regarding cholesterol. o It’s an algorithm based on LDL, HDL and
other risk factors, o followed by a recommendation to the
patient regarding whether or not taking a cholesterol-reducing medication is advisable.

A. A. Afifi Biostatistics in Public Health 70
Uses of Bioinformatics and Medical Informatics
A. A. Afifi Biostatistics in Public Health 71
Potential of Bioinformatics and Medical Informatics
It is within our grasp to be able to generalize this example many-fold.
Based on the individual’s profile, it will be possible to formulate individual tailor-made guidelines for a healthier life.
A. A. Afifi Biostatistics in Public Health 72
Challenges in Data Analysis: Adjustments Needed
The flood of information from genomics, proteomics, and microarrays can overwhelm the current methodology of biostatistics.
Example: microarrays.
A. A. Afifi Biostatistics in Public Health 73
Example: DNA Microarrays Plate smaller than a microscope slide Can be used to measure thousands of
gene expression levels simultaneously Microarrays can detect specific genes or
measure collective gene activity in tissue samples.
2 basic types: cDNA arrays oligonucleotide arrays

A. A. Afifi Biostatistics in Public Health 74
Making a Microarray Slide
A. A. Afifi Biostatistics in Public Health 75
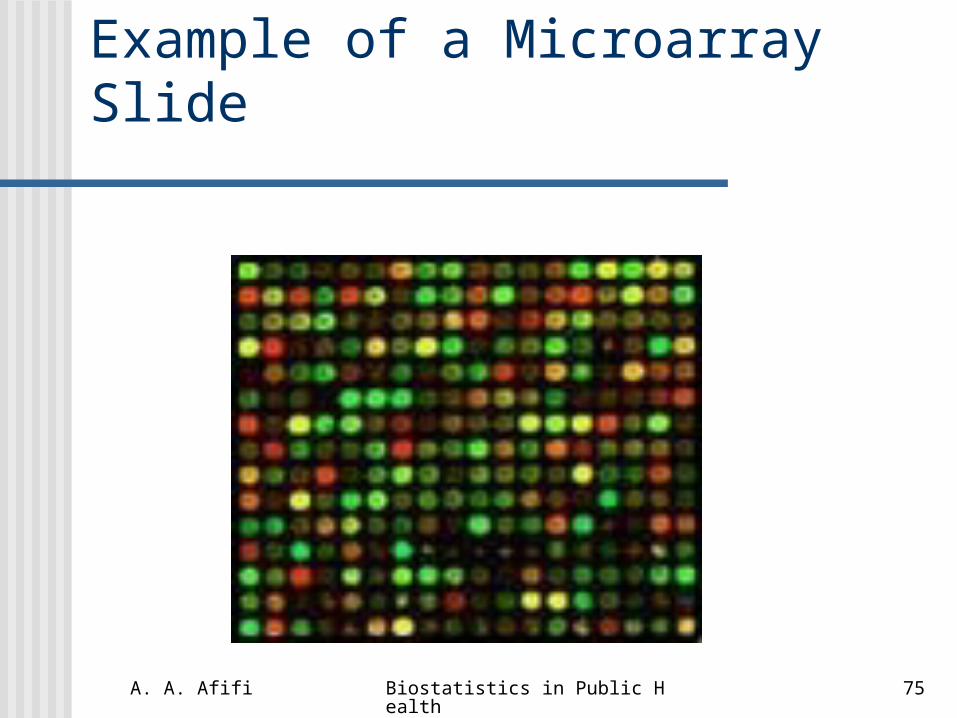
Example of a Microarray Slide

A. A. Afifi Biostatistics in Public Health 76
Uses of Microarrays Gene expression patterns are compared
between different tissue samples Question: Can the gene expression profile
predict cancer tissue? (Diagnosis). Question: Can a gene expression predict
survival outcomes? (Prognosis). Question: can we tailor the drug to the
patient’s profile? (Treatment)
A. A. Afifi Biostatistics in Public Health 77
Ethical Issues of Bioinformatics and Medical Informatics
A. A. Afifi Biostatistics in Public Health 78
Ethical Issues of Bioinformatics and Medical Informatics
Some discrimination based on whether a person smokes or is overweight takes place right now.
The eligibility of individuals for health and life insurance can become threatened by whether they fit certain criteria based on genetic profiles.
Employment opportunities may also be jeopardized.
A. A. Afifi Biostatistics in Public Health 79
Summary It is indeed an exciting time for
biostatistics and public health.
Thank you very much.Abdelmonem A. [email protected]