Embed Size (px)
Citation preview
Document of
The World Bank
FOR OFFICIAL USE ONLY
A-A/ 3 Z2gS- EcReport No. 9082-EC
STAFF APPRAISAL REPORT
ECUADOR
MUNICIPAL DEVELOPMENT AND URBAN INFRASTRUCTURE PROJECT
NOVEMBER 29, 1990
Infrastructure and Energy DivisionCountry Department IVLatin America and the Cai.$bbean Regional Office
This document has a resticted distribution and may be used by recipienis only In the performance oftheir official dutfes. Its contents may not otherwise be disclosed without World Bank athorization
Pub
lic D
iscl
osur
e A
utho
rized
Pub
lic D
iscl
osur
e A
utho
rized
Pub
lic D
iscl
osur
e A
utho
rized
Pub
lic D
iscl
osur
e A
utho
rized
Pub
lic D
iscl
osur
e A
utho
rized
Pub
lic D
iscl
osur
e A
utho
rized
Pub
lic D
iscl
osur
e A
utho
rized
Pub
lic D
iscl
osur
e A
utho
rized
CURRENCY AND EQUrVALENT UNITS
Currency Units Sucre (8/.)
U8$l - 8/* 655.19 (December 1989)
WEIGHTS AND MEASURES
Metric Syste
FISCAL YEAR
January 1 to December 31
ABBREVIATIONS AND ACRONYMS
AME - Asociacion de Municipalidades Ecuatorianas (Association ofEcuadoran municipalities)
BEDE - Banco de Desarrollo del Fcuador S.A. (Development Bankof Ecuador)
CONADZ - Consejo Nacional de Desarrollo (National DevelopmentCouncil)
FODESEC - Fondo de nesarrollo Seccional (Local GovernmentDevelopment Fund)
FONAPAR - Fondo Nacional de Participacion (National RevenueSharing Fund)
FONAPRE - Fondo Nacional de Pre-inversion (National Pre-Lnvestment Fund)
FONEN - Fondo de Emergencia Nacional (National Emergency Fund)GTZ - Gesellschaft fur Technische Zusammenarbeit (German Technical
Assistance Organization)IDB - Inter-American Development BankINEC - Instituto Nacional de Estadistica y Censos (National
Institute of Statistics and Censuses)IEOe - Instituto Bcuatoriano de Obras Sanitarias (Institute of
Sanitary Works of Ecuador)INBCBL - Instituto Nacional de Electrificacion del Ecuador (National
Institute of Electrification)LGDL Local Government Development LawMIF - Municipal Investment FundMDUI - Municipal Development and Urban Infrastructure [program
or project)BENDA Secretaria Nacional de Desarrollo Administrativo (National
Secretariat of Administrative Development)
FOR OFFICIAL USE ONLYECUADOR
MUNICIPAL DEVELOPMENT AND URBAN INFRASTRUCTURE PROJECT
STAFF APPRAISAL REPORT
TABLB OF CONTENTS
Page No.
LOAN AND PROECT SUMMARY ... . . . . . . . . . . . . . . . . . . . . iii
I. THE SECTOR...1A. Background: Rapidly Rising Demands; and Declining Capacity . 1B. Government Structure and the Provision of Public Services . . . 2C. Government's Request for Assistance and the Sector Policy
Letter . .. .. .. ..... .......... 2D. Institutional and Legal Constraints for Provision of Pi'b3ic
Services .*. . . . . . . . .* 3E. Reform of Intergovernmental Fiscal Relations . . 6F. Strengthening BEDE as a Lender and Provider of Technical
Assistance . . . . . . . . . . . . . . . . . . . . . . . . . 8G. Sector Development Issues, Objectives, and Bank Lending
Strategy .... . . . . . . . . . . ... 10H. Prior Bank Experience ............... .... 11I. Rationale for Bank Involvement ......... ...... 11
II. TIE PROJECT.. .. .12A. Project Origin . . . . . . . . . . . . . . . . . . . . . .. . 12B. Project Objectives ... . . . . . . ..... . . . . . . . . . 12C. Project Description ... . .13D. Project Costs and Financing Plan .. .14E. Eligibility Criteria . . . . . . . . . . . . . . . . . . . . . . 16F. Borrower and Executing Agency ... . . . . . .. . . . . . . . 19G. Cost Recovery Policy and Grants to Compensate Lifeline Rates . . 19
II. PROJECT IMPLEMENTATION . .. . . . .. ... ...... . . . 20A. Implementation Arrangements ........ ....... . . 20B. Strengthening Implementing Institutions ... ..... . . . . 21C. Procurement ... . .22D. Disbursement.. . . . .... ......... 24E. Accounts and Audits .... ... 26F. Project Reporting and Monitoring . .. .26
This report was prepared by D. Vetter (LA4IE) based on the findings of amission which visited Ecuador during April/May 1990. The mission comprisedMessrs/Mmes M. Art&za-Rouxel (Mission Leader, LA4IE), J. Carvalho (LEGLA), M.Linder (LACVP), L. Pisani (LATHR), D. Vetter (LA4IE), E. Wessels (LATDR), L.Ficinski, H. Garzon and S. Miquel (Consultants). A. Aza, A. Ezcurra, and W.Malik (Consultants) assisted in the production of this report. The financialprojections were done by B. Von Rabenau (Consultant).
This document has a restricted distribution and may be used by recipients only in the performanceof their official duties. Its contents may not otherwise be disclosed without World Bank authorization.
- ii -
IV. PROJUCT JUSTI1MICATION AND RISKS . ...... . . . . . . . . .. . 27
A. Financial Benefit . . . . . . . . . . . . . . .. . . . . .. 27
B. Economic Benefits . . . . . . . . . . . . . . . . . . . . . . 27C. Poverty Impact . . . . . . . . ...... . . . 28D. Environmental Impact . . . . . . . . . . . . . . 28
E. Risks and Safeguards... .. . . . . . . . . 29
V. AGRMANTS REACHED AND RBCOIMNDATIONS . . . . . . . . . . . . . . . 29
ANNBXES
ANNEX 1: Population Trends and Access to Urban Infrastructure
ANNEX 2: Policy Letter and MatrixANNEX 3: Reform of the Transfer SystemANNEX 4s BEDE: Financial Statements and Projections
ANNEX 5: BEDE: Organization ChartsANNEX 6: Institutional Development and Training Component
ANNEX 7: Infrastructure Component
ANNEX 8: Methodology for Economic and Financial Evaluation of Projects
ANNEX 9: Cost Recovery PolicyANNEX 10: Estimated Schedule of Bank Disbursements
ANNEX 11: Monitoring IndicatorsANNEX 12: Selected Documents in the Project File
MAP
IBRD 18179 ECUADOR
-iii -
ECUADOR
MUNICIPAL DEVELOPMENT AND URBAN INFRASTRUCTURE PROJECT
LOAN AND PROJECT SUMMARY
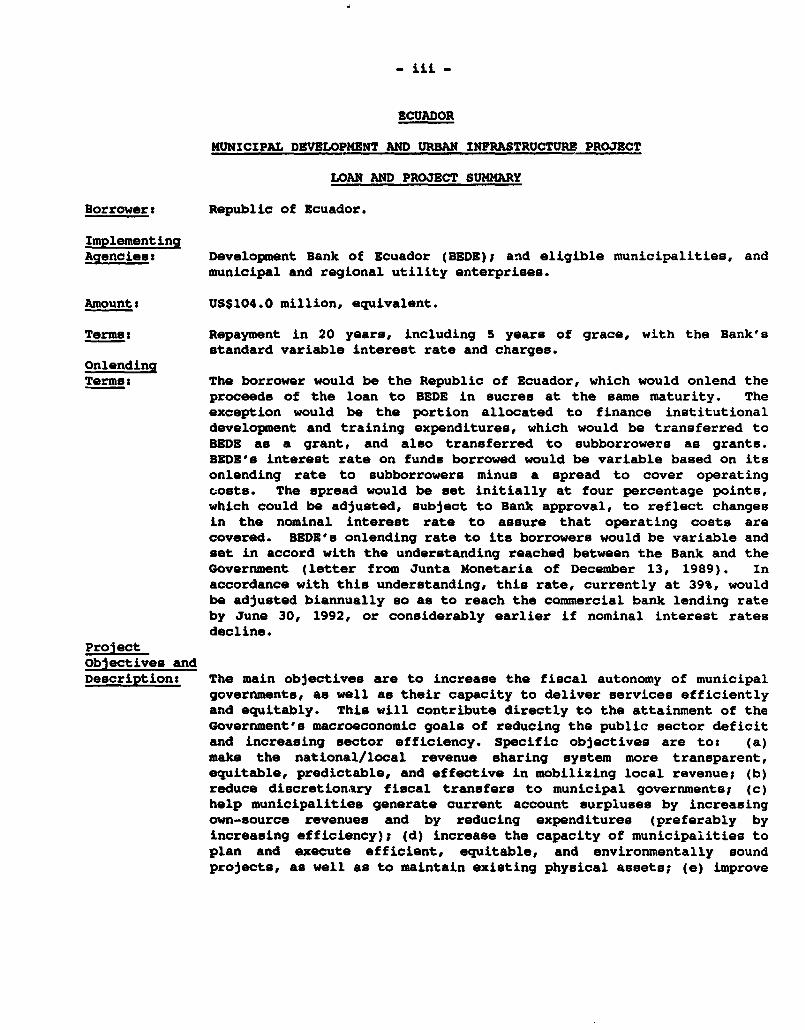
Borrower: Republic of Ecuador.
ImplementingAgencies: Development Bank of Ecuador (BEDE)I and eligible municipalities, and
municipal and regional utility enterprises.
Amount: US$104.0 million, equivalent.
Terms: Repayment in 20 years, including 5 years of grace, with the Bank'sstandard variable interest rate and charges.
OnlendingTerms: The borrower would be the Republic of Ecuador, which would onlend the
proceeds of the loan to BEDE in sucres at the same maturity. Theexception would be the portion allocated to finance institutionaldevelopment and training expenditures, which would be transferred toBEDE as a grant, and also transferred to subborrowers as grants.BEDE's interest rate on funds borrowed would be variable based on itsonlending rate to subborrowers minus a spread to cover operatingCosts. The spread would be set initially at four percentage points,which could be adjusted, subject to Bank approval, to reflect changesin the nominal interest rate to assure that operating costs arecovered. BEDE's onlending rate to its borrowers would be variable andset in accord with the understanding reached between the Bank and theGovernment (letter from Junta Monetaria of December 13, 1989). Inaccordance with this understanding, this rate, currently at 39%, wouldbe adjusted biannually so as to reach the commercial bank lending rateby June 30, 1992, or considerably earlier if nominal interest ratesdecline.
Projectobjectives andDescription: The main objectives are to increase the fiscal autonomy of municipal
governments, as well as their capacity to deliver services efficientlyand equitably. This will contribute directly to the attainment of theGovernment's macroeconomic goals of reducing the public sector deficitand increasing sector efficiency. Specific objectives are to: (a)make the national/local revenue sharing system more transparent,equitable, predictable, and effective in mobilizing local revenue; (b)reduce discretionary fiscal transfers to municipal governments; (c)help municipalities generate current account surpluses by increasingown-source revenues and by reducing expenditures (preferably byincreasing efficiency); (d) increase the capacity of municipalities toplan and execute efficient, equitable, and environmentally soundprojects, as well as to maintain existing physical assets; (e) improve
- iv -
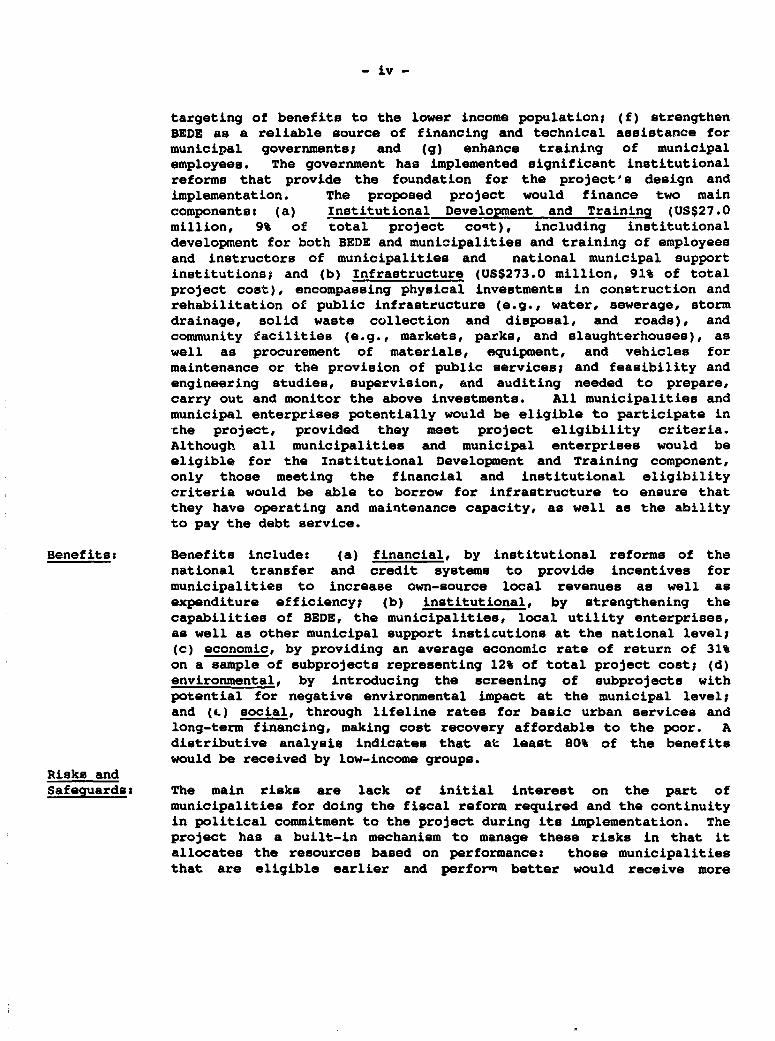
targeting of benefits to the lower income population; (f) strengthenBEDE as a reliable source of financing and technical assistance formunicipal governments; and (g) enhance training of municipalemployees. The government has implemented significant institutionalreforms that provide the foundation for the project's design andimplementation. The proposed project would finance two maincomponentes (a) Institutional Development and Traininq (US$27.0million, 9% of total project covt), including institutionaldevelopment for both BEDE and municipalities and training of employeesand instructors of municipalities and national municipal supportinstitutions; and (b) Infrastructure (US$273.0 million, 91% of totalproject cost), encompassing physical investments in construction andrehabilitation of public infrastructure (e.g., water, sewerage, stormdrainage, solid waste collection and disposal, and roads), andcommunity facilities (e.g., markets, parks, and slaughterhouses), aswell as procurement of materials, equipment, and vehicles formaintenance or the provision of public services; and feasibility andengineering studies, supervision, and auditing needed to prepare,carry out and monitor the above investments. All municipalities andmunicipal enterprises potentially would be eligible to participate inche project, provided they meet project eligibility criteria.Although all municipalities and municipal enterprises would beeligible for the Institutional Development and Training component,only those meeting the financial and institutional eligibilitycriteria would be able to borrow for infrastructure to ensure thatthey have operating and maintenance capacity, as well as the abilityto pay the debt service.
Benefits: Benefits include: (a) financial, by institutional reforms of thenational transfer and credit systems to provide incentives formunicipalities to increase own-source local revenues as well asexpenditure efficiency; (b) institutional, by strengthening thecapabilities of BEDE, the municipalities, local utility enterprises,as well as other municipal support insticutions at the national level;(c) economic, by providing an average economic rate of return of 31%on a sample of subprojects representing 12% of total project cost; (d)environmental, by introducing the screening of subprojects withpotential for negative environmental impact at the municipal level;and (e.) social, through lifeline rates for basic urban services andlong-term financing, making cost recovery affordable to the poor. Adistributive analysis indicates that at least 80% of the benefitswould be received by low-income groups.
Risks andSafeguards: The main risks are lack of initial interest on the part of
municipalities for doing the fiscal reform required and the continuityin political commitment to the project during its implementation. Theproject has a built-in mechanism to manage these risks in that itallocates the resources based on performance: those municipalitiesthat are eligible earlier and perform better would receive more
resources. The incentives built into the reformed transfer systemshould also stimulate the transfer of innovations from the lesssuccessful municipalities to the more succeseful ones. In addition tothese general risks, there is the possibility of inefficient projectmanagement by BEDS and the municipalities. This risk has beendiminished through technical assistance and training during projectpreparation, as well as the institutional development requirements inthe eligibility criteria. There ia also the risk of lack ofcontinuity in project management by municipallties due to staffturnover. This would be reduced by technical assistance in thepreparation of legielation to grant civil service status to municipalemployees. Finally, reforms already implemented might be abandoned.While real, this risk has been reduced through the embodiment nf thereforms in legislation as well as by specific related loan conditlons.
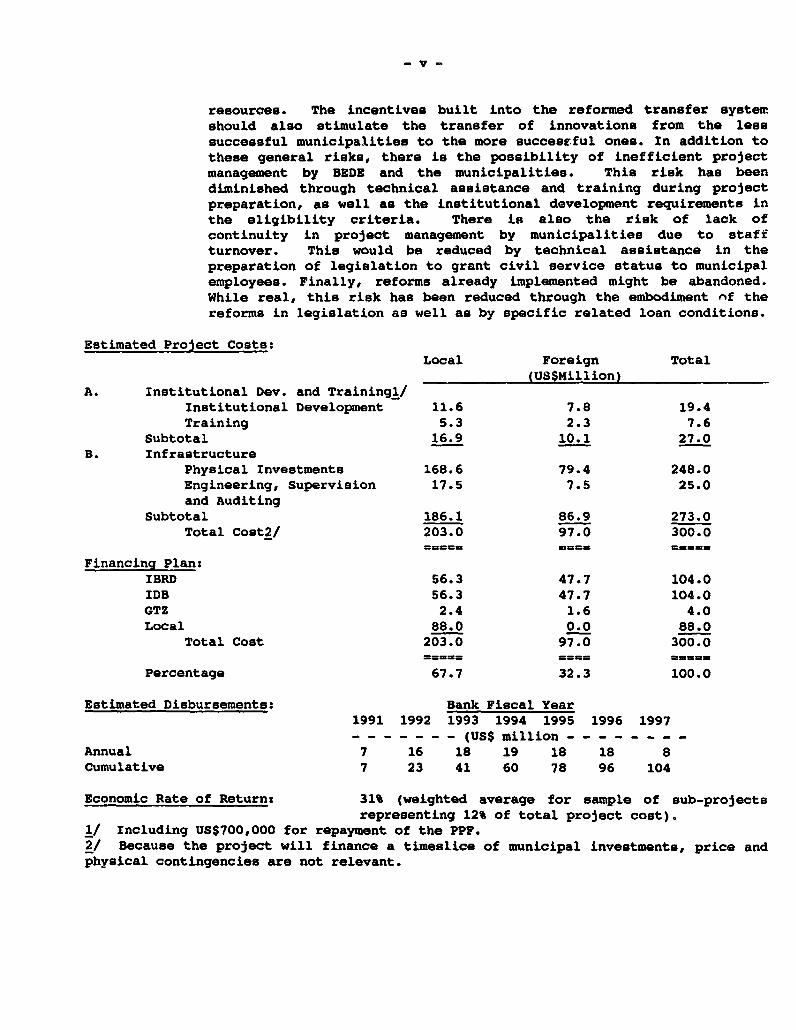
Estimated Project Costs:Local Foreign Total
(US$Million)A. Institutional Dev. and Trainingl/
Institutional Development 11.6 7.8 19.4Training 5.3 2.3 7.6
Subtotal 16.9 10.1 27.0B. Infrastructure
Physical Investments 168.6 79.4 248.0Engineering, Supervlsion 17.5 7.5 25.0and Auditing
Subtotal 186.1 86.9 273.0Total Cost2/ 203.0 97.0 300.0
Financing Plan:IBRD 56.3 47.7 104.0IDB 56.3 47.7 104.0GTZ 2.4 1.6 4.0Local 88.0 0.0 88.0
Total Cost 203.0 97.0 300.0
Percentage 67.7 32.3 100.0
Estimated Disbursements: Bank Fiscal Year1991 1992 1993 1994 1995 1996 1997- - … - - - - (US$ million
Annual 7 16 18 19 18 18 8Cumulative 7 23 41 60 78 96 104
Economic Rate of Return: 31% (weighted average for sample of sub-projectsrepresenting 12% of total project cost).
1/ Including US$700,000 for repayment of the PPF.2/ Because the project will finance a timeslice of municipal investments, price andphysical contingencies are not relevant.
ECUADOR
MUNICIPAL DEVELOPMENT AND URBAN INFRASTRUCTURE PROJECT
I. THE SECTOR
A. Backgrounds Rapidly Rising Demands and Declining Capacitv
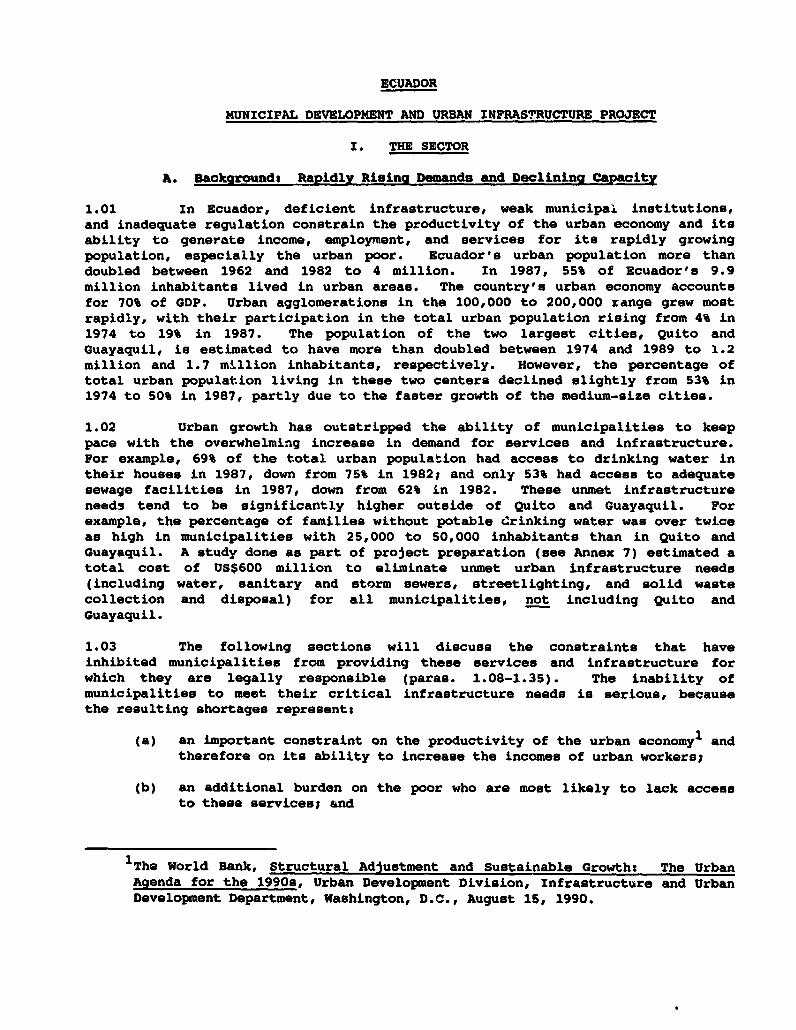
1.01 In Ecuador, deficient infrastructure, weak municipal. institutions,and inadequate regulation constrain the productivity of the urban economy and itsability to generate income, employment, and services for its rapidly growingpopulation, especially the urban poor. Ecuador's urban population more thandoubled between 1962 and 1982 to 4 million. In 1987, 55% of Ecuador's 9.9million inhabitants lived in urban areas. The country's urban economy accountsfor 70% of GDP. Urban agglomerations in the 100,000 to 200,000 range grew mostrapidly, with their participation in the total urban population rising from 4% in1974 to 19% in 1987. The population of the two largest cities, Quito andGuayaquil, is estimated to have more than doubled between 1974 and 1989 to 1.2million and 1.7 million inhabitants, respectively. However, the percentage oftotal urban population living in these two centers declined slightly from 53% in1974 to 50% in 1987, partly due to the faster growth of the medium-size cities.
1.02 Urban growth has outstripped the ability of municipalities to keeppace with the overwhelming increase in demand for services and infrastructure.For example, 69% of the total urban population had access to drinking water intheir houses in 1987, down from 75% in 1982; and only 53% had access to adequatesewage facilities in 1987, down from 62% in 1982. These unmet infrastructureneeds tend to be significantly higher outside of Quito and Guayaquil. Forexample, the percentage of families without potable drinking water was over twiceas high in municipalities with 25,000 to 50,000 inhabitants than in Quito andGuayaquil. A study done as part of project preparation (see Annex 7) estimated atotal cost of US$600 million to eliminate urmet urban infrastructure needs(including water, sanitary and storm sewers, streetlighting, and solid wastecollection and disposal) for all municipalities, not including Quito andGuayaquil.
1.03 The following sections will discuss the constraints that haveinhibited municipalities from providing these services and infrastructure forwhich they are legally responsible (paras. 1.08-1.35). The inability ofmunicipalities to meet their critical infrastructure needs is serious, becausethe resulting shortages represent:
(a) an important constraint on the productivity of the urban economyl andtherefore on its ability to increase the incomes of urban workers;
(b) an additional burden on the poor who are most likely to lack accessto these services; and
1 The World Bank, Structural Adjustment and Sustainable Growth: The UrbanAgenda for the 1990., Urban Development Division, Infrastructure and UrbanDevelopment Department, Washington, D.C., August 15, 1990.
2-
(c) environmental degradation, because sewage and solid waste are notbaing disposed of properly due to lack of the necessaryinfrastructure or failure to design and operate the systems properly.
B. Government Structure and the Provision of Public Services
1.04 Local governments in Ecuador include: 20 provinces, 162 cantones %ithconstituted municipalities, and about 1,000 other cantones withoutmunicipalities, mostly in rural areas. Municipalities are the primary politicaland administrative units of government and are headed by mayors (Alcaldes) whogovern together with a Municipal Councils both are elected for four years and areineligible for reelection. The number of municipalities increased from 105 in1974 to 162 today, an increase of 56% in 16 years. Unfortunately, the greatmajority of these are very small (many with less than 2,000 inhabitants),sometimes not large enough to provide efficiently even basic services.
1.05 Under the current Municipal Law, municipalities are responsible forplanning and delivery of various urban services including water supply andsewerage, drainage, solid waste, construction and maintenance of streets, parksand other green spaces, streetlighting, and construction and operation ofslaughterhouses and markets. Provincial Councils provide most of the services inrural areas, especially construction of rural roads. Article III of theMunicipal Law grants full autonomy to municipal governments to: (a) set andcollect property taxes, as well as user fees and tariffs for basic urbanservices; (b) plan, finance and implement investments; and (c) operate andmaintain basic services.
C. Government's Request for Assistance and the Sector Policy Letter
1.06 In December 1988, the Government of Ecuador, through a letter fromthe Minister of Finance, requested assistance from the Bank and IDB for a project"to change the concept of financing works and expenditures, to modify therelationship of dependence on Central Government funds, and to increase thegeneration of local resources, thus providing greater autonomy to localgovernments." Early in project identification, IDB and the Bank agreed tocooperate in the development of a Municipal Development and Urban InfrastructureProject that could be cofinanced by both banks. The GTZ (German TechninalAssistance Organization) soon joined this cooperative effort to provide technicalassistance in the preparation of this Project. The extraordinarily high level ofcooperation and integration of the Bank, IDB, and GTZ teams in projectpreparation made it possible to attain full agreement on project objectives,procedures, evaluation criteria, and on procurement guidelines for local bidding.These agreements are precedents that should greatly facilitate cofinancing withIDB and GTZ in future operations.
1.07 The ensuing dialogue of the Government with IDB, GTZ, and the Bankresulted in an agreement with the Government for a two-stage strategy, involving:(a) a program of significant institutional reforms; and (b) a project that wouldbuild on these reforms to increase further the autonomy of municipal governments.
-3-
Through this dialogue and the reports done to develop an overall sector
strategy, a far-reaching program of rfforms was developed and included in a
policy letter of the Government to the Bank (see Annex 2). This letter addressedthree main problem areas: (a) general institutional and legal constraints to
municipal development; (b) the system of intergovernmental national/local
transfers; and (c) lending to local governments. As will be discussed in the
following sections, the most important of these reforms were embodied in the
Local Goverr4,ient Development Law (LGDL) of May 1990.3
D. Institutional and Legal Co:sstraints for Provii.on of Public Services
1.08 There are numerous institutional and legal constraints that make it
difficult for municipalities to exercise their legal responsibilities for
providing urban services. The following sections will review these constrairnts
and the program of institutional reforms adopted to resolve them.
The Constraints
1.09 Legal Constraint for Full Cost Recovery. Municipalities were allowed
under the previous Municipal Law to recover only operation and maintenance costs
of water and sewer systems through user charges, but not the cost of investment.
Existing water tariffs are exceedingly low in most municipalities. Average
tariffs are well below the marginal cost of new suppliea. For one large new
project in Quito, the average tariff was less than a tenth of the marginal cost.
On average, municipalities currently recover only about 30% of operating and
maintenance costs for sewer and water; and many municipalities recover far less.
Recent studies show willingness to pay more for water to avoid the high costs of
purchasing it from tank cars.
1.10 Lack of Coordination of Central Government Entities Working in Urban
Areas. Several agencies of the Central Government oversee or are responsible for
providing administrative, technical, and financial support to the municipalities.
The Ministry of Government regulates the creation of new municipalities. The
Ministry of Finance and Public Credit administers transfers to the local
governments through the National Revenue Sharing Fund (previously FONAPAR, now
FODESEC, the Local Government Development Fund). The National Development
Council (CONADE) approves the municipal annual budgets and determines tha
priority of the municipal projects presented for domestic and foreign financing,
2The World Bank, "Local Governments," Ecuador: Public Sector Finances:
Reforms to Foster Growth in the Era of Declining Oil Output, Country
Department IV, Latin American and the Caribbean Region, August 22, 1990.
3Ecuador, "Ley de Desarrollo Seccional y de Reformas a las Leyes de Regimen
Municipal, Regimen Tributario Interno, Arancelaria, Organica de
Administracion Financiera y Control y 006 de Control Tributario y
Financiero," May 1990.
-4-
thc latter mainly through credits of the Development Bank of Ecuador (BEDE). TheNait3.onal Pre-investment Fund (FONAPRE) lends and provides 4-echnical assistancefor preinvestment studies for public and private entities. The NationalSueretariat for Administrative Development (SENDA) was created in 1989 to developplolicy for improvement of management in public and private entities by upgradingiiyntor,, and developing integrated national training programs. The Ministries of1;ilAu Work,s, Education ard Health as well as the Iretitutes of Sanitary Works'.;)- arui Electrification of Ecuador (INECEL) execute works or provide servicesto mtAUcipal jurisdictions. There is a. considerable ambiguity on the role androuponeibilities of these institutions and a lack of coordination of theiractivities. The result is bureaucratic conflict and delay with very lowo2fctivenoss in fulfillment of these roles and responsibilities.
Lack of Qualified Staff. The scarcity of qualified staff is one ofi:tio ohi.f constraints to the development of municipalities, causing: reducedmobil)zation of local financial resources, inefficient investment plans, andinioff,ctive operation and maintenance of basic municipal services. Although theiatiibx o- municipal workers is more than adequate (about 1.2 municipal employeesior every 1,000 inhabitants), most are unskilled. Only the largest cities haveotaff with the technical capacity to prepare multiyear investment programs anddesign new projects. Municipalities have a total staff of about 35,000, and thenational support institutions (BEDE, CONADE, AME, etc.) employ about 700.Ettimates of the percentage of municipal personnel by employment category are asfullowss 7% managers and professionals; 31% technical and administrative; and62% manual workers. In general, the levels of education and qualification varywidely by location and size of municipality. For example, while in Machala(Costa) and Puyo (Oriente) only 6.7% and 14.3%, respectively, have completedprimary education, in Ibarra (Sierra), this percentage rises to 24.5%. Theevidence indicates that at the management and professional levels the two majorproblems are: (a) the incompatibility between staff qualification and jobrequirements; and (b) high turnover due to the change of mayor every four years.
1012 Inadequate and Poorly Coordinated Training Programs. Problemsaffecting the municipalities and municipal support institutions are amplified andoften the direct result of insufficient training. During the last 7 years onlyabout 2,000 persons (representing roughly 5% of the potential total) received anytraining at all. Furthermore, the training programs that exist lack: (a)eotablished iolicy, strategy, and objectives; (b) mechanisms for thecoordinatior planning and implementation of the training programs; (c) soundtraining need assessment; (d) managerial knowledge of personnel administvationand training; and (e) human and financial resources to carry out the trainingactivities.
lo 11 Insufficient Controls on Increases in Municipal Payrolls. MunicipalLaw (Chapter III, Article 40) allows municipalities to establish their own systemof personnel administration (including sala&.ies, promotion, and careerdevelopment). Howeve;., until recent reforms, municipalities normally preferredto follow the civil service of the Central Government, including its salary laws.It was common practice to raise salaries in accord with the national laws even if
- 5 -
no municipal budgetary resources were available--and then to go to the CentralGovernment for a transfer to cover the resulting deficit. Municipalities alsooften hired new employees with no budget to pay them, expectinc discretionarytransfers to cover the cost.
Reforms to Reduce the Institutional and Legal Constraints
1.14 These constraints have been addressed in the following legal oradministrative reformsa
1.15 Enactment of Legislation to Permit Full Cost Recover$r for Sewer andWater Systems. The LGDL of May 1990 permits full cost recovery for water andsewer projects.
1.16 Improved Coordination of Central Government Agencies inMunicipalities. A "Project Committee" will be established in BEDE and will bechaired by its General Manager. All Government organizations with a role inurban development would be represented on this Committee, including the Ministryof Finance, BEDE, IEOS, CONADE, FONAPRE, and SENDA. The role of this Committeeis to: (a) determine the priocity of the projects presented for financing; (b)determine the type of studies required for each project; (c) suggest to theGovernment future policies and possible legal reforms regarding municipalitiesand municipal support institutions; and (d) periodically review progress onproject completion. In other words, this Committee would seek to assureconsistency among municipal investment, institutional development, and trainingprograms. As a condition of effectiveness for the proposed project, the membersof the BEDE Pro3ect Committee would have been appointed and such Committee wouldhave begun to exercise its duties in a manner satisfactory to the Bank.
1.17 Passage of Legislation Controlling Increases in the MunicipalPayroll. Under clauses of the LGDL, municipalities cannot raise wages orcontract new employees unleas they have sufficient resources in their budgets topay them. The proposed project will build on this by assisting municipalities todevelop more effective personnel policies. At negotiations, it was agreed thatBEDE, with the assistance of SENDA, will develop a model career development planfor municipal civil servants designed to ensure their greater employmentstability. Taking into account the Bank's comments, BEDE will requiremunicipalities to adopt, as part of their subloan agreement, a career developmentplan for its employees consistent with the model plan, The terms of referencefor the plan itself will be presented to the Bank as a condition of effectivenessand the plan will be completed within the first six months after loaneffectiveness.
1.18 Improvement of the Coordination and Quality of Municipal TrainingPrograms. The Government selected SENDA to coordinate municipal trainingprograms and to form the nucleus of the central national coordination unit.Expanded training under the proposed project will be provided largely by theAssociation of the Municipalities of Ecuador (AhE) through the National Institutefor Municipal Development (INFODEM). AMR is a non-governmental entity with
- 6 -
representatives from all municipalities that was created in 1978 to safeguardmunicipal autonomy, provide technical assistance and training to municipalities,and coordinate municipal investment plans with those of the Central Government.
1.19 A Steering Committee headed by SENDA's secretary and composed ofsenior officials of BEDE, FONAPRE, AME, CONADE would be established to provideadvice in policy, coordination, implementation, evaluation, and financing of thetraining programs within three months after loan effectiveness. The coordinationof training programs for BEDE, FONAPRE, and INFODEM staff will be consolidated bySENDA to avoid overlapping activities and to facilitate participation of staff inprograma of common interest.
1.20 Training programs for about 580 staff of the municipal supportinstitutions (mainly BEDE and FONAPRE) and for about 460 staff of the first groupof municipalities selected to participate in the project were partially financedby the PPFs from IBRD and IDB. These efforts proved useful in improving thedesigri of the project's training programs, as well as providing training forthose who wiLl participate during its first year.
B. Reform of Intergovernmental Fiscal Relations
1.21 Lack of transparency, predictability, sustainability and equity inthe transfer system. Before the reforms, there were significant incentives inthe national/local transfer system for municipalities to run fiscal deficits andfor expenditure inefficiency. Municipalities would run up high fiscal deficitsas a way to pressure the Central Government for more discretionary grants. Thesegrants were often awarded to municipalities in direct proportion to their fiscalirresponsibility (see Annex 3), as in the case of transfers to cover payrollincreases (para. 1.13). As discretionary grants were readily available duringthe oil boom years in the 1970s, municipalities used them in lieu of raisingtheir own taxes and user charges. FONAPAR was set up in 1971 to make revenuesharing more predictable and transparent; however, by 1988 its automatic revenuesharing component constituted only about 30% of total transfers. FONAPAR'stransfers for investments (about 20% of total transfers in 1988) were not madebased on transparent and predictable criteria. In addition to the transfers,investment projects were often carried out in the municipalities by CentralGovernment agencies with only minimal participation by local governments inplanning. Furthermore, there was litt'le analysis of the capacity of thesegovernments to maintain adequately, operate, and recover costs for the completedprojects, or of their commitment for so doing. Technical, economic,environmental and financial evaluation of projects was very weak or nonexistent,
1.22 In summary, the transfer system provided incentives for fiscalbehavior that ran counter to objectives of lower deficits and greater efficiencyin the public sector. After the decline of oil revenues and total transfers, theunsustainability and counterproductive aspects of this transfer system becameincreasingly evident. However, the disincentives for local fiscal effort (para.1.21) kept local own-source revenues at about the same levels. For this reason,total municipal revenues from both own and national sources dropped from 2.5% of
-7
GDP in 1982 to only 1.5% in 1988, creating a serious decline in revenueBnocessary to meet the burgeoning demographic demand for municipal services (para.1.01).
1.23 The removal of the disincentives for local fiscal effort shouldencourage local governments to take advantage of the wide margin for increasedmobilization of resources and improved expenditure efficiency. About 55% ofmunicipal revenues derive from taxes on real estate, transfers of ownership, andprofits from sales. The reBt come from taxes on business activities andvehicles, and user fees, including tariffs and betterment levies. cadastres areout of date, billing and collection procedures inefficient, and cost recoveryfrom services quite low. There is also much room for improvement in expenditureefficiency.
1.24 Per capita transfers from the Central to local governments have notbeen highly correlated with poverty indicators or unsatisfied basic needs which,in turn, are "proxies" for lack of fiscal capacity. Thus, municipalities withrelatively high fiscal capacity often received higher per capita transfers, thanthose with low capacity (see Chart 3.1 in Annex 3). This perceived lack offairness of the system makes it difficult for the Central Government to resistthe demands of municipalities for discretionary grants.
1.25 Reform of the Transfer System. The reform cf the LGDL made thetransfer system more transparent, predictable, sustainable, and equitable (seeAnnex 3). Under the new law, FODESEC (Fondo de Desarrollo Seccional) replacesFONAPR and will receive i ;ut the same share of national fiscal resources (seeAnnex 3). The total amount to be distributed annually by FODESEC should exceedUS$87.1 million in 1991 versus total transfers from all sources to municipalitiesof US$90 million in 1988 of which less than a third came from the automatictransfers from FONAPAR.
1.26 Of this total, the 2% from the non-earmarked current revenues of theNational budget goes to provincial capitals; the remainder is div'ded as follows:75% for municipalities, 20% for provinces, and 5% for the emergency fund. Forthe municipal share, 60% would go to automatic revenue sharing and 40% to theMunicipal Investment Fund (MIF). Given the budget estimates for 1991, this wouldmean US$23.9 million for revenue sharing and US$15.9 million for the MIF. Thefollowing three criteria will be used in automatic distribution: (a) 60% bypopulation; (b) 30% by poverty; and (c) 10% by fiscal effort in relation tofiscal capacity. Chart 3.2 in Annex 3 shows the distribution of the total amountof FODESEC in accord with these different criteria. This automatic revenuesharing will reduce the incentives for fiscal irresponsibility and also make thesystem more equitable, in that municipalities with higher poverty and thereforeless fiscal capacity, will get higher per capita shares. As a condition ofeffoctiveness, the Ministry of Economy and Finance would have established all ofthe operational procedures for automatic revenue sharing, including theoperational definition and calculation of all indicators to be used in theallocation.
1.27 The LGDL specifies that the 40% going to the MIF will be transferredto BEDE and serve as counterpart fo.: the proposed project. The MIF will thenserve as a predictable, transparent, and sustainable source of counterpartfunding for eligible subborrowers. Moreover, all eubprojects to be supportedunder this project must meet the rigorous economic, financial, environmental andtechnical evaluations of BEDE. Eligible subborrowers (para. 2.10-2.16) willhave access to the MIF in three different ways: (a) onlending from BEDE; (b)grants to compensate subborrowers for the lose of revenue from lifeline ratescharged to the lower income families unable to pay the full cost of the followingbasic services: water, sanitary and storm sewers, solid waste and neighborhoodimprovement (see para. 2.20 for method of calculation); and (c) grants asincentives for current account saving. The grants for current account surpluswill serve as an added incentive for municipalities to increase their fiscalautonomy.
1.28 It was agreed by BEDE at negotiations that transfers from the MIF forthe first year will be as follows: (a) a minimum of 10% for onlending; (b) amaximum of 40% for grants for lifeline rates; and (c) a maximum of 50% for theincentives for current account surplus. During the first year, BEDE will onlendto the eligible subborrowers wishing to receive this incentive, then deduct themarginal increase in current account surplus from the principal of the loan atthe end of the year. At negotiations, BEDE agreed to put into effect amethodology, satisfactory to the Bank, for allocation by each of these threecriteria foL the remaining years of project implementation based on the analysisof the municipal financial and institutional action plans within the first 10months of loan effectiveness (para. 5.02). To the extent shown viable in thisanalysis, the grants for lifeline rates should decline and incentives to currentaccount surplus increase to augment the fiscal autonomy of the municipalities.This methodology should also monitor the distributive impact of the criteria usedin revenue sharing. For example, it will be important to know if the transferfrom revenue sharing would enable municipalities with a "reasonable" fiscaleffort and expenditure levels to balance their current accounts. If not, thecriteria might be altered or other steps taken (e.g., combine municipalities thatare too small to be fiscally viable).
1.29 In summary, the LGDL sets up a more predictable, transparent,equitable and sustainable transfer system. At negotiations, the Governmentagreed that the LGDL will not be modified in any way that would reduce itseffective contribution to project objectives.
F. Strengthening BDUE as a Lender and Provider of Technical Assistance
1.30 BEDE and Its Previous Policies. BEDE was established in 1976 as anautonomous financial institution to provide financing for public sector projectsand programs related to the socioeconomic development of Ecuador. BEDE's boardis chaired by the Minister of Finance; its operations are under a GeneralManager; and it is regulated by the Superintendencia de Bancos. BEDEIs mainsource of capital is from Government transfere.
-9-
1.31 BEDE's policy of lending at fixed interest rates of about 12% causedrapid decapitalization in real terms when the annual inflation rates jumped from27% in 1986 to 86% in 1988 causing annual markst interest rates for 90-day CDs toescalate from 23% in the first quarter of 1986 to 65.3% in May 1990. Theresulting highly negative interest rates caused the real value of BEDE's loanportfolio to fall from US$979.7 million in 1986 to only US$133.2 million in 1989,an annual rate of 39.3%. Net real earnings plummeted by an annual rate of 42.1%and real interest revenues dropped from US$148.6 million in 1986 to only US$18.5million in 1989. BEDE's net worth dropped from US$1.4 billion in 1986 to onlyUS$134 million in 1989 for two main reasons: (a) the drop in net earnings; and(b) the decline in capital transfers from oil due to the drop in theinternational price of oil and the sharp reduction of output after the 1987earthquake. The current rise in oil prices will be counteracted in part by theexpected decline of oil output due to the exhaustion of reserves.
1.32 Institutional Reform and Capitalization of BEDE. Reform of BEDE'sinterest rate policy is essential to assure its financial health. The Governmentand BEDE have agreed to an interest rate reform under which BEDE would graduallyincrease its interest charges to market levels on loans to local governmento andother governmental entities in accord with the interest rate agreement betweenthe Government and the Bank (para. 2.18). To capitalize BEDE, it would retain upto 25% of the amount borrowed from the Government as an equity contribution fromthe '^overnment, subject to review by the Government which could increase thepercentage repayment in accord with its overall macroeconomic objectives and theevolution of BEDE's capital base. In light of legislation passed after appraisalsetting up the Provincial Development Fund, which significantly increased thetotal transfers of the Government to BEDE, it was agreed at negotiations thatBEDE willt (a) commission a study with terms of reference and consultantacceptable to the Bank to: (i) develop a methodology for determining the"adequate" level of capitalization to meet its objectives as the primary lenderto the public sector; (ii) revise the estimates of the total amount of capitalassistance to BEDE under current and pending legislation; (iii) recommendappropriate corrective actions if necessary to correct any imbalance between suchcapital requirements and the availability of funds; (b) submit such study to theBank for comments promptly upon its completion; and (c) take into account theBank's comments and take all steps necessary to adopt such recommendations. Thestudy will be done within six months after loan effectiveness. BEDE's financialperformance would be monitored under the project (para. 2.19).
1.33 During project preparation, BEDE commissioned a comprehensivemanagement study (financed in part by the PPF) to determine how it could bestincrease its institutional capacity for the implementation of the proposedproject. Following the recommendations of this study, BEDE completelyreorganized its administrative structure (see organization charts in Annex 5) todeal more effectively with its expanded lending program and increased role as aprovider of technical assistance to municipalities. To improve projectevaluation (a major weakness in the past), a separate Project Evaluation Divisionwas created within the Technical Department with four separate sectors devoted toenvironmental, technical, financial and economic evaluation. To avoid the
- 10 _
implementation problems suffered by other Bank projects in Ecuador due to thehigh turnover of key project staff, BEDE agreed at negotiations to: (a) maintaina person with qualifications and experience satisfactory to the Bank who would beresponsible for the coordination of the Project (Project Coordinator); (b)establish the Project Coordinator as a department management-level position(under BEDE's internal rules, hiring or removal at the departmental levelrequires the permission of the Board of Directors); (c) make appointment orremoval of high-level staff assigned to work under the supervision of the ProjectCoordinator for purposes of the Project *:o be the sole responsibility of BEDE'sBoard of Directors, such appointment or removal to be made on the basis ofrecommendations of the Project Coordinator. As a condition of effectiveness,BEDE's Board of Directors would have issued a directive to establish thesestaffing procedures.
1.34 During project preparation, BEDE contracted with GTZ to producefinancial simulation models for its own use and for developing financial actionplans for municipalities (see Annex 4). To use these models, BEDE formed a newteam of professionals. Financial and institutional action plans for the 18municipalities given technical assistance under the pilot project (partiallyfinanced by the PPF) have been completed (para. 3.08).
0. Sector Development Issues, Objectives, and Bank Lending Strategy
1.35 The sector lending strategy is twofold, in that it aims tot
(a) Induce institutional reforms that:
i) encourage reforms to the current transfer and credit systems toprovide strong incentives for increased fiscal responsibilityand expenditure efficiency at the local level (see paras. 1.21-1.24); and
(ii) strengthen the institutional capacity of municipalities torespond to these new incentives.
(b) Based on this program of reforms, the proposed project would assistmunicipalities in increasing their fiscal autonomy and in reducingtheir shortfalls of urban services and infrastructure in an efficientmanner.
1.36 Although the recent events in the Middle East and the resulting risein oil prices make neceesary constant updating of the country's macroeconomicstrategy, the basic elements relevant to this project remain valid. To exploitfully its productive potential and to alleviate pervasive poverty, the countrywill have to replace the exhausted growth model of the 1970s with medium-termpolicies aimed at accomplishing two fundamental changes in the economy: (a)redefinition of the role of the public sector, and (b) elimination of theexisting protectionist trade regime and constraining labor market policies. Thepublic sector should use most of its oil revenues to finance puk.-lic and private
- 11 -
investment rather than consumption. Within this strategy, the local publicsector should: (a) rely less on subsidies from the Central Government and moreon its own revenues, and (b) increase its expenditure efficiency.
H. Prior Bank M!2erience
1.37 The Bank has financed a number of operations related to the urbansector since 1980. Bank assistance to the urban seotor in Ecuador began with theGuayaquil Urban Development Project (Loan 1776-EC) that became effective in 1980.This US$31 million loan was designed to demonstrate alternative low-costapproaches to providing services to poor beneficiaries with minimum subsidies.Its PCR concluded that this project had a positive impact on the implementinginstitutions at the national level, but was not succeesful in improvingmanagerial and financial capability at the municipal level. Following thisproject, there have been two housing loans to Ecuador. The first loan (Loan2135-EC) in the amount of US$35.7 million closed in 1988. Its PCR indicates thatit succeeded in demonstrating the feasibility of low-cost sheter alternativesand introducing concepts of affordable standards, coet recovery, andreplicability criteria into government housing programs. The follow-up housingloan (Loan 2898-EC) sought to build on the achievements of this first loan byintroducing new interest rate policies and a new mortgage instrument designed toimprove housing affordability. Unfortunately, loan performance has been poor dueto the rapidly rising rates of inflation and the weakness of the implementinginstitution. The Bank is supervising this project closely. FONAPRE received atechnical assistance loan (S-006-EC) of US$11 million in 1977. The PCR showsthat after a very slow start due to bureaucratic delays, the pace of projectexecution improved, resulting in the following achievements: completion of majorpreinvestment studies, good progress in its own institutional development, andthe preparation of a proposal for improving the legislation governing consultingactivities. The Second Guayaquil and Guayas Province Water Supply Project (Loan2135-EC) is currently suspended. The reason for this was that the implementingagency was abolished and responsibility for the sector transferred to a newentity after a serious deciine in the financial and institutional capacity of theoriginal entity. Recent efforts made to improve project performance have beeneffective, and the suspension is expected to be lifted soon with the new entitytaking over as borrower. In 1988, the Bank discussed the results of its UrbanWater Supply and Sewerage Sector Study with the Government and its mainrecommendations were adopted in the design of this project. The Public SectorManagement loan (2516-EC) financed consultants who contributed to the design ofthe reform of the revenue sharing system.
I. Rationale for Bank Involvement
1.38 The rationale for the Bank's involvement to date has been to helpdevelop the overall macroeconomic strategy in which the individual localgovernment reforms (e.g., revenue sharing, municipal legislation, and BEDE) are
- 12 -
integral parts.4 The Bank's continued involvement through the proposed projectwill help the Government to implement this strategy to maximum benefit at boththe national and local levels. Furthermore, the Bank can facilitate themobilization of cofinancing when appropriate and strengthen institutions throughthe introduction of new technologies in such areas as budgeting, informationsystems, and environmental assessment.
II. THE PROJECT
A. Project Origin
2.01 This project evolved from the Government's initial request forassistance in the design of a program of institutional reforms that form thisproject's institutional foundation (paras. 1.06-1.07). The project also draws onthe experience in municipal development and finance gained in similar projects inBrazil (Loan Nos. 2343-BR and 2623-BR) and in Argentina (Loan 2920-AR), whichalso seek to increase the fiscal autonomy of local governments by increasing boththeir capacity to mobilize resources and to spend efficiently.
B. Proiect Obiectives
2.02 The objectives of both the program of institutional reforms alreadydiscussed and the proposed project are essentially the same. The main objectivesare to increase the fiscal autonomy of municipal governments, as well as theircapacity to efficiently and equitably deliver services. This will contributedirectly to the attainment of the Government's overall macroeconomic goals ofreducing the public sector deficit and increasing its efficiency and equity.Specific objectives are to support governmental initiatives to:
(a) modify the national/local revenue sharing system to make it moretransparent, equitable, predictable, and effective in mobilizinglocal revenue;
(b) reduce discretionary fiscal transfers to municipal governments;
(c) help municipalities generate current account surpluses by increasingown-source revenues (especially user charges) and by reducingexpenditures (preferably by increasing efficiency);
(d) increase the capacity of municipalities to plan and executeefficient, equitable, and environmentally sound projects, as well asto maintain existing physical assets;
(e) improve the targeting of benefits to the lower income population;
4The World Bank, "Local Goverrments", op. cit.
- 13 -
(f) strengthen BEDE as a reliable source of financing and technicalassistance for municipal governments; and
(g) enhance the training activities in municipalities and of themunicipal support institutions at the national level.
C. Project DescriDtian
2.03 The proposed project (1991-1997, US$300 million) would financetechnical assistance and training and also onlending from BEDE for civil worksand equipment to eligible subborrowers: municipalities, and municipal andregional utility enterprises (hereafter municipal enterprises). The proposedBank project would finance about 35% of total project cost. BEDE's ProjectOperation Manuals would provide key implementation arrangements to assure projectobjectives would be attained.
2.04 The Project would finance two main componentos
(a) Institutional Development and Training (US$27.0 million, 9% of totalproject cost) including:
(i) institutional development (US$19.4 million, 6.5% of total cost)for both BEDE and municipalities; and
(ii) training (US$7.6 million, 2.5% of total cost) of about 1,100employees of national municipal support institutions (e.g.,BEDE, FONAPRE, SENDA and AME) and about 6,000 municipalemployees and instructors (i.e., training of trainers); and thecoordination of training activities.
Both institutional development and training would focus on such areasas the creation or improvement of: planning and budgeting systems;cadastres; general organization and management; personnel policy; taxadministration; and project preparation and evaluation, includinganalysis of environmental impacts. This component would finance thefollowing, related to the above areas: fees for consultants andinstructors, courses, travel and subsistence, teaching materials,office supplies and equipment (e.g., vehicles, computers,audiovisuals and furniture). No civil works construction would befinanced under this component. See Annex 6 for details.
(b) Infrastructure (US$273.0 rillion, 91% of total cost) encompassing:
(i) physical investments (US$273 million, 83% of total cost) inconstruction and rehabilitation of public infrastructure (e.g.,water, sewerage, storm drainage, solid waste collection anddisposal, and roads), and community facilities (e.g., markets,parks, and slaughterhouses), as well as procurement of
- 14 -
materials, equipment and vehicles for maintenance or theprovision of public services; and
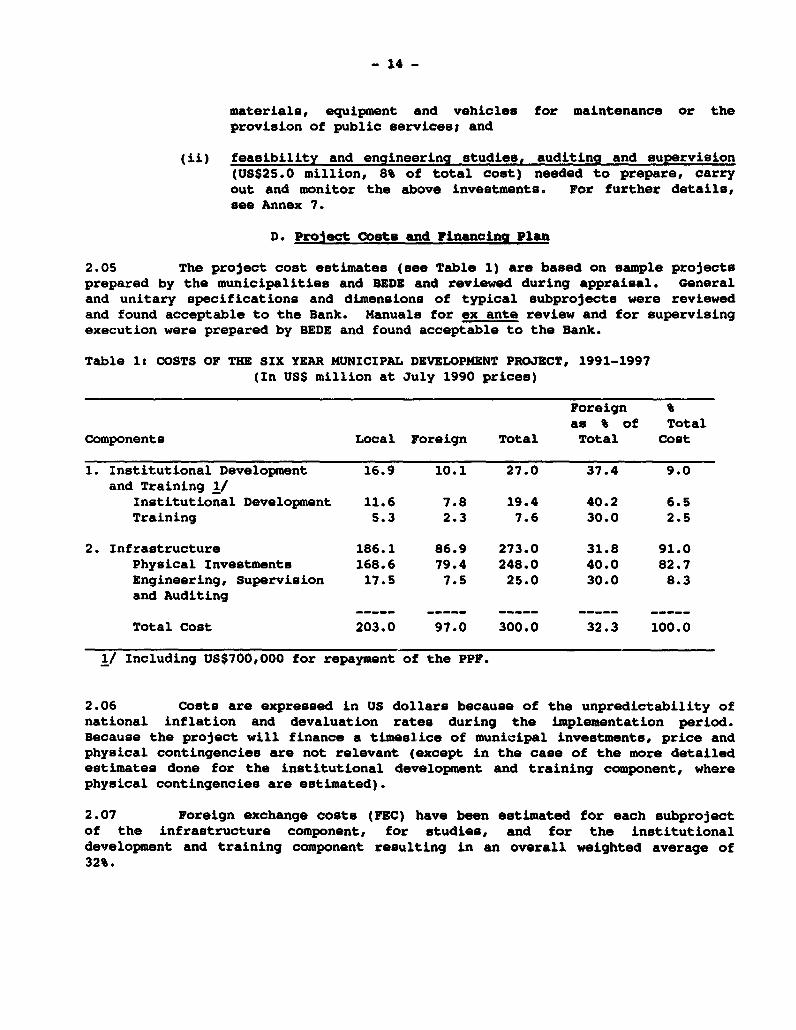
(ii) feasibility and engineering studies, auditing and supervision(US$25.0 million, 8% of total cost) needed to prepare, carryout and monitor the above investments. For further details,see Annex 7.
D. Proiect Costs and Financina Plan
2.05 The project cost estimates (see Table 1) are based on sample projectsprepared by the municipalities and BEDE and reviewed during appraisal. Generaland unitary specifications and dimensions of typical subprojects were reviewedand found acceptable to the Bank. Manuals for ex ante review and for supervisingexecution were prepared by BEDE and found acceptable to the Bank.
Table 1: COSTS OF THE SIX YEAR MUNICIPAL DEVELOPMENT PROJECT, 1991-1997(In US$ million at July 1990 prices)
Foreign as % of Total
Components Local Foreign Total Total Cost
1. Institutional Development 16.9 10.1 27.0 37.4 9.0and Training 1/
Institutional Development 11.6 7.8 19.4 40.2 6.5Training 5.3 2.3 7.6 30.0 2.5
2. Infrastructure 186.1 86.9 273.0 31.8 91.0Physical Investments 168.6 79.4 248.0 40.0 82.7Engineering, Supervision 17.5 7.5 25.0 30.0 8.3and Auditing
Total Cost 203.0 97.0 300.0 32.3 100.0
1/ Including US$700,000 for repayment of the PPF.
2.06 Costs are expressed in US dollars because of the unpredictability ofnational inflation and devaluation rates during the implementation period.Because the project will finance a timeslice of municipal investments, price andphysical contingencies are not relevant (except in the case of the more detailedestimate. done for the institutional development and training component, wherephysical contingencies are estimated).
2.07 Foreign exchange costs (FEC) have been estimated for each subprojectof the infrastructure component, for studies, and for the institutionaldevelopment and training component resulting in an overall weighted average of32%.
- 15 -
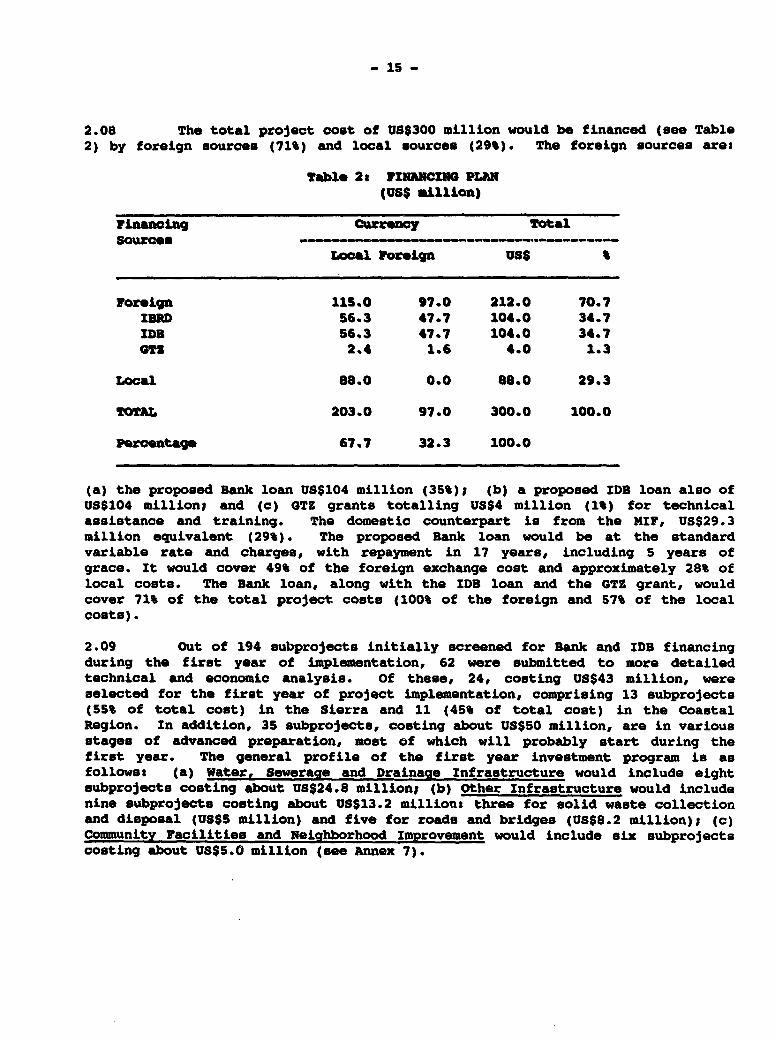
2.08 The total project cost of US$300 million would be financed (see Table2) by foreign sources (71%) and local sources (29%). The foreign sources ares
Table 28 P1NANCING PLAN(US$ mlllon)
Financing Currency TotalSources__
Local Poreign US$
Forelgn 115.0 97.0 212.0 70.7IBRD 56.3 47.7 104.0 34.7IDB 56.3 47.7 104.0 34.7GTS 2.4 1.6 4.0 1.3
Local 88.0 0.0 88.0 29.3
TOTAL 203.0 97.0 300.0 100.0
percentage 67.7 32.3 100.0
(a) the proposed Bank loan US$104 million (35%)l (b) a proposed IDB loan also ofUS$104 million; and (c) GTZ grants totalllng US$4 mlllion (1%) for technicalaseistance and tralnlng. The domestic counterpart li from the NIr, US$29.3million equivalent (29%). The proposed Bank loan would be at the standardvarlable rate and charges, with repayment in 17 years, including 5 years ofgrace. It would cover 49% of the foreign exchange cost and approximately 28% oflocal costs. The Bank loan, along with the IDB loan and the GTZ grant, wouldcover 71% of the total project costs (100% of the foreign and 57% of the localcosts).
2.09 Out of 194 subprojects inltlally screened for Bank and IDB flnanclngdurlng the first year of implementatlon, 62 were submltted to more detalledtechnical and economlc analysis. Of these, 24, costing US$43 million, wereselected for the flrst year of project implementation, comprlslng 13 subprojects(55% of total cost) ln the Sierra and 11 (45% of total cost) in the CoastalReglon. In addltlon, 35 subprojects, costlng about US$50 milllon, are ln variousstages of advanced preparation, most of which will probably start during theflrst year. The general profile of the flrst year lnvestment program is asfollows: (a) Water, Sewerage and Drainage Infrastructure would include eightsubprojects costing about US$24.8 million; (b) Other Infrastructure would includenine subprojects costing about US$13.2 millions three for solid waste collectlonand disposal (US$S million) and flve for roads and brldges (US$8.2 milllon); (c)Communlty Facliltles and Neiqhborhood Improvement would include six subprojectscostlng about US$5.0 million (see Annex 7).
16
E. Eligibility Criteria
2.10 All municipalities and municipal enterprises potentially would beeligible to participate in the project, provided they meet project eligibilitycriteria. However, to assure sufficient funds for Quito and Guayaquil, while notdepriving the smaller municipalities of much needed resources, no subborrowercould receive more than 15% of the total project resources, unless otherwiseagreed with the Bank. Although all municipalities and municipal enterpriseswould be eligible for the Institutional Development and Training component(subject to the priorities listed balow), only those meeting the financial andinstitutional eligibility criteria would be eligible to borrow for infrastructureto assure that they will have the capacity to maintain and operate theinfrastructure, as well as to pay the debt service. In addition to theserequirements for municipal governments in general, there are specificrequirements for municipal and regional enterprises (para. 2.14). Regionalenterprises will be subject to the same criteria as municipal enterprises.
2.11 Institutional and Financial Action Plan (IFAP). To participate inthe Infrastructure Component, each municipality must present an institutional andfinancial action plan (IFAP) for developing adequate capacity for projectimplementation. This IFAP, which is described in the Project ImplementationManuals, will show how revenues will be raised and expenditure efficiencyincreased for both current and capital expenditures, as well as managementchanges necessary for project implementation. Municipalities that have notupdated their cadastres within the last five years would have to do so in lessthan two years in accordance with the implementation manuals. The goal would beto increase the collection efficiency to 80% of total potential urban land taxthrough such measures as: increasing cadastre coverage, reassessing land values,improving procedures for continual updating (e.g., improving registration of realestate transactions), and strengthening billing and collection procedures,including the indexing of tax bills.
2.12 Specific Requirements for the Sewer and Water Subcomponent. Inaccord with the Bank's sector study on urban water and sewerage, municipalitieswishing to invest in water and sewer systems must:
(a) have a sufficiently autonomous entity for project implementationMunicipalities with populations of 100,000 or more must create anindependent water company to construct, operate and maintain thesystem, and smaller municipalities that do not have an independentcompany must have a decentralized entity within the municipalgovernment for these ends that is acceptable to the Bank;
(b) develop a financial and institutional development plan acceptable tothe Bank as described in the operations manual. This plan wouldcontain strategies for: (i) increasing of metering at points ofproduction, distribution and consumption to augment the percentage ofwater billed to 75% of total water produced; (ii) design and
- 17 -
implementation of a tariff system with lifeline rates for the poorl(iii) improving billing and collection systems; (iv) establishing aseparate and efficient accounting system; and (v) bettering operationand maintenance practices.
2.13 Financial Criteria for municipal eligibility covers (a) currentaccount surplus and (b) debt capacity. In terms of current account surplus, onlymunicipalities with ratios of 1.0 or more between current revenues/currentexpenditures would be eligible to borrow for infrastructure, provided they alsomeet the requirements for improved financial planning discussed above. Incalculating this ratio, automatic revenue aharing is considered as a revenue, butdiscretionary grants are not. However, municipalities entering the program forthe first time with a current account ratio of 0.9 would be eligible to receivesubloans for infrastructure projects subject to the following conditionss (a)presentation of an action plan for reaching a current account ratio of 1.0 withina period compatible with the project's objective of full cost recovery; (b) abalanced current account will be a condition of disbursement for any subloan toassure compliance with the action plan; hcwever, in the case of a current ratioof less than 1.0, proof that the municipality has taken all actions deemed byBEDE necessary to reach this ratio (e.g., has updated the cadastre, raisedtariffs, etc.) based on agreed financial projections would be considered incompliance. In terms of debt capacity. the total service of the debt (includingboth interest and amortization) should not exceed 15% of the total revenues (netof discretionary grants and borrowing) of the preceding year, duly adjusted forinflation; and total short- and long-term debt should not exceed 60% of totalrevenues, as defined above. One of the objectives of the institutionaldevelopment and training component is to improve accounting systems so thatmunicipalities consistently use a cash basis and follow other accepted accountirgprocedures.
2.14 The financial criteria for municipal and regional enterprises arethat: (a) revenues from tariffs must cover all costs of operation, maintenanceand e.ministration, as well as the cost of investment not covered by grants tocompensate lifeline rates when the new works enter into operation (see para. 2.20for a discussion of the grants); (b) the averaga time of bill payment must beless than 90 days--if not, an action plan to reach this goal must be included;and (c) those enterprises with poor project execution or debt paymentperformance must present a plan for improving future performance, as well as forpaying outstanding debts.
2.15 Priorities for Institutional Development and Training Component. Allmunicipalities will be eligible to participate in the Training Sub-component, bu.priorities will be set for participation in the Institutional DevelopmentSubcomponent to assure the most efficient allocation of this more costlyassistance involving intensive on-site work by teams of consultants. For thosesubborrowers not initially eligible for the institutional developmentsubcomponent, BEDE would make recommendations for reforms and a financial actionplan to enable each municipality to meet the financial eligibility criteria.Furthermore, these municipalities would have access to the training programs
- s1 -
(e.g., regular courses, seminars, workshops and on-the-job training) oriented todeveloping its capacity to the point where it could more effectively participatein the institutional development subcomponent and the infrastructure component.The sequential priorities for this institutional subcomponent are as follows:(a) first priority would go to those municipalities that have balanced currentaccounts and are therefore ellgible to borrow for investments or that have amunicipal enterprise that might borrow; (b) second priority would go to thosethat have: (i) a ratio of current revenues/expenditures of 0.9 or more, (ii)institutional potential to achieve current account equilibrium wlthin areasonably short perlod, and (lii) a project that might potentially be financed;and (c) last oriority would go to the remaining municipalities. These criteriaassure that the resources for the institutlonal development subcomporant will beawarded to those municipalities that can best use them.
2.16 Criteria for EvaluatJon of Subprojects. Subprojects will be preparedat the municipal level and evaluated by BEDE according to the economic,environmental, technical, financial and institutional criteria set out in theProject Implementation Manuals (see Annex 8 for criteria for economicevaluation).
F. Borrower and ExecutLng Agency
2.17 The Borrower would be the Republic of Ecuador. The proceeds of theBank and IDB loans would be onlent in sucres to BEDE at the same maturity as theBank loan (20 years with five of grace). The exception would be the portionsallocated to finance institutional development and trining expenditures, whichwould be transferred to BEDE and to subborrowers as grants (with the exception ofupdating cadastres, which would be financed by onlending). Grants are used as anadded incentive to participate fully in the institutional development andtraining component. The Central Government would assume the cross-currency anddollar exchange rate risks and will also pay the commitment charge. The signingof agreements between the Government and BEDE for the transfer of the Bank loanwould be a condition of effectiveness.
2.18 BEDE's interest rate on funds borrowed will be variable based on itsonlending rate minus a spread to cover operating costs, set initially at 4percentage points. However, this spread could be adjusted, subject to Bankapproval, in accord with changes in the nominal interest rate to assure thatoperating costs are covered. The spread should be estimated as the totaloperating costs divided by the sum of llabilities and net worth, plus areasonable margin for profit and risk. The first revlew of the spread should bein the first quarter of 1991 to assure that it is adequate given the manymacroeconomic changes that have occurred since appralsal. BEDE's onlending ratetVo all of its subborrowers (not just the subborrower under thls project) would bevariable and set in accord with the understanding reached between the Bank andthe Govern.!ent (Letter of the President of the Junta MonetarLa of December 13,1989). In accordance w.th this understanding, the rate on July 1, 1990 was setac 3S%. This rate would be adjusted biannually in line with the scheduleindicated Ln the above mentioned understanding, reaching the commercial bank
- 19 -
lending rate (Tasa de Libre Contratacion) by June 30, 1992 or considerablyearlier if nominal interest rates decline (see Annex 4, para. 20). The onlendingterms would be included in the agreements between BEDE and each of its borrowers.Municipal repayment of loans would be guaranteed by its revenue-sharing receipts.The repayment period of the loans to municipalities will vary in accord withpotential for cost recovery, ranging from 5 years for cadastres to 20 years forwater and eewer eystems. The local cuunterpart will come from the MIF inaccordance with the criteria established by BEDE (para. 1.28).
2.19 At negotiations, agreement was reached on a set of specific financialtargets, including real rates of return on net assets, real net worth, realdisbursements and real growth of disbursements. In addition, BEDE agreed toprepare an annual financial management plan acceptable to the Bank, to bediscussed during the annual review, which would include: (a) a review ofprogress in meeting its financial targets; and (b) a atrategy for the coming yearto contribute to the attainment of project and overall macroeconomic objectiveswith emphasis on (i) the volume of capital assistance from the Central Governmontand (ii) capacity to use it effectively. This plan should also analyze po -ac"overcapitalization" of BEDE due to new legislation (e.g., the ProvincialDevelopment Fund) using the methodology discussed previously (para. 1.32). TheBEDE financial simulation would be used to adjust specific targets for monitoringindicators from the base case scenario (see Table 4.7, Annex 4) established atnegotiations in accord with macroeconomic shifts, such as changes in theinternational price of oil.
G. Cost Recovery Policy and Grants to Ccomensate Lifeline Rates
2.20 Normally, all costs of operation, administration, maintenance, andinvestment would be recovered either directly from user charges (e.g., tariffs,fees and betterment levies) or indirectly from increased general tax revenues(see Annex 9 for details by subcomponent). However, in the cases of water,sanitary and storm sewers, solid waste, and neighborhood improvement, the generalrule of total cost recovery would be relaxed to provide lifeline rates. Alifeline rate is a below-marginal-cost price for a minimum quantity of a basicservice for lower-income families unable to pay marginal cost prices. Forexamtple, the municipal water entity could charge a lifeline rate to lower-incomefamilies for a specified minimum amount of water (e.g., 10 to 15 cubic meters permonth), for which families could not be charged more than 3% of the averagemonthly income for '.he municipality (if available) or the region. To compensatefor the revenue lost due to these lifeline rates that cannot be recovered withinthe municipality via cross-subsidies in the form of higher rates to higher-incomefamilies, a transparent and up-front grant from the HIF would be allowed. Thecalculation of the amount of this grant would require only estimates of the totalfamilies paying lifeline rates, in addition to the other data required forproject evaluation. The amount of the grant could never be greater than totalinvestment cost and the other data used for project evaluation. In moretechnical terms, the grant to compensate lifeline rates would be calculated asthe present value of the revenue stream necessary to cover total project costs(including maintenance, administration, operating, and investment costs) minus
- 20 -
the present value of the actual stream of revenue from the project (which doesnot cover all costs due to the lower lifeline rates for poor families). Therules for cost recovery and methodology for calculating the grants are defined indetail in the project implementation manuals.
III. PROJECT IMPLEMENTATION
A. Implementation Arrangements
3.01 Overall responsibility for project implementation would rest withBEDE, which would administer the MIF and the resources from the Bank, IDB loans,and the GTZ grants. During project preparation, a number of efforts weredirected at strengthening BEDE to fulfill adequately its key role in projectimplementation through its expanded lending program and increased role as aprovider of technical assistance, including a complete a'ministrativereorganiization and training of employees (paras. 1.33-1.34). BEDE respondedefficiently to the many demands of project preparation and appears ready toaesume its increased responsibilities. During project implementation, anextensive program of institutional development a-.d training will continue tostrengthen this capacity (para. 3.06 and Annex 6~,
3.02 The Project Implementation Manuals, acceptable to the Bank--includingspecific manuals for Eligibility, Operations, Sapervision and Monitoring,Economic and Financial Appraisal of Projects and Bor,-owers, Technical Evaluation,Environmental Impact, and Institutional Developmen'. --would cover all regulationsconcerning the relationships between the municipal.). ies and other subborrowerswith BEDE, FONAPRE, SENDA, and AME. At negotiation*, BEDE agreed to administerthe project in accordance with these manuals, and not to amend them without priorBank consent. A condition of effectiveness would e that project operatingmanuals acceptable to the Bank have been issued, These regulations woulddescribe in detail the role of participating entities and the internal proceduresof BEDE that municipalities and other subborrowers should be aware of for theirefficient participation in the project, includinS;: (a) the criteria foreligibility (para. 2.13); (b) the preparation of feasibility studies; (c)subproject selection criteria; (d) mechanisms for approval of projects by BEDE,including conditionality on local resource mobilization (tariffs, property taxes,user charges, etc.) and others re.ated to cost recovery and operation andmaintenance of the projects to be financed; (e) a model of the Loan Agreementbetween BEDE and its subborrowers; (f) procurement procedures for goods, worksand services; (g) accounts and auditing; and (h) specific regulations onenvironmental protection to be followed during preparation, implementation, andoperation of each project. BEDE would determine the eligibility of subborrowers(i.e., municipalities and municipal enterprises) according to the EligibilityManual (for criteria see paras. 2.09-2.15) acceptable to the Bank. BEDE alsowould carry out the technical, economic, financial, and environmental evaluationof the subprojects and would approve the respective subloans. The ProjectCommittee will continue to coordinate all Government organizations with a role inurban development (para. 1.16). BEDE would supervise subproject implementationin accordance with procedures determined in the Supervision and Monitoring
- 21 -
Manual, acceptable to the Bank. This Manual would include: (a) a description ofthe rights and obligations of all subborrowers; (b) the financial mechanisms forproject implementation (disbursement, retention, and accounting); (c) monitoringand supervision mechanisms, defining the areas of responsibility of thesubborrowers and BEDE; (d) cross-references with the Project ImplementationManuals on the interrelation between the project advance reports anddisbursements; (e) a mechanism for disbursements for monthly payments; (f) asAnnexes, the models of standard bidding documents for civil works, goods, andservices to be utilized by municipalities and other subborrowers. Auditing wouldbe cai-ried out as described in para. 3.18. BEDE would approve the procurementcontracts of the subborrowers (see para. 3.10) and would provide the Bank with abiannual progress report (para. 3.19).
3.03 BEDE will establish subsidiary agreements with FONAPRE and SENDA toperform specific functions for the project. FONAPRE would be responsible forhiring consultants and supervising the preinvestment studies requested by BEDE'ssubborrowers (prefeasibility, feasibility, and final engineering design) inaccordance with an agreement signed between BEDE and FONAPRE, acceptable to theBank. BEDE would finance these studies with proceeds from the proposed loan, butwould recover these costs from its subborrowers. SENDA will coordinate themunicipal training program, but the actual training programs will be provided byAME and other entities. As a condition of effectiveness, subsidiary agreementsacceptable to the Bank would be signed between BEDE and (i) FONAPRE and (ii)SENDA.
3.04 Adequate Bank supervision would be an especially '.mportant element ofsuccessful project implementation, especially during the first years. BEDEagreed during negotiations to submit all requests for subproject financing withvalues over established limits (e.g., US$4 million for sewer and water projectsand US$1 million for other projects) for prior approval of the Bank.
B. Strenqthening Implementing Institutions
3.05 The institutional development and training programs will encompassall of the institutions involved in the project (see Annex 6).
3.06 BEDE will be strengthened so that it can meet its increasedresponsibilities for providing technical assistance to its subborrowers, as wellas doing the economic, environmental, technical, and financial analyses of theprojects and of the borrowing entities themselves (see Annex 6).
3.07 Since institutional development is a key objective of the project andfinancial and Institutional action plans by municipalities and municipalenterprises are prerequisites for project participation (paras. 2.09-2.15),special emphasis has been given to it. BEDE will establish a technicalcooperation agreement with GTZ that will create a specialized unit staffed byhigh-level professionals to carry out this program. This unit will beinstitutionally located in the Technical Department of BEDE in the Technical
- 22 -
Cooperation and Promotion Division (see Annex 5). The signing of an agreementbetween BEDE and GTZ for execution of the institutional development componentwould be a condition of effectiveness. In addition, at negotiations, BEDE agreedthat it will hire consultants necessary to implement effectively theinstitutional development and training component.
3.08 As part of the project preparation effort, GTZ applied and tested acomprehensive methodology and an institutional development model in themunicipalities of Tulcan, Riobamba, and Babahoyo. In addition, GTZ organizedseveral courses and seminars in coordination with BEDE, AME, FONAPRE and a numberof international entities. Training was provided for about 100 officials fromthe 18 municipalities selected to be the first group of project participants,including the preparation of administrative manuals for improving institutionaland financial management (see Annex 6). This effort facilitated the testing andfine tuning of the institutional development program for the municipalities(para. 1.34). Training programs for about 580 staff of the municipal supportinstitutions (mainly BEDE and FONAPRE) and for about 460 staff of the first groupof municipalities selected to participate in the project were partially financedby the PPFe from IBRD and IDB (see Annex 6). These efforts proved useful inimproving the design of the training programs to be implemented during projectimplementation, as well as providing training for those who will participateduring its first year.
C. Procurement
3.09 Most of tho 162 municipalities of the country are expected toparticipate in the project, resulting in a large number of small and scatteredcivil works. Procurement for civil works costing US$50,000 equivalent or lessand for goods costing US$25,000 equivalent or less would be done through localshopping, requiring at least three price quotations. This is expected to accountfor US$27.4 million equivalent, or about 9% of project costs. Procurement ofcivil works costing more than US$50,000 and less than US$1 million equivalentwould account for approximately US$64.2 million equivalent, or 22% of totalproject costs, and would be done through Local Competitive Bidding (LCB)procedures acceptable to the Bank. Procurement of goods costing more thanUS$25,000, but less than US$200,000 equivalent, would be done through LCBprocedures acceptable to the Bank and represent approximately US$26.0 million, or9% of project costs. Procurement of civil works costing US$1 million equivalentor more and of goods costing US$200,000 equivalent or more, would be done throughInternational Competitive Bidding (ICB) in agreement with the Bank's guidelinesfor procurement, representing about US$135.4 million equivalent, or 45% ofproject costs. Consulting services, estimated to cost US$47.0 millior.equivalent, or 15% of total project costs, would be procured in accordance withBank guidelines. These arrangements are summarized in Table 3 below.
3.10 BEDE has prepared standard bidding documents for ICB and for LCB ofcivil works and goods as well as for hiring of consultants that were approved atnegotiations by both IBRD and IDB. To facilitate the preparation of these commondocuments, IDB adjusted some of its procurement regulations to Bank guidelines.
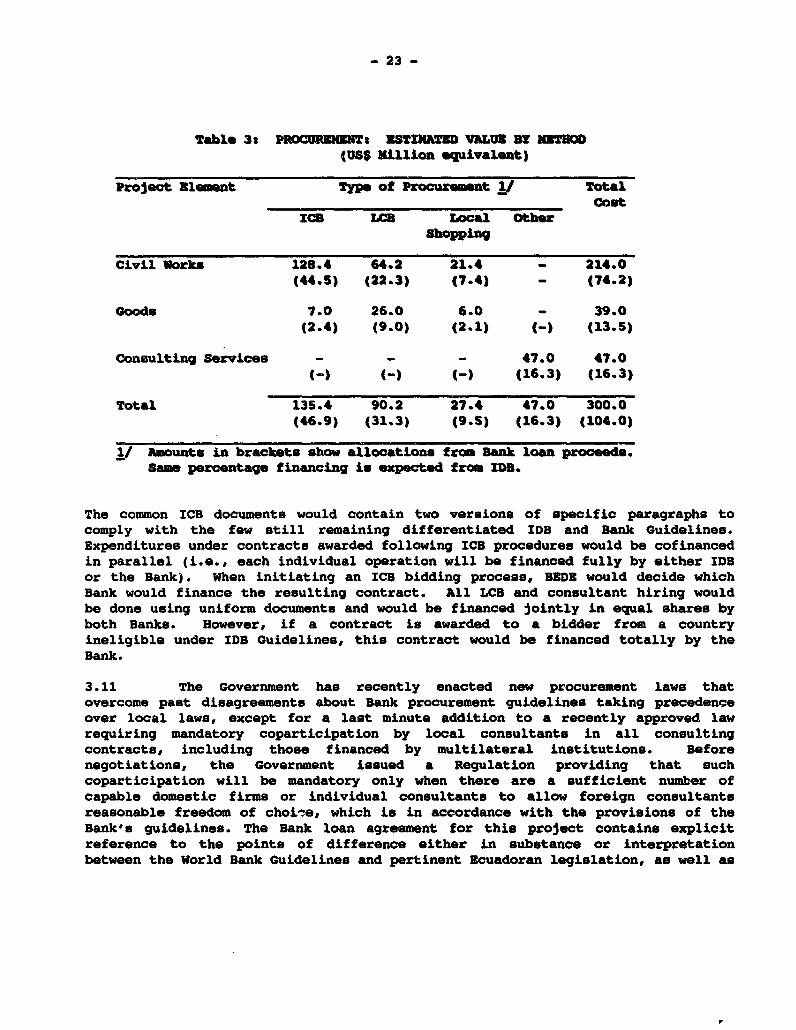
- 23 -
Table 3: R - STIM&TED VALUE BY NITOSH(USS Million equivalent)
Project Element Type of Procurement l/ TotalCost
ICQ LC8 Local OtherShopping
Civil Works 128.4 64.2 21.4 - 214.0(44.5) (22.3) (7.4) - (74.2)
Goods 7.0 26.0 6.0 - 39.0(2.4) (9.0) (2.1) (-) (13.5)
Consulting Services - - - 47.0 47.0C-) (-) (-) (16.3) (16.3)
Total 135.4 90.2 27.4 47.0 300.0(46.9) (31.3) (9.5) (16.3) (104.0)
1/ Amounts in brackets show allocations from Bank loan proceeds.same percentage financing is expected from IDB.
The common ICB documents would contain two versions of specific paragraphs tocomply with the few still remaining differentiated IDB and Bank Guidelines.Expenditures under contracts awarded following ICB procedures would be cofinancedin parallel (i.e., each individual operation will be financed fully by either IDSor the Bank). When initiating an ICB bidding process, BEDE would decide whichBank would finance the resulting contract. All LCB and consultant hiring wouldbe done using uniform documents and would be financed jointly in equal shares byboth Banks. However, if a contract is awarded to a bidder from a countryineligible under IDB Guidelines, this contract would be financed totally by theBank.
3 11 The Government has recently enacted new procurement laws thatovercome past disagreements about Bank procurement guidelines taking precedenceover local laws, except for a last minute addition to a recently approved lawrequiring mandatory coparticipation by local consultants in all consultingcontracts, including those financed by multilateral institutions. Beforenegotiations, the Government issued a Regulation providing that suchcoparticipation will be mandatory only when there are a sufficient number ofcapable domestic firms or individual consultants to allow foreign consultantsreasonable freedom of choi^-e, which is in accordance with the provisions of theBank's guidelines. The Bank loan agreement for this project contains explicitreference to the points of difference either in substance or interpretationbetween the World Bank Guidelines and pertinent Ecuadoran legislation, as well as
- 24 -
those procedures not specifically mentioned in the Bank Guidelines. To reducethe very long delays resulting from the need to have approval of bidding
documents for each subproject by the Procuraduria General del Estado and theContraloria General de la Nacion, which have been a major factor in slowing
project Implementation in Ecuador, the Government agreed that the review of theProcuraduria and the Contraloria would be limited to the basic model biddingdocuments for civil works, goods, and services. The review of the bidding awardswould still be subject to the review of both the Procuraduria and the
Contraloria.
3.12 BEDE would review ex ante all procurement procedures, documents, bidevaluations and contract awards to ensure that the agreed procurement process isproperly carried out. In addition, all procedures, documents, bid evaluationsand contract awards for ICB procurement of goods and works and for procurement of
consultant services costing US$30,000 equivalent or more, would be reviewed exante by the Bank. Because LCB bid packages would be too small and numerous foreffective ex ante review by the Bank, such review would be delegated to BEDE.However, to ensure compliance with Bank procurement guidelines, the Bank wouldreview ex ante the two first LCB procurement processes to be carried out in eachmunicipal subsector. Furthermore, the audit terms of reference to be prepared byBEDE would provide that the audit reports contain a certification that theaudited municipalities have used the standard bidding documents prepared by BEDE,and further tJ.. the procurement documents presented to the Bank for ex antereview are representative. However, the Bank would review LCB and local shoppingprocurement procedures on an ex post basis by sampling. If it were determinedthat procurement did not follow agreed procedures, then no expenditures for such
items would be financed out of loan proceeds and the Bank would cancel thecorresponding loan amount. If contracts not following agreed procurementprocedures were paid with funds from the special account, the Government would
have to refund to the Bank their corresponding amount.
D. Disbursement
3.13 Loan proceeds should be disbursed in six years, with a closing dateof June 30, 1997 (Annex 10). This period, which is shorter than the Ecuadoran
disbursement schedule profile (8 years), is considered acceptable based on the
following: (a) the priority assigned by the Government to eliminating urgentunmet municipal infrastructure needs that would cost an estimated US$600 million,excluding the two largest municipalities; (b) the establishment of the MIF as areliable source of counterpart funding (para. 1.27); (c) subprojects costingUS$43 million have already been prepared for the first year and other subprojectscosting about US$50 million are in advanced stages of preparation for
implementation during the first year; (d) all necessary provisions have beentaken during project preparation and will be taken during project execution to
overcome administrative, legal and financial problems that have curtailed prompt
project execution of past IDB, GTZ and Bank projects and to increase the
implementation capacity of BEDE and the municipalities; and (e) the concerted
actions programmed under the project by IDB, GTZ and the Bank to assure promptand efficient project implementation. Given that expenditures for consulting
- 25 -
services and LCB for goods and works would be financed jointly by IDB and the
Bank, and expenditures for goods and works for ICB would be financed in parallel,
the following disbursement percentages would apply:
(a) 35% (LCB) or 70% (ICB) of total expenditures for eligible civil
works;(b) 50% (LCB) or 100% (ICB) of foreign expenditures for imported
equipment, vehicles, and materials;(c) 35% of total local expenditures for locally procured equipment,
vehicles, and materials;(d) 35% of total local expenditures for hiring local consultants for
preinvestment studies, supervision and auditing, and for
institutional development and training (but excluding salaries); and
(e) 50% of the foreign expenditures for hiring foreign consultants and
for travel expenses for training abroad.
Given that financing is partially joint, the signature of the lending agreement
with IDB would be a condition of loan effectiveness. BEDE has already received a
grant from GTZ in the amount of US$1.9 million equivalent (at an estimated
exchange rate of OM1 - US$0.67) and should receive a second grant in the amount
of at least US$2.1 million equivalent before December 31, 1991. If by December
31, 1991 the IDB loan agreement and the second GTZ grant are not effective, the
Bank will have the right to suspend disbursements.
3.14 Disbursements for civil works and for equipment, vehicles and
materials would ba authorized only after verification and certification by BEDE
that expenditurea resulted from a previously approved subloan agreement between
BEDE and one of its subborrowers. For expenditures for hiring of foreign
consultants and under category (d), disbursements would be authorized after
verification and certification by BEDE that expenditures resulted from the
hiring of consultants acceptable to the Bank or from the technical assistance and
training program approved by the Bank.
3.15 Because of the large number of contracts and relatively small
payments, all disbursements for local expenditures and disbursements for foreign
expenditures for contracts up to US$200,000 equivalent would be against Statement
of Expenditures (SOEs). These SOEs would present expenditures by subproject,
with a breakdown of outlays for studies, equipment, materials, consultant
services, and civil works. The documentation for SOE expenditures would not be
sent to the Bank but would be retained by BEDE and available for inspection by
the Bank staff. All other disbursements should be on the basis of full
contractual documentation. A Special Account in US dollars would be set up in
the Central Bank. The initial deposit would be up to US$6.0 million, which
represents an estimated four months of expenditures under the loan. The Special
Account would be managed by BEDE.
3.16 The PPF for project preparation in the amount or US$700,000 would be
repaid from the loan proceeds. At negotiations, it was agreed that retroactive
financing not exceeding US$1.0 million would be provided for expenditures
- 26 -
approved by the Bank for training, equipment and consultant services required forfurther institutional strengthening and incurred between August 1, 1990 and theexpected signing date of the loan agreement.
3.17 Beginning one year from loan effectiveness, the Bank, jointly withIDB, will annually review progress in project execution and, in particular,progress in loan disbursement. This is to ensure that the Bank's participationin project financing does not exceed 35% of the total project cost over the longterm. In the event the Bank's overall participation exceeds a cumulative 35% oftotal project cost at the end of any given year, it will request that BEDE slowthe approval of subloans for Bank financing during the subsequent year to reducethe Bank's participation to a cumulative 35% of total project expendituresapproved by the end of the subsequent year.
E. Accounts and Audits
3.18 The loan agreements between BEDE and its subborrowers (participatingmunicipalities, and municipal and regional utility enterprises) would include theresponsibility of each to maintain a separate Project Account. BEDE's financialstatements, the Special Account and the Project Account in BEDE and eachmunicipality or enterprise would be audited by external, independent auditorsacceptable to the Bank in accordance with terms of reference acceptable to theBank. Such audits, including the SOEs, and compliance with all Bank agreementsand with the implementation of eligibility and creditworthiness criteriaestablished in the Project Implementation Manuale, would be furnished to the Banknot later than four months after the end of each fiscal year.
F. Project Reporting and Nonitorinq
3,19 BEDE would require monthly reports from each of the subborrowers andfrom the agencies responsible for specific components (e.g., water, sewage, andtraining), and in turn BEDE would submit biannual reports on projectimplementation to the Bank, within 30 days of the end of each semester. Duringnegotiations the Government and BEDE agreed that they will exchange viewsannually with the Bank on progress in project execution. These exchanges wouldtake place in March of each year, starting in 1992. With the Government, thesediscussions would focus on the overall performance of the project in relation tothe objectives outlined in the policy letter. With BEDE, the exchanges wouldinclude: (a) the borrowing capacity and creditworthiness of the municipalitiesand other eligible subborrowers; (b) compliance with the loan agreement, creditregulations, and enforcement of provisions under the subloan agreements(including audit reporting); (c) financial performance of BEDE and subborrowersunder agreed indicators; (d) financial management plan for the coming year; (e)resource allocation including grants and subloans by region, type ofmunicipality, and nature of investments for the current and forthcoming calendaryears; (f) achievement of the Bank's overall percentage participation in totalproject cost; (g) indicators of fiscal and cost recovery performance of thesubborrowers; (h) implementation of environmental provisions; and (i) the statusof the Institutional Development and Training component. If any of these reviews
- 27 -
shows an unsatisfactory performance by BEDE or lack of enforcement of lts creditregulations and subloan agreemente, the Government and BEDE should promptly takeall necessary actions satisfactory to the Bank to improve performance, or theBank could take corrective action, including suspension.
3.20 Systematic monitoring would be undertaken by BEDE and SENDA of thespecific and broad ranging indicatore that measure the overall performance andimpact of the project. Special attention would be given to financial indicatoreof improvements in municipal finances, notably increased capacity to invest andincreased revenue. Annex 11 lists typical indicators that would be used.
IV. PROJECT JUSTIFICATION AND RISKS
A. Financial Benefits
4.01 A primary project focus is on the institution&l reforms of thenational transfer and credit system to provide incentives for municipalities toincrease own-source local revenues as well as the efficiency with which theyspend them. This would contribute directly to help local governments to becomemore autonomous development entities that save and invest wieely to improve theirinfrastructure. Thie, in turn, could stimulate economic development and futurelocal revenues.
4.02 Municipal creditworthiness and component eligibility criteria wouldensure that all municipalities participating in the project would be financiallystrengthened. Only municipalities that have sufficient financial andinstitutional capacity to maintain and operate the new investment adequately, aswell as service its debt are eligible for financing. Technical aseietance wouldbe provided for those municipalities not initially meeting the creditworthinesscriteria so that they might improve their performance.
B. Economic Benefits
4.03 The minimum acceptable internal economic rate of return (ERR) forproject approval is 12%, which is the estimated social opportunity cost ofcapital. The economic evaluation of the infrastructure projects has been carriedout for 23 subprojects, representing approximately 12% of the proposed project'scost. The evaluation includes an analysis of the market demand for eachsubproject; an analysis of alternatives to ensure that the minimum costalternative is selected; and an analysis of the ERR. The weighted average ofthe ERR estimates for all subcomponents is 31.1% (see Table 8.2 of Annex 8). Theaverage return by subcomponent is the followingt water supply (17.4%); sewerage(19.3%); storm drainage (22.9%); solid waste (93.8%); roads (24.5%); andcommunity facilities (18.0%). A sensitivity analysis was done by altering thevariable to which the ERR for each subproject is most sensitive by 25% todetermine the negative impact on ERR. Following this procedure and excluding thesolid waste project in Quito because of its very high ERR, the overall rate ofreturn dropped to 15.4%.
- 28 -
C. Poverty Impact
4.04 About 70% of total investments in infrastructure would beconcentrated in the municipalities outside Quito and Guayaquil where the unmetneeds for basic urban services and infrastructure are highest. The proposedproject would eliminate about a third of these unmet needs. Although usuallybetter off than these smaller cities, the unmet needs in Quito and Guayaquil arealso sizeable. For example, about a quarter of their inhabitants lack access towater and over 40% lack access to adequate basic sanitation. Most of theresources of the IBRD and IDB loans would be used to finance projects in thewater and sewerage sector that accounts for the bulk of these unmet needs forurban services. Lifeline rates would promote access by the poorest families. Inaddition, the project would provide increased affordability of basic services dueto BEDE's relatively long-term financing, which would permit longer beneficiaryrepayment periods. A study done by GTZ during project preparation indicates thatabout half of the possible project beneficiaries would have incomes below thepoverty line (US$277 per capita per year or only US$23 per month). Thedistributive analysis of IDB showed that, on average, at least 80% of totalproject benefits would be directed to low-income beneficiaries (i.e., earningless than US$511 per year or US$43 per month). Finally, the project wouldgenerate over 100,000 person-years of construction work.
D. Environmental Impact
4.05 The project will introduce systematic analysis of the environmentalimplications of infrastructure investments at the municipal level. Thus, theBEDE/GTZ program will help the municipalities to develop the capacity to doenvironmental impact assessment. To assist them, BEDE has prepared a draft of anEnvironment&l Manual explaining how to screen projects for environmental impactin conformity with the Bank's Guidelines (Operational Directive 4.0) that hasbeen reviewed and approved by the Bank. To receive and analyze the assessmentsdone by the municipalities as well as do prescreening of projects withpotentially high negative environmental impacts, BEDE has created theEnvironmental Preservation Sector in its Technical Department (see theorganization charts in Annex 5). This Sector will receive technical assistanceto improve its capacity to: (a) analyze the environmental assessments submittedby the municipalities: and (b) identify potential problems at the prefeasibilityphase of subproject evaluation so that it can alert the municipality to the needfor careful consideration of environmental impact in subproject appraisal. BEDEcan intervene at three different points in the project cycle to deal withenvironmental issues: (a) during the initial public discussion of municipalpriorities, BEDE will identify projects that could potentially generate negativeenvironmental consequences; (b) when the municipality presents the projectprefeasibility study, BEDE's Environmental Preservation Sector can request apublic meeting of representatives of governmental and nongovernmental entitiesbefore presentation of the final project appraisal report (which would beconvened by the Municipal Council, with minutes of the meeting to accompany thereport); and (c) during appraisal of the final project report presented by themunicipality or municipal enterprise, BEDE would decide whether the project is
- 29 -
environmentally sound in accordance with the guidelines established in theEnvironmental Manual. As part subproject review during project preparation andappraisal, careful consideration was given to all environmental aspects(particularly for water supply and solid waste subprojects). In many cases, thisresulted ln substantial design improvements. For example, .n the Quito solidwaste project, the Bank requested further studies to ensure that the proposed newdisposal site area would not contaminate ground water.
4.06 The project should improve the physical environment by reducing theunmet needs of urban infrastructure (e.g., water, sewerage, solid waste, roadsurfacing, drainage and slaughterhouses) and by more carefully designing theproject to improve environmental quality. The general institutional andfinancial strengthening of municipalities should facilitate maintenance once thesystems are operational. Finally, the project will finance parks and in somecases help to preserve historical areas (e.g., the improvement of sewage andstorm sewers in the historical center of Quito).
S. Risks and Safeguards
4.07 The main risks are lack of initial interest on the part ofmunicipalities for doing the fiscal reform required and the continuity inpolitical commitment to the project during its implementation. The project has abuilt-in mechanism to manage these risks in that it allocates the resources basedon performancet those municipalities that are eligible earlier and performbetter would receive more resources. The incentives built into the reformedtransfer system should also stimulate the transfer of innovitions from the lesssuccessful municipalities to the more successful ones. In addition to thesegeneral risks, there is the possibility of inefficient project management by BEDEand municipalities. This risk has been diminished through technical assistanceand training during project preparation, as well as the institutional developmentrequirements in the eligibility criteria. There is also the risk of lack ofcontinuity in project management by municipalities due to staff turnover. Thiswould be reduced by technical assistance in the preparation of legislation togrant civil service status to municipal employees. Finally, reforms alreadyimplemented might be abandoned. While real, this risk has been reduced throughtheir embodiment of the reforms in legislation as well as by specific relatedconditions.
V. AGRBMBNTS PRACHED AND RBCOMEBNDATIONS
5.01 During negotiations, assurances were obtained, as follows:
(a) From the Central Government that it will:
(i) establish a Steering Committee headed by SENDA's secretary andcomposed of senior officials of BEDE, FONAPRE, AME and CONADEto provide advice on the coordination, implementation,
- 30 -
evaluation, and flnancing of the training programs withln three
months after loan effectiveness (para. 1.19);
(ii) not modify the reforms of the LGDL in any way that would reduce
its effective contrlbution to project objectives (para. 1.29)t
(iii) agree that BEDE will retain up to 25% of the total amount
borrowed as an equity contribution, subject to the review of
the Government, which could increase the percentage repayment
in accord with and the evolution of BEDE's capital base (see
study defined below in (b)(v)) and its overall macroeconomic
objectives (para. 1.32);
(iv) accept the onlending terms and conditions, including agreement
to assume fully the cross-currency and dollar-to-sucre exchange
risk (2.17);
(V) accept that the review of the Procuraduria and the Contraloria
will be limited to the basic model bidding documents for civil
works, goods and services (3.11)S and
(vi) agree to exchange views with the Bank at the annual review on
the overall performance of the project in relation to the
objectives outlined in the policy letter (para. 3.19).
(b) From BEDE that it will:
(i) develop with the assistance of SENDA a model career development
plan for municipal civil servants designed to ensure their
greater employment stability. Taking into account the Bank's
comments, BEDE will require municipalities to adopt, as an
objective under their subloan agreement, a career development
plan for its employees consistent with the model plan. The
plan will be presented within the first six months after loan
effectiveness (para. 1.17);
(ii) allocate transfers from the NIF for the first year as follows:
a minimum of 10% for onlending, a maximum of 40% for grants to
compensate for lifeline rates for lower-income families, and a
maximum of 50% for the incentives for current account surplus;
and put into effect a satisfactory methodology for allocation
based on each of these three criteria for the remaining years
of project implementation within the first 10 months of loaneffectiveness (para. 1.28);
(iii) maintain a person with qualifications and experience
satisfactory to the Bank to be responsible for the coordination
of the Project (Project Coordinator); establish the Project
Coordinator as a department management-level position; cause
- 31 -
appointment or removal of high-level staff assigned to workunder the supervision of the Project Coordinator for purposesof the Project to be the sole responsibility of BEDE's Board ofDirectors, such appointment or removal to be made on the basisof recommendations by the Project Coordinator (see 5.02, (d))(para. 1.33);
(iv) raise interest rates to market levels for all new BEDE loans inaccordance with the interest rate understanding between theGovernment and the Bank (para. 1.32);
(v) a. commission a study with terms of reference and consultantacceptable to the Bank to: i. develop a methodology fordetermining the "adequate" level of capitalization to meet itsobjectives as the primary lender to the public sector; ii.revise the estimates of the total amount of capital assistanceto BEDE under current and pending legislation; iii. recommendappropriate corrective actions if necessary to correct anyimbalance between such capital requirements and theavailability of funds; b. submit such study to the Bank forcomments promptly upon its completion; and c. take into accountthe Bank's comments and take all steps necessary to adopt suchrecommendations. The study will be done within six monthsafter loan effectiveness (para. 1.32).
(vi) present an annual financial management plan acceptable to theBank during the yearly review (para. 2.19);
(vii) carry out the program in accordance with the agreed ProjectImplementation Manuals, with no amendments without the Bank'sprior consent (para. 3.02);
(viii) submit all projects with values over established limits forprior approval by the Bank (para. 3.04);
(ix) hire consultants necessary to implement effectively theinstitutional development and training component (para. 3.07);
(x) require monthly reports from each of the subborrowers and fromthe agencies responsible for specific components (e.g., water,sewage, and training), and submit biannual reports on projectimplementation to the Bank within 30 days of the end of eachsemester (3.19); and
(xi) agree to exchange views annually with the Bank on: theborrowing capacity and creditworthiness of subborrowers;compliance with the loan agreement, credit regulations, andenforcement of provisions under the subloan agreements;financial performance under agreed indicators; financial
- 32 -
management plan for the coming year; resource allocation
including grants and subloans, and nature of investments for
the current and forthcoming calendar years; achievement of the
Bank's overall percentage participation in total project cost;
cost recovery performance; implementation of environmental
provaisons; and the statuu of the institutional development and
training component (para. 3.19).
5.02 Conditions of loan effectiveness will be that the:
(a) members of the BEDE Project Committee would have been appointed and
such Committee would have begun to exercise its duties in a manner
satisfactory to the Bank (para. 1.16);
(b) terms of reference satisfactory to the Bank would have been prepared
by BEDE with the assistance of SENDA for model career development
plan designed to ensure more stability for municipal employees as
described in para. 5.01 (b) (i) (para. 1.17);
(c) Ministry of Economy and Finance would have established all of the
operational procedures for FODESEC including the operational
definition and calculation of all pertinent indicators (para. 1.26);
(d) BEDE's Board of Directors would have issued a directive to establish
the staffing procedures of 5.01, b, iii (para. 1.33);
(e) project implementation manuals acceptable to the Bank have been
issued (para. 3.02);
(f) subsidiary agreements acceptable to the Bank would be signed between
the Government and BEDE (para. 2.17), and also between BEDE and: (i)
GTZ for the institutional development component (para. 3.07); (ii)
FONAPRE; and (iii) SENDA (para. 3.03); and
(g) loan agreement between the Government and IDB would have been signed
(para. 3.13).
Recommendation
5.03 With the above assurance and conditions the proposed project would be
suitable for a Bank loan of US$104 million equivalent to be repaid over a period
of 20 years, including 5 years of grace, at the Bank's standard variable interest
rate and fees.
Washington, D.C., November 29, 1990

ANNEX 1Page 1 of 4
BCUADOR
NUNICIPAL DEVEOPMENT AND URBAN INFRASTRUCTURB PROJECT
Population Trends and Access to Urban Infrastructure
1. The urban population of Ecuador more than doubled during the 19b2-82 period to 4.0 million in 1982, causing the percentage of total populationliving in urban areas to jump from 36% in 1962 to over half in 1982. While thetotal population grew at a rate of 3% in the period 1950-1974 and 2.7% between1974-1982, the urban population grew at 4.6% per year for the 1950-74 period and4.9% for 1974-82. Estimates based on these trends show 55% of Ecuador'sinhabitants living in urban areas in 1987.
2. Urban population is heavily concentrated in two urban centers,Guayaquil and Quito, although their participation in the total urban populationhas decreased from 53% in 1974 to 50% in 1987. Urban agglomerations in the100,000 to 200,000 range had the fastest demographic growth, and theirparticipation in the total urban population grew from 4% in 1974 to 19% in 1987.Other urban centers also increased, but at a lower rate, with the exception oftowns of less than 10,000, where population growth was almost nil. Regionally,the urban population, which was slightly concentrated in the Sierra in 1950, isnow more highly concentrated in the Coastal region. Although the urbanpopulation in the Eastern part of the country (Oriente) has grown very rapidly,it is still not very large.
3. Notwithstanding the slight redu-tion in their participation in thetotal urban population, the population of Guayaquil is estimated to have morethan doubled during the 1974-89 period to 1.7 million. Quito's population alsodoubled during the same period to 1.2 million.
4. This rapid urbanization has generated great demand for urban servicesand infrastructure, especially in the two largest cities and in the intermediateurban centers. As .unicipalities have been unable to meet this demand, deficitshave increased. For example, only 69% of the urban population had access todrinking water in their houses in 1987, compared to 75% in 1982; and only 53%had access to adequate sewage facilities in 1987, compared to 62% in 1982. InGuayaquil, in 1987, only 56% had water connections, and only 43% had access toadequate sewerage facilities. Although better than in Guayaquil, the levels ofservice in Quito are also deficient: 80% of the population had access to water,while only 65% had adequate sewage faAlities. Surveys done as part of projectpreparation indicate that most urban centers have large deficits in paving,street lighting, markets, slaughterhouses, etc. The garbage collection is alsoinadequate in many areas due to the lack of good roads and equipment, and itsdisposal is often most primitive. The municipal utilities have growing fiscaldeficits and a chronic lack of capacity to serve the expanding areas.
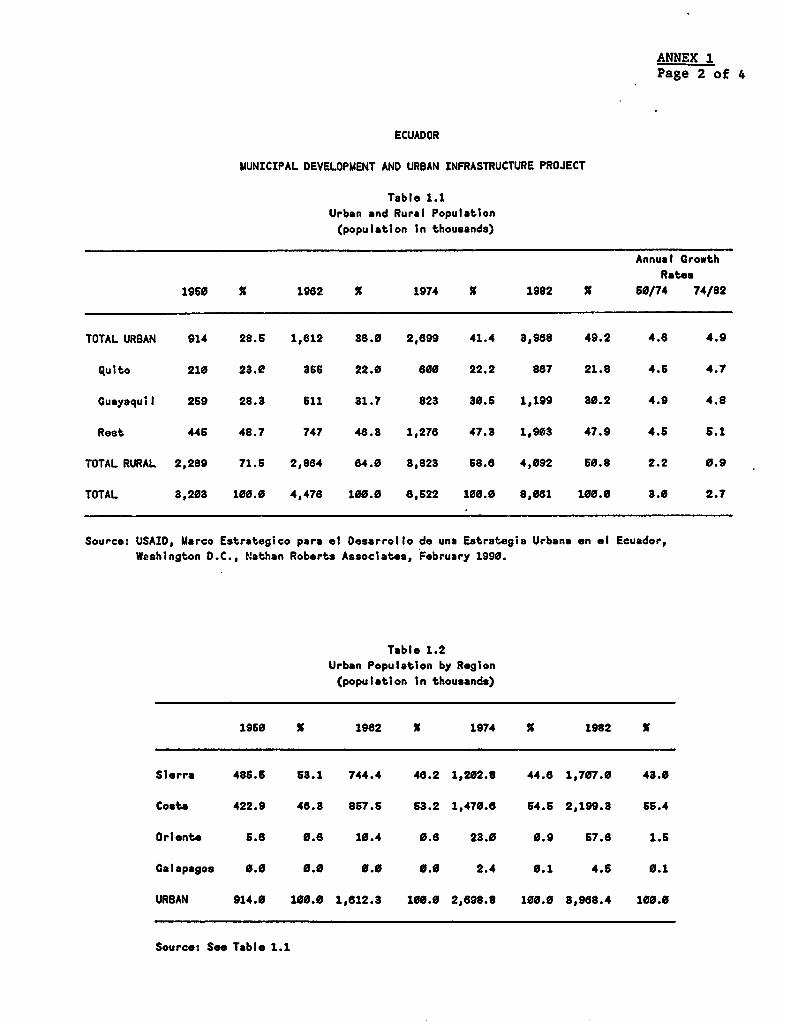
ANNEX 1Page 2 of 4
ECUADOR
MUNICIPAL DEVELOPMENT AND URBAN INFRASTRUCTURE PROJECT
Table 1.1Urban and Rural Population
(populatlon In thousands)
Annual GrowthRates
1950 % 1962 % 1974 % 1982 % 50/74 74/82
TOTAL URBAN 914 28.5 1,612 86.0 2,699 41.4 3,988 49.2 4.6 4.9
quito 210 23.0 3SS 22.0 800 22.2 867 21.8 4.6 4.7
Guayaquil 259 28.3 611 81.7 823 30.6 1,199 30.2 4.9 4.8
Rest 446 48.7 747 46.3 1,276 47.3 1,903 47.9 4.6 6.1
TOTAL RURAL 2,289 71.6 2,864 64.0 3,823 68.6 4,092 60.8 2.2 0.9
TOTAL 3,203 100.0 4,476 100.0 6,622 100.0 8,081 100.0 3.0 2.7
Source: USAID, Marco Estrategico para el Desarrollo do una Estrategia Urbana en el Ecuador,Washington D.C., Nathan Roberts Associates, February 1990.
Table 1.2Urban Population by Region
(population in thousands)
1950 X 1962 x 1974 % 1982 X
Sierra 485.6 63.1 744.4 46.2 1,202.8 44.6 1,707.0 43.0
Costs 422.9 46.3 867.6 53.2 1,470.6 64.5 2,199.8 55.4
Oriente 5.6 0.6 10.4 0.6 23.0 0.9 57.8 1.6
Galapagos 0.0 0.0 0.0 0.0 2.4 0.1 4.5 0.1
URBAN 914.0 100.0 1,612.3 100.0 2,698.8 100.0 3,988.4 100.0
Source: See Table 1.1
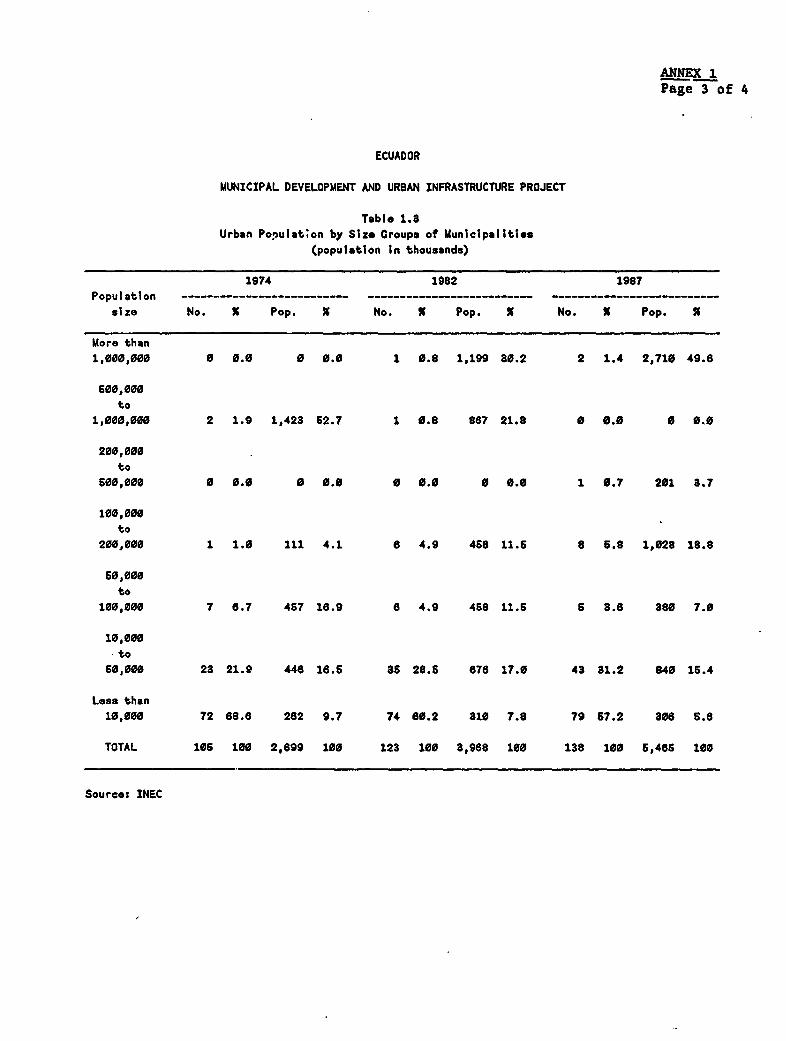
ANNX 1Page 3 of 4
ECUADOR
MUNICIPAL DEVELOPMENT AND URBAN INFRASTRUCTURE PROJECT
Table 1.8Urban Populat.on by Siz- Groups of Municipalities
(population In thousands)
1974 1982 1987Population --------_--- -------------------------- --------------- -- ___
size No. X Pop. % No. X Pop. X No. X Pop. X
More than1,000,000 0 0.0 0 0.0 1 0.8 1,199 30.2 2 1.4 2,710 49.6
600,000to
1,000,000 2 1.9 1,423 62.7 1 0.8 867 21.8 0 0.0 0 0.0
200,000to
500,000 a 0.0 0 0.0 0 0.0 0 0.0 1 0.7 201 3.7
100,000to
200,000 1 1.0 11I 4.1 6 4.9 458 11.6 8 6.8 1,028 18.8
60,000to
100,000 7 6.7 457 18.9 6 4.9 458 11.5 6 a.6 380 7.0
10,000to
50,000 23 21.9 448 18.5 35 28.5 678 17.0 43 31.2 840 15.4
Less than10,000 72 68.6 282 9.7 74 60.2 310 7.8 79 57.2 308 5.6
TOTAL 105 100 2,899 100 123 100 3,968 100 138 100 5,485 100
Source: INEC
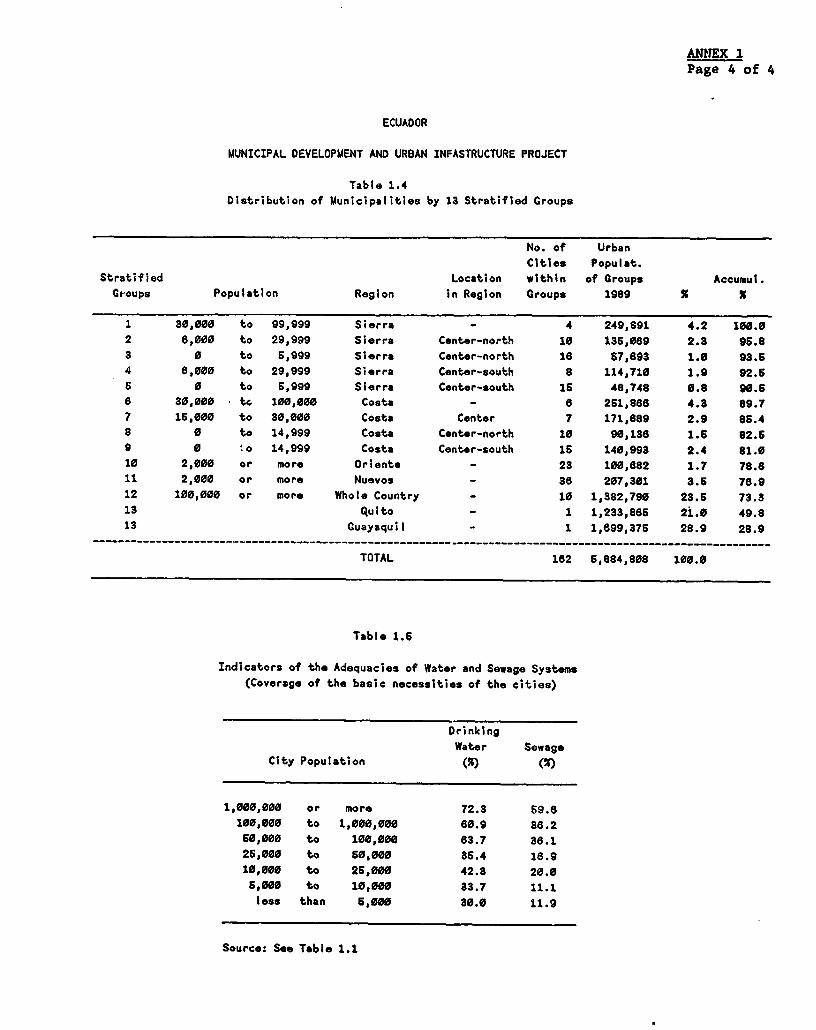
ANTEX 1Page 4 of 4
ECUADOR
MUNICIPAL DEVELOPMENT AND URBAN INFASTRUCTURE PROJECT
Table 1.4Distribution of Municipalities by 13 Stratified Groups
No. of UrbanCities Populat.
Stratified Location within of Groups Accumul.
Groups Population Region in Region Groups 1989 X %
1 30,000 to 99,999 Sierra 4 249,891 4.2 100.0
2 6,000 to 29,999 Sierra Center-north 10 136,069 2.3 96.8
a 0 to 5,999 Sierra Center-north 16 67,893 1.0 93.6
4 8,000 to 29,999 Sierra Center-south 8 114,710 1.9 92.5
S 0 to 6,999 Sierra Center-south 15 48,748 0.8 90.5
e 30,000 to. 100,000 Costa - 6 251,868 4.3 89.7
7 16,000 to 30,000 Costa Center 7 171,689 2.9 85.4
8 0 to 14,999 Costa Center-north 10 90,136 1.6 82.6
9 0 to 14,999 Costa Center-south 15 140,993 2.4 81.0
10 2,000 or more Orients - 23 100,882 1.7 78.6
11 2,000 or more Nuevos - 86 207,301 3.5 76.9
12 100,000 or more Whole Country - 10 1,382,790 23.6 73.3
13 Quito - 1 1,233,865 2i.0 49.8
13 Guayaquil - 1 1,699,375 28.9 28.9…------------------------------------------------------- ---------- __--------__---------------------------
TOTAL 162 6,884,808 100.0
Table 1.6
Indicators of the Adequacies of Water and Sewage Systems
(Coverage of the basic necessities of the cities)
DrinkingWater Sewage
City Population (5) (X)
1,000,000 or more 72.3 69.6
100,000 to 1,000,000 60.9 38.2
60,000 to 100,000 83.7 38.1
26,000 to 50,000 86.4 16.910,000 to 25,000 42.3 20.0
5,000 to 10,000 33.7 11.1
less than 6,000 30.0 11.9
Source: See Table 1.1
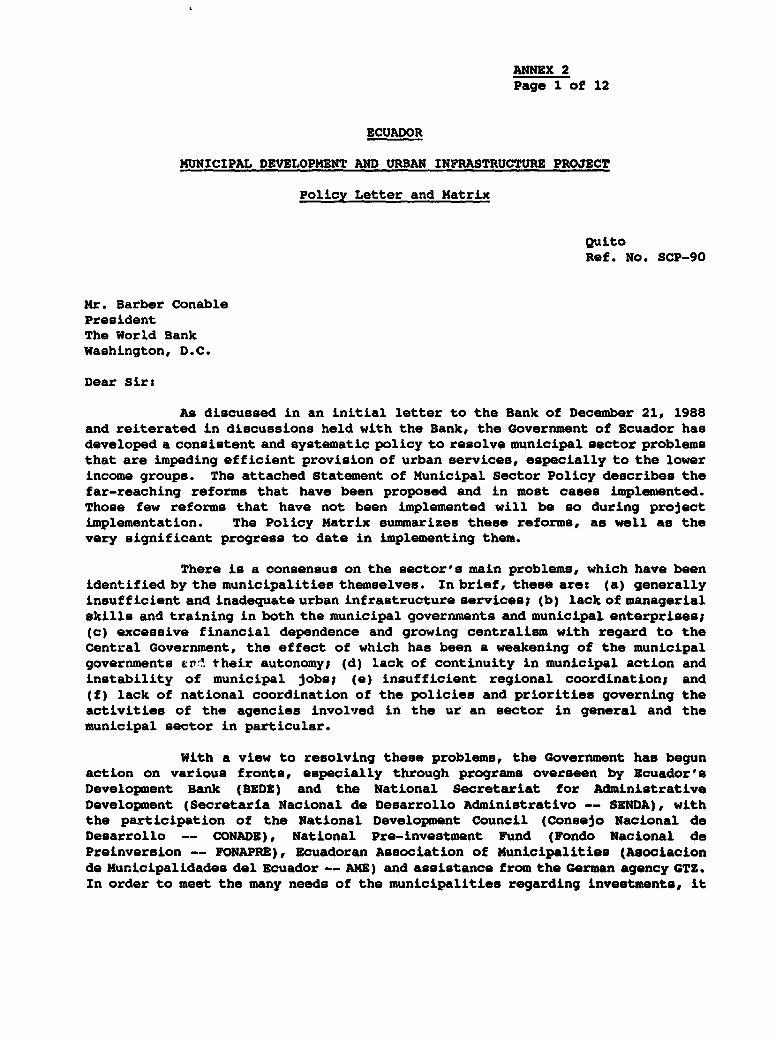
ANNEX 2Page 1 of 12
ECUADOR
MUNICIPAL DEVELOPMENT AND URBAN INFRASTRUCTURE PROJECT
Policy Letter and Matrix
QuitoRef. No. SCP-90
Mr. Barber ConablePresidentThe World BankWashington, D.C.
Dear Sir:
As discussed in an initial letter to the Bank of December 21, 1988and reiterated in discussions held with the Bank, the Government of Ecuador hasdeveloped a consistent and systematic policy to resolve municipal sector problemsthat are impeding efficient provision of urban services, especially to the lowerincome groups. The attached Statement of Municipal Sector Policy describes thefar-reaching reforms that have been proposed and in most cases implemented.Those few reforms that have not been implemented will be so during projectimplementation. The Policy Matrix summarizes these reforms, as well as thevery significant progress to date in implementing them.
There is a consensus on the sector's main problems, which have beenidentified by the municipalities themselves. In brief, these are: (a) generallyinsufficient and inadequate urban infrastructure services; (b) lack of managerialskills and training in both the municipal governments and municipal enterprises;(c) excessive financial dependence and growing centralism with regard to theCentral Government, the effect of which has been a weakening of the municipalgovernments &rd their autonomy; (d) lack of continuity in municipal action andinstability of municipal jobs} (e) insufficient regional coordination; and(f) lack of national coordination of the policies and priorities governing theactivities of the agencies involved in the ur an sector in general and themunicipal sector in particular.
With a view to resolving these problems, the Government has begunaction on various fronts, especially through programs overseen by Ecuador'sDevelopment Bank (BEDE) and the National Secretariat for AdministrativeDevelopment (Secretaria Nacional de Desarrollo Administrativo -- SENDA), withthe participation of the National Development Council (Consejo Nacional deDesarrollo -- CONADE), National Pre-investment Fund (Fondo Nacional dePreinversion -- FONAPRE), Ecuadoran Association of Municipalities (Asociacionde Municipalidades del Ecuador -- ANE) and assistance from the German agency GTZ.In order to meet the many needs of the municipalities regarding investments, it
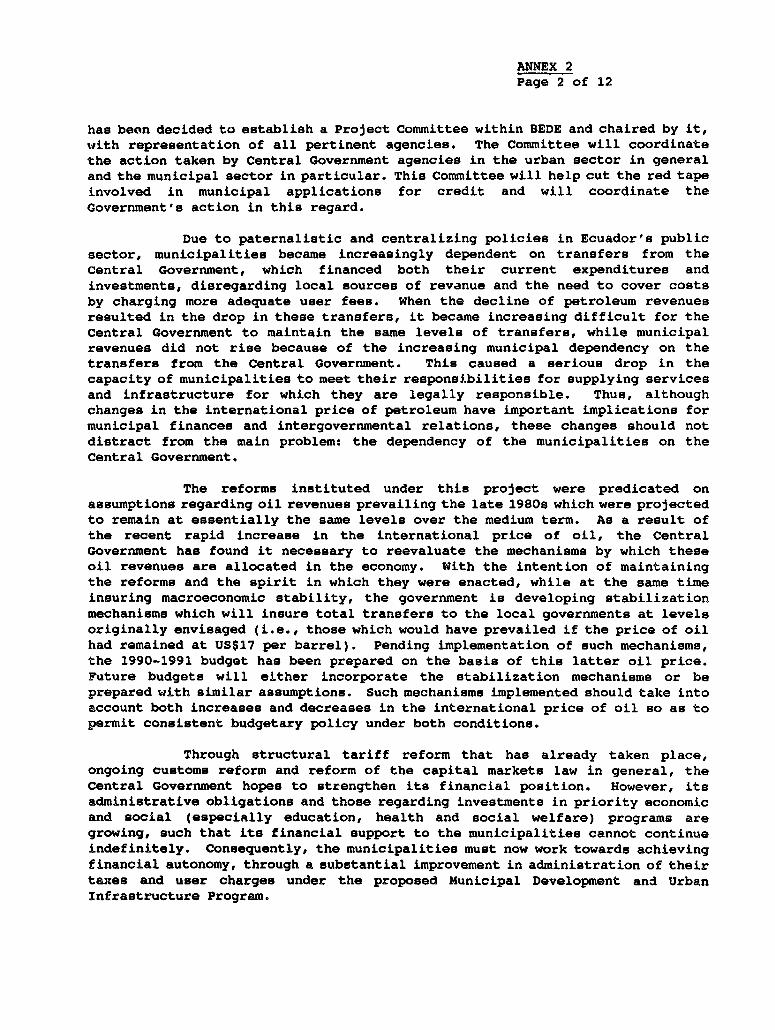
ANNEX 2Page 2 of 12
has been decided to establish a Project Committee within BEDE and chaired by it,
with representation of all pertinent agencies. The Committee will coordinatethe action taken by Central Government agencies in the urban sector in general
and the municipal sector in particular. This Committee will help cut the red tape
involved in municipal applications for credit and will coordinate the
Government's action in this regard.
Due to paternalistic and centralizing policies in Ecuador's public
sector, municipalities became increasingly dependent on transfers from the
Central Government, which financed both their current expenditures and
investments, disregarding local sources of revanue and the need to cover costsby charging more adequate user fees. When the decline of petroleum revenues
resulted in the drop in these transfers, it became increasing difficult for the
Central Government to maintain the same levels of transfers, while municipal
revenues did not rise because of the increasing municipal dependency on the
transfers from the Central Government. This caused a serious drop in the
capacity of municipalities to meet their responsibilities for supplying services
and infrastructure for which they are legally responsible. Thus, although
changes in the international price of petroleum have important implications for
municipal finances and intergovernmental relations, these changes should not
distract from the main problem: the dependency of the municipalities on the
Central Government.
The reforms instituted under this project were predicated on
assumptions regarding oil revenues prevailing the late 19809 which were projected
to remain at essentially the same levels over the medium term. As a result of
the recent rapid increase in the international price of oil, the Central
Government has found it necessary to reevaluate the mechanisms by which these
oil revenues are allocated in the economy. With the intention of maintaining
the reforms and the spirit in which they were enacted, while at the same time
insuring macroeconomic stability, the government is developing stabilization
mechanisms which will insure total transfers to the local governments at levels
originally envisaged (i.e., those which would have prevailed if the price of oil
had remained at US$17 per barrel). Pending implementation of such mechanisms,
the 1990-1991 budget has been prepared on the basis of this latter oil price.
Future budgets will either incorporate the stabilization mechanisms or be
prepared with similar assumptions. Such mechanisms implemented should take into
account both increases and decreases in the international price of oil so as to
permit consistent budgetary policy under both conditions.
Through structural tariff reform that has already taken place,
ongoing customs reform and reform of the capital markets law in general, the
Central Government hopes to strengthen its financial position. However, its
administrative obligations and those regarding investments in priority economic
and social (especially education, health and social welfare) programs are
growing, such that its financial support to the municipalities cannot continue
indefinitely. Consequently, the municipalities must now work towards achieving
financial autonomy, through a substantial improvement in administration of their
taxes and user charges under the proposed Municipal Development and Urban
Infrastructure Program.
ANNEX 2Page 3 of 12
The Government's finance policy, .aerefore, aims to reversedependence of local governments on the Central Government's coffers bystimulating the generation of local resources, thereby also increasing municipalautonomy. As part of this effort by the Government to strengthen local publicfinances, the political, legal, institutional and financial changes will beimplemented to improve the efficiency of the municipalities in providing urbaninfrastructure and upgrading the quality and quantity of their services,especially for the urban poor.
The Government is also seeking to reduce the levels and scope ofgrants from the Central Government, while concurrently ensuring more equitabletargeting of benefits to the poor, and also to make the budget and revenuesharing processes more disciplined, transparent and predictable. Through thereforms of the Local Government Development Law of May 1990, the Government hastaken the necessary measures to ensure that in the future the revenue sharingfunds reach the municipalities in response to well defined criteria in terms ofthe population and real needs. Likewise, in the future all funds allocated tolocal governments will be distributed essentially in accordance with thosecriteria. Moreover, we understand that urban works must be financed through BEDEoperations, while other agencies tend to rural needs.
The Government of Ecuador is committed to a policy of municipalstrengthening, which it considers basic to sound municipal finances. Thiscommitment is demonstrated by the fact that almost all of the major reforms havealready been implemented, thereby forming a very sound foundation for projectimplementation.
Very truly yours,
Jorge Gallardo ZavalalMinister of Finance and Public Credit
1Signed copy sent on November 21, 1990.
ANNEX 2Page 4 of 12
STATEMENT OF MUNICIPAL SECTOR POLICY
The Government has embarked on a Municipal Development and UrbanInfrastructure Program, to be financed by US$212 million in external resourcesprovided by the Inter-American Development Bank (IDB), the International Bankfor Reconstruction and Development (IBRD) and the GTZ, in response to the needfor an effective solution to the financial crisis faced by Ecuador'smunicipalities, which are highly dependent on fiscal transfers because they donot generate sufficient resources themselves. This has meant that investmentsby local governments are limited in volume and suffer from a lack of properplanning.
The result has been a marked deficit in basic servicas and urbaninfrastructure which, according to a study contracted by BEDE to the CEDATOSconsulting firm for this Program, represents an estimated SI. 324,201.7 million,at the national level distributed among the following sectors in millions ofNovember 1989 sucres: potable water (76,116.7), sewerage (41,255.3), stormdrainage (27,245.8), solid waste collection and treatment (2,216.7), roads(95,889.9), markets (13,552.2), slaughterhouses (8,474.7), cemeteries (9,210.0)and green areas (50,240.4).
This Statement will analyze four basic points:
I. Brief assessment of the municipal situation;II. Studies and training done in preparation for the policy reforms;III. The Municipal Development and Urban Infrastructure Program; andIV. Municipal policy changes under the Program;
I. Brief Assessment of the Municipal Financial Situation
The capacity of Municipalities to provide urban services andinfrastructure is constrained by a shortage of both own-source tax revenue anduser charges. Moreover, because of their institutional weaknesses, themunicipalities are severely constrained in meeting their obligations to thecommunity.
Municipal investments are relatively modest in relation to cantonneeds and the cost of the necessary works. In addition, the investments dependon funding from Central Government transfers. Only in the larger and betterorganized municipalities and those that have carried out large-scale projectswith BEDE assistance and loans from international agencies with the backing ofthe Central Government are investing significant amounts.
Unquestionably, urban property taxes are the main source of revenuethat the municipalities can generate, but their collection does not correspondto the needs, despite efforts to enforce existing regulations and legislation.
2 Free market exchange rate: US$1 = S/.650.54.
ANNEX 2Page 5 of 12
From an administrative standpoint, because most municipal salaryscales are the lowest in the public sector, the municipalities have difficultyin hiring capable and competent technical personnel.
Regarding legal aspects, current legislation for certain municipaltaxes is entirely too cumbersome and lacks the necessary flexibility to avoidan erosion of the limited resources.
The financial situation of the municipalities, according to data fromthe Office of the Controller General for 1985-89, is as follows:
(a) The municipalities depend heavily on funding from the CentralGovernment, which provided 53.2% of their total revenue during theperiod in question.
(b) Direct tax revenue for the municipalities represented 68.8% of theirtotal current expenditures during the same time.
(c) The current expenditures of municipalities represented 47.6% of totalrevenue for the period. Investments accounted for only 40.5% oftotal expenditures.
(d) The debt service of municipalities, which represents 9.7% of totalexpenditures, grew annually on average by 17.6%, rising froms/. 2,482.1 million in 1985 to S/. 4,750.1 million in 1989.
In summary, the financial crisis faced by Ecuador's municipalities and municipalenterprises cannot be resolved without an increase in their revenue from localtaxes and user charges to finance all of their current expenditures, thereby freeup more resources for investment and decreasing their financial dependence onthe Central Government.
II. Studies and Training Done in Preparation for the Policy Reforms
BEDE has taken various actions to promote the development ofmunicipal governments. It has contracted administrative, technical, planningand financial studies, carried out by Ecuadoran experts, such as the study onthe "Socioeconomic and Financial Situation of the Municipalities of Ecuador" byeconomist Jaime Moncayo. Others were done by university professors contractedby USAID. H. Petrei did an in-depth study of transfers to sub-nationalgovernments.
Other entities such as CONADE, FONAPRE and AME have carried outstudies on the municipal situation and proposed changes in legislation with aview to improving the financial solvency of the municipalities. They have soughtto coordinate the action of local governments within the framework of nationalplanning.
Preparatory work for the Municipal Development and UrbanInfrastructure Program has been as follows:
ANNEX 2Page 6 of 12
With a view to improving the financial situation of themunicipalities, the National Government, assisted by GTZ, prepared a studyentitled "A Proposal for the Municipal Future," which analyzes the need tocoordinate the action by the agencies of the Central Government that are involvedin the activities of the municipalities. The intent is to make inter-institutional cooperation more effective and cumbersome so that it does not bogdown municipal actions.
In the area of legal, administrative and procedural reforms, GTZcarried out a study on legal reforms regarding the procedures for municipalprojects and the ability of the municipal governments and municipal enterprisesto recover the investment, administrative and maintenance costs of the projectsthrough higher taxes.
GTZ also submitted a study on "Policies and Strategies to ImproveMunicipal Finances" and "Some Basic Notions for Municipal FinancialRestructuring." It also held an inter-institutional seminar at which theconsultants presented the results, conclusions and recommendations for thatstudy.
To upgrade the skills of municipal employees, training courses weregiven under the direction of BEDE, AME/INFODEM (National Institute of MunicipalSupport and Development), CONADE and the Office of the Controller General onbudgeting, cadastres and project appraisal, as well as other topics.
III. The Municipal Development and Urban Infrastructure Program
The Municipal Development Program to be carried out under theIDB/IBRD credit inc;.udes the financial rehabilitation of the municipalities inorder to give them financial autonomy with regard to the Central Government andgreater managerial capacity, in addition to financing to meet basicinfrastructure needs.
The program includes the following components that can be financedby IDB and IBRD:
1. Investments in infrastructure, including construction andrehabilitation (e.g., water, sewerage and storm drainage, roadmaintenance, solid waste collection and treatment, markets,slaughterhouses, and green areas);
2. Pre-investment studies;
3. Technical assistance/institution building and training;
4. Provision of equipment for BEDE, FONAPRE, AME and the municipalities;
5. Supervision;
6. Audits.
ANNEX 2Page 7 of 12
The Municipal Development Program, which BEDE will launch in 1990,will make it possible to make adjustments in the municipal sector, through theadoption of specific administrative, financial/accounting, legal and technicalmeasures, as detailed below. The measures will aim at achieving fiscaldiscipline, by establishing the bases for faster growth and better livingconditions. To that end, municipal finances will have to be bolstered, so thatthe curtailment in government transfers does not affect the availability ofresources for the productive sectors.
The improvement in the financial situation will occur in tandem withinstitution building for the municipalities, through training and technicalassistance.
Direct training of sector personnel will be overseen by the NationalSecretariat for Administrative Development and cover the following areas:
Management and planningBudget administrationFinancial managementProject identification, preparation and appraisalComputerization of information.
Technical assistance related to the implementation of investment projects willbe provided by BEDE.
Initially, projects in 9 different sectors in medium and smallmunicipalities throughout the country will be carried out, along with projectsin Quito. It is expected that in the coming years, while the Program is active,projects will be carried out in all municipalities of the country. This willrequire constant generation of projects by the agencies that conduct pre-investment studies. Nevertheless, other results are expected to emanate fromthe Program since it aims at a sweeping transformation of the municipalities.
IV. Municipal Policy Changes Under the Program
With the Municipal Development Program, the Government is undertakingto make policy changes in urban development, municipal finance and municipaladministration.
The urban development policies seek to ensure that investmentprogramming is consistent with the available financial resources and urbanplanning, such that urban growth, land use, provision of services, equipment anddistribution of population is done in accordance with a planning system.
Municipal finance policies govern the handling of the funds of localgovernments and consequently budget programming and execution, as well as thesources of the funds and taxation systems. These policies aim at improvingfinancial management via mechanisms for assessing, optimizing and financingmunicipal investments.
ANNEX 2Page 8 of 12
Municipal administration policies seek to improve administration sothat it satisfies the needs of the municipality. They will be directed towardsthe establishment of mechanisms that result in effective and efficient planning,organization and administration.
The policy changes will in some instances require legal,administrative and procedural reforms.
Institutional changes
The entities that provide technical and financial support will makeinstitutional changes that will affect project appraisal and execution and theadministrative and other procedures needed for the implementation of theMunicipal Development Program.
BEDE has changed its organizational structure in the technical areafor project environmental, socioeconomic, financial and technical appraisal.
The national/local transfer system was totally revised by the LocalGovernment Development Law (LGDL) of May 1990 to make It more equitable,transparent and predictable. The LGDL also established the Municipal InvestmentFund that will partly cover the gap between the payment capacity of thepopulation served by each project and the funds needed for full recovery of thecosts of operation, maintenance and investment, as well as provide addedincentives for local fiscal effort. This Fund will be administered by BEDE underagreement with the Ministry of Finance.
Due to paternalistic and centralizing policies in Ecuador's publicsector, municipalities became increasingly dependent on transfers from thecentral Government, which financed both their current expenditures andinvestments, disregarding local sources of revenue and the need to cover costsby charging more adequate user fees. When the decline of petroleum revenuesresulted in the drop in these transfers, it became increasing difficult for theCentral Government to maintain the same levels of transfers, while municipalrevenues did not rise because of the increasing municipal dependency on thetransfers from the Central Government. This caused a serious drop in thecapacity of municipalities to meet their responsibilities for supplying servicesand infrastructure for which they are legally responsible. Thus, althoughchanges in the international price of petroleum have important implications formunicipal finances and intergovernmental relations, these changes should notdistract from the main problem: the dependency of the municipalities on theCentral Government.
Ths reforms instituted under this project were predicated onassumptions regarding oil revenues prevailing the late 19808 which were projectedto remain at essentially the same levels over the medium term. As a result ofthe recent rapid increase in the international price of oil, the CentralGovernment has found it necessary to reevaluate the mechanisms by which theseoil revenues are allocated in the economy. With the intention of maintaining
ANNEX 2Page 9 of 12
the reforms and the spirit in which they were enacted, while at the same timeinsuring macroeconomic stability, the government is developing stabilizationmechanisms which will insure total transfers to the local governments at levelsoriginally envisaged (i.e., those which would have prevailed if the price of oilhad remained at US$17 per barrel). Pending implementation of such mechaniems,tts 1990-1991 budget has been prepared on the basis of this latter oil price.Future budgets will either incorporate the stabilization mechanisms or beprepared with similar assumptions. Such mechanisms implemented should take intoaccount both increases and decreases in the international price of oil so as topermit consistent budgetary policy under both conditions.
The municipalities will establish a personnel and administrativecareer policy. They will have to standardize the procedures and regulationsgoverning the hiring and retaining of municipal employees and workers. The localentities will have to issue their own regulations through ordinances and takesteps towards adopting a comprehensive personnel policy that governs recruitment,appointments, career growth and promotions and compensation, including theemployee benefits required by law.
Financial Changes
The changes in the financial conditions governing the loans to beextended by BEDE using the IDB/IBRD funds will affect interest rates and loanterms, which will follow the interest rate policy agreed with the Bank foradjustable preferential rates until mid-1992, when the latter will no longer besubsidized.
Moreover, as in some projects the beneficiaries will not be able toafford the costs of the investments, grants will be made available. As theamount of the grant will be based on the project appraisal by BEDE, the grantswill be transparent, direct and based on the payment capacity of the projectbeneficiaries.
With a view to increasing the revenue of the municipalities, taxrevenues and those from user charges for public services and special bettermentlevies must be increased. The main source of tax revenue for the municipalitiesis or should be the urban property tax, which is at present neither determinedon a technical basis nor properly administered. The necessary improvements wouldinclude an urgent updating of cadastres and assessments using modern technicalprocedures, which would also make it possible to increase tax revenue throughthe special betterment levy, since the beneficiaries of the municipal investmentswould be identified. Tariffs should be set high enough to cover the costs ofoperation and maintenance, as well as investment. The same objective is soughtwith the rates charged for other municipal services, which do not cover the costsof investment, operation, maintenance or replacement of infrastructure. The LGDLof May 1990 amends the Municipal Law to permit full cost recovery for water andsewer systems.
A more technical approach to budget preparation and execution, aswell as computerization of accounting, cash-flow and internal control systems,
ANNEX 2Page 10 of 12
would improve municipal finances in general.
Legal, Administrative and Procedural Changes
The measures to be adopted in this regard will follow from thediagnostic study being carried out by GTZ on the legal regulations governing themunicipal sector and the proposed legal reforms prepared by BEDE to simplify andstreamline the procedures for granting and formalizing the loans under theProgram. In addition, the necessary mechanisms will be eought to ensure thatinter-institutional cooperation is more effective and less encumbered, throughthe establishment, by means of an executive decree, of a Project Committeecomposed of all entities involved by law in municipal projects. The Committeewill be responsible for coordination and decision miking regarding projecteligibility, development, approval and execution.
The administrative and procedural changes will be aimed at cuttingred tape for all entities involved in the Program.
Technical Assistance and Training
The training programs will be designed to help resolve the sector'stechnical and administrative problems. Training will take the form of courses,seminars and overseas trips. Training activities will be based on theinstitutional diagnostic study and technical assistance that will be providedto the municipalities in the form of institution building and specific needsstudies.
The training activities will be coordinated by SENDA and be carriedout by AME in the following fields:
Administrative: Administration of human resources; institutLonalplanning and administration of public services;
Financial: Financial and budget administration; policies andstrategies to improve municipal finances; taxation and tax controland government accounting;
- Technical: Project preparation; technical, environmental, financialand economic appraisal of projects; updating of urban cadastres;formulation of municipal ordinances; works monitoring and inspection;direct advisory assistance in local planning; specific advisoryassistance for projects.
BEDE will be responsible for technical assistance, which will aimat resolving specific problems in the identification, appraisal andimplementation of projects under the Program, as well as institution buildingfor the municipalities, through recommendations to improve their organizationaland functional structure and their administrative, financial and accountingprocedures and regulations.
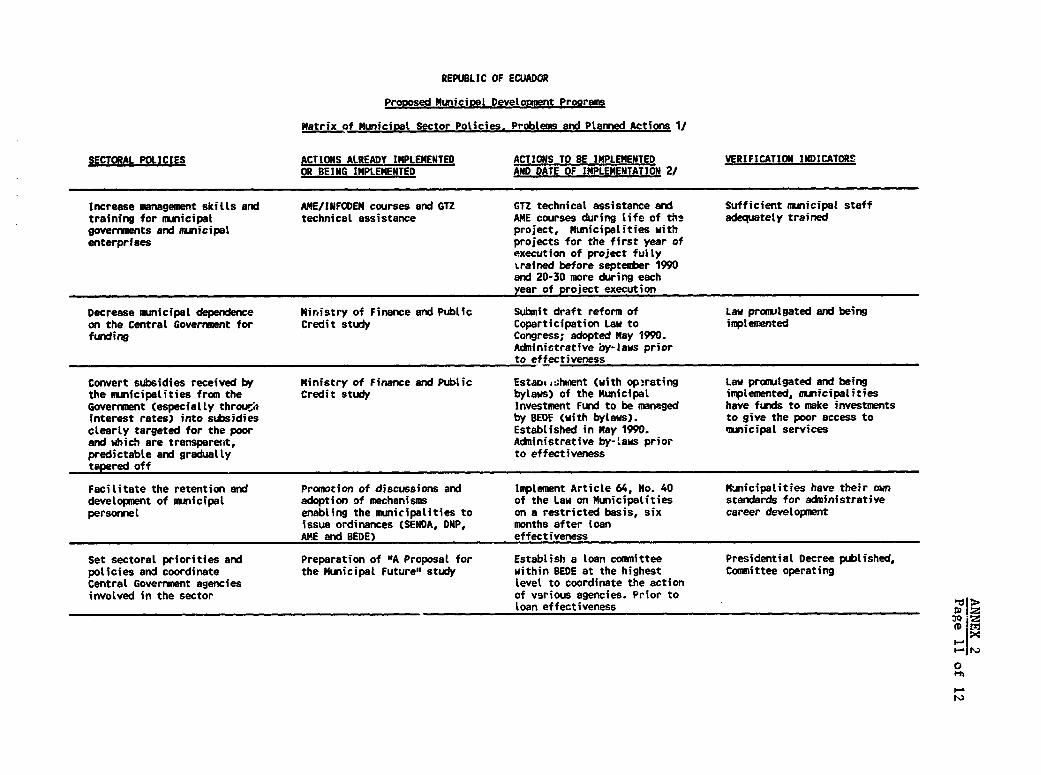
REPUBLIC OF ECUADOR
Proposed Municipal Develoranent Programs
Matrix of MuniciPal Sector Policies, Problems and Ptanred Actions I/
SECTORAL POLICIES ACTIONS ALREADY IMPLEMENTED ACTIONS TO BE IMPLEMENTED VERIFICATION INDICATORSOR BEING IMPLEMENTED AND DATE OF IMPLEMENTATION 2/
Increase management skills and ANE/INFODEM courses and GTZ GTZ technical assistance and Sufficient municipal stafftraining for municipal technical assistance AME courses during life of the adequately trairedgovermments and omuicipal project, Municipalities withenterprises projects for the first year of
execution of project fullytrained before septemrber 1990and 20-30 more during eachyear of project execution
Decrease municipal dependence Ministry of Finance and Public Submit draft reform of Law promulgated and beingon the Central Government for Credit study Coparticipation Law to implementedfunding Congress; adopted May 1990.
Adninistrative by-laws priorto effectiveness
Convert subsidies received by Ministry of Finance and Public Estaos .shment (with opirating Law promulgated and beingthe municipalities from the Credit study bylaws) of the Municipal implemented, municipalitiesGoverment (especially throurh Investment Fund to be managed have funds to make investmentsinterest rates) into subsidies by BEDE (with bylaws). to give the poor access toclearly targeted for the poor Established in May 1990. mnicipal servicesand which are transparent, Administrative by-laws priorpredictable and gradually to effectivenesstapered off
Facilitate the retention and Promotion of discussions and Implement Article 64, No. 40 Municipalities have their owndevelopment of municipal adoption of mechanisms of the Law on Municipalities standards for administrativepersorviel enabling the municipalities to on a restricted basis, six career development
issue ordinances (SENDA, DNP, months after loanAME and BEDE) effectiveness
Set sectoral priorities and Preparation of "A Proposal for Establish a loan conmmittee Presidential Decree published,policies and coordinate the Municipal Future" study within BEDE at the highest Comittee operatingCentral Goverrunent agencies level to coordinate the actioninvolved in the sector of various agencies. Prior to
loan effectiveness >
0D >
0
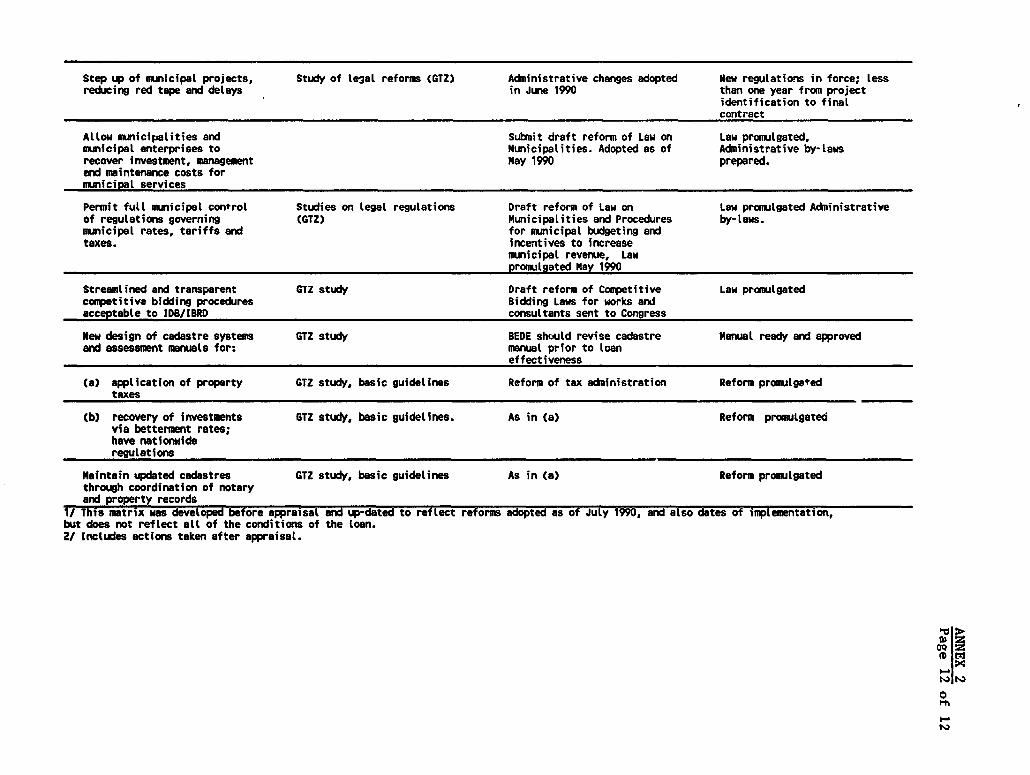
Step up of municipal projects, Study of legal reforms (GTZ) Adninistrative changes adopted New regulations in force; lessreducing red tape and delays in June 1990 than one year from project
identification to finalcontract
Allow municipalities and Submit draft reform of Law on Law promulgated,
municipal enterprises to Municipalities. Adopted as of Acdninistrative by-laws
recover investment, management May 1990 prepared.and maintenance costs formunicipal services
Permit full municipal control Studies on legal regulations Draft reform of Law on Law promulgated Administrativeof regulations governing (GTZ) Municipalities and Procedures by-laws.
municipal rates, tariffs and for municipal budgeting and
taxes. incentives to increasemunicipal revenue, Lawpromulgated May 1990
Streamlined and transparent GTZ study Draft reform of Competitive Law promulgatedcompetitive bidding procedures Bidding Laws for works andacceptable to IDB/IBRD consultants sent to Congress
New design of cadastre systems GTZ study BEDE shcould revise cadastre Manual ready and approvedand assessment manuals for: manual prior to loan
effectiveness
(a) application of property GTZ study, basic guidelines Reform of tax administration Refom promulgatedtaxes
(b) recovery of investments GTZ study, basic guidelines. As in (a) Reform promulgatedvia betterment rates;have nationwideregulations
Maintain updated cadastres GTZ study, basic guidelines As in (a) Reform promulgatedthrough coordination of notaryand property records
1/ This matrix was developed before appraisal and up-dated to reflect reforms adopted as of July 1990, and also dates of implementation,but does not reflect all of the conditions of the loan.2/ Includes actions taken after appraisal.
19
0X X~
I-M
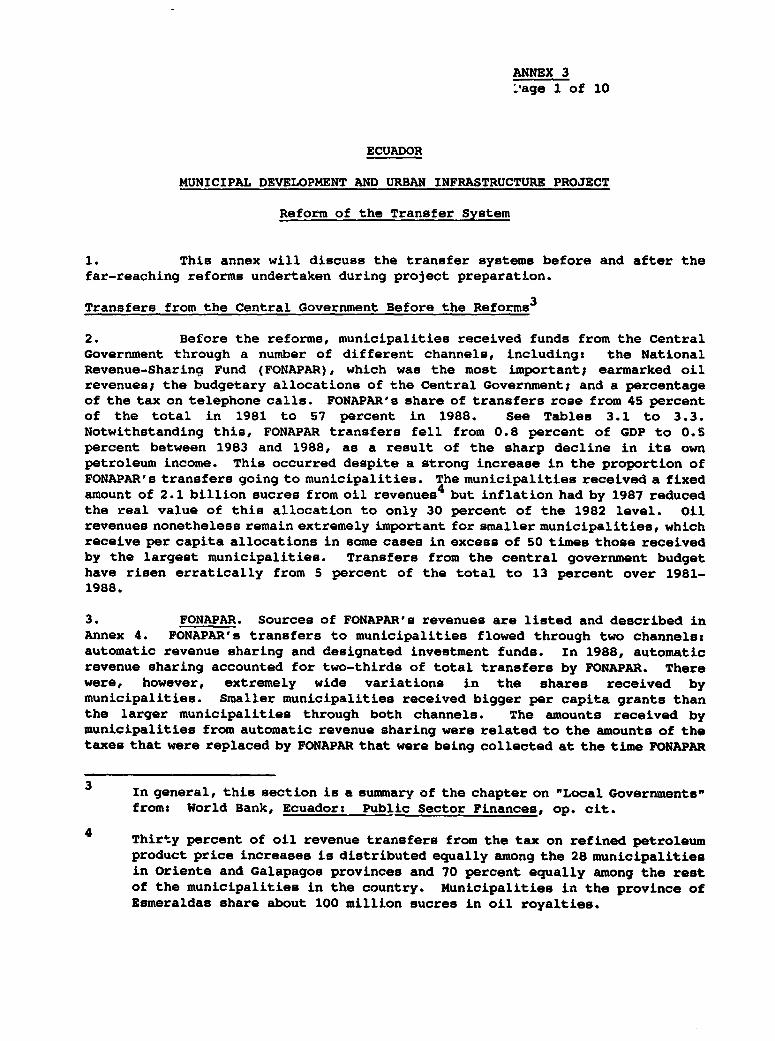
ANNEX 3-age 1 of 10
ECUADOR
MUNICIPAL DEVELOPMENT AND URBAN INFRASTRUCTURE PROJECT
Reform of the Transfer System
1. This annex will discuss the transfer systems before and after thefar-reaching reforms undertaken during project preparation.
Transfers from the Central Government Before the Reforms 3
2. Before the reforms, municipalities received funds from the CentralGovernment through a number of different channels, including: the NationalRevenue-Sharing Fund (FONAPAR), which was the most important; earmarked oilrevenues; the budgetary allocations of the Central Government; and a percentageof the tax on telephone calls. FONAPAR's share of transfers rose from 45 percentof the total in 1981 to 57 percent in 1988. See Tables 3.1 to 3.3.Notwithstanding this, FONAPAR transfers fell from 0.8 percent of GDP to 0.5percent between 1983 and 1988, as a result of the sharp decline in its ownpetroleum income. This occurred despite a strong increase in the proportion ofFONAPAR's transfers going to municipalities. The municipalities received a fixedamount of 2.1 billion sucres from oil revenues4 but inflation had by 1987 reducedthe real value of this allocation to only 30 percent of the 1982 level. Oilrevenues nonetheless remain extremely important for smaller municipalities, whichreceive per capita allocations in some cases in excess of 50 times those receivedby the largest municipalities. Transfers from the central government budgethave risen erratically from 5 percent of the total to 13 percent over 1981-1988.
3. FONAPAR. Sources of FONAPAR's revenues are listed and described inAnnex 4. FONAPAR's transfers to municipalities flowed through two channels:automatic revenue sharing and designated investment funds. In 1988, automaticrevenue sharing accounted for two-thirds of total transfers by FONAPAR. Therewere, however, extremely wide variations in the shares received bymunicipalities. Smaller municipalities received bigger per capita grants thanthe larger municipalities through both channels. The amounts received bymunicipalities from automatic revenue sharing were related to the amounts of thetaxes that were replaced by FONAPAR that were being collected at the time FONAPAR
3 In general, this section is a summary of the chapter on "Local Governments"from: World Bank, Ecuador: Public Sector Finances, op. cit.
4 Thirty percent of oil revenue transfers from the tax on refined petroleumproduct price increases is distributed equally among the 28 municipalitiesin Oriente and Galapagos provinces and 70 percent equally among the restof the municipalities in the country. Municipalities in the province ofEsmeraldas share about 100 million sucres in oil royalties.
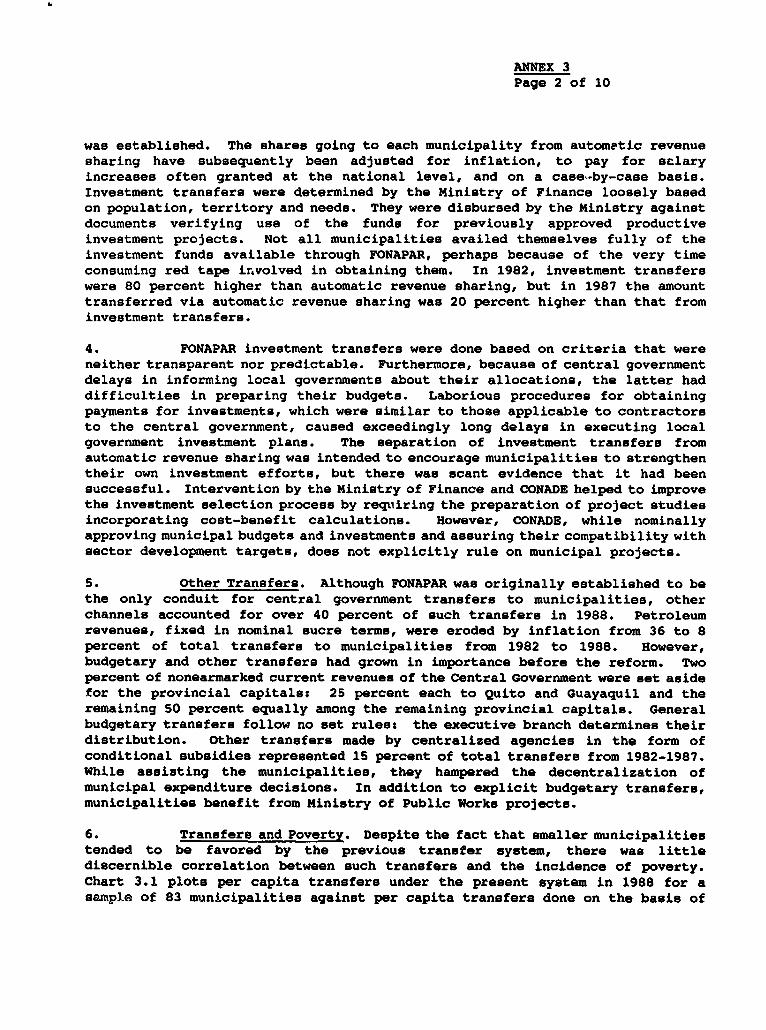
ANNEX 3Page 2 of 10
was established. The shares going to each municipality from autometic revenuesharing have subsequently been adjusted for inflation, to pay for salaryincreases often granted at the national level, and on a case-by-case basis.Investment transfers were determined by the Ministry of Finance loosely basedon population, territory and needs. They were disbursed by the Ministry againstdocuments verifying use of the funds for previously approved productiveinvestment projects. Not all municipalities availed themselves fully of theinvestment funds available through FONAPAR, perhaps because of the very timeconsuming red tape involved in obtaining them. In 1982, investment transferswere 80 percent higher than automatic revenue sharing, but in 1987 the amounttransferred via automatic revenue sharing was 20 percent higher than that frominvestment transfers.
4. FONAPAR investment transfers were done based on criteria that wereneither transparent nor predictable. Furthermore, because of central governmentdelays in informing local governments about their allocations, the latter haddifficulties in preparing their budgets. Laborious procedures for obtainingpayments for investments, which were similar to those applicable to contractorsto the central government, caused exceedingly long delays in executing localgovernment investment plans. The separation of investment transfers fromautomatic revenue sharing was intended to encourage municipalities to strengthentheir own investment efforts, but there was scant evidence that it had beensuccessful. Intervention by the Ministry of Finance and CONADE helped to improvethe investment selection process by requiring the preparation of project studiesincorporating cost-benefit calculations. However, CONADE, while nominallyapproving municipal budgets and investments and assuring their compatibility withsector development targets, does not explicitly rule on municipal projects.
5. Other Transfers. Although FONAPAR was originally established to bethe only conduit for central government transfers to municipalities, otherchannels accounted for over 40 percent of such transfers in 1988. Petroleumrevenues, fixed in nominal sucre terms, were eroded by inflation from 36 to 8percent of total transfers to municipalities from 1982 to 1988. However,budgetary and other transfers had grown in importance before the reform. Twopercent of nonearmarked current revenues of the Central Government were set asidefor the provincial capitals: 25 percent each to Quito and Guayaquil and theremaining 50 percent equally among the remaining provincial capitals. Generalbudgetary transfers follow no set rules: the executive branch determines theirdistribution. Other transfers made by centralized agencies in the form ofconditional subsidies represented 15 percent of total transfers from 1982-1987.While assisting the municipalities, they hampered the decentralization ofmunicipal expenditure decisions. In addition to explicit budgetary transfers,municipalities benefit from Ministry of Public Works projects.
6. Transfers and Poverty. Despite the fact that smaller municipalitiestended to be favored by the previous transfer system, there was littlediscernible correlation between such transfers and the incidence of poverty.Chart 3.1 plots per capita transfers under the present system in 1988 for asample of 83 municipalities against per capita transfers done on the basis of
ANNEX 3Page 3 of 10
an index of poverty.5 There is very little correlation between the actual percapita transfers and those made using the poverty indicator. Chart 3.1 alsoshows the per capita distribution based only on population as a line sloppingupward. This chart shows that many municipalities received much more than theywould have received if the transfers had been done based solely on population.The new revenue sharing system will be based on indices of population, povertyand fiscal effort, albeit defined using different indicators.
7. So then, the process for determining the amount and distribution ofcentral government transfers to the municipalities had become fragmented,arbitrary, non-transparent, and unpredictable, before the adoption of the recentreforms. Furthermore, it did not adequately address the alleviation of poverty.Transfers should be made on the basis of well-defined criteria that impartgreater stability and predictability to the transfer process and encouragemunicipalities to make greater efforts to raise revenues themselves, as is thecase under the new law.
Reform of the Transfer System
8. In accord with the agreements defined in the Policy Letter (See Annex2), Congress passed legislation reforming the whole national/local governmenttransfer system in Nay 1990.6 Under this law, FODESEC (Fondo de DesarrolloSeccional) replaces FONAPAR and will receive the following resources: (a) 2percent of the total non-earmarked resources of the National Budget to bedistributed directly to the provincial capitals; (b) all of the revenuespreviously assigned to FONAPAR; (c) 3 billion sucres per year from the oil exportrevenues (to be adjusted annually beginning in 1991 using the consumer priceindex); and (d) future budget allocations from the National Budget. All of theseresources will be deposited directly into FODESEC's account in the Central Bankfor future distribution to the local governments. In all, the total amount tobe distributed annually via FODESEC should exceed US$87 million.
9. The 2 percent of the non-earmarked National Budget going to theprovincial capitals will be distributed as follows: (a) Quito and Guayaquil willreceive 25 percent each, and (b) the remaining 50 percent will be divided equallyamong the rest of the provincial capitals. The remaining amount of FODESEC (see(b), (c) and (d) in para. 8) will be distributed, first, between provinces andmunicipalities and then among the entities of each of these three groups.Panel A of Chart 3.2 shows the criteria used in the first stage of the
5 Details regarding the construction of the poverty index and the simulationof transfers under a revised system are described in para. 12 of thisannex.
6 Ecuador, Congresso Nacional, LEY DE DESARROLLO SECCIONAL Y DE REFORMAS ALAS LEYES DE REGIMEN MUNICIPAL, REGIMEN TRIBUTARIO INTERNO, ARANCELARIA,ORGANICA DE ADMINISTRACION FINAWCIERA Y DE CONTROL TRIBUTARIO Y FINANCIERO,May 8, 1990.
ANNEX 3Page 4 of 10
distribution:
(a) 20 percent to the Provincial Councils and the Instituto NacionalGalapagos (hereafter, the provinces);
(b) 75 percent to the municipalities; and(c) 5 percent for the Emergency Reserve Account.
10. The 75 percent going to the municipalities will be divided into twoportions: 60 percent for automatic distribution and 40 percent for theInvestment Fund. As panel B of Chart 3.2 demonstrates, the following threecriteria will be used in automatic distribution: (a) 60 percent by population;(b) 30 percent by poverty; and (c) 10 percent by fiscal effort in relation tototal capacity to pay.7 Following IMF guidelines, these resources should beconsidered to be municipal revenues because they are automatically set asidefor municipalities.' The Investment Fund will be the primary source ofcounterpart funds of municipal governments for the proposed IBRD/IDB project.
11. Chart 3.3 summarizes all of the distribution criteria and shows thetotal projected amount to be distributed under each criteria in 1991.
Indices for Distribution in Automatic Revenue Sharing
12. The indices used in the distribution of total transfers in Chart 3.1are from Petrei's report and are operationally defined as follows:9
Population.--The population distribution criteria is the percent of thetotal population in Ecuador living in the municipality in 1988, asprojected by INEC.
Poverty.--This is the inverse of a composite "index of development" thatis calculated using the following four indicators from the 1982 DemographicCensus done by INEC:1 0
7 The 20 percent going to the provinces will be distributed as follows: 60%by population; 20% by geographical area; and 20% by poverty.
8 "It may be useful to attribute tax revenues to noncollecting beneficiarygovernments . . . when under provisions of the tax law they automaticallyreceive a given percentage of the tax collected." IMF, A Manual onGovernment Finance Statistics, Washington, D.C., 1986, p. 53.
9 A. Humberto Petrei, ECUADOR: TRANSFERENCIAS DEL GOBIERNO CENTRAL A LOSGOBIERNOS SECCIONALES, Quito, Gobierno de Ecuador, Noviembre de 1989.
10 ibid., "Indice de Desarrollo" in Petrei's Report (last column of Cuadro
C.1 in Annex C).
ANNEX 3Page 5 of 10
Education: Average years of schooling.Watert Percent of households connected to the public water system.Electricity: Percent of households with electricity.Housings Percent of units constructed of durable materials and notcrowded.
Each of these four variables is divided by the corresponding average orpercentage for the country as a whole, so that each indicator shows the percentthat a given municipality is above or below the nation as whole with regard toeach indicator. The "Development Index" is the simple average of these fourvariables. The Unstandardized Poverty Index is calculated by multiplying theinverse of the Development Index by percent population in the municipalities.The Unstandardized Poverty Index (which is population weighted by poverty) wasthen standardized so that it sums to one, by dividing the unstandardizedindicator for each local government by its sum for all local governments. Thisstandardized poverty index was then multiplied by the total amount to betransferred in 1988 to arrive at the per capita estimates used in Chart 3.1.
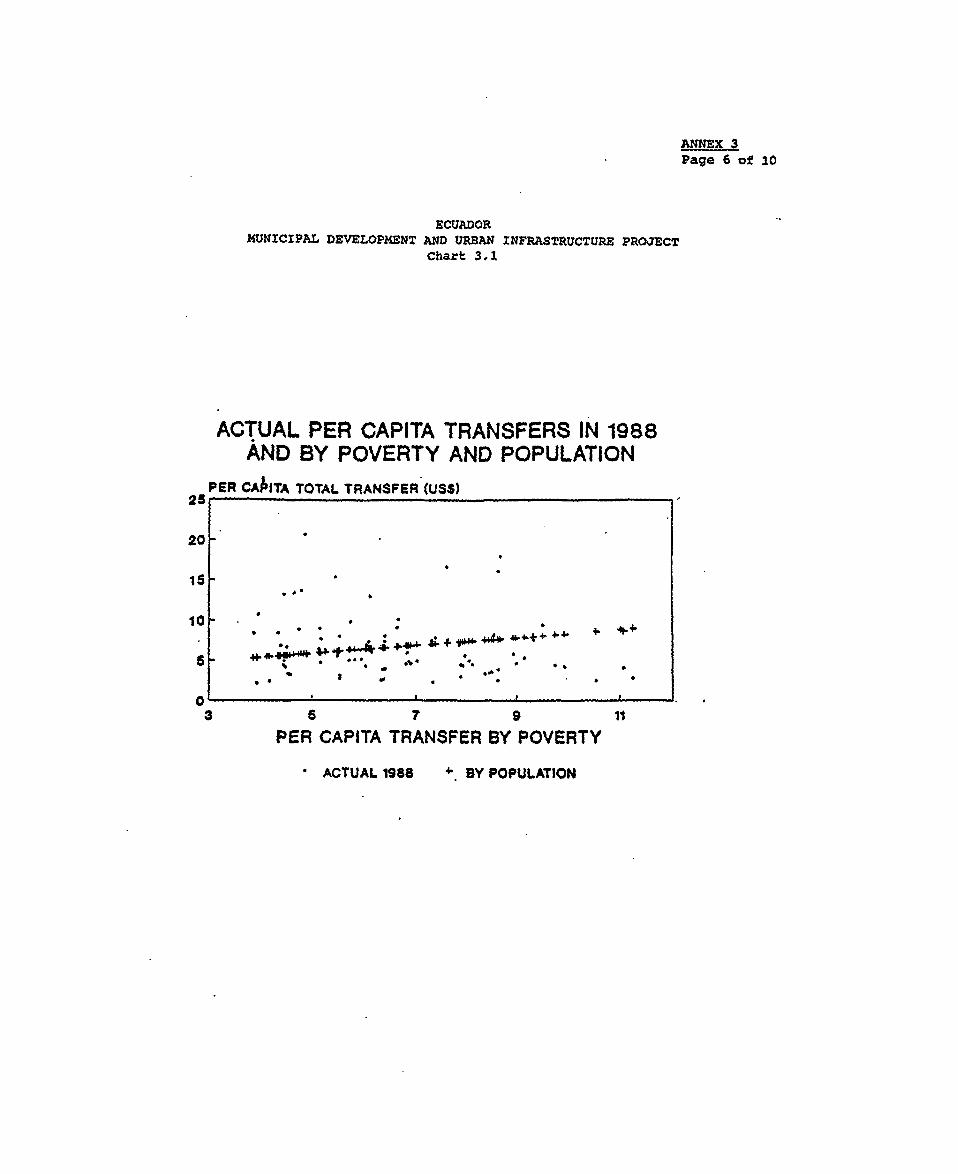
ANNEX 3Page 6 of 10
ECUADORMUNICIPAL DEVELOPMENT AND UP.BAN INFRASTRUCTURE PROJECT
Chart 3.1
ACTUAL PER CAPITA TRANSFERS IN 1988AND BY POVERTY AND POPULATION
PER CAAITA TOTAL TRANSFER (USS)25
20
4.~~~~
15.
10 *r#ts 44.*"; v
O3 t 7 8 1t
PER CAPITA TRANSFER BY POVERTY
ACTUAL 1988 4 BY POPULATION
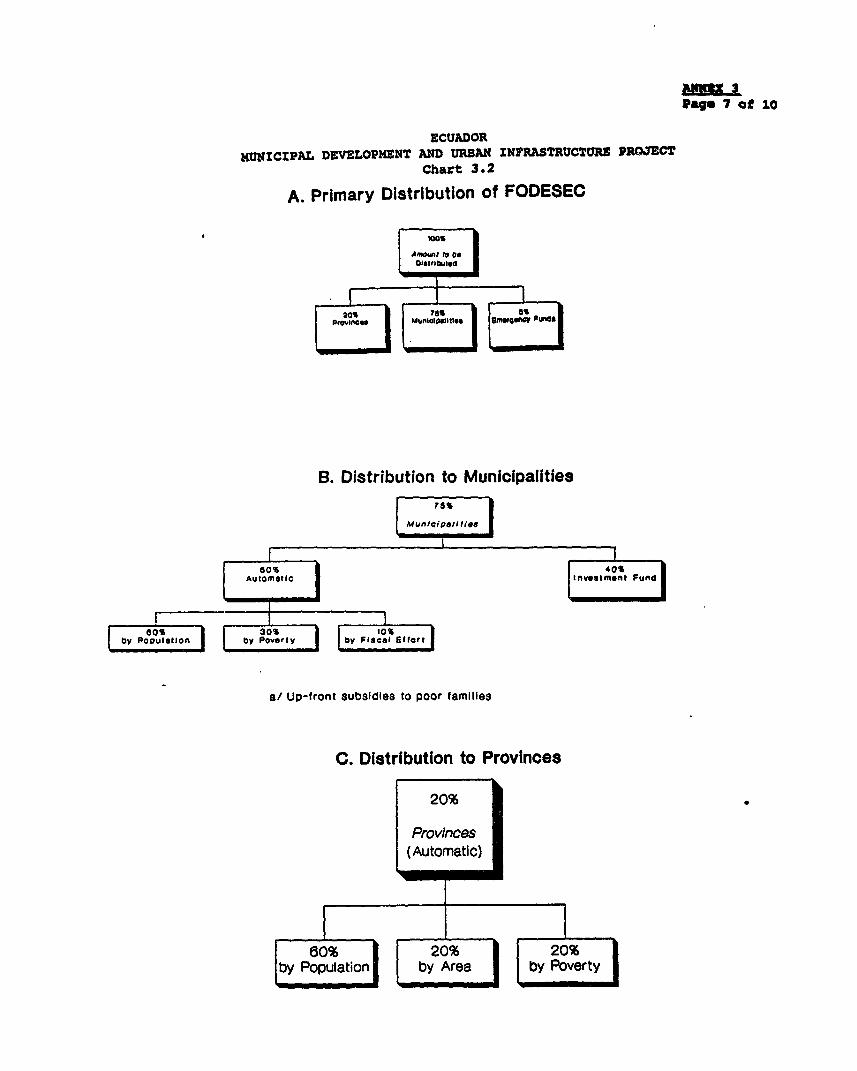
AM=lZ 3Page 7 of 10
ECUADOR
KIUNICIPAL DEVELOPMENT AND URBAN INFRASTRUCTURE PROJECTChart 3.2
A. Primary Distribution of FODESEC
100% 1Amjn to iee
B. Distribution to Municipalities
20%~~~~~~0
{ Automatic | tnvos(menm Funatc
050% 1 30S 10%by POVulation by OV Pt oty bP F bScAr Ebf P rt
a/ UP-front subsZide-s to poor families
C. Distribution to Provinces
20%
Provlnces (Automatic)|
60% 20% 20% by Population by Area by poverty
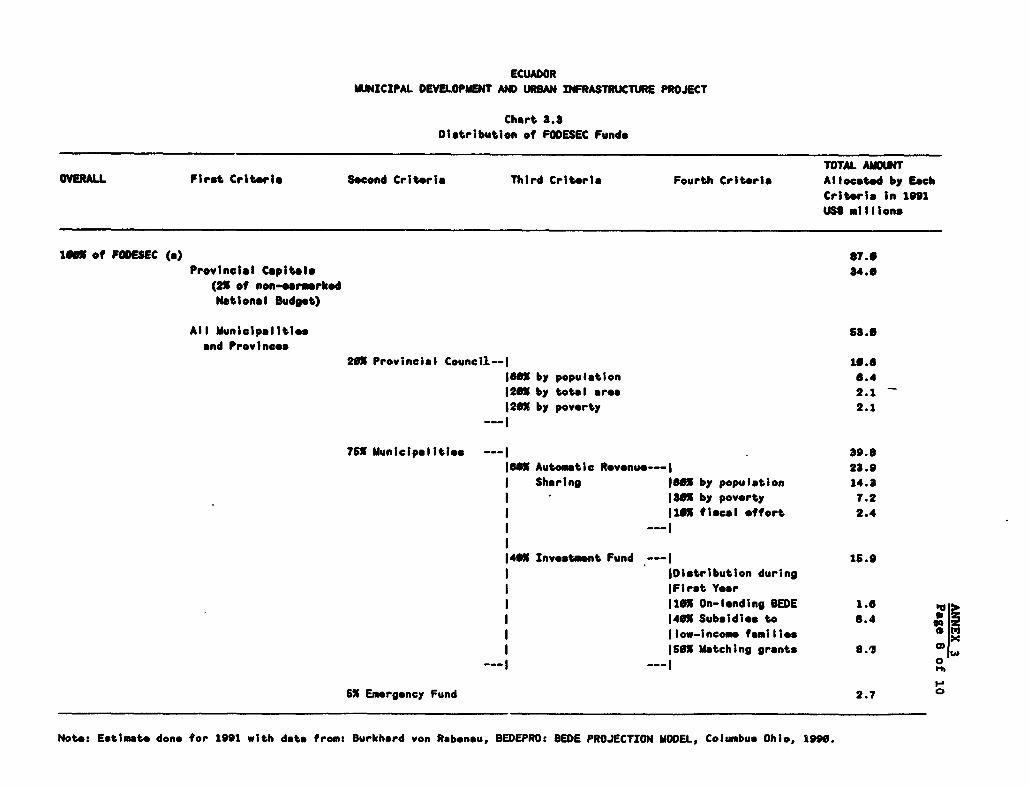
ECUADORMWNICIPAL DEVELOPMENT AND URBAN INFRASTRUCTURE PROJECT
Chart 3.3Distribution of FODESEC Funds
TOTAL AMOUNTOVERALL First Criteria Second Criteria Third Criteria Fourth Criteria Allocated by Each
Criteris in 1991US millions
19X of FODESEC (a) 07.5Provinclal Capitals 34.3
(21 of non-armarkedNational Budget)
All Municipalities 53.0and Provincos
20X Provincial Council--I 10.8169X by population 6.4120 by total area 2.1 -
120X by poverty 2.1
76X Municipalities --- l 39.0J69X Automatic Rovenue---l 23.9
Sharing 1651 by population 14.3I 39 by poverty 7.2119X fiscal effort 2.4
I --- ~~~~~~~~~~~~~~~~~~~I
149X Investmnt Fund ---I 16.9I IDastribution duringI lFirst YearI 110X On-lending BEDE 1.6
140X Subsidies to 6.4 el'I hlow-incom familiosI 160X Matching grants 80.'3
___I ___--I o
65 Emergency Fund 2.7
Note: Estimate done for 1991 with data from: Burkhard von Rubonou, BEDEPRO: BEDE PROJECTION MODEL, Columbus Ohio, 193.
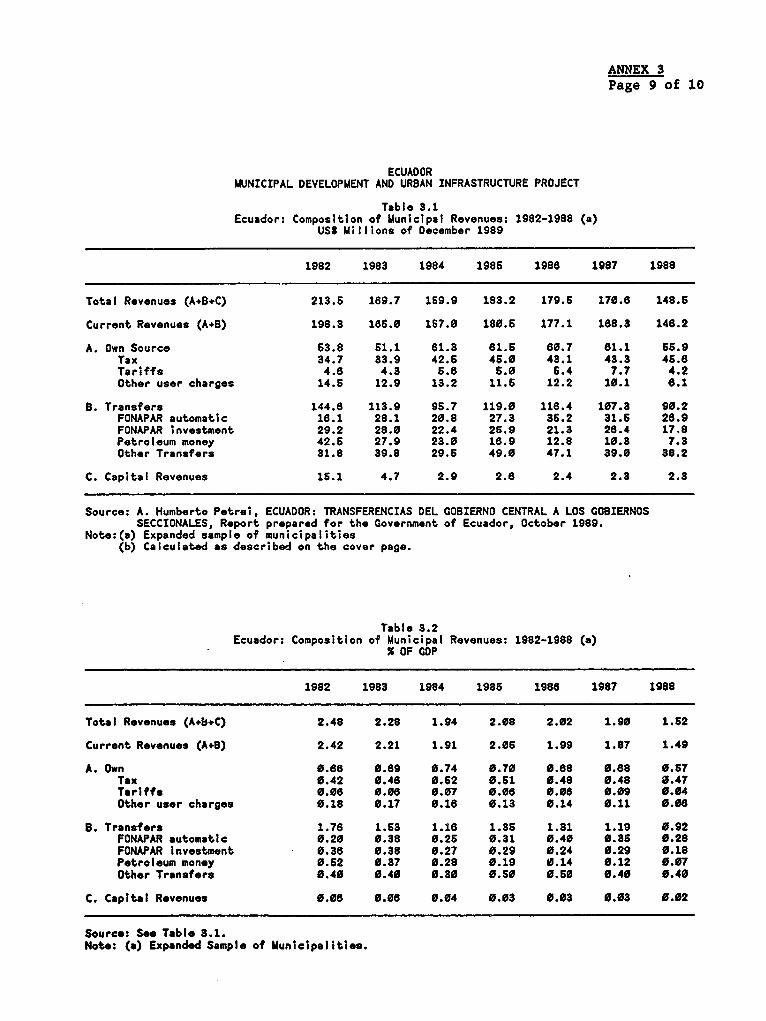
ANNEX 3Page 9 of 10
ECUADORMUNICIPAL DEVELOPMENT AND URBAN INFRASTRUCTURE PROJECT
Table 3.1Ecuador: Composition of Municipal Revenues: 1982-1988 (a)
USS Millions of December 1989
1982 1983 1984 1986 1988 1987 1988
Total Revenues (A+B+C) 213.6 189.7 169.9 183.2 179.6 170.8 148.5
Current Revenues (A+B) 198.3 186.0 167.0 180.6 177.1 168.3 148.2
A. Own Source 63.8 61.1 61.3 61.6 60.7 81.1 66.9Tax 34.7 33.9 42.5 46.0 43.1 43.3 45.6Tariffs 4.6 4.3 6.6 5.0 6.4 7.7 4.2Other user charges 14.5 12.9 13.2 11.6 12.2 10.1 6.1
B. Transfers 144.6 113.9 95.7 119.0 116.4 107.3 90.2FONAPAR automatic 16.1 28.1 20.8 27.3 36.2 31.6 28.9FONAPAR investment 29.2 28.0 22.4 25.9 21.3 26.4 17.8Petroleum money 42.6 27.9 23.0 16.9 12.8 10.3 7.3Other Transfers 31.8 39.8 29.6 49.0 47.1 39.0 38.2
C. Capital Revenues 16.1 4.7 2.9 2.6 2.4 2.3 2.3
Source: A. Humberto Petrei, ECUADOR: TRANSFERENCIAS DEL COBIERNO CENTRAL A LOS GOBIERNOSSECCIONALES, Report prepared for the Government of Ecuador, October 1989.
Note:(a) Expanded sample of municipalities(b) Calculated as described on the cover page.
Table 3.2Ecuador: Composition of Municipal Revenues: 1982-1988 (a)
S OF GOP
1982 1983 1984 1985 1986 1987 1988
Total Revenues (A+b+C) 2.48 2.28 1.94 2.08 2.02 1.90 1.52
Current Revenues (A+B) 2.42 2.21 1.91 2.06 1.99 1.87 1.49
A. Own 0.86 0.69 0.74 0.70 0.88 0.88 0.57Tax 0.42 0.48 0.62 0.61 0.48 0.48 0.47Tariffs 0.08 0.06 0.07 0.06 0.06 0.09 0.04Other user charges 0.18 0.17 0.16 0.13 0.14 0.11 0.06
B. Transfers 1.76 1.53 1.16 1.35 1.31 1.19 0.92FONAPAR automatic 0.20 0.38 0.26 0.31 0.40 0.36 0.28FONAPAR investment 0.36 0.38 0.27 0.29 0.24 0.29 0.18Petroleum money 0.52 0.37 0.28 0.19 0.14 0.12 0.07Other Transfers 0.40 0.40 0.30 0.50 0.50 0.40 0.40
C. Capital Revenues 0.06 0.06 0.04 0.03 0.03 0.03 0.02
Source: See Table 3.1.Note: (a) Expanded Sample of Municipalities.
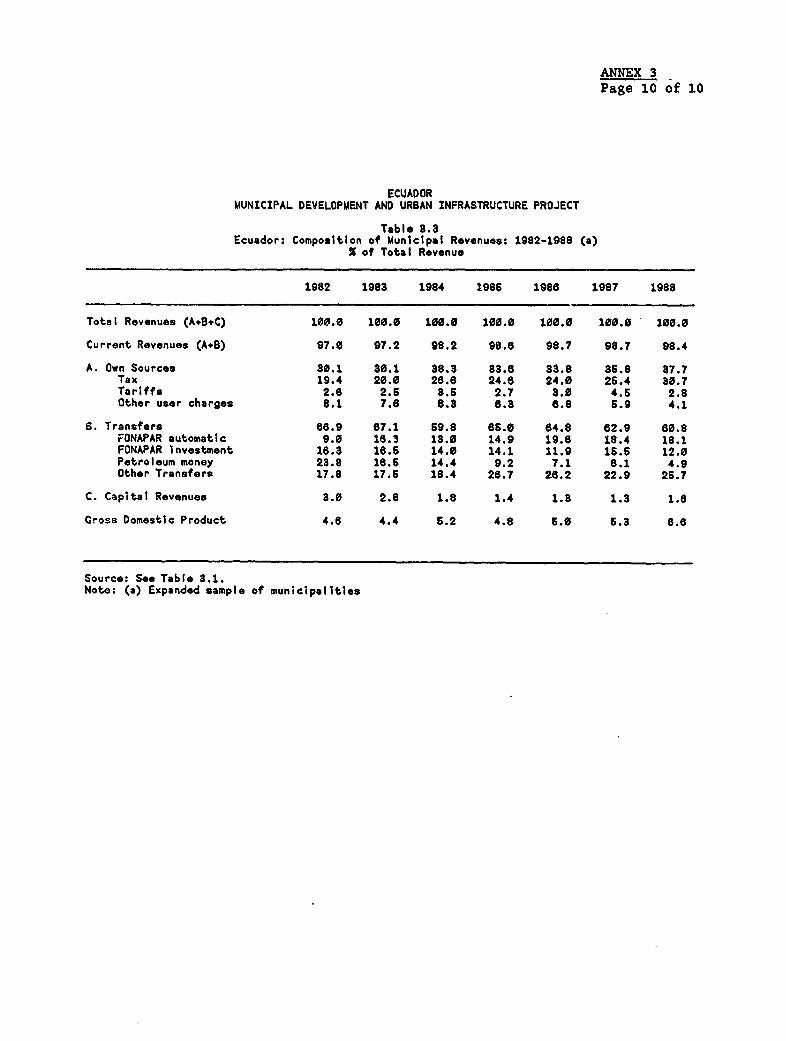
ANNEX 3Page 10 of 10
ECUADORMUNICIPAL DEVELOPMENT AND URBAN INFRASTRUCTURE PROJECT
Table 3.3Ecuador: Composition of Municipal Revenues: 1982-1988 (a)
X of Total Revenue
1982 1983 1984 1986 1988 1987 1988
Total Revenues (A+B+C) 100.0 100.0 100.0 100.0 100.0 100.0 100.0
Current Revenues (A+B) 97.0 97.2 98.2 98.6 98.7 98.7 98.4
A. Own Sources 30.1 30.1 38.3 83.6 33.8 36.8 37.7Tax 19.4 20.0 268. 24.6 24.0 26.4 30.7Tariffs 2.6 2.5 3.5 2.7 3.0 4.6 2.8Other user charges 8.1 7.8 8.3 6.3 8.8 6.9 4.1
S. Transfers 68.9 67.1 59.8 65.0 64.8 82.9 60.8FONAPAR automatic 9.0 18.3 13.0 14.9 19.6 18.4 18.1FONAPAR Investment 16.3 16.5 14.0 14.1 11.9 156. 12.0Petroleum money 23.8 16.5 14.4 9.2 7.1 8.1 4.9Other Transfers 17.8 17.5 18.4 28.7 26.2 22.9 25.7
C. Capital Revenues 3.0 2.8 1.8 1.4 1.3 1.3 1.8
Gross Domestic Product 4.8 4.4 5.2 4.8 6.0 5.3 8.6
Source: See Table 3.1.Note. (a) Expanded sample of municipalities
ANNEX 4Page 1 of 17
ECUADOR
MUNICIPAL DEVELOPMENT AND URBAN INFRASTRUCTURE PROJECT
BEDEs: Financial Statements and Projections
1. BEDE was formed in 1976 (Decreto Supremo No. 774 of 9/30/1976) andis regulated by v-he Superintendencia de Bancos. Although there are provisionsfor private ownerahip in its charter, BEDE is 100% owned by the Government. Itsmain objectives are to: finance projects, civil works and services of the publicsector including local governments; and act as financial agent for the publicsector.
Financial Performance and Position
2. BEDE's balance sheet and income statement for 1986-89 in 1989 dollars(see Tables 4.1 and 4.2) show the negative impact of its fixed interest ratepolicy in the face of inflation rates ranging from 27% in 1986 to 86% in 1988.The real value of the loan portfolio dropped at an annual rate of 39.3% duringthis period. Net real earnings plummeted at an annual rate of 42.1%. Duringthis period, BEDE's most important asset was its loan portfolio (62% in 1986,and 85% in 1989). BEDE is essentially a "transfer bank" and borrows very little.Although BEDE has issued bonds, they have been purchased by the Government atfixed and highly negative interest rates. Thus, these bonds are more liketransfers from the Government to BEDE than borrowing. In this highlyinflationary environment, real interest income dropped from US$148.6 million in1986 to only US$18.5 million in 1989. BEDE's net worth dropped from US$1.4billion in 1986 to only US$134 million in 1989 for two main reasons: (a) thedrop in net earnings due to the precipitous drop in real interest; and (b)decline in capital transfers from oil due to the drop in the international priceof oil and the 1987 earthquake, which significantly disrupted oil production inEcuador.
3. BEDE has virtually no arrears in its loan portfolio. Almost 72% ofthis portfolio as of December 1989 was to the Central Government and the restto local governments. Loans to local governments are guaranteed by their revenuesharing funds. In other words, if the local governments don't pay, theGovernment just deducts the amount owed from their revenue sharing funds.
4. Given that it is a transfer bank, many of the indicators normallyused to analyze commercial banks and other lending institutions are notpertinent. For example, BEDE's debt/equity ratio was 1:11 in 1986 versus anaverage of 9:1 for private commercial banks in Ecuador and most other LatinAmerican countries. Due to the transfers from the Government, BEDE has not hadto borrow funds, and, therefore, has virtually no liabilities. Bonds issued it1987 and 1988 to the Central Bank are expected to be repaid by 1993.
ANNEX 4Page 2 of 17
Financial Projections
5. BEDE is now redesigning its lending policies, switching from fixedinterest loans at below market rates to loans with adjustable rates which willeventually reach commercial levels, as well as streamlining its procedures tosubstantially reduce diebursements lags.
6. BEDE's Projection Model (BEDEPRO) is designed to evaluate alternativedevelopment scenarios to assist bank management with a projection horizon of 15years. It is a Lotus based set of tables that includes all major BEDE accountsas well as information on the economic snvironment in which BEDE operates.Specifically, the main components of the framework aret
(1) Economic Environment: Indicators on BEDE's economic environmentlncluding assumptions with regard to inflation, economic growth,financial conditions, government growth, and petroleum productionand consumption. These assumptions are then used to project thegovernment budget, revenue sharing funds, BEDE capital assistance,and BEDE interest rates.
(2) Resource Mobilizationt Projections of BEDS's sources of funds,including bonds, international and domestic loans, governmenttransfers, and amortization of BEDE loans.
(3) BEDE Lending: Targets for lending operations for the IBRD-IDBmunicipal program and BEDE's regular lending program. The targetsare set in terms of loan approvals and are translated intodisbursements through lag functions that reflect BEDE implementationcapacity. The model then tracks outstanding debt, disbureements,repayments, and other loan accounts by credit line and aggregatesthem to their relevant account totals.
(4) BEDE Operation and Administration: Estimation of BEDE's totaloperating cost as a function of its cost structure (fixed andvariable cost by activity type), and based on assumptions about therigidity in BEDE's response to excess capacity.
(5) Financial Accounts and Indicators: Summary of BEDE accounts.
7. Results from the Base Case. The base case projections (see Tables4.3 to 4.4) show how BEDE's future will evolve as a result of three main changess(a) the IBRD-IDB loan which will give BEDE experience in financialintermediation, that is, in borrowing resources at a cost to re-lend; (b)recapitalization of BEDE through government assistance; and (c) revision inBEDE's interest policies. A description of the main assumptions used for thebase case appears in the following section.
8. The base case suggests that these policies will be very effective,so effective in fact that it is unlikely that BEDE will need to borrow again forthe foreseeable future. Current government intent (written into various laws
ANNEX 4Page 3 of 17
and agreements) is to raise BEDE capital assistance by a factor of more than six(in constant prices) in a period of two years. Hence, capital assistance fromall sources wlll rise from US$5.6 million in 1989 to US$25.6 million in 1990,and will stabilize at a level of US$37.4 million starting in 1991 (all inconstant 1989 prices).
9. The rise in capital assistance, coupled with the IBRD-IDB loan andchanges in BEDE's interest policies, allow BEDE to grow at a rapid rate. Thebase case suggests that project approvals will rise from US$59.2 million in 1989to US$82.6 million in 1990 (in constant prices), and continue to rise thereafterat an annual average real rate of 10.5%. Disbursements will almost double eachyear between 1989 and 1992, and then slow to an average annual growth rate of10%. Given these growth rates, it is unlikely that BEDE will see a need to tapthe financial markets for additional resources.
10. Hence, the direct impact of the IBRD-IDB loan on BEDE resourcemobilization is temporary. The debt/equity ratio shifts from 1:6 in 1989 to 1:3in 1993 as a result of the IBRD-IDB loan, but then moves to 1:16 in 2000 and tolt48 by 2004. Similarly, the ratio of interest received to interest paid dropsfrom 10.4 in 1989 to 2.9 by 1992, but eventually rises to 60.5 by the Year 2004.An obvious possibility of course is that government transfers will turn out tobe much smaller than projected. A sensitivity run considers this concern andthe possibility of domestic resource mobilization.
11. Because BEDE has little debt and arrears are small, there is littleconcern with capital adequacy, asset quality, and liquidity, and the usual ratiosare not examined, though they are calculated in the model. ?rofitability,however, must be a major concern, and is examined in Table 4.5. It suggests thatthe changes in BEDE interest policies and the switch to adjustable rats loanswill be sufficient to improve BEDE earnings and to establish BEDE as a viableinstitution. The real rate of return on net worth (earnings over net worth,adjusted for inflation) is -38.0% in 1989, rising to -13.8% by 1992. It becomespositive for the first time in 1997 and eventually rises to 3.2% by the Year2004. While this result is encouraging, it also suggests that the turnarourndfor BEDE will not be a quick one, due to the gradual adjustment of the interestrates to market levels and portfolio of loans at fixed rates. It will takeconsistently high interest rates for BEDE to overcome the drag on profitabilityby the existing loan portfolio, unless inflation drops dramatically to 12% orless.
12. Sensitivity Analysis. Sensitivity analysis is done by systematicallyaltering the values of five crucial variables in the base case:
-- Interest rate drops from 5% real in base case to 2% reall
-- Interest rate drops to zero;
-- Supervision and commitment fee reduced to zero;
-- Inflation rate that stays at 40% over the entire period rather than
ANNEX 4Page 4 of 17
declining from 50% in 1990 to 15% in 1994, as in the base case;
-- Capital assistance from the Provincial Development Fund and FODESECdeclines to 50% of base case levels in 1995; to 25% in 1996, and tozero thereafter.
Tables 4.5 and 4.6 show the impact of these changes from the base case on the.eal rate of return on net worth and net worth (Table 4.5) and also on averageannual disbursement and annual real growth of disbursement (Table 4.6).
13. Obviously, this result depends crucially on BEDE's interest ratepolicy. As seen in Table 4.5, a drop from 5% to 2% in the real rate of returnwill postpone BEDE profitability to the twenty-first century; a drop to zero realrate points will keep BEDE unprofitable past the end of the projection period.
14. Other fees and spreads are also quite important, including the BEDEspread on its IBRD-IDB loan and the supervision and commitment fees BEDE chargeson all its loans. Indeed, the latter are important to BEDE profitability.Elimination of the supervision and commitment fees would reduce but not eliminateprofitability. The rate of return declines between 1 and 2 points, from -0.9%to -2.4% in 1995, an-] from 3.2% to 2.0% in the year 2004.
15. Still another concern are higher inflation rates. These would reducethe value of the current loan portfolio, which consists of fixed interest loans,and hence may be expected to reduce profitability. However, with adjustable rateloans and high inflation rates, the lending volume in constant prices risessubstantially, as real loan repayments become heavily tilted to the front-endof the loan term. Since commitment and supervision fees are strongly relatedto the turnover of BEDE capital, high inflation rates lead to increased BEDEearnings and increased capitalization.
16. A final concern is availability of public resources for BEDEassistance. A sensitivity analysis was undertaken to determine impact fromreduced assistance starting in 1995. Specifically, the analysis assumes thatassistance from the Provincial Development Fund and FODESEC declines to 50% ofbase case levels in 1995, to 25% in 1996, and to zero thereafter. This willreduce average disbursements over the projection horizon by more than 35% frombase case levels (Table 4.6), reduce DEDE net worth by more than 35% by the year2000 (Table 4.5), but will not substantially affect the rate of return (Table4.5). Even in this case, however, the average rate of growth of disbursementsfor the 15 years of the projection horizon is 9.8% in real terms, though mostof this growth occurs during the first four years of the projection. In the 11years beyond 1993, disbursemer'. row at only 2.1% in real terms.
Principal Government Transfers to BEDE
17. During the mid-1970s as much as 30% of total oil revenues werechanneled to BEDE, but rigid distribution quotas and rapid inflation reduced thisto 8.2% in 1980 and 0.5% in 1989. This and the rapid erosion of BEDE's assetbase led to a decline in BEDE lending that is only now being reversed under a
ANNEX 4Page 5 of 17
series of laws and agreements that aim to recapitalize BEDE. The principalsources of capital assistance to BEDE are:
(a) The Municipal Investment Fund will receive 40% of FODESEC funds goingto municipalities (see para. 10 or Annex 3).
(b) Capital Assistance by the Ministry of Finance in the amount of 25%of the IBRD-IDB loan, under the subsidiary agreement between BEDEand the Ministry of Finance. BEDE would repay 75% of the totalprincipal of this loan, keeping the other 25% to be capitalized inthe form of shares for municipalities up to a limit of 24% of theequity, subject to the review of the Government, which could requirehigher repayment in accord with its overall macroeconomic objectives.Any amount in excess of this 24% would go to a reserve account thatwould compensate the Government for exchange losses.
(c) A Provincial Development Fund created under a law of March 11, 1990that transfers 2% of the Central Government's net operating budgetto BEDE for capitalization in the form of shares for the provinces.
(d) Funds for rural road development in Manabi, which become BEDE capitalunder the Ley de Creacion del Programa de Vialidad Rural de Manabi.
(e) Funds obtained through the legalization of loans of BEDE'spredecessor that become BEDE capital upon loan recovery.
(f) Direct participation in petroleum revenues, based on the allocationsystem established in the 1970s and modified through the 1989 Lawof Petroecuador.
19. Base Case Assumptions. The model is extensive and includes severalhundred parameters. The most important assumptions of the base case scenarioare:
Economic Environment
Inflation: Rates are taken from recent Bank projections and assumea decline from 50% in 1990 to 15% in 1994. They are constantthereafter.
GDP Growth: In line with Bank projections, GDP grows 3.5% in 1990and 5.0% thereafter.
Commercial Lending Rates: This is the market rate (tasa libre decontratacion) charged by commercial banks on their short-term (90day) loans. The rate is estimated to be around 5.0% in real termsin 1990, and the base case assumes a continuation at that level.
Exchange Rates: The exchange rate exactly compensates for inflationdifferentials between sucres and dollars. The US inflation rate is
ANNEX 4Page 5 of 17
assumed to be 5% throughout. The intervention rate is lagged
relative to the market rate. The effect is that the intervention
rate during most of the planning horizon is about 2% below the market
rate. Resources from the IBRD-IDB loan are exchanged based on the
intervention rate.
Government Current Income: A share of 2% of the Government's non-
earmarked funds each go to FODESEC and the new Provincial DevelopmentFund. Government current income is assumed to be a constantproportion of GDP, and earmarked funds are a constant share of total
current income.
Petroleum Revenues: These are projected to determine the base for
BEDE and FODESEC's revenue sharing, and generally are consistent withBank assumptions before the recent rise of international oil prices:
(a) production peaks in 1994 with 111.6 million barrels and by 1998
declines at a rate of 10% per annum; (b) domestic consumption
declines following a regime of real price increases, and does not
regain its 1989 volume of 34.8 million barrels until 1999; (c) export
prices (in current US dollars) grow at an average annual rate of 2%
in constant prices; and (d) unit production cost rise initially at
an annual real rate of 4% declining to 2%, as a result of the growing
exploration cost and the New Petroecuador Law which permits this
entity to recover all costs of production.
Petroecuador Funds for BEDE/FODESEC Revenue Sharing are projected
as total production net of domestic consumption (in barrels) valued
at export prices (in US dollars), net of royalties, militarycontributions, cost of production, ini -est expenditures, and a 10%
share of the remainder for Petroecuad,.. investments. The remainder
is then allocated to BEDE and FODESEC based on an exchange rate of
44 sucres to the dollar, based on shares established by existing laws
with separate consideration of the appropriate TEXACO and CEPE
revenues. Projections assume a price elasticity of domestic
consumption of -0.6 and a GDP elasticity of 0.8.
BEDE Resource Mobilization
BEDE Petrosucre Revenue Sharing: BEDE participates in TEXACO and CEPE
revenues. Under base case assumptions, BEDE revenues from this
source decline to zero by the Year 2003 (though oil production
continues well beyond).
BEDE Share in Provincial Development Fund: Under the new Law
governing the Provincial Development Fund, BEDE receives a 2% share
of the Central Government's non-earmarked operating budget from non-petroleum sources. The funds are for BEDE capitalization (lent toProvincial Governments) and constrained to be less than 25% of BEDE's
paid-up capital.
ANNEX 4Page 7 of 17
FODESEC: FODESEC funds are projected based on: (a) the CentralGovernment's non-earmarked operating budget; (b) petrosucre revenuesharing; and (c) GDP (based on FONAPAR shares in import duties anddomestic taxes). Of the FODESEC funds, 73.5% are for municipalities,of which 40% are for investments.
IBRD-IDB Loan: Loan conditions are specified for each of theindividual loan components. The interest rate paid by BEDE isassumed adjustable, equal to the rate at which BEDE lends, minus anadministrative spread of 20% of the lending rate. A 5 percentagepoint spread has been accepted by IBRD and the Ministry of Financein past Bank lending, and would exceed the spread assumed for thebase for years beyond 1993, when BEDE's lending rate will be lessthan 25%.
Capital Assistance: BEDE receives 25% of the IBRD-IDB loan as capitalassistance, up to a limit of 25% of BEDE paid-up capital. However,it pays interest, supervision and commitment on the capitalassistance portion.
Other International Loans: A loan by the German Democratic Republicfor machinery will not be disbursed. BEDE will receive USAID fundsof US$0.6 million both in 1990 and 1991 for housing and localinfrastructure projects on which it earns a 4 point spread. Otherloans can be entered into the model, but none has been assumed forthe base case.
Bonds: Bonds issued prior to 1989 are being repaid by 1993. No newbonds are issued.
Manabi Rural Road Program: BEDE receives US$16.9 million (in constantprices of 1989) in capital assistance under a 1990 Law on the ManabiRural Road Development Program. Disbursements are between 1991 and1996.
Retained Earnings: All earnings are retained, and become paid-upcapital with a one-year lag.
BEDE Development Lending
BEDE Implementation of IBRD-IDB Municipal Program: BED! prepares itsMunicipal Development Projects during the four-year period 1990-1993.Of the approved loans, 60% are signed the same year and 40% thefollowing year. Of the signed loans, 30% are disbursed the sameyear, and 40 and 30%, respectively, during the following two years.This leads to a disbursement profile of 3.6% of total funds in 1990,11.7% in 1991, 22.1% in 1992, 27.1% in 1993, 22.1% in 1994, and theremaining 13.4% in 1995 and 1996. The projected disbursement lagsare much shorter than those experienced by BEDE in the past. Torealize them, procurement practices must be streamlined and
ANNEX 4Page 8 of 17
implementation procedures improved.
Regular BEDE Lending Program: This program captures all BEDE lending
outside the IBRD-IDB program, including municipal lending required
under the terms of the IBRD-IDB loan for five years afterdisbursement is completed in 1996. The growth rates for project
approvals have been set to maximize total lending, subject to
availability of BEDE funds.
BEDE Loans Types: BEDE offers five types of loans, three for the
IBRD-IDB program and two in the regular program. Under the term of
the IBRD-IDB loan, all future BEDE lending must be at the same
adjustable interest rate, both in the IBRD-IDB Municipal DevelopmentProgram and in BEDE's regular lending program. However, during 1990
almost all BEDE lending will continue at below market fixed rates
that average 13%. To model this, one of the two types of loans in
the regular lending program has been used for these conditions.
BEDE Lending Rate: Future BEDE lending will be at adjustable rates
equal to (an average) 37.5% in 1990 and growing biannually to the
tasa de contratacion (short-term commercial lending rate) not later
than mid-1992. Beyond this the BEDE lending rate equals the short-
term commercial rate.
Other BEDE Lending Conditio..s: The loan term varies between 10 and
17 years for the IBRD-IDB program. It is 10 years for loans in
BEDE's regular lending program. BEDE charges a 2% supervision charge
on disbursements, and a 2% commitment rate on undisbursed funds.
BEDE Administration and Operation
Administrative Cost Structure: LEDE's personnel cost structure is
based on 325 employees in 1989, 20% excess capacity in 1989, and 20%
of staff in fixed administrative tasks. Variable cost are projected
based on the level of three BEDE activities: loan preparation
(measured by loan approval), loan disbursement, and loan collection
(total debt service). Unit cost (or staff productivity) is estimated
based on the recent distribution of staff among the three activities.
Similar assumptions are made to establish the structure of operating
cost.
Capacity Adjustments: BEDE staff capacity is upwardly flexible and
downwardly rigid. New staff and operating capacity is added as
needed by BEDE activities. Capacity declines at the natural
"retirement ratew of 2% per year.
Cash Management: All BEDE capital assistance is channeled through
the Central Bank, where it remains inaccessible to cash management
until specific project disbursement requests are presented. In
principle, BEDE could ask for funding authorization from the Junta
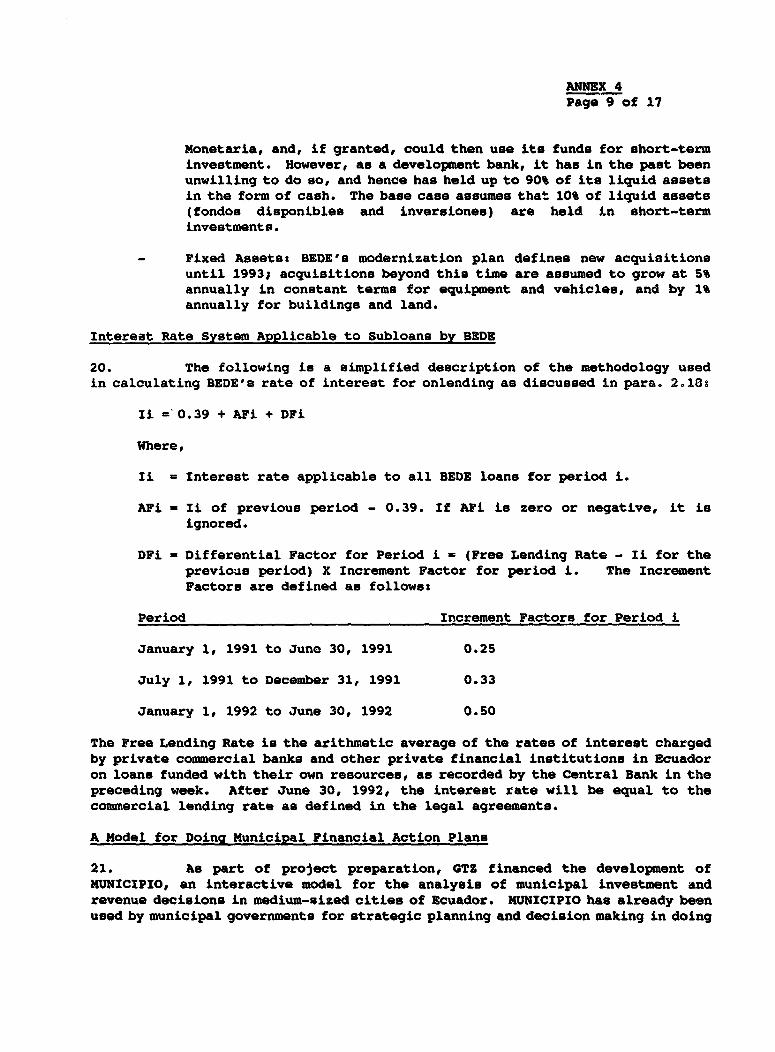
ANNEX 4Page 9 of 17
Monetaria, and, if granted, could then use its funds for short-terminvestment. However, as a development bank, it has in the past beenunwilling to do 90, and hence has held up to 90% of its liquid assetsin the form of cash. The base case assumes that 10% of liquid assets(fondos disponibles and inversiones) are held in short-terminvestments.
- Fixed Assets: BEDE's modernization plan defines new acquisitionsuntil 19931 acquisitions beyond this time are assumed to grow at 5%annually in constant terms for equipment and vehicles, and by 1%annually for buildings and land.
Interest Rate System Applicable to Subloans by BEDE
20. The following is a simplified description of the methodology usedin calculating BEDE's rate of interest for onlending as discussed in para. 2.18:
Ii = 0.39 + AFi + DFi
Where,
IL = Interest rate applicable to all BEDE loans for period i.
AFi = Ii of previous period - 0.39. If AFi is zero or negative, it isignored.
DFi - Differential Factor for Period i = (Free Lending Rate - Ii for theprevious period) X Increment Factor for period i. The IncrementFactors are defined as follows:
Period Increment Factors for Period i
January 1, 1991 to Juno 30, 1991 0.25
July 1, 1991 to December 31, 1991 0.33
January 1, 1992 to June 30, 1992 0.50
The Free Lending Rate is the arithmetic average of the rates of interest chargedby private commercial banks and other private financial institutions in Ecuadoron loans funded with their own resources, as recorded by the Central Bank in thepreceding week. After June 30, 1992, the interest rate will be equal to thecommercial lending rate as defined in the legal agreements.
A Model for Doing Municipal Financial Action Plans
21. As part of project preparation, GTZ financed the development ofMUNICIPIO, an interactive model for the analysis of municipal investment andrevenue decisions in medium-sized cities of Ecuador. MUNICIPIO has already beenused by municipal goverrments for strategic planning and decision making in doing
ANNEX 4Page 10 of 17
their financial action plans for this project, and in the future may be used forshort-term financial decision making and the annual budgeting process. MUNICIPIOhas also been used by BEDE to assist in its lending decisions and to determinethe financial feasibility of its loans. Specifically, the model has beencalibrated to 18 municipalities that are expected to become the f'rst-roundrecipients of IBRD-IDB loans. Finally, the model may be used by the CentralGovernment to determine the impact of policy changes, such as changes inMunicipal Law.
22. Model Structure. The model consists of four main building blocks.The first block describes the national and urban economic environment in whichthe municipal government operates. This includes the urban population growthrate, the rate of inflation, the rate of interest at which the municipality mayborrow, the rate of GDP growth, and the behavior of the petroleum sector. GDPand the petroleum sector determine the funds available to the municipality undervarious revenue sharing laws. Variables in this block are parametric tomunicipal decision-making. They determine municipal decisions but are notinfluenced by it. The only exception is urban population growth, which in onemodel option is taken as a function of the level and cost of infrastructureservices provided. Hence, higher population growth would add to service demand,and rising service levels would add to population growth.
23. The second block consists of the municipal infrastructure andinvestment sector. Specifically, the model tracks the amount and quality ofinfrastructure services by sector (e.g., water, sewerage, drainage, electricity,garbage collection, and streets). For each sector, it estimates the populationshare with access to the service. Sector performance over time is driven in oneof two ways: (a) the model user either specifies service targets (i.e., the per-centage of the population with access to a service), or (b) the model userspecifies an investment program. In the first case the model determines requiredinvestments, in the second case it determines service achievements. In eithercase the model keeps track of the value of fixed assets, the size of investments,and the level of maintenance and operating expenditures, based on unit costestimates provided by the model user.
24. The third block deals with municipal resource mobilization from allsources, including changes in tax rates, improvements in revenue collection, andupgrading of the revenue base, such as the indexation of the cadastre, theone-time revaluation of the municipal property tax base, or a reduction in thelevel of tax exemptions. It also determines the municipal borrowing capacity,and permits the user to specify borrowing goals. The model then keeps track ofmunicipal revenues from transfers and own sources; and it tracks municipaloutstanding debt, loan disbursements and repayment, debt service and interestpayments.
25. Finally, the fourth block integrates model results in a system ofmunicipal accounts. This represents the core of the model and includes an incomeand expenditure statement, sources and uses of funds, the municipal balancesheet, and financial indicators. The system of accounts is similar to the oneused in Ecuador, but has been expanded to provide the correct dynamic link
ANNEX 4Page 11 of 17
between the sources and uses of funds and the balance sheet.
26. Municipal Projections. MUNICIPIO in LOTUS based. Though essentiallydescriptive, it can be used as a prescriptive modelling tool. It is descriptivein the sense that it determines the impacts and implications of municipaldecision making, but includes no objective function with which to evaluatealternative courses of action. However, it is a prescriptive modelling tool forthe user willing to try a fair number of alternatives through trial and errorand educated guessing. In that case it is up to the user to interpret andevaluate the results of each run in light of some stated objective, and to alterparameters until a local optimum (or satisfactory solution) emerges. Thestarting point of the model are sector specific service targets. For each typeof service the ueer specifies the percentage of the population with serviceaccess for each year. Based on these targets the model computes investmentrequiremente, taking into account population growth and replacement demand. Itthen computes maintenance and operating cost. Finally, the user specifies meansof revenue generation, including changes in taxes and tariffs, and plannedchanges in collection efforts. The model determines to what extent thecombination of service targets plus revenue generation efforts are feasible.
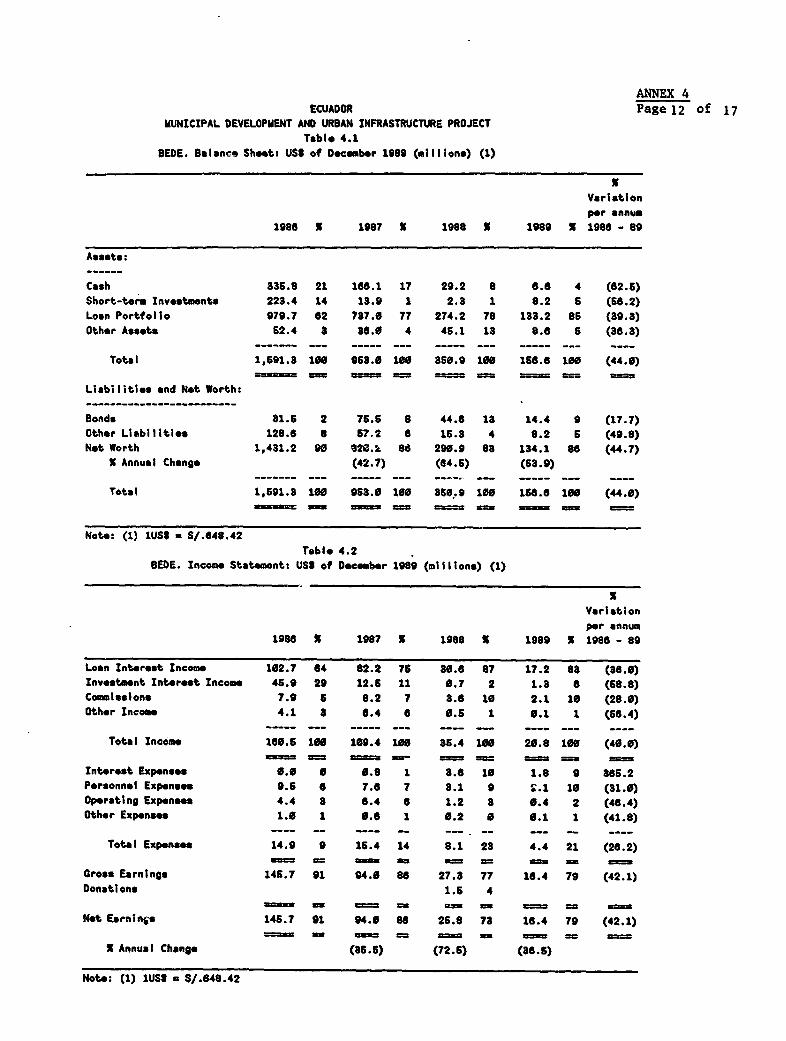
ANNEX 4ECUADOR Page 12 of 17
MUNICIPAL DEVELOPMENT AND URBAN INFRASTRUCTURE PROJECTTable 4.1
BEDE. Balance Shoot: USS of December 1989 (millions) (1)
X
Variationper annum
1986 X 1987 X 1988 X 1989 X 1986 - 89
Assets:
Cash 335.8 21 166.1 17 29.2 8 6.6 4 (62.6)Short-term Investments 223.4 14 18.9 1 2.3 1 8.2 6 (68.2)Loan Portfolio 979.7 62 787.0 77 274.2 78 133.2 86 (39.8)Other Assets 62.4 3 86.0 4 46.1 13 8.6 6 (36.3)
Total 1,691.3 1tW 965.0 100 360.9 106 168.8 166 (44.0)#=3 2Q C = = C3 === Q= - 1 ==
Liabilitios and Net Worth:
Bonds 81.6 2 76.5 8 44.6 13 14.4 9 (17.7)Other Liabilities 128.6 8 57.2 6 16.3 4 8.2 6 (49.8)Net Worth 1,431.2 93 a20.2 86 290.9 88 134.1 86 (44.7)
X Annual Change (42.7) (64.6) (63.9)
Total 1,591.3 160 963.0 166 368.9 166 156.6 166 (44.0)-= = -_ :=3 G=5 Q - _ =
Note: (1) lUSS u S/.648.42Table 4.2
BEDE. Incom Statement: USS of December 1989 (millions) (1)
Variationper annum
1986 X 1987 X 1988 X 1989 X 1986 - 89
Loan Interest Income 102.7 64 82.2 76 30.6 87 17.2 83 (38.0)Investment Interest Income 46.9 29 12.5 11 6.7 2 1.8 6 (58.8)Coemicsons 7.9 5 8.2 7 3.6 16 2.1 10 (28.0)Other Income 4.1 3 6.4 6 0.5 1 0.1 1 (56.4)
Total Income 166.6 166 109.4 100 36.4 160 20.8 166 (40.0)=3= om =3= =sr = = = Q =
Inter-st Expenses 6.o 6 0.8 1 8.6 10 1.8 9 365.2Personnel Expenses 9.6 6 7.6 7 3.1 9 2.1 16 (31.6)Operating Expen-se 4.4 8 6.4 6 1.2 3 0.4 2 (46.4)Other Expenses 1.0 1 0.6 1 0.2 6 0.1 1 (41.8)
Total Expenses 14.9 9 15.4 14 8.1 28 4.4 21 (26.2)
Gross Earnings 145.7 91 94.0 88 27.3 77 16.4 79 (42.1)Donations 1.6 4
=3 = 3= =3 = = _ = 3=
Not Earningo 145.7 91 94.0 88 26.8 73 18.4 79 (42.1)=3 3~~=== = 3= =3= = =m=m3 =3 3=--
X Annual Change (36.5) (72.6) (36.6)
Note: (1) IUS8 = S/.648.42
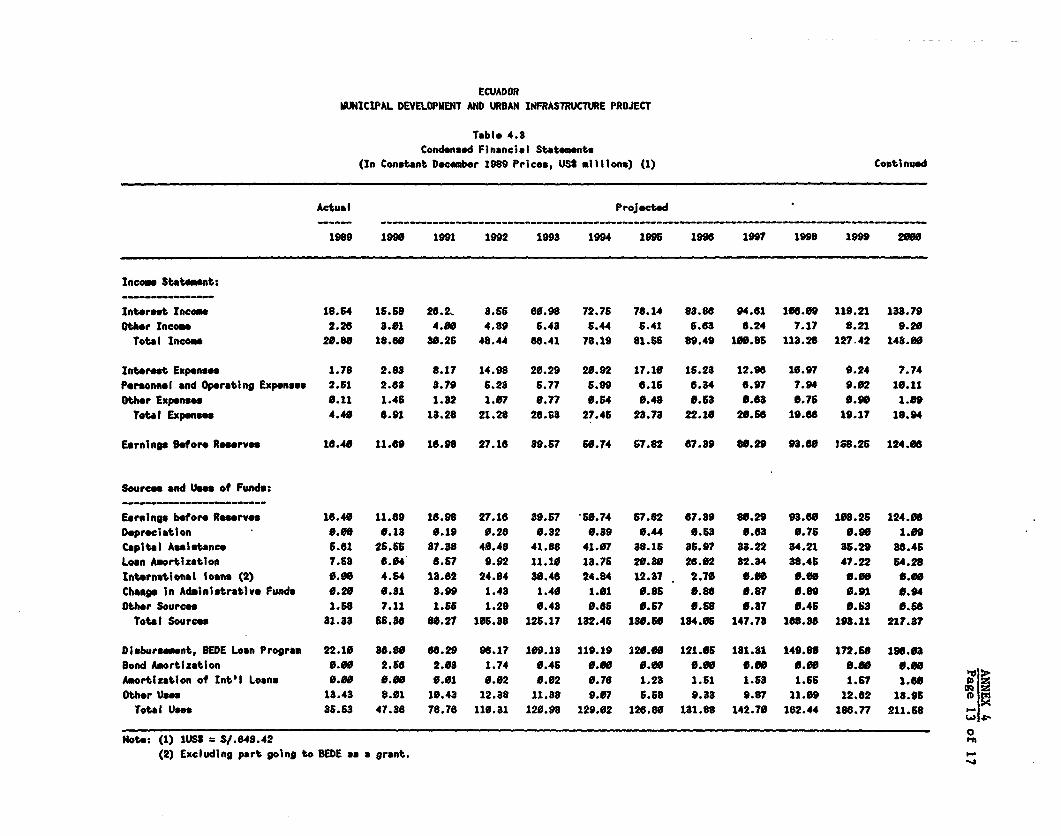
ECUADORMUNICIPAL DEVELOPMENT AND URBAN INFRASTRUCTURE PROJECT
Table 4.8Condensed Financial Statements
(In Constant December 1989 Prices, USS millions) (1) Continued
Actual Projected
1989 1990 1-91 1992 1993 1994 s 1995 s99 1997 1998 1999 2008
Inco"e Statmnt:
Interest Income 18.54 15.58 28.2, 8.66 60.98 72.75 78.14 68S.8 94.61 106.09 119.21 133.79Other Incoam 2.26 8.01 4.00 4.89 6.43 5.44 5.41 6.68 6.24 7.17 8.21 9.20Total Ineoe 20.80 18.80 30.25 48.44 88.41 78.19 91.55 89.49 100.85 113.26 127.42 148.00Interest Expense 1.78 2.98 8.17 14.99 20.29 20.92 17.10 16.23 12.96 10.97 9.24 7.74Personnel and Operating Expense 2.51 2.83 3.79 6.23 5.77 5.99 6.16 6.34 6.97 7.94 9.02 10.11Other Expenses 6.11 1.46 1.82 1.07 6.77 0.54 0.48 0.53 0.63 0.76 0.90 1.09Total Expenses 4.40 8.91 13.28 21.28 2e.63 27.45 23.78 22.10 20.66 19.66 19.17 18.94
Earnings Before Reserves 18.40 11.69 16.98 27.18 89.57 50.74 97.82 87.89 80.29 98.60 168.25 124.08
Sources and Uses of Funds:
Earnings before Reserves 18.40 11.69 18.98 27.16 39.71 50.74 57.82 67.89 80.29 93.8o 108.25 124.08Depreciation 0.00 0.18 0.19 0.28 0.82 0.89 0.44 0.65 0.63 0.75 0.90 1.09Capital Assistance 5.1 25.66 87.38 40.48 41.88 41.07 88.15 85.97 83.22 84.21 85.29 88.45Loan Amortization 7.53 8.04 6.57 9.92 11.10 13.75 20.80 26.02 32.34 38.46 47.22 54.28International loans (2) 0.90 4.S4 18.62 24.84 30.46 24.84 12.37 2.70 0.00 9.o0 e.00 0.06Change In Adainistrative Funds 0.20 0.31 8.99 1.48 1.40 1.01 0.85 9.86 0.87 0.89 0.91 0.94Other Sourc 1.58 7.11 1.56 1.29 0.43 0.65 0.57 6.58 0.37 0.45 0.83 0.66
Total Sources 81.83 55.86 60.27 105.38 125.17 182.46 180.59 184.06 147.75 168.86 198.11 217.37Disburosemnt, BEDE Loan Program 22.10 88.96 66.29 96.1? 169.18 119.19 120.00 121.06 131.81 149.89 172.58 196.08Bond Amortization 0.00 2.56 2.03 1.74 0.45 0.60 0.00 0.00 6.00 0.00 0.00 0.60Amortization of Int'l Loans 0.60 0.90 0.01 0.02 0.02 0.76 1.23 1.51 1.58 1.56 1.57 1.80Other Uses 13.43 8.01 10.43 12.38 11.38 9.07 6.58 9.33 9.87 11.09 12.82 18.95Total Use 36.58 47.86 78.78 110.31 120.98 129.02 126.80 181.89 142.70 162.44 188.77 211.58Note: (1) IUSS = S/.848.42
0(2) Excluding part going to BEDE as a grant.
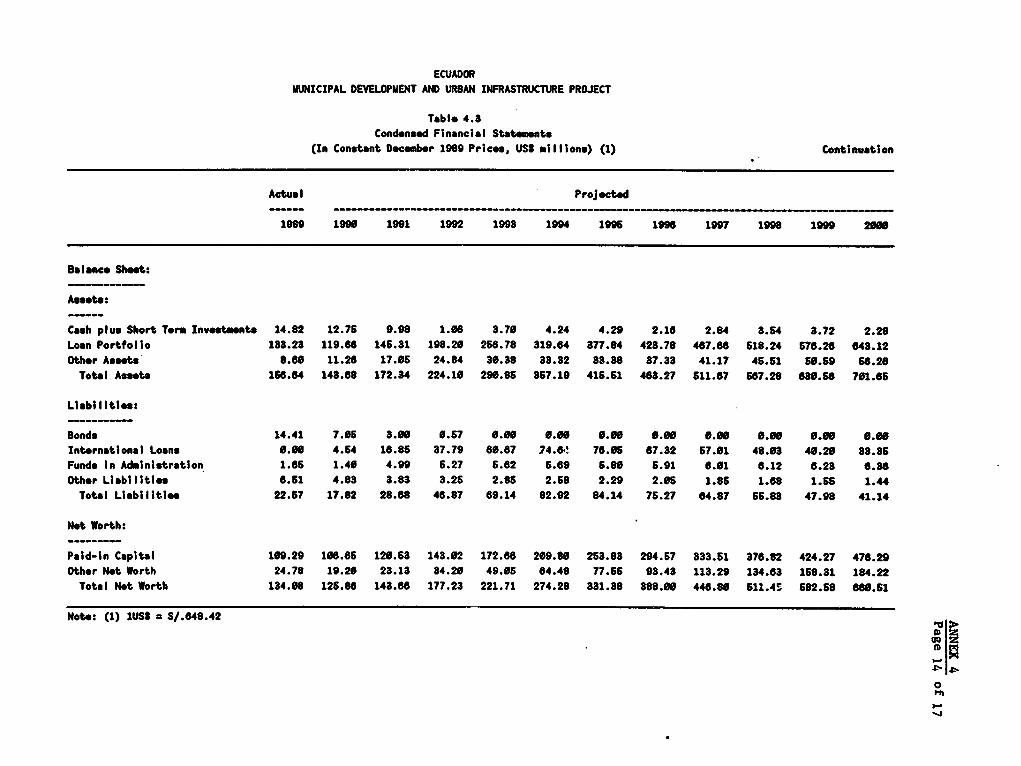
ECUADORMUNICIPAL DEVELOPMENT AND URBAN INFRASTRUCTURE PROJECT
Table 4.3Condensed Financial Statments
(In Constant December 1989 Priceo, USS mi llions) (1) Continuation
Actual Projected
1989 1990 1991 1992 1993 1994 1995 1996 1997 1m 1999 200
Balance Sheet:
Assets:
Cash plus Short Term Investmnts 14.82 12.76 9.98 1.08 3.70 4.24 4.29 2.16 2.84 8.54 3.72 2.28Loan Portfolio 183.23 119.66 145.31 198.20 256.78 319.64 377.84 423.78 487.66 518.24 576.26 643.12Other Assets 8.60 11.26 17.06 24.84 36.88 33.32 33.38 37.33 41.17 46.61 60.69 68.26
Total Assets 166.64 143.68 172.84 224.10 290.85 367.19 416.61 463.27 511.67 687.28 636.56 701.66
Liabilitiesl
Bonds 14.41 7.065 3.00 0.57 0.00 0.00 0.W0 0.00 0.00 0.00 0.00 0.00International Loans 0.00 4.54 18.86 37.79 60.67 74.6.! 78.065 67.32 67.01 48.03 40.20 33.36Funds In Administration 1.86 1.40 4.99 6.27 6.62 6.69 6.80 6.91 6.01 8.12 6.23 6.36Other Liabilitie 6.51 4.83 3.83 3.26 2.86 2.68 2.29 2.06 1.86 1.68 1.66 1.44
Total Liabilities 22.67 17.82 28.88 46.87 69.14 82.92 84.14 75.27 64.87 66.83 47.98 41.14
Net Worth:
Paid-in Capital 109.29 106.65 120.63 143.02 172.66 209.80 253.83 294.67 333.51 376.82 424.27 476.29Other Net Worth 24.78 19.20 23.13 34.20 49.05 64.48 77.55 93.43 113.29 134.63 158.31 184.22
Total Not Worth 134.08 126.86 148.68 177.23 221.71 274.28 331.38 388.00 446.80 651.45 582.68 660.61
Note: (1) lUSS * S/.648.42
a-
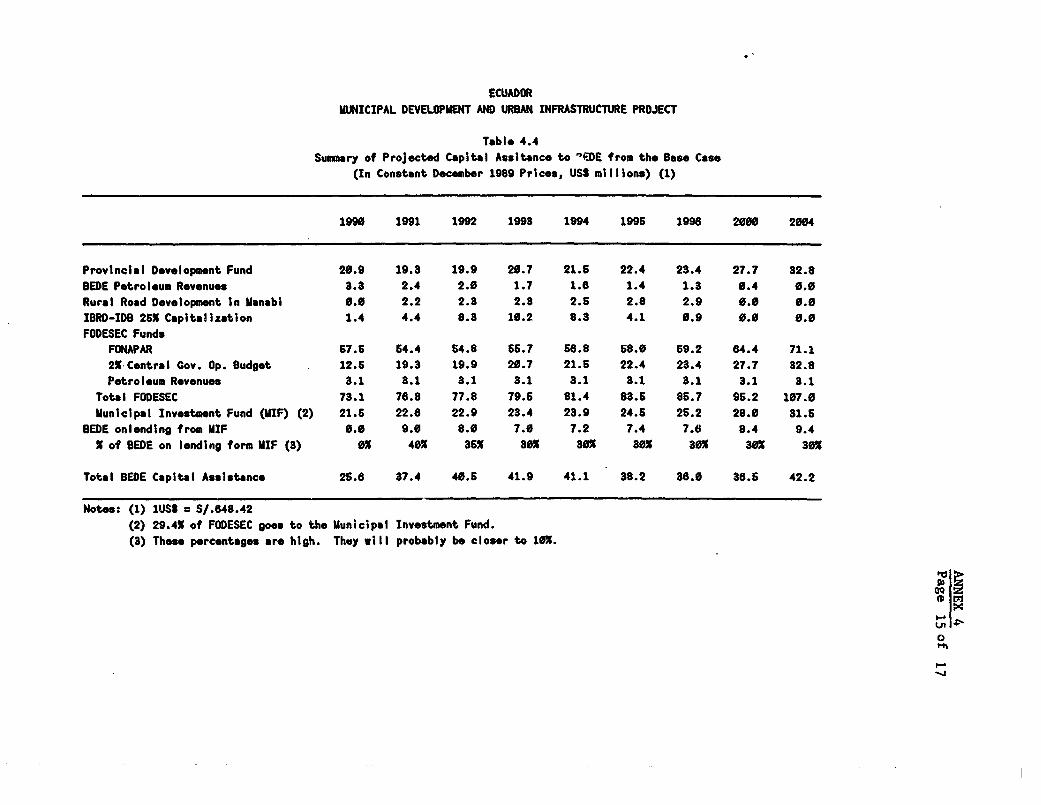
ECUADORMUNICIPAL DEVELOPMENT AND URBAN INFRASTRUCTURE PROJECT
Tablo 4.4
Summary of Projected Capital Assitance to 'FDE from the Base Case
(In Constant December 1989 Prices, US3 millions) (1)
1990 1991 1992 1993 1994 1995 1996 2000 2004
Provincial Development Fund 20.9 19.8 19.9 20.7 21.5 22.4 23.4 27.7 32.8
BEDE Petroleum Revenues 3.3 2.4 2.0 1.7 1.6 1.4 1.3 0.4 0.0
Rural Road Development In Manabi 0.0 2.2 2.3 2.3 2.5 2.8 2.9 0.0 0.0
IBRD-IDB 26% Capitalization 1.4 4.4 8.3 10.2 8.3 4.1 0.9 0.0 0.0
FODESEC Funds
FONAPAR 57.5 64.4 54.8 66.7 65.8 68.0 69.2 84.4 71.1
2% Central Cov. Op. Budget 12.5 19.3 19.9 20.7 21.5 22.4 23.4 27.7 32.8
Petroleum Revenues 3.1 3.1 3.1 3.1 3.1 3.1 3.1 3.1 3.1
Total FODESEC 73.1 78.8 77.8 79.6 81.4 83.6 86.7 96.2 107.0
Municipal Investment Fund (MIF) (2) 21.5 22.6 22.9 23.4 23.9 24.6 25.2 28.0 31.5
BEDE onlending from MIF 0.0 9.0 8.0 7.0 7.2 7.4 7.6 8.4 9.4
X of BEDE on lending form MIF (3) 0x 40% 35X 30X 30X 30% 30% 30% 30X
Total BEDE Capital Assistance 25.8 37.4 40.6 41.9 41.1 38.2 38.0 36.5 42.2
Notes: (1) lUSS = S/.648.42(2) 29.4X of FODESEC goes to the Municipal Investment Fund.
(3) These percentages are high. They will probably be closer to 10%.
I-Z
Q Z
t-n
0
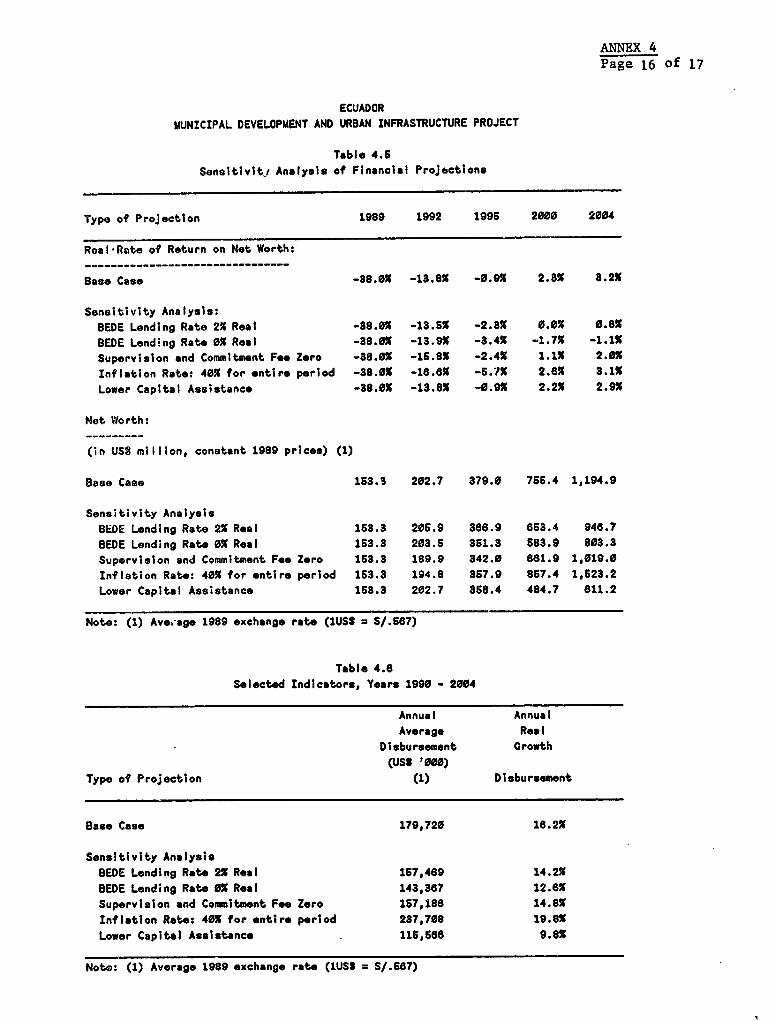
ANNEX 4Page 16 of 17
ECUADORMUNICIPAL DEVELOPMENT AND URBAN INFRASTRUCTURE PROJECT
Table 4.6Sensitivitj Analysis of Financial Projections
Type of Projection 1989 1992 1996 2000 2004
Roal-Rate of Return on Net Worth:________________________________
Base Case -38.0K -13.8% -0.9% 2.8% 3.2X
Sensitivity Analysis:BEDE Lending Rate 2% Real -89.0% -13.6% -2.83 O.0% 0.6%
BEDE Lending Rate OX Real -88.0K -13.9% -3.4% -1.7% -1.1%
Supervision and Commitment Feo Zero -38.0K -15.8X -2.4% 1.1X 2.0%Inflation Rate: 40% for entire period -38.0K -16.6% -S.7X 2.6K 3.1X
Lower Capital Assistance -88.0X -13.8K -0.9K 2.2% 2.9%
Not Worth:
(in US8 million, constant 1989 prices) (1)
Base Case 153.3 202.7 379.0 756.4 1,194.9
Sensitivity AnalysisBEDE Lending Rate 2% Real 153.3 205.9 366.9 853.4 946.7BEDE Lending Rate OK Real 153.3 203.5 351.3 583.9 803.3
Supervision and Commitment Fee Zero 153.3 189.9 342.0 661.9 1,019.0Inflation Rate: 40K for entire period 1S3.3 194.8 357.9 867.4 1,623.2Lower Capital Assistance 163.3 202.7 868.4 484.7 811.2
Note: (1) Ave.age 1989 exchange rate (IUSS = S/.567)
Table 4.6Selected Indicators, Years 1990 - 2004
Annual AnnualAverage Real
Disbursement Growth(USS '000)
Type of Projection (1) Disbursement
Base Case 179,720 16.2%
Sensitivity Analysis8EDE Lending Rate 2% Real 157,469 14.2%BEDE Lending Rate O% Real 143,367 12.6XSupervision and Commitment Fee Zero 157,186 14.8%
Inflation Rate: 40X for entire period 237,708 19.8XLower Capital Assistance 115,666 9.8%
Note: (1) Average 1989 exchange rate (1US3 = S/.687)
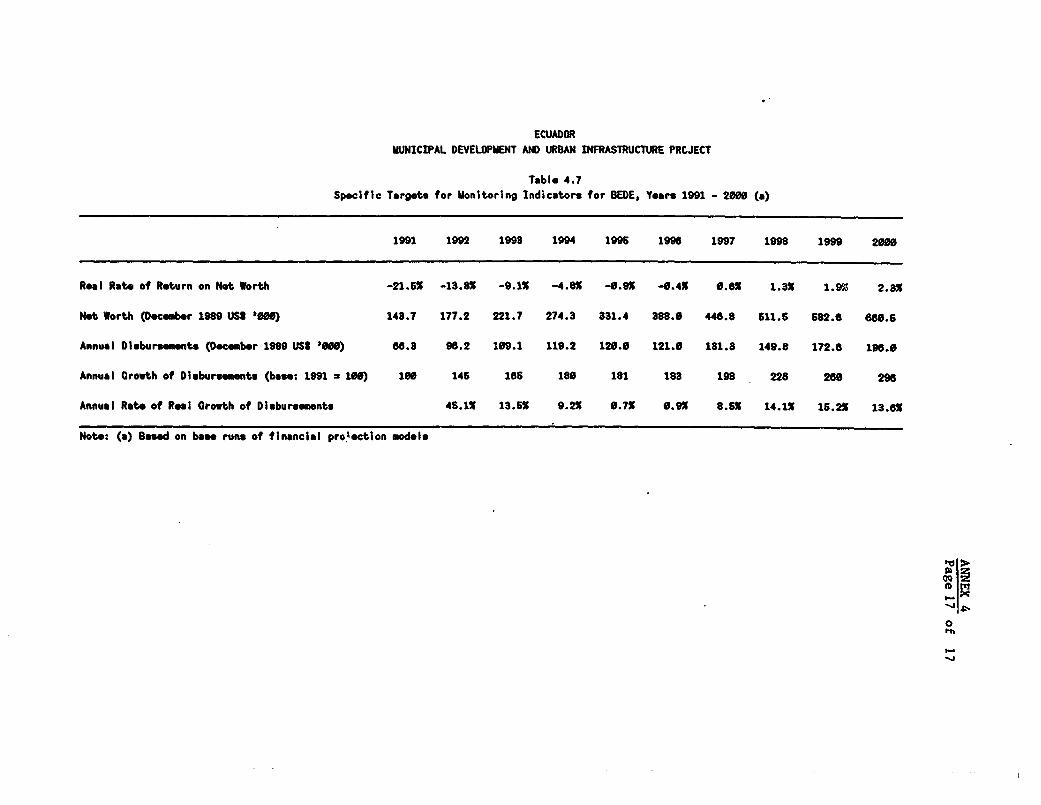
ECUADOR
MUNICIPAL DEVELOPMENT AND URBAN INFRASTRUCTURE PRCJECT
Table 4.7
Specific Targets for Monitoring Indicators for BEDE, Years 1991 - 2066 (a)
1991 19m 1993 1994 1996 1996 1997 1998 1999 2090
Real Rate of Return on Not Worth -21.56 -13.81 -9.1% -4.81 -0.9X -0.4X 0.61 1.3X 1.9% 2.3%
Net Worth (December 1989 USS 066) 143.7 177.2 221.7 274.3 331.4 388.0 448.8 611.6 582.6 680.6
Annual Disbursements (December 1989 US$ 066) 66.3 96.2 109.1 119.2 120.0 121.0 131.8 149.8 172.6 196.0
Annual Growth of Disburseemnts (base: 1991 = 16) 100 146 l6S 186 181 183 198 226 266 296
Annual Rate of Real Growth of Disbursements 4S.11 13.65 9.21 0.71 0.9X 8.51 14.11 16.2X 13.6X
Note: (a) Based on base runs of financial pro;ection models
IZo 0
1h
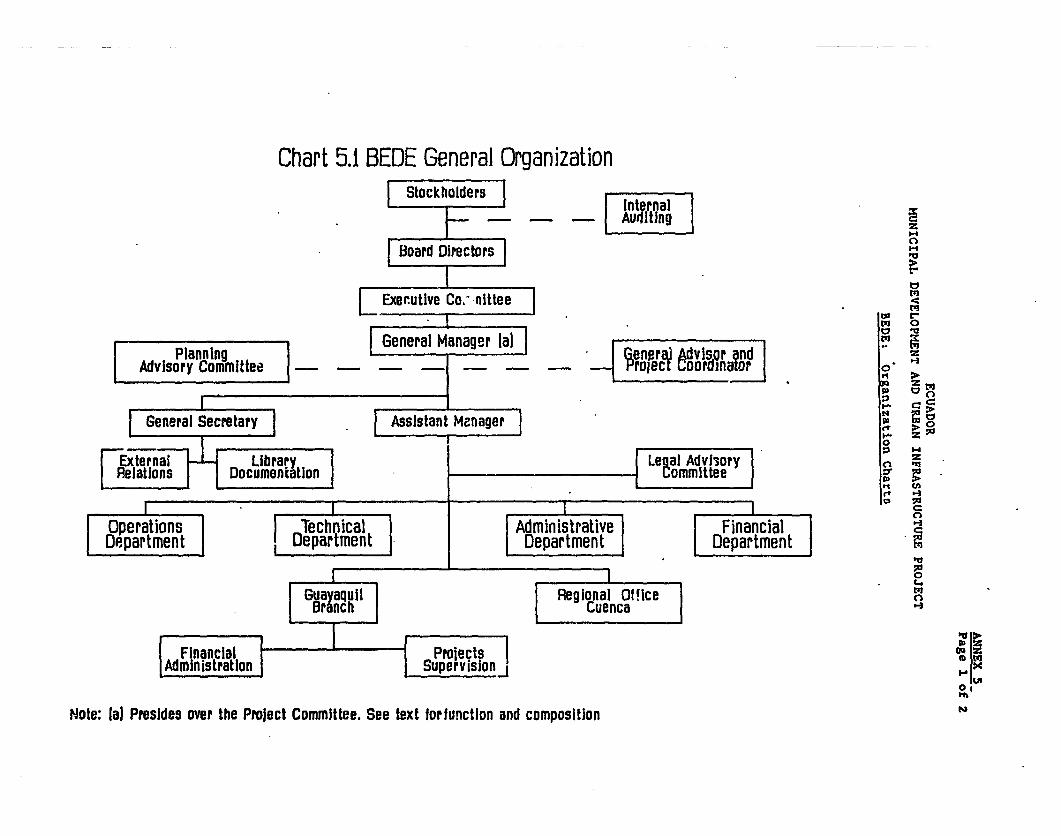
Chart 5.1 BEDE General OrganizationStockholders
I Internal_ -_ Auditing
Board oirectors|
Exec.utive Co.: nitteetoW otqL 0
P General Manager lal F A rAdvlsory Committe c
go0
General Secretary | | ss sta nt Mznager | t 00External _ _ Library Legal AdvisoryRelations Documentation Uommittee w Crt
Operations Technical Administrative FinancialDepartment L Department Department Department
0
I Guayaquil | [ Regional Office Branch I Cuenca
Flnanclal Projects I I Administration Supervisionj x
Note: lal Presides over the Prolect Committee. See text forfunction and composition
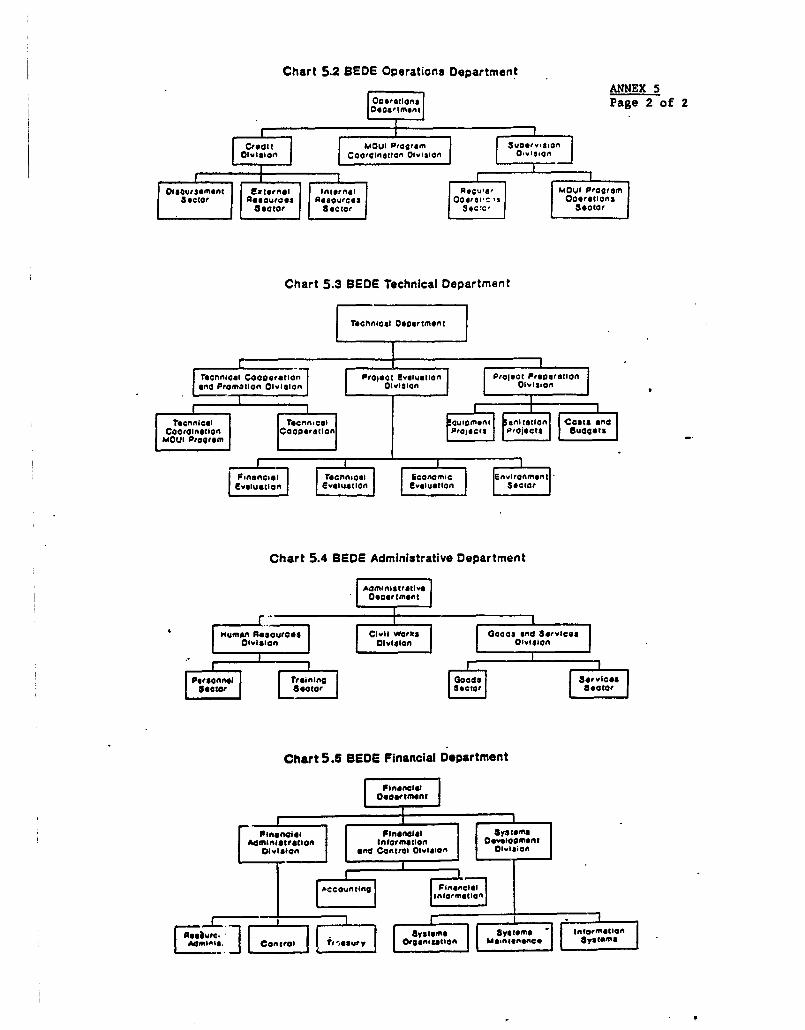
Chart 5.2 BEDE Operations DepartmentANNEX S
r°oflon,l ~~~~Page 2 of 2
aecior a oUr g* Aoue es Oore(.'3' Va,ilons
Chart 5.3 BEDS Technical DepartmentToC cttn| |oOU ?ocnncoi |uOmn |n luotion Co| n
oroition Coso o Protcvt ovro Prot P rOjects SudgonFI I iIoncagI Divison c nvirOmn
rOulst Prograt emn Ints;n Rcauoao |ectot
Chart 5.4 BEDE Administrative Department
Administrativ.eOeoortn'ont
m4umonAscurcesj Civil Works ocs ond Sorvictng sno Peovotisn OlvIon | | Olvlon fOiVISon |
f nsonnel training l| cnoi | |nsonfce|ot0 SVIlInI Ietor on| IEvl^iO Soo
Chart 5.5 BEDE Financial Department
A4 intormation~~~~~~~~~*norot@
A 0 O DvCionr Ol ?,oor Oron E M Olvi tion
L 1g1 ' 1k1~~~~~~~~~~~~o,ata
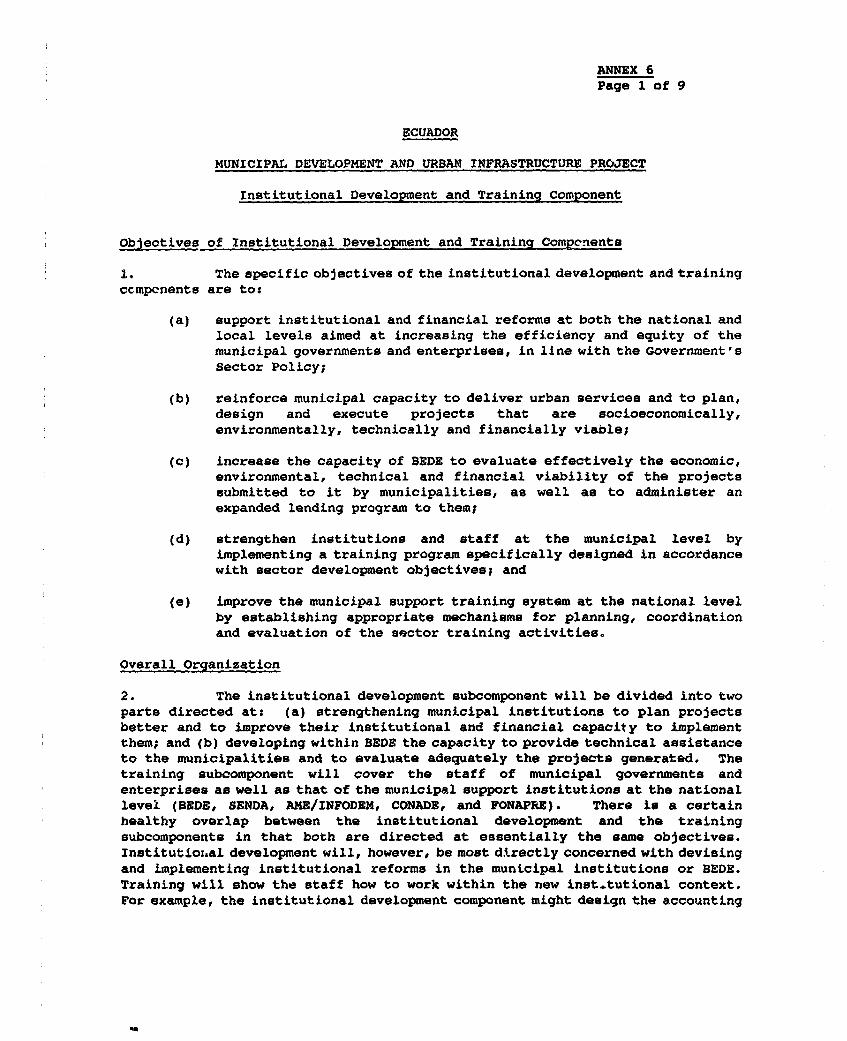
ANNEX 6Page 1 of 9
ECUADOR
MUNICIPAL DEVELOPMENT AND URBAN INFRASTRUCTURE PROJECT
Institutional Development and Training Component
Objectives of Institutional Development and Training Compcnents
1. The specific objectives of the institutional development and trainingccmpcnents are tot
(a) support institutional and financial reforms at both the national andlocal levels aimed at increasing the efficiency and equity of themunicipal governments and enterprises, in line with the Government'sSector Policy;
(b) reinforce municipal capacity to deliver urban services and to plan,design and execute projects that are socioeconomically,environmentally, technically and financially viable;
(C) increase the capacity of BEDS to evaluate effectively the economic,environmental, technical and financial viability of the projectssubmitted to it by municipalities, as well as to administer anexpanded lending program to them;
(d) strengthen institutions and staff at the municipal level byimplementing a training program specifically designed in accordancewith sector development objectives; and
(e) improve the municipal support training system at the national levelby establishing appropriate mechanisms for planning, coordinationand evaluation of the sector training activities.
Overall Organization
2. The institutional development subcomponent will be divided into twoparts directed at: (a) strengthening municipal institutions to plan projectsbetter and to improve their institutional and financial capacity to implementthem; and (b) developing within BEDS the capacity to provide technical assistanceto the municipalities and to evaluate adequately the projects generated. Thetraining subcomponent will cover the staff of municipal governments andenterprises as well as that of the municipal support institutions at the nationallevel (BEDE, SENDA, AME/INFODEM, CONADE, and FONAPRE). There is a certainhealthy overlap between the institutional development and the trainingsubcomponents in that both are directed at essentially the same objectives.Institutiox.al development will, however, be most directly concerned with devisingand implementing institutional reforms in the municipal institutions or BEDE.Training will show the staff how to work within the new inst.tutional context.For example, the institutional development component might design the accounting
ANNEX 6Page 2 of 9
systems of municipalities and prepare manuals for their use, while the trainingprogram would provide courses and on-the-job training on how to use the newsystems either on site or through classroom instruction involving more than onemunicipality. The same holds true for BEDE. The institutional developmentsubcomponent would provide assistance in improving systems, while the trainingwould instruct all designated staff on how to function in this new environment.
Description of the Institutional Development Subcomponent (US$19.4 million)
3. The institutional development subcomponent will be divided into twomain parts: one directed at BEDE and the other at the municipalities.
4. Institutional Development at BEDE (US$4 million) will be providedto assist BEDE in improving its institutional capacity to meet its objectives,especially in the areas of economic, environmental, technical and financialevaluation of projects, information systems and operational systems. The projectwill finance national and local consultants in each of these areas, as well asequipment and materials. A new computer system in BEDE with network extendingto participating municipalities will also be installed. The US$4 millionallocated for this will include financing of consultants, travel, per diems, anew computer system, and other equipment. See Table 6.1. A consultant onenvironmental evaluation would assist BEDE in developing its capacity to analyzethe environmental assessments prepared by the municipalities, as well as to alertsubborrowers to potential environmental problems at the prefeasibility phase ofproject evaluation.
5. The BEDE/GTZ Program for Municipalities (US$15.4 million). Theinstitutional development objectives for the municipalities will be achieved byimplementing a technical assistance program in BEDE with assistance from GTZcovering the areas of municipal finance and credit management, planning, andadministration. Financing would be provided under the proposed loan for: (a)administration and coordination of the institutional development programincluding consultant fees, per diem, and transportation of the centralcoordination unit personnel; (b) local and foreign consultants services toprovide advice to BEDE and municipalities; (c) equipment and materials includingvehicles, furniture, computers, printers, and audio-visuals aids; (d) tutorialtraining; and (e) manuals. Detailed costs are presented in Table 6.1.Assistance to municipalities will be provided through five teams consisting ofspecialists in: socioeconomic development, administrative systems, environmentalassessment, urian development, planning and evaluation, financing, urbaninfrastructure and equipment, and human resource development. The technicalassi3tance teams will remain in each municipality between 4 and 6 monthsdepending on the size of the municipality and the complexity of their problems.The methodology to be applied will be operationally oriented, highlyparticipatory, analyzing urban and municipal problems as well as theirsocioeconomic context and implications. As a result, municipal organization willbe upgraded and operations manuals and procedures established in consonance withthe nature of the problems detected.
ANNEX 6Page 3 of 9
Description of the Training Component (US$7.6 million)
6. The training objectives will be achieved through:
(a) a comprehensive training program to enable municipal staff to improve
productivity and efficiency in the delivery of municipal services;
and
(b) building up a permanent training capability for the staff of
municipal governments by strengthening SENDA as a training
coordination unit and AME as a main institution for execution of the
training programs in the municipalities.
Table 6.2 shows total costs of persons trained under the different types of
training programs, and Table 6.3 shows costs.
7. Training of Municipal Sector Institutions Staff (US$388,000). This
program is designed to improve the skills of about 1,000 managers and technical
staff of the agencies providing technical and financial support to the
municipalities, mainly BEDE, FONAPRE and AME (see Table 6.2). To implement the
training program for the sector institutions, staff financing would be provided
for: (a) internal courses for about 950 participants including training and
learning material as well as fees of the instructors; (b) contracting courses
with local universities and consulting firms to train about 150 participants;
(c) foreign consultant services (up to 30 staff-months) to prep6re training
manuals and to train sector institutions staff in subjects such as: project
financial appraisal, municipal financial analysis and forecasting, financial
and credit management, cadastres administration, and project formulation,
appraisal and supervision; (d) local consultant services (up to 32 staff-months)
to prepare training manuals and to train sector institution- staff in credit
procedures, loan processing, costs and tariffs of public works and services,
municipal financial legislation, procurement, and mechanisms for cost recovery;
(e) overseas training (up to 28 staff-months) for the management and professional
staff of sector institutions to visit other countries better developed in
financial and credit management and human resources development in the municipal
sector; and (f) specific studies to evaluate the impact of the training in
improving the efficiency of the sector institutions that provide financial and
technical support to municipalities.
S. Training of Municipal Staff (US$4.6 millioni. This training program
aims to improve the performance capabilities of about 6,000 persons. Performance
based training would be provided in (a) municipal investment planning and
budgeting; (b) municipal finance and revenue administration; (c) municipal
organization and administration; (d) municipal legislation; (e) municipal
infrastructure and services standards and norms; (f) accounting and
administrative simplification; and (g) public services planning, organization
and maintenance. Training programs would address the solution of day-to-day
critical operational problems. Most of the training will be carried out on-
the-job as improved systems, procedures and administrative practices are
introduced. To train municipal staff financing would be provided for (a) on-
ANNEX 6Page 4 of 9
the-job training for about 4,000 participants, including fees, per diem andtravel expenses for instructors; (b) specific courses for about 3,000participants including instructor fees and participants travel expenses and perdiem (total cost estimated at US$3.7 million); (c) administration of thetraining program, including consulting fees of the professional staff, officesupplies, travel expenses and per diem for supervision and coordination seminars(US$647,000); (d) instructors fees (up to 384 staff-months) to develop andprovide training for municipal professionals and technicians in the followingareas: financial planning, organization and administration systems, occupationalanalysis, curriculum design, preparation of training programs, and traininginstructors for training programs (i.e., training of trainers); and (e)furniture, training materials and equipment including audio-visual aids, books,training manuals, vehicles and microcomputers.
9. Training Coordination and Organization (US$1.2 million). One of themain deficiencies of the municipal sector training system is the lack ofcoordination among the large number of institutions offering training and betweenthem and the municipalities. The need for institutional coordination is criticalto avoid overlapping of activities and to facilitate the exchange of technicaland operational experiences. The Government has assigned to SENDA theresponsibility to assume the role of central national coordination unit formunicipal training programs. The central training coordination unit functionswould bet
(a) to coordinate the implementation of the training program for thestaff of the municipalities;
(b) to define a sector training policy and strategy as well as integratethe specific plans of municipalities and the national supportinstitutions into a national plan for the overall sector;
(c) to head the interinstitutional steering committee for trainingcomposed by representatives of AME, BEDE, FONAPRE, GTZ and threemunicipalities representing small, medium and large municipalities.
(d) to promote, in coordination with AME, the adoption of specificadministrative guidelines to regulate municipal staff careerdevelopment and promotion;
(e) to establish a permanent system for monitoring and evaluation of thetraining programs carried out disseminating the results andrecommending improvement/adjustment, as appropriate;
(f) to seek financial resources to insure the stability of the trainingsystem during and beyond the life of the project.
10. To establish central coordination unit for training, financing wouldbe provided under the loan for: (a) consulting fees for up to 12 technical staff(up to 576 staff-months); (b) travel and per diem for supervision and monitoringof the training program; (c) office supplies; (d) seminars to discuss regional
ANNEX 6Page 5 of 9
training plans, as well as implementation and coordination problems; (e) foreignconsultant services (up to 55 staff-months) to assist the central coordinationunit in management information systems, administration by objectives andpersonnel administration, as well as planning, organization, execution andevaluation of the training program including the application of new trainingmethodologies; (f) local consultants (up to 21 staff-months) to provideassistance in occupational analysis, job description, monitoring of the trainingprogram and dissemination of innovative training experiences; (g) overseastraining (up to 12 staff-months) for 6 of SENDA's professional staff to beexposed to successful training programs in other countries; (h) microcomputersto implement a training information system, as well as supplementary furnitureand learning materials; and (i) studies including: a model career developmentplan, training needs assessment, job description, and the evaluation of thetraining program.
Preparation Activities Financed Under the PPFs
11. IBRD and IDB partially financed through PPFs institutionaldevelopment and training programs with the objectives of: (a) testing theinstitutional development methodology and preparing operational, administrative,and training manuals in financial management and municipal administration; (b)initiating the training of the staff of the central agencies that will have theresponsibility to provide technical and financial support during projectimplementation; and (c) training the staff of the municipalities that will haveinvestment projects during the first year of project implementation. Theactivities and results achieved were as follows:
12. Institutional Development. To test the institutional developmentmethodology, GTZ provided assistance to the municipalities of Riobamba, Tulcanand Babahoyo. Starting with the involvement of the community in defining itspriority needs, five GTZ specialists working together with the municipalitiesprofessionala identified the main problems, their causes, and possible solutionsin the areas of water supply, transportation, housing, solid waste, urbanstreets, retail and wholesale markets, streetlighting, recreation, and communityorganization. After solutions were discussed with the community, plan wasprepared for each municipality including a municipal infrastructure improvementcomponent and a municipal management planning component, the latter coveringcoordination, administration, costing, financing and evaluation of publicservices. To streamline procedures, manuals were prepared covering these sameareas and on-the-job training was provided for about 100 staff.
13. Training of Municipal Sector Institutional Staff. The trainingprogram was implemented by BEDE and FONAPRE for about 500 professional staff ofthese institutions and about 80 from other institutions related to the project,such as CONADE, the Ministry of Finance, Procuraduria General del Estado, andIEOS. Training was provided by local and foreign consultants and organizations(GTZ and a number of other international organizations in the field) in the areasof: credit management, project evaluation, financial and socioeconomic analysis,urban and regional planning, tariffs, data processing, accounting, legalregulations in public services, adjustment for inflation and financial
in-.. a M
A£N3X 6Page 6 of 9
projections, environmental impact of investments, and cadastres.
14. Training of Municipal Staff. About 460 municipal officials andprofessional staff, representing about 20 murO.cipalities tkat should be eligiblefor an investment project during the first year of the project were trainedmainly by AME. Training covered: financial planning, municipal administration,program budgeting, municipal taxes, municipal records, public sector pricing,revenue collection, and cadastres. AMR also spent up to 150 staff-days providingtechnical assistance to municipalities in the application of the subjects taught.
z2 Si
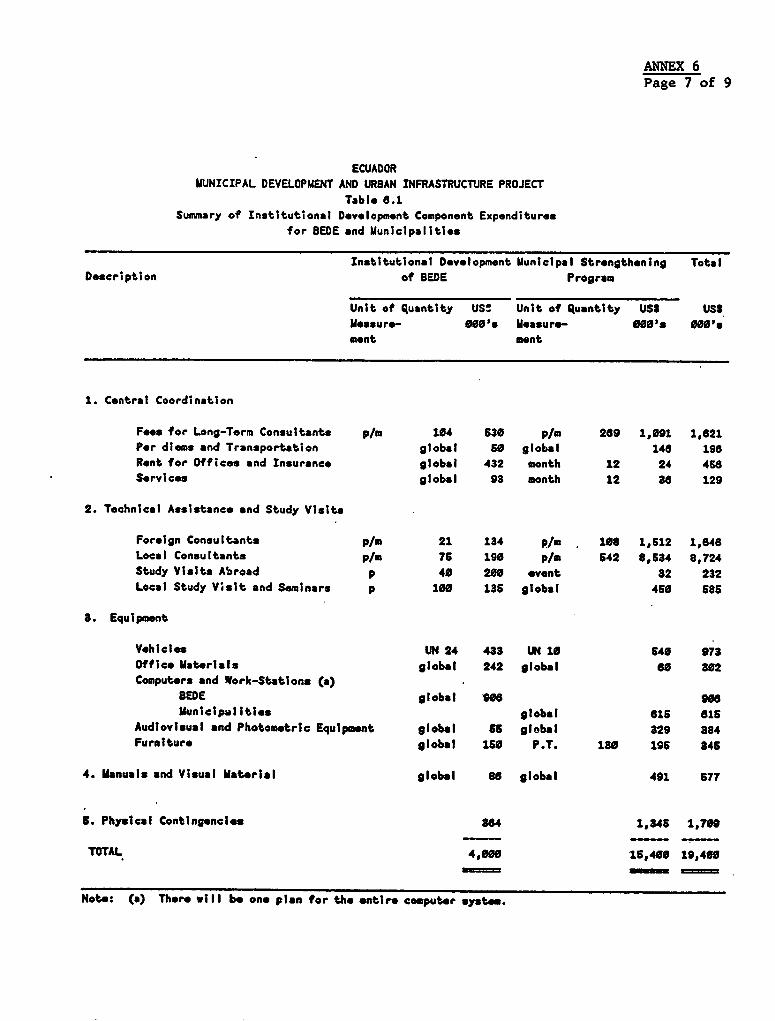
ANNEX 6Page 7 of 9
ECUADORMUNICIPAL DEVELOPMENT AND URBAN INFRASTRUCTURE PROJECT
Tabl- 8.1Summary of Institutional Development Component Expenditures
for BEDE and Municipalities
Institutional Development Municipal Strengthening TotalDescription of BEDE Program
Unit of quantity US! Unit of Quantity USS US$Measure S00S's Measure- 000's 000'.ment snt
1. Central Coordination
Fes for Long-Term Consultants p/m 104 630 p/m 289 1,091 1,621Par diems and Transportation global S0 global 146 196Rent for Officeo and Insurance global 432 month 12 24 468Services global 93 month 12 86 129
2. Technical Assistance and Study Visits
Foreign Consultants p/m 21 134 p/m 106 1,612 1,646Local Consultants p/m 76 190 p/i 642 8,634 9,724Study Visits Abroad p 40 200 event 32 232Local Study Visit and Seminars p 100 135 global 450 58S
S. Equipment
Vehiclos UN 24 433 UN 10 54O 973Office Materials global 242 global as 302Computers and Work-Stations (a)
BEDE global in 906Uunicipalitles global 615 615
Audiovisual and Photometric Equipment global 65 global 329 884Furnitur- global 1s5 P.T. 130 195 346
4. Manuals and Visual Materlal global s6 global 491 577
S. Physical Contingencies S84 1,346 1,709
TOTAL 4,000 15,400 19,400
Note: (a) There will be one plan for the entire computer system.
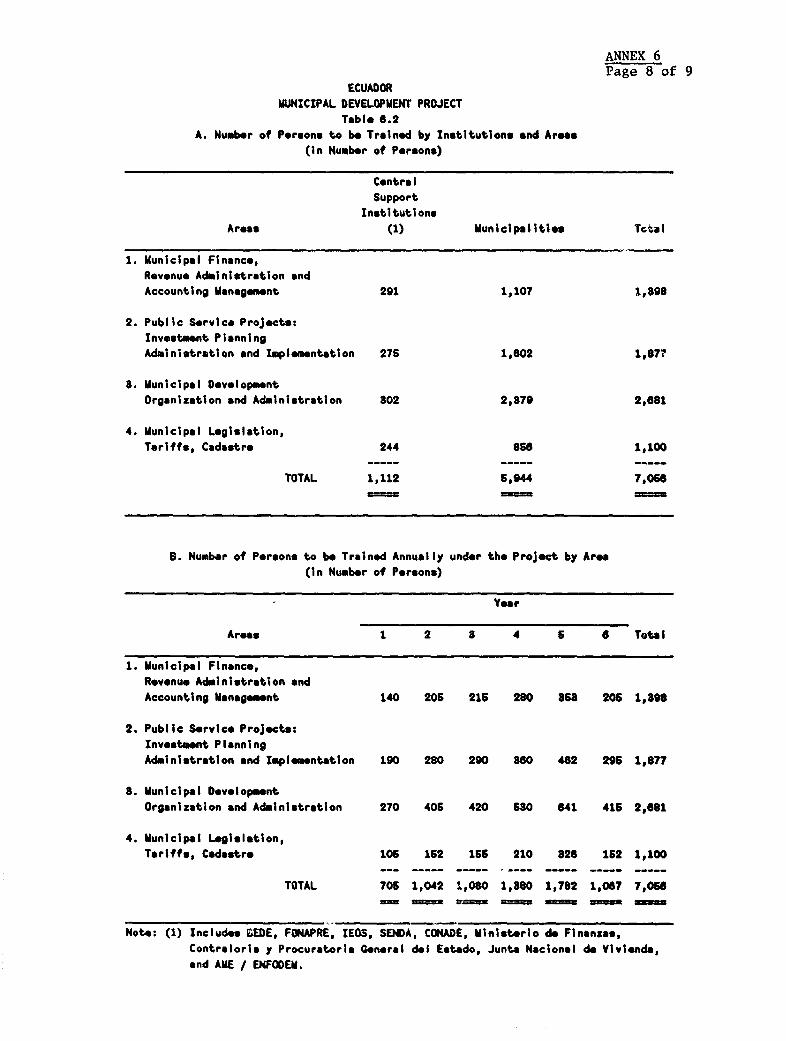
ANNEX 6Page 8 of 9
ECUADORMUNICIPAL DEVELOPMENT PROJECT
Table 0.2A. Numb.r of Persons to be Trained by Institutions and Arose
(in Number of Persons)
CentralSupport
InstitutionsAreas (1) Municipalities Tctal
1. Municipal Finance,Revenue Administration andAccounting Management 291 1,107 1,898
2. Public Service Projocts:Investment PlanningAdministration and Imploemntation 276 1,802 1,877
8. Municipal DevelopmentOrganization and Administration 302 2,879 2,681
4. Municipal Legislation,Tariffs, Cadastre 244 856 1,100
TOTAL 1,112 5,944 7,056
B. Numb.r of Persons to bo Trainod Annually under the Project by Aroa(in Number of Porsons)
Yer
Areas 1 2 8 4 5 6 Total
1. Municipal Finance,Revenue Administration and
Accounting Monagement 140 206 215 280 8s5 206 1,898
2. Public Service Projects:Investment PlanningAdministration and Implementation 190 280 290 S80 482 296 1,877
8. Municipal Development
Organization and Administration 270 405 420 sao 641 415 2,681
4. Municipal Legislation,Tariffs, Cadaotre 105 152 155 210 826 152 1,100
TOTAL 705 1,042 1,080 1,880 1,782 1,067 7,056- = 3 = = 3 = =
Note: (1) Includes GEDE, FONAPRE, IEOS, SENDA, CONADE, Ministerio de Finangas,
Contraloria y Procuratoria Coneral del Estado, Junta Nacional de Vivienda,and AME / ENFOOEM.
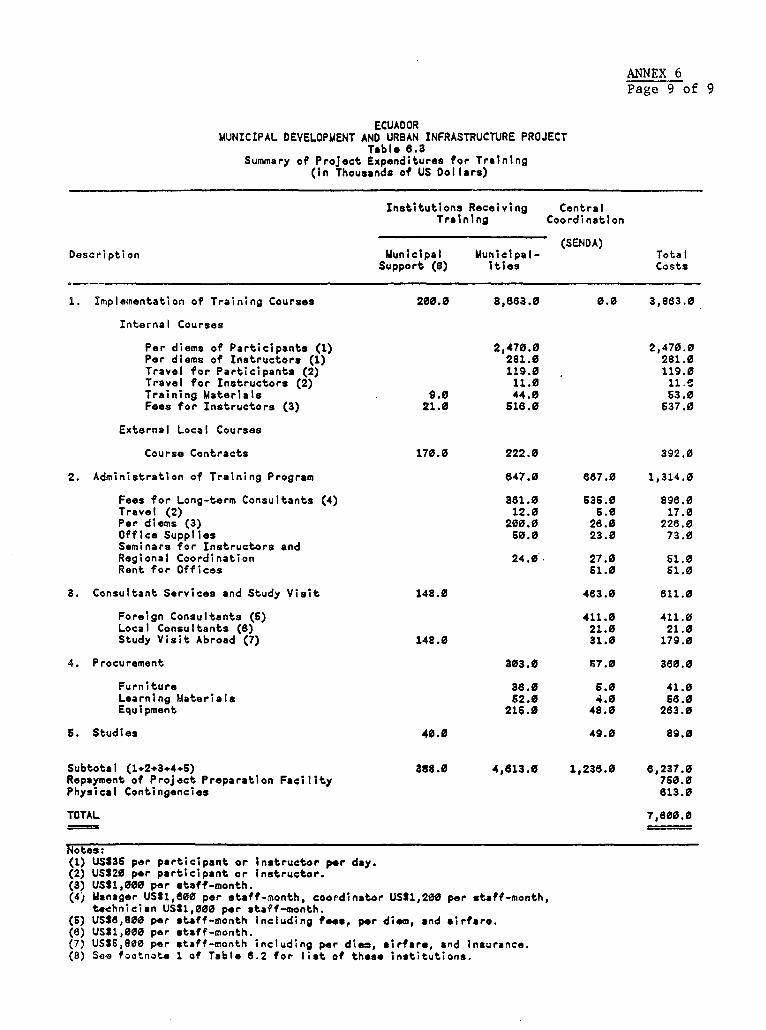
ANNEX 6Page 9 of 9
ECUADORMUNICIPAL DEVELOPMENT AND URBAN INFRASTRUCTURE PROJECT
Table 6.3Summary of Project Expenditures for Training
(in Thousands of US Dollars)
Institutions Receiving CentralTraining Coordination
(SEN DA )Description Municipal Municipal- Total
Support (8) ities Costs
1. Impleinentation of Training Courses 200.0 3,883.0 0.0 3,883.0
Internal Courses
Per diems of Participants (1) 2,470.0 2,470.0Per diems of Instructors (1) 281.0 281.0Travel for Participants (2) 119.0 119.0Travel for Instructors (2) 11.0 11-.Training Materials 9.0 44.0 53.0Fees for Instructors (3) 21.0 518.0 637.0
External Local Courses
Course Contracts 170.0 222.0 392.0
2. Administration of Training Program 647.0 687.0 1,314.0
Fees for Long-term Consultants (4) 361.0 636.0 898.0Travel (2) 12.0 6.0 17.0Per diems (3) 200.0 26.0 228.0Office Supplies 60.0 23.0 73.0
Seminars for Instructors andRegional Coordination 24.0. 27.0 61.0Rent for Offices S1.0 61.0
3. Consultant Services and Study Visit 148.0 483.0 811.0
Foreign Consultants (6) 411.0 411.0Local Consultants (8) 21.0 21.0Study Visit Abroad (7) 148.0 31.0 179.0
4. Procurement 303.0 57.0 380.0
Furniture 38.0 6.0 41.0Learning Materials S2.0 4.0 68.0Equipment 216.0 48.0 283.0
S. Studies 40.0 49.0 89.0
Subtotal (1+2+3+4+5) 388.0 4,613.0 1,238.0 6,237.0Repayment of Project Preparation Facility 750.0Physical Contingencies 813.0
TOTAL 7,800.0
Notes:(1) USS36 per participant or Instructor por day.(2) USSZO per participant or Instructor.(3) USS1,000 per staff-month.(4j Manager USS1,800 per staff-month, coordinator USS1,200 per staff-month,
t*chnician USS1,000 per staff-month.(5) USS8,800 per staff-month including fees, per diem, and airfare.(8) USS1,000 per staff-month.(7) USS6,800 per staff-month including per diem, *irfare, and insurance.(8) Ses footnote 1 of Table 8.2 for list of these institutions.
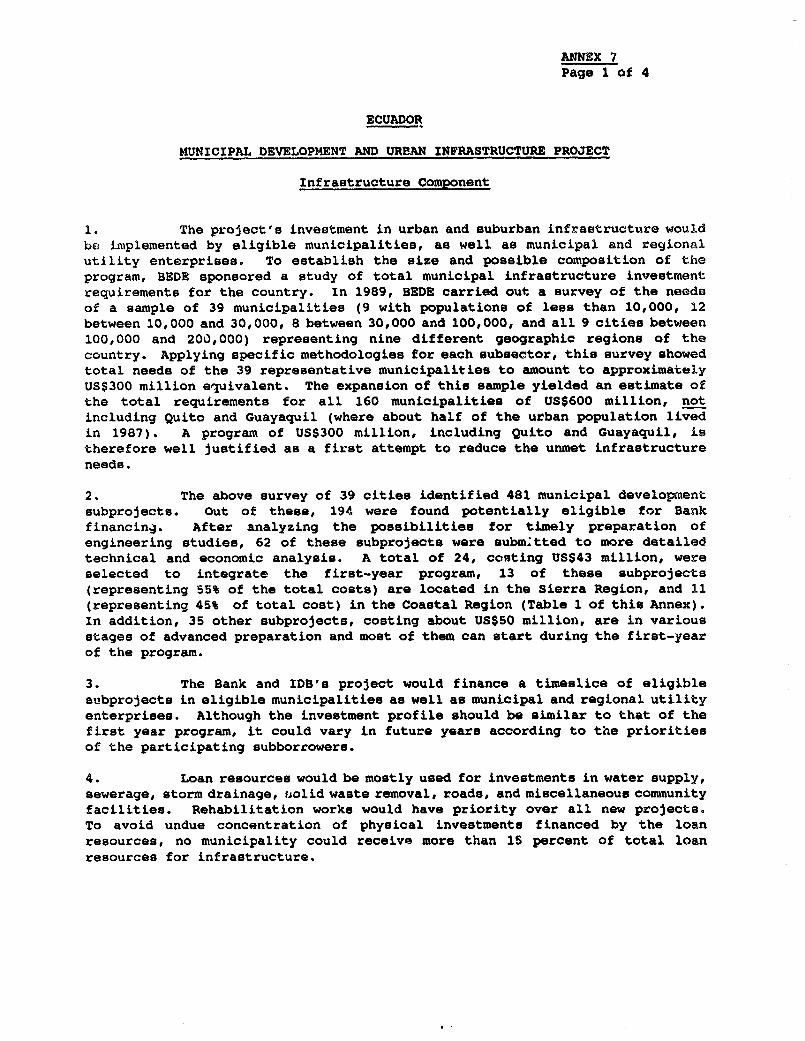
ANNEX 7Page 1 of 4
ECUADOR
MUNICIPAL DEVELOPHENT AND URBAN INFRASTRUCTURE PROJECT
Infrastructure Component
1. The project's investment in urban and suburban infrastructure wouldbe implemented by eligible municipalities, as well as municipal and regionalutility enterprises. To establish the size and possible composition of theprogram, BEDE sponsored a study of total municipal infrastructure investmentrequirements for the country. In 1989, BEDE carried out a survey of the needBof a sample of 39 municipalities (9 with populations of less than 10,000, 12between 10,000 and 30,000, 8 between 30,000 and 100,000, and all 9 cities between100,000 and 200,000) representing nine different geographic regions of thecountry. Applying specific methodologies for each subsector, this survey showedtotal needs of the 39 representative municipalities to amount to approximatelyUs$300 million equivalent. The expansion of this sample yielded an estimate ofthe total requirements for all 160 municipalities of US$600 million, notincluding Quito and Guayaquil (where about half of the urban population livedin 1987). A program of US$300 million, including Quito and Guayaquil, istherefore well justified as a first attempt to reduce the unmet infrastructureneeds.
2. The above survey of 39 cities identified 481 municipal developmentsubprojects. Out of these, 194. were found potentially eligible for Bankfinancing. After analyzing the possibilities for timely preparation ofengineering studies, 62 of these subprojects were submitted to more detailedtechnical and economic analysis. A total of 24, costing US$43 million, wereselected to integrate the first-year program, 13 of these subprojects(representing 55% of the total costs) are located in the Sierra Region, and 11(representing 45% of total cost) in the Coastal Region (Table 1 of this Annex).In addition, 35 other subprojects, costing about US$50 million, are in variousstages of advanced preparation and most of them can start during the first-yearof the program.
3. The Bank and IDB's project would finance a timeslice of eligiblesubprojects in eligible municipalities as well as municipal and regional utilityenterprises. Although the investment profile should be similar to that of thefirst year program, it could vary in future years according to the prioritiesof the participating subborrowers.
4. Loan resources would be mostly used for investments in water supply,sewerage, storm drainage, fjolid waste removal, roads, and miscellaneous communityfacilities. Rehabilitation works would have priority over all new projects.To avoid undue concentration of physical investments financed by the loanresources, no municipality could receive more than 15 percent of total loanresources for infrastructure.
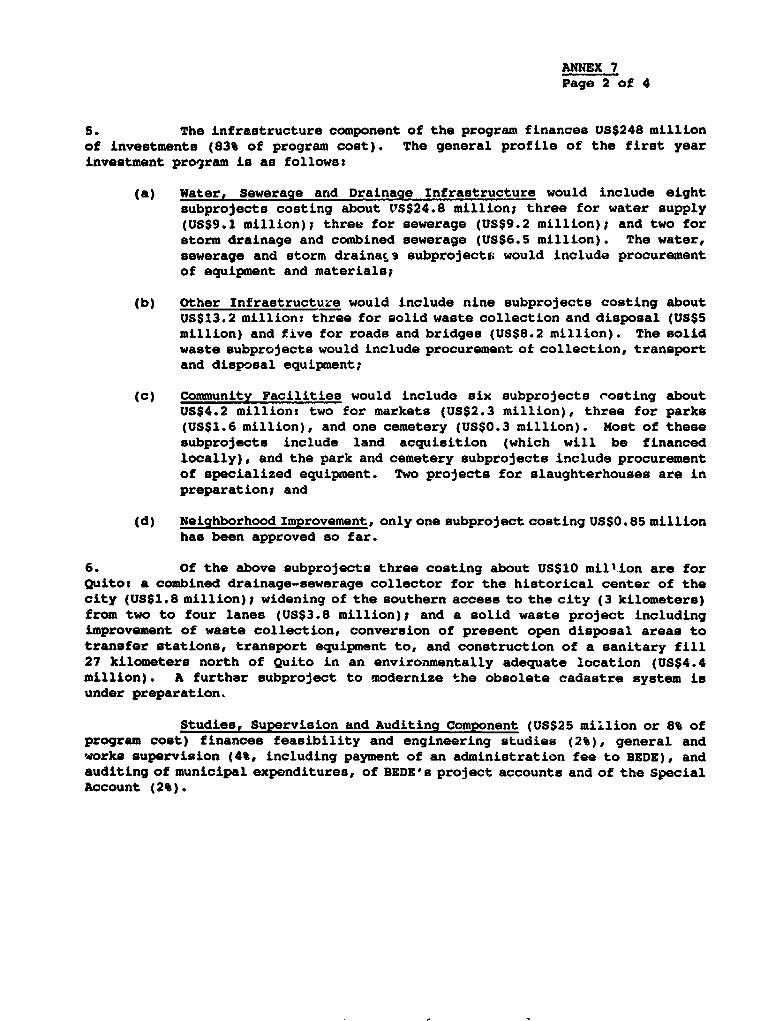
ANNEX 7Page 2 of 4
5. The infrastructure component of the program finances US$248 millionof investments (83% of program cost). The general proflle of the first yearinvestment program is as follows:
(a) Water, Sewerage and Drainage Infrastructure would include eightsubprojects costing about VS$24.8 million; three for water supply(US$9.1 million); three for sewerage (US$9.2 million); and two forstorm drainage and combined sewerage (US$6.5 million). The water,sewerage and storm drainats subprojects; would include procurementof equipment and materials;
(b) Other Infrastructure would include nine subprojects costing aboutUS$13.2 million: three for solid waste collection and disposal (US$5million) and five for roads and bridges (US$8.2 million). The solidwaste subprojects would include procurement of collection, transportand disposal equipment;
*c) Community Facilities would include six subprojects costing aboutUS$4.2 million: two for markets (US$2.3 million), three for parks(US$1.6 million), and one cemetery (US$0.3 million). Most of thesesubprojects include land acquisition (which will be financedlocally), and the park and cemetery subprojects include procurementof specialized equipment. Two projects for slaughterhouses are inpreparation; and
(d) Neighborhood Improvement, only one subproject costing US$0.85 millionhas been approved so far.
6. Of the above subprojects three costing about US$10 million are forQuito: a combined drainage-sewerage collector for the historical center of thecity (US$1.8 million); widening of the southern access to the city (3 kilometers)from two to four lanes (US$3.8 million); and a solid waste project includingimprovement of waste collection, conversion of present open disposal areas totransfer stations, transport equipment to, and construction of a sanitary fill27 kilometers north of Quito in an environmentally adequate location (US$4.4mlllion). A further subproject to modernize the obsolete cadastre system isunder preparation.
Studies, Supervision and Auditing Component (US$25 million or 8% ofprogram cost) finances feasibility and engineering studies (2%), general andworks supervision (4%, including payment of an administration fee to BEDE), andauditing of municipal expenditures, of BEDE's project accounts and of the SpecialAccount (2%).
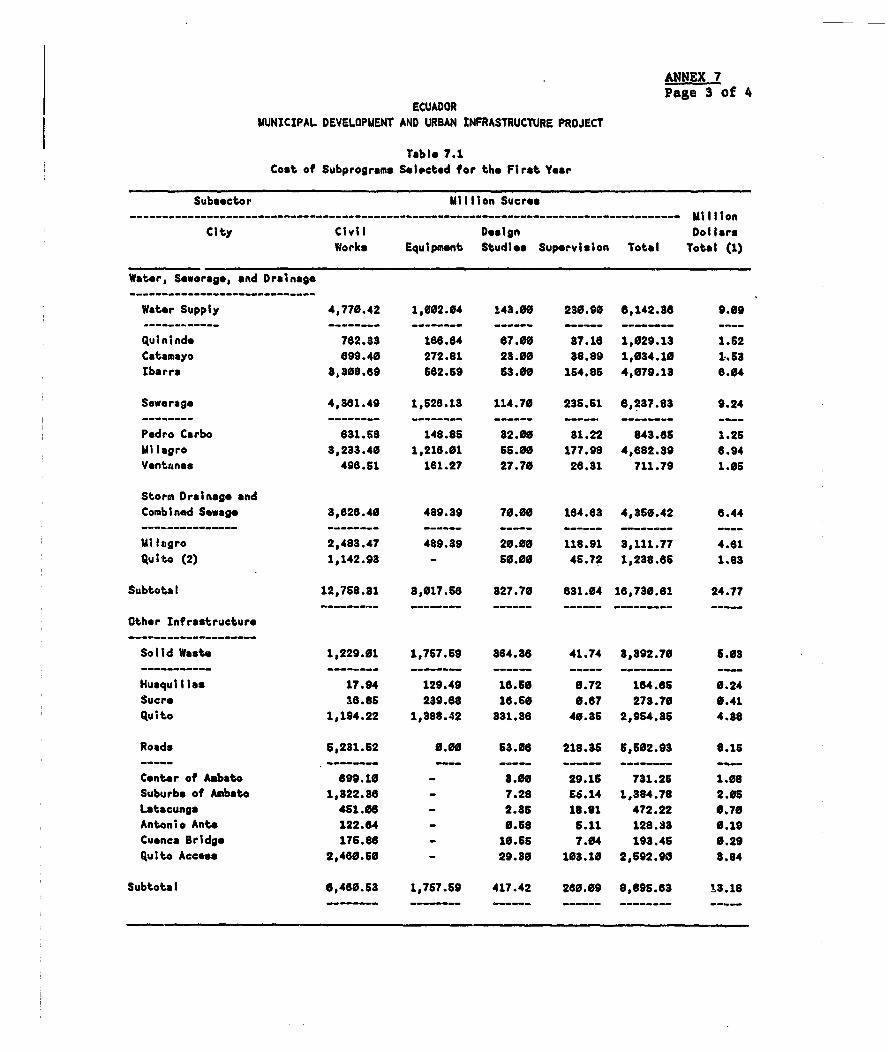
ANNEX 7Page 3 of 4
ECUADORMUNICIPAL DEVELOPMENT AND URBAN INFRASTRUCTURE PROJECT
Table 7.1
Cost of Subprograms Selected for the Ftrst Year
Subsector Million Sucros
------------------------------------------------------------------------------------- Million
City Civil Design Dollars
Works Equipment Studios Supervision Total Total (1)
Water, Sewerage, and Drainage----- _-----------------------
Water Supply 4,770.42 1,002.04 143.00 230.90 6,142.88 9.09
Quininds 762.33 186.64 67.00 37.16 1,029.13 1.52
Catamayo 699.40 272.81 23.00 38.89 1,034.10 1.53
Ibarra s,s30.69 682.59 53.06 154.8s 4,079.18 6.04
Sewerage 4,381.49 1,528.13 114.70 236.61 6,237.83 9.24
Pedro Carbo 631.58 148.86 82.00 31.22 843.s6 1.25
Milagro 3,233.40 1,216.01 65.00 177.98 4,682.39 6.94
Ventanas 498.51 161.27 27.70 26.31 711.79 1.06
Storm Drainage and
Combined Sewage 3,628.40 489.39 70.00 164.63 4,350.42 6.44
Milagro 2,483.47 489.39 20.00 118.91 3,111.77 4.81
Quito (2) 1,142.93 - 50.o0 46.72 1,238.65 1.83
Subtotal 12,7S8.31 3,017.58 827.70 631.04 16,730.61 24.77
Other Infrastructure
Solid Waste 1,229.01 1,757.59 364.38 41.74 3,392.70 5.03
Huaqullas 17.94 129.49 18.50 0.72 164.65 0.24
Sucre 16.86 239.68 16.56 0.67 273.70 0.41
Quito 1,194.22 1,388.42 831.38 40.86 2,954.36 4.88
Roads S,231.62 6.00 S3.08 218.385 5,02.93 8.15
Center of Aebato 699.10 - 3.00 29.15 731.25 1.08
Suburbs of Ambato 1,822.38 - 7.28 56.14 1,384.78 2.05
Latacunga 451.06 - 2.85 18.81 472.22 0.70
Antonio Ante 122.84 - 0.58 5.11 128.83 6.19
Cuanca Bridge 17S.89 - 10.65 7.04 193.46 0.29
quito Access 2,480.50 - 29.30 103.10 2,692.96 3.84
Subtotal 6,460.63 1,757.59 417.42 260.09 8,89s.63 13.18
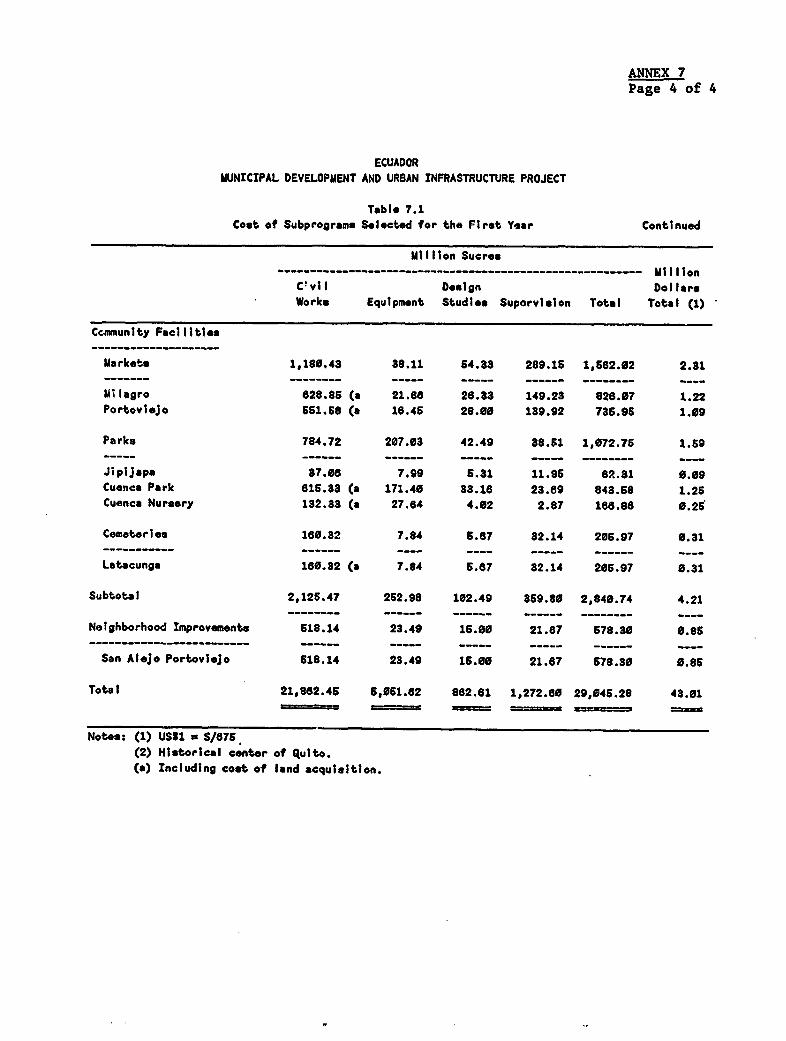
ANNEX 7Page 4 of 4
ECUADORMUNICIPAL DEVELOPMENT AND URBAN INFRASTRUCTURE PROJECT
Table 7.1Cost of Subprograms Selected for the First Year Continued
Million Sucres…M--------___----------------------------------------- million
C?vil Design DollarsWorks Equlpment Studies Suporvislon Total Total (1)
Cctmmunity Facilities
Markets 1,180.43 88.11 54.33 289.15 1,662.02 2.31
Milagro 628.86 (a 21.66 26.83 149.23 826.07 1.22Portovlejo 661.68 (a 16.46 28.00 139.92 736.96 1.09
Parks 784.72 207.03 42.49 38.S1 1,072.76 1.69_____ ------ ------ ----- ----- -------- ___-
Jipljapa 87.06 7.99 6.31 11.96 62.81 0.09
Cuenca Park 616.33 (a 171.40 33.16 23.69 843.58 1.26Cuenca Nursery 132.83 (a 27.64 4.02 2.87 168.88 0.25
Cemeterles 160.32 7.84 5.67 32.14 206.97 0.31_________ ______-- ---- ---- ----- ------ ----
Latacunga 160.32 (a 7.84 6.87 32.14 206.97 0.31
Subtotal 2,126.47 252.98 102.49 369.80 2,840.74 4.21________ ------ ______ ----_
Neighborhood Improvements 518.14 23.49 16.00 21.67 678.30 0.86…-- ------ -- ----------- --------
San Alejo Portovlejo 518.14 23.49 15.00 21.67 578.30 0.85
Total 21,862.45 6,061.62 862.61 1,272.60 29,046.28 43.01
Notes: (1) USSI a S/876(2) Historical center of Quito.(a) Including cost of land acquisition.
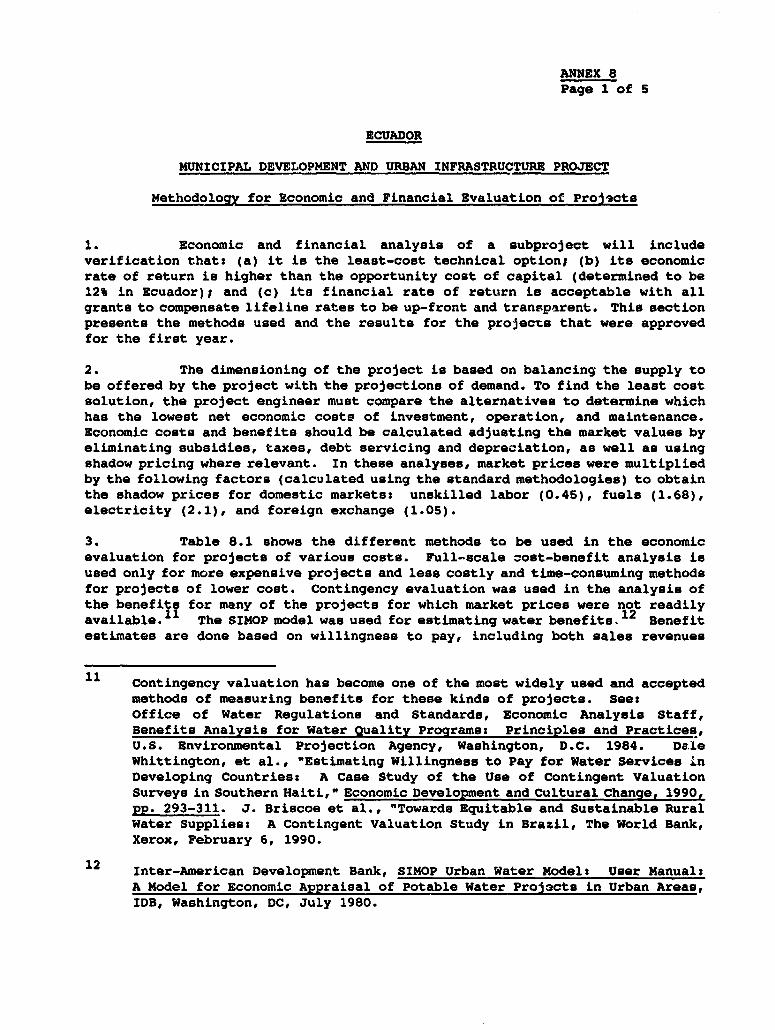
ANNEX 8Page 1 of 5
ECUADOR
MUNICIPAL DEVELOPMENT AND URBAN INFRASTRUCTURE PROJECT
Methodology for Economic and Financial Evaluation of Proiscts
1. Economic and financial analysis of a subproject will includeverification that: (a) it is the least-cost technical option; (b) its economicrate of return is higher than the opportunity cost of capital (determined to be12% in Ecuador); and (c) its financial rate of return is acceptable with allgrants to compensate lifeline rates to be up-front and transparent. This sectionpresents the methods used and the results for the projects that were approvedfor the first year.
2. The dimensioning of the project is based on balancing the supply tobe offered by the project with the projections of demand. To find the least costsolution, the project engineer must compare the alternatives to determine whichhas the lowest net economic costs of investment, operation, and maintenance.Economic costs and benefits should be calculated adjusting the market values byeliminating subsidies, taxes, debt servicing and depreciation, as well as usingshadow pricing where relevant. In these analyses, market prices were multipliedby the following factors (calculated using the standard methodologies) to obtainthe shadow prices for domestic markets: unskilled labor (0.45), fuels (1.68),electricity (2.1), and foreign exchange (1.05).
3. Table 8.1 shows the different methods to be used in the economicevaluation for projects of various costs. Full-scale cost-benefit analysis isused only for more expensive projects and less costly and time-consuming methodsfor projects of lower cost. Contingency evaluation was used in the analysis ofthe benefits for many of the projects for which market prices were not readilyavailable.1 1 The SIMOP model was used for estimating water benefits.12 Benefitestimates are done based on willingness to pay, including both sales revenues
11 Contingency valuation has become one of the most widely used and accepted
methods of measuring benefits for these kinds of projects. See:Office of Water Regulations and Standards, Economic Analysis Staff,Benefits Analysis for Water Quality Programs: Principles and Practices,U.S. Environmental Projection Agency, Washington, D.C. 1984. DeleWhittington, et al., "Estimating Willingness to Pay for Water Services inDeveloping Countries: A Case Study of the Use of Contingent ValuationSurveys in Southern Haiti," Economic Development and Cultural Change, 1990,pp. 293-311. J. Briscoe et al., "Towards Equitable and Sustainable RuralWater Supplies: A Contingent Valuation Study in Brazil, The World Bank,Xerox, February 6, 1990.
12 Inter-American Development Bank, SIMOP Urban Water Model: User Manual:
A Model for Economic Appraisal of Potable Water Proj3cts in Urban Areas,IDB, Washington, DC, July 1980.
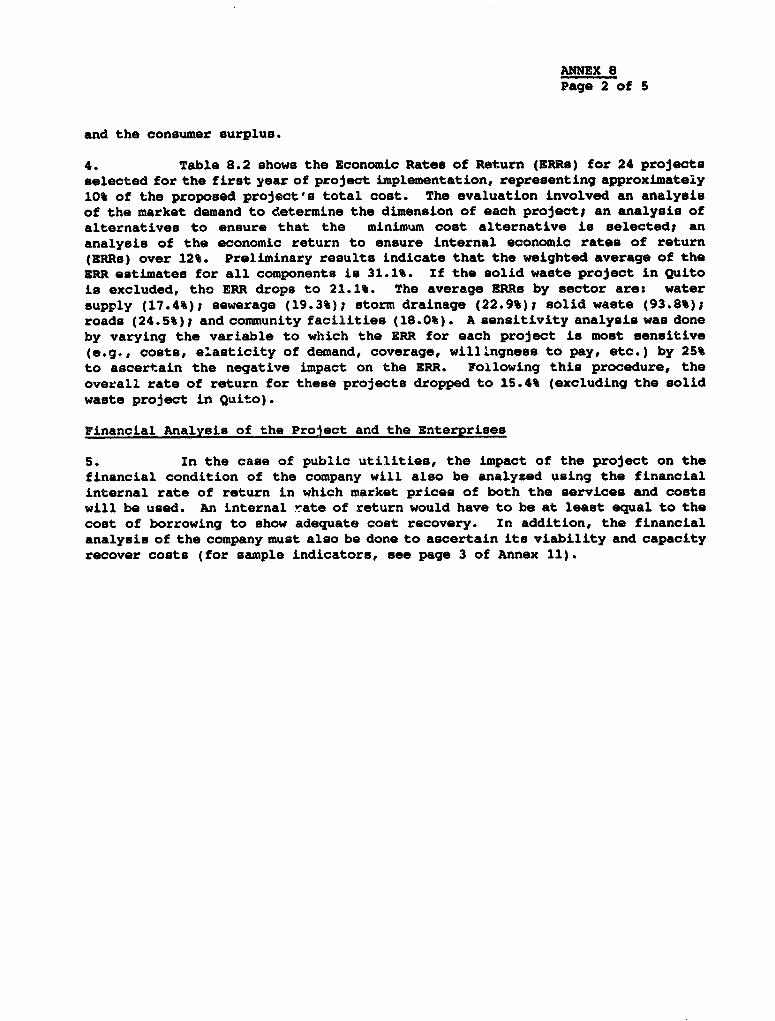
ANNEX 8Page 2 of 5
and the consumer surplus.
4. Table 8.2 shows the Economic Rates of Return (ERRs) for 24 projectsselected for the first year of project implementation, representing approximately10% of the proposed project's total cost. The evaluation involved an analysisof the market demand to determine the dimension of each project; an analysis ofalternatives to ensure that the minimum cost alternative is selected; ananalysis of the economic return to ensure internal economic rates of return(ERRs) over 12%. Preliminary results indicate that the weighted average of theERR estimates for all components is 31.1%. If the solid waste project in Quitois excluded, tho ERR drops to 21.1%. The average ERRs by sector are: watersupply (17.4%); sewerage (19.3%); storm drainage (22.9%); solid waste (93.8%);roads (24.5%); and community facilities (18.0%). A sensitivity analysis was doneby varying the variable to which the ERR for each project is most sensitive(e.g¢, costs, elasticity of demand, coverage, willIngness to pay, etc.) by 25%to ascertain the negative impact on the ERR. Following this procedure, theoverall rate of return for these projects dropped to 15.4% (excluding the solidwaste project in Quito).
Financial Analysis of the Project and the Enterprises
S. In the case of public utilities, the impact of the project on thefinancial condition of the company will also be analyzed using the financialinternal rate of return in which market prices of both the services and costswill be used. An internal rate of return would have to be at least equal to thecost of borrowing to show adequate cost recovery. In addition, the financialanalysis of the company must also be done to ascertain its viability and capacityrecover costs (for sample indicators, see page 3 of Annex 11).
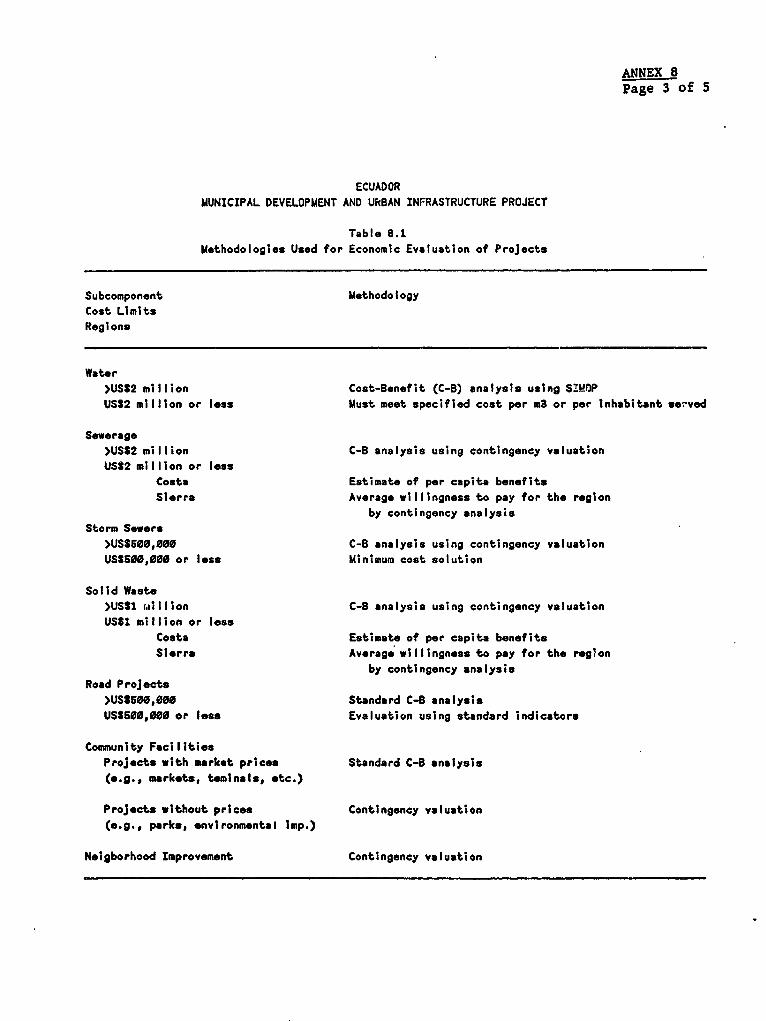
ANNEX 8Page 3 of 5
ECUADORMUNICIPAL DEVELOPMENT AND URBAN INFRASTRUCTURE PROJECT
Table 8.1Methodologies Used for Economic Evaluation of Projects
Subcomponent MethodologyCost LimitsRegions
Water>USS2 million Cost-Benefit (C-B) analysis using SIMOPUSS2 million or less Must meet specified cost per m3 or per Inhabitant se-ved
Sewerage>USS2 million C-B analysis using contingency valuationUSS2 million or less
Costa Estimate of per capita benefits
Sierra Average willingness to pay for the region
by contingency analysisStorm Sewers
>USS600,000 C-B analysis using contingency valuationUSS600,000 or leSS Minimum cost solution
Solid Waste>USS1 uillion C-B analysis using contingency valuation
USS1 million or lossCosta Estimate of per capita benefitsSierra Average willingness to pay for the reglon
by contingency analysisRoad Projects
>USSS00,000 Standard C-B analysis
USS600,000 or less Evaluation using standard indicators
Community FacilitiesProjects with market prices Standard C-B analysis(e.g., markets, teminals, etc.)
Projects without prices Contingency valuation
(e.g., parks, environmental Imp.)
Neigborhood Improvement Contingency valuation
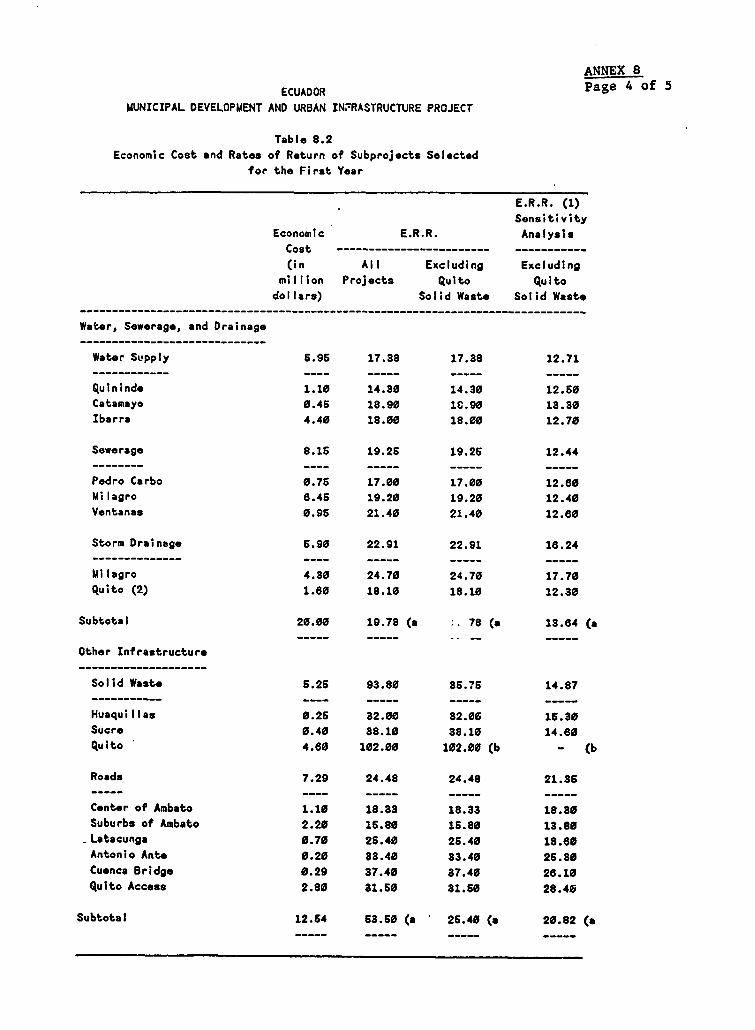
ANNEX 8
ECUADOR Page 4 of 5MUNICIPAL DEVELOPMENT AND URBAN INFRASTRUCTURE PROJECT
Table 8.2Economic Cost and Rates of Return of Subprojects Selected
for the First Year
E.R.R. (1)Sensitivity
Economlc E.R.R. AnalysisCost -(in All Excluding Excludingmillion Projects Quito Quitodollars) Solid Waste Solid Waste
------------------------------------------------------------- _-____----------__
Water, Sewerage, and Drainage
Water Supply 6.95 17.38 17.38 12.71
Quininde 1.10 14.30 14.30 12.60Catamayo 0.45 18.90 1C.90 13.30Ibarra 4.40 18.00 18.00 12.70
Sewerage 8.15 19.26 19.26 12.44________ ---- ----- ----- -----
Pedro Carbo 0.76 17.00 17.00 12.60Milagro 6.46 19.20 19.20 12.40Ventanas 0.96 21.40 21.40 12.60
Storm Drainage 6.90 22.91 22.91 16.24-------------- ~~~~~~~---- - - -
Milagro 4.30 24.70 24.70 17.70quito (2) 1.60 18.10 18.10 12.30
Subtotal 20.00 19.78 (a 78 (a 13.64 (a
Other Infrastructure
Solid Waste 5.26 93.80 356.7 14.87----------- ~~~----- - -- - -
Huaquillas 0.26 32.00 32.06 16.30Sucre 0.40 38.10 38.10 14.60Quito 4.60 102.00 102.00 (b - (b
Roads 7.29 24.48 24.48 21.36_____- --- _____ ____ _____
Center of Ambato 1.10 18.33 18.33 18.30Suburbs of Ambato 2.20 16.80 16.80 13.80Latacunga 0.70 26.40 26.40 18.60Antonio Ante 0.20 33.40 33.40 25.30Cuenca Bridge 0.29 37.40 37.40 26.10Quito Access 2.80 31.50 31.60 28.40
Subtotal 12.54 53.60 (a 26.40 (a 20.82 (a
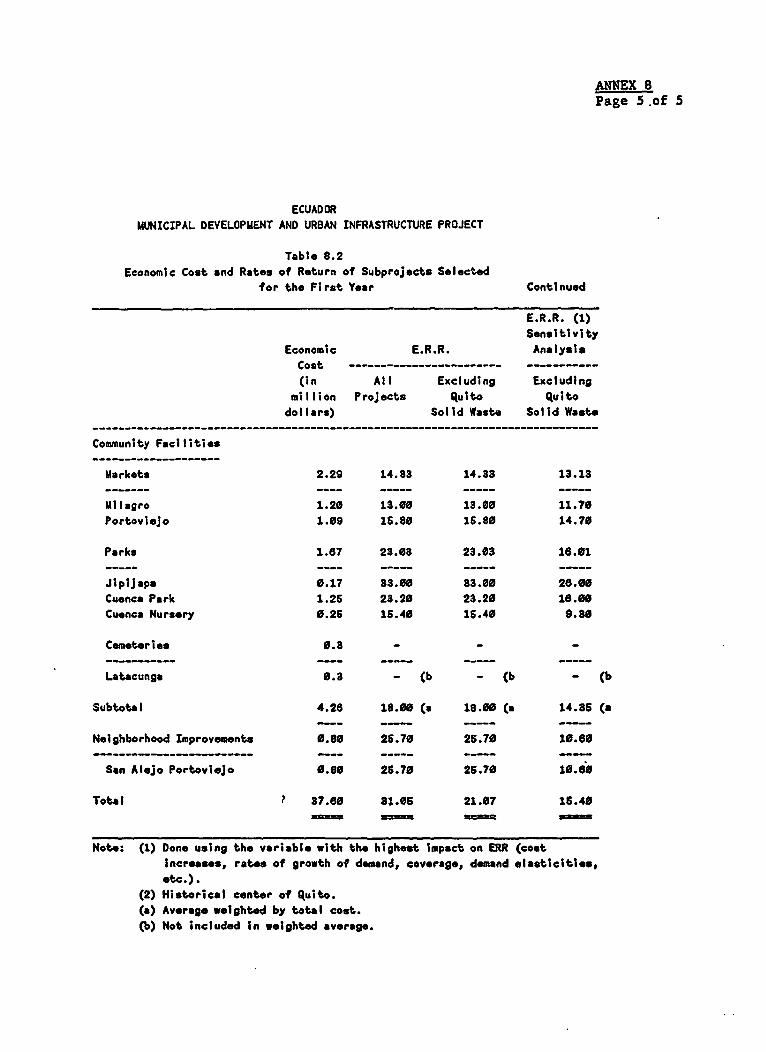
ANNEX 8Page 5.of 5
ECUADORMUNICIPAL DEVELOPMENT AND URBAN INFRASTRUCTURE PROJECT
Table 8.2Economic Cost and Rates of Return of SubproJocts Selected
for the First Year Continued
E.R.R. (1)Sensitivity
Economic E.R.R. AnalysisCost … …-…(in All Excluding Excludingmillion Projects quito Quitodollars) Solid Waste Solid Waste
Community Facilities
Markets 2.29 14.83 14.33 13.13
Milagro 1.20 13.00 13.00 11.70Portoviejo 1.09 16.80 16.80 14.70
Parks 1.67 23.03 23.03 18.01
Jipijapa 0.17 33.00 83.00 26.00Cuenca Park 1.26 23.20 23.20 16.00Cuenca Nursery 0.25 15.40 16.40 9.30
Cemeteries 0.3 - - -
Latacungs 0.3 - (b - (b - (b
Subtotal 4.26 18.00 (a 18.00 (a 14.85 (a
Neighborhood Improvements 0.80 26.70 25.70 10.60
Son AleJo Portovitjo 0.80 26.70 26.70 10.60
Total ? 37.60 81.05 21.07 16.40=== ==
Note: (1) Done using the variable with the highest Impact on ERR (costincreases, rates of growth of demand, coverage, demand elasticities,etc.).
(2) Historical center of Quito.(a) Average weighted by total cost.(b) Not included in weighted average.

ANNEX 9
ECUADOR
MUNICIPAL DEVELOPMENT AND INFRASTRUCTURE PROJECT
Cost Recovery Policy
1. As a general norm, user charges (e.g., tariffs, fees and bettermentlevies) and taxes should cover all costs of operation, administration,maintenance, and investment. In the cases of water, sanitary and storm sewers,solid waste disposal and neighborhood improvement, where the technical studiesshow that the final users will not be able to cover the entire investment cost,part of this can be covered by grants from the Municipal Investment Fund. Thecost recovery policy by sector is as follows:
Water, Sanitary and Storm Sewers, and Solid Waste Disposal. All costs(with the exception of the portion of the investment cost subsidized forlow-income families) will be recovered from tariffs or betterment levies.
Road Projects. Investment and maintenance costs will be recovered fromtolls, betterment fees, and increases in general municipal revenues.
Markets and Transport Terminals. All costs of investment, maintenance,and operation to be recovered via fees and/or rent of space.
Parks. All costs to be recovered via betterment fees and increases ingeneral municipal revenues.
Neighborhood Improvement. For on-site improvements of residentialproperties, investment costs not subsidized by the Municipal InvestmentFund would be recovered from loan payments for loans onlent to the finalbeneficiaries under the same terms as for municipalities. For publicservices, cost recovery would be as stated for each of the above sectors.
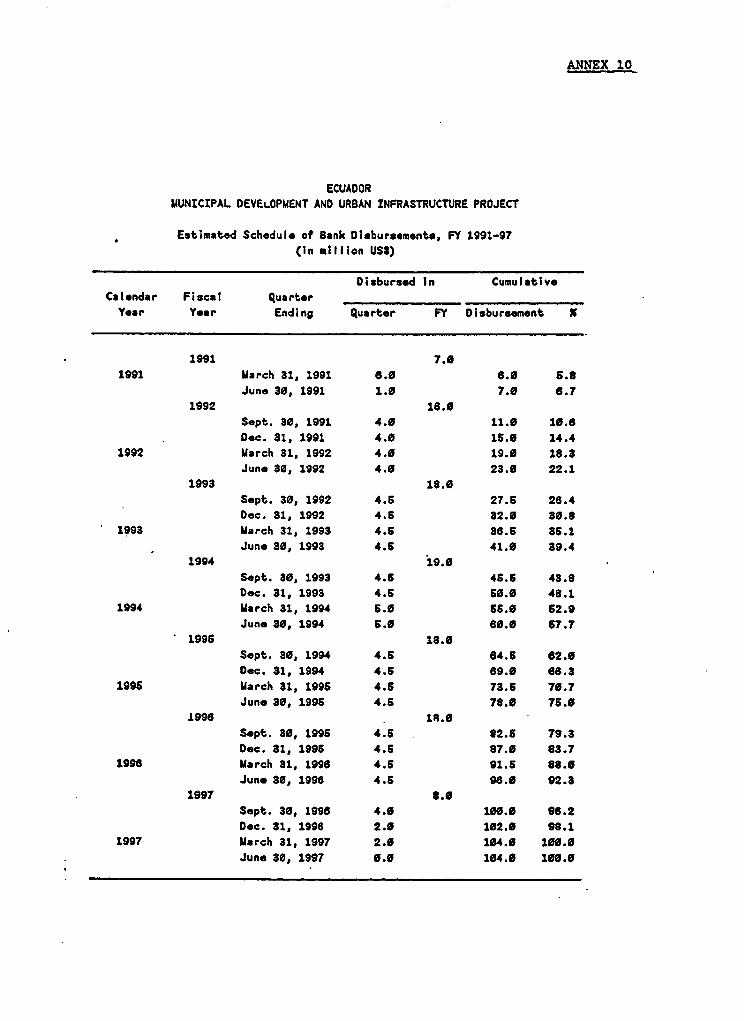
ANNEX 10
ECUADORMUNICIPAL DEVELOPMENT AND URBAN INFRASTRUCTURE PROJECT
Estimated Schedule of Bank Disbursements, FY 1991-97(In million US$)
Disbursed In CumulativeCalendar Fiscal Quarter _Year Year Ending Quarter FY Disbursement X
1991 7.01991 March 31, 1991 6.0 6.o 5.8
June 30, 1991 1.0 7.0 6.71992 16.0
Sept. 30, 1991 4.0 11.0 10.6Dec. 31, 1991 4.0 15.0 14.4
1992 March 31, 1992 4.0 19.0 18.3June 30, 1992 4.0 23.0 22.1
1993 18.0Sept. 30, 1992 4.6 27.5 26.4Dec. 31, 1992 4.5 32.0 86.8
1993 March 31, 1993 4.6 38.5 36.1June 30, 1993 4.6 41.0 39.4
1994 19.0Sept. 30, 1993 4.5 46.5 43.8Dec. 31, 1993 4.5 60.0 48.1
1994 March 31, 1994 5.6 56.0 52.9June 30, 1994 5.6 66.0 67.7
1996 18.0Sept. 30, 1994 4.5 84.5 62.0Dec. 31, 1994 4.5 89.0 68.3
1995 March 31, 1995 4.5 73.6 70.7June 30, 1995 4.6 78.0 76.0
1996 1S.6Sept. 30, 1996 4.6 82.6 79.3Dec. 31, 1996 4.5 87.0 83.7
1998 March 31, 1996 4.5 91.5 88.0Jun. 30, 1998 4.5 96.0 92.3
1997 8.6Sept. 36, 1996 4.0 100.0 06.2Dec. 31, 1998 2.0 102.0 98.1
1997 March 31, 1997 2.0 104.0 100.0June 30, 1997 0.0 104.0 100.0
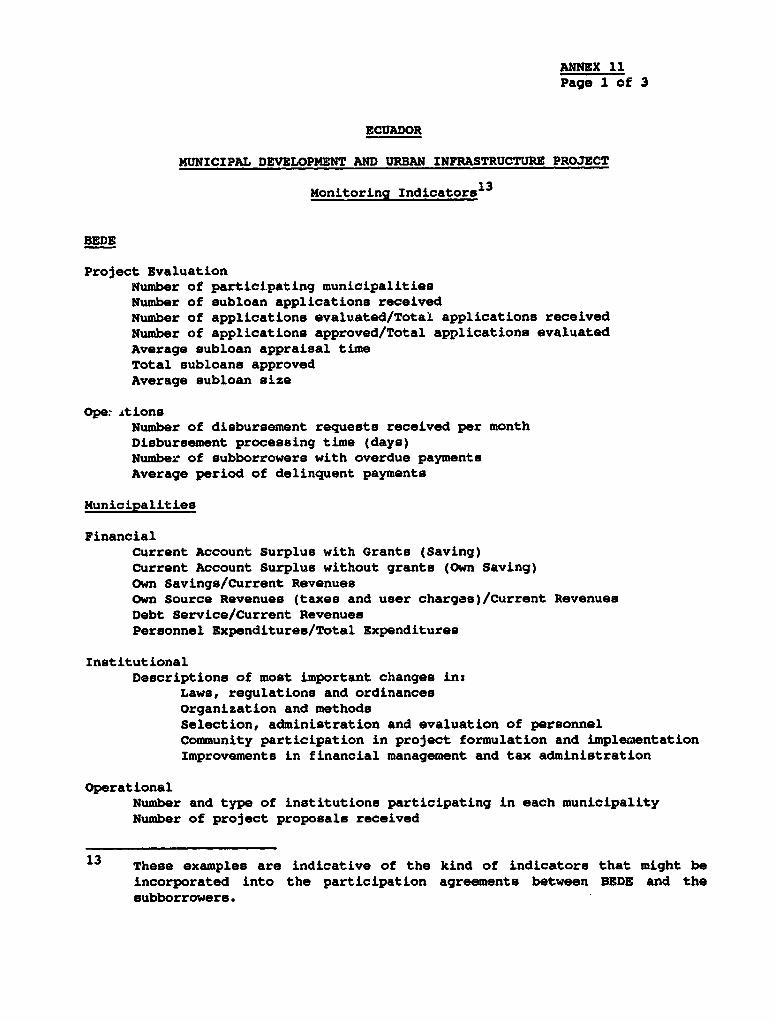
ANNEX 11Page 1 of 3
ECUADOR
MUNICIPAL DEVELOPMENT AND URBAN INFRASTRUCTURE PROJECT
Monitoring Indicators13
BEDE
Project EvaluationNumber of participating municipalitiesNumber of subloan applications receivedNumber of applications evaluated/Total applications receivedNumber of applications approved/Total applications evaluatedAverage subloan appraisal timeTotal subloans approvedAverage subloan size
Ope. stionsNumber of disbursement requests received per monthDisbursement processing time (days)Number of subborrowers with overdue paymentsAverage period of delinquent payments
Municipalities
FinancialCurrent Account Surplus with Grants (Saving)Current Account Surplus without grants (Own Saving)Own Savings/Current RevenuesOwn Source Revenues (taxes and user charges)/Current RevenuesDebt Service/Current RevenuesPersonnel Expenditures/Total Expenditures
InstitutionalDescriptions of most important changes in:
Laws, regulations and ordinancesOrganization and methodsSelection, administration and evaluation of personnelCommunity participation in project formulation and implementationImprovements in financial management and tax administration
OperationalNumber and type of institutions participating in each municipalityNumber of project proposals received
13 These examples are indicative of the kind of indicators that might be
incorporated into the participation agreements between BEDE and thesubborrowers.
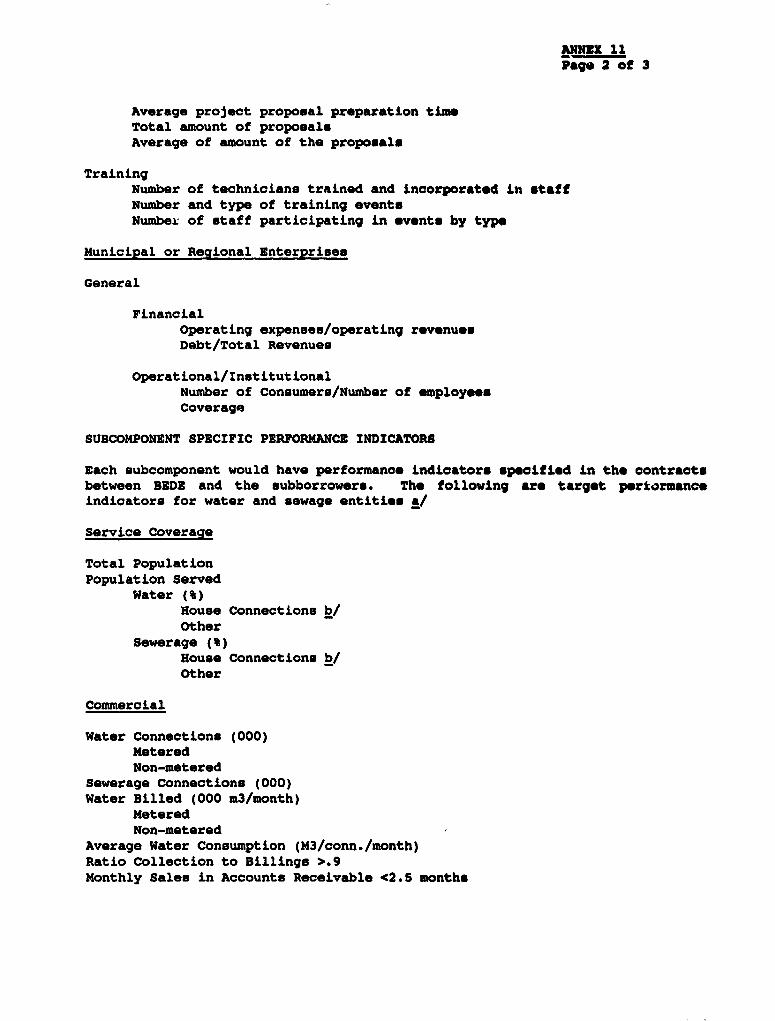
AmuxX 11Page 2 of 3
Average project proposal preparation timTotal amount of proposalsAverage of amount of the proposals
TrainingNumber of technicians trained and lncorporated ln staffNumber and type of training eventsNumbex of staff particlpatlng ln events by type
Municipal or ReQional EnterprLses
General
FLnancialOperating expenses/operating revenuesDebt/Total Revenues
Operational/InstLtutionalNumber of Consumers/Number of employeesCoverage
SUBCOMPONENT SPECIFIC PERFORMANCE INDICATORS
Each subcomponent would have performance Lndlcators specified ln the contractsbetween BEDE and the subborrowers. The followlng are target pertormanceindicators for water and sewage entities a/
Servlce Coverage
Total PopulatlonPopulatLon Served
Water (%)House ConnectLons b/other
Sewerage (%)House Connections b/
Other
CommercLal
Water ConnectLons (000)MeteredNon-metered
Sewerage Connections (000)Water Billed (000 m3/month)
MeteredNon-metered
Average Water Consumption (M3/conn./month)Ratio Collection to Blllings >.9Monthly Sales in Accounts Recelvable <2.5 months
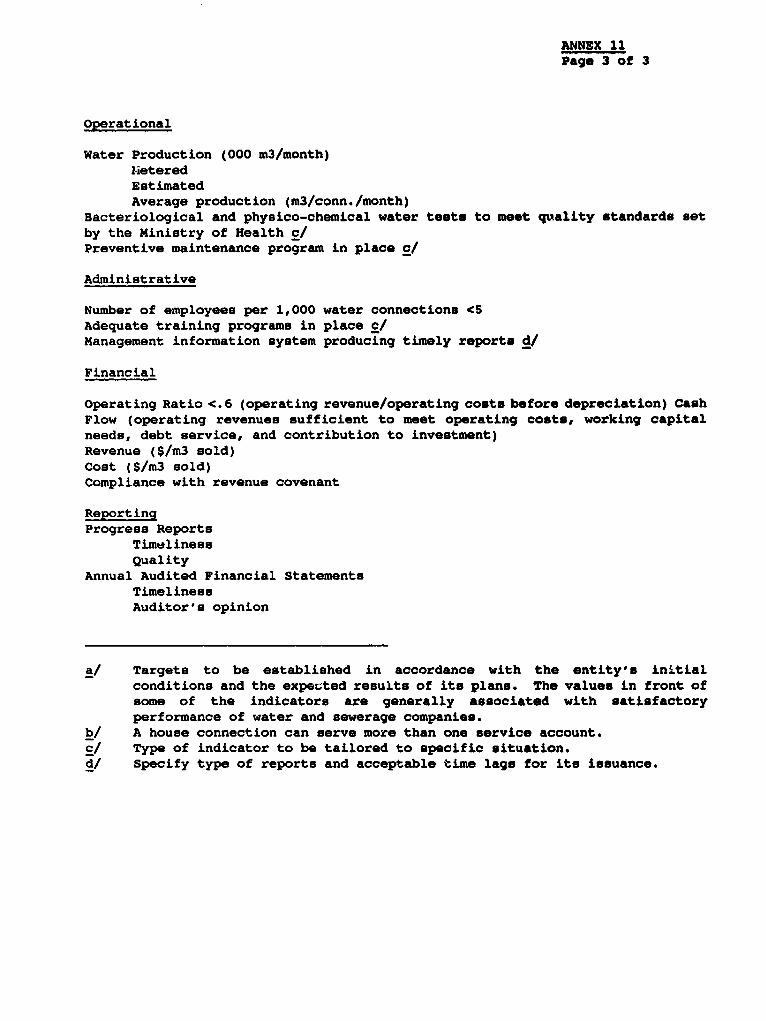
ANNEX 11Page 3 of 3
Operational
Water Production (000 m3/month)ZieteredEstimatedAverage production (m3/conn./month)
Bacteriological and physico-chemical water tests to meet quality standards setby the Ministry of Health c/Preventive maintenance program in place c/
Administrative
Number of employees per 1,000 water connections <5Adequate training programs in place c/Management information system producing timely reports d/
Financial
Operating Ratio <.6 (operating revenue/operating costs before depreciation) CashFlow (operating revenues sufficient to meet operating costs, working capitalneeds, debt service, and contribution to investment)Revenue ($/m3 sold)Cost ($/m3 sold)Compliance with revenue covenant
ReportingProgress Reports
TimelinessQuality
Annual Audited Financial StatementsTimelinessAuditor's opinion
a/ Targets to be established in accordance with the entity's initialconditions and the expected results of its plans. The values in front ofsome of the indicators are generally associated with satisfactoryperformance of water and sewerage companies.
b/ A house connection can serve more than one service account.c/ Type of indicator to be tailored to specific situation.d/ specify type of reports and acceptable time lags for its issuance.
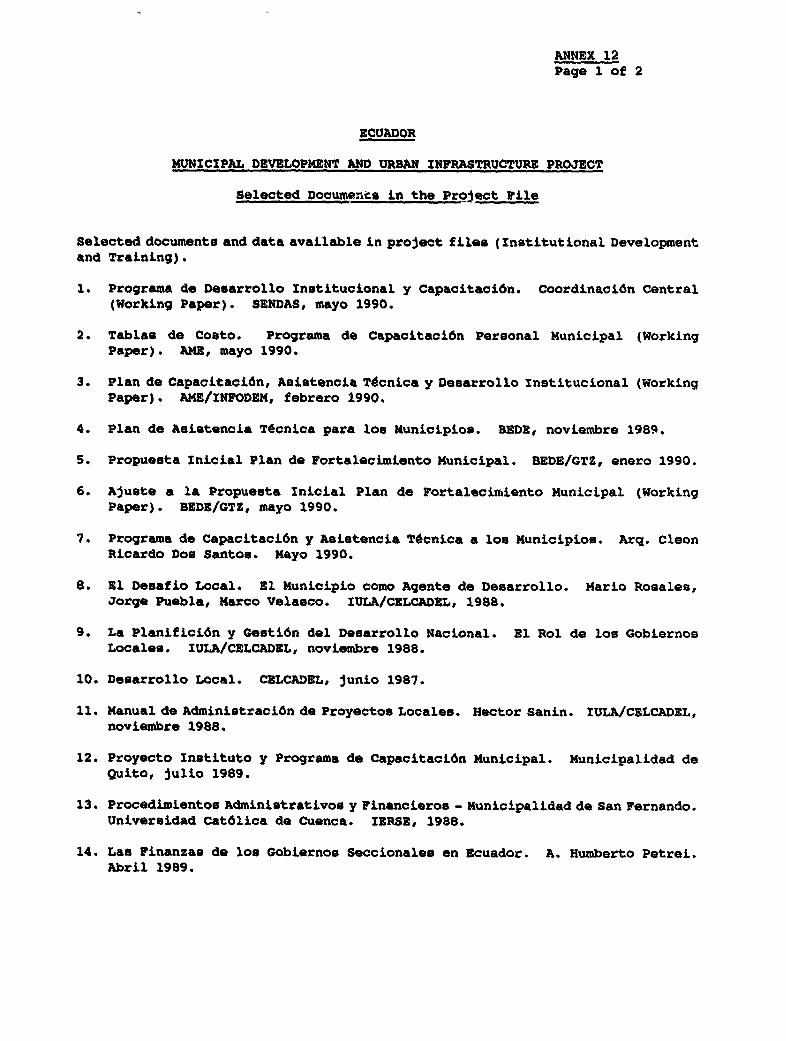
ANNEX 12Page 1 of 2
ECUADOR
MUNICIPAL DEVELOPMENT AND URBAN INFRASTRUCTURE PROJECT
Selected Documen.ts in the Project Vile
Selected documento and data available in project files (Institutional Developmentand Training).
1. Programa de Desarrollo Institucional y Capacitaci6n. Coordinacidn Central(Working Paper). SENDAS, mayo 1990.
2. Tablas de Costo. Programa do Capacitacifn Personal Municipal (WorkingPaper). AMN, mayo 1990.
3. Plan do Capacitaci6n, Asistencia Tdcnica y Desarrollo Institucional (WorkingPaper). AME/ZNFODEM, febrero 1990.
4. Plan de Asistencia T6cnica para los Municipios. BEDE, noviembre 1989.
5. Propuesta Inicial Plan de Fortalecimiento Municipal. BEDE/GTZ, enero 1990.
6. Ajuste a la Propuesta Inicial Plan de Fortalecimiento Municipal (WorkingPaper). BEDE/GTZ, mayo 1990.
7. Programa de Capacitaci6n y Asistencia T6cnica a lo Municipios. Arq. CleonRicardo Doe Santos. Mayo 1990.
8. E1 Desafio Local. El Municipio como Agente de Desarrollo. Mario Rosales,Jorge Puebla, Marco Velaeco. IULA/CELCADEL, 1988.
9. La Planificidn y Gesti6n del Desarrollo Nacional. E1 Rol de lo GobiernosLocales. IULA/CELCADEL, noviembre 1988.
10. Desarrollo Local. CELCADEL, junio 1987.
11. Manual do Administraci6n de Proyoctos Locales. Hector Sanin. IULA/CELCADEL,noviembre 1988.
12. Proyecto Instituto y Programa de Capacitacidn Municipal. Municipalidad deQuito, julio 1989.
13. Procedimientos Administrativoe y Financieros - Municipalidad de San Fernando.Univorsidad Cat6lica de Cuenca. IERSE, 1988.
14. Las Finanzas de l10 Gobiernos Seccionales en Ecuador. A. Humberto Petrei.Abril 1989.

ANNEX 12Page 2 of 2
15. Ley do R#gqmen Munlolpal. Rouador, 1989.
16. SLstama de Presupuesto por Programa para Municlpios. IERSE, Cuenca 1980.
17. Roglamonto Org6nico FuncLonal do la NunLiolpalLdad de Cuenca. 1985.
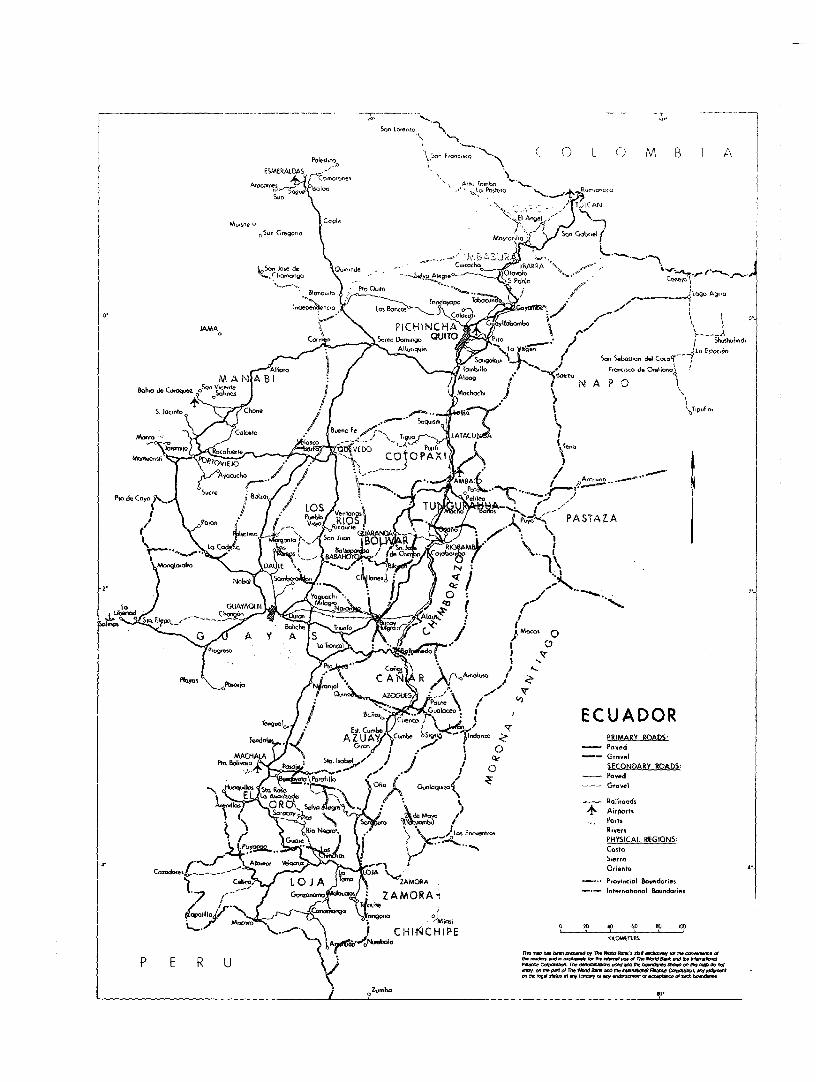
5-nfoc.c F- (- L~ l ( M B I
ESMERALDAS . ''
Suo X
, <~~~~~~~~~~~~~~~~~~~~~~E, A t/ t
d ? , tRA Sg t^k,
O. Inde nclo \ ~~~~~~~~~~~~~~~tos (wonc Co ci .
g_ Ag-
JAMA @
dINC P. oy N 0
_f 4- q\u-n zSon lobuSo s wf Son~~Sm Sebst-g del c-sT___
MUA NA 81:SiAoo N A P D It
S. Jocmf bne:{_ ;sotv bopu
C O O P X | IACDl <1
Pt.~~~~~~ de CP,Re-y.gl PbY° \_PcllinvN+inls CA N R A\<AoI- /
re9t0l , PASTAZ>vlaeo , , CADO
MACHALA |2~~ ~ ~~~~ ~ ~
I 'tes6
Grle
A Yk A ev M-9 0./*5+ cto
>~~~~A R> wj;et/. ol
jag er. \w)\C nvrsRvr
< Mors70 . 0 , CH116CHiPE ~~~~~~~~~~~0P.od2 O40r C
It.w 01
P E R U \ '
>> * _ _ > V _S5 w =~~~~~~~~~~~~~~~~~~Rilcm
< 5f 5w 5 ~~~~~~~~~~~~~~~i , o nsa
j OZ.Jnbo~~~~~~~~~~~~~~P,