Embed Size (px)
Citation preview
AD-A267 738FN RPORTl
DETECTION AND REMOVAL OF DEFECTS INAPPAREL PRODUCTION
ByWayne Tincher, Wayne Daley and Wiley Holcombe
Prepared for -. oj•3Defense Logistics Agency
UnderContract DLA 900-87-D-0018-0007
March, 1993 . -
\..
93-.17600
-6 3 8 19/iIl I fii• ly4llil
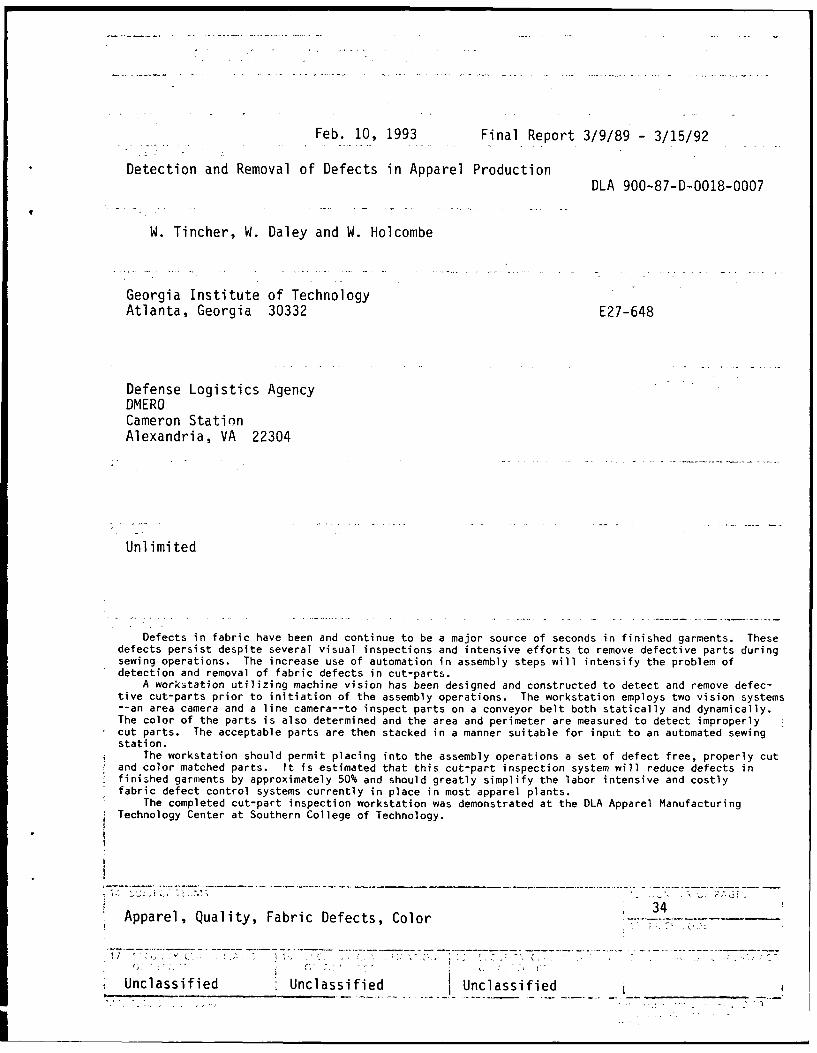
Feb. 10, 1993 Final Report 3/9/89 - 3/15/92
Detection and Removal of Defects in Apparel ProductionDLA 900-87-D-0018-0007
W. Tincher, W. Daley and W. Holcombe
Georgia Institute of TechnologyAtlanta, Georgia 30332 E27-648
Defense Logistics AgencyDMEROCameron StatinnAlexandria, VA 22304
Unlimited
Defects in fabric have been and continue to be a major source of seconds in finished garments. Thesedefects persist despite several visual inspections and intensive efforts to remove defective parts duringsewing operations. The increase use of automation in assembly steps will intensify the problem ofdetection and removal of fabric defects in cut-parts.
A workstation utilizing machine vision has been designed and constructed to detect and remove defec-tive cut-parts prior to initiation of the assembly operations. The workstation employs two vision systems-- an area camera and a line camera--to inspect parts on a conveyor belt both statically and dynamically.The color of the parts is also determined and the area and perimeter are measured to detect improperlycut parts. The acceptable parts are then stacked in a manner suitable for input to an automated sewingstation.
The workstation should permit placing into the assembly operations a set of defect free, properly cutand color matched parts. It is estimated that this cut-part inspection system will reduce defects infinished garments by approximately 50% and should greatly simplify the labor intensive and costlyfabric defect control systems currently in place in most apparel plants.
The completed cut-part inspection workstation was demonstrated at the DLA Apparel ManufacturingTechnology Center at Southern College of Technology.
34Apparel, Quality, Fabric Defects, Color
Unclassified Unclassified Unclassified
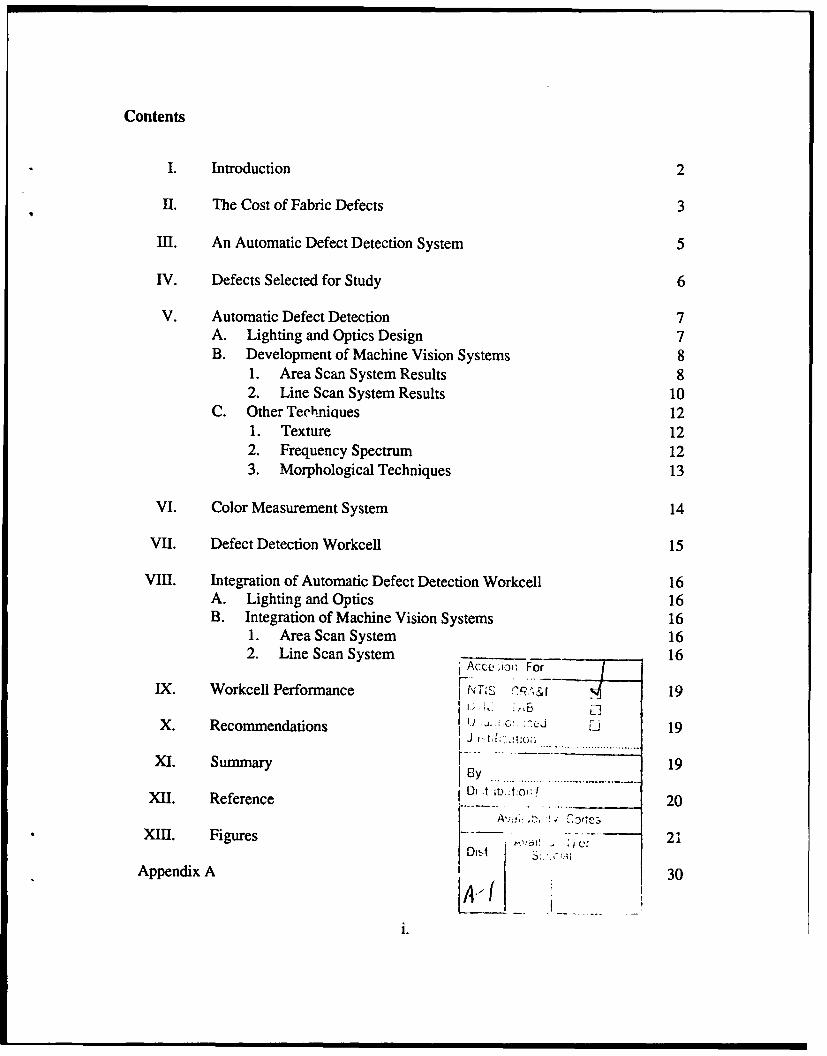
Contents
I. Introduction 2
II. The Cost of Fabric Defects 3
III. An Automatic Defect Detection System 5
IV. Defects Selected for Study 6
V. Automatic Defect Detection 7A. Lighting and Optics Design 7B. Development of Machine Vision Systems 8
1. Area Scan System Results 82. Line Scan System Results 10
C. Other Techniques 121. Texture 122. Frequency Spectrum 123. Morphological Techniques 13
VI. Color Measurement System 14
VII. Defect Detection Workcell 15
VIII. Integration of Automatic Defect Detection Workcell 16A. Lighting and Optics 16B. Integration of Machine Vision Systems 16
1. Area Scan System 162. Line Scan System 16
Acce 10; For [
IX. Workcell Performance [Nn' •",&f 19
X. Recommendations ; C., ne [i 19J I- t . S.... ...... . ..................
XI. Summary y 19By.......
XII. Reference Di t L.Ao,' 20
XIII. Figures 21
Appendix A 30
:, •, i i i i. |
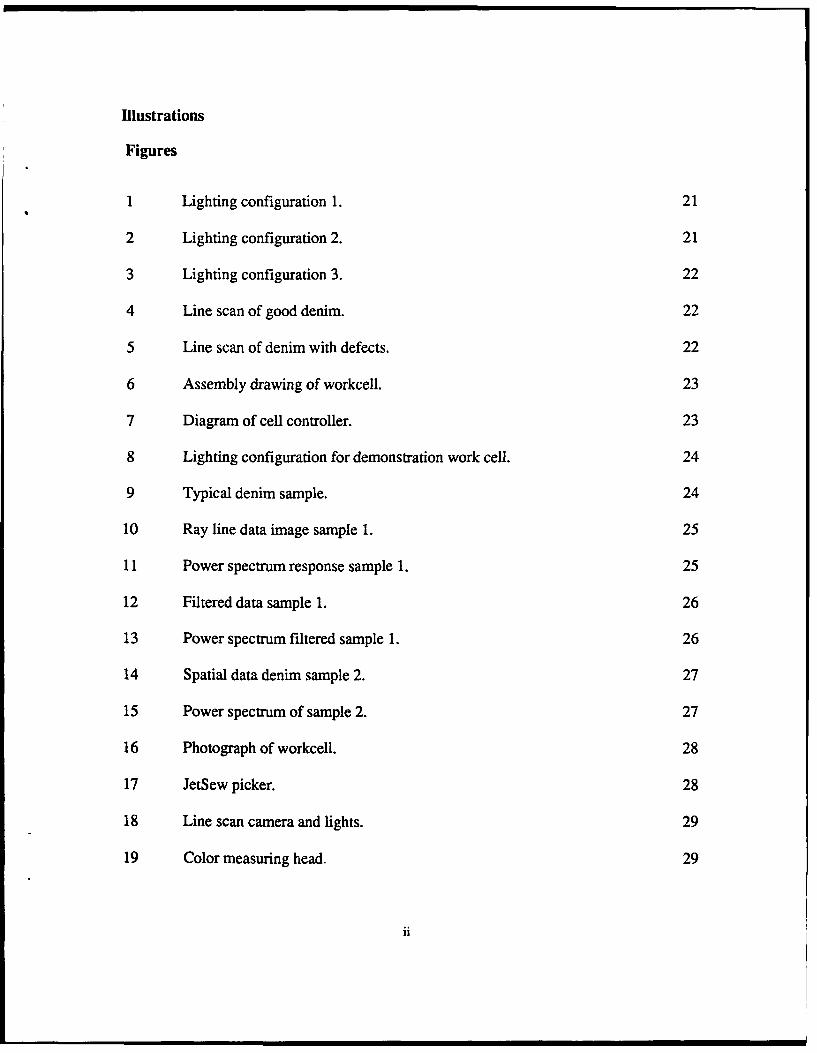
Illustrations
Figures
1 Lighting configuration 1. 21
2 Lighting configuration 2. 21
3 Lighting configuration 3. 22
4 Line scan of good denim. 22
5 Line scan of denim with defects. 22
6 Assembly drawing of workcell. 23
7 Diagram of cell controller. 23
8 Lighting configuration for demonstration work cell. 24
9 Typical denim sample. 24
10 Ray line data image sample 1. 25
11 Power spectrum response sample 1. 25
12 Filtered data sample 1. 26
13 Power spectrum filtered sample 1. 26
14 Spatial data denim sample 2. 27
15 Power spectrum of sample 2. 27
16 Photograph of workcell. 28
17 JetSew picker. 28
18 Line scan camera and lights. 29
19 Color measuring head. 29
ii
Tables
1 Cost of fabric defects in apparel manufacturing. 3
2 Cut part inspection unit components. 6
3 Area camera defect detection effectiveness. 9
4 Results of defect detection trial line scan camera. 11
5 Cut part inspection unit components. 16
6 Results of defect detection trail. 18
111.
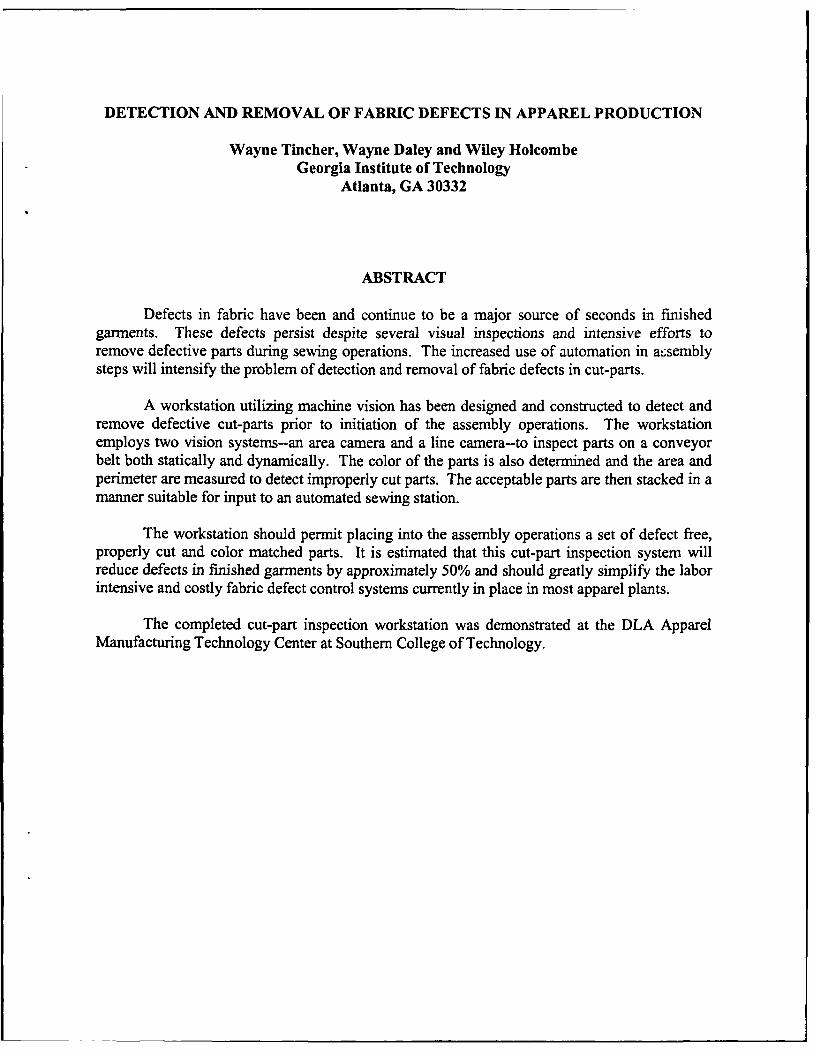
DETECTION AND REMOVAL OF FABRIC DEFECTS IN APPAREL PRODUCTION
Wayne Tincher, Wayne Daley and Wiley HolcombeGeorgia Institute of Technology
Atlanta, GA 30332
ABSTRACT
Defects in fabric have been and continue to be a major source of seconds in finishedgarments. These defects persist despite several visual inspections and intensive efforts toremove defective parts during sewing operations. The increased use of automation in a:semblysteps will intensify the problem of detection and removal of fabric defects in cut-parts.
A workstation utilizing machine vision has been designed and constructed to detect andremove defective cut-parts prior to initiation of the assembly operations. The workstationemploys two vision systems-an area camera and a line camera-to inspect parts on a conveyorbelt both statically and dynamically. The color of the parts is also determined and the area andperimeter are measured to detect improperly cut parts. The acceptable parts are then stacked in amanner suitable for input to an automated sewing station.
The workstation should permit placing into the assembly operations a set of defect free,properly cut and color matched parts. It is estimated that this cut-part inspection system willreduce defects in finished garments by approximately 50% and should greatly simplify the laborintensive and costly fabric defect control systems currently in place in most apparel plants.
The completed cut-part inspection workstation was demonstrated at the DLA ApparelManufacturing Technology Center at Southern College of Technology.
DETECTION AND REMOVAL OF FABRIC DEFECTS IN APPAREL PRODUCTION
Wayne C. Tincher, Wayne Daley and Wiley HolcombeGeorgia Institute of Technology
Atlanta, Georgia 30332
I. INTRODUCTION
Fabric defects are a constant and continuing problem in the manufacture of apparel.Despite major improvements in yarn manufacturing equipment and knitting and weavingmachines, it is not possible at the present time to manufacture defect free fabric. In an era when"zero defects" is the goal of most textile mills, it must be admitted that this still remains a goaland not an accomplished objective.
Defects in fabric create significant problems for the apparel manufacturer and a varietyof systems have been developed to cope with the defect problem. Some firms conduct 100%inspection of in-coming fabric, mark or label detected defects and attempt to remove all fabricdefects in spreading. Other firms depend on inspection during spreading by the spreaderoperator and the removal of the detected defects prior to cutting. A few firms depend on sewingoperators to detect flaws in cut parts and to replace the parts before manufacturing proceeds.Still others make no attempt to find fabric defects during manufacturing, but rely on finalgarment inspection to detect and remove defect containing garments. In a few cases, cut partsare examined individually before bundling and defective parts are replaced prior to initiation ofthe sewing operations [1].
All these methods of coping with fabric defects are costly and disruptive in the apparelmanufacturing process and most are not successful in eliminating fabric defects in finishedgarments. Therefore, fabric defects are a major point of conflict at the textile and apparelindustries interface. Study of this problem has been the subject of continuing investigation inthe military procurement system but no satisfactory solution is apparent [2-4].
The problem of detecting and removing fabric defects increases in severity as moreapparel operations are automated. Automated spreading machines requiring less workerattention reduce the probability of finding defects and, in some cases, of finding markers thathave been placed on the fabric denoting the location of defects. With fewer workers handlingparts in sewing operations, the probability that a defect will be detected decreases.
Most of the effort at the present time in automatic detection of defects in fabric isdirected toward inspection of fabric rolls. A number of companies either have, or will market inthe near future, systems for automatic roll inspection [5]. The unfortunate disadvantage of thesesystems is that if defects are detected they can only be marked (or cut out and replaced by aseam which is another defect). The defect must still be removed with the fabric loss and timeloss involved in such defect removal. The approach taken in this work is to develop systems toautomatically inspect cut parts and only remove those parts from the production process whichare defective. This approach should significantly reduce the fabric loss due to defects and
2
should decrease the number of fabric defects that go through the entire assembly process and
result in garment seconds.
Il. THE COST OF FABRIC DEFECTS
Research efforts in the apparel quality area would benefit greatly from a more detaileddata base on defects at various stages of manufacture and the economic impact of defectdetection and removal at these various stages. Most of the data on apparel defects that have beenpublished report only defects in finished garments. This information is useful but it does notaccount for the many inspection steps during textile and apparel production and the difficultiesand costs of removal of defects at many points in the production process. At the present time, itis difficult to evaluate the total economic impact of new defect detection technologies due to theabsence of good baseline cost data for existing procedures for defect detection and removal.
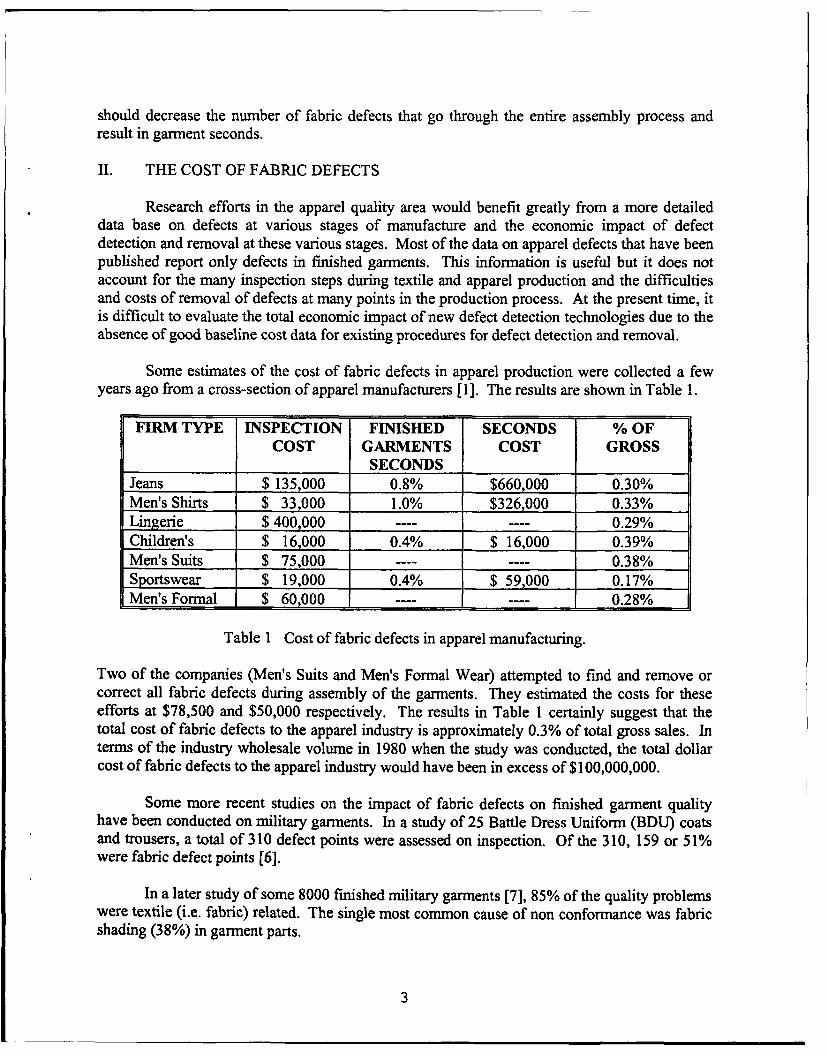
Some estimates of the cost of fabric defects in apparel production were collected a fewyears ago from a cross-section of apparel manufacturers [1]. The results are shown in Table 1.
FIRM TYPE INSPECTION FINISHED SECONDS % OFCOST GARMENTS COST GROSS
SECONDSJeans $135,000 0.8% $660,000 0.30%Men's Shirts $ 33,000 1.0% $326,000 0.33%Lingerie $ 400,000 ---- ---- 0.29%Children's $ 16,000 0.4% $ 16,000 0.39%Men's Suits $ 75,000 ....---- 0.38%
Sportswear $ 19,000 0.4% $ 59,000 0.17%Men's Formal $ 60,000 ........ 0.28%
Table 1 Cost of fabric defects in apparel manufacturing.
Two of the companies (Men's Suits and Men's Formal Wear) attempted to find and remove orcorrect all fabric defects during assembly of the garments. They estimated the costs for theseefforts at $78,500 and $50,000 respectively. The results in Table 1 certainly suggest that thetotal cost of fabric defects to the apparel industry is approximately 0.3% of total gross sales. Interms of the industry wholesale volume in 1980 when the study was conducted, the total dollarcost of fabric defects to the apparel industry would have been in excess of $100,000,000.
Some more recent studies on the impact of fabric defects on finished garment qualityhave been conducted on military garments. In a study of 25 Battle Dress Uniform (BDU) coatsand trousers, a total of 310 defect points were assessed on inspection. Of the 310, 159 or 51%
were fabric defect points [6].
In a later study of some 8000 finished military garments [7], 85% of the quality problemswere textile (i.e. fabric) related. The single most common cause of non conformance was fabricshading (38%) in garment parts.
3
The Apparel Research Committee in conjunction with the Apparel Quality Committee ofthe American Apparel Manufacturers Association recently undertook a survey of apparelmanufacturers to identify the most common and the most damaging defects in finished garments[8]. Visual defects in fabric were by far both the most common and the most damaging of thedefects listed. Shading was number 4 on the list of most damaging defects and number 7 on thelist of most common defects.
As part of the current research program, a survey of defects in finished garments for aperiod of one year in 20 plants manufacturing approximately 20 million pair of denim jeans wasobtained. The data show that 1.15% of all finished garments were classified as irregulars due tofabric defects.
One of the more common approaches to elimination of fabric defects in finished apparelrelies on detection and removal of defects during spreading of the fabric for cutting. In manycases the fabric will have been inspected by the fabric manufacturer and the defects marked insome manner. The defect markers are detected either automatically or by the spreader operatorand the defects removed. In other cases the spreader operator will inspect the fabric as it isbeing spread and remove any defects he finds. This method of defect elimination results in lossof significant fabric for each defect as the ply can only be cut at specific locations to prevent thecut from crossing one of the garment parts. One study has been reported in the United Kingdomon the cost of fabric defect removal in spreading [5]. This study found that in a large apparelplant, an average of 1,575 fabric flaws were detected per day and that three-quarters of a yard offabric was lost for each defect removed in the spreading operation. It further suggested that thetime required for removing defects was a substantial contribution to the overall spreading time.
As part of the current project, similar data have been collected on the losses due toremoval of fabric defects in spreading of denim for jeans manufacture. In this study involvingspreading of over 7000 yards of fabric, 86 defects were removed with a total loss of 98.8 yardsof fabric. This represents a loss of 1.1 yards per defect or 1.4 % of the total yardage beingspread. The actual time loss due to cutting and removal of defects was over 35 minutes or 5.8%of the total time required to spread the fabric (the actual time credited to the spreader for defectcutting was 14.2%). It was also apparent in observing this operation that not all marked defectswere detected and removed by the spreader. Thus, significant losses in time, material, andseconds are being experienced by the companies in the apparel industry using this approach tofabric defect removal.
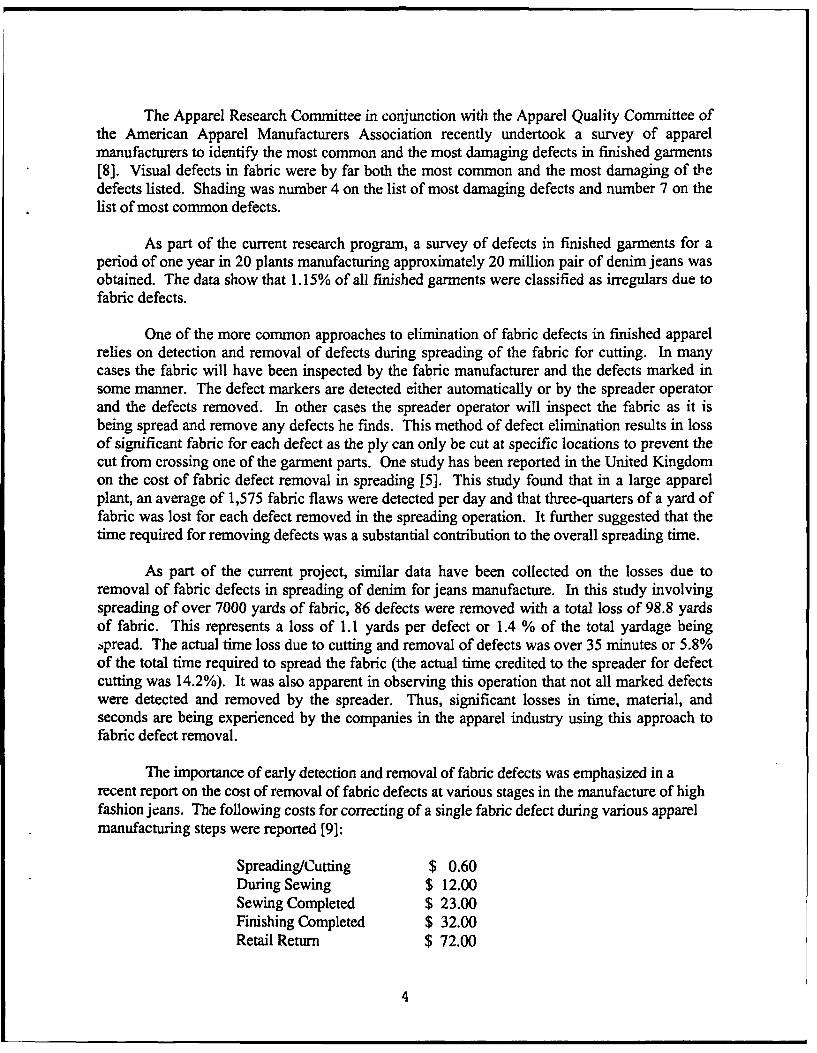
The importance of early detection and removal of fabric defects was emphasized in arecent report on the cost of removal of fabric defects at various stages in the manufacture of highfashion jeans. The following costs for correcting of a single fabric defect during various apparelmanufacturing steps were reported [9]:
Spreading/Cutting $ 0.60During Sewing $ 12.00Sewing Completed $ 23.00Finishing Completed $ 32.00Retail Return $ 72.00
4
This study clearly demonstrates the economic importance of detection and removal of fabricdefects prior to the beginning of the sewing operations.
The existing data clearly indicate that roughly 1% of all manufactured apparel must beclassified as off-quality due to fabric defects. This level seems to persist over at least the lastdecade despite improvements in fabric manufacturing, extensive inspection of fabric rolls,emphasis on quality assurance programs and intensive efforts to find and eliminate fabric defectsin the garment manufacturing process. The available data strongly suggest that defects in fabricare a major and very costly problem in apparel manufacturing and that new techniques andprocedures are clearly needed to address this problem.
III. AN AUTOMATIC DEFECT DETECTION SYSTEM
Since fabric is produced and handled in continuous rolls prior to the cutting operation,the only action on defects than can be taken before cutting is to mark defects. Removad must bepostponed to the spreading operation or later since removal of defects from continuous rollseither requires seaming (an additional defect) or production of smaller rolls which greatlyreduces the efficiency of fabric spreading and utilization. The losses that can be expected byremoval of defects in spreading have been detailed above.
The current work is based on the assumption that the ideal solution for the problem ofeliminating fabric defects would be the removal of cut parts that contain defects immediatelyafter the cutting operation. Suclh an approach should significantly reduce the fabric loss due todefect removal since only those parts that contain defects that will be visible in finishedgarments need be removed. Defects that happen to fall in waste areas of the marker or that occurin nonvisible parts of the garment would not require removal. Instead of losing over one yard offull width fabric per defect when defects are removed before cutting, only the actual fabric in thedefective part would be lost.
Some apparel plants practice manual inspection of cut parts and removal of partscontaining defects as a method of coping with the fabric defect problem. A limited observationon the effectiveness of this technique suggests that it is quite effective in elimination of fabricdefects in finished apparel [1]. Of course manual inspection of cut parts is very labor intensiveand costly. However, the very significant advances hi, and cost reduction of, machine visionsystems in the recent past suggested that the cut part inspection and removal of fabric defectscould be automated.
A fabric defect detection workstation was designed, therefore, for automatic inspectionof cut parts. The workstation consists of five components--a pick and place device to selectparts from a stack and place them individually on a conveyor belt, a conveyer belt transportsystem to move parts to the various inspection stations, a machine vision system (including bothline and area camera systems) to inspect parts for fabric defects, a non contact colormeasurement system to precisely measure the color of each part, and a take-off device that willreject defective parts and place acceptable parts in a configuration suitable for input to anautomated sewing workstation. The system will be under the overall control of a microcomputerfor integration of the operation of the various components in the system and for analysis of the
5
collected data to permit decisions regarding the acceptability of each part. The system can alsocalculate the area and perimeter of each part tv determine if the part has been properly cut.Thus, the workstation should insure that only defect free, color matched, and properly cut partswill enter the assembly operations with the parts already configured to feed an automated sewingworkstation.
Denim fabric used for manufacture of Navy Men's Utility Trousers was selected fordemonstration of the cut part inspection system. The manufacturing process for this product istypical of the very large segment of the apparel industry involved in production of denimgarments. The Navy trouser has eleven parts (left and right front and back leg panels, 4 patchpockets, left and right fly, waistband). The prototype workstation was designed to inspect theleg panels and the pockets. The design objectives were an inspection time of 4 seconds for a legpanel and I second for a pocket (approximately 20 seconds inspection time per garment) with apositive detection of over 50% of the most common defects found in denim fabric. The goal ofthe inspection workstation was a minimum of a 50% reduction in seconds in finished garmentsdue to fabric defects and shading problems. It was felt that such a workstation woald make avery attractive contribution to reduction of costs due to fabric defects in finished garments.
Equipment selected for initial study and evaluation and possible inclusion in the proof-of-concept model of the workstation is shown in Table 2.
Part Pick-and-Place Jet SewMachine Vision Unit IRI SVP Area Camera
Digital Design Line CameraColor Measurement Hunter SpectraProbeConveyor System In-house DesignTake-off Unit In-house Design
Table 2 Cut part inspection unit components.
A primary consideration in equipment selection was the time constraints imposed for the partinspection. For example, the Hunter SpectraProbe was the only non contact color measuringinstrument capable of a complete color measurement in less than I second.
IV. DEFECTS SELECTED FOR STUDY
It has been reported that approximately seventy differer+ flaws have been identified indenim fabric [10]. Fortunately, many of these defects are very uncommon. To achieve someidea of the number and frequency of defects that currently appear in denim, approximately 7000yards of denim were inspected and some 100 defects were removed for study. Fifty-four ofthese were identified by comparison with defects catalogued in the Manual of Standard FabricDefects in the Textile Industry [11] or by experts in the analysis of fabric defects (many of thedefects common to more recent shuttleless weaving machines are not iLted in the Manual). Thefifty-four defects are listed in Appendix A.
6
As indicated in Appendix A, the fifty-four defects were of 14 types with five defectsaccounting for 65% of the observed flaws. These 14 defect types served as the test set of defectsf )r development of machine vision system-.
V. AUTOMATIC DEFECT DETECTION
A. Lighting and Optics Design
In designing any machine vision solution, two areas of great importance are those oflighting and optics. Attention to these aspects of a design can sometimes mean the differencebetween success and failure. It was decided therefore to do a preliminary study of theseparameters to determine the lighting and optical configuration most suitable for application tofabric defect detection.
In acquiring a camera image the properties of various parts of the system interact todetermine the final quality of the image. Some of these characteristics include the light source,the properties of the material being illuminated, as well as the properties of the -ensors in thecameras. To determine the overall effect of these interactions, experiments were conductedusing different light sources and configurations. The aim of the experiments was to find theoptimum configuration(s) for conducting automated inspection.
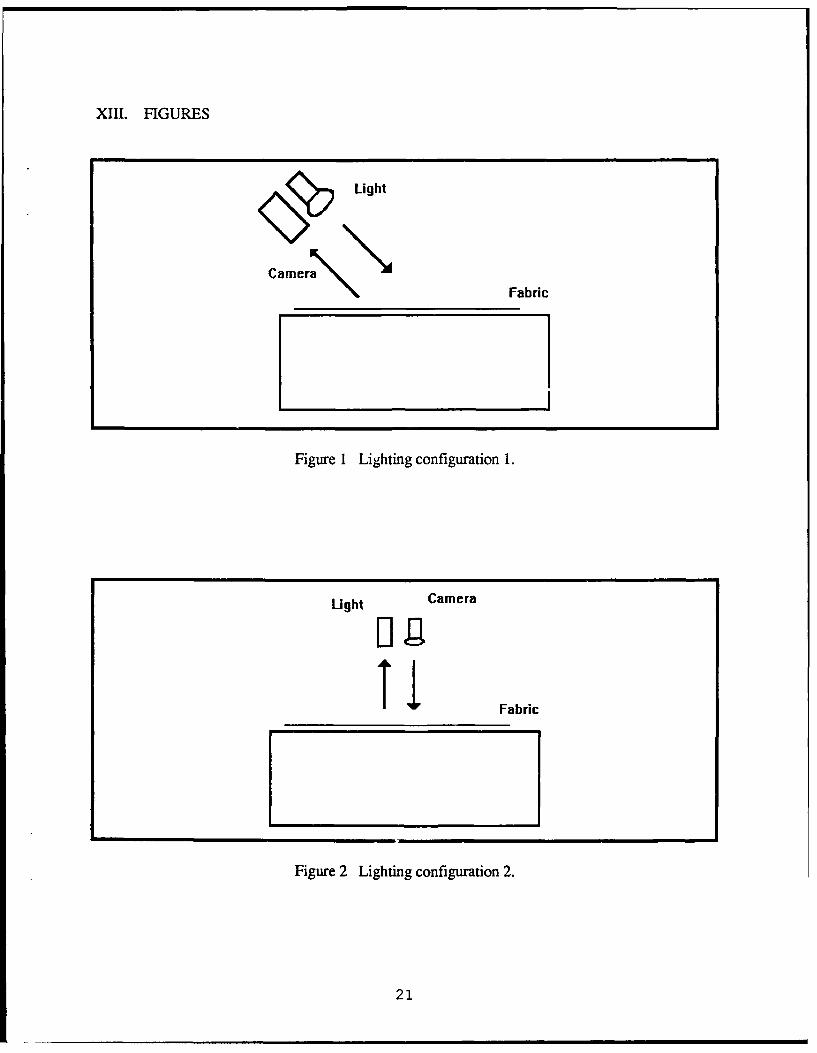
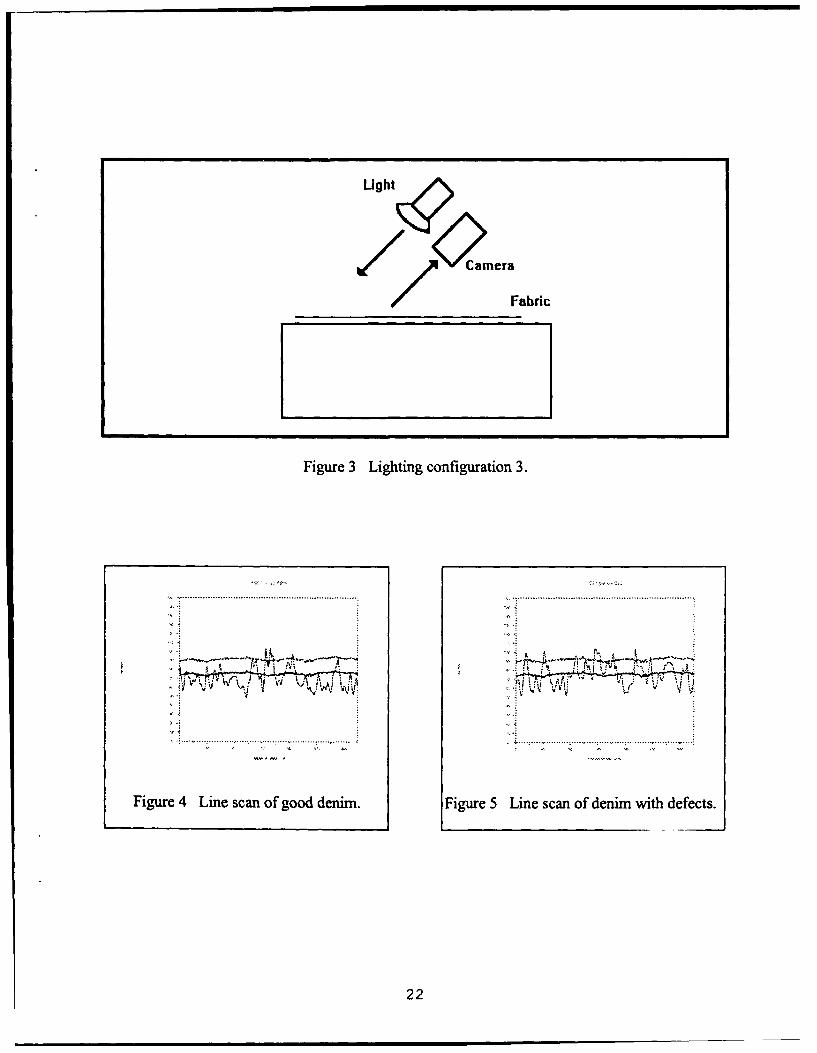
For the tests, the orientations illustrated in Figures 1, 2 and 3 were used. These schemesare in general called direct lighting configurations and the aim is to identify any directionalproperty of the material that could be utilized to enhance the contrast between acceptable anddefective portions of the material. Different light sources were also used to span the wavelengthrange from the ultraviolet to the infrared (this includes the visible spectrum).
The tests were carried out by making reflectance measurements in tihe orientations shownin Figures 1, 2 and 3, using five different light sources (incandescent, fluorescent, halogen,orange halogen, ultraviolet). This was done using a spectroradiometer. A white Teflon blockwas used as a reference standard and its reflectance was taken as the 100% reflectance in each ofthe experimental orientations with the different light sources. The reflectance of normal denimand of denim exhibiting 3 different types of defects with a range of visual reflectance properties(accumulator defects, dye streaks, oil spots) were obtained relative to the Teflon blockreflectance. The relative reflectance intensity differences between acceptable and defectivesegments of the material were then tabulated with each of the five light sources in each of thethree configurations. In addition, regions in the electromagnetic sp,%ctrum that showednoticeable contrast were also noted.
These data were tabulated and an ANOVA procedure used to aid in the analysis. Thedata indicate that orientation is a significant factor in determining contrast differences with theorientation shown in Figure 1 being the most significant. As would also be expected the type ofdefect being examined has a significant effect on the contrast differences.
7
Later work with the configuration shown in Figure 1 on a larger selection of defectsrevealed that this configuration yielded very large differences in reflectance with defects in thewarp and fill directions. The geometrical arrangement that was ultimately selected employedillumination of the sample with two light suarces impinging on the fabric at 45 degree angles ina plane along the long axis of the conveyor belt with observation by the camera at 0 degrees(perpendicular to the fabric). This optical arrangement was used in all additional studies andwas employed in the proof-of-concept workstation.
The incandescent and halogen light sources produced the greatest contrasts betweennormal and defective fabric in the designed experiment. Two Newport Model MP-1000 lampsin the configuration described above were therefore selected for all later experiments with themachine vision system.
B. Development of Machine Vision Systems
From a machine vision viewpoint the defects present in denim can be placed into twobroad classes. These would be defects that show up as contrast differences and defects thatmaterialize as changes in a regular pattern. Methods for defect detection were examined usingboth the area and line cameras. Area cameras are cameras whose sensor elements are arrangedin a matrix while line cameras are cameras whose sensor elements are arranged linearly.
1. Area Scan System Results
There are two fairly effective methods for use in detecting defects in denim materialinvolving the use of an area vision system and some form of uniform lighting. There arehowever several drawbacks with each of these methods. What follows is a brief description ofwhat was found to be helpful and some of the problems encountered in the pursuit of a denimdetection system with an area vision system.
The two methods, to be called Dyadic Analysis and Subtractive Analysis for theduration of this report, involve performing a dyadic operation on a grayscale image and theSubtractive Analysis involved subtracting a grayscale image from an average image of what isconsidered to be good denim respectively. Each is outlined in some detail below.
The Dyadic Analysis involves acquiring a full grayscale image of the area to beinspected, "running" this image through a series of convolutions to "smooth" the image out andthen performing a dyadic operation on the image. During the dyadic operation every pixel thatis not within a predetermined intensity band is considered to be a defective area and thereforehighlighted. All other areas, ones whose intensities fall within this predetermined band, areconsidered to be part of normal denim material and made dark. At present the cutoff band isconsidered to be the average grayscale of a good piece of denim minus twice the standarddeviation and the average plus twice the standard deviation. This band has proven to highlight amajority of the supplied defects and has therefore not been changed.
8
The Subtractive Analysis technique involves subtracting a grayscale image from anaverage image of what is considered to be good fabric. The result of this image is then runthrough a binarization process where any pixel above a set grayscale is considered to be a defect.This threshold was found by examining several histograms of defective as well as good fabricand determining a point at which all good denim disappears and defective denim remains. Thismethod has done well in finding all defects that cause light spots in the denim material.
In viewing the histograms of denim samples that were subtracted from an average imageof what was considered to be good denim, an optimum resolution of 42 pixels per inch wasfound. At this resolution there is a noticeable separation between good fabric samples and badfabric sampies and samples having any histogram data above the middle light intensity (128) areconsidered to be bad denim. Optimum resolution was determined using a simple version ofSubtractive Analysis because this method is largely dependent on the resolution of the grayscaleimage.
This number was found by viewing histograms of what is considered to be good denimand a few samples of bad denim at various resolutions and attempting to determine a thresholdpoint above which only bad denim shows data. The above mentioned optimum resolution of 42pixels per inch was the point at which this separation is most evident.
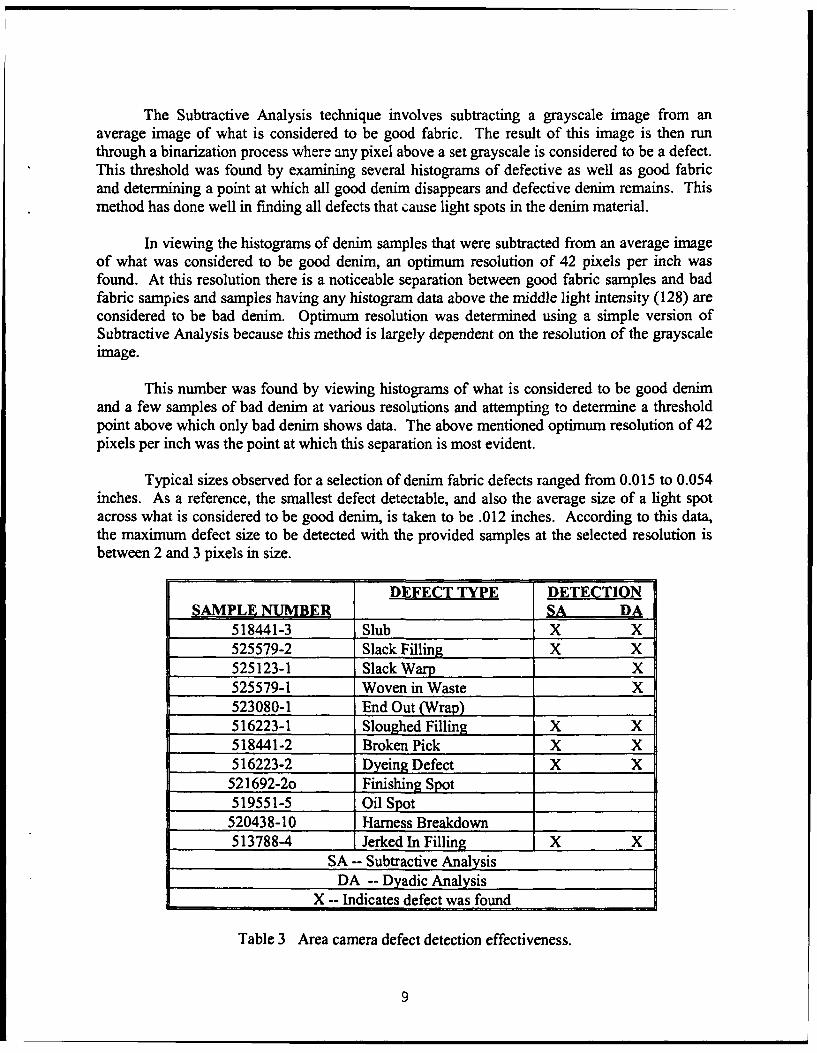
Typical sizes observed for a selection of denim fabric defects ranged from 0.015 to 0.054inches. As a reference, the smallest defect detectable, and also the average size of a light spotacross what is considered to be good denim, is taken to be .012 inches. According to this data,the maximum defect size to be detected with the provided samples at the selected resolution isbetween 2 and 3 pixels in size.
DEFECT TYPE DETECTIONSAMPLE NUMBER _SA DA
518441-3 Slub X X525579-2 Slack Filling X X525123-1 Slack Warp X525579-1 Woven in Waste X523080-1 End Out (Wrap)516223-1 Sloughed Filling X X518441-2 Broken Pick X X516223-2 Dyeing Defect X X
521692-2o Finishing Spot519551-5 Oil Spot520438-10 Harness Breakdown513788-4 Jerked In Filling X X
SA -- Subtractive AnalysisDA -- Dyadic Analysis
X -- Indicates defect was found
Table 3 Area camera defect detection effectiveness.
9
When tested with a group of denim fabrics that contained one example of each type ofdefect, it was found that for the defects that caused light areas, the Dyadic Analysis methodproved to be more effective than the Subtractive Analysis. According to the results shown inTable 3, the Dyadic Analysis method found 62% of the defects examined and the SubtractiveAnalysis found 46% of the defects. Both methods, however, proved to be useless for defectsthat caused dark spots on the fabric. The Subtractive Analysis method tends to make the darkarea the same color as what is considered to be good denim and the dark defective areas fallwithin the preset band of the Dyadic Analysis method. With all the defects in the test group,both methods found the reported light defects each time the test was run.
2. Line Scan System Results
A major technique employed in detection of defects using a line scan camera isthresholding. In thresholding, a simple upper and lower intensity threshold pair are used todetect significant transitions in intensity outside of the allowable bounds. The optimumthreshold levels for denim were determined by studying normal fabric samples and determiningtheir intensity variations. The thresholds were then set just above and below the upper and lowerbounds. However, the rate of defect detection afforded by this method was not satisfactory dueto its inability to differentiate between several defects and normal fabric. It became apparentthat a higher contrast between warp and fill should be attempted and some type of patternrecognition should be implemented.
The first requirement was satisfied with the use of a narrow bandpass filter centered at a600 manometer wavelength. The second requirement was dealt with by developing a newmethod of defect detection utilizing a combination of different tests in combination with twothresholds positioned above the average image. In addition to calculating potential intensityvariations in normal fabric, observations had to be made relative to the size and shape of eachdefect type to be analyzed. Characteristics such as average defect intensity must also be takeninto account. Once these determinations have been made and the thresholds set, the lowerthreshold is used to detect increased activity in a specified frequency range, while the upperthreshold keeps track of peaks in intensity. The information gathered on the size and shape ofeach defect type was incorporated into the new defect detection program algorithms and used inconjunction with the thresholds to determine defect occurrences. An average intensity fornormal fabric was also measured, and compared against test fabric to identify certain defects.
The method used to determine the upper and lower threshold settings is not yet an exactone, and relies on a trial-and-error method to determine the optimum settings. Keeping in mindthe fact that it is required to locate ranges of intensities where a maximum of change betweennormal and defective material is occurring, several samples of normal and defective material areobserved, and each threshold is set to identify an area of maximum change. Currently, the lowerthreshold is set at seven intensity levels above the reference image and the upper threshold is setat 23 intensity levels above the reference image.
To illustrate the implementation of the previously described algorithm, Figures 4 and 5show representations of normal and defective fabric line scans, respectively. In the case of thedefect pictured in Figure 5, all points above the upper threshold are counted from left to right.
10
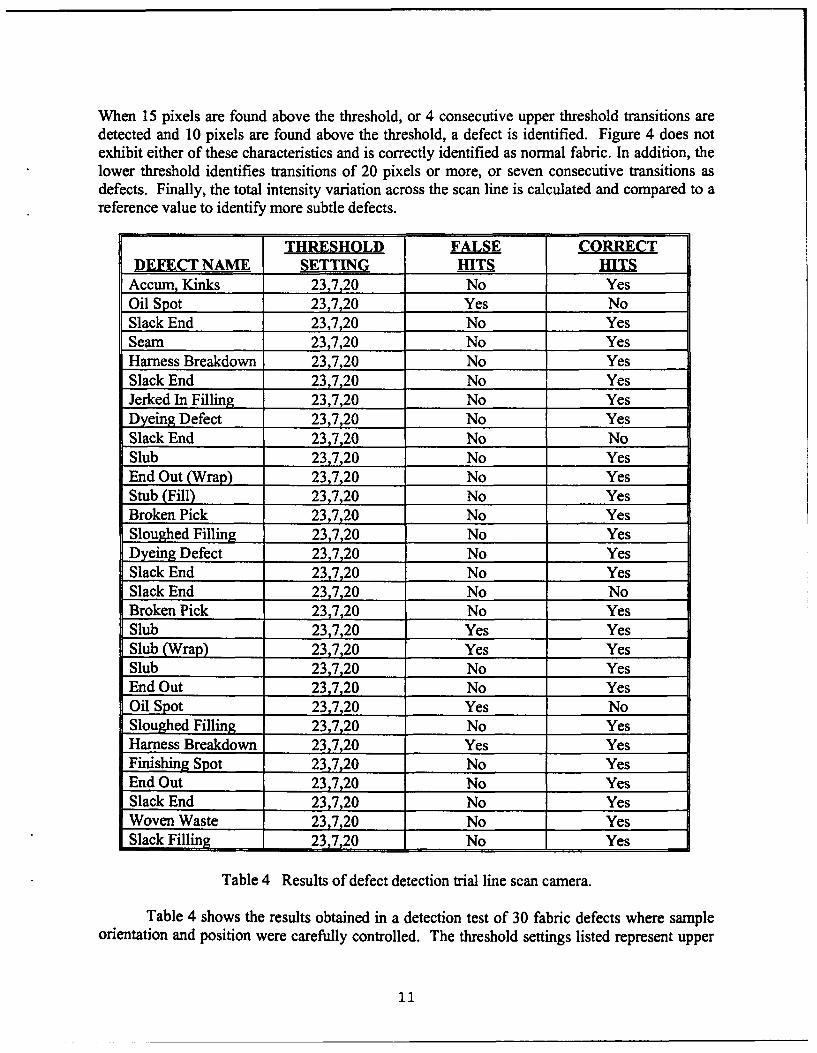
When 15 pixels are found above the threshold, or 4 consecutive upper threshold transitions aredetected and 10 pixels are found above the threshold, a defect is identified. Figure 4 does notexhibit either of these characteristics and is correctly identified as normal fabric. In addition, thelower threshold identifies transitions of 20 pixels or more, or seven consecutive transitions asdefects. Finally, the total intensity variation across the scan line is calculated and compared to areference value to identify more subtle defects.
THRESHOLD FALSE CORRECTDEFECT NAME SETTING HITS HITS
Accum, Kinks 23,7,20 No YesOil Spot 23,7,20 Yes NoSlack End 23,7,20 No YesSeam 23,7,20 No YesHarness Breakdown 23,7,20 No YesSlack End 23,7,20 No YesJerked In Filling 23,7,20 No YesDyeing Defect 23,7,20 No YesSlack End 23,7,20 No NoSlub 23,7,20 No YesEnd Out (Wrap) 23,7,20 No YesStub (Fill) 23,7,20 No YesBroken Pick 23,7,20 No YesSloughed Filling 23,7,20 No YesDyeing Defect 23,7,20 No YesSlack End 23,7,20 No YesSlack End 23,7,20 No NoBroken Pick 23,7,20 No YesSlub 23,7,20 Yes YesSlub (Wrap) 23,7,20 Yes YesSlub 23,7,20 No YesEnd Out 23,7,20 No YesOil Spot 23,7,20 Yes NoSloughed Filling 23,7,20 No YesHarness Breakdown 23,7,20 Yes YesFinishing Spot 23,7,20 No YesEnd Out 23,7,20 No YesSlack End 23,7,20 No YesWoven Waste 23,7,20 No YesSlack Filling 23,7,20 No Yes
Table 4 Results of defect detection trial line scan camera.
Table 4 shows the results obtained in a detection test of 30 fabric defects where sampleorientation and position were carefully controlled. The threshold settings listed represent upper
11
threshold offset from average image, lower threshold offset, and required defect width. Thethreshold offset numbers are given in terms of intensity levels where the maximum level is 256,and the defect width is given in pixel widths.
Orientation can play a role when the defect in question is directed along a particular axis,such as the Sloughed Filling or Slack End defects. Because the line scan system is effectivelyone-dimensional, these defects may appear in certain orientations to be nothing more thannormal fabric. Presently, each defect must be aligned to closely coincide with the orientation ofthe scan line in order to provide reliable detection. To overcome this limitation, a two-dimensional picture may need to be constructed by storing several successive line scans forperiodic analysis or buffers might be maintained on several potential defects as each individualline is scanned.
The difference in average intensity does not vary significantly from one sample toanother, but a few samples differ greatly from the norm and even the small differences betweenthe majority of samples can pose a problem. All image analysis techniques require a defect-freereference image from which to set constraints, and consistency in overall intensity of anymaterial being analyzed is crucial to the success of these techniques. It is assumed, however,that individual pieces put together into a single garment will be from the same roll number andsufficiently close in average gray-level intensity. Each piece can then be analyzed with the samethreshold settings, except some of the more "noisy" ones, whose intensity levels tend to varywidely, even within the same sample. A low-pass filter may be required to adequately analyzethese samples.
C. Other Techniques
Other possible techniques for defect detection were evaluated to determine theireffectiveness for fabric defect detection. These included: texture, frequency spectrum analysis,and morphological filtering. The results of these investigations are described below.
1. Texture
The spatial gray level detection method [12] was chosen as a method of automatic texturediscrimination. It works by finding the probability of going from any gray level to any othergray level in each of four directions, 0, 45, 90, and 135 degrees from the horizontal. A matrix isconstructed for each direction using a normal sample of fabric and repeated for each defectivesample being tested. Five texture feature formulas (energy, entropy, correlation, localhomogeneity, and inertia) are calculated using the matrices and comparing normal and defectivesamples. As an example, three normal 32x32 pixel samples were analyzed along with onedefective 32x32 sample. The resulting calculations showed no definite contrast between normaland defective samples, due to the fact that the formulas are designed for macroscopicdifferentiation rather than pixel-level detection as was the case here.
2. Frequency Spectrum
Frequency Spectrum Analysis was also studied. The Fast Fourier Transform (FFT) was
12
investigated as a method of defect detection because of the characteristic periodicity of warp andfill used in the material being analyzed. It was thought that defects might show up well in aparticular frequency range relating to this periodicity. With a few exceptions, however, this didnot prove to be the case. There is no significant difference between the normal samples andmost defective samples. This may have been due to insufficient resolution or lack of defectpresence across the scan line. As a further attempt to establish a link between frequency dataand defects, a sample of each half and each quarter scan line of the Endout, Harness Breakdown,and Slub defects were collected and compared against similar sections of normal material. It wasthought that if a defect was more pronounced in a particular section of the scan line, it would bemore effective to take several sections of the scan line and perform separate FFT's on eachsection. While the Slub defect showed up well as a smoothing of lower frequencies in section 1of 2 and 2 of 4, neither the Endout nor Harness Breakdown showed any significant changes.
3. Morphological Techniques
The use of Morphology analysis in machine vision appeared to be well suited to thedetection of a large number of typical defects which might occur in the manufacture of fabric.Mathematical Morphology employs two simple building blocks from which may be built a largenumber of transformational tools; these tools can then be used to manipulate an image of the testsample in a manner that can be dealt with by computer software to compare to a standard,defect-free reference pattern.
The search for a coherent pattern (or lack thereof) in the test material forms the basis forerror detection. To accomplish this, an image of the test material must be probed systematically,using the simplest relations possible. From this systematic probing comes the idea of astructuring element, a small pattern which is superimposed against the image in question at eachpixel position, forming a modified image based on one of two simple operations, erosion anddilation.
Erosion searches for all exact pattern matches of the image with the structuring elementand sets or clears the pixel at the predetermined origin of the structuring element for eachcomparison made. The effect is to "erode" or shrink all objects in the image. Dilation looks forany conjunction of objects with the structuring element, therefore filling any gaps or holes in theobjects.
The application of these simple grayscale morphological techniques proved to beinsufficient. While it is possible that a further study of grayscale morphology may yield positiveresults, the number of calculations required for more complex operations will be prohibitive andwould undoubtedly require longer times than design constraints on the inspection unit wouldallow.
Thus, the results of the investigation of machine vision detection of defects in denimfabric suggest that the line scan system is more effective that the area camera in detecting avariety of defect types. It appears that the techniques employed in this study with the line scancamera can reliably detect all but two of the defects, oil spots and slack ends, investigated in thiswork. These two accounted for 17% of the 54 defects listed in Appendix A.
13
VI. COLOR MEASUREMENT SYSTEM
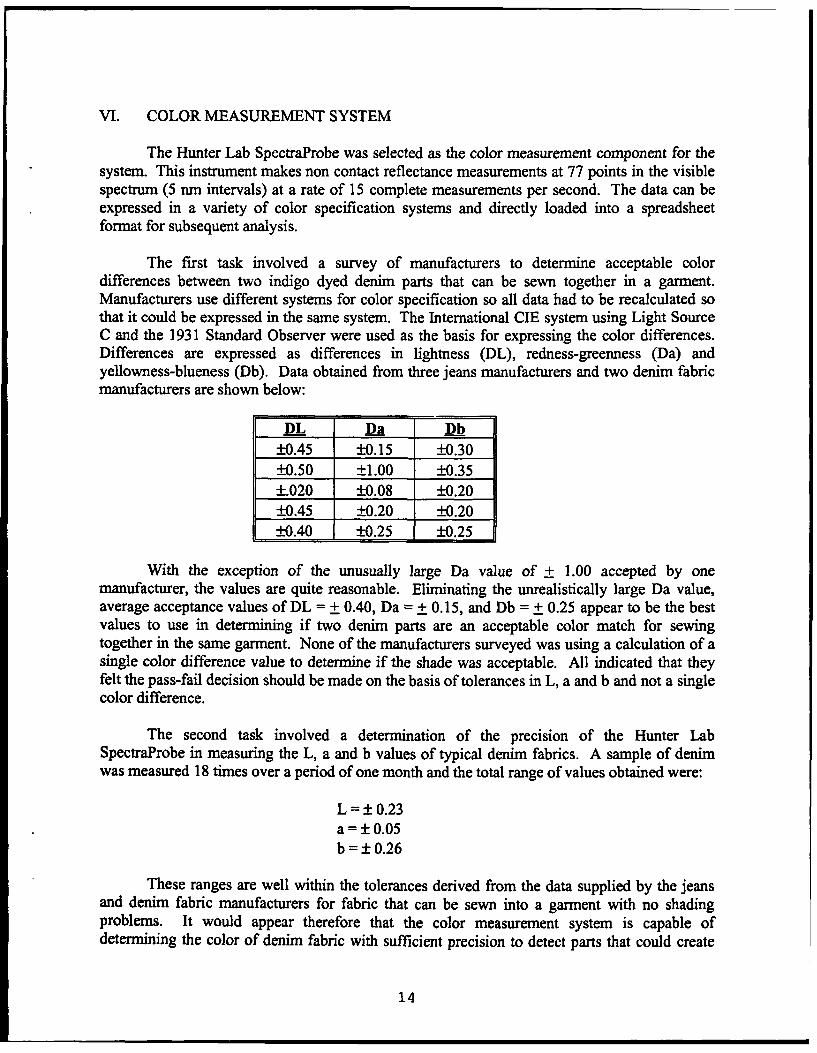
The Hunter Lab SpectraProbe was selected as the color measurement component for thesystem. This instrument makes non contact reflectance measurements at 77 points in the visiblespectrum (5 rn intervals) at a rate of 15 complete measurements per second. The data can beexpressed in a variety of color specification systems and directly loaded into a spreadsheetformat for subsequent analysis.
The first task involved a survey of manufacturers to determine acceptable colordifferences between two indigo dyed denim parts that can be sewn together in a garment.Manufacturers use different systems for color specification so all data had to be recalculated sothat it could be expressed in the same system. The International CIE system using Light SourceC and the 1931 Standard Observer were used as the basis for expressing the color differences.Differences are expressed as differences in lightness (DL), redness-greenness (Da) andyellowness-blueness (Db). Data obtained from three jeans manufacturers and two denim fabricmanufacturers are shown below:
DL DaD+0.45 ±0.15 ±0.30+0.50 ±1.00 ±0.35±.020 ±0.08 ±0.20
0.45 -+0.20 ±0.200.40 T±0.25 ±0.25
With the exception of the unusually large Da value of + 1.00 accepted by onemanufacturer, the values are quite reasonable. Eliminating the unrealistically large Da value,average acceptance values of DL = + 0.40, Da = + 0.15, and Db = + 0.25 appear to be the bestvalues to use in determining if two denim parts are an acceptable color match for sewingtogether in the same garment. None of the manufacturers surveyed was using a calculation of asingle color difference value to determine if the shade was acceptable. All indicated that theyfelt the pass-fail decision should be made on the basis of tolerances in L, a and b and not a singlecolor difference.
The second task involved a determination of the precision of the Hunter LabSpectraProbe in measuring the L, a and b values of typical denim fabrics. A sample of denimwas measured 18 times over a period of one month and the total range of values obtained were:
L = 0.23a =0.05b = 0.26
These ranges are well within the tolerances derived from the data supplied by the jeansand denim fabric manufacturers for fabric that can be sewn into a garment with no shadingproblems. It would appear therefore that the color measurement system is capable ofdetermining the color of denim fabric with sufficient precision to detect parts that could create
14
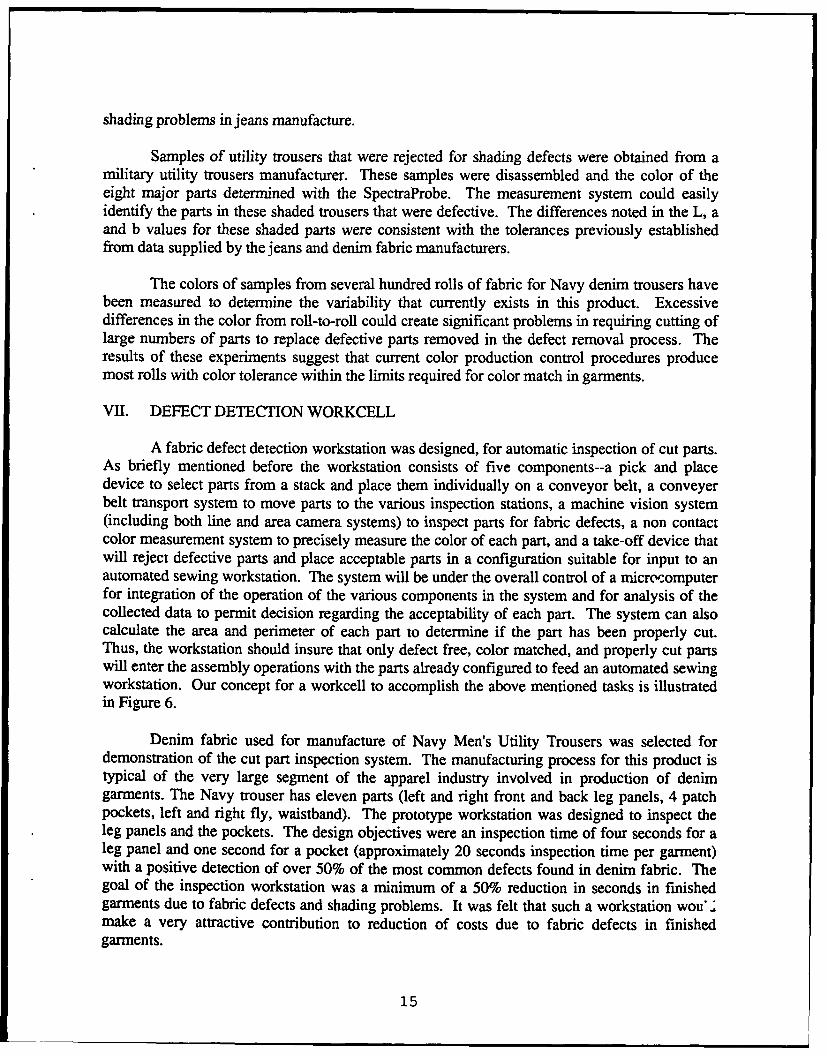
shading problems in jeans manufacture.
Samples of utility trousers that were rejected for shading defects were obtained from amilitary utility trousers manufacturer. These samples were disassembled and the color of theeight major parts determined with the SpectraProbe. The measurement system could easilyidentify the parts in these shaded trousers that were defective. The differences noted in the L, aand b values for these shaded parts were consistent with the tolerances previously establishedfrom data supplied by the jeans and denim fabric manufacturers.
The colors of samples from several hundred rolls of fabric for Navy denim trousers havebeen measured to determine the variability that currently exists in this product. Excessivedifferences in the color from roll-to-roll could create significant problems in requiring cutting oflarge numbers of parts to replace defective parts removed in the defect removal process. Theresults of these experiments suggest that current color production control procedures producemost rolls with color tolerance within the limits required for color match in garments.
VII. DEFECT DETECTION WORKCELL
A fabric defect detection workstation was designed, for automatic inspection of cut parts.As briefly mentioned before the workstation consists of five components--a pick and placedevice to select parts from a stack and place them individually on a conveyor belt, a conveyerbelt transport system to move parts to the various inspection stations, a machine vision system(including both line and area camera systems) to inspect parts for fabric defects, a non contactcolor measurement system to precisely measure the color of each part, and a take-off device thatwill reject defective parts and place acceptable parts in a configuration suitable for input to anautomated sewing workstation. The system will be under the overall control of a micro'zomputerfor integration of the operation of the various components in the system and for analysis of thecollected data to permit decision regarding the acceptability of each part. The system can alsocalculate the area and perimeter of each part to determine if the part has been properly cut.Thus, the workstation should insure that only defect free, color matched, and properly cut partswill enter the assembly operations with the parts already configured to feed an automated sewingworkstation. Our concept for a workcell to accomplish the above mentioned tasks is illustratedin Figure 6.
Denim fabric used for manufacture of Navy Men's Utility Trousers was selected fordemonstration of the cut part inspection system. The manufacturing process for this product istypical of the very large segment of the apparel industry involved in production of denimgarments. The Navy trouser has eleven parts (left and right front and back leg panels, 4 patchpockets, left and right fly, waistband). The prototype workstation was designed to inspect theleg panels and the pockets. The design objectives were an inspection time of four seconds for aleg panel and one second for a pocket (approximately 20 seconds inspection time per garment)with a positive detection of over 50% of the most common defects found in denim fabric. Thegoal of the inspection workstation was a minimum of a 50% reduction in seconds in finishedgarments due to fabric defects and shading problems. It was felt that such a workstation wou .,make a very attractive contribution to reduction of costs due to fabric defects in finishedgarments.
15
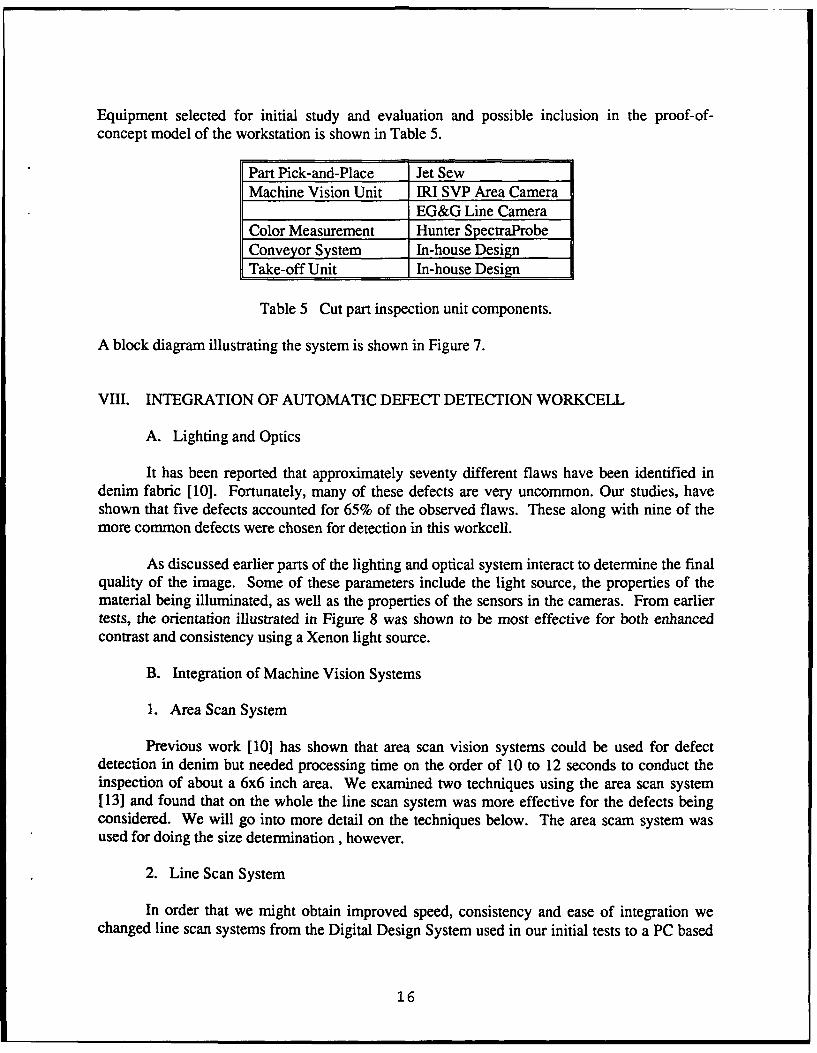
Equipment selected for initial study and evaluation and possible inclusion in the proof-of-concept model of the workstation is shown in Table 5.
Part Pick-and-Place Jet SewMachine Vision Unit IRI SVP Area Camera
EG&G Line CameraColor Measurement Hunter SpectraProbeConveyor System In-house DesignTake-off Unit In-house Design
Table 5 Cut part inspection unit components.
A block diagram illustrating the system is shown in Figure 7.
VIII. INTEGRATION OF AUTOMATIC DEFECT DETECTION WORKCELL
A. Lighting and Optics
It has been reported that approximately seventy different flaws have been identified indenim fabric [10]. Fortunately, many of these defects are very uncommon. Our studies, haveshown that five defects accounted for 65% of the observed flaws. These along with nine of themore common defects were chosen for detection in this workcell.
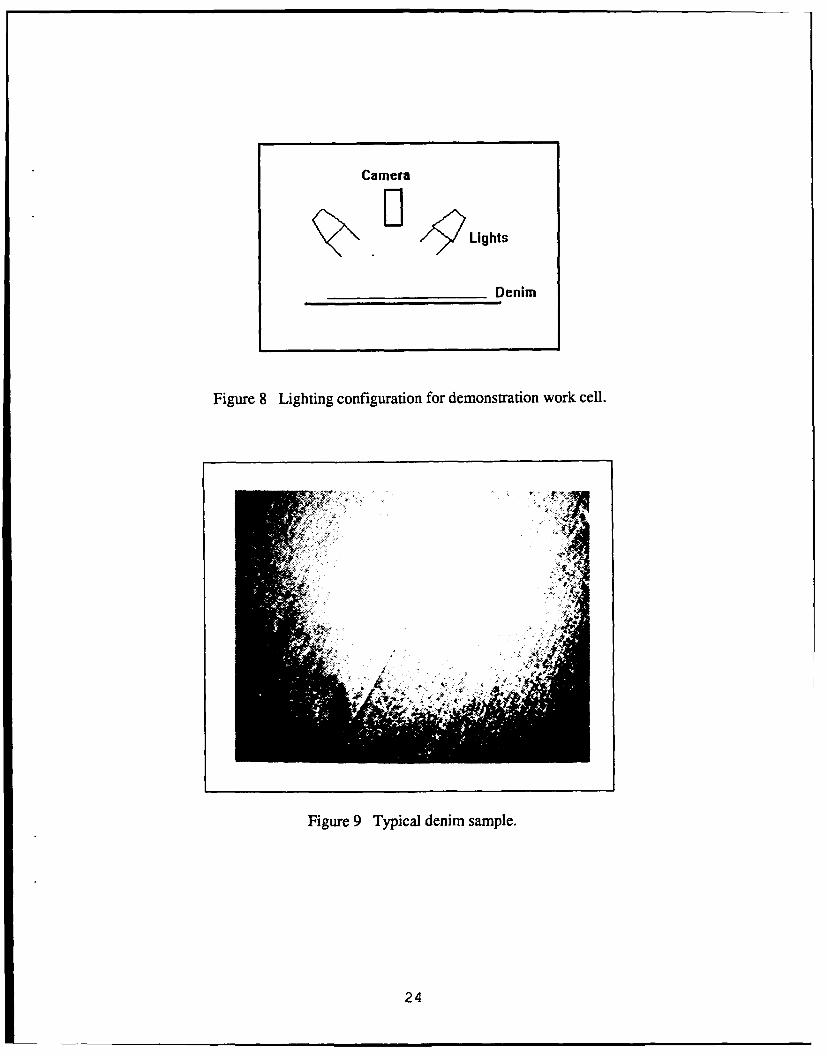
As discussed earlier parts of the lighting and optical system interact to determine the finalquality of the image. Some of these parameters include the light source, the properties of thematerial being illuminated, as well as the properties of the sensors in the cameras. From earliertests, the orientation illustrated in Figure 8 was shown to be most effective for both enhancedcontrast and consistency using a Xenon light source.
B. Integration of Machine Vision Systems
1. Area Scan System
Previous work [10] has shown that area scan vision systems could be used for defectdetection in denim but needed processing time on the order of 10 to 12 seconds to conduct theinspection of about a 6x6 inch area. We examined two techniques using the area scan system[13] and found that on the whole the line scan system was more effective for the defects beingconsidered. We will go into more detail on the techniques below. The area scam system wasused for doing the size determination, however.
2. Line Scan System
In order that we might obtain improved speed, consistency and ease of integration wechanged line scan systems from the Digital Design System used in our initial tests to a PC based
16
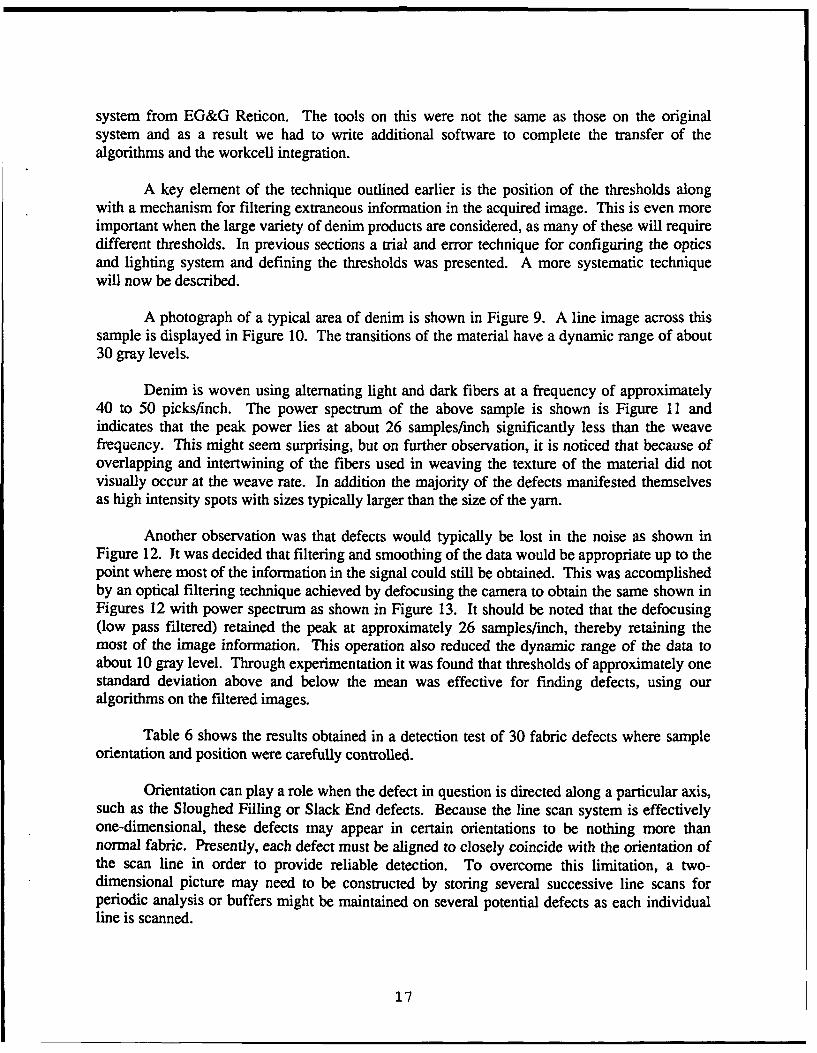
system from EG&G Reticon. The tools on this were not the same as those on the originalsystem and as a result we had to write additional software to complete the transfer of thealgorithms and the workcell integration.
A key element of the technique outlined earlier is the position of the thresholds alongwith a mechanism for filtering extraneous information in the acquired image. This is even moreimportant when the large variety of denim products are considered, as many of these will requiredifferent thresholds. In previous sections a trial and error technique for configuring the opticsand lighting system and defining the thresholds was presented. A more systematic techniquewill now be described.
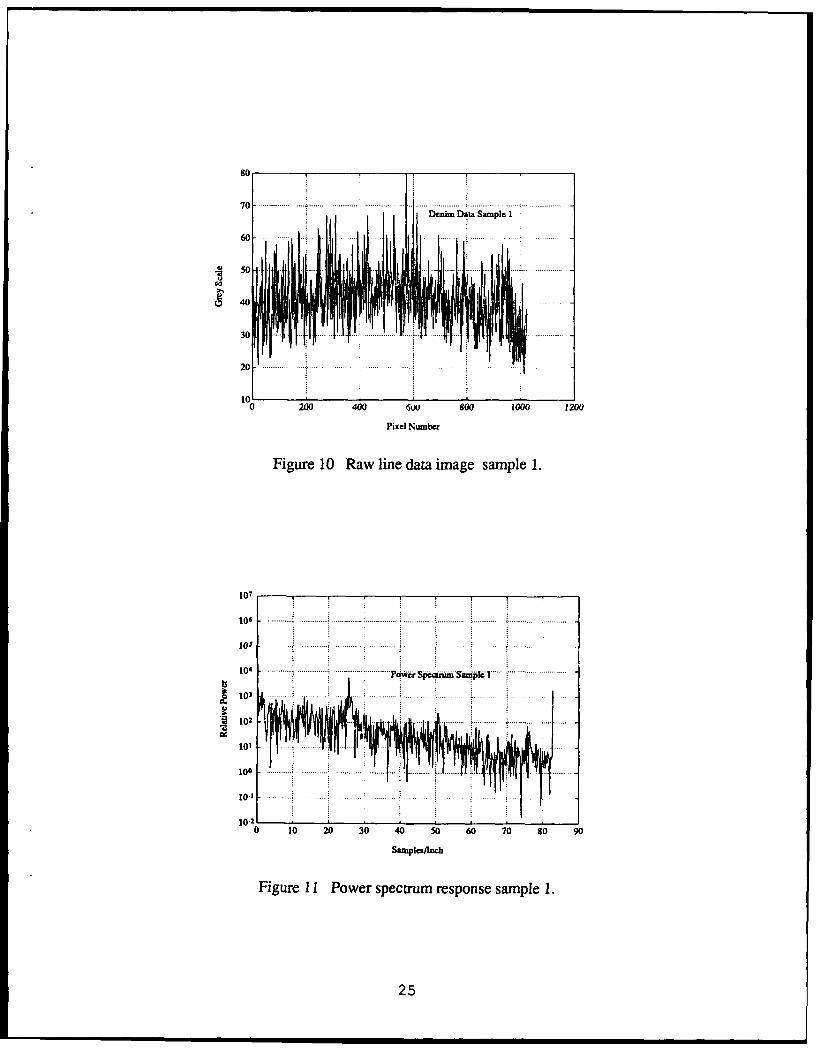
A photograph of a typical area of denim is shown in Figure 9. A line image across thissample is displayed in Figure 10. The transitions of the material have a dynamic range of about30 gray levels.
Denim is woven using alternating light and dark fibers at a frequency of approximately40 to 50 picks/inch. The power spectrum of the above sample is shown is Figure 11 andindicates that the peak power lies at about 26 samples/inch significantly less than the weavefrequency. This might seem surprising, but on further observation, it is noticed that because ofoverlapping and intertwining of the fibers used in weaving the texture of the material did notvisually occur at the weave rate. In addition the majority of the defects manifested themselvesas high intensity spots with sizes typically larger than the size of the yam.
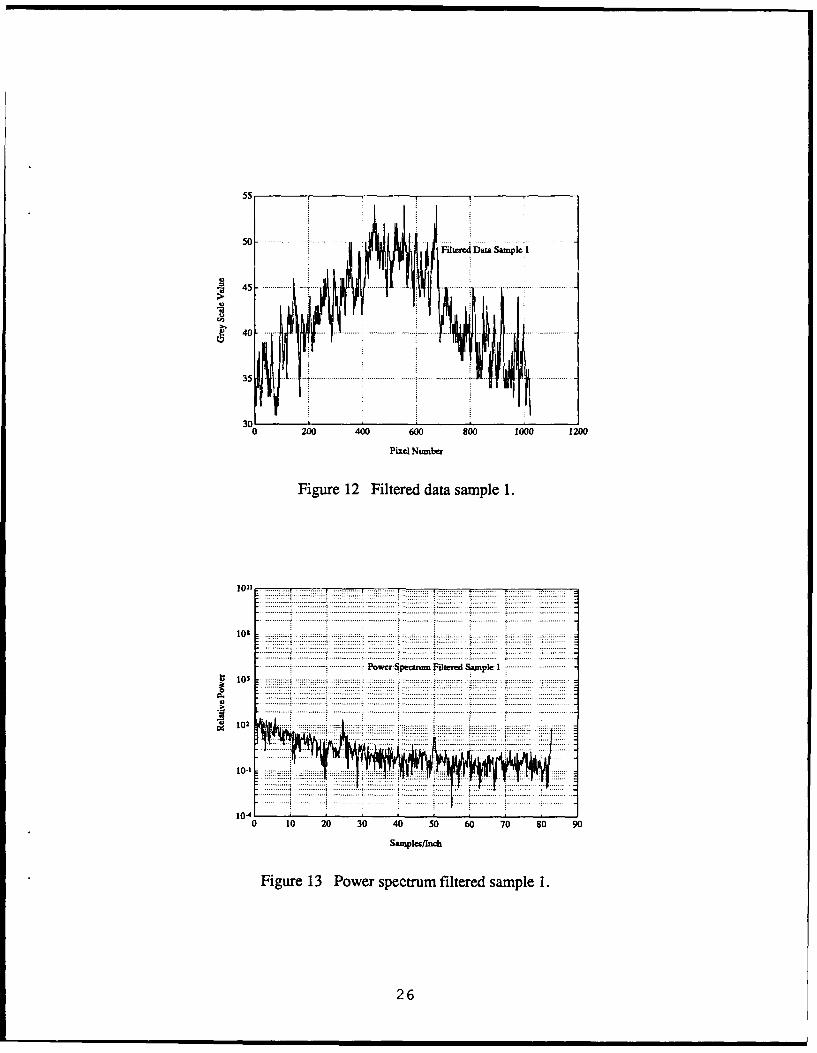
Another observation was that defects would typically be lost in the noise as shown inFigure 12. Jt was decided that filtering and smoothing of the data would be appropriate up to thepoint where most of the information in the signal could still be obtained. This was accomplishedby an optical filtering technique achieved by defocusing the camera to obtain the same shown inFigures 12 with power spectrum as shown in Figure 13. It should be noted that the defocusing(low pass filtered) retained the peak at approximately 26 samples/inch, thereby retaining themost of the image information. This operation also reduced the dynamic range of the data toabout 10 gray level. Through experimentation it was found that thresholds of approximately onestandard deviation above and below the mean was effective for finding defects, using ouralgorithms on the filtered images.
Table 6 shows the results obtained in a detection test of 30 fabric defects where sampleorientation and position were carefully controlled.
Orientation can play a role when the defect in question is directed along a particular axis,such as the Sloughed Filling or Slack End defects. Because the line scan system is effectivelyone-dimensional, these defects may appear in certain orientations to be nothing more thannormal fabric. Presently, each defect must be aligned to closely coincide with the orientation ofthe scan line in order to provide reliable detection. To overcome this limitation, a two-dimensional picture may need to be constructed by storing several successive line scans forperiodic analysis or buffers might be maintained on several potential defects as each individualline is scanned.
17
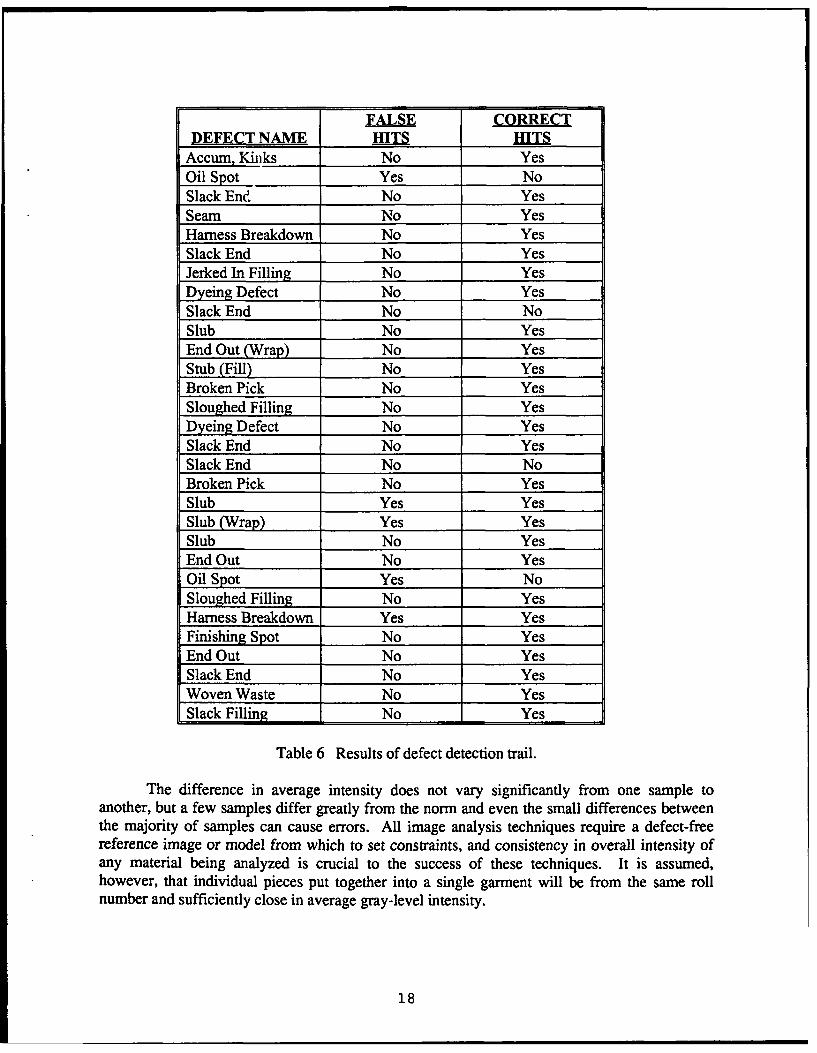
FALSE CORRECTDEFECT NAME ffn HITS
Accum, Kinks No YesOil Spot Yes NoSlack End No YesSeam No YesHarness Breakdown No YesSlack End No YesJerked In Filling No YesDyeing Defect No YesSlack End No NoSlub No YesEnd Out (Wrap) No YesStub (Fill) No YesBroken Pick No YesSloughed Filling No YesDyeing Defect No YesSlack End No YesSlack End No NoBroken Pick No YesSlub Yes YesSlub (Wrap) Yes YesSlub No YesEnd Out No YesOil Spot Yes NoSloughed Filling No YesHarness Breakdown Yes YesFinishing Spot No YesEnd Out No YesSlack End No YesWoven Waste No YesSlack Filling No Yes
Table 6 Results of defect detection trail.
The difference in average intensity does not vary significantly from one sample toanother, but a few samples differ greatly from the norm and even the small differences betweenthe majority of samples can cause errors. All image analysis techniques require a defect-freereference image or model from which to set constraints, and consistency in overall intensity ofany material being analyzed is crucial to the success of these techniques. It is assumed,however, that individual pieces put together into a single garment will be from the same rollnumber and sufficiently close in average gray-level intensity.
18
IX. WORKCELL PERFORMANCE
A proof of concept workcell was built and was demonstrated at the Third AnnualAcademic Apparel Research Conference in Atlanta in April 1992. Pictures of the system and itscomponents are shown in Figures 16 through 19.
In order not to miss a defect that was approximately a pick in size, we were able toachieve an inspection speed of approximately one inch/sec. using a camera resolution of 160samples/inch. Most defects are bigger than one pick and using defects about 2.5 to 3 inches inlength (hand generated) we were able to run the cell at approximately four inches per second.Our desired speed was 12 inches per second, thus, we were able to run at approximately a thirdof the target value.
Part of our speed limitation was due to the fact that we were utilizing a PC based systemfor the line scan camera. Approximately 50% of the inspection time was actually spenttransferring data across the PC bus. In addition the algorithm implementation could be greatlyoptimized in a more flexible processing environment. With these improvements 12inches/second would be achievable. Periodically we also observed some noisy line scans fromthe camera. We suspected this to be due to malfunctioning hardware.
X. RECOMMENDATIONS
The final workcell was 16 feet long by 5 feet at its widest point. This is probably biggerthan could be accommodated easily in most manufacturing facilities considering its function.We believe however, that the system could be integrated to provide the same functionality in amachine the size of the JetSew picker. This would require minuraturizing the color measuringhead and the line scan system and its peripheral devices. The technology to design and assemblethese components exist, and a machine such as this would be quite feasible.
In developing the algorithms we used a material that was fairly uniform as opposed topatterned. We showed that it was possible to see many of the common defects in this type ofmaterial. Other techniques for defect detection on this and other kinds of material should also beinvestigated. Promising technologies include the use of Neural Nets in which the system istrained to recognize good and defective material. Research in the use of this technology isshowing promise in many areas that seemed impossible previously.
XI. SUMMARY
The results of our work indicate that defect detection in denim is possible with availabletechnology. Problem areas include inconsistent image acquisition and lack of processingcapability on some existing boards. The technology for including more capability already existsin other systems and is really a problem of integration. Another consideration is tailoring thealgorithms for different types of denim. One manufacturer, for example, makes 60 differenttypes of denim. The techniques outlined above could also be used to determine thresholds andoptimizing filters.
19
The present work on the important machine vision and color measuremen: componentsof the automatic fabric defect detection system suggest that the existing equipment caneffectively detect the majority of fabric and color flaws that are responsible for defects infinished garments. The proof-of-concept model of the cut part defect detection workstation wasdesigned, built and demonstrated at the Georgia Tech-Southern Tech Apparel ManufacturingTechnology Center in 1992.
XII. REFERENCES
1. Freeston, W. D., Tincher, W. C., Konopasde, M., et al., Opportunities for ProductivityImprovement at the Textile-Apparel Interface, Final Report DOC Grant No. 99-26-098578-10. U.S. Department of Commerce, Washington, D.C., December 1980.
2. Gardner, G. T., et al., The Relations of Piece Goods Defects to Garment Quality,Technical Advisory Committee Report, American Apparel Manufacturers Association,Arlington, VA 1962.
3. Kennedy, S. J., et at., Study to Determine the Relation of Fabric Defects to FabricatedEnd Items, Final Report Quartermaster Research & Engineering Command, U.S. ArmyNatick Laboratories, Natick, MA, May 1062.
4. Weinston, J.J., Study of Fabric Defects in End Items, Memorandum to GovernmentContracts Committee, American Apparel Manufacturers Association, February 1988.
5. Technical Assistance Bulletin, Kuris High Tech Systems, Norcross, GA, August, 1988.6. Anonymous, Inspection of BDU Coats and Trousers with Fabric Defects Memorandum
for Record, U.S. Army Natick Laboratories, Natick, MA, May 1988.7. Kernodle, J.W., The Source of Clothing and Textile Quality Based Problems,
Presentation to the Clothing and Textile Board, Defense Logistic Agency, Alexandria,VA, January 1991.
8. Collier, M. E., Armfield, J. W., et al., Technology for Quality, Report of the ApparelResearch Committee and the Apparel Quality Committee, American ApparelManufacturers Association, Arlington, VA, January 1990.
9. Thigpen, P.L., Cost of Quality: Failure to Prevent a Missed Pick, Presentation at theSAFETALC Meeting, Dallas, TX, December 3, 1990.
10. Emery, N. B., The Inspection of Blue Denim Fabric widi Computer Vis*'n, A ThesisSuhmitted to the Graduate Faculty of North Carolina State University, Raleigh NC, 1990.
11 Manual of Standard Fabric Defects in the Textile Industry, Graniteville Company,Graniteville, SC, 1975.
12. Conners, R. W. and Harlow, C. A., A Theoretical Comparison of Texture Algorithms,IEEE Transactions on Pattern Analysis and Machine Intelligence, Volume PAMI-2,number 3, May 1980, pp. 204-222.
13. Tincher, W. C., Daley, W., Holcombe, W. D., Detection and Removal of Fabric Defectsin Apparel Production, Third Annual Academic Apparel Research ConferenceImplementing Advanced Technology, Atlanta, GA, Februar5 1991.
20
XIII. FIGURES
Light
C a m e r~aF a b ric
Figure 1 Lighting configuration 1.
Light Camera
U Fabric
Figure 2 Lighting configuration 2.
21
Ught•
/Camera
Fabric
Figure 3 Lighting configuration 3.
7 -: ~ ,- .. Vi
S.... " •. AA • ~ ~...........r, • _.•"i. i ,j
Figure 4 Line scan of good denim. Figure 5 Line scan of denim with defects.
22
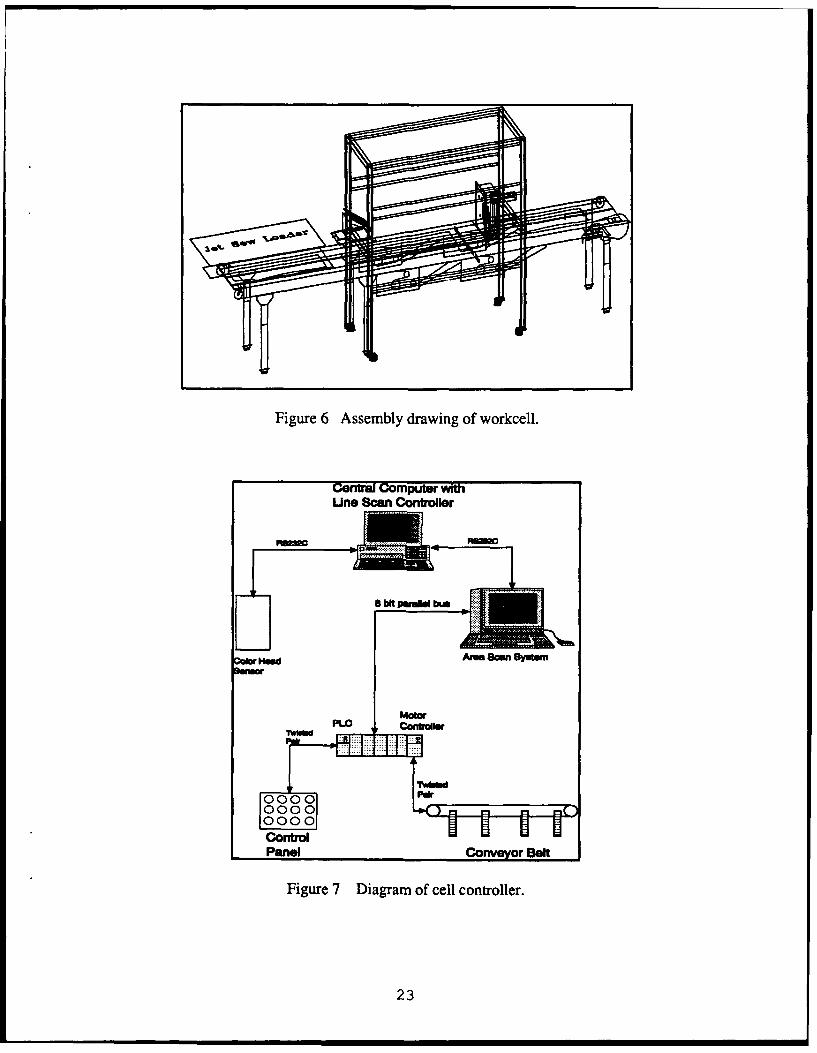
Figure 6 Assembly drawing of workcell.
Central Computer withUno Scan Controller
Fiue7DigaNf elcntolr
23ftPMWb
Camera
19 Lights
Denim
Figure 8 Lighting configuration for demonstration work cell.
Figure 9 Typical denim sample.
24
80
7 0 . ............ .. . ..... .... ....... .... ..... . .......... ............ . .............. .............. ...............
Denim Dita Sample 1
6 0 . ............ ... . . . . .. . . . .
40
30 .........-............ ...................................... i ...............
0 200 400 6U 800 1000 1200
Pixel Number
Figure 10 Raw line data image sample 1.
107
1 0 6 . ............. ... .............. .............. : ................. .............. ................ ............. ,. ..... .. ............. .
10 . . .... I .6.....
10 4 . .............. ................ .. ............................ P , .- s . .... .. .... . .......,• ~~~ ~ ~ .. .o ... ....... ...... i............... .......
103102 . ...e . ..e a ....... .....e...
101
10 o .............. ............... ........................
l o -, .. .. ..i . ..... ..... .. ... ... . ... ... ... ... . .. ... ...... ..10'1
10-21
0 10 20 30 40 so 60 70 80 90
Samples/Inch
Figure I I Power spectrum response sample 1.
25
5! r
Filtere Data Samplei
0 200 40 600 800 1000 1200
Pixel Number
Figure 12 Filtered data sample 1.
10'* ,
108
Po er pCtrum . ltred Sape
U 105
1 0 .. ..... ....... .....
.. ..... .. ..... .. .. ....... ......... . .......0 ...... 10 ....... 20 ...... 30 .... 0... .... 0... .... 0... 70...... ... 0.. 90.......SapesIc
Fig..... e 13....... Pow er..... sp ctu filter...... s....ple. ...............
....... ....... .! ..... ... .2... ......
140
1 2 0 . ........ .. ...... .. ......... .... .. ..... .... ... ........ ...... ..
Denim Data Sample 2
100 - .. .....
'60
40 ......
2"
0 o 40 60 800 1000 1200
Pixel Number
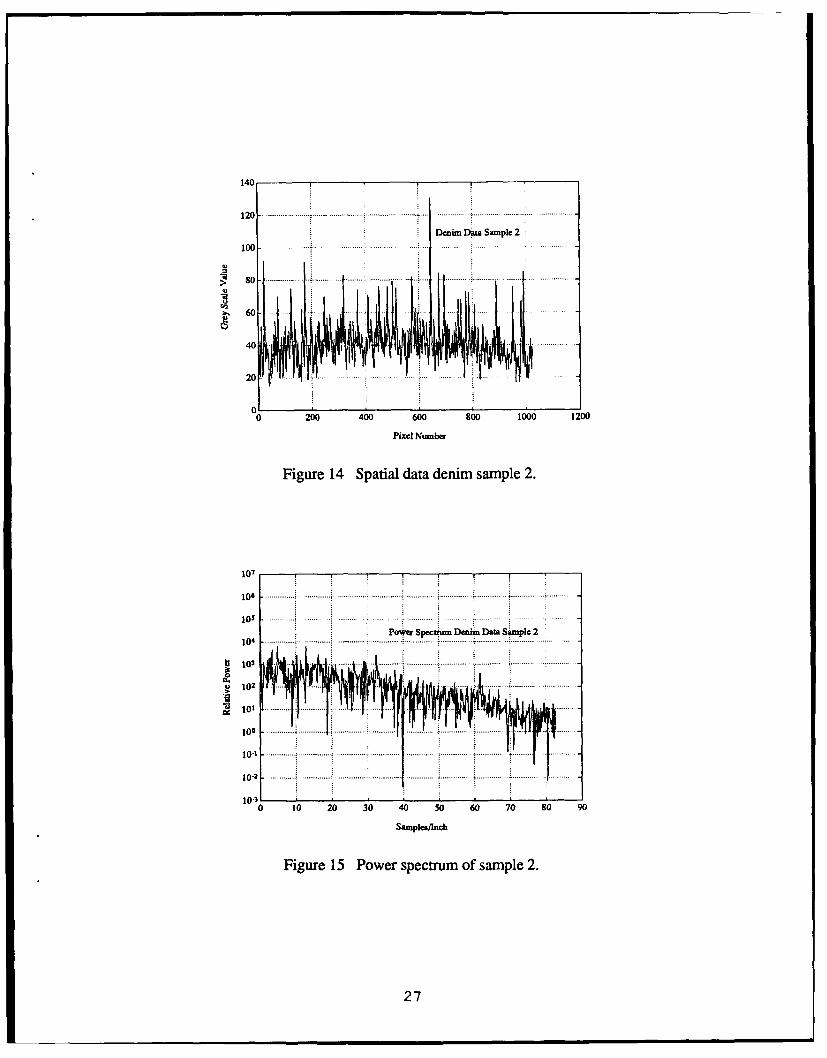
Figure 14 Spatial data denim sample 2.
107
106 ................ ..... ...................... ...................... -......
105 ..
PoWer Spectumi Denim Data Sample 2
102 .....
10-3
0 10 20 30 40 50 60 70 so 90
Samples/Inch
Figure 15 Power spectrum of sample 2.
27
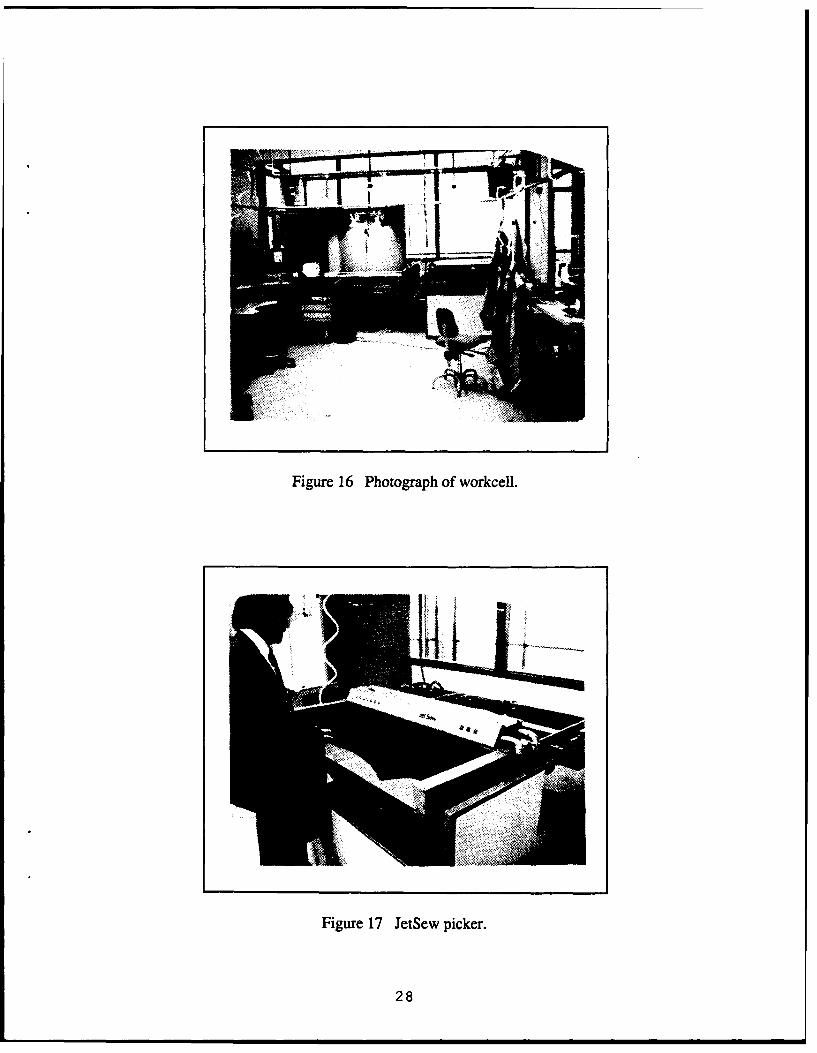
Figure 16 Photograph of workcell.
Figure 17 JetSew picker.
28
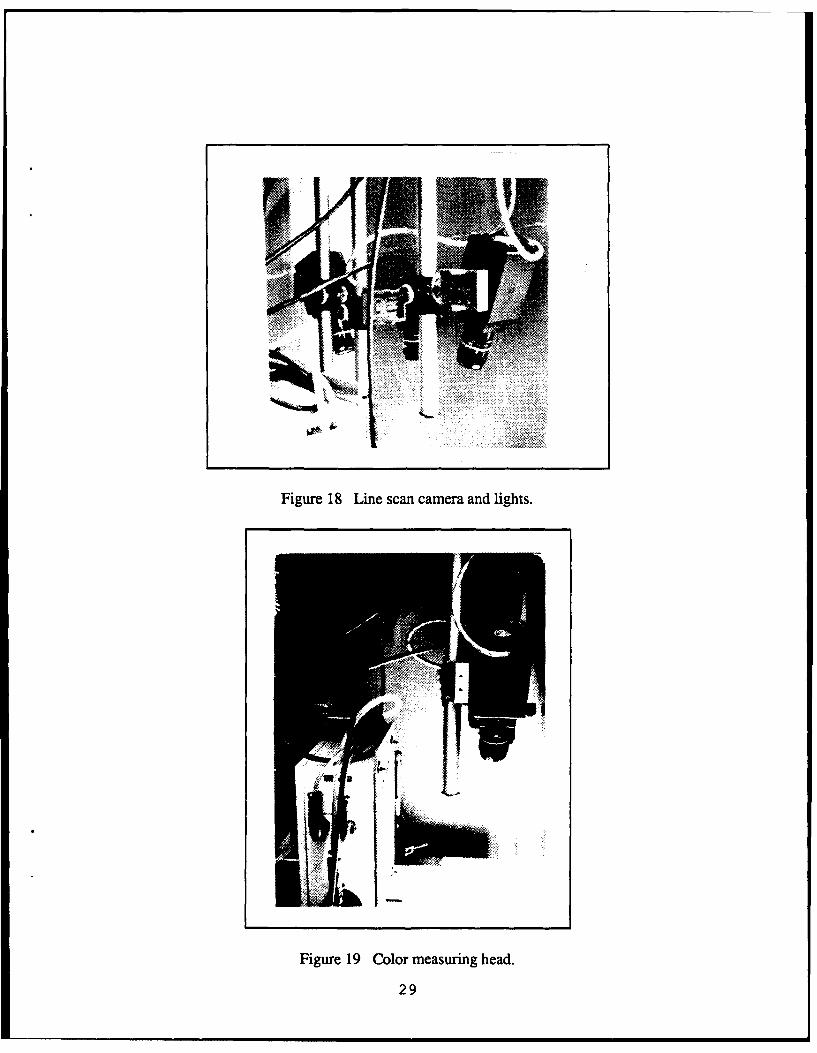
Figure 18 Line scan camera and lights.
Figure 19 Color measuring head.
29
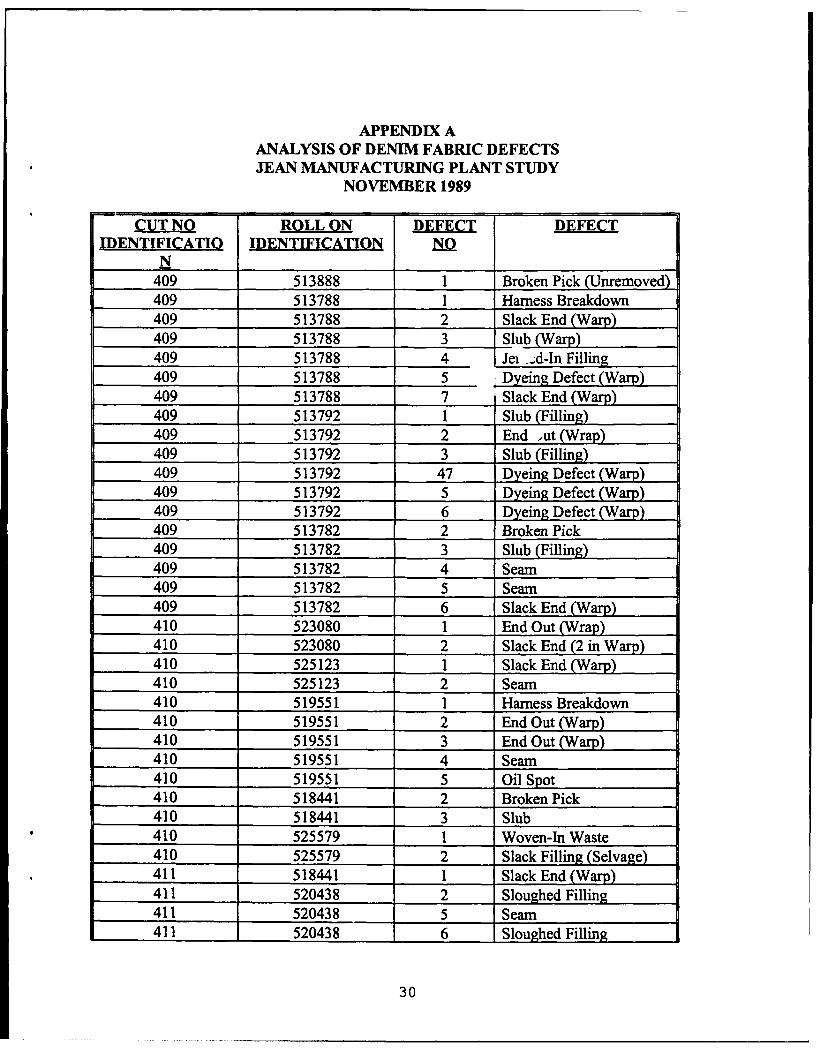
APPENDIX AANALYSIS OF DENIM FABRIC DEFECTSJEAN MANUFACTURING PLANT STUDY
NOVEMBER 1989
CUT NO ROLL ON DEFECT DEFECTIIDENTIFICATIO IDENTIFICATION NQ
N409 513888 1 Broken Pick (Unremoved)409 513788 1 Harness Breakdown409 513788 2 Slack End (Warp)409 513788 3 Slub (Warp)409 513788 4 Jei .4d-In Filling409 513788 5 Dyeing Defect (Warp)409 513788 7 Slack End (Warp)409 513792 1 Slub (Filling)409 513792 2 End ,ut (Wrap)409 513792 3 Slub (Filling)409 513792 47 Dyeing Defect (Warp)409 513792 5 Dyeing Defect (Warp)409 513792 6 Dyeing Defect (Warp)409 513782 2 Broken Pick409 513782 3 Slub (Filling)409 513782 4 Seam409 513782 5 Seam409 513782 6 Slack End (Warp)410 523080 1 End Out (Wrap)410 523080 2 Slack End (2 in Warp)410 525123 1 Slack End (Warp)410 525123 2 Seam410 519551 1 Harness Breakdown410 519551 2 End Out (Warp)410 519551 3 End Out (Warp)410 519551 4 Seam410 519551 5 Oil Spot410 518441 2 Broken Pick410 518441 3 Slub410 525579 1 Woven-In Waste410 525579 2 Slack Filling (Selvage)411 518441 1 Slack End (Warp)411 520438 2 Sloughed Filling411 520438 5 Seam411 520438 6 Sloughed Filling
30
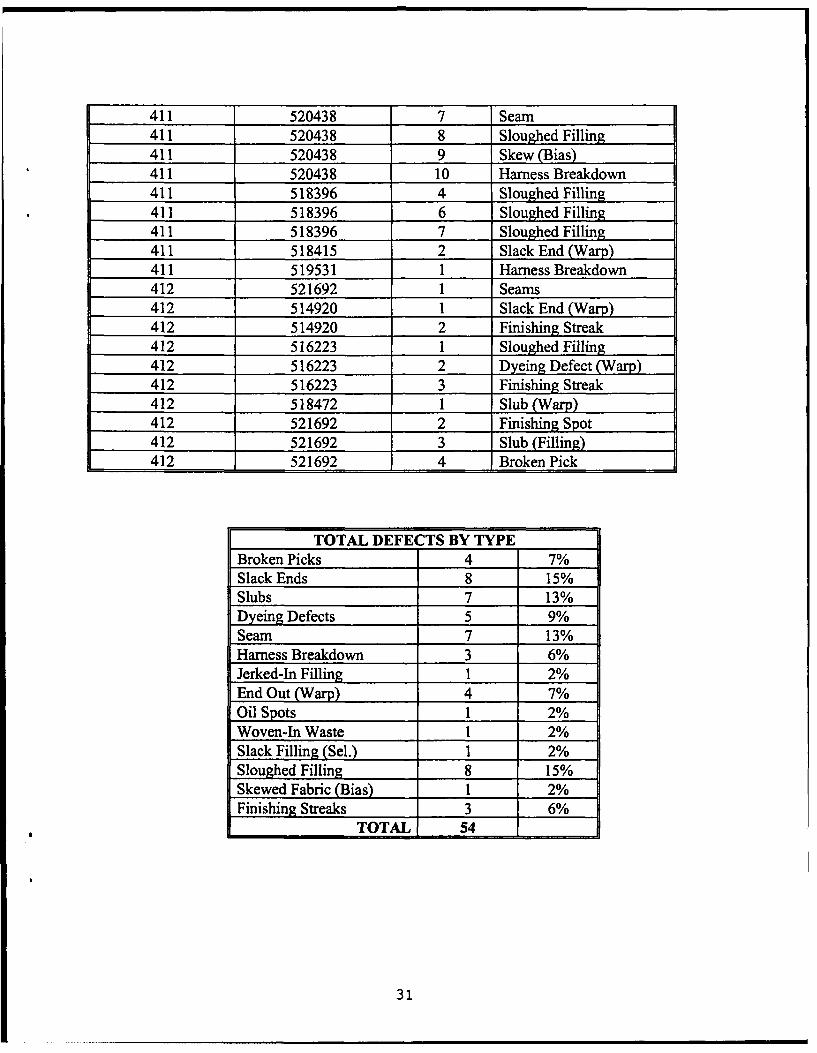
411 520438 7 Seam411 520438 8 Sloughed Filling411 520438 9 Skew (Bias)411 520438 10 Hamess Breakdown411 518396 4 Sloughed Filling411 518396 6 Sloughed Filling411 518396 7 Sloughed Filling411 518415 2 Slack End (Warp)411 519531 1 Hamess Breakdown412 521692 1 Seams412 514920 1 Slack End (Warp)412 514920 2 Finishing Streak412 516223 1 Sloughed Filling412 516223 2 Dyeing Defect (Warp)412 516223 3 Finishing Streak412 518472 1 Slub (Warp)
2 5216 2 im P, Spot412 521692 3 Slub (Filling)412 521692 4 Broken Pick
TOTAL DEFECTS BY TYPEBroken Picks 4 7%Slack Ends 8 15%Slubs 7 13%Dyeing Defects 5 9%Sewn 7 13%Hamess Breakdown 3 6%Jerked-In FilljAg 1 2%End Out (Warp) 4 7%Oil Spots 1 2%Woven-In Waste 1 2%Slack Filling (Sel.) 1 2%Sloughed Filling 8 15%Skewed Fabric (Bias) 1 2%Finishing Streaks 3 6%
TOTAL 54
31