Embed Size (px)
Citation preview

TERMOTEHNICA 1/2011 59
OPTIMIZATION OF ENERGY REQUIREMENT IN AN
EXISTING RESIDENTIAL HOUSE - ENERGY AUDITS
OF A REAL CASE WITH REDEVELOPMENT TO THE
ENERGY CLASS A
Fausto BOZZINI 1, Paul Gabriel ANOAICA
2, Mircea MARINESCU
3
1THERMO-TECHNICAL ENGINEERING APPLICATION, Italy; 2
UNIVERSITY OF MEDICINE AND PHARMACY CRAIOVA, Romania 3UNIVERSITY “POLITEHNICA” OF BUCHAREST, Romania
Rezumat. Studiul a fost realizat asupra unei case reale. S-a realizat un audit energetic asupra sistemul de încălzire în stadiul actual şi un proiect de audit pentru a realizarea unei optimizări cu integrarea resurselor regenerabile. In acest fel se poate evalua intervenţia asupra optimizari consumului de energie al clădiri, fezabilitatea tehnică şi economică necesară pentru introducerea casei în condiţiile energetice pentru clasa A de energie. Comparaţia a celor două audite energetice relevă reducerea segnifiantă a consumului de energie şi a cantităţi de dioxid de
carbon în atmosferă. Cuvinte cheie: audit energetic, colector solar, optimizare termică, fotovoltaice.
Abstract: The study has been applied on an existing residential house. It was carried out an energy audit on the
building-heating installation system in the actual state and a project energy audit for realise the interventions of
optimization with integration of renewable sources. In this way we could evaluate the interventions for
optimization of energy consumption of the building and plant, technically feasible and economic suitable to
redevelopment of the house in energy conditions of the national class A. The comparision of both energy audit
underlines the significant reduction of energy consumption and of the carbon dioxide quantity in environment.
Keywords: energy audit,solar collector, thermal optimization, photovoltaic.
1. INTRODUCTION
The house studied is located in Usseglio, a country near to Alpi Graie near the French border in Piedmont Region.The annual average external temperature is -12°C. The house’s surface is 160 m2 and the net volume is 440 m3. It is composed of
two floors: a first floor and an attic. The external perimetral wall has a thikness of 400 mm, it is made of full uninsulated bricks. The windows have an alluminium frame and a simple glass. This
structure is heated with traditional boiler. Year after year, it have been realized some energy optimizations such as: replacce of the traditional boiler with a condensing one, the existing windows with modern ones costituted by PVC frame and
triple-glass with a low emmission magnetotronic selective coat and the insulation of all the opaque structures.
The chosen frames, have respectively a
coefficient of trasmission Uf = 1,3 W/m2K, Ug =
0,6-1,1 W/m2K of the glass and a global heat
transfer coefficient (frame+glass) Uw = 1,0-1,4
W/m2K variable, in function of the size of the
window (see figure 1).
Fig. 1. The section of window kind with triple glass and with
selectiv magnetotronic coating

Fausto BOZZINI, Paul Gabriel ANOAICA, Mircea MARINESCU
60 TERMOTEHNICA 1/2011
The pre-optimization house’s condition is shown in Figure 2. The colors represent the distribution of the level of the useful thermal
energy for heating each room after we have made the energy audit in according to the Standard European laws.
Min = 203,01 kWh/m2 year Max =522,86 kWh/m
2 year
Fig. 2. House’s map before building’s redevelopment: Level’s energy for heating every zone
The envelope’s energy audit has shown a annual primary energy of 426 kWh·m-2year-1 which places the building at the G class national energy
(high energy-dispersion building). The CO2 produced into the atmosphere is equivalent to 18.53 kgCO2·m
-3year-1. The house has undergone a partial
redevelopment in the highlighted area in Figure 3,
in order to enhance the static structure. This
portion of the building has been practically rebuilt
in order to reduce the global energy consumption.
We have chosen to build the new brick walls
insulated with perlite of 365 mm thickness with a
coefficient of trasmission U = 0.18 W·m-2K-1. The
bricks have an high mass per specific area and a
summer phase displacement of 27 h. This structure
is realized insulated all the thermal border bridge.
The new walls have the advantage of being laid
quickly and directly plasteble without adding other
layers of insulate material (see next figure 3).
2. ENERGY ANALYSIS OF A CONCRETE
CASE AND STRUCTURAL OPTIMIZATION
The house’s optimization consist of two phases: 1) optimization of the building:
− redevelopment of the first floor and attic, and of
the roof
− insulation of the existing opaque walls
2) energy optimization:
− addition of a radiant floor system in the new
zones
− adding forced-air ventilation.
− integration of the heat generator with a heating
solar collectors system for the production of
sanitary warm water
− addition of photovoltaic collectors by 7 kW.
The values calculated that verify the absence of surface and interstitial condensation on the opaque structures of the building and those that demostrate
OPTIMIZATION OF ENERGY REQUIREMENT IN AN EXISTING RESIDENTIAL HOUSE - ENERGY AUDITS OF A REAL
TERMOTEHNICA 1/2011 61
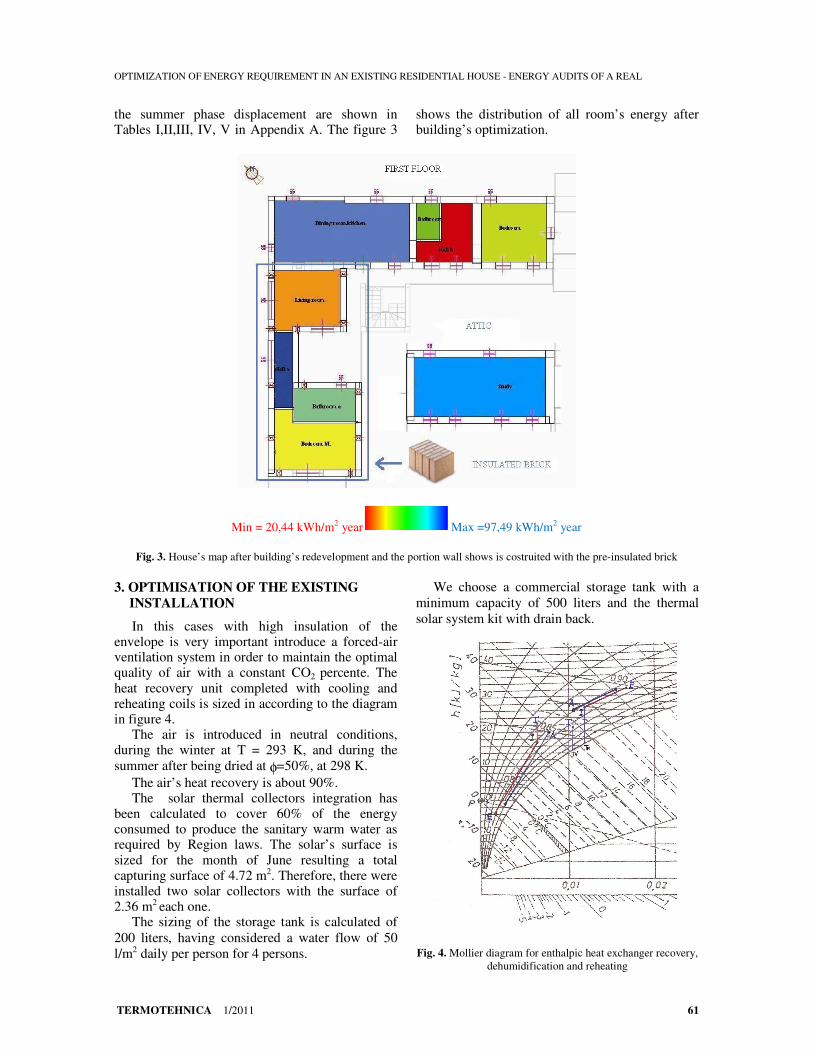
the summer phase displacement are shown in Tables I,II,III, IV, V in Appendix A. The figure 3
shows the distribution of all room’s energy after building’s optimization.
Min = 20,44 kWh/m2 year Max =97,49 kWh/m2 year
Fig. 3. House’s map after building’s redevelopment and the portion wall shows is costruited with the pre-insulated brick
3. OPTIMISATION OF THE EXISTING
INSTALLATION
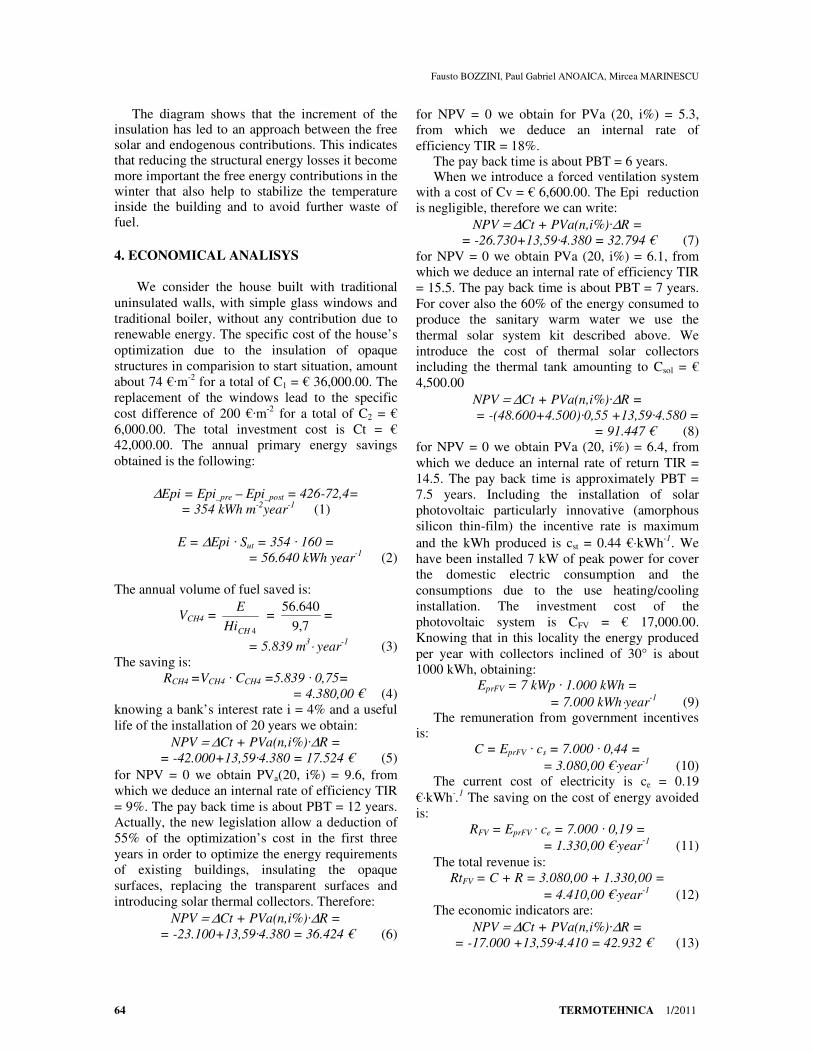
In this cases with high insulation of the envelope is very important introduce a forced-air ventilation system in order to maintain the optimal quality of air with a constant CO2 percente. The
heat recovery unit completed with cooling and reheating coils is sized in according to the diagram in figure 4.
The air is introduced in neutral conditions, during the winter at T = 293 K, and during the
summer after being dried at φ=50%, at 298 K.
The air’s heat recovery is about 90%. The solar thermal collectors integration has
been calculated to cover 60% of the energy consumed to produce the sanitary warm water as required by Region laws. The solar’s surface is
sized for the month of June resulting a total capturing surface of 4.72 m2. Therefore, there were installed two solar collectors with the surface of 2.36 m2 each one.
The sizing of the storage tank is calculated of
200 liters, having considered a water flow of 50
l/m2 daily per person for 4 persons.
We choose a commercial storage tank with a
minimum capacity of 500 liters and the thermal
solar system kit with drain back.
Fig. 4. Mollier diagram for enthalpic heat exchanger recovery,
dehumidification and reheating

Fausto BOZZINI, Paul Gabriel ANOAICA, Mircea MARINESCU
62 TERMOTEHNICA 1/2011
The storage tank consists of three coils used respectively: the first for the production of sanitary warm water connected in series with the boiler, the second for the heating of the storage tank water
and the thirth for the heating of the fresh air unit re-heat coil. The heat required for the re-heat coil is 1000 W. This one utilizes the solar integration power that is already exploited for producing the sanitary warm water.
We present the advantages of this thermal solar system in comparision to the traditional one:
1. the risk of frost in the winter without the use
of ethylene glycol antifreeze and the stagnation
temperature in the summer are avoided.
2. the water tank is heated and pushed directly
into the solar collectors, and then it return in the
tank where it stratifies. The solar hydraulic circuit
works directly in storage technical water tank. The
heat exchanger separator between solar collectors
circuit and sanitary warm water circuit is avoided.
This feature increases the performance and safety
of the entire system.
3. This solar system works without pressure so
we also do not need the expansion vessel, the
safety valve and the manometer. Avoiding the
installation of all this components we obtained
saving costs and an increase operational safety.
When the probe immersion into the solar
collectors detects a low temperature blocks the
function of the pumps and the circuit will become
empty. When the sunlight is sufficient and the
temperature detected by the probe is higher than
those of the tank, then the pumps are activated for
a short time to transfer the heat from solar
collectors to the tank. After one minute a pump
stops, while the other continues to move the water
in the collectors. Solar collectors are also designed
to withstand 473 K temperature water and without
being damaged in such circunstances.
The choice of the radiant floor has permited to
use the same floor for summer cooling. It was
utilized a small refrigeration group with
compression vapor air-cooled with heat pump
reverse cycle and a cooling power of 5 kW. The
refrigeration group, in summer, cools the radiant
floor and the coil of the air unit and it dehumidifies
the air up to ϕ=50% at a temperature of about 295
K. The re-heating is obtained in a free way by
taking heat from the storage tank if the tank
temperature isn’t below 323 K (see Figure 4).
Fig. 5. Installation technical scheme; 1) Condensig boiler, 2) Sanitary boiler, 3) Inertial accumulation boiler, 4) Solar collectors,
5) Hydraulic separator, 6) Heat pump, 7) Heat recovery exchanger for refresh air, 8) Supply/return water of the radiant floor on
first stairs, 9) Supply/return water of the radiant floor on attic stairs, 10) Supply/return water of the calorifers on first stairs

OPTIMIZATION OF ENERGY REQUIREMENT IN AN EXISTING RESIDENTIAL HOUSE - ENERGY AUDITS OF A REAL
TERMOTEHNICA 1/2011 63
The optimization plants were analized in comparision to the start situation.
The Table I shows the percents of reduction of performance energetic index in comparision
to the situation of pre-optimization. We deduce that the contribution of maximum energetic saving is due to building’s insulation. The results
obtained with the intervention of building’s insulation, lead the building to B class national energy (see Figure 5).
The energetic contributions of the thermic
solar and photovoltaic systems allow the
building to pass in A class national energy.
Table 1
Values of the EPi in function of kind of the optimization
0
5000
10000
15000
20000
25000
30000
35000
40000
45000
0 2 4 6 8
Energy fluxes MJ
Months
Dispersion of the building
Dispersion of
trasmission post-
optimizationDispersion of
ventilation post-
optimizationTotal dispersion
post-optimization
Dispersion of
trasmission pre-
optimizationDispersion of
ventilation pre-
optimization
Fig. 5. Energy saving comparative diagram
The diagram shows the energetic comparison between pre-and post- building’s insulation, obtaining an important reduction of transmission
and ventilation energy losses of about 71%. The contribution of thermal solar system doesn’t lead to the decrement of the energy performance index EPI, but it halves the EPW index of sanitary
warm water. Its contribution is therefore sufficient to translate the building from the B class energy to the A one. The next diagram of
Figure 6 represents the contribution of solar and endogenous energy before and after the optimization.
0
1000
2000
3000
4000
5000
6000
7000
0 2 4 6 8
Energy loads
Months
Gratuite energy loads
Solar load post-
optimization
Endogenous
post-
optimization
Solar load pre-
optimization
Endogenous
load pre-
optimization
Fig. 6 . Solar and endogenous energy diagram pre/post optimization
Fausto BOZZINI, Paul Gabriel ANOAICA, Mircea MARINESCU
64 TERMOTEHNICA 1/2011
The diagram shows that the increment of the insulation has led to an approach between the free solar and endogenous contributions. This indicates that reducing the structural energy losses it become
more important the free energy contributions in the winter that also help to stabilize the temperature inside the building and to avoid further waste of fuel.
4. ECONOMICAL ANALISYS
We consider the house built with traditional
uninsulated walls, with simple glass windows and
traditional boiler, without any contribution due to
renewable energy. The specific cost of the house’s
optimization due to the insulation of opaque
structures in comparision to start situation, amount
about 74 €·m-2 for a total of C1 = € 36,000.00. The
replacement of the windows lead to the specific
cost difference of 200 €·m-2
for a total of C2 = €
6,000.00. The total investment cost is Ct = €
42,000.00. The annual primary energy savings
obtained is the following:
∆Epi = Epi_pre – Epi_post = 426-72,4=
= 354 kWh m-2year-1 (1)
E = ∆Epi · Sut = 354 · 160 =
= 56.640 kWh year-1 (2)
The annual volume of fuel saved is:
VCH4 = 4CHHi
E =
7,9
640.56=
= 5.839 m3⋅ year
-1 (3)
The saving is:
RCH4 =VCH4 · CCH4 =5.839 · 0,75=
= 4.380,00 € (4)
knowing a bank’s interest rate i = 4% and a useful
life of the installation of 20 years we obtain:
NPV = ∆Ct + PVa(n,i%)·∆R =
= -42.000+13,59·4.380 = 17.524 € (5)
for NPV = 0 we obtain PVa(20, i%) = 9.6, from
which we deduce an internal rate of efficiency TIR
= 9%. The pay back time is about PBT = 12 years.
Actually, the new legislation allow a deduction of
55% of the optimization’s cost in the first three
years in order to optimize the energy requirements
of existing buildings, insulating the opaque
surfaces, replacing the transparent surfaces and
introducing solar thermal collectors. Therefore:
NPV = ∆Ct + PVa(n,i%)·∆R =
= -23.100+13,59·4.380 = 36.424 € (6)
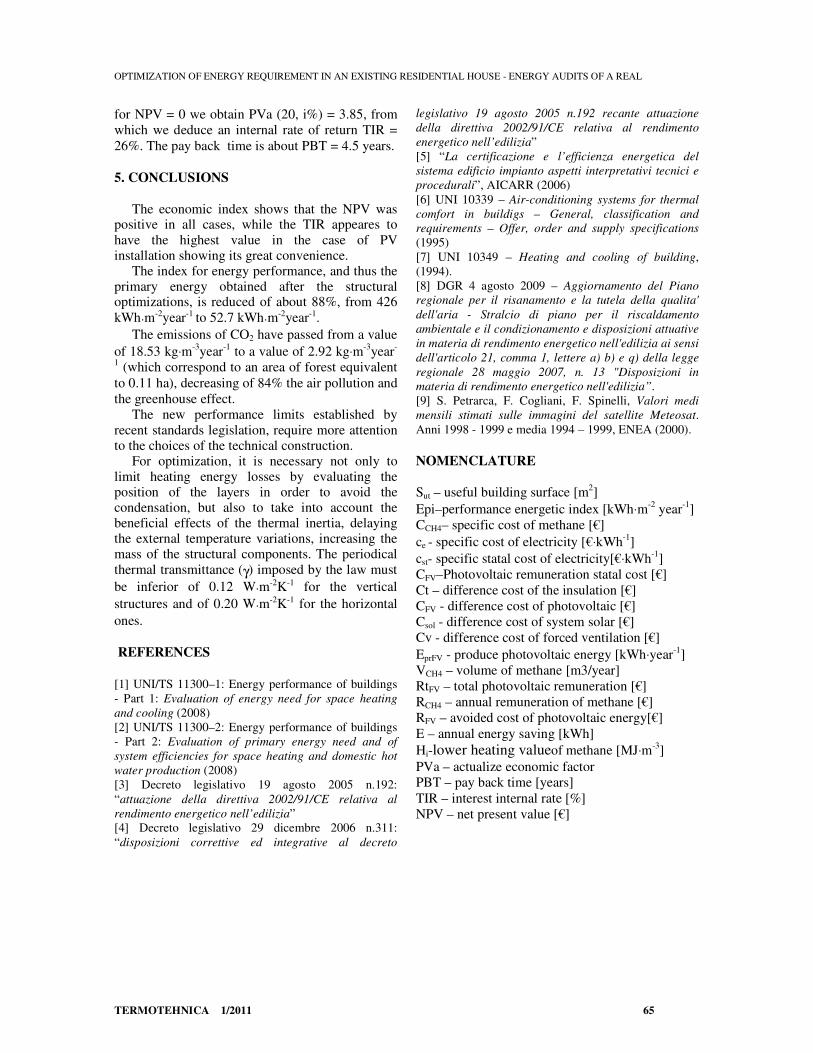
for NPV = 0 we obtain for PVa (20, i%) = 5.3,
from which we deduce an internal rate of
efficiency TIR = 18%. The pay back time is about PBT = 6 years. When we introduce a forced ventilation system
with a cost of Cv = € 6,600.00. The Epi reduction
is negligible, therefore we can write:
NPV = ∆Ct + PVa(n,i%)·∆R =
= -26.730+13,59·4.380 = 32.794 € (7)
for NPV = 0 we obtain PVa (20, i%) = 6.1, from
which we deduce an internal rate of efficiency TIR
= 15.5. The pay back time is about PBT = 7 years.
For cover also the 60% of the energy consumed to
produce the sanitary warm water we use the
thermal solar system kit described above. We
introduce the cost of thermal solar collectors
including the thermal tank amounting to Csol = €
4,500.00
NPV = ∆Ct + PVa(n,i%)·∆R =
= -(48.600+4.500)·0,55 +13,59·4.580 =
= 91.447 € (8)
for NPV = 0 we obtain PVa (20, i%) = 6.4, from
which we deduce an internal rate of return TIR =
14.5. The pay back time is approximately PBT =
7.5 years. Including the installation of solar
photovoltaic particularly innovative (amorphous
silicon thin-film) the incentive rate is maximum
and the kWh produced is cst = 0.44 €⋅kWh-1. We
have been installed 7 kW of peak power for cover
the domestic electric consumption and the
consumptions due to the use heating/cooling
installation. The investment cost of the
photovoltaic system is CFV = € 17,000.00.
Knowing that in this locality the energy produced
per year with collectors inclined of 30° is about
1000 kWh, obtaining:
EprFV = 7 kWp · 1.000 kWh =
= 7.000 kWh⋅year-1 (9) The remuneration from government incentives
is:
C = EprFV · cs = 7.000 · 0,44 =
= 3.080,00 €⋅year-1
(10) The current cost of electricity is ce = 0.19
€⋅kWh-.1 The saving on the cost of energy avoided
is:
RFV = EprFV · ce = 7.000 · 0,19 =
= 1.330,00 €⋅year-1
(11)
The total revenue is:
RtFV = C + R = 3.080,00 + 1.330,00 =
= 4.410,00 €⋅year-1 (12) The economic indicators are:
NPV = ∆Ct + PVa(n,i%)·∆R =
= -17.000 +13,59·4.410 = 42.932 € (13)
OPTIMIZATION OF ENERGY REQUIREMENT IN AN EXISTING RESIDENTIAL HOUSE - ENERGY AUDITS OF A REAL
TERMOTEHNICA 1/2011 65
for NPV = 0 we obtain PVa (20, i%) = 3.85, from
which we deduce an internal rate of return TIR =
26%. The pay back time is about PBT = 4.5 years.
5. CONCLUSIONS
The economic index shows that the NPV was positive in all cases, while the TIR appeares to
have the highest value in the case of PV installation showing its great convenience.
The index for energy performance, and thus the primary energy obtained after the structural optimizations, is reduced of about 88%, from 426
kWh⋅m-2year-1 to 52.7 kWh⋅m
-2year-1.
The emissions of CO2 have passed from a value
of 18.53 kg⋅m-3
year-1
to a value of 2.92 kg⋅m-3
year-
1 (which correspond to an area of forest equivalent
to 0.11 ha), decreasing of 84% the air pollution and
the greenhouse effect.
The new performance limits established by
recent standards legislation, require more attention to the choices of the technical construction.
For optimization, it is necessary not only to limit heating energy losses by evaluating the position of the layers in order to avoid the condensation, but also to take into account the beneficial effects of the thermal inertia, delaying the external temperature variations, increasing the mass of the structural components. The periodical
thermal transmittance (γ) imposed by the law must
be inferior of 0.12 W⋅m-2K-1 for the vertical
structures and of 0.20 W⋅m-2K-1 for the horizontal
ones.
REFERENCES
[1] UNI/TS 11300–1: Energy performance of buildings
- Part 1: Evaluation of energy need for space heating
and cooling (2008)
[2] UNI/TS 11300–2: Energy performance of buildings
- Part 2: Evaluation of primary energy need and of
system efficiencies for space heating and domestic hot
water production (2008)
[3] Decreto legislativo 19 agosto 2005 n.192:
“attuazione della direttiva 2002/91/CE relativa al
rendimento energetico nell’edilizia”
[4] Decreto legislativo 29 dicembre 2006 n.311:
“disposizioni correttive ed integrative al decreto
legislativo 19 agosto 2005 n.192 recante attuazione
della direttiva 2002/91/CE relativa al rendimento
energetico nell’edilizia”
[5] “La certificazione e l’efficienza energetica del
sistema edificio impianto aspetti interpretativi tecnici e
procedurali”, AICARR (2006)
[6] UNI 10339 – Air-conditioning systems for thermal
comfort in buildigs – General, classification and
requirements – Offer, order and supply specifications
(1995)
[7] UNI 10349 – Heating and cooling of building,
(1994).
[8] DGR 4 agosto 2009 – Aggiornamento del Piano
regionale per il risanamento e la tutela della qualita'
dell'aria - Stralcio di piano per il riscaldamento
ambientale e il condizionamento e disposizioni attuative
in materia di rendimento energetico nell'edilizia ai sensi
dell'articolo 21, comma 1, lettere a) b) e q) della legge
regionale 28 maggio 2007, n. 13 "Disposizioni in
materia di rendimento energetico nell'edilizia”.
[9] S. Petrarca, F. Cogliani, F. Spinelli, Valori medi
mensili stimati sulle immagini del satellite Meteosat.
Anni 1998 - 1999 e media 1994 – 1999, ENEA (2000).
NOMENCLATURE
Sut – useful building surface [m2]
Epi–performance energetic index [kWh⋅m-2
year-1
]
CCH4– specific cost of methane [€]
ce - specific cost of electricity [€⋅kWh-1
]
cst- specific statal cost of electricity[€⋅kWh-1
]
CFV–Photovoltaic remuneration statal cost [€]
Ct – difference cost of the insulation [€]
CFV - difference cost of photovoltaic [€]
Csol - difference cost of system solar [€]
Cv - difference cost of forced ventilation [€]
EprFV - produce photovoltaic energy [kWh⋅year-1]
VCH4 – volume of methane [m3/year]
RtFV – total photovoltaic remuneration [€]
RCH4 – annual remuneration of methane [€]
RFV – avoided cost of photovoltaic energy[€]
E – annual energy saving [kWh]
Hi-lower heating valueof methane [MJ⋅m-3]
PVa – actualize economic factor
PBT – pay back time [years]
TIR – interest internal rate [%]
NPV – net present value [€]

Fausto BOZZINI, Paul Gabriel ANOAICA, Mircea MARINESCU
66 TERMOTEHNICA 1/2011
A. APPENDIX
Table 1
Thermophysical parameters of the roof structure and Glaser diagram
Table 2
Thermophysical parameters of the floor structure and Glaser diagram
OPTIMIZATION OF ENERGY REQUIREMENT IN AN EXISTING RESIDENTIAL HOUSE - ENERGY AUDITS OF A REAL
TERMOTEHNICA 1/2011 67
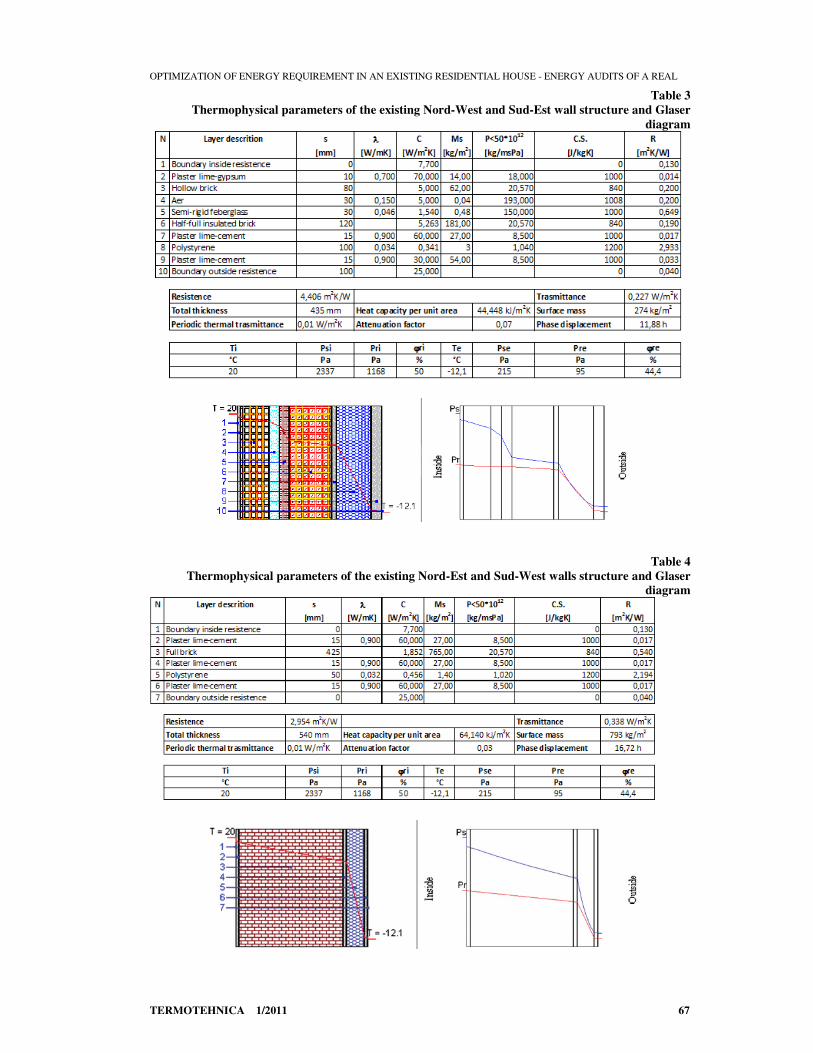
Table 3
Thermophysical parameters of the existing Nord-West and Sud-Est wall structure and Glaser
diagram
Table 4
Thermophysical parameters of the existing Nord-Est and Sud-West walls structure and Glaser
diagram

Fausto BOZZINI, Paul Gabriel ANOAICA, Mircea MARINESCU
68 TERMOTEHNICA 1/2011
Table 5
Thermophysical parameters of the new walls structure and Glaser diagram
All structures doesn’t subject interstitial
and superficial condense. Maxim
eligible value of the superficial quantity
of condensate is with U=0,34 W/m2K for
jennary critical month. Although the
structure in Table.3 is subject to interstitial
condensation is however verified, because
the quantity of the condensate of 0.0137
kg/m2 evaporates in summer. We specify
that the value of the phase displacement after
24 hours is restart in according to law. Thus
in the table V it is considers only its excess
value. Therefore, this structure has the phase
displacement 27,15 h.