Embed Size (px)
Citation preview
8. SITE 224
The Shipboard Scientific Party1
With Additional Reports FromRobert Coleman, U. S. Geological Survey, Menlo Park, California
andNorman Hamilton, University of Southampton, United Kingdom
222 + 20°
SITE SUMMARY
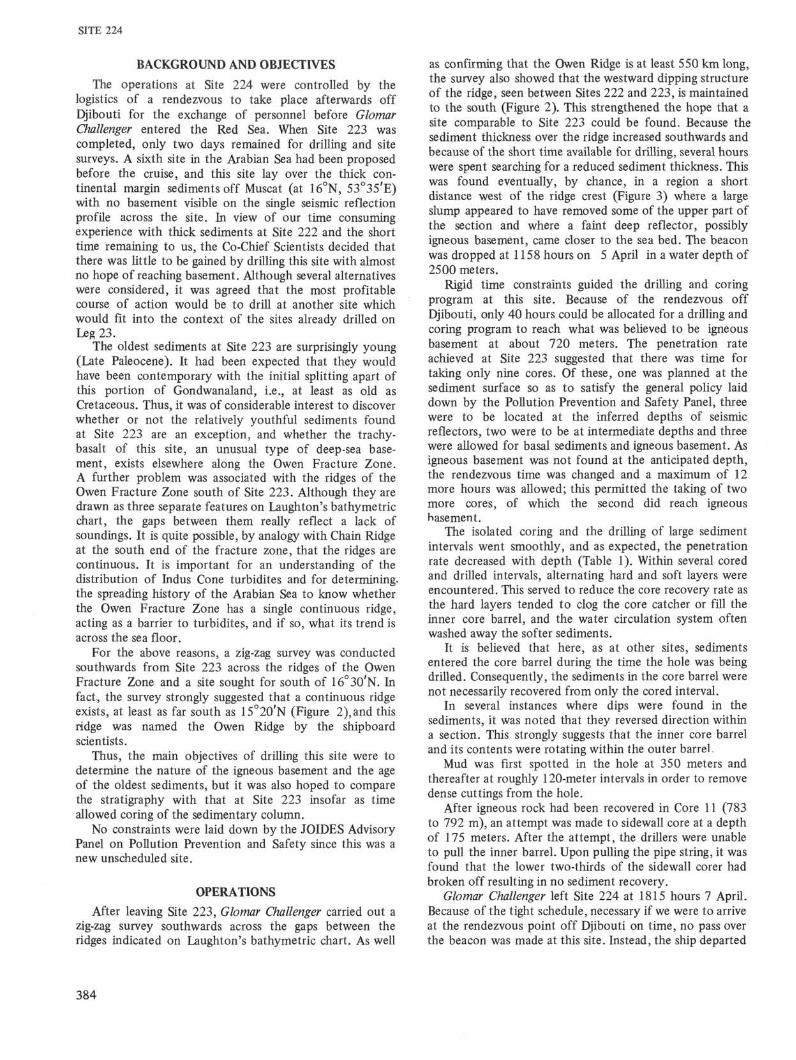
Figure 1. Position of Site 224 and adjacent Leg 23 sites(shown by +). Contours at 200, 1000, and 4000 metersfrom Laugh ton et al. (1971).
SITE DATA
Dates: 0800 5 Apr-1415 7 Apr 72Time: 54 hours
Position (Figure 1): 16°32.5l'N, 59 O 42 .10 'E
Holes Drilled: 1 Total Penetration: 792 metersWater Depth by Echo-Sounder: 2500 corr. metersTotal Core Recovered: 30 meters from 11 coresAge of Oldest Sediment: mid-Early EoceneBasement: Lamprophyre
ABSTRACTLower Eocene nanno-rich clay was laid down on a
lamprophyre flow. The clay grades upwards into a nannochalk which by the Late Eocene was mixed with siltyclaystone and sandstone. In the Late Oligocene, thesedimentation rate changed from 10 to at least 61 m/m.y.A 400-meter-thick Oligocene to Miocene dominantly clasticsection, with rare graded beds, followed. The site rose inthe earliest Miocene and the detrital component decreased.Subsequently, nanno ooze or chalk accumulated at about30 m/m.y. up to the present. Sometime between the earlyMiddle and the Late Miocene, biogenic silica appeared,suggesting the onset of upwelling.
Robert B. Whitmarsh, National Institute of Oceanography,Wormley, Godalming, Surrey, United Kingdom; Oscar E. Weser,Scripps Institution of Oceanography, La Jolla, California: Syed Ali,State University of New York, Stony Brook, New York; Joseph E.Boudreaux, Texaco, Inc., New Orleans, Louisiana; Robert L.
m
Fleisher, University of Southern California, Los Angeles, California;Dan Jipa, M.I.M.G. Institutul Geologic, Bucharest, Romania; RobertB. Kidd, Southampton University, Southampton, United Kingdom(Present address: National Institute of Oceanography, Wormley,Godalming, Surrey, United Kingdom); Tapas K. Mallik, GeologicalSurvey of India, Calcutta, India; Albert Matter, GeologischesInstitut, Universitát Bern, Bern, Switzerland; Catherine Nigrini,Lexington, Massachusetts; Hassan N. Siddiquie, Geological Surveyof India, Calcutta India (Present address: National Institute ofOceanography, Goa, India); Peter Stoffers, Laboratorium fürSedimentforschung, Universitát Heidelberg, Heidelberg, Germany.
383
SITE 224
BACKGROUND AND OBJECTIVES
The operations at Site 224 were controlled by thelogistics of a rendezvous to take place afterwards offDjibouti for the exchange of personnel before GlomarChallenger entered the Red Sea. When Site 223 wascompleted, only two days remained for drilling and sitesurveys. A sixth site in the Arabian Sea had been proposedbefore the cruise, and this site lay over the thick con-tinental margin sediments off Muscat (at 16°N, 53°35'E)with no basement visible on the single seismic reflectionprofile across the site. In view of our time consumingexperience with thick sediments at Site 222 and the shorttime remaining to us, the Co-Chief Scientists decided thatthere was little to be gained by drilling this site with almostno hope of reaching basement. Although several alternativeswere considered, it was agreed that the most profitablecourse of action would be to drill at another site whichwould fit into the context of the sites already drilled onLeg 23.
The oldest sediments at Site 223 are surprisingly young(Late Paleocene). It had been expected that they wouldhave been contemporary with the initial splitting apart ofthis portion of Gondwanaland, i.e., at least as old asCretaceous. Thus, it was of considerable interest to discoverwhether or not the relatively youthful sediments foundat Site 223 are an exception, and whether the trachy-basalt of this site, an unusual type of deep-sea base-ment, exists elsewhere along the Owen Fracture Zone.A further problem was associated with the ridges of theOwen Fracture Zone south of Site 223. Although they aredrawn as three separate features on Laughton's bathymetricchart, the gaps between them really reflect a lack ofsoundings. It is quite possible, by analogy with Chain Ridgeat the south end of the fracture zone, that the ridges arecontinuous. It is important for an understanding of thedistribution of Indus Cone turbidites and for determining,the spreading history of the Arabian Sea to know whetherthe Owen Fracture Zone has a single continuous ridge,acting as a barrier to turbidites, and if so, what its trend isacross the sea floor.
For the above reasons, a zig-zag survey was conductedsouthwards from Site 223 across the ridges of the OwenFracture Zone and a site sought for south of 16°3θ'N. Infact, the survey strongly suggested that a continuous ridgeexists, at least as far south as 15°2θ'N (Figure 2),and thisridge was named the Owen Ridge by the shipboardscientists.
Thus, the main objectives of drilling this site were todetermine the nature of the igneous basement and the ageof the oldest sediments, but it was also hoped to comparethe stratigraphy with that at Site 223 insofar as timeallowed coring of the sedimentary column.
No constraints were laid down by the JOIDES AdvisoryPanel on Pollution Prevention and Safety since this was anew unscheduled site.
OPERATIONS
After leaving Site 223, Glomar Challenger carried out azig-zag survey southwards across the gaps between theridges indicated on Laughton's bathymetric chart. As well
as confirming that the Owen Ridge is at least 550 km long,the survey also showed that the westward dipping structureof the ridge, seen between Sites 222 and 223, is maintainedto the south (Figure 2). This strengthened the hope that asite comparable to Site 223 could be found. Because thesediment thickness over the ridge increased southwards andbecause of the short time available for drilling, several hourswere spent searching for a reduced sediment thickness. Thiswas found eventually, by chance, in a region a shortdistance west of the ridge crest (Figure 3) where a largeslump appeared to have removed some of the upper part ofthe section and where a faint deep reflector, possiblyigneous basement, came closer to the sea bed. The beaconwas dropped at 1158 hours on 5 April in a water depth of2500 meters.
Rigid time constraints guided the drilling and coringprogram at this site. Because of the rendezvous offDjibouti, only 40 hours could be allocated for a drilling andcoring program to reach what was believed to be igneousbasement at about 720 meters. The penetration rateachieved at Site 223 suggested that there was time fortaking only nine cores. Of these, one was planned at thesediment surface so as to satisfy the general policy laiddown by the Pollution Prevention and Safety Panel, threewere to be located at the inferred depths of seismicreflectors, two were to be at intermediate depths and threewere allowed for basal sediments and igneous basement. Asigneous basement was not found at the anticipated depth,the rendezvous time was changed and a maximum of 12more hours was allowed; this permitted the taking of twomore cores, of which the second did reach igneousbasement.
The isolated coring and the drilling of large sedimentintervals went smoothly, and as expected, the penetrationrate decreased with depth (Table 1). Within several coredand drilled intervals, alternating hard and soft layers wereencountered. This served to reduce the core recovery rate asthe hard layers tended to clog the core catcher or fill theinner core barrel, and the water circulation system oftenwashed away the softer sediments.
It is believed that here, as at other sites, sedimentsentered the core barrel during the time the hole was beingdrilled. Consequently, the sediments in the core barrel werenot necessarily recovered from only the cored interval.
In several instances where dips were found in thesediments, it was noted that they reversed direction withina section. This strongly suggests that the inner core barreland its contents were rotating within the outer barrel
Mud was first spotted in the hole at 350 meters andthereafter at roughly 120-meter intervals in order to removedense cuttings from the hole.
After igneous rock had been recovered in Core 11 (783to 792 m), an attempt was made to sidewall core at a depthof 175 meters. After the attempt, the drillers were unableto pull the inner barrel. Upon pulling the pipe string, it wasfound that the lower two-thirds of the sidewall corer hadbroken off resulting in no sediment recovery.
Glomar Challenger left Site 224 at 1815 hours 7 April.Because of the tight schedule, necessary if we were to arriveat the rendezvous point off Djibouti on time, no pass overthe beacon was made at this site. Instead, the ship departed
384

SITE 224
60°
49°
Figure 2. Bathymetric chart of the Owen Fracture Zone from Laughton's unpublished charts with Leg23 soundings added. Contours at 1000-meter intervals, 3500-meter contour added north of 15°N.Closed contours around depressions contain a minus sign, all other closed contours represent positivefeatures. Leg 23 sites shown by dots, Leg 24 sites, by crosses. The Owen Ridge is almost certainlycontinuous between Sites 223 and 224 and only appears discontinuous here because of the chosencontour spacing.
385

SITE 224
Hl6°30'N
5<r30' 60°E
Figure 3. Bathymetric chart of the area around Site 224 with the tracks o/Glomar Challenger. Contour interval 100 fathoms;depths in corrected fathoms; dots represent soundings by other vessels (after Laughton, unpublished).
on a westerly course at 4 knots while gear was beingstreamed and then came up to full speed afterwards.
LITHOLOGY
A 792-meter-thick stratigraphic section was drilled. Themain objective of this site was to reach basement andestablish the stratigraphic sequence, taking as many cores astime constraints allowed. Unfortunately, only 11 corescould be taken, and the positions of the unit boundaries arenecessarily indefinite (see Table 2).
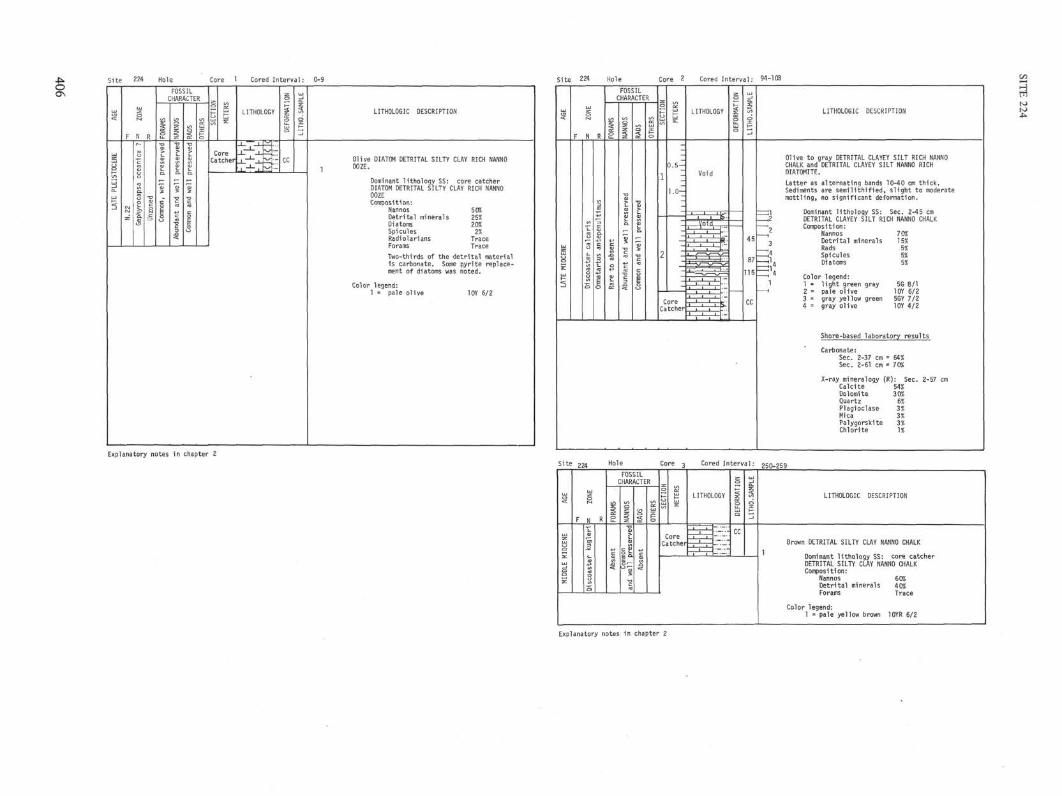
Unit I
This unit consists of soft-to-semilithified pale olive togreenish-gray detrital clayey silt-rich nanno ooze and chalk.Diatoms occur in the top two cores only, the sedimentsbeing diatom-rich in Core 1 and ranging from diatom-bearing nanno chalk to an impure diatomite in Core 2. Thelatter core also contains 5 percent each of Radiolaria andsponge spicules. A downward increase of the detrital clayand silt content can be observed as well as a regularalternation of detrital silty clay-rich nanno chalk (64%carbonate) and nanno-bearing detrital silty claystone (2%carbonate). These lithologic differences are reflected by
color changes from greenish gray to grayish olive. Smallamounts of palygorskite and dolomite occur in this unit.
Unit I encompasses an unconformity in the drilledinterval between Cores 1 and 2. The seismic profile indi-cates that at the site 150 meters of the uppermost sediment,which are present at the top of the Owen Ridge, are absentbecause of slumping from the ridge flank. Core 1 probablyrepresents a surface veneer of sediments deposited afterslumping took place.
Unit II
This unit consists of semilithified to lithified detritalclayey silt and claystone. The carbonate content of thisunit ranges from 2 to 15 percent. X-ray mineralogy revealsthat mica and quartz are very abundant (Appendix III). Twosubunits are recognized according to color and according tothe amount of nannofossils and sand layers present in thesediments.
Subunit Ha is a finely laminated grayish detrital siltyclaystone with a 3-meter interbedded interval of light bluishdetrital clay-rich nanno chalk. The sediments aremoderately to intensely bioturbated. In places, the burrowsdip 22° to 30°. The lower part of this unit shows slump
386
SITE 224
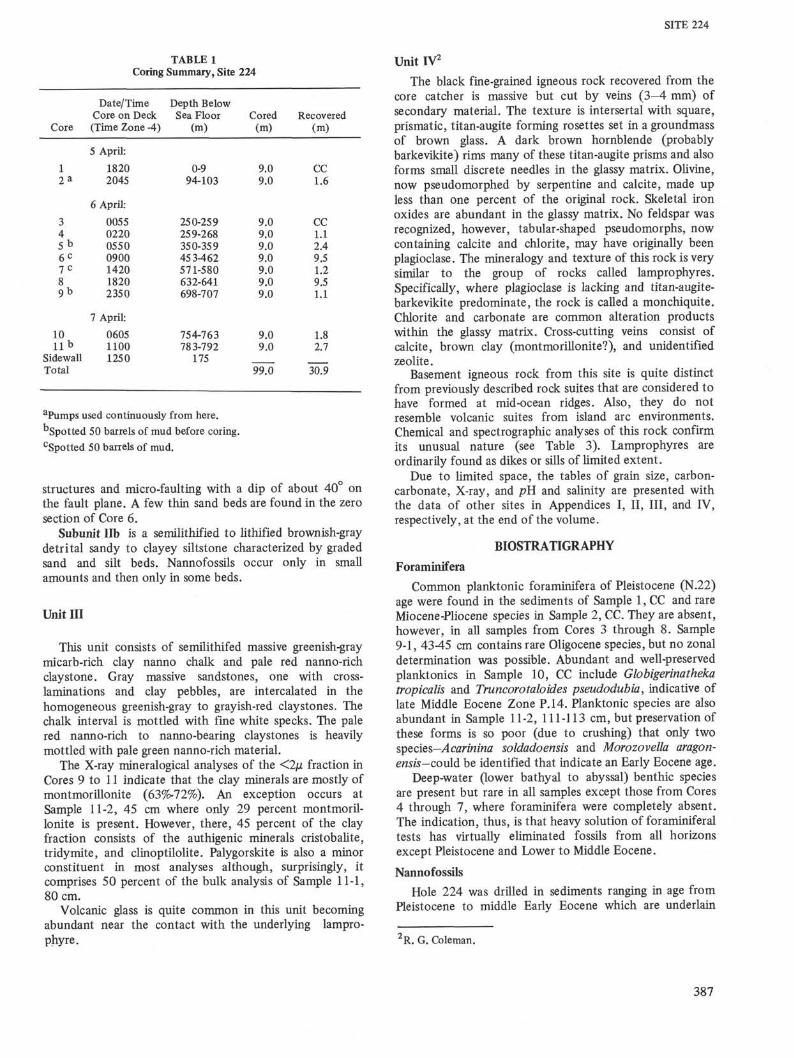
TABLE 1Coring Summary, Site 224
Core
12 ^
345 b6C
7 C
8
9 b
10l i b
SidewallTotal
Date/TimeCore on Deck(Time Zone -4)
5 April:
18202045
6 April:
0055022005500900142018202350
7 April:
060511001250
Depth BelowSea Floor
(m)
0-994-103
250-259259-268350-35945 3-462571-580632-641698-707
754-763783-792
175
Cored(m)
9.09.0
9.09.09.09.09.09.09.0
9.09.0
99TO
Recovered(m)
cc1.6
CC1.12.49.51.29.51.1
1.82.7
309
aPumps used continuously from here.
"Spotted 50 barrels of mud before coring.cSpotted 50 barrels of mud.
structures and micro-faulting with a dip of about 40° onthe fault plane. A few thin sand beds are found in the zerosection of Core 6.
Subunit lib is a semilithified to lithified brownish-graydetrital sandy to clayey siltstone characterized by gradedsand and silt beds. Nannofossils occur only in smallamounts and then only in some beds.
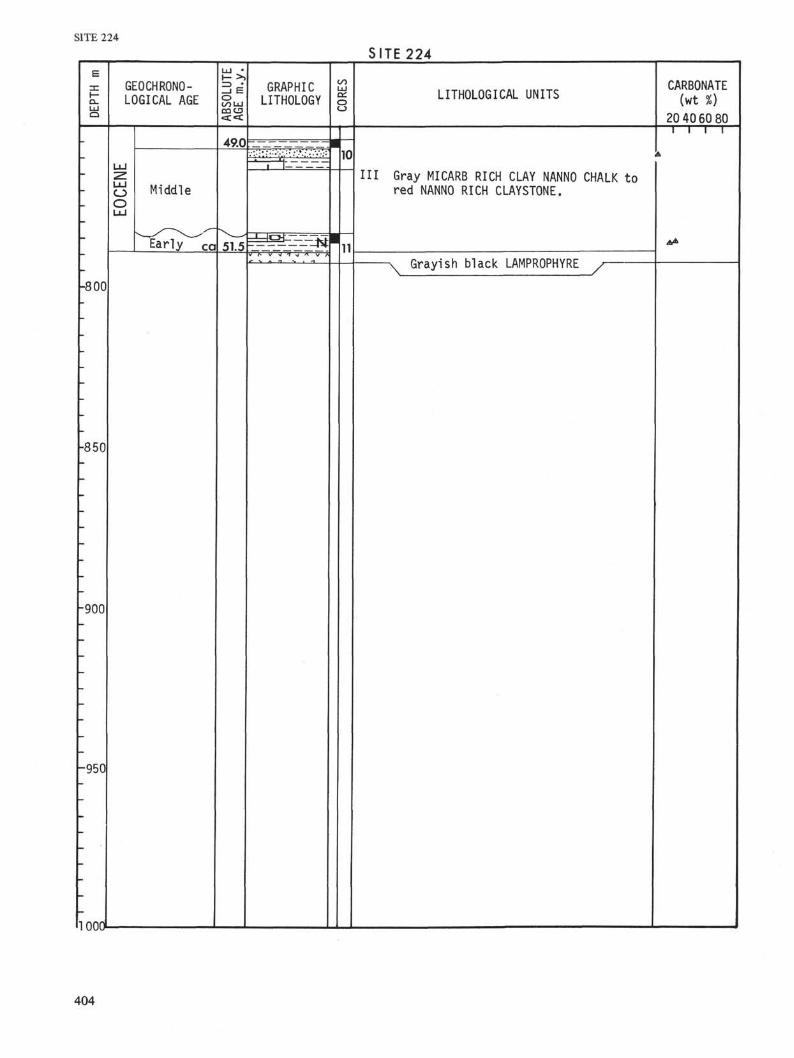
Unit III
This unit consists of semilithifed massive greenish-graymicarb-rich clay nanno chalk and pale red nanno-richclay stone. Gray massive sandstones, one with cross-laminations and clay pebbles, are intercalated in thehomogeneous greenish-gray to grayish-red claystones. Thechalk interval is mottled with fine white specks. The palered nanno-rich to nanno-bearing claystones is heavilymottled with pale green nanno-rich material.
The X-ray mineralogical analyses of the <2µ fraction inCores 9 to 11 indicate that the clay minerals are mostly ofmontmorillonite (63%-72%). An exception occurs atSample 11-2, 45 cm where only 29 percent montmoril-lonite is present. However, there, 45 percent of the clayfraction consists of the authigenic minerals cristobalite,tridymite, and clinoptilolite. Palygorskite is also a minorconstituent in most analyses although, surprisingly, itcomprises 50 percent of the bulk analysis of Sample 11-1,80 cm.
Volcanic glass is quite common in this unit becomingabundant near the contact with the underlying lampro-phyre.
Unit IV2
The black fine-grained igneous rock recovered from thecore catcher is massive but cut by veins (3-4 mm) ofsecondary material. The texture is intersertal with square,prismatic, titan-augite forming rosettes set in a groundmassof brown glass. A dark brown hornblende (probablybarkevikite) rims many of these titan-augite prisms and alsoforms small discrete needles in the glassy matrix. Olivine,now pseudomorphed by serpentine and calcite, made upless than one percent of the original rock. Skeletal ironoxides are abundant in the glassy matrix. No feldspar wasrecognized, however, tabular-shaped pseudomorphs, nowcontaining calcite and chlorite, may have originally beenPlagioclase. The mineralogy and texture of this rock is verysimilar to the group of rocks called lamprophyres.Specifically, where Plagioclase is lacking and titan-augite-barkevikite predominate, the rock is called a monchiquite.Chlorite and carbonate are common alteration productswithin the glassy matrix. Cross-cutting veins consist ofcalcite, brown clay (montmorillonite?), and unidentifiedzeolite.
Basement igneous rock from this site is quite distinctfrom previously described rock suites that are considered tohave formed at mid-ocean ridges. Also, they do notresemble volcanic suites from island arc environments.Chemical and spectrographic analyses of this rock confirmits unusual nature (see Table 3). Lamprophyres areordinarily found as dikes or sills of limited extent.
Due to limited space, the tables of grain size, carbon-carbonate, X-ray, and pH and salinity are presented withthe data of other sites in Appendices I, II, III, and IV,respectively, at the end of the volume.
BIOSTRATIGRAPHY
Foraminifera
Common planktonic foraminifera of Pleistocene (N.22)age were found in the sediments of Sample 1, CC and rareMiocene-Pliocene species in Sample 2, CC. They are absent,however, in all samples from Cores 3 through 8. Sample9-15 43-45 cm contains rare Oligocene species, but no zonaldetermination was possible. Abundant and well-preservedplanktonics in Sample 10, CC include Globigerinathekatropicalis and Truncorotaloides pseudodubia, indicative oflate Middle Eocene Zone P.M. Planktonic species are alsoabundant in Sample 11-2, 111-113 cm, but preservation ofthese forms is so poor (due to crushing) that only twospecies—Acarinina soldadoensis and Morozovella aragon-emis—covλà. be identified that indicate an Early Eocene age.
Deep-water (lower bathyal to abyssal) benthic speciesare present but rare in all samples except those from Cores4 through 7, where foraminifera were completely absent.The indication, thus, is that heavy solution of foraminiferaltests has virtually eliminated fossils from all horizonsexcept Pleistocene and Lower to Middle Eocene.
Nannofossils
Hole 224 was drilled in sediments ranging in age fromPleistocene to middle Early Eocene which are underlain
'R. G. Coleman.
387
SITE 224
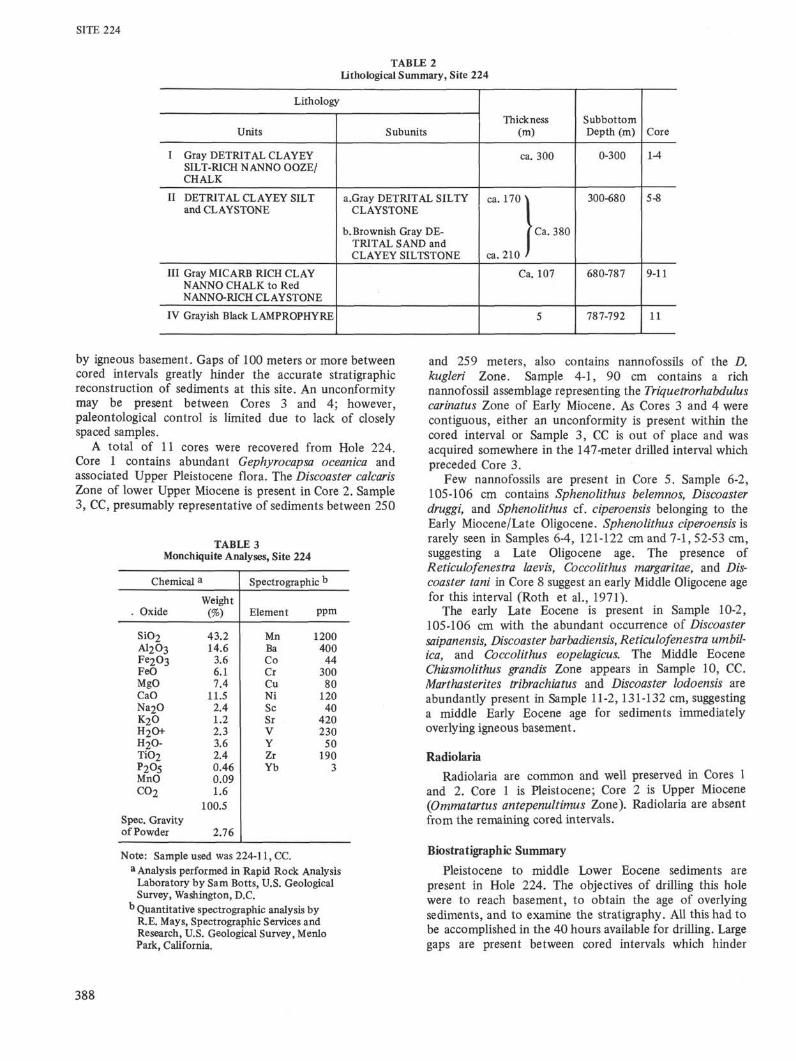
TABLE 2Iithological Summary, Site 224
Lithology
Units
I Gray DETRITAL CLAYEYSILT-RICH NANNO OOZE/CHALK
II DETRITAL CLAYEY SILTand CLAYSTONE
III Gray MICARB RICH CLAYNANNO CHALK to RedNANNO-RICH CLAYSTONE
IV Grayish Black LAMPROPHYRE
Sub units
a.Gray DETRITAL SILTYCLAYSTONE
b. Brownish Gray DE-TRITAL SAND andCLAYEY SILTSTONE
Thickness(m)
ca. 300
ca. 170 \
j Ca. 380
ca. 210 /
Ca. 107
5
SubbottomDepth (m)
0-300
300-680
680-787
787-792
Core
1-4
5-8
9-11
11
by igneous basement. Gaps of 100 meters or more betweencored intervals greatly hinder the accurate stratigraphicreconstruction of sediments at this site. An unconformitymay be present between Cores 3 and 4; however,paleontological control is limited due to lack of closelyspaced samples.
A total of 11 cores were recovered from Hole 224.Core 1 contains abundant Gephyrocapsa oceanica andassociated Upper Pleistocene flora. The Discoaster calcarisZone of lower Upper Miocene is present in Core 2. Sample3, CC, presumably representative of sediments between 250
TABLE 3Monchiquite Analyses, Site 224
Chemical
. Oxide
Siθ2AI2O3Fe 2 θ3FeOMgOCaONa2OK 2 OH2O+H2O-TiO2
P2O5MnOC O 2
Spec. Gravityof Powder
a
Weight(%)
43.214.6
3.66.17.4
11.52.41.22.33.6
2.40.460.091.6
100.5
2.76
Spectrographic b
Element
MnBaCoCrCuNiSeSrVY
ZrYb
ppm
1200400
44300
80120
40420230
50190
3
Note: Sample used was 224-11, CC.a Analysis performed in Rapid Rock Analysis
Laboratory by Sam Botts, U.S. GeologicalSurvey, Washington, D.C.
b Quantitative spectrographic analysis byR.E. Mays, Spectrographic Services andResearch, U.S. Geological Survey, MenloPark, California.
and 259 meters, also contains nannofossils of the D.kugleri Zone. Sample 4-1, 90 cm contains a richnannofossil assemblage representing the Triquetrorhabduluscarinatus Zone of Early Miocene. As Cores 3 and 4 werecontiguous, either an unconformity is present within thecored interval or Sample 3, CC is out of place and wasacquired somewhere in the 147-meter drilled interval whichpreceded Core 3.
Few nannofossils are present in Core 5. Sample 6-2,105-106 cm contains Sphenolithus belemnos, Discoasterdruggi, and Sphenolithus cf. ciperoensis belonging to theEarly Miocene/Late Oligocene. Sphenolithus ciperoensis israrely seen in Samples 6-4, 121-122 cm and 7-1, 52-53 cm,suggesting a Late Oligocene age. The presence ofReticulofenestra laevis, Coccolithus margaritae, and Dis-coaster tani in Core 8 suggest an early Middle Oligocene agefor this interval (Roth et al., 1971).
The early Late Eocene is present in Sample 10-2,105-106 cm with the abundant occurrence of Discoastersaipanensis, Discoaster barbadiensis, Reticulofenestra umbil-ica, and Coccolithus eopelagicus. The Middle EoceneChiasmolithus grandis Zone appears in Sample 10, CC.Marthasterites tribrachiatus and Discoaster lodoensis areabundantly present in Sample 11-2, 131-132 cm, suggestinga middle Early Eocene age for sediments immediatelyoverlying igneous basement.
Radiolaria
Radiolaria are common and well preserved in Cores 1and 2. Core 1 is Pleistocene; Core 2 is Upper Miocene(Ommatartus antepenultimus Zone). Radiolaria are absentfrom the remaining cored intervals.
Biostratigraphic Summary
Pleistocene to middle Lower Eocene sediments arepresent in Hole 224. The objectives of drilling this holewere to reach basement, to obtain the age of overlyingsediments, and to examine the stratigraphy. All this had tobe accomplished in the 40 hours available for drilling. Largegaps are present between cored intervals which hinder
388

SITE 224
proper stratigraphic reconstruction. An age of 51.5 m.y. isassigned to the oldest sediments penetrated in Hole 224.
The Late Pleistocene is well represented in Core 1 (0 to9 m) by abundant planktonic foraminifera (Zone N.22),nannofossils (Gephyrocapsa oceanica Zone), and Radio-laria. Abundant well-preserved Radiolaria belonging to theOmmatartus antepenultimus Zone are present in Core 2(103 m). Abundant nannofossils of the Discoaster calcarisZone and rare lower bathyal to (abyssal?) benthonicforaminifera are also present. An early Late Miocene age isassigned to sediments recovered in Core 2.
Core 3 (250 to 259 m) contains abundant nannofossils ofthe D. kugleri Zone, as well as Discoaster exilis whichrepresents older strata approaching the Discoaster exilisZone of the lower Middle Miocene. Planktonic foraminiferaare absent from Core 3, and Radiolaria are absent fromCore 3 and the remaining cored intervals.
Abundant nannofossils of the Triquetrorhabduluscarinatus Zone are present in Sample 4-1, 90 cm (268meters), and an Early Miocene age is assigned to thesesediments. An unconformity seems to be present betweenCores 3 and 4 as evidenced by the absence of at least fournannofossil zones ranging in age of from early MiddleMiocene (Discoaster exilis Zone) to early Early Miocene(Discoaster druggi Zone). However, the lack of adequatepaleontological control below Core 4 does not provideconcrete evidence for its existence, but there is seismicevidence for an unconformity of about this age (seeDiscussion, Conclusions, this chapter). As the sediments ofSample 3, CC may have entered the core barrel higher in thehole, due to the long drilled interval of 147 meters betweenCores 2 and 3, this may be still another explanation for themissing interval. Foraminifera were not noted in Core 4.Core 5 contains a few nondiagnostic nannofossils, probablyof Early Miocene age. Foraminifera are also absent in Cores5, 6, and 7. Sample 6-2, 105-106 cm contains sparseDiscoaster druggi, Sphenolithus belemnos, and Spheno-lithus cf. ciperoensis, which are of either earliest Miocene orlatest Oligocene age.
Samples 6-4, 121-122 cm and 7-1, 52-53 cm (580meters) contains a few nannofossils with very rareSphenolithus ciperoensis belonging to the Late Oligocene.The presence of clay stone in Cores 5, 6, and 7 may indicatesedimentary deposition very near or below the nannofossilcompensation depth as verified by the general lack ofdiagnostic nannofossils and the complete absence offoraminifera. Core 8 contains a lower Middle Oligoceneassemblage of nannofossils. Core 9 contains very rareOligocene foraminifera. The presence of Cyclococcolithusformosus, rare Helicopontosphaera reticulata, and rarefragments of Sphenolithus predistentus suggest a late EarlyOligocene age for sediments in Core 9.
The lower Upper Eocene is well represented in Sample10-2, 105-106 cm with an abundant nannofossil assemblagecontaining Discoaster saipanensis, Discoaster barbadiensis,and Reticulofenestra umbilica. The Middle EoceneChiasmolithus grandis Zone appears in Sample 10, CC.Abundant foraminifera belonging to Zone P. 14 are alsopresent in Sample 10, CC. Sample 11-2, 131-132 cm and asample taken at the sediment-lamprophyre contact containvery abundant nannofossils of the Marthasterites tribrach-
iatus Zone of middle Early Eocene. Abundant planktonicforaminifera in Sample 11-2,111-113 cm also belong to theEarly Eocene.
Sedimentation Rate
The lowest samples recovered at this site, in Core 11,contain faunas of Early Eocene age. Middle Eocene fossilsare present, however, in Core 11, Section 1; if this sedimentis in place, a minor unconformity is present betweenSections 1 and 2 of this core.
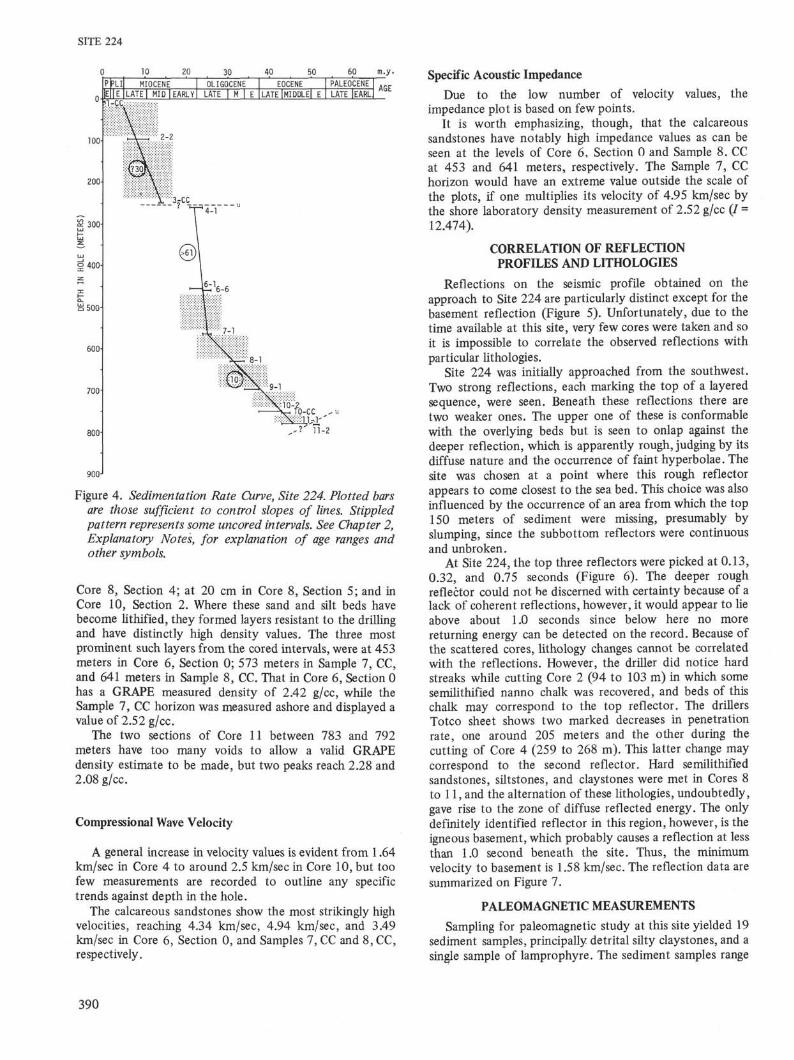
Middle Eocene to Lower Oligocene sediments (630 to780 m) accumulated at the relatively slow rate of 10m/m.y. (see Figure 4). This rate increased markedly duringthe Late Oligocene, to over 61 m/m.y. (255 to 570 m). Thediscrepancy in age between sediments in Cores 3 and 4suggests an unconformity representing most of the EarlyMiocene at about 255 meters, but this may be artificial iffloras in Sample 3, CC were emplaced by contaminationduring the long drilling period between recovery of Cores 2and 3.
Little sediment was recovered from the upper 250meters penetrated at this site, and it is not possible toprecisely determine a sedimentation rate for the interval.An unconformity near the top of the hole is indicated byseismic evidence of a missing 150-meter-thick layerremoved by slumping, but there is no way of determiningits age from the available samples. If there has been littlesediment accumulation since the slumping, then thesedimentation rate line can be projected to pass through apoint 150 meters above the sea bed. In this manner a meanMiddle to Late Miocene rate of about 30 m/m.y. is obtained.
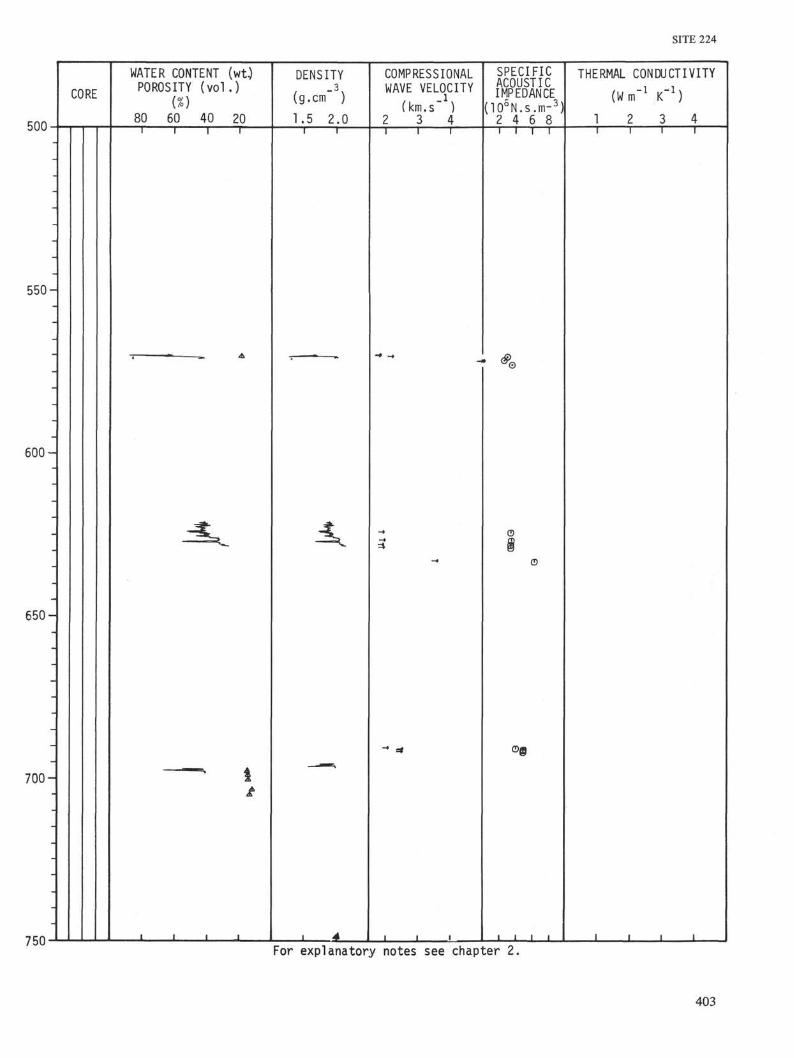
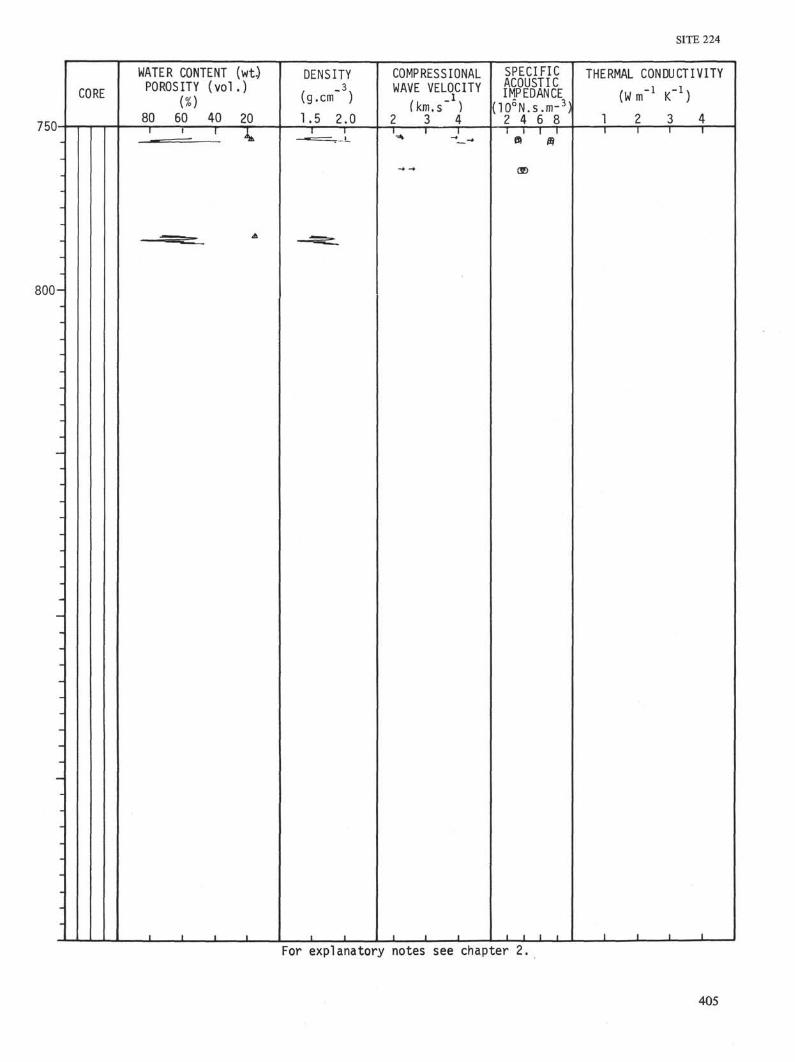
PHYSICAL PROPERTIES
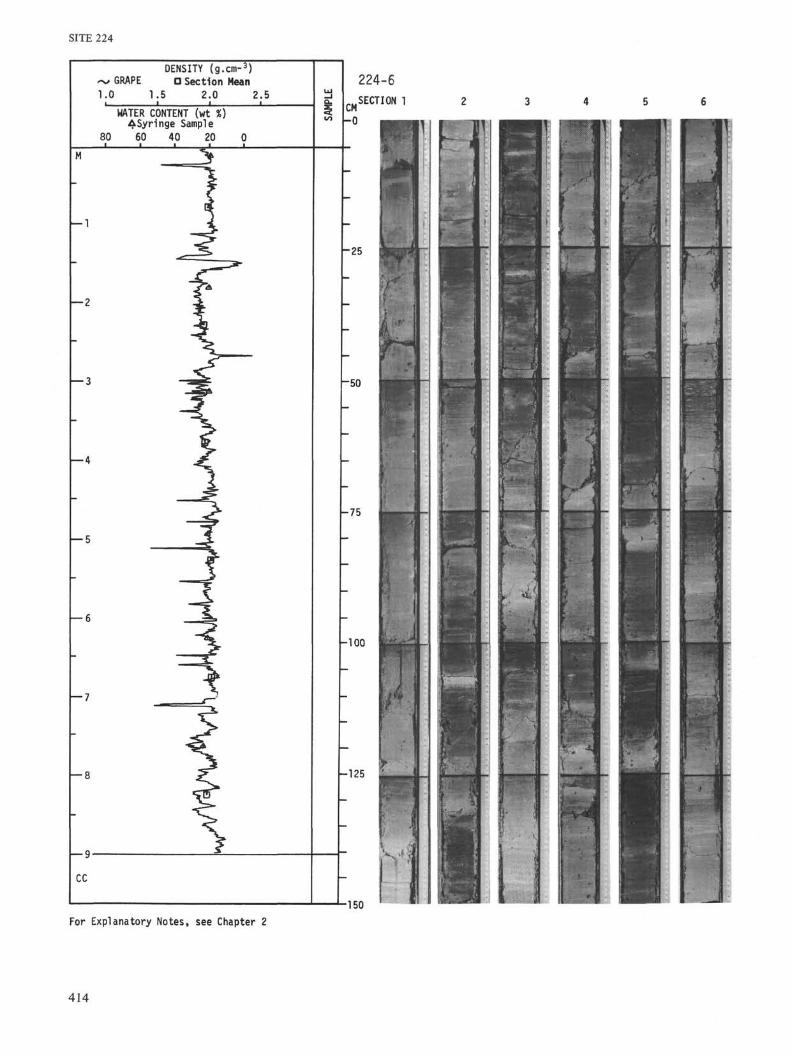
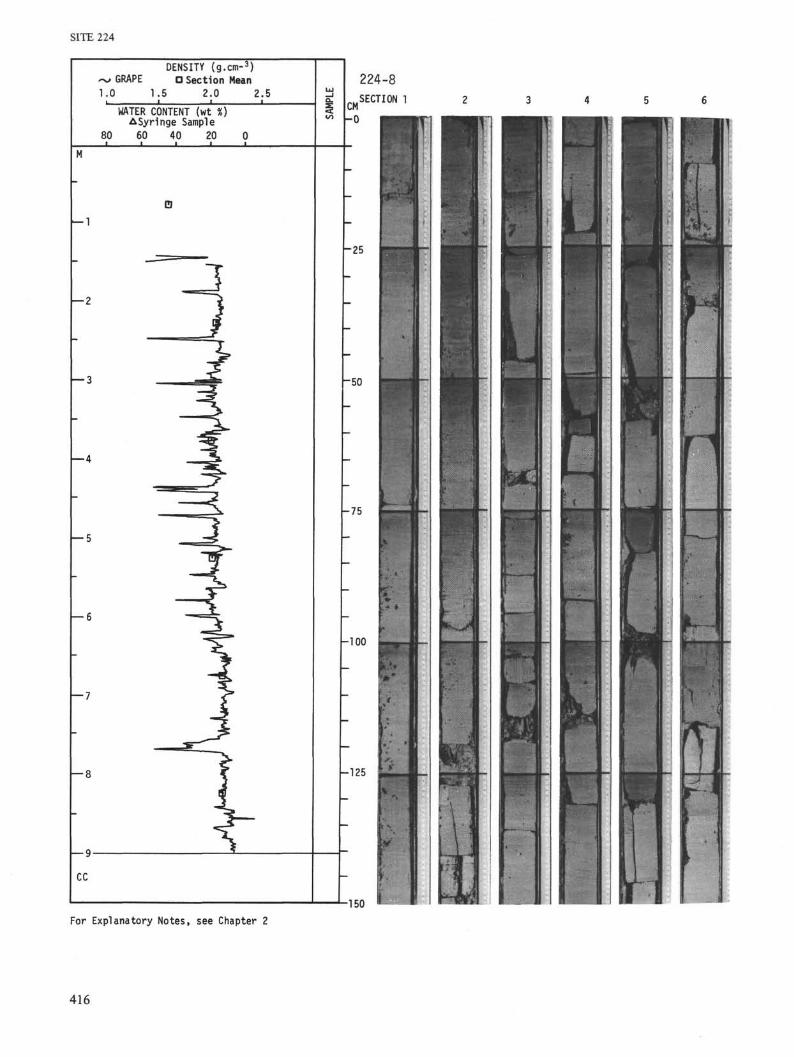
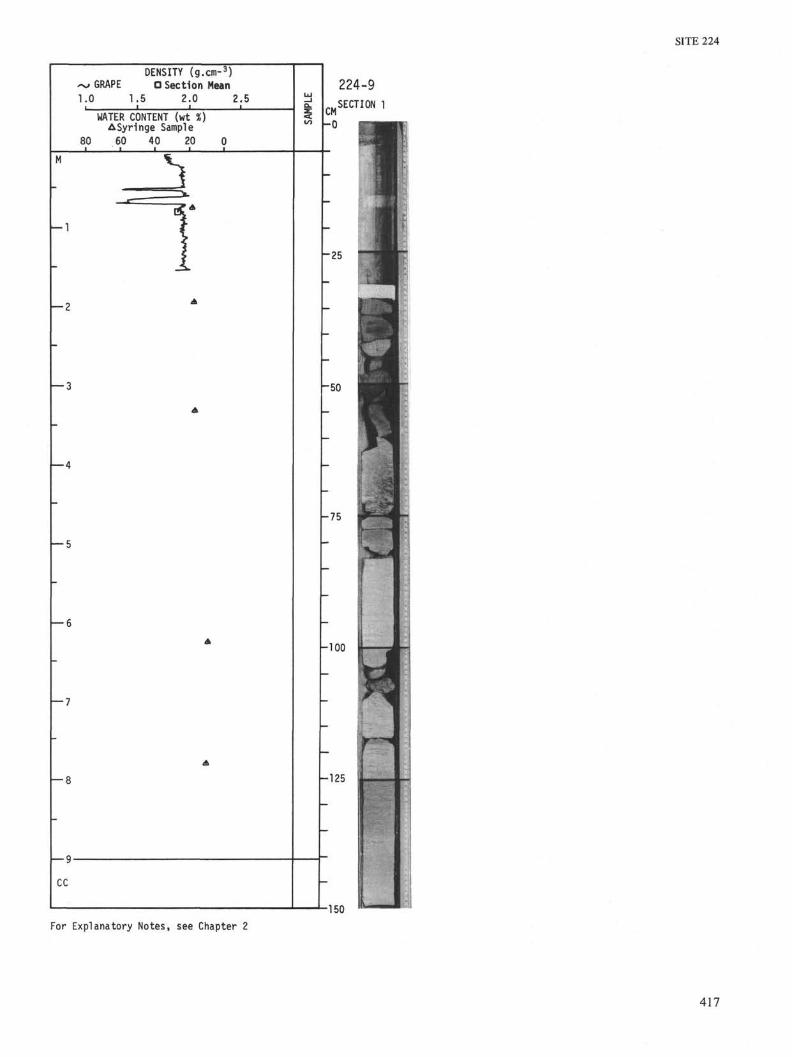
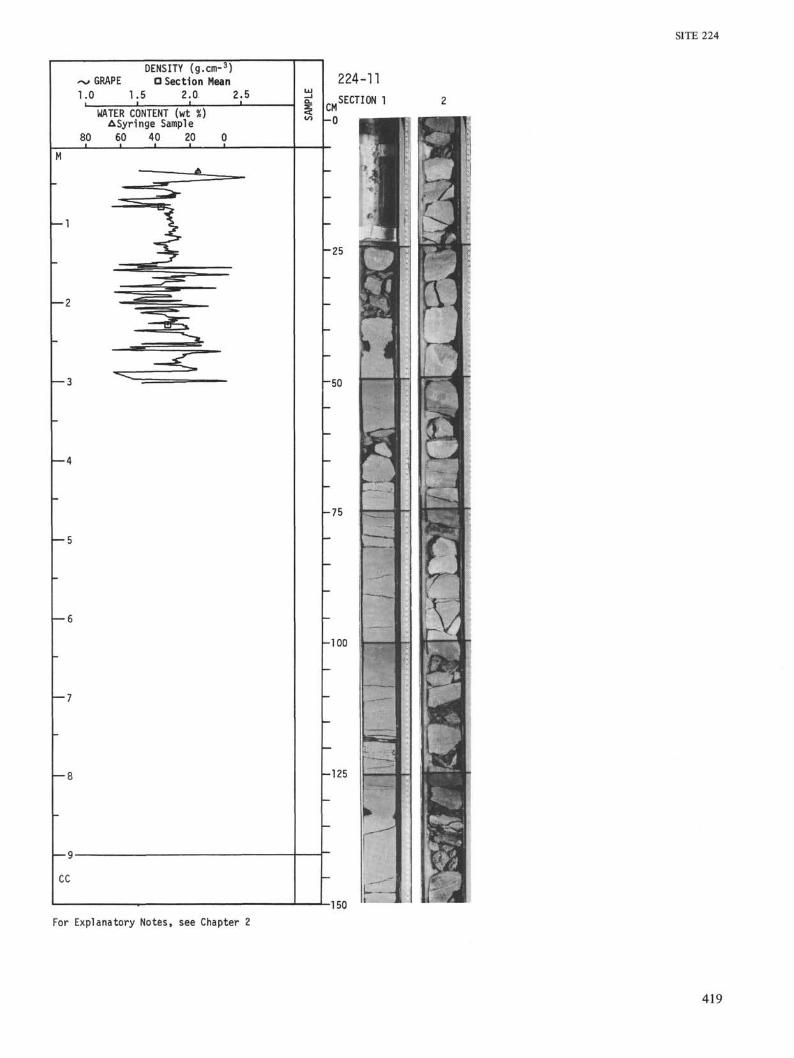
Since only eleven cores were recovered from this siteover a penetrated interval of 792 meters the Site Summarydisplays little data for general interpretation. However, anumber of features from the core logs are worthy ofconsideration.
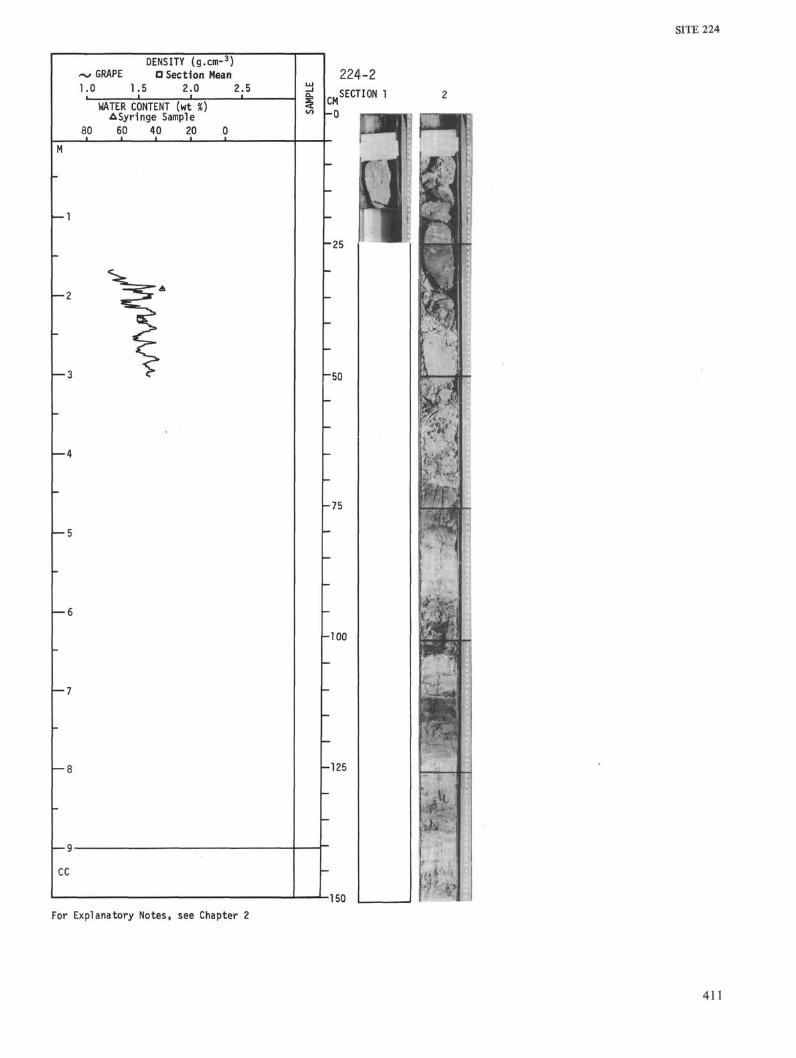
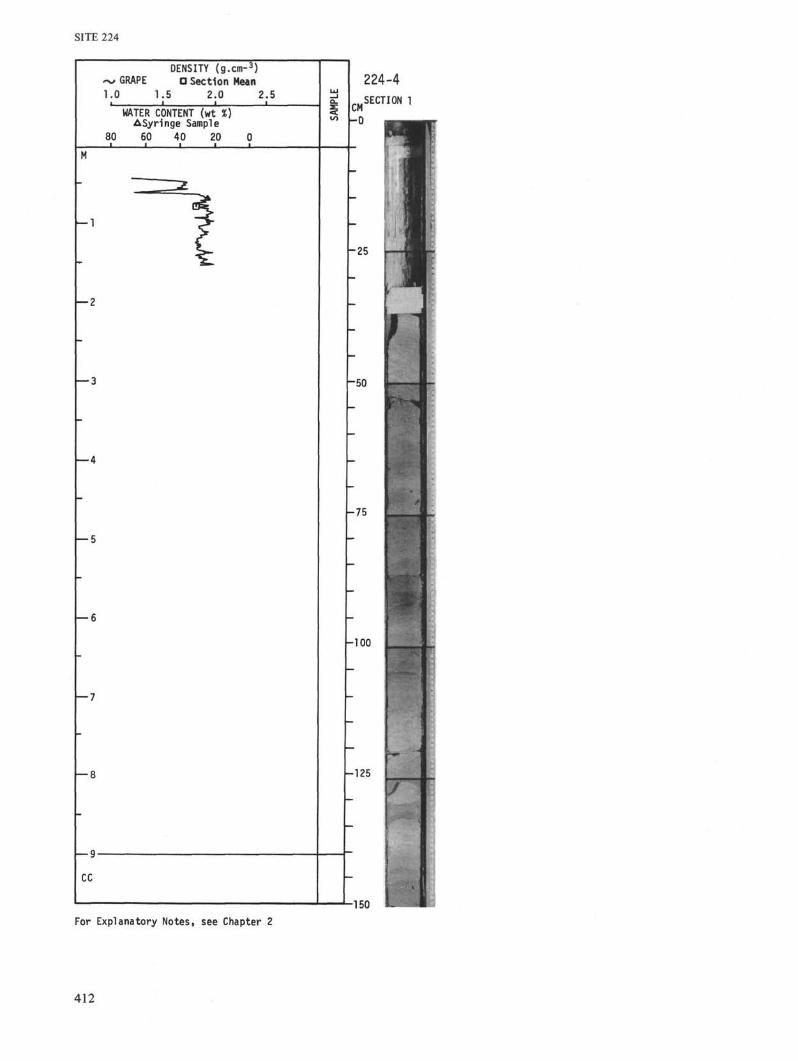
Sediment Density, Porosity, and Water Content
GRAPE density values show a general increase in densitywith depth over the top four cores, which may be related tothe progressive lithologic increase in detrital silt contentover this unit I interval.
The remainder of the sedimentary sequence shows afairly constant GRAPE density level with a number ofprominent fluctuations away from the general level.
In more detail, the core logs show that the gradientnoted in unit I may be made up of a number of short stepincreases in density; for example, one step in Core 4,Section 1 results in a rise from 1.68 g/cc to 1.88 g/cc. Also,there is a fairly strong density contrast between Core 2,with values between 1.5 and 1.6 g/cc (excluding voids), andCore 4, at around 1.7 g/cc. The variability evident in thedensity plot of Core 2 is not wholly due to voids. Theindividual low GRAPE values may be caused by thepresence of beds containing opaline silica.
Over the interval of Cores 5 to 10, sand and silt bedscause peaks in the density plot to over 2.1 g/cc; forexample, at the boundary between the upper two sectionsof Core 6; at 120 cm in Core 8, Section 2; at 110 cm in
389
SITE 224
o 10 20 30 40 50 60 m.y.
P 3LI MIOCENE OLIGOCENE EOCENE PALEOCENELATE | MID | EARLY| LATE 1 M [ E 1 LATE [ M I D D L E T E f LATE |EARL.
AGE
100
200i
2; 3 0 °
400
1500
600-
700-
800-
900-1
Figure 4. Sedimentation Rate Curve, Site 224. Plotted barsare those sufficient to control slopes of lines. Stippledpattern represents some uncored intervals. See Chapter 2,Explanatory Notes, for explanation of age ranges andother symbols.
Core 8, Section 4; at 20 cm in Core 8, Section 5; and inCore 10, Section 2. Where these sand and silt beds havebecome lithified, they formed layers resistant to the drillingand have distinctly high density values. The three mostprominent such layers from the cored intervals, were at 453meters in Core 6, Section 0; 573 meters in Sample 7, CC,and 641 meters in Sample 8, CC. That in Core 6, Section 0has a GRAPE measured density of 2.42 g/cc, while theSample 7, CC horizon was measured ashore and displayed avalue of 2.52 g/cc.
The two sections of Core 11 between 783 and 792meters have too many voids to allow a valid GRAPEdensity estimate to be made, but two peaks reach 2.28 and2.08 g/cc.
Compressional Wave Velocity
A general increase in velocity values is evident from 1.64km/sec in Core 4 to around 2.5 km/sec in Core 10, but toofew measurements are recorded to outline any specifictrends against depth in the hole.
The calcareous sandstones show the most strikingly highvelocities, reaching 4.34 km/sec, 4.94 km/sec, and 3.49km/sec in Core 6, Section 0, and Samples 7, CC and 8, CC,respectively.
Specific Acoustic Impedance
Due to the low number of velocity values, theimpedance plot is based on few points.
It is worth emphasizing, though, that the calcareoussandstones have notably high impedance values as can beseen at the levels of Core 6, Section 0 and Sample 8, CCat 453 and 641 meters, respectively. The Sample 7, CChorizon would have an extreme value outside the scale ofthe plots, if one multiplies its velocity of 4.95 km/sec bythe shore laboratory density measurement of 2.52 g/cc (/ =12.474).
CORRELATION OF REFLECTIONPROFILES AND LITHOLOGIES
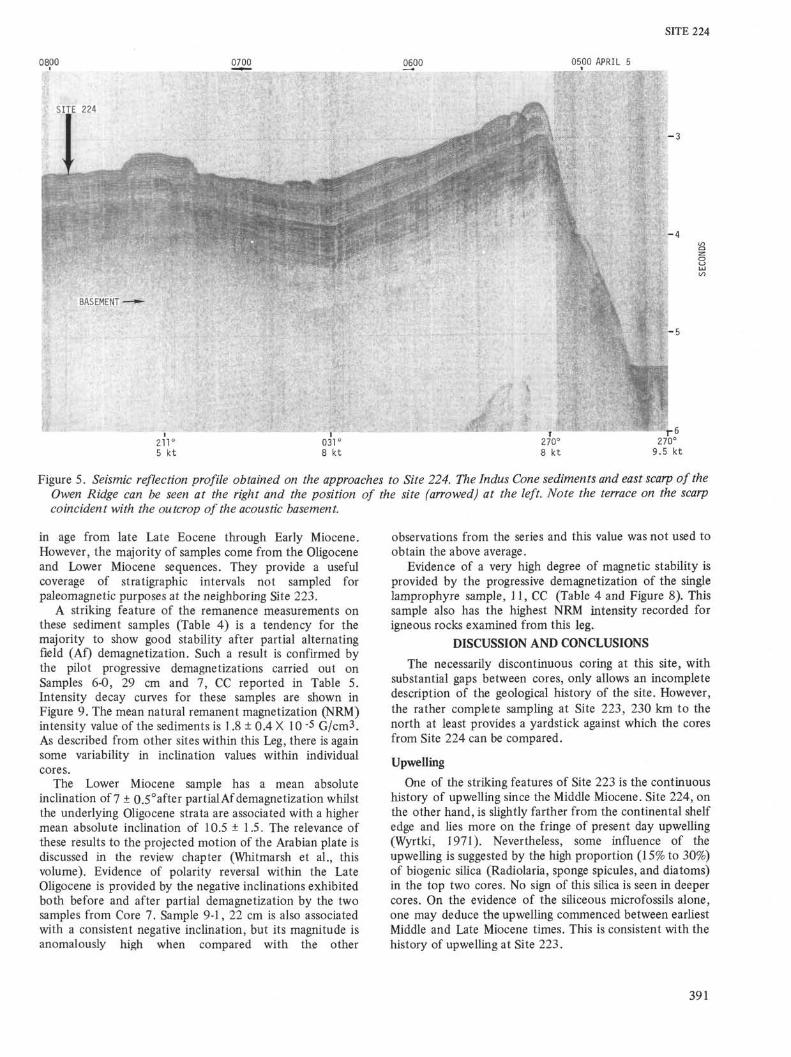
Reflections on the seismic profile obtained on theapproach to Site 224 are particularly distinct except for thebasement reflection (Figure 5). Unfortunately, due to thetime available at this site, very few cores were taken and soit is impossible to correlate the observed reflections withparticular lithologies.
Site 224 was initially approached from the southwest.Two strong reflections, each marking the top of a layeredsequence, were seen. Beneath these reflections there aretwo weaker ones. The upper one of these is conformablewith the overlying beds but is seen to onlap against thedeeper reflection, which is apparently rough, judging by itsdiffuse nature and the occurrence of faint hyperbolae. Thesite was chosen at a point where this rough reflectorappears to come closest to the sea bed. This choice was alsoinfluenced by the occurrence of an area from which the top150 meters of sediment were missing, presumably byslumping, since the subbottom reflectors were continuousand unbroken.
At Site 224, the top three reflectors were picked at 0.13,0.32, and 0.75 seconds (Figure 6). The deeper roughreflector could not be discerned with certainty because of alack of coherent reflections, however, it would appear to lieabove about 1.0 seconds since below here no morereturning energy can be detected on the record. Because ofthe scattered cores, lithology changes cannot be correlatedwith the reflections. However, the driller did notice hardstreaks while cutting Core 2 (94 to 103 m) in which somesemilithified nanno chalk was recovered, and beds of thischalk may correspond to the top reflector. The drillersTotco sheet shows two marked decreases in penetrationrate, one around 205 meters and the other during thecutting of Core 4 (259 to 268 m). This latter change maycorrespond to the second reflector. Hard semilithifiedsandstones, siltstones, and claystones were met in Cores 8to 11, and the alternation of these lithologies, undoubtedly,gave rise to the zone of diffuse reflected energy. The onlydefinitely identified reflector in this region, however, is theigneous basement, which probably causes a reflection at lessthan 1.0 second beneath the site. Thus, the minimumvelocity to basement is 1.58 km/sec. The reflection data aresummarized on Figure 7.
PALEOMAGNETIC MEASUREMENTS
Sampling for paleomagnetic study at this site yielded 19sediment samples, principally detrital silty claystones, and asingle sample of lamprophyre. The sediment samples range
390
SITE 224
0800 0700 0600 0500 APRIL 5
-3
BASEMENT
-5
211°5 kt
031°8 kt
T270°8 kt
270°9.5 kt
Figure 5. Seismic reflection profile obtained on the approaches to Site 224. The Indus Cone sediments and east scarp of theOwen Ridge can be seen at the right and the position of the site (arrowed) at the left. Note the terrace on the scarpcoincident with the outcrop of the acoustic basement.
in age from late Late Eocene through Early Miocene.However, the majority of samples come from the Oligoceneand Lower Miocene sequences. They provide a usefulcoverage of stratigraphic intervals not sampled forpaleomagnetic purposes at the neighboring Site 223.
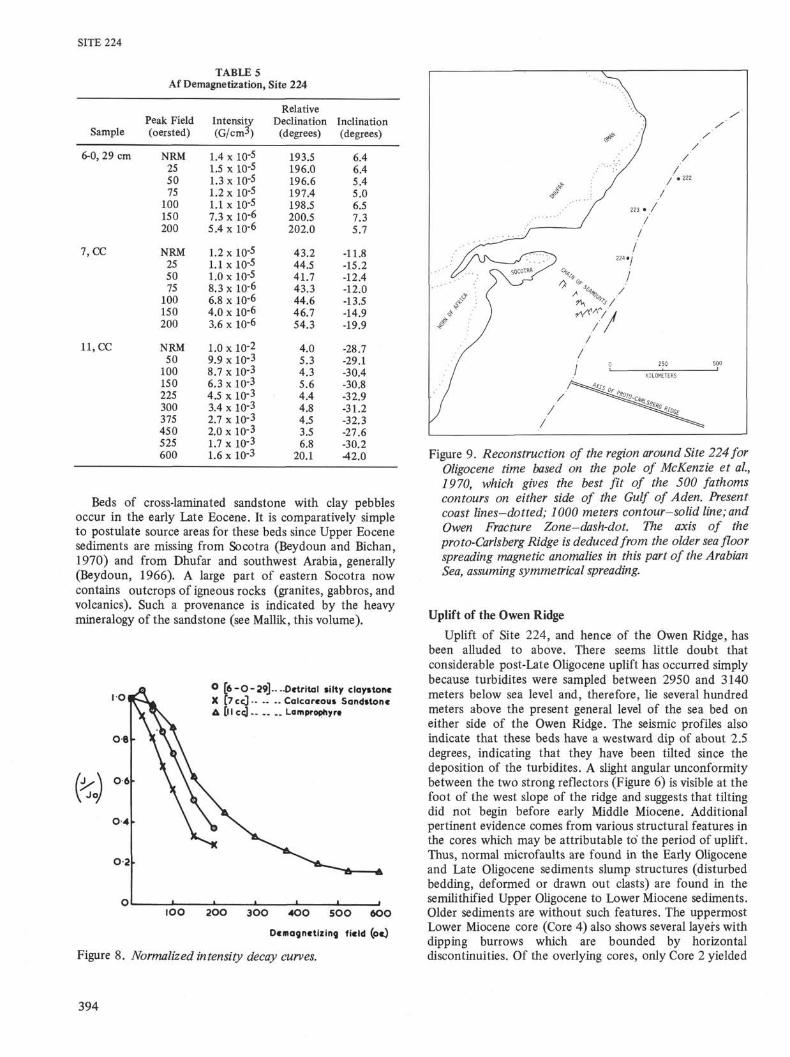
A striking feature of the remanence measurements onthese sediment samples (Table 4) is a tendency for themajority to show good stability after partial alternatingfield (Af) demagnetization. Such a result is confirmed bythe pilot progressive demagnetizations carried out onSamples 6-0, 29 cm and 7, CC reported in Table 5.Intensity decay curves for these samples are shown inFigure 9. The mean natural remanent magnetization (NRM)intensity value of the sediments is 1.8 ± 0.4 × 10 •5 G/cm3.As described from other sites within this Leg, there is againsome variability in inclination values within individualcores.
The Lower Miocene sample has a mean absoluteinclination of 7 ± O.5°after partial Af demagnetization whilstthe underlying Oligocene strata are associated with a highermean absolute inclination of 10.5 ±1.5. The relevance ofthese results to the projected motion of the Arabian plate isdiscussed in the review chapter (Whitmarsh et al., thisvolume). Evidence of polarity reversal within the LateOligocene is provided by the negative inclinations exhibitedboth before and after partial demagnetization by the twosamples from Core 7. Sample 9-1, 22 cm is also associatedwith a consistent negative inclination, but its magnitude isanomalously high when compared with the other
observations from the series and this value was not used toobtain the above average.
Evidence of a very high degree of magnetic stability isprovided by the progressive demagnetization of the singlelamprophyre sample, 11, CC (Table 4 and Figure 8). Thissample also has the highest NRM intensity recorded forigneous rocks examined from this leg.
DISCUSSION AND CONCLUSIONS
The necessarily discontinuous coring at this site, withsubstantial gaps between cores, only allows an incompletedescription of the geological history of the site. However,the rather complete sampling at Site 223, 230 km to thenorth at least provides a yardstick against which the coresfrom Site 224 can be compared.
Upwelling
One of the striking features of Site 223 is the continuoushistory of upwelling since the Middle Miocene. Site 224, onthe other hand, is slightly farther from the continental shelfedge and lies more on the fringe of present day upwelling(Wyrtki, 1971). Nevertheless, some influence of theupwelling is suggested by the high proportion (15% to 30%)of biogenic silica (Radiolaria, sponge spicules, and diatoms)in the top two cores. No sign of this silica is seen in deepercores. On the evidence of the siliceous microfossils alone,one may deduce the upwelling commenced between earliestMiddle and Late Miocene times. This is consistent with thehistory of upwelling at Site 223.
391

SITE 224
0805 Hrs.
Glomar Challenger 23April 5, 1972Edo 2 Roll 6 0730 Hrs. SOUTHWEST NORTHEAST
_ A
— -
*x
B
./
STRONG REFLECTORSX
ROUGH REFLECTOR
KILOMETERS
3.0
-3.1
3.2
3.3
3.4
3.5
3.6
3.7
3.8
|LULO
3.9
4.1
4.2
4.3
4.4
4.5
4.6
4.7
Figure 6. (a). Seismic reflection profile obtained on the final approach to Site 224. The vertical line marks the position of thedrilled hole. (b). The interpretation of Figure 6a was used to construct Figure 7. The vertical line has 0.1 second divisions.
Terrigenous Sediments
Perhaps the most marked feature of Site 224 is theroughly 400-meter-thick Middle Oligocene Lower Mioceneinterval of detrital clayey silt and clay stone. Not only arethe cores from this section estimated to contain close to100 percent detrital material but also in the deeper Upperto Middle Oligocene part of the stratigraphic section, thereare graded silt and sand beds. The sedimentation rate formost of this interval is high (at least 61 m/m.y.), and thecarbonate content is very low (2% to 14%). Foraminiferaare absent and even nannofossils are rare in the section. Therarity of nannofossils, and the relative amounts ofplanktonic and benthic foraminifera in cores just above andbelow this interval, suggest that the sea bed was close to, orjust below, the calcium carbonate compensation depth atthis time. However, nannofossils are sometimes found inthe section, but with a restricted occurrence. In the toppart of the section, bluish chalk layers rich in nannofossils
are found, and in the lower part, a few nannofossils occurin isolated beds.
Studies of the heavy mineralogy of the graded beds(Mallik; Jipa and Kidd; this volume) suggest a metamorphicand acid igneous provenance. Many grains are well rounded,which is indicative of a long transportation history. It isinteresting to consider what was the likely source region forthe detrital sediment and in particular for the graded beds.Since detrital sediments are absent from the Oligocenesediments of Site 223, it appears that a northern source forthe heavy minerals can be ruled out. In Oligocene time, seafloor spreading between Arabia and Somalia had not yetbegun, and the proto-Gulf of Aden was probably a narrowshallow sea. On the other hand, there would probably havebeen an almost complete semicircle of shallow seas or landto the west of Site 224 (Figure 9). It is to these areas thatwe should look for signs of unconformities or nondeposi-tion in the Oligocene which would indicate a likely sourcearea of detrital sediments. In Dhufar, the Oligocene and
392

DEPTH, METERS300 400 500
Figure 7. Plot of reflection times beneath Site 224 againstthe depths where significant changes in bit penetrationoccurred. Lines have been drawn with slopescorresponding to mean velocities of 1.5, 1.6,1.7 and 1.8km/sec.
SITE 224
Miocene are represented by a thick chalky limestone(Beydoun, 1966) and, similarly, 50 meters of Oligocenechalk with signs of contemporaneous vertical movementsare found in Socotra (Beydoun and Bichan, 1970). Farthereast, the Oligocene history is less clear. Powers et al.(1966), without specifying the boreholes, state that drillingthroughout Saudi Arabia has failed to detect Upper Eoceneor Oligocene sediments, except near Jordan. At Duqm, inthe Gulf of Masirah, there are 170 meters of chalkyOligocene limestones exposed, and the Upper Oligocene issaid to extend far to the west (Morton, 1959).Shallow-water limestones are also known in the Oligoceneof Oman (Henson, 1951). Thus, at the present state ofknowledge, it seems unlikely that either Socotra or theDhufar-Oman coast of Arabia could have been the sourceareas of the Oligocene detrital sediments found at Site 224.It may be significant that Oligocene elastics (quartzsandstones) are found along the Gulf of Aden and IndianOcean coasts of the Horn of Africa. The source area isbelieved to have been to the west (Azzaroli and Fois,1964). An equally close source of detrital material may,however, have been the mouth of a large river in thenorth-west part of peninsular India. Accepting theEarly /Middle Miocene uplift of the Owen Ridge (see belowand Chapter 7), this feature may not have existed inOligocene time to prevent turbidites from the east crossingthe Owen Fracture Zone. Nevertheless, the trough or trenchof the then active Owen Fracture Zone would itself havebeen a formidable barrier to turbidites, and it appears morelikely that the detrital source lay to the west in the nowsubmerged shallow areas of unknown geology aroundSocotra or along the Arabian coast, or else it lay along theproto-Gulf of Aden.
TABLE 4Summary of Magnetic Data
Sample(Interval in cm)
Sediments
4-1,1486-0,296-1, 636-3,906-4, 1426-5, 846-6,1017-1,477,CC8-1, 628-1, 748-3, 628-4, 728-5,188-5,728-6, 729-1, 2210-2, 910-2,144
Basalts
ll .CC
Intensity(G/cm3)
2.3 x 10-51.4 x 10-52.1 x 10-54.1 x 10-72.5 x I0"6
2.0 x 10-61.2 x 10-51.9 x 10-51.2 x I0"5
8.2 x I0"5
1.9 x 10"52.5 x I0"5
9.1 x I0"6
3.8 x I0"5
2.4 x 10-61.2 x I0-5
2.4 x 10-51.2 x 10-59.3 x 10-6
LO x 10-2
NRM
RelativeDeclination
(degrees)
135.9193.5282.7104.888.3
349.473.337.943.2
271.147.6
138.914.439.8
191.49.3
293.6356.8145.0
4.0
Inclination(degrees)
1.06.4
-6.931.612.928.7-1.24 . 3
-11.817.221.012.28.7
19.117.1
1.7-58.2
9.913.0
-28.7
Peak Field(oersted)
50505050505050505050505050505050505050
100
Af demagnetization
Intensity(G/cm3)
2.4 x 10-51.4 x I0"5
2.0 x I0"5
2.8 x 10-71.4 x I0"6
1.7 x I0"6
9.1 x 10-61.6 x I0"6
1.0 x 10-58.1 x 10-51.7 x 10-52.5 x I0'5
8.0 x I0-6
2.7 x 10-53.9 x 10-61.1 x 10-52.2 x 10-53.4 x 10-69.3 x I0"6
8.7 x 10⁻³
RelativeDeclination
(degrees)
135.3196.6281.9107.490.9
294.998.739.441.7
272.248.6
141.017.278.1
198.211.8
278.771.3
148.9
4.3
Inclination(degrees)
- 7.55.4
- 4.413.67.3
10.82.0
- 8.1-12.416.320.7
9.910.218.116.8
- 1.2-78.239.74.9
-30.4
393
SITE 224
TABLE 5Af Demagnetization, Site 224
Sample
6-0, 29 cm
7,CC
11, CC
Peak Field(oersted)
NRM255075
100150200
NRM255075
100150200
NRM50
100150225300375450525600
Intensity(G/cm3)
1.4 x I0"5
1.5 x 10-51.3 x 10-51.2 x 10-51.1 x I0"5
7.3 x 10-65.4 x 10-6
1.2x10-51.1x10-51.0 x 10-58.3 x I0" 6
6.8 x 10-64.0 x I0-6
3.6 x 10⁻⁶
1.0x10-29.9 x 10-38.7 x 10-36.3x10-34.5 x I0" 3
3.4 x I0-3
2.7 x 10-32.0 x I0" 3
1.7 x 10-31.6 x I0"3
RelativeDeclination
(degrees)
193.5196.0196.6197.4198.5200.5202.0
43.244.541.743.344.646.754.3
4.05.34.35.64.44.84.53.56.8
20.1
Inclination(degrees)
6.46.45.45.06.57.35.7
-11.8-15.2-12.4-12.0-13.5-14.9-19.9
-28.7-29.1-30.4-30.8-32.9-31.2-32.3-27.6-30.242.0
Beds of cross-laminated sandstone with clay pebblesoccur in the early Late Eocene. It is comparatively simpleto postulate source areas for these beds since Upper Eocenesediments are missing from Socotra (Beydoun and Bichan,1970) and from Dhufar and southwest Arabia, generally(Beydoun, 1966). A large part of eastern Socotra nowcontains outcrops of igneous rocks (granites, gabbros, andvoleanics). Such a provenance is indicated by the heavymineralogy of the sandstone (see Mallik, this volume).
O [6-O-29j~~Detritαl silty clαystoneX [7cc] Calcareous SandstoneA [ll c<j- .. .. Lamprophyrt
100 2OO 3OO 4OO 5OO 6OO
Demagnetizing field (oe)
Figure 8. Normalized intensity decay curves.
Figure 9. Reconstruction of the region around Site 224 forOligocene time based on the pole of McKenzie et al,1970, which gives the best fit of the 500 fathomscontours on either side of the Gulf of Aden. Presentcoast lines-dotted; 1000 meters contour-solid line; andOwen Fracture Zone-dash-dot. The axis of theproto-Carlsberg Ridge is deduced from the older seafloorspreading magnetic anomalies in this part of the ArabianSea, assuming symmetrical spreading.
Uplift of the Owen Ridge
Uplift of Site 224, and hence of the Owen Ridge, hasbeen alluded to above. There seems little doubt thatconsiderable post-Late Oligocene uplift has occurred simplybecause turbidites were sampled between 2950 and 3140meters below sea level and, therefore, lie several hundredmeters above the present general level of the sea bed oneither side of the Owen Ridge. The seismic profiles alsoindicate that these beds have a westward dip of about 2.5degrees, indicating that they have been tilted since thedeposition of the turbidites. A slight angular unconformitybetween the two strong reflectors (Figure 6) is visible at thefoot of the west slope of the ridge and suggests that tiltingdid not begin before early Middle Miocene. Additionalpertinent evidence comes from various structural features inthe cores which may be attributable to'the period of uplift.Thus, normal microfaults are found in the Early Oligoceneand Late Oligocene sediments slump structures (disturbedbedding, deformed or drawn out clasts) are found in thesemilithified Upper Oligocene to Lower Miocene sediments.Older sediments are without such features. The uppermostLower Miocene core (Core 4) also shows several layers withdipping burrows which are bounded by horizontaldiscontinuities. Of the overlying cores, only Core 2 yielded
394
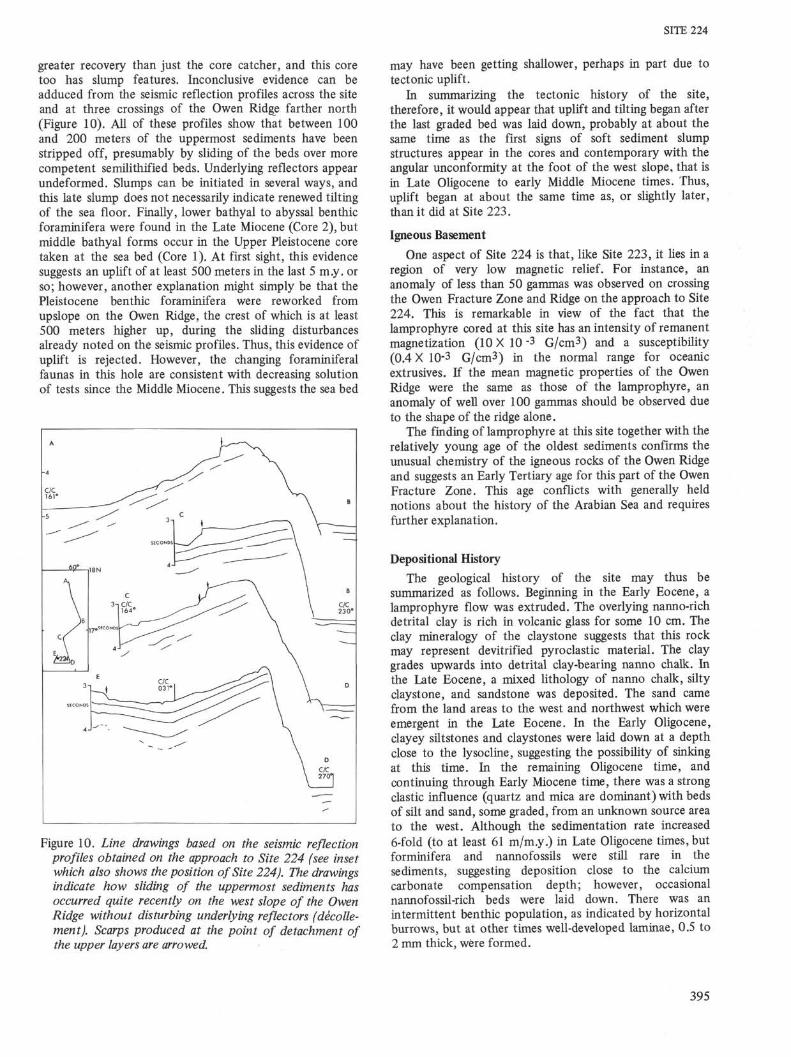
SITE 224
greater recovery than just the core catcher, and this coretoo has slump features. Inconclusive evidence can beadduced from the seismic reflection profiles across the siteand at three crossings of the Owen Ridge farther north(Figure 10). All of these profiles show that between 100and 200 meters of the uppermost sediments have beenstripped off, presumably by sliding of the beds over morecompetent semilithified beds. Underlying reflectors appearundeformed. Slumps can be initiated in several ways, andthis late slump does not necessarily indicate renewed tiltingof the sea floor. Finally, lower bathyal to abyssal benthicforaminifera were found in the Late Miocene (Core 2), butmiddle bathyal forms occur in the Upper Pleistocene coretaken at the sea bed (Core 1). At first sight, this evidencesuggests an uplift of at least 500 meters in the last 5 m.y. orso; however, another explanation might simply be that thePleistocene benthic foraminifera were reworked fromupslope on the Owen Ridge, the crest of which is at least500 meters higher up, during the sliding disturbancesalready noted on the seismic profiles. Thus, this evidence ofuplift is rejected. However, the changing foraminiferalfaunas in this hole are consistent with decreasing solutionof tests since the Middle Miocene. This suggests the sea bed
Figure 10. Line drawings based on the seismic reflectionprofiles obtained on the approach to Site 224 (see insetwhich also shows the position of Site 224). The drawingsindicate how sliding of the uppermost sediments hasoccurred quite recently on the west slope of the OwenRidge without disturbing underlying reflectors (décolle-ment). Scarps produced at the point of detachment ofthe upper layers are arrowed.
may have been getting shallower, perhaps in part due totectonic uplift.
In summarizing the tectonic history of the site,therefore, it would appear that uplift and tilting began afterthe last graded bed was laid down, probably at about thesame time as the first signs of soft sediment slumpstructures appear in the cores and contemporary with theangular unconformity at the foot of the west slope, that isin Late Oligocene to early Middle Miocene times. Thus,uplift began at about the same time as, or slightly later,than it did at Site 223.
Igneous Basement
One aspect of Site 224 is that, like Site 223, it lies in aregion of very low magnetic relief. For instance, ananomaly of less than 50 gammas was observed on crossingthe Owen Fracture Zone and Ridge on the approach to Site224. This is remarkable in view of the fact that thelamprophyre cored at this site has an intensity of remanentmagnetization (10 × 10 "3 G/cm3) and a susceptibility(0.4 X I0"3 G/cm3) in the normal range for oceanicextrusives. If the mean magnetic properties of the OwenRidge were the same as those of the lamprophyre, ananomaly of well over 100 gammas should be observed dueto the shape of the ridge alone.
The finding of lamprophyre at this site together with therelatively young age of the oldest sediments confirms theunusual chemistry of the igneous rocks of the Owen Ridgeand suggests an Early Tertiary age for this part of the OwenFracture Zone. This age conflicts with generally heldnotions about the history of the Arabian Sea and requiresfurther explanation.
Depositional HistoryThe geological history of the site may thus be
summarized as follows. Beginning in the Early Eocene, alamprophyre flow was extruded. The overlying nanno-richdetrital clay is rich in volcanic glass for some 10 cm. Theclay mineralogy of the claystone suggests that this rockmay represent devitrified pyroclastic material. The claygrades upwards into detrital clay-bearing nanno chalk. Inthe Late Eocene, a mixed Lithology of nanno chalk, siltyclaystone, and sandstone was deposited. The sand camefrom the land areas to the west and northwest which wereemergent in the Late Eocene. In the Early Oligocene,clayey siltstones and claystones were laid down at a depthclose to the lysocline, suggesting the possibility of sinkingat this time. In the remaining Oligocene time, andcontinuing through Early Miocene time, there was a strongclastic influence (quartz and mica are dominant) with bedsof silt and sand, some graded, from an unknown source areato the west. Although the sedimentation rate increased6-fold (to at least 61 m/m.y.) in Late Oligocene times, butforminifera and nannofossils were still rare in thesediments, suggesting deposition close to the calciumcarbonate compensation depth; however, occasionalnannofossil-rich beds were laid down. There was anintermittent benthic population, as indicated by horizontalburrows, but at other times well-developed laminae, 0.5 to2 mm thick, were formed.
395

SITE 224
Sometime between Late Oligocene and earliest MiddleMiocene the site began to rise, probably contemporane-ously with post-Early Miocene uplift in Socotra (Beydounand Bichan, 1970) and Arabia (Beydoun, 1966). Subse-quently, the detrital component in the sediments decreased,the sedimentation rate dropped to about 30 m/m.y., andmainly nanno chalk or ooze was laid down. Sometimebetween the early Middle and Late Miocene, biogenic silicabegan to form an appreciable proportion of the sediment,and this probably reflects the onset of monsoonal upwellingalong the South Arabian coast.
As a result of the uplift, the younger sediments weredeformed by slight slumping the older rocks by normalfaulting. In quite recent times 100 to 200-meter-thick bedsof sediment had slid off the west slope of the Owen Ridgewithout disturbing the underlying beds.
REFERENCES
Azzarolli A. and Fois U., 1964. Geological outlines of thenorthern end of the Horn of Africa: Intl. Geol. Cong.,22nd, New Delhi, Proc, pt 4, sec 4.
Beydoun Z.R., 1966. Geology of the Arabian Peninsular,eastern Aden Protectorate and part of Dhufar: U.S.Geol. Surv. Prof. Paper 560-H, p. 49.
Beydoun Z.R. and Bichan H.R., 1970. The geology ofSocotra Island, Gulf of Aden: Quart. J. Geol. Soc, v.125, p. 413-446.
Henson F.R.S., 1951. Observations on the geology andpetroleum occurrences of the Middle East: World Petrol.Cong., 3rd, The Hague, Proc, sec 1, p. 118-140.
Laughton, A.S., Matthews, D.H., and Fisher, R.L., 1971.The structure of the Indian Ocean. In The Sea, Maxwell,A. (Ed.): New York (John Wiley & Sons Inc), v. 4 (2), p.543-586.
McKenzie, D.P., Davies, D., and Molnar, P., 1970. Platetectonics of the Red Sea and East Africa; Nature, v. 226,p. 243-248.
Morton, D.M., 1959. The geology of Oman: World Petrol.Cong., 5th, Proc, sec. 1, Paper 14.
Powers, R.W., Ramirez, L.F., Redmond, CD., and Elbert,EX., 1966. Geology of the Arabian Peninsular: U.S.Geol. Surv. Prof. Paper 560-D, p. 147.
Roth, P.H., Baumann, P., and Bertolino, V., 1971. LateEocene-Oligocene calcareous nannoplankton fromcentral and northern Italy: Plankt. Conf., 2nd, Roma,1970, Proc, p. 1069-1097.
Wyrtki K., 1971. Oceanographic Atlas of the InternationalIndian Ocean Expedition: Nat. Sci. Found., p. 531.
396


SITE 224
εDC
I—GuLLJQ
SITE 224
GEO CHRONO-LOGICAL AGE o
OOUJCO CD<C<C
GRAPHICLITHOLOGY LITHOLOGICAL UNITS
CARBONATE
(wt %)
20 40 60 80
OO
-50
-100
OO
-150
-200
L250
Late
Late
I Gray DETRITAL CLAYEY SILT RICH NANN000ZE/CHALK.
398

SITE 224
CORE
WATER CONTENT (wt)POROSITY (vol.)
80 60 40 20
DENSITY_3
(g.cm )
1.5 2.0
COMPRESSIONALWAVE VELOCITY
(km.s~1)
2 3 4
SPECIFICACOUSTICIMPEDANCE
(10δN.s.m-
3
2 4 6 8
THERMAL CONDUCTIVITY
(Wm~1 K"1)
1 2 3 4
50-
1 0 0 -
150-
200-
250
i i r i i i i
For explanatory notes see chapter 2.
399
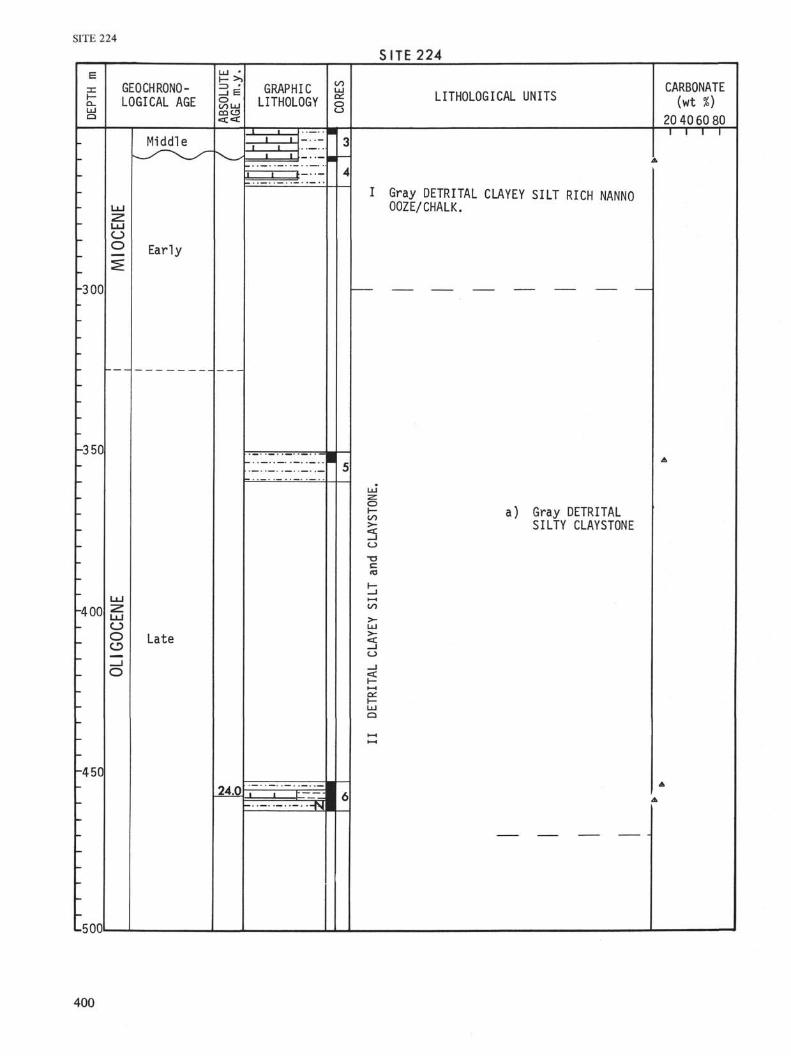
SITE 224
SITE 224
LUQ
GEOCHRONO-LOGICAL AGE
i- >>
o00 LUCO CD
GRAPHICLITHOLOGY LITHOLOGICAL UNITS
CARBONATE(wt %)
20 4060 80
LUOO
-300
-350
-400oOo
-450
-500
Middle
Early
i r i i
I Gray DETRITAL CLAYEY SILT RICH NANNO00ZE/CHALK.
=
Late
LU
o
on
<:
o
-σ
>-LU
a) Gray DETRITALSILTY CLAYSTONE
24.0
400

CORE
SITE 224
WATER CONTENT (wt)POROSITY (vol.)
80 60 40 20
DENSITY3
(g.cm )
1.5 2.0
COMPRESSIONALWAVE VELOCITY
(km.s~1)2 3 4
SPECIFICACOUSTICIMPEDANCE
(10 5 N.s .m- 3
2 4 6 8
THERMAL CONDUCTIVITY
(Wm~1 K~1)
1 2 3 4i l l \
I© ©
j I
For explanatory notes see chapter 2.
401

SITE 224
SITE224
LüQ
GEO CHRONO-LOGICAL AGE 3é
o00 LUDQC3
GRAPHICLITHOLOGY LITHOLOGICAL UNITS
CARBONATE(wt %)
20 4060 80
-550
-600
oOO
-650
-700
o
L750
Late
oo>-
-oc
>-UJ
<c_lo_1<CI—i—iCáLüQ
b) Brownish grayDETRITAL SAND andCLAYEY SILTSTONE
:_• 8Middle
Early
Late
III Gray MICARB RICH CLAY NANNO CHALK tored NANNO RICH CLAYSTONE.
402
SITE 224
CORE
500
WATER CONTENT (wt.)POROSITY (vol.)
80 60 40 20
DENSITY_3
(g.cm )
1.5 2.0
COMPRESSIONALWAVE VELOCITY
(km.s~1)
2 3 4
SPECIFICACOUSTICIMPEDANCE
(10 δ N.s.m- 3
2 4 6 8
THERMAL CONDUCTIVITY
(Wm~1 K"1)
i i i r
550-
600-
650-
700-
750For explanatory notes see chapter 2.
403
SITE 224
SITE 224
LuQ
GEOCHRONO-LOGICAL AGE o
OOLUCQCD
:
GRAPHICLITHOLOGY
j:W: ^•^ io
LITHOLOGICAL UNITSCARBONATE(wt %)
20 4060 80
LUOO
49.0
Middle
Earlycα 51.5
v r• V V I - > ^ Λ v
-800
-850
-900
-950
lOOOL
III Gray MICARB RICH CLAY NANNO CHALK tored NANNO RICH CLAYSTONE.
\Grayish black LAMPROPHYRE
S
404
CORE
750-
WATER CONTENT (wt.)POROSITY (vol.)
80 60 40 20
DENSITY_3
(g.cm )
1.5 2.0
COMPRESSIONALWAVE VELOCITY
(km.s~1)2 3 4
SPECIFICACOUSTICIMPEDANCE10
δN.s.m-
3
2 4 6 8
SITE 224
THERMAL CONDUCTIVITY
(Wm~1 K"1)
1 2 3 4i i r
800-
i I T
J J I
For explanatory notes see chapter 2.
405
Core 1 Cored I n t e r v a l : 0-9 S i t e 224 Hole Core 2 Cored I n t e r v a l : 94-103
FOSSILCHARACTER
CoreCatcher
LITHOLOGIC DESCRIPTION
Ol i ve DIATOM DETRITAL SILTY CLAY RICH NANNOOOZE.
Dominant l i t h o l o g y SS: core catcherDIATOM DETRITAL SILTY CLAY RICH NANNOOOZEComposition:
NannosDetr i ta l mineralsDiatomsSpiculesRadiolariansForams
202%
TraceTrace
Two-thirds of the de t r i t a l materialis carbonate. Some pyr i te replace-ment of diatoms was noted.
Color legend:1 • pale o l i
Explanatory notes in chapter 2
FOSSILCHARACTER
CoreCatcher
LITHOLOGIC DESCRIPTION
Olive to gray DETRITAL CLAYEY SILT RICH NANNOCHALK and DETRITAL CLAYEY SILT NANNO RICHDIATOMITE.
Latter as alternating bands 10-40 cm thick.Sediments are semi lithified, slight to moderatemottling, no significant deformation.
Dominant lithology SS: Sec. 2-45 cmDETRITAL CLAYEY SILT RICH NANNO CHALKComposition:
Nannos 70%Detr i ta l minerals 15%Rads 5*Spicules 5%Diatoms 5%
Color legend:1 • l i gh t green gray2 = pale ol ive3 = gray yellow green4 = gray ol ive
5G 8/110Y 6/25GY 7/210Y 4/2
Shore-based laboratory results
Carbonate:Sec. 2-37 cm = 64%Sec. 2-61 cm = 70S
X-ray mineralogy (R): Sec. 2-57 cmCalcite ' 54%Dolomite 303!Quartz 6%Plagioclase 3%Mica 3%Palygorskite 3%Chlorite 1%
Hole Core Cored Interval:
F N R
FOSSILCHARACTER
CoreCatcher
LITHOLOGIC DESCRIPTION
Brown DETRITAL SILTY CLAY NANNO CHALK
Dominant lithology SS: core catcherDETRITAL SILTY CLAY NANNO CHALKComposition:
NannosDetri t<Forams
i l minerals-
40%Trace
Color legend:1 = pale yellow brown 10YR 6/2
Explanatory notes in chapter 2

Site 224 Core 4 Cored I n t e r v a l : 259-268 Cored I n t e r v a l : 350-359
LITHOLOGIC DESCRIPTION
Brown to gray DETRITAL SILTY CLAY NANNO CHALKand DETRITAL CLAYSTONE.
The l a t t e r occur in 40 cm thick alternating beds.The sediments are semi l i t h i f i e d , moderatelymottled and moderately disturbed. Some portionsshow burrowing 40-45 cm, 110-130 cm (see below).Burrows dip at about 25°. Lowest part of thesection shows s l i g h t lamination and streaks ofpyri t e .
Dominant l i thology SS: Sec. 1-40 cmDETRITAL CLAYEY SILT NANNO CHALKComposition:
Nannos 60%Detrital minerals 40%
Color legend:1 = pale yellow brown 10YR 6/2
2 = dark yellow brown 10YR 4/23 = medium light gray
4 = brown gray5 • olive gray
Melange of burrowedand slumped materialin browns - 10YR 7/4,10YR
v5/4 and 5YR 4/4
N65YR 4/1
5Y 4/1
Brown s i l t / c h a l k5YR 4/4 with l i g h t10YR, 7/4 incl inedburrows and 5BY 7/2speckles
'ale blue-green5BY 7/2 incl inedhorizon with 5BG 2/2'burrows above
110_cm
5Y 8/4 with
5G 6/1 burrows
5Y 8/4
nanno chalk
Inclined horizon
rich in discoasters
5G 6/1 with
5Y 8/1 burrows
Fracture 130 c
5P 2/2 burrow
r ich in diεcoasters
Shore-based laboratory results
Carbonate:Sec. 1-62 cm 2%
X-ray mineralogy: Sec. 1-64 cm (WHOI)Quartz ' 14%Layer s i l i c a t e 80%Plagioclase 6%
Grain size: Sec. 1-64 cmSand 0%Silt 18%Clay 82%
FOSSILCHARACTER
CoreCatcher
LITHOLOGIC DESCRIPTION
Gray DETRITAL CLAYEY SILTSTONE.
Homogenous, s e m i l i t h i f i e d , f i n e l y laminated(0.1 cm). In section 2 between 113-115 cm cross-laminated. Sl ight deformation.
Dominant l i thology SS: Sec. 1-74 cmDETRITAL CLAYEY SILTSTONEComposition:
Detr i ta l minerals 100%
Color legend:1 = green gray 5G 6/12 = brown gray 5YR 4/1
Shore-based laboratory results
Carbonate:Sec. 2-75 cm 14%
X-ray mineralogy: Sec. 2-75 cmCalcite 12%Quartz 3 9%K feldspar 2%Plagioclase 12%Dolomite 2%Mica 27%Chlorite 6%
Grain size: Sec. 2-75 cmSand 0%Silt 72%Clay 28%
Explanatory notes in chapter 2
è

Site 224o00
Core 6 Cored Interval: 453-462 Site 224 Core 7 Cored In te rva l : 571-580
FOSSILCHARACTER
CoreCatcher
Color legend:1 = o l . gy. 5Y4/1 122 = o l . b l . 5Y2/1 13
4 w/ 3 = gy. o l . 10Y4/2 14bur. 5 4 = p a i e g n . 10G6/2 15
5 = I t . o l . gn. 5Y5/2 166 = mod. brn. 5YR3/4 177 = dk. y l . brn. 10YR4/2 188 = pale y l . brn.lOYR6/2 199 = mod. brn. 5YR4/4 20 =
10 = I t . gn. gy. 5G8/1 21 =11 = pale b l . gn. 5BG7/2 22 =
7,8,9w/ mot.10 11 Shore-based laboratory results
Carbonate: Sec. 1-9 cm ••
LITHOLOGIC DESCRIPTION
Gray DETRITAL CLAYSTONE to DETRITAL SILTY CLAYSTONEinterbedded with DETRITAL CLAY RICH NANNO CHALK.
Semilithified, moderately mottled and burrowed.Laminated in silt rich portions. In section 5(121-125 cm) faulting and slump structures occur(see below). Burrowing is parallel to bedding.
Dominant lithology SS: Sec. 4-40 cmDETRITAL CLAYSTONEComposition:
Total de t r i t a l minerals 1003!
pale brn.= gy. red= gy y i . gn.
pale red brn,10R5/4dk. red brn. 10R3/4pale b l . 5PB7/2med. gy. N5
" ' 5YR5/25R4/2
5GY7/2I t . brn. gy. 5YR6/1gy. b lk . 5GY2/1gn. gy. 5G6/1med. b l . gy. 5B5/1
I U Sec. 4-42 cm
X-ray mineralogy: Sec. 1-9 cm (WHOI) Sec. 4-42 cm(WH0IQuartzPlagioclaseLayer s i l i ca teCalciteMicrocline
Grain size:SandSiltClay
13%4%
8K0%
Z e r o s e c t i o n 0 t o 60 cm. G r a y DETRITAL CLAYSTONEsemilithified to l i th i f ied , laminated locallygraded. Interbedded with si l ty sand layers.
* Represents extra interval at topof core
115 cm5GYB/2 withtop intenselyburrowed5YR3/4
Clay 5BG7/2pi. blue gr.with normalfault at 40°displacings i l t lamina
CARBONATE:
6-1-9 cm • I U
6-4-42 cm = 2%
ntercalate1c
Homogenousbrown claywith mm burrows
FOSSILCHARACTER
ConCatcher
0.5- : 54
78
100(3
130
LITHOLOGIC DESCRIPTION
Gray DETRITAL SILTY CLAYSTONE
Semi l i th i f ied , t h i n l y bedded with burrow mott l ingbetween 90-110 cm. Burrows are of e l l i p t i c a lshape mostly paral le l to bedding, l i t t l e deforma-t ion except between 55-75 cm.
Dominant l i tho logy SS: Sec. 1-130 cmDETRITAL SILTY CLAYSTONEComposition:
Detr i ta l minerals 100%
Color legend:1 = brown gray 5YR 4/12 - green gray 5Y 6/13 • dark green gray 5GY 4/14 = brown gray 5YR 2/1
Shore-based laboratory results
Carbonate: Sec. 1-48 cm = 9%
X-ray mineralogy: Sec. 1-48 cm (WHOI)Quartz 183!Plagioclase 1(KLayer s i l i c a t e 662Calcite 6%
Grain s i r e : Sec. 1-48 cmSand 0*Silt 37%Clay 63%
Explanatory notes in chapter 2
Explanatory notes in chapter 2
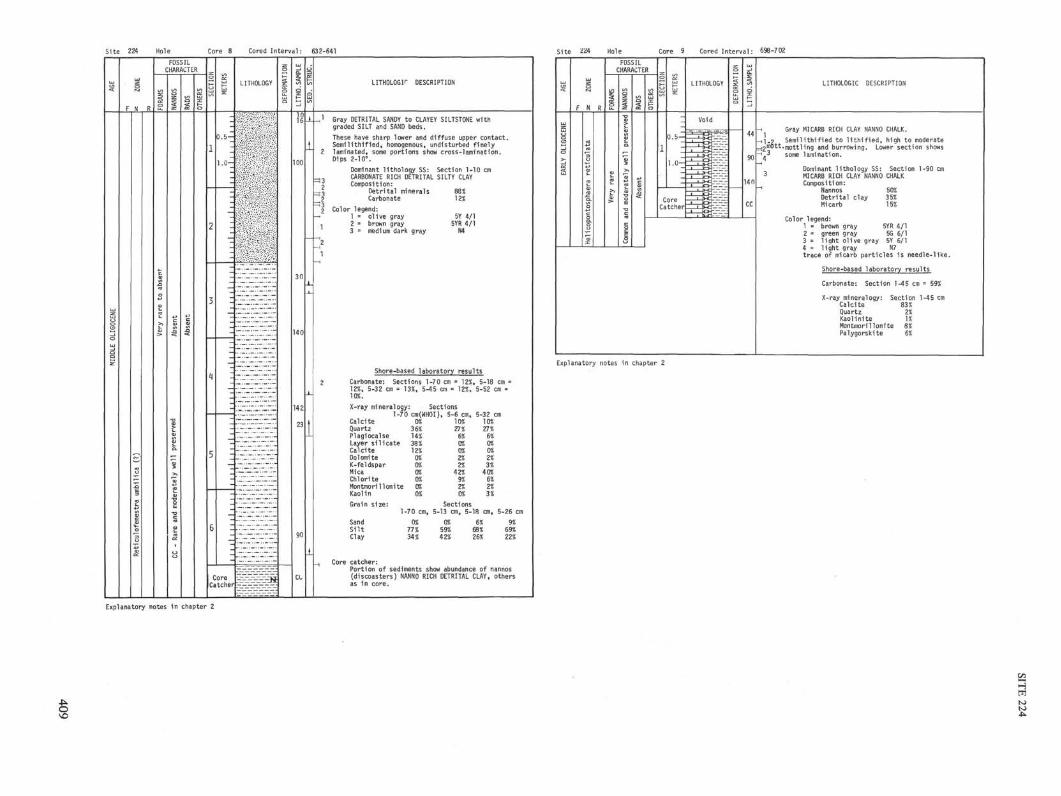
Site 224 Cored In terva l : 632-641 Site 224 Core 9 Cored In terva l : 698-702
F N R
FOSSILCHARACTER
CoreCatcher
-Ji
32
=!3
LITHOLOGY DESCRIPTION
Gray DETRITAL SANDY to CLAYEY SILTSTONE withgraded SILT and SAND beds.
These have sharp lower and diffuse upper contact.Semi l i th i f ied , homogenous, undisturbed f ine lylaminated, some portions show cross-lamination.Dips 2-10°.
Dominant l i thology SS: Section 1-10 cmCARBONATE RICH DETRITAL SILTY CLAYComposition:
Detr i ta l minerals 88%Carbonate 12%
2 Color legend:1 - ol ive gray 5Y 4/1
, 2 - brown gray 5YR 4/13 medium dark gray N4
Shore-based l a b o r a t o r y r e s u l t s
Carbonate: Sect ions 1-70 cm = 12%, 5-18 cm12%, 5-32 cm = 13%, 5-45 cm = 12%, 5-52 cm =10%.
X-ray minera logy: Sect ions1-70 cm(WHOI), 5-6 cm, 5-32 cm
10% 10%27% 27%
42%9%2%
Sections1-70 cm, 5-13 cm, 5-18 cm, 5-26 cm
Core catcher:Portion of sediments show abundance of nannos(discoasters) NANNO RICH DETRITAL CLAY, othersas in core.
CalciteQuartzPlagiocalse
0%36%14%
Layer s i l i ca te 38%CalciteDolomiteK-feldsparMicaChlorite
12%0%0%0%056
Montmori11 onite 0%Kaolin
Grain size:
SandSiltClay
0%
1-70 c
0%77%34%
LITHOLOGIC DESCRIPTION
Gray MICARB RICH CLAY NANNO CHALK.
Semilithified to lithified, high to moderatemottling and burrowing. Lower section showssome lamination.
Dominant lithology SS: Section 1-90 cmMICARB RICH CLAY NANNO CHALKComposition:
Nannos 50%Detr i ta l clay 35%Micarb 15%
Color legend:1 - brown gray 5YR 4/12 • green gray 5G 6/13 = l i gh t ol ive gray 5Y 6/14 = l i gh t gray N7
trace of micarb part ic les is needle-l ike.
Shore-based laboratory results
Carbonate: Section 1-45 cm = 59%X-ray mineralogy: Section 1-45 cm
Calcite 83%Quartz 2%Kaolinite 1%Montmorillonite 8%Palygorskite 6%
Explanatory notes in chapter 2
Explanatory notes in chapter 2
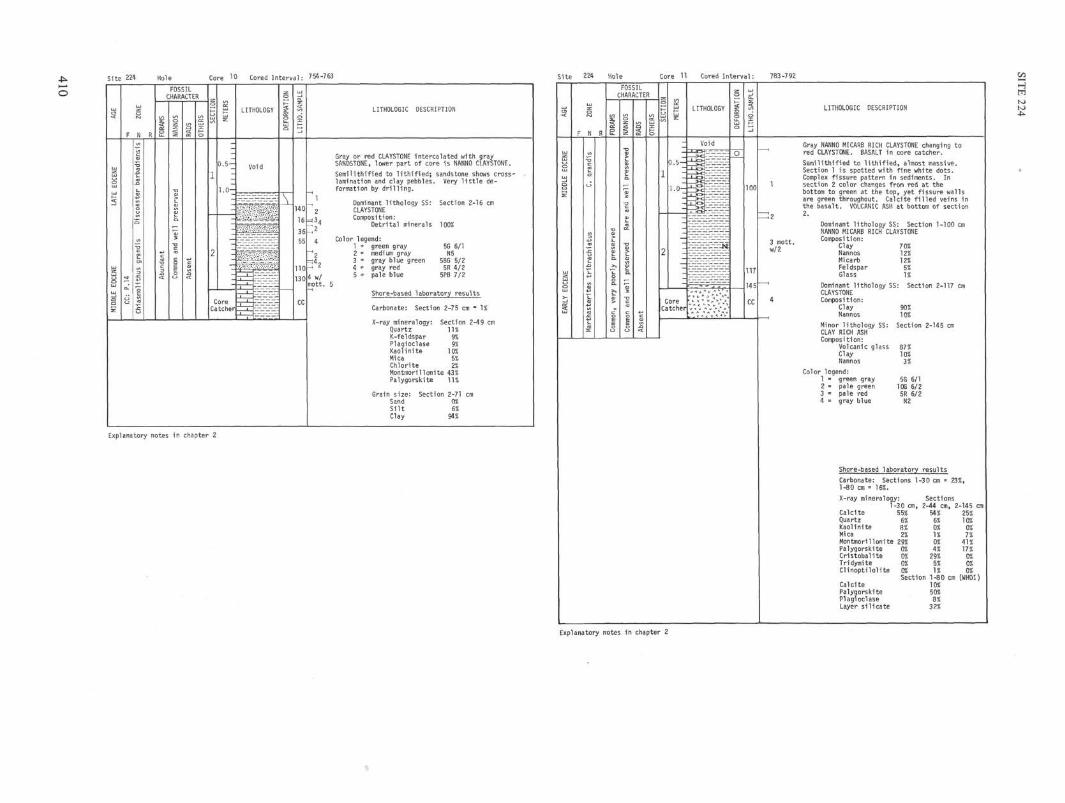
Site 224 Core 10 Cored I n t e r v a l : 754-763
FOSSIL
CHARACTER
CoreCatcher
130 1
LITHOLOGIC DESCRIPTION
Gray or red CLAYSTONE intercalated with graySANDSTONE, lower part of core is NANNO CLAYSTONE.
Semilithified to lithified; sandstone shows cross-lamination and clay pebbles. Very little de-formation by drilling.
Dominant lithology SS: Section 2-16 cmCLAYSTONEComposition:
Detr i ta l minerals 100%
Color legend:
w/mott.
green graymedium graygray blue greengray redpale blue
5G 6/1N5
5BG 5/25R 4/2
5PB 7/2
Shore-based laboratory results
Carbonate: Section 2-75 cm - 1%
X-ray mineralogy: Section 2-49 cmQ ' UQuartzK-feldsparPlagioclaseKaoliniteMicaChlorite
I U9%9%
10%5%2%
Montmorillonite 43%Palygorskite I U
Grain size: Section 2-71 cmSandSiltClay
0%6%
94%
Explanatory notes in chapter 2
Site
a
g(_>
2LU
Q
i - i
sUJ
LU
224
o
F N R
<Λ
E
&.
<J
iatu
3
•
Mart
Hole
FOSSILCHARACTER
ü.
?α.>>
poor
>
o
D .
, -
T3
>
5;
"gto
U0
0
nt
X I
so
Core 11
_^
CTIO
</.
1
2
ETER5
z
0 . 5 -
-
-
-
CoreCatcher
Cored Interval:
LITHOLOGY
Void
- L
_ 1 _
o -
O
X
3 - t
r -_i.-
r_-_-_-_-
• Z J • t h "•> u V
10
|
o
D.SAM
ITH
-1
145
rr
783-792
LITHOLOGIC DESCRIPTION
: Gray NANNO MICARB RICH CLAYSTONE changing to
Semi l i th i f ied to l i t h i f i e d , almost massive.Section 1 is spotted with f ine white dots.Complex f issure pattern in sediments. In
1 section 2 color changes from red at thebottom to green at the top, yet f issure wallsare green throughout. Calcite f i l l e d veins inthe basalt. VOLCANIC ASH at bottom of section
Dominant l i thology SS: Section 1-100 cmNANNO MICARB RICH CLAYSTONE
-, „ „ * * . Composition:3 ™ " • Clay 70%
' Nannos 12%Micarb 12%Feldspar 5%Glass U
' Dominant l i t h o l o g y SS- Section 2-117 cmCLAYSTONE
4 Composit ion:Clay 90%
! Nannos 10%
Minor l i t h o l o q y SS: Sect ion 2-145 cmCLAY RICH ASH
Volcanic glass 87%Clay 10%Nannos 3%
Color legend:1 = green gray 5G 6/12 = pale green 10G 6/23 = pale red 5R 6/24 = gray b lue N2
Shore-based l a b o r a t o r y r e s u l t s
Carbonate: Sections 1-30 cm = 23%,1-80 cm = 16%.
X-ray mineralogy: Sect ions1-30 cm, 2-44 cm, 2-145 cm
C a l c i t e 55% 54% 25%Quartz 6% 6% 10%K a o l i n i t e 8% 0% 0%Mica 2% 1% 7%M o n t m o r i l l o n i t e 29% 0% 41%P a l y g o r s k i t e 0% 4% 17*C r i s t o b a l i t e 0% 29% 0%T r i d y m i t e 0% 5% 0%C l i n o p t i l o l i t e 0% 1% 0%
Sect ion 1-80 cm (WHOI)C a l c i t e 10%P a l y g o r s k i t e 50%P l a g i o c l a s e 8%Layer silicate 32%
Explanatory notes in chapter 2
DENSITY (g.cm- 3 )
<^> GRAPE o Sect ion Mean
1.0 1.5 2.0 2.5
WATER CONTENT (wt %)Syringe Sample
80 60 40 20 0
— 1
— 2
— 3
— 4
— 6
— 7
— 8
— 9•
CC
For Explanatory Notes, see Chapter 2
-25
-50
CM
hθ
224-2SECTION 1
-75
- 1 0 0
- 1 2 5
150
fi
k
X
SITE 224
411
SITE 224
DENSITY (g.cm-3)^ GRAPE o Section Mean1.0 1.5 2.0 2.5
WATER CONTENT (wt %)Syringe Sample
80 60 40 20 0
— 1
— 2
— 3
— 4
— 5
—~ 6
— 7
— 8
— 9
CC
For Explanatory Notes, see Chapter 2
-25
-50
CM- 0
224-4SECTION 1
-75
-100
-125
150
412

DENSITY (g.cm-3)
~*> GRAPE Q Section Mean1.0 1.5 2.0 2.5
WATER CONTENT (wt %)ΔSyringe Sample
80 60 40 20 0
- 1
— 2
— 3
— 5
— 6
— 7
— 8
— g.
CC
GJ
For Explanatory Notes, see Chapter 2
CMhθ
-25
-50
224-5SECTION 1
-75
-100
-125
150
SITE 224
413
SITE 224
DENSITY (g.cm-3)
^/ GRAPE α Section Mean1.0 1.5 2.0 2.5
WATER CONTENT (wt %)ΔSyringe Sample
80 60 40 20 0
— 1
— 4
βmiiim g•
— 6
— 7
— 8
— 9
CC
For Explanatory Notes, see Chapter 2
-25
-50
CMhθ
224-6SECTION 1
-75
-100
- 1 2 5
150
414

SITE 224
DENSITY ( g . c m - 3 )<v> GRAPE α Section Mean1.0 1.5 2.0 2.5
WATER CONTENT (wt %)Syringe Sample
80 60 40 20 0
CM- 0
224-7
SECTION 1
— 1
-25
— 2
— 3 -50
— 4
— 7
-75
-100
M | | | Q -125
— 9
CC
-150
415
SITE 224
DENSITY (g.cm-3)~ GRAPE o Section Mean1.0 1.5 2.0 2.5
WATER CONTENT (wt %)Syringe Sample
80 60 40 20 0
mmm 0
— 3
— 5
— 7
— 9•
CC
-25
-50
CMhθ
224-8SECTION 1
-75
-100
-125
150
,
M
1
J
1 jFor Explanatory Notes, see Chapter 2
416
DENSITY (g.cm-3)
^ GRAPE α Section Mean1.0 1.5 2.0 2.5
WATER CONTENT (wt %)Syringe Sample
80 60 40 20 0
— 2
— 3
— 4
— 6
— 9
cc
For Explanatory Notes, see Chapter 2
CMhθ
-25
-50
224-9SECTION 1
-75
-100
-125
150
SITE 224
417

SITE 224
DENSITY (g.cm-3)
~ GRAPE α Section Mean1.0 1.5 2.0 2.5
WATER CONTENT (wt %)
Syringe Sample80 60 40 20 0
— 2
— 3
— 4
— 5
— 7
— 9•
CC
For Explanatory Notes, see Chapter 2
CMhθ
-25
-50
224-10SECTION 1
-75
-100
- 1 2 5
150
418
_ 1
— 3
— 4
DENSITY (g.cm-3)
-v/ GRAPE α Section Mean1.0 1.5 2.0. 2.5
WATER CONTENT (wt %)ΔSyringe Sample
80 60 40 20 0
— 5
— 6
— 7
_— Q.
cc
For Explanatory Notes, see Chapter 2
CMhθ
-25
-50
224-11
SECTION 1
-75
- 1 0 0
SITE 224
w
- 1 2 5
•150
L -
419