Embed Size (px)
Citation preview
DISCLOSURE APPENDIX AT THE BACK OF THIS REPORT CONTAINS IMPORTANT DISCLOSURES, ANALYST CERTIFICATIONS, LEGAL ENTITY DISCLOSURE AND THE STATUS OF NON-US ANALYSTS. US Disclosure: Credit Suisse does and seeks to do business with companies covered in its research reports. As a result, investors should be aware that the Firm may have a conflict of interest that could affect the objectivity of this report. Investors should consider this report as only a single factor in making their investment decision.
8 December 2016Europe
Equity ResearchDiversified Telecommunication Services
European Telcos 2017 Outlook SECTOR REVIEWResearch Analysts
Justin Funnell44 20 7888 0268
Jakob Bluestone44 20 7883 0834
Paul Sidney44 20 7888 6015
Henrik Herbst44 20 7888 0286
Back to square one
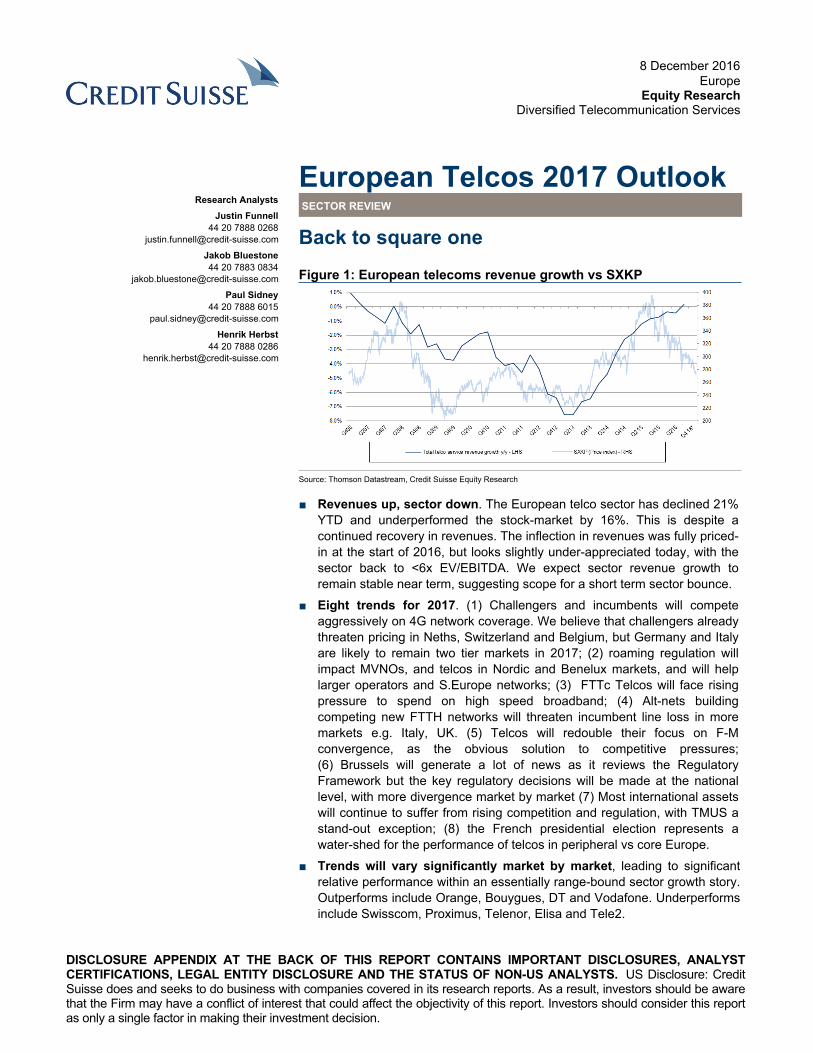
Figure 1: European telecoms revenue growth vs SXKP
Source: Thomson Datastream, Credit Suisse Equity Research
■ Revenues up, sector down. The European telco sector has declined 21% YTD and underperformed the stock-market by 16%. This is despite a continued recovery in revenues. The inflection in revenues was fully priced-in at the start of 2016, but looks slightly under-appreciated today, with the sector back to <6x EV/EBITDA. We expect sector revenue growth to remain stable near term, suggesting scope for a short term sector bounce.
■ Eight trends for 2017. (1) Challengers and incumbents will compete aggressively on 4G network coverage. We believe that challengers already threaten pricing in Neths, Switzerland and Belgium, but Germany and Italy are likely to remain two tier markets in 2017; (2) roaming regulation will impact MVNOs, and telcos in Nordic and Benelux markets, and will help larger operators and S.Europe networks; (3) FTTc Telcos will face rising pressure to spend on high speed broadband; (4) Alt-nets building competing new FTTH networks will threaten incumbent line loss in more markets e.g. Italy, UK. (5) Telcos will redouble their focus on F-M convergence, as the obvious solution to competitive pressures; (6) Brussels will generate a lot of news as it reviews the Regulatory Framework but the key regulatory decisions will be made at the national level, with more divergence market by market (7) Most international assets will continue to suffer from rising competition and regulation, with TMUS a stand-out exception; (8) the French presidential election represents a water-shed for the performance of telcos in peripheral vs core Europe.
■ Trends will vary significantly market by market, leading to significant relative performance within an essentially range-bound sector growth story. Outperforms include Orange, Bouygues, DT and Vodafone. Underperforms include Swisscom, Proximus, Telenor, Elisa and Tele2.
8 December 2016
European Telcos 2017 Outlook 2
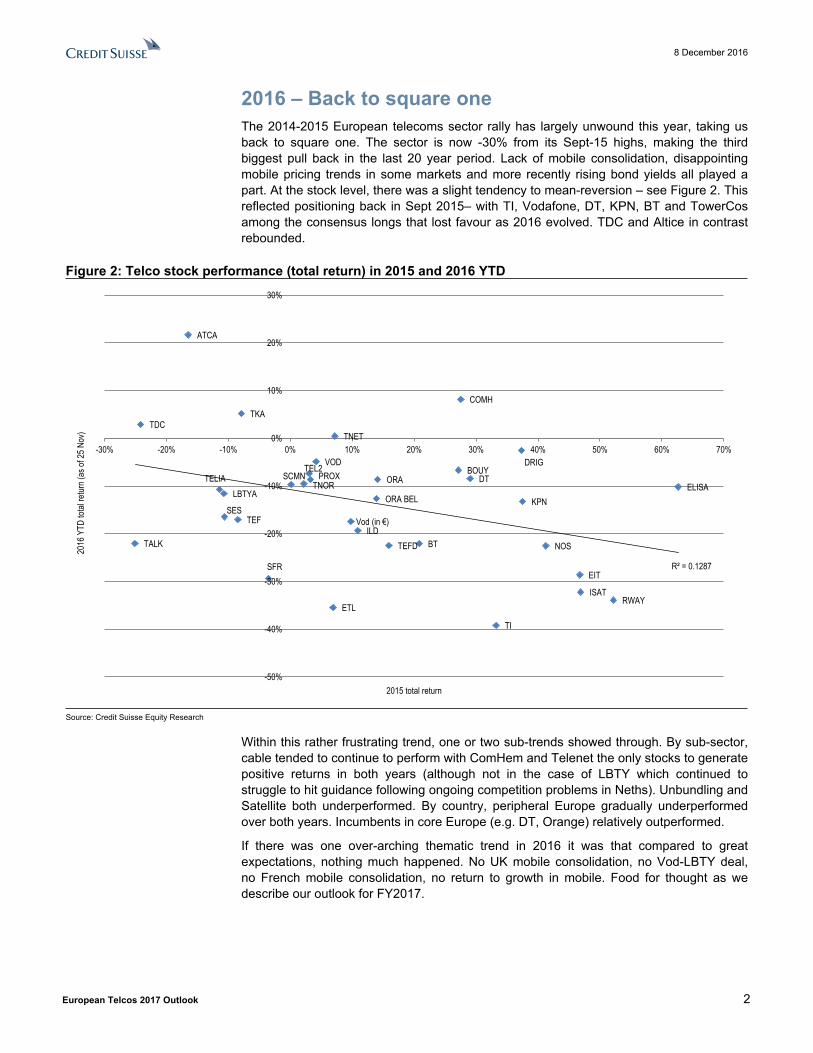
2016 – Back to square oneThe 2014-2015 European telecoms sector rally has largely unwound this year, taking us back to square one. The sector is now -30% from its Sept-15 highs, making the third biggest pull back in the last 20 year period. Lack of mobile consolidation, disappointing mobile pricing trends in some markets and more recently rising bond yields all played a part. At the stock level, there was a slight tendency to mean-reversion – see Figure 2. This reflected positioning back in Sept 2015– with TI, Vodafone, DT, KPN, BT and TowerCos among the consensus longs that lost favour as 2016 evolved. TDC and Altice in contrast rebounded.
Figure 2: Telco stock performance (total return) in 2015 and 2016 YTD
PROX
BT
DTORA
KPN
SCMN
TKATDC
TEF
TI
TELIATNOR
VOD
ATCA
COMH
LBTYA
NOS
SFR
TNET
EIT
ETLISAT
RWAY
SES
BOUYDRIG
ELISA
ILD
ORA BEL
TALK TEFD
TEL2
Vod (in €)
R² = 0.1287
-50%
-40%
-30%
-20%
-10%
0%
10%
20%
30%
-30% -20% -10% 0% 10% 20% 30% 40% 50% 60% 70%
2016
YTD
total
retur
n (as
of 25
Nov
)
2015 total return
Source: Credit Suisse Equity Research
Within this rather frustrating trend, one or two sub-trends showed through. By sub-sector, cable tended to continue to perform with ComHem and Telenet the only stocks to generate positive returns in both years (although not in the case of LBTY which continued to struggle to hit guidance following ongoing competition problems in Neths). Unbundling and Satellite both underperformed. By country, peripheral Europe gradually underperformed over both years. Incumbents in core Europe (e.g. DT, Orange) relatively outperformed.
If there was one over-arching thematic trend in 2016 it was that compared to great expectations, nothing much happened. No UK mobile consolidation, no Vod-LBTY deal, no French mobile consolidation, no return to growth in mobile. Food for thought as we describe our outlook for FY2017.
8 December 2016
European Telcos 2017 Outlook 3
Figure 3: List of CS ratings for European Telecoms, Cable, Satellite and TowerCosCompany Ticker FX Price
TargetComment
OutperformBouygues BOUY.PA Eu 38.0 Strong mobile momentum to continue, turn-around in construction driven by Colas and Bouygues ConstructionCellnex CLNX.MC Eu 18.0 Upside from continued strong data usage growth driving demand for more sites. Potential consolidation of footprintCom Hem COMH.ST SEK 91.0 Strong market fixed broadband subscriber growth, price inflation and limited downside from OTTDT DTEGn.F Eu 16.50 Continued growth potential in TMUS and German EBITDA slowly inflectingInmarsat ISAT.L GBP 9.40 Inmarsat to maintain global competitive advantage in key Maritime and Government sectors for the next 5 years.INWIT INWT.MI Eu 5.20 Benefits from continued upsell and opex savings from decomissioning of sitesLiberty Global LBTYA.O US$ 42.0 Little increase in churn from Q1 16 price increases suggesting pricing power still intact.NOS NOS.LS Eu 8.10 Less uncertainty after contract sharing agreement with Altice and continued upside form price increasesOrange ORA.PA Eu 16.50 Building a sustainable long term advantage in fixed, mobile could improve in '17 with ILD throttling/SFR restructuringSES SESFd.PA Eu 25.0 Less exposed than Eutelsat to commoditised data revenues. Revenues to stabilise over 2016. O3b positive.TalkTalk TALK.L GBP 2.60 Competitive edge reducing (UK demand for high-speed BB) but can beat more cautious consensus expectationsTDC TDC.CO DKK 40.0 Consumer mobile and B2B have inflected and we get earnings upside on a conservative fixed bb scenarioTelenet TNET.BR Eu 52.0 Telenet a long-term winner in Belgium post-BASE acquisition despite worsening market growth outlookTelekom Austria TELA.VI Eu 6.00 Mobile market repair, fixed line pricing power returning and potential subs growth with fibreVodafone VOD.L GBP 2.40 Slow down in India and Italy offset by continued pricing power in Germany, UK and Spain
UnderperformElisa ELI1V.HE Eu 29.0 Better exposure to mobile data usage growth elsewhere in the sector, downside risk from roamingOrange Belgium OBEL.BR Eu 18.0 Orange Belgium faces a much tougher outlook, particularly in mobile. At risk of losing mobile market share.Proximus PROX.BR Eu 21.0 Belgian Telco market growth to deteriorate. Consensus expectation of EBITDA growth in 2017 looks too optimistic .Swisscom SCMN.VX CHF 425 MSR no longer superior so premium harder to justify. Fixed-mobile substitution, salt risk in fixedTelenor TEL.OL NOK 115 Norway slowing, Asia seeing rising competition. India exit largely priced inTele2 TEL2b.ST SEK 63.6 Pressure from Swedish mobile and weak prospects in the Netherlands
NeutralAltice ATCA.AS Eu 17.0 Strong EBITDA growth, but valuation expensive vs growth and balance sheet/execution riskBT Group BT.L GBP 4.00 Upside from EE deal, RPL growth and cost cutting offset by UK recession impact and pension riskDrillisch DRIG.DE Eu 40.0 MBA-MVNO growth already in consensus forecasts. TEFD's MVNO negotiations are the key issue.EI Towers EIT.MI Eu 50.0 Defensive business model with growing dividends and consolidation potential of Italian broadcast tower marketEutelsat ETL.PA Eu 20.0 More exposed to geographies and applications (global data services, professional video) that are at riskIliad ILD.PA Eu 190 Has de-rated but risks of higher capex and slowing growth in mobileRai Way RWAY.MI Eu 3.90 Defensive business model with growing dividends and consolidation potential of Italian broadcast tower marketSFR SFRGR.PA Eu 25.0 French fixed and mobile to improve in H2, 2nd round of restructuring in mid-17Sunrise SRCG.S CHF 65.0 Mobile stable, fixed has risks from Salt. Could shift focus under new managementTelefonica TEF.MC Eu 10.00 Turn-around in Spain and Germany offset by weakness in Latam.TEF Deutschland O2Dn.DE Eu 4.0 Lacks pricing power due to lag in 4G. Rising regulatory pressure in 2017.KPN KPN.AS Eu 3.20 Wireline outlook improving; Tele2 launch & T-Mo raising Neths mobile competition. In line with consensusTelecom Italia TLIT.MI Eu 0.90 Cost cutting likely to expand, but offset by longer term risks from Iliad and Enel market entryTelia Company TELIA.ST SEK 39.0 Uncertainty from potential fines and the sales process of Telia's Eurasian businessSource: Credit Suisse Equity Research
8 December 2016
European Telcos 2017 Outlook 4
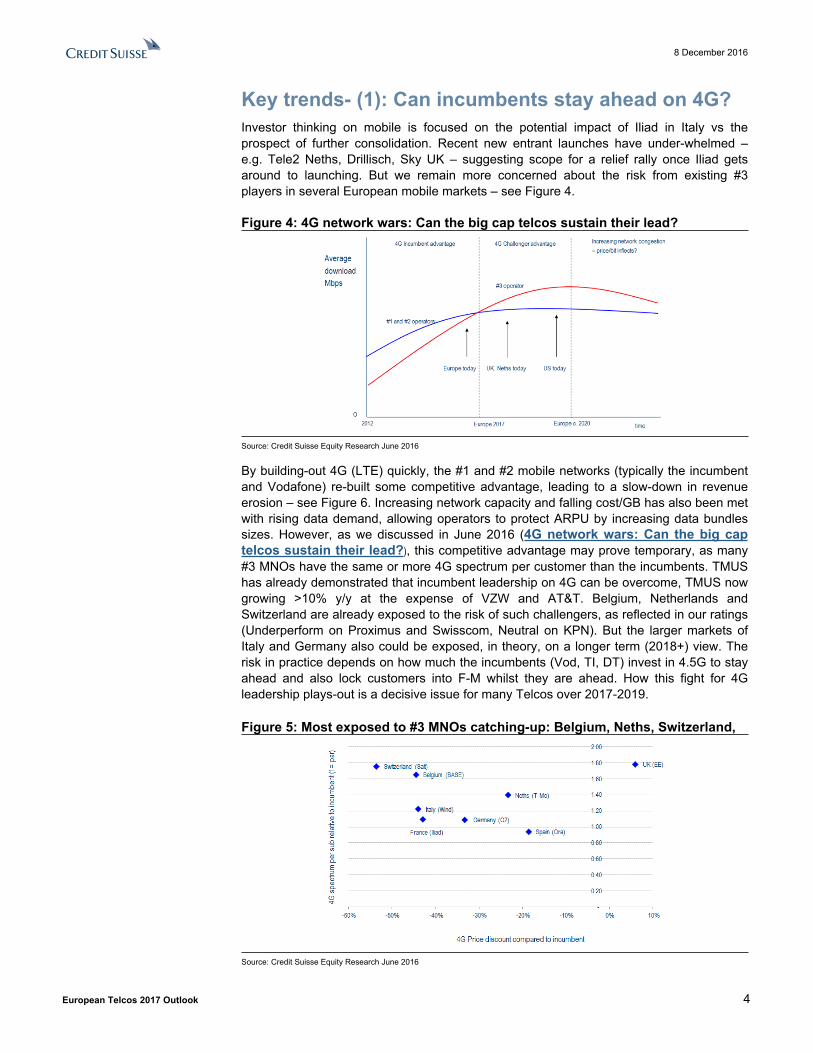
Key trends- (1): Can incumbents stay ahead on 4G?Investor thinking on mobile is focused on the potential impact of Iliad in Italy vs the prospect of further consolidation. Recent new entrant launches have under-whelmed – e.g. Tele2 Neths, Drillisch, Sky UK – suggesting scope for a relief rally once Iliad gets around to launching. But we remain more concerned about the risk from existing #3 players in several European mobile markets – see Figure 4.
Figure 4: 4G network wars: Can the big cap telcos sustain their lead?
Source: Credit Suisse Equity Research June 2016
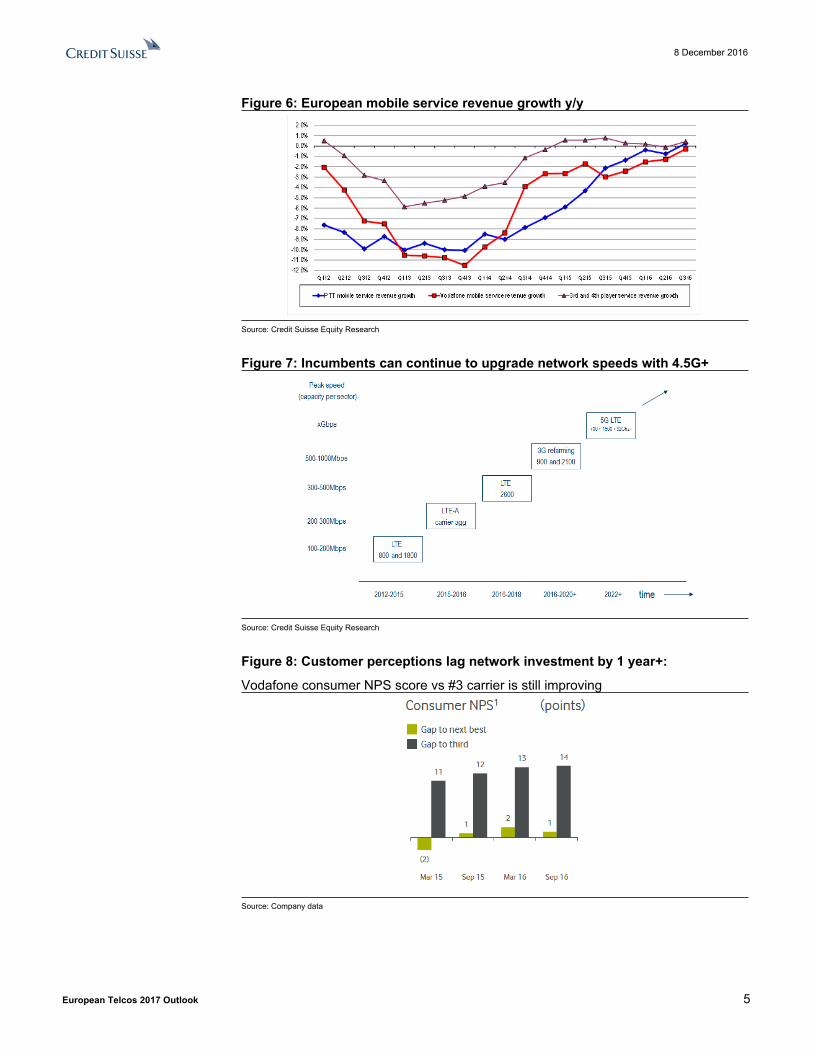
By building-out 4G (LTE) quickly, the #1 and #2 mobile networks (typically the incumbent and Vodafone) re-built some competitive advantage, leading to a slow-down in revenue erosion – see Figure 6. Increasing network capacity and falling cost/GB has also been met with rising data demand, allowing operators to protect ARPU by increasing data bundles sizes. However, as we discussed in June 2016 (4G network wars: Can the big cap telcos sustain their lead?), this competitive advantage may prove temporary, as many #3 MNOs have the same or more 4G spectrum per customer than the incumbents. TMUS has already demonstrated that incumbent leadership on 4G can be overcome, TMUS now growing >10% y/y at the expense of VZW and AT&T. Belgium, Netherlands and Switzerland are already exposed to the risk of such challengers, as reflected in our ratings (Underperform on Proximus and Swisscom, Neutral on KPN). But the larger markets of Italy and Germany also could be exposed, in theory, on a longer term (2018+) view. The risk in practice depends on how much the incumbents (Vod, TI, DT) invest in 4.5G to stay ahead and also lock customers into F-M whilst they are ahead. How this fight for 4G leadership plays-out is a decisive issue for many Telcos over 2017-2019.
Figure 5: Most exposed to #3 MNOs catching-up: Belgium, Neths, Switzerland,
Source: Credit Suisse Equity Research June 2016
8 December 2016
European Telcos 2017 Outlook 5
Figure 6: European mobile service revenue growth y/y
Source: Credit Suisse Equity Research
Figure 7: Incumbents can continue to upgrade network speeds with 4.5G+
Source: Credit Suisse Equity Research
Figure 8: Customer perceptions lag network investment by 1 year+:
Vodafone consumer NPS score vs #3 carrier is still improving
Source: Company data
8 December 2016
European Telcos 2017 Outlook 6
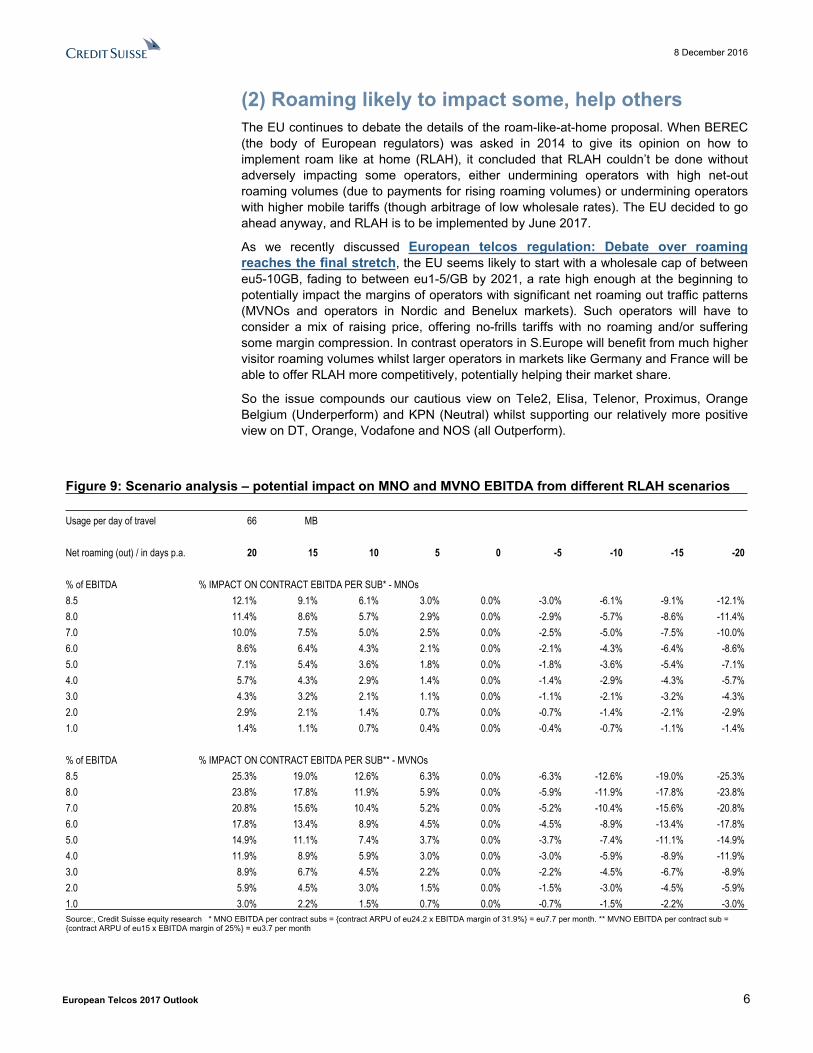
(2) Roaming likely to impact some, help othersThe EU continues to debate the details of the roam-like-at-home proposal. When BEREC (the body of European regulators) was asked in 2014 to give its opinion on how to implement roam like at home (RLAH), it concluded that RLAH couldn’t be done without adversely impacting some operators, either undermining operators with high net-out roaming volumes (due to payments for rising roaming volumes) or undermining operators with higher mobile tariffs (though arbitrage of low wholesale rates). The EU decided to go ahead anyway, and RLAH is to be implemented by June 2017.
As we recently discussed European telcos regulation: Debate over roaming reaches the final stretch, the EU seems likely to start with a wholesale cap of between eu5-10GB, fading to between eu1-5/GB by 2021, a rate high enough at the beginning to potentially impact the margins of operators with significant net roaming out traffic patterns (MVNOs and operators in Nordic and Benelux markets). Such operators will have to consider a mix of raising price, offering no-frills tariffs with no roaming and/or suffering some margin compression. In contrast operators in S.Europe will benefit from much higher visitor roaming volumes whilst larger operators in markets like Germany and France will be able to offer RLAH more competitively, potentially helping their market share.
So the issue compounds our cautious view on Tele2, Elisa, Telenor, Proximus, Orange Belgium (Underperform) and KPN (Neutral) whilst supporting our relatively more positive view on DT, Orange, Vodafone and NOS (all Outperform).
Figure 9: Scenario analysis – potential impact on MNO and MVNO EBITDA from different RLAH scenarios
Usage per day of travel 66 MB
Net roaming (out) / in days p.a. 20 15 10 5 0 -5 -10 -15 -20
% of EBITDA % IMPACT ON CONTRACT EBITDA PER SUB* - MNOs8.5 12.1% 9.1% 6.1% 3.0% 0.0% -3.0% -6.1% -9.1% -12.1%8.0 11.4% 8.6% 5.7% 2.9% 0.0% -2.9% -5.7% -8.6% -11.4%7.0 10.0% 7.5% 5.0% 2.5% 0.0% -2.5% -5.0% -7.5% -10.0%6.0 8.6% 6.4% 4.3% 2.1% 0.0% -2.1% -4.3% -6.4% -8.6%5.0 7.1% 5.4% 3.6% 1.8% 0.0% -1.8% -3.6% -5.4% -7.1%4.0 5.7% 4.3% 2.9% 1.4% 0.0% -1.4% -2.9% -4.3% -5.7%3.0 4.3% 3.2% 2.1% 1.1% 0.0% -1.1% -2.1% -3.2% -4.3%2.0 2.9% 2.1% 1.4% 0.7% 0.0% -0.7% -1.4% -2.1% -2.9%1.0 1.4% 1.1% 0.7% 0.4% 0.0% -0.4% -0.7% -1.1% -1.4%
% of EBITDA % IMPACT ON CONTRACT EBITDA PER SUB** - MVNOs8.5 25.3% 19.0% 12.6% 6.3% 0.0% -6.3% -12.6% -19.0% -25.3%8.0 23.8% 17.8% 11.9% 5.9% 0.0% -5.9% -11.9% -17.8% -23.8%7.0 20.8% 15.6% 10.4% 5.2% 0.0% -5.2% -10.4% -15.6% -20.8%6.0 17.8% 13.4% 8.9% 4.5% 0.0% -4.5% -8.9% -13.4% -17.8%5.0 14.9% 11.1% 7.4% 3.7% 0.0% -3.7% -7.4% -11.1% -14.9%4.0 11.9% 8.9% 5.9% 3.0% 0.0% -3.0% -5.9% -8.9% -11.9%3.0 8.9% 6.7% 4.5% 2.2% 0.0% -2.2% -4.5% -6.7% -8.9%2.0 5.9% 4.5% 3.0% 1.5% 0.0% -1.5% -3.0% -4.5% -5.9%1.0 3.0% 2.2% 1.5% 0.7% 0.0% -0.7% -1.5% -2.2% -3.0%Source:, Credit Suisse equity research * MNO EBITDA per contract subs = {contract ARPU of eu24.2 x EBITDA margin of 31.9%} = eu7.7 per month. ** MVNO EBITDA per contract sub = {contract ARPU of eu15 x EBITDA margin of 25%} = eu3.7 per month
8 December 2016
European Telcos 2017 Outlook 7
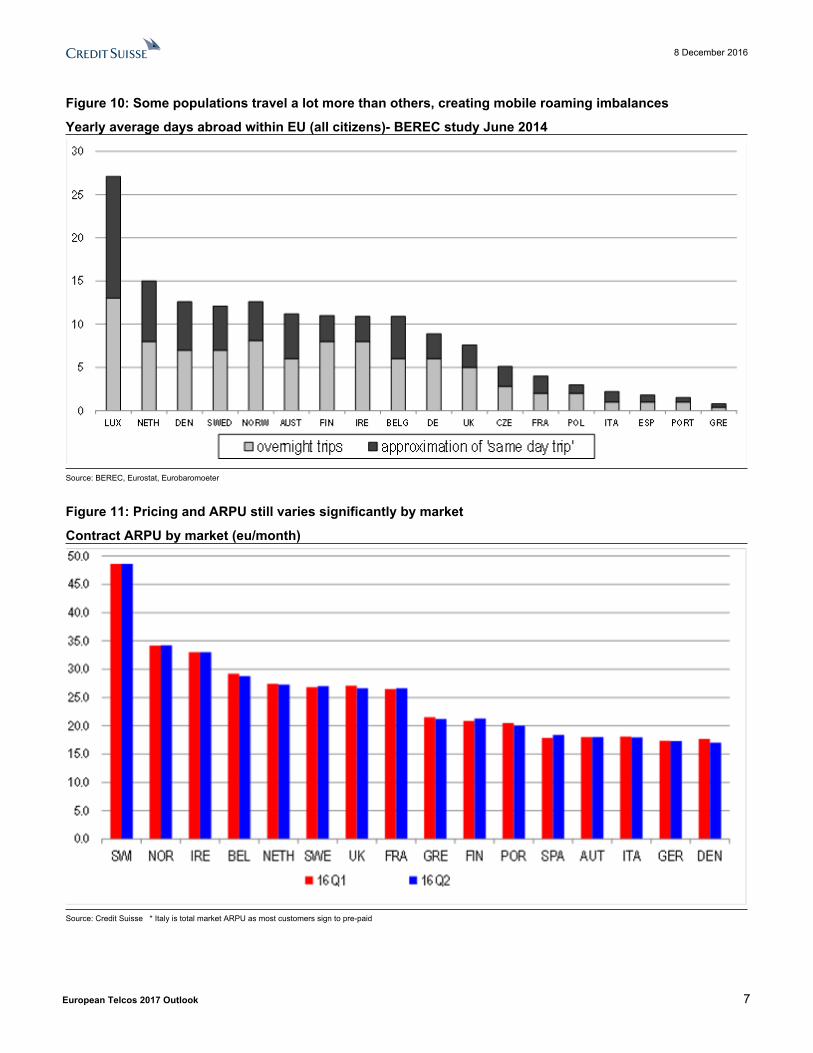
Figure 10: Some populations travel a lot more than others, creating mobile roaming imbalances
Yearly average days abroad within EU (all citizens)- BEREC study June 2014
Source: BEREC, Eurostat, Eurobaromoeter
Figure 11: Pricing and ARPU still varies significantly by market
Contract ARPU by market (eu/month)
Source: Credit Suisse * Italy is total market ARPU as most customers sign to pre-paid
8 December 2016
European Telcos 2017 Outlook 8
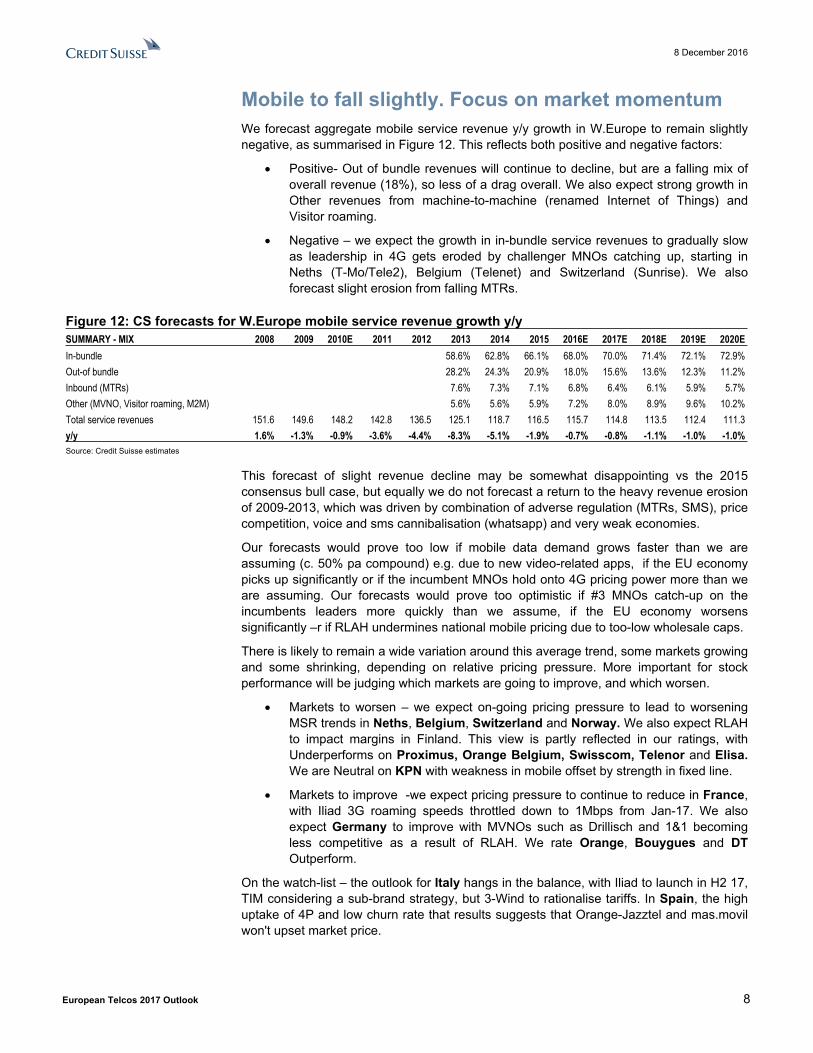
Mobile to fall slightly. Focus on market momentumWe forecast aggregate mobile service revenue y/y growth in W.Europe to remain slightly negative, as summarised in Figure 12. This reflects both positive and negative factors:
Positive- Out of bundle revenues will continue to decline, but are a falling mix of overall revenue (18%), so less of a drag overall. We also expect strong growth in Other revenues from machine-to-machine (renamed Internet of Things) and Visitor roaming.
Negative – we expect the growth in in-bundle service revenues to gradually slow as leadership in 4G gets eroded by challenger MNOs catching up, starting in Neths (T-Mo/Tele2), Belgium (Telenet) and Switzerland (Sunrise). We also forecast slight erosion from falling MTRs.
Figure 12: CS forecasts for W.Europe mobile service revenue growth y/ySUMMARY - MIX 2008 2009 2010E 2011 2012 2013 2014 2015 2016E 2017E 2018E 2019E 2020EIn-bundle 58.6% 62.8% 66.1% 68.0% 70.0% 71.4% 72.1% 72.9%Out-of bundle 28.2% 24.3% 20.9% 18.0% 15.6% 13.6% 12.3% 11.2%Inbound (MTRs) 7.6% 7.3% 7.1% 6.8% 6.4% 6.1% 5.9% 5.7%Other (MVNO, Visitor roaming, M2M) 5.6% 5.6% 5.9% 7.2% 8.0% 8.9% 9.6% 10.2%Total service revenues 151.6 149.6 148.2 142.8 136.5 125.1 118.7 116.5 115.7 114.8 113.5 112.4 111.3y/y 1.6% -1.3% -0.9% -3.6% -4.4% -8.3% -5.1% -1.9% -0.7% -0.8% -1.1% -1.0% -1.0%Source: Credit Suisse estimates
This forecast of slight revenue decline may be somewhat disappointing vs the 2015 consensus bull case, but equally we do not forecast a return to the heavy revenue erosion of 2009-2013, which was driven by combination of adverse regulation (MTRs, SMS), price competition, voice and sms cannibalisation (whatsapp) and very weak economies.
Our forecasts would prove too low if mobile data demand grows faster than we are assuming (c. 50% pa compound) e.g. due to new video-related apps, if the EU economy picks up significantly or if the incumbent MNOs hold onto 4G pricing power more than we are assuming. Our forecasts would prove too optimistic if #3 MNOs catch-up on the incumbents leaders more quickly than we assume, if the EU economy worsens significantly –r if RLAH undermines national mobile pricing due to too-low wholesale caps.
There is likely to remain a wide variation around this average trend, some markets growing and some shrinking, depending on relative pricing pressure. More important for stock performance will be judging which markets are going to improve, and which worsen.
Markets to worsen – we expect on-going pricing pressure to lead to worsening MSR trends in Neths, Belgium, Switzerland and Norway. We also expect RLAH to impact margins in Finland. This view is partly reflected in our ratings, with Underperforms on Proximus, Orange Belgium, Swisscom, Telenor and Elisa. We are Neutral on KPN with weakness in mobile offset by strength in fixed line.
Markets to improve -we expect pricing pressure to continue to reduce in France, with Iliad 3G roaming speeds throttled down to 1Mbps from Jan-17. We also expect Germany to improve with MVNOs such as Drillisch and 1&1 becoming less competitive as a result of RLAH. We rate Orange, Bouygues and DT Outperform.
On the watch-list – the outlook for Italy hangs in the balance, with Iliad to launch in H2 17, TIM considering a sub-brand strategy, but 3-Wind to rationalise tariffs. In Spain, the high uptake of 4P and low churn rate that results suggests that Orange-Jazztel and mas.movil won't upset market price.
8 December 2016
European Telcos 2017 Outlook 9
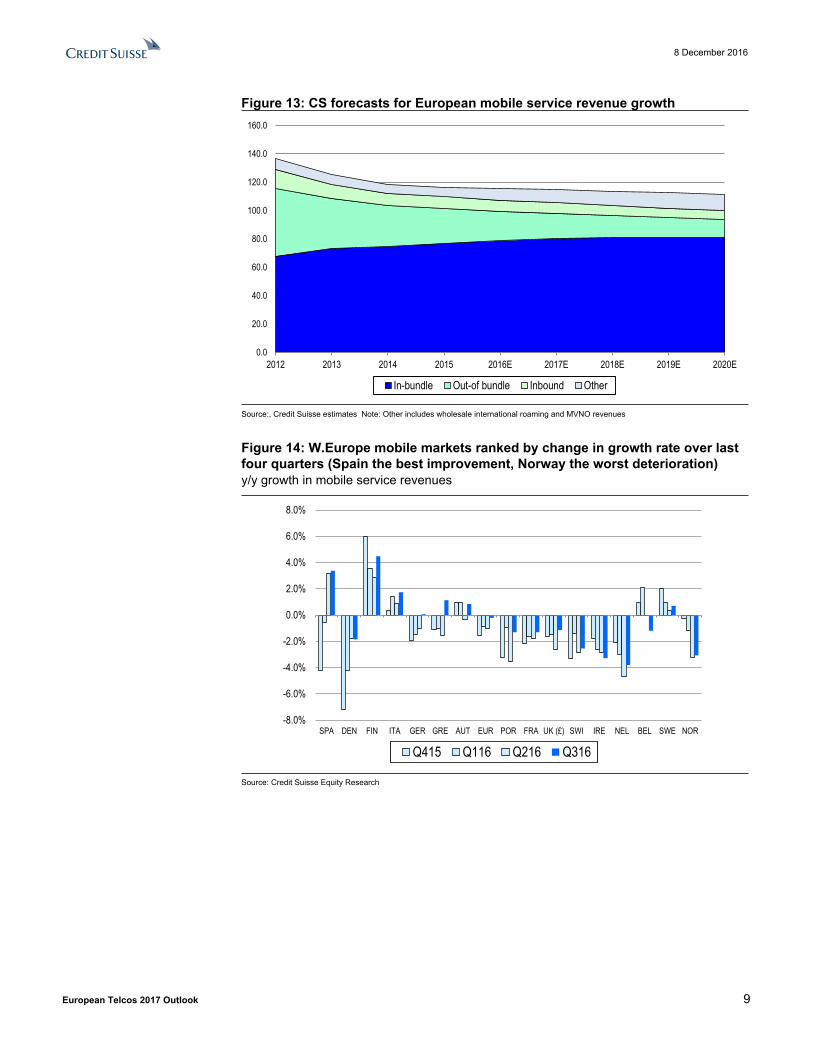
Figure 13: CS forecasts for European mobile service revenue growth
0.0
20.0
40.0
60.0
80.0
100.0
120.0
140.0
160.0
2012 2013 2014 2015 2016E 2017E 2018E 2019E 2020E
In-bundle Out-of bundle Inbound Other
Source:, Credit Suisse estimates Note: Other includes wholesale international roaming and MVNO revenues
Figure 14: W.Europe mobile markets ranked by change in growth rate over last four quarters (Spain the best improvement, Norway the worst deterioration)y/y growth in mobile service revenues
-8.0%
-6.0%
-4.0%
-2.0%
0.0%
2.0%
4.0%
6.0%
8.0%
SPA DEN FIN ITA GER GRE AUT EUR POR FRA UK (£) SWI IRE NEL BEL SWE NOR
Q415 Q116 Q216 Q316
Source: Credit Suisse Equity Research

8 December 2016
European Telcos 2017 Outlook 10
(3) Rising pressure on FTTc telcos to invest moreFigure 15: The pressure on telcos to build high speed broadband is rising
Telco investmentin high speed
broadband
ChallengersbuildingFTTH
Cable1Gbps viaDocsis3.1
5G mm-wave
1Gbps
Risingdemand for
speed
FallingCost to
Build FTTH
Increasingpublic investment
In broadband
Privateinvestment ininfrastructure
Regulationto target
100Mbps+ (?)
The pressure on Telcos to build high speed broadband is rising
Source: Credit Suisse Equity Research
As we discussed in September 2016 (Building the gigabit society - The rising pressure on telco CAPEX), there are increasing pressures on telcos that have invested in FTTc (fibre to the cabinet) to deepen their fibre networks further, responding to a combination of increased demand for FTTH speeds, increasing overbuild by competitors, increased public subsidy to fund FTTH and changing regulatory focus on 1Gbps speeds. Telcos that have invested in FTTc – including DT, BT, Telecom Italia and Proximus – face these pressures at a time when companies (e.g. Orange, LBTY) are already investing in FTTH/cable or even coming towards the end (Telefonica). This gradually changes the risk/reward among the leading stocks in the European telco sector, suggesting FTTc telcos will stop outperforming and could come to underperform in time – indeed this process may already have begun, judging from Figure 16.
Figure 16: FTTc no longer outperforming FTTH
0
50
100
150
200
250
Total
retur
n (ind
exed
29 A
ug 20
11 =
100)
FTTc basket (PROX, BT, DT, TI) FTTH basket (TEF, TELIA, ORA)FTTc basket vs FTTH basket
Source: Datastream, Credit Suisse Equity Research
8 December 2016
European Telcos 2017 Outlook 11
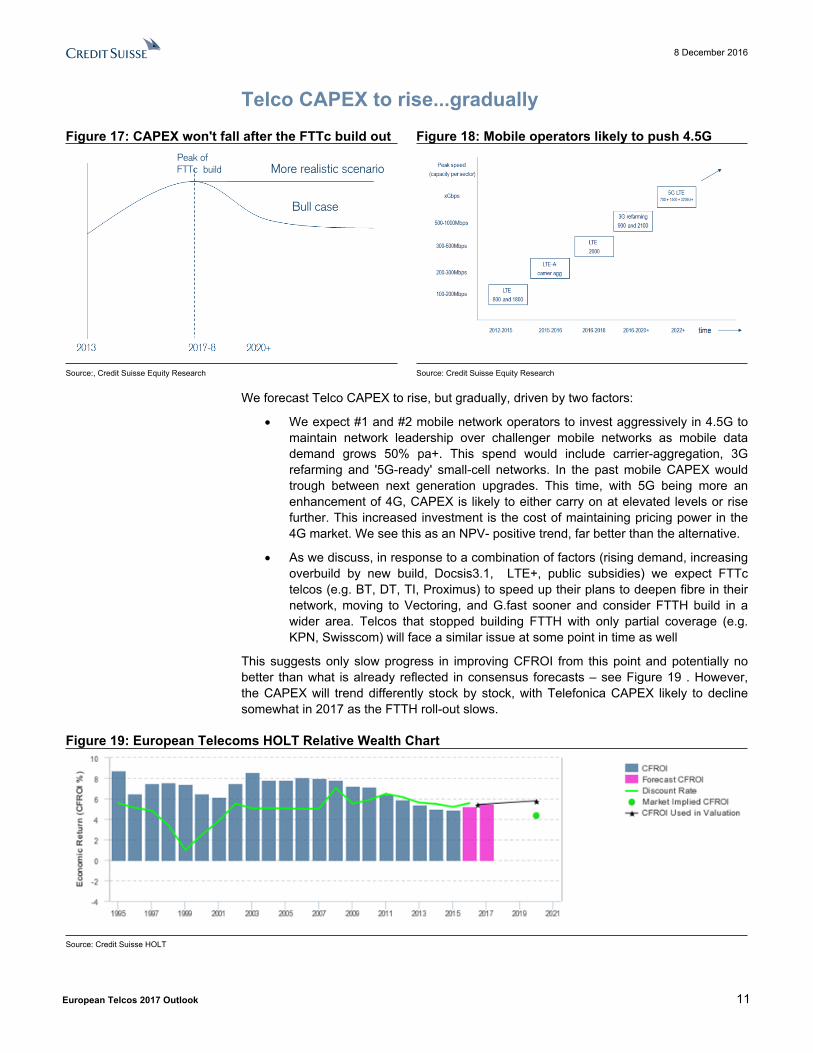
Telco CAPEX to rise...graduallyFigure 17: CAPEX won't fall after the FTTc build out Figure 18: Mobile operators likely to push 4.5G
Bull case
More realistic scenarioPeak ofFTTc build
Source:, Credit Suisse Equity Research Source: Credit Suisse Equity Research
We forecast Telco CAPEX to rise, but gradually, driven by two factors:
We expect #1 and #2 mobile network operators to invest aggressively in 4.5G to maintain network leadership over challenger mobile networks as mobile data demand grows 50% pa+. This spend would include carrier-aggregation, 3G refarming and '5G-ready' small-cell networks. In the past mobile CAPEX would trough between next generation upgrades. This time, with 5G being more an enhancement of 4G, CAPEX is likely to either carry on at elevated levels or rise further. This increased investment is the cost of maintaining pricing power in the 4G market. We see this as an NPV- positive trend, far better than the alternative.
As we discuss, in response to a combination of factors (rising demand, increasing overbuild by new build, Docsis3.1, LTE+, public subsidies) we expect FTTc telcos (e.g. BT, DT, TI, Proximus) to speed up their plans to deepen fibre in their network, moving to Vectoring, and G.fast sooner and consider FTTH build in a wider area. Telcos that stopped building FTTH with only partial coverage (e.g. KPN, Swisscom) will face a similar issue at some point in time as well
This suggests only slow progress in improving CFROI from this point and potentially no better than what is already reflected in consensus forecasts – see Figure 19 . However, the CAPEX will trend differently stock by stock, with Telefonica CAPEX likely to decline somewhat in 2017 as the FTTH roll-out slows.
Figure 19: European Telecoms HOLT Relative Wealth Chart
Source: Credit Suisse HOLT
8 December 2016
European Telcos 2017 Outlook 12
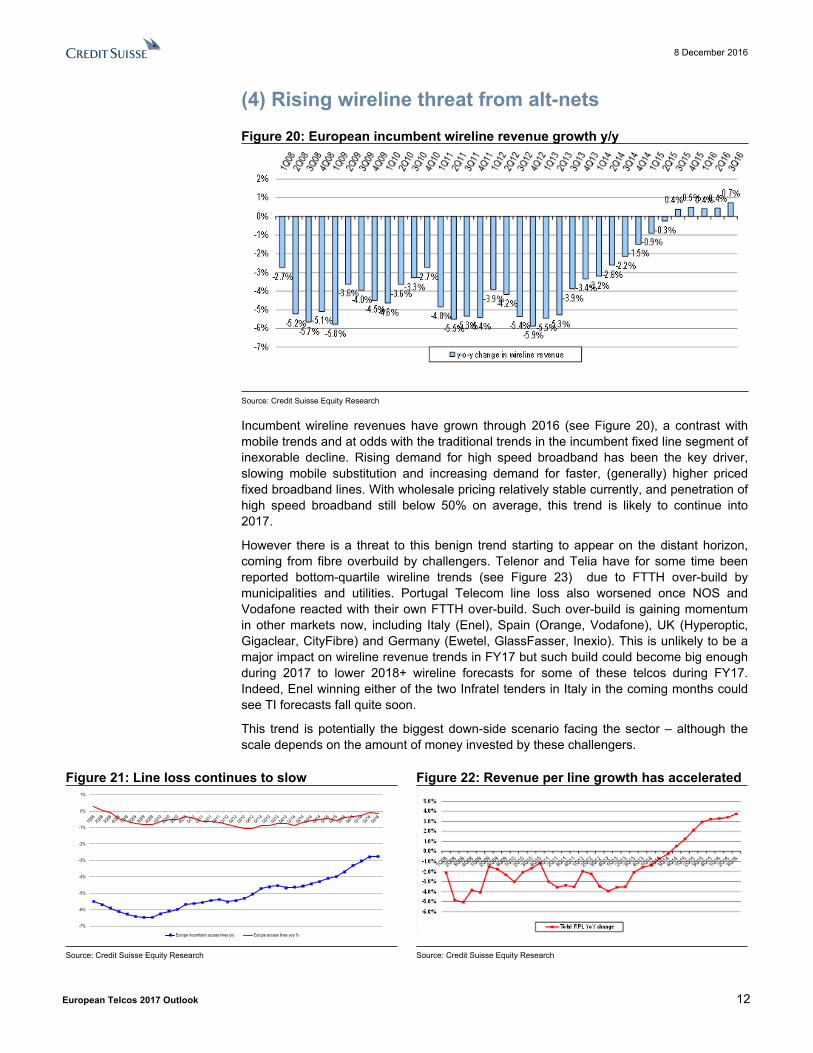
(4) Rising wireline threat from alt-nets Figure 20: European incumbent wireline revenue growth y/y
Source: Credit Suisse Equity Research
Incumbent wireline revenues have grown through 2016 (see Figure 20), a contrast with mobile trends and at odds with the traditional trends in the incumbent fixed line segment of inexorable decline. Rising demand for high speed broadband has been the key driver, slowing mobile substitution and increasing demand for faster, (generally) higher priced fixed broadband lines. With wholesale pricing relatively stable currently, and penetration of high speed broadband still below 50% on average, this trend is likely to continue into 2017.
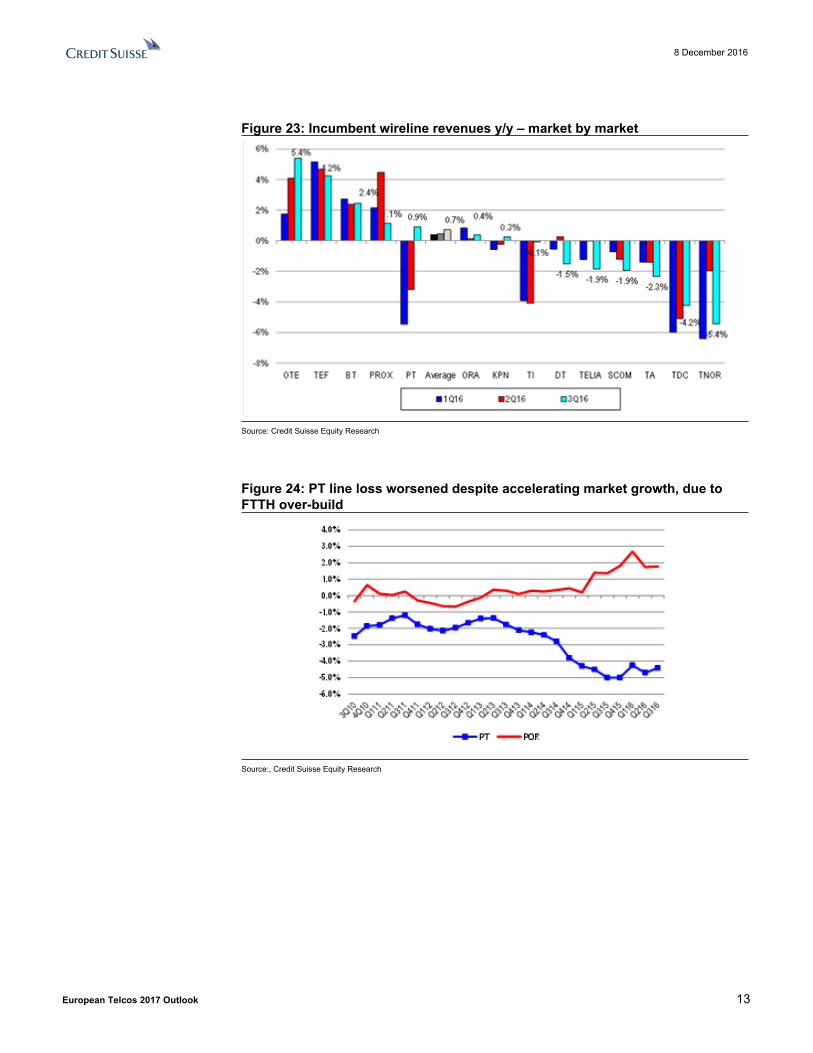
However there is a threat to this benign trend starting to appear on the distant horizon, coming from fibre overbuild by challengers. Telenor and Telia have for some time been reported bottom-quartile wireline trends (see Figure 23) due to FTTH over-build by municipalities and utilities. Portugal Telecom line loss also worsened once NOS and Vodafone reacted with their own FTTH over-build. Such over-build is gaining momentum in other markets now, including Italy (Enel), Spain (Orange, Vodafone), UK (Hyperoptic, Gigaclear, CityFibre) and Germany (Ewetel, GlassFasser, Inexio). This is unlikely to be a major impact on wireline revenue trends in FY17 but such build could become big enough during 2017 to lower 2018+ wireline forecasts for some of these telcos during FY17. Indeed, Enel winning either of the two Infratel tenders in Italy in the coming months could see TI forecasts fall quite soon.
This trend is potentially the biggest down-side scenario facing the sector – although the scale depends on the amount of money invested by these challengers.
Figure 21: Line loss continues to slow Figure 22: Revenue per line growth has accelerated
-7%
-6%
-5%
-4%
-3%
-2%
-1%
0%
1%
Europe incumbent access lines y/y Europe access lines yoy %
Source: Credit Suisse Equity Research Source: Credit Suisse Equity Research
8 December 2016
European Telcos 2017 Outlook 13
Figure 23: Incumbent wireline revenues y/y – market by market
Source: Credit Suisse Equity Research
Figure 24: PT line loss worsened despite accelerating market growth, due to FTTH over-build
Source:, Credit Suisse Equity Research

8 December 2016
European Telcos 2017 Outlook 14
(5) Telcos to redouble focus on F-M convergence Operators that have encouraged customers to migrate to F-M bundles have generally exhibited lower rates of churn in their mobile customer base as a result. Telefonica's mobile contract churn rate has for example fallen from c. 2.0% per month before the November 2012 launch of Fusion to 1.4% pm on the Fusion customer base today. KPN's churn rate has fallen similarly due to F-M bundles (from 20% pa to 9% pa on KPN branded mobile subs). As a result both Telefonica and KPN have been able to raise prices in the last 18 months, in contrast with most other incumbents. If competition is the main problem from an industry point of view, F-M convergence seems to be the solution.
Figure 25: Consumer adoption of F-M bundles by Telco
0%
10%
20%
30%
40%
50%
60%
70%
80%
90%
TEF ES ORA FR NOS KPN DT DE SCMN TDC PROX TI TNOR TELIA
Broadband subs on F-M bundles Mobile subs on F-M bundles
Source: Credit Suisse Equity Research
The F-M business model is likely to be tested more intensively during 2017, with the Vodafone-Ziggo merger creating a stronger competitor in Netherlands and Orange Spain currently undermining price stability with cheaper F-M offers on Jazztel. However, the outcome of such competitive moves is still likely to be substantially lower than what it would have been if Telefonica and KPN had bundled Fixed and mobile together.
F-M convergence represents a rare example of a strategy in the telco sector that has broadly 'worked'. Furthermore, it appears to be broadly supported by regulation, with anti-trust allowing F-M combinations such as BT-EE and Vod-KDG/Ono/Ziggo with relatively few concessions.
Incumbents should be trying to lock customers into F-M bundles whilst they have leadership in 4G and relatively favourable regulation of VDSL. The dilemma for incumbents that have not yet bundled their customers is the discounts most customers need to be offered to take a F-M bundle. Telefonica Spain has only recently returned to revenue and EBITDA stability with revenues falling more than 20% during the Fusion migration phase. DT is getting a reasonable degree of uptake on Magenta1, with more than 50% of consumer mobile contract gross adds without deep discounts. Proximus has recently raised the discounts on F-M offers (adding a 2GB/m SIM for eu14/m from eu20/m previously). TI (offering a c. eu10/m discount on TIM Smart F-M) and Swisscom (which offer a <10% bundle discount) could be doing more, but might jeopardise near-term EBITDA trends by doing so.
8 December 2016
European Telcos 2017 Outlook 15
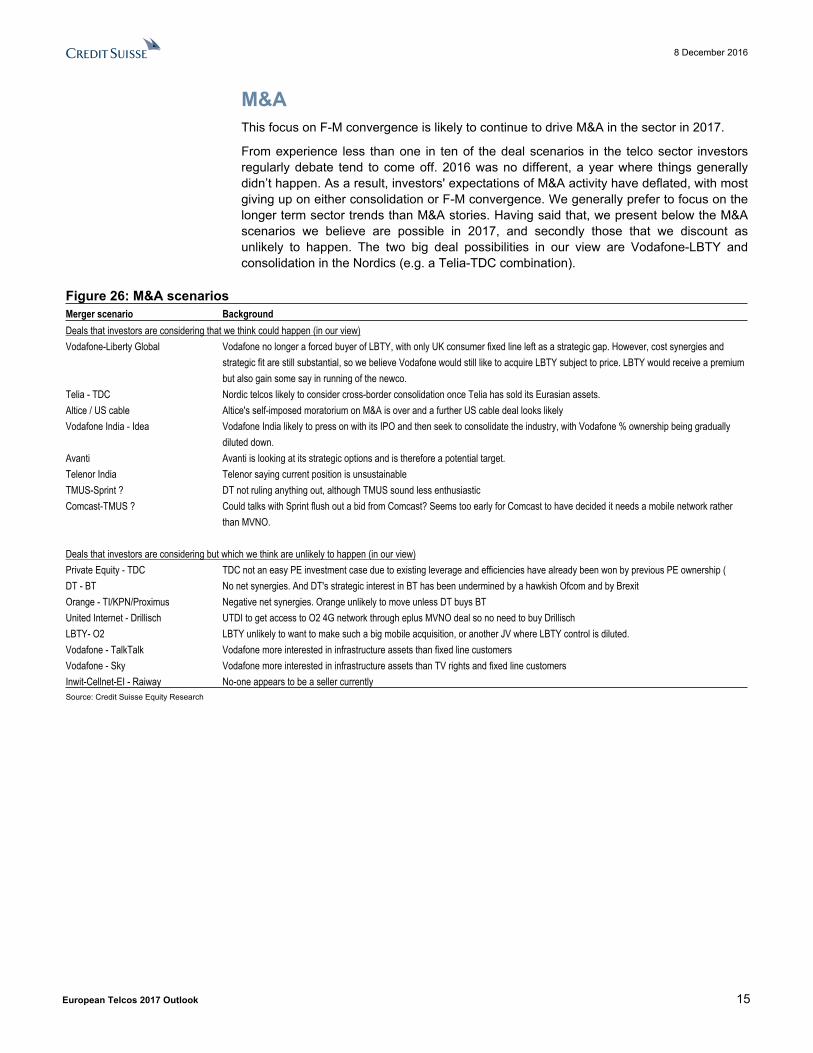
M&AThis focus on F-M convergence is likely to continue to drive M&A in the sector in 2017.
From experience less than one in ten of the deal scenarios in the telco sector investors regularly debate tend to come off. 2016 was no different, a year where things generally didn’t happen. As a result, investors' expectations of M&A activity have deflated, with most giving up on either consolidation or F-M convergence. We generally prefer to focus on the longer term sector trends than M&A stories. Having said that, we present below the M&A scenarios we believe are possible in 2017, and secondly those that we discount as unlikely to happen. The two big deal possibilities in our view are Vodafone-LBTY and consolidation in the Nordics (e.g. a Telia-TDC combination).
Figure 26: M&A scenariosMerger scenario BackgroundDeals that investors are considering that we think could happen (in our view)Vodafone-Liberty Global Vodafone no longer a forced buyer of LBTY, with only UK consumer fixed line left as a strategic gap. However, cost synergies and
strategic fit are still substantial, so we believe Vodafone would still like to acquire LBTY subject to price. LBTY would receive a premium but also gain some say in running of the newco.
Telia - TDC Nordic telcos likely to consider cross-border consolidation once Telia has sold its Eurasian assets.Altice / US cable Altice's self-imposed moratorium on M&A is over and a further US cable deal looks likelyVodafone India - Idea Vodafone India likely to press on with its IPO and then seek to consolidate the industry, with Vodafone % ownership being gradually
diluted down.Avanti Avanti is looking at its strategic options and is therefore a potential target.Telenor India Telenor saying current position is unsustainableTMUS-Sprint ? DT not ruling anything out, although TMUS sound less enthusiasticComcast-TMUS ? Could talks with Sprint flush out a bid from Comcast? Seems too early for Comcast to have decided it needs a mobile network rather
than MVNO.
Deals that investors are considering but which we think are unlikely to happen (in our view)Private Equity - TDC TDC not an easy PE investment case due to existing leverage and efficiencies have already been won by previous PE ownership (DT - BT No net synergies. And DT's strategic interest in BT has been undermined by a hawkish Ofcom and by BrexitOrange - TI/KPN/Proximus Negative net synergies. Orange unlikely to move unless DT buys BTUnited Internet - Drillisch UTDI to get access to O2 4G network through eplus MVNO deal so no need to buy DrillischLBTY- O2 LBTY unlikely to want to make such a big mobile acquisition, or another JV where LBTY control is diluted.Vodafone - TalkTalk Vodafone more interested in infrastructure assets than fixed line customersVodafone - Sky Vodafone more interested in infrastructure assets than TV rights and fixed line customersInwit-Cellnet-EI - Raiway No-one appears to be a seller currentlySource: Credit Suisse Equity Research
8 December 2016
European Telcos 2017 Outlook 16
(6) Increasing regulatory divergence The European telco sector has for two decades been driven by common regulatory themes emerging from the EU, starting with liberalisation in the mid 1990s', licensing of mobile spectrum to new operators (1995-2002), disruptive fixed line access regulation (ULL) from 2002 and more recently BULRIC MTRs (2007-2013) and roaming regulation (2007-2016+). These EU initiatives have been sector wide, generally deflationary and disruptive to telco sector returns.
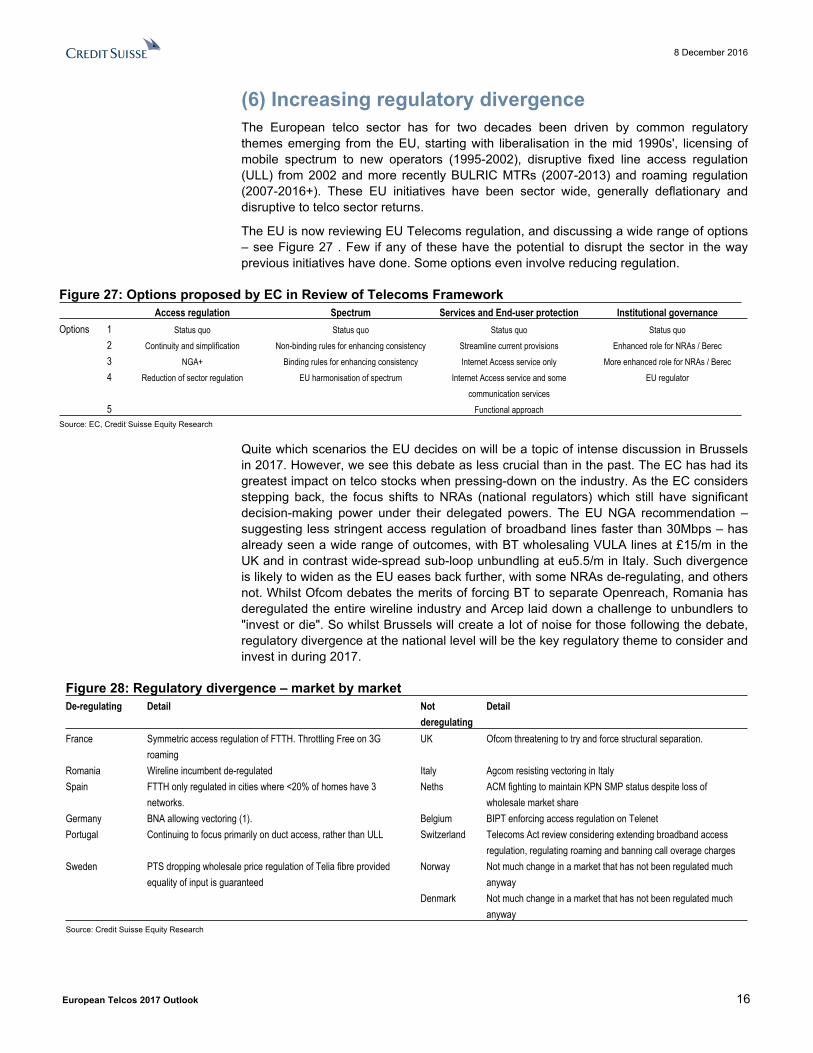
The EU is now reviewing EU Telecoms regulation, and discussing a wide range of options – see Figure 27 . Few if any of these have the potential to disrupt the sector in the way previous initiatives have done. Some options even involve reducing regulation.
Figure 27: Options proposed by EC in Review of Telecoms FrameworkAccess regulation Spectrum Services and End-user protection Institutional governance
Options 1 Status quo Status quo Status quo Status quo2 Continuity and simplification Non-binding rules for enhancing consistency Streamline current provisions Enhanced role for NRAs / Berec3 NGA+ Binding rules for enhancing consistency Internet Access service only More enhanced role for NRAs / Berec4 Reduction of sector regulation EU harmonisation of spectrum Internet Access service and some
communication servicesEU regulator
5 Functional approachSource: EC, Credit Suisse Equity Research
Quite which scenarios the EU decides on will be a topic of intense discussion in Brussels in 2017. However, we see this debate as less crucial than in the past. The EC has had its greatest impact on telco stocks when pressing-down on the industry. As the EC considers stepping back, the focus shifts to NRAs (national regulators) which still have significant decision-making power under their delegated powers. The EU NGA recommendation – suggesting less stringent access regulation of broadband lines faster than 30Mbps – has already seen a wide range of outcomes, with BT wholesaling VULA lines at £15/m in the UK and in contrast wide-spread sub-loop unbundling at eu5.5/m in Italy. Such divergence is likely to widen as the EU eases back further, with some NRAs de-regulating, and others not. Whilst Ofcom debates the merits of forcing BT to separate Openreach, Romania has deregulated the entire wireline industry and Arcep laid down a challenge to unbundlers to "invest or die". So whilst Brussels will create a lot of noise for those following the debate, regulatory divergence at the national level will be the key regulatory theme to consider and invest in during 2017.
Figure 28: Regulatory divergence – market by marketDe-regulating Detail Not
deregulatingDetail
France Symmetric access regulation of FTTH. Throttling Free on 3G roaming
UK Ofcom threatening to try and force structural separation.
Romania Wireline incumbent de-regulated Italy Agcom resisting vectoring in ItalySpain FTTH only regulated in cities where <20% of homes have 3
networks.Neths ACM fighting to maintain KPN SMP status despite loss of
wholesale market shareGermany BNA allowing vectoring (1). Belgium BIPT enforcing access regulation on TelenetPortugal Continuing to focus primarily on duct access, rather than ULL Switzerland Telecoms Act review considering extending broadband access
regulation, regulating roaming and banning call overage chargesSweden PTS dropping wholesale price regulation of Telia fibre provided
equality of input is guaranteedNorway Not much change in a market that has not been regulated much
anywayDenmark Not much change in a market that has not been regulated much
anywaySource: Credit Suisse Equity Research
8 December 2016
European Telcos 2017 Outlook 17
(7) International generally suffering from increasing competition and regulation. TMUS the big exception.International exposure remains a decisive factor for European relative performance. Much of the world's telecoms markets are suffering the same trend of increasing regulation and competition that Europe has suffered from, so International stopped being a driver of outperformance some years ago. However exposure varies by market, and by market position.
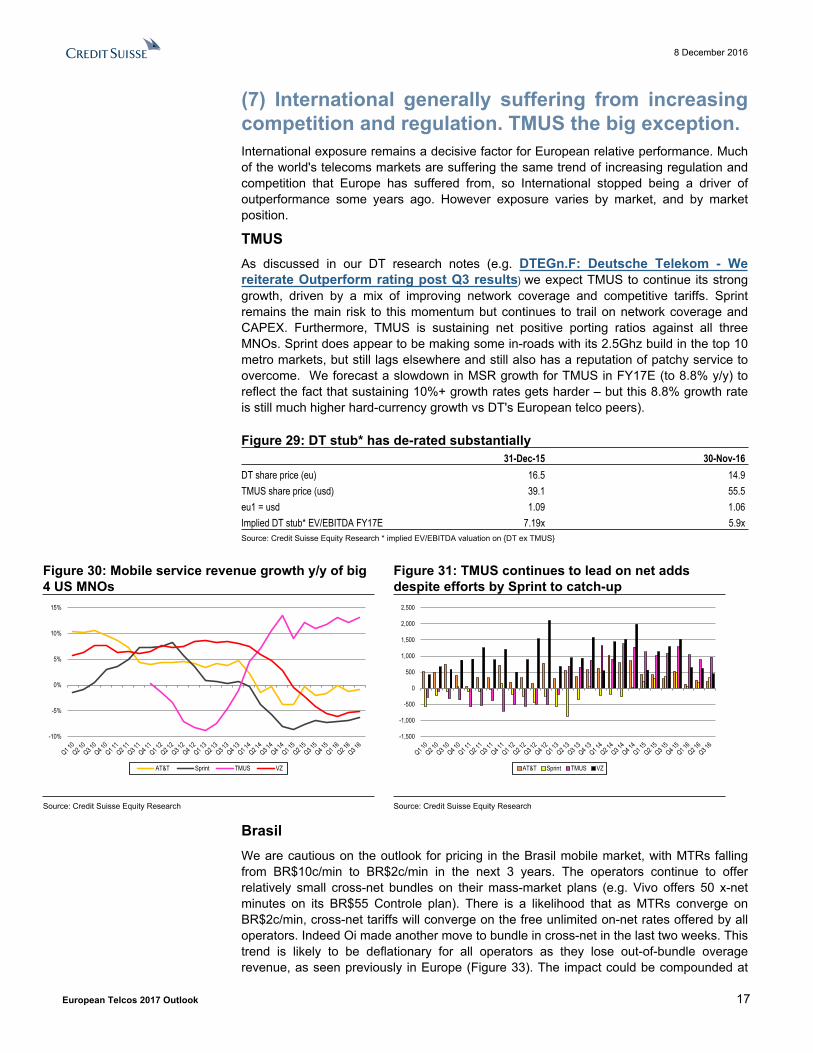
TMUSAs discussed in our DT research notes (e.g. DTEGn.F: Deutsche Telekom - We reiterate Outperform rating post Q3 results) we expect TMUS to continue its strong growth, driven by a mix of improving network coverage and competitive tariffs. Sprint remains the main risk to this momentum but continues to trail on network coverage and CAPEX. Furthermore, TMUS is sustaining net positive porting ratios against all three MNOs. Sprint does appear to be making some in-roads with its 2.5Ghz build in the top 10 metro markets, but still lags elsewhere and still also has a reputation of patchy service to overcome. We forecast a slowdown in MSR growth for TMUS in FY17E (to 8.8% y/y) to reflect the fact that sustaining 10%+ growth rates gets harder – but this 8.8% growth rate is still much higher hard-currency growth vs DT's European telco peers).
Figure 29: DT stub* has de-rated substantially31-Dec-15 30-Nov-16
DT share price (eu) 16.5 14.9TMUS share price (usd) 39.1 55.5eu1 = usd 1.09 1.06Implied DT stub* EV/EBITDA FY17E 7.19x 5.9xSource: Credit Suisse Equity Research * implied EV/EBITDA valuation on {DT ex TMUS}
Figure 30: Mobile service revenue growth y/y of big 4 US MNOs
Figure 31: TMUS continues to lead on net adds despite efforts by Sprint to catch-up
-10%
-5%
0%
5%
10%
15%
AT&T Sprint TMUS VZ
-1,500
-1,000
-500
0
500
1,000
1,500
2,000
2,500
AT&T Sprint TMUS VZ
Source: Credit Suisse Equity Research Source: Credit Suisse Equity Research
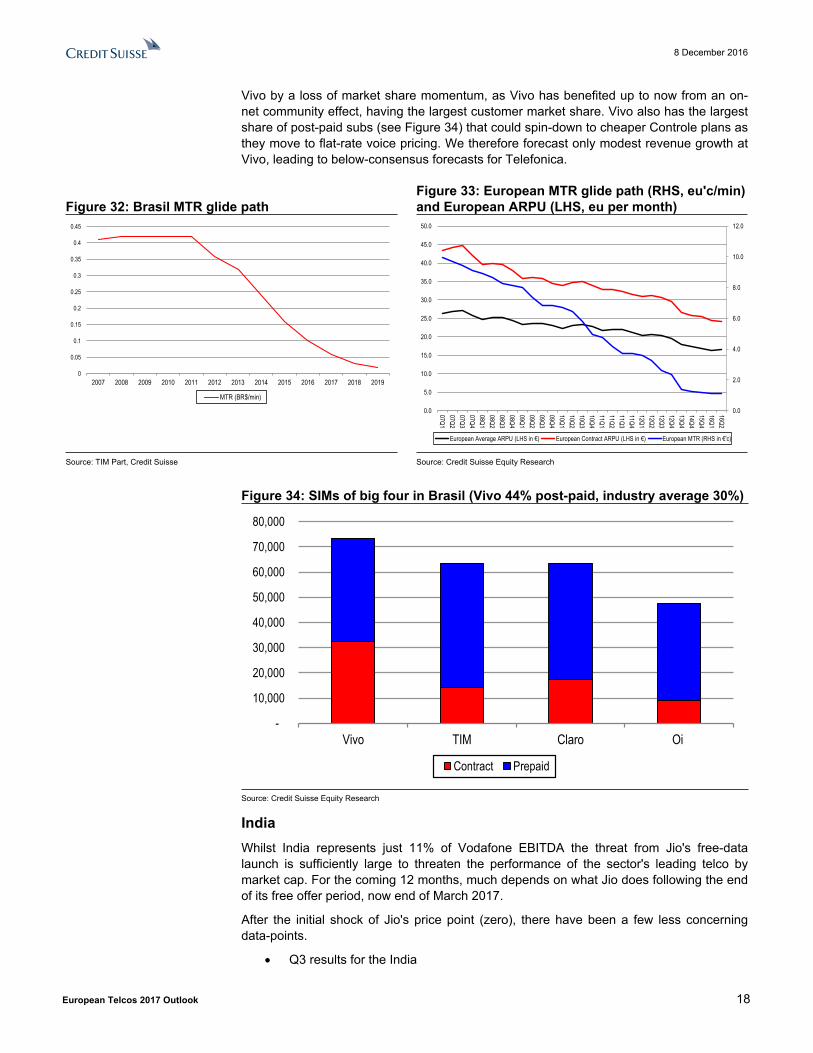
BrasilWe are cautious on the outlook for pricing in the Brasil mobile market, with MTRs falling from BR$10c/min to BR$2c/min in the next 3 years. The operators continue to offer relatively small cross-net bundles on their mass-market plans (e.g. Vivo offers 50 x-net minutes on its BR$55 Controle plan). There is a likelihood that as MTRs converge on BR$2c/min, cross-net tariffs will converge on the free unlimited on-net rates offered by all operators. Indeed Oi made another move to bundle in cross-net in the last two weeks. This trend is likely to be deflationary for all operators as they lose out-of-bundle overage revenue, as seen previously in Europe (Figure 33). The impact could be compounded at
8 December 2016
European Telcos 2017 Outlook 18
Vivo by a loss of market share momentum, as Vivo has benefited up to now from an on-net community effect, having the largest customer market share. Vivo also has the largest share of post-paid subs (see Figure 34) that could spin-down to cheaper Controle plans as they move to flat-rate voice pricing. We therefore forecast only modest revenue growth at Vivo, leading to below-consensus forecasts for Telefonica.
Figure 32: Brasil MTR glide pathFigure 33: European MTR glide path (RHS, eu'c/min) and European ARPU (LHS, eu per month)
0
0.05
0.1
0.15
0.2
0.25
0.3
0.35
0.4
0.45
2007 2008 2009 2010 2011 2012 2013 2014 2015 2016 2017 2018 2019
MTR (BR$/min)
0.0
2.0
4.0
6.0
8.0
10.0
12.0
0.0
5.0
10.0
15.0
20.0
25.0
30.0
35.0
40.0
45.0
50.0
07Q107Q207Q307Q408Q108Q208Q308Q409Q109Q209Q309Q410Q110Q210Q310Q411Q111Q211Q311Q412Q112Q212Q312Q413Q414Q415Q416Q116Q2
European Average ARPU (LHS in €) European Contract ARPU (LHS in €) European MTR (RHS in €'c)
Source: TIM Part, Credit Suisse Source: Credit Suisse Equity Research
Figure 34: SIMs of big four in Brasil (Vivo 44% post-paid, industry average 30%)
-
10,000
20,000
30,000
40,000
50,000
60,000
70,000
80,000
Vivo TIM Claro Oi
Contract Prepaid
Source: Credit Suisse Equity Research
IndiaWhilst India represents just 11% of Vodafone EBITDA the threat from Jio's free-data launch is sufficiently large to threaten the performance of the sector's leading telco by market cap. For the coming 12 months, much depends on what Jio does following the end of its free offer period, now end of March 2017.
After the initial shock of Jio's price point (zero), there have been a few less concerning data-points.
Q3 results for the India
8 December 2016
European Telcos 2017 Outlook 19
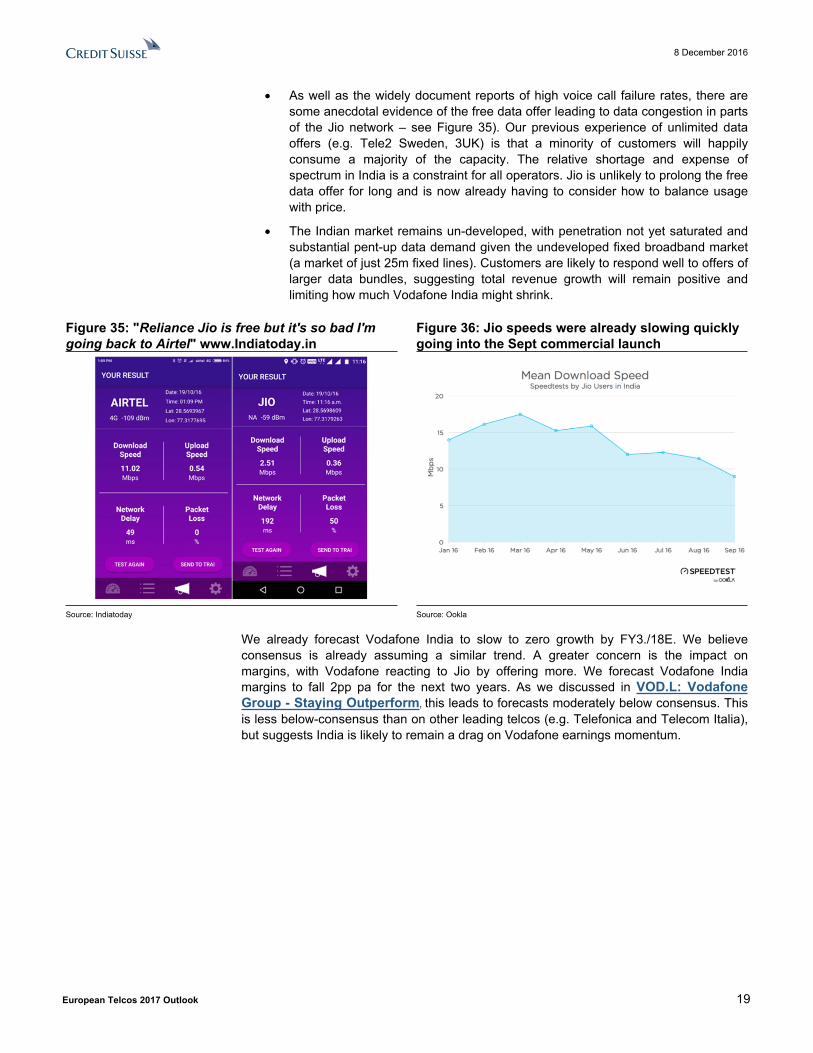
As well as the widely document reports of high voice call failure rates, there are some anecdotal evidence of the free data offer leading to data congestion in parts of the Jio network – see Figure 35). Our previous experience of unlimited data offers (e.g. Tele2 Sweden, 3UK) is that a minority of customers will happily consume a majority of the capacity. The relative shortage and expense of spectrum in India is a constraint for all operators. Jio is unlikely to prolong the free data offer for long and is now already having to consider how to balance usage with price.
The Indian market remains un-developed, with penetration not yet saturated and substantial pent-up data demand given the undeveloped fixed broadband market (a market of just 25m fixed lines). Customers are likely to respond well to offers of larger data bundles, suggesting total revenue growth will remain positive and limiting how much Vodafone India might shrink.
Figure 35: "Reliance Jio is free but it's so bad I'm going back to Airtel" www.Indiatoday.in
Figure 36: Jio speeds were already slowing quickly going into the Sept commercial launch
Source: Indiatoday Source: Ookla
We already forecast Vodafone India to slow to zero growth by FY3./18E. We believe consensus is already assuming a similar trend. A greater concern is the impact on margins, with Vodafone reacting to Jio by offering more. We forecast Vodafone India margins to fall 2pp pa for the next two years. As we discussed in VOD.L: Vodafone Group - Staying Outperform, this leads to forecasts moderately below consensus. This is less below-consensus than on other leading telcos (e.g. Telefonica and Telecom Italia), but suggests India is likely to remain a drag on Vodafone earnings momentum.

8 December 2016
European Telcos 2017 Outlook 20
(8) Macro outlook – French election a key watershedMacro trends remain a decisive issue for European Telecoms performance, with telcos running levered assets bound to the countries they operate within. Telco revenues are more geared to underlying economic performance than many investors factor-in, a point we made when downgrading BT to Neutral shortly after the Brexit referendum. We continue to expect a slow-down in BT operating momentum as the UK economy slows through the Brexit negotiation process. With BT also facing a seemingly more hawkish Ofcom and a key wholesale review in 2017, there is no hurry to upgrade our rating .
Figure 37: Italian 10 year bond yields – German 10 year bond yields (pp)
0
1
2
3
4
5
6
%
Italian 10 year bond yield over German 10 year bond yield
Source: Datastream, Credit Suisse estimates
Harder to judge, and a bigger issue for 2017 is the outlook for the euro system. The widely recognised flaws of the euro project may have been temporarily neutralised by the ECB but still face the test of voter opinion. Concerns over rising 'populism' are already part of the stock-market consensus, but the down-side of a break-down of the euro system is not priced-in. We are Telco sector not macro analysts but the stocks we cover are geared to country risk so this issue is too important to ignore.
Figure 38: Upcoming national elections or referendums among EU Member StatesEU Member State Date Election Leader eurosceptic partyItaly 4 Dec 2016 Referendum on new constitution. Democratic Party M5S - Five Star MovementAustria 4 Dec 2016 Re-run of Presidential election Freedom Party / Greens Freedom PartyNeths 15 March 2017 General election VVD led coalition PVVFrance 23 April and 7 May 2017 Presidential election Republican (Fillon) FNGermany Aug-Oct 2017 German federal election CDU/CSU, SPD AfDAustria In or before 2018 General election Austrian Green Party Freedom PartySource: Credit Suisse Equity Research
Any vote by a core Member State to leave the euro would likely widen bond yield spreads between weaker and stronger euro-zone economies – weighing on Italy and Greece, and probably Portugal and Greece, impacting the share prices of TI, OTE, NOS and Telefonica, and also Vodafone (given its geographic exposure). France would likely underperform Germany but outperform weaker eurozone economies. This process has already begun in the run up to the Italy referendum. Currently, our Outperforms happen to be more weighted more to core / N.European markets – e.g. Orange, DT, TDC. Ultimately, this eurozone question is one factor we will continue weigh when considering our telco stock ratings during the course of 2017. The French Presidential election second round on 7 May 2017 currently looks the key milestone for considering a more constructive view on S.European telcos.
8 December 2016
European Telcos 2017 Outlook 21
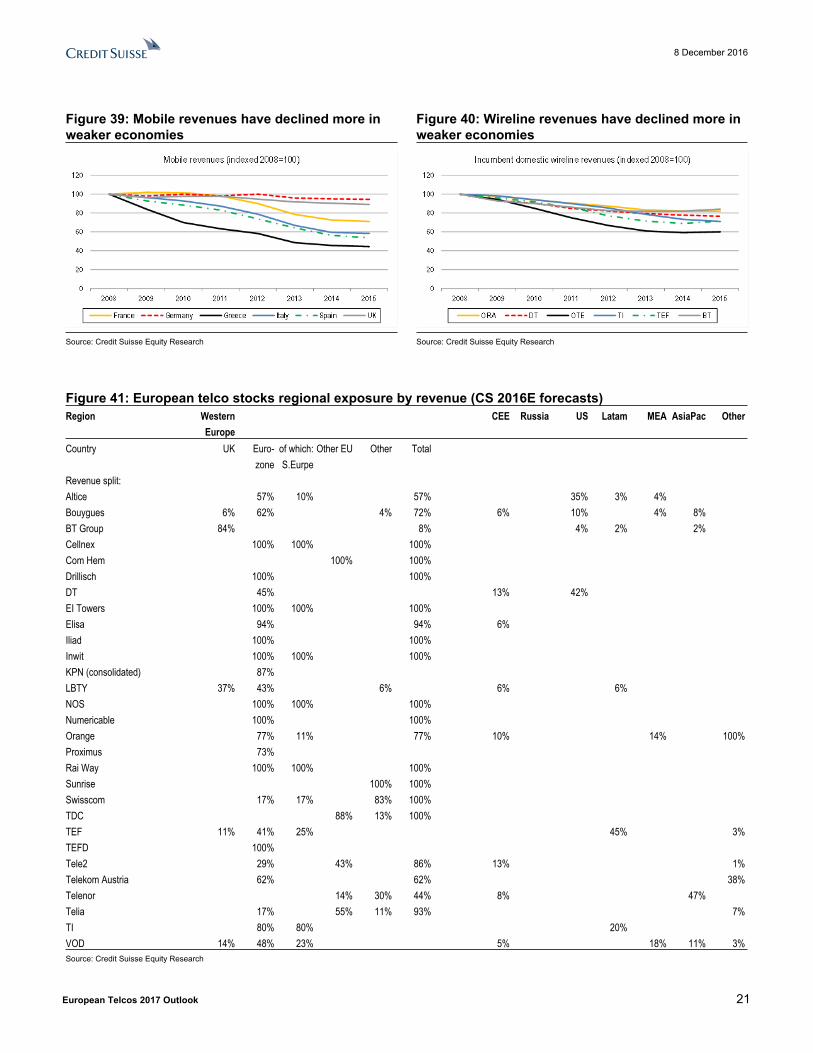
Figure 39: Mobile revenues have declined more in weaker economies
Figure 40: Wireline revenues have declined more in weaker economies
Source: Credit Suisse Equity Research Source: Credit Suisse Equity Research
Figure 41: European telco stocks regional exposure by revenue (CS 2016E forecasts)Region Western
EuropeCEE Russia US Latam MEA AsiaPac Other
Country UK Euro-zone
of which: S.Eurpe
Other EU Other Total
Revenue split:Altice 57% 10% 57% 35% 3% 4%Bouygues 6% 62% 4% 72% 6% 10% 4% 8%BT Group 84% 8% 4% 2% 2%Cellnex 100% 100% 100%Com Hem 100% 100%Drillisch 100% 100%DT 45% 13% 42%EI Towers 100% 100% 100%Elisa 94% 94% 6%Iliad 100% 100%Inwit 100% 100% 100%KPN (consolidated) 87%LBTY 37% 43% 6% 6% 6%NOS 100% 100% 100%Numericable 100% 100%Orange 77% 11% 77% 10% 14% 100%Proximus 73%Rai Way 100% 100% 100%Sunrise 100% 100%Swisscom 17% 17% 83% 100%TDC 88% 13% 100%TEF 11% 41% 25% 45% 3%TEFD 100%Tele2 29% 43% 86% 13% 1%Telekom Austria 62% 62% 38%Telenor 14% 30% 44% 8% 47%Telia 17% 55% 11% 93% 7%TI 80% 80% 20%VOD 14% 48% 23% 5% 18% 11% 3%Source: Credit Suisse Equity Research
8 December 2016
European Telcos 2017 Outlook 22
Longer term trends that are important but may not drive performance in 2017We highlight a few longer term trends that matter quite a lot to the long-term sector view but may not drive stock or sector performance much in 2017
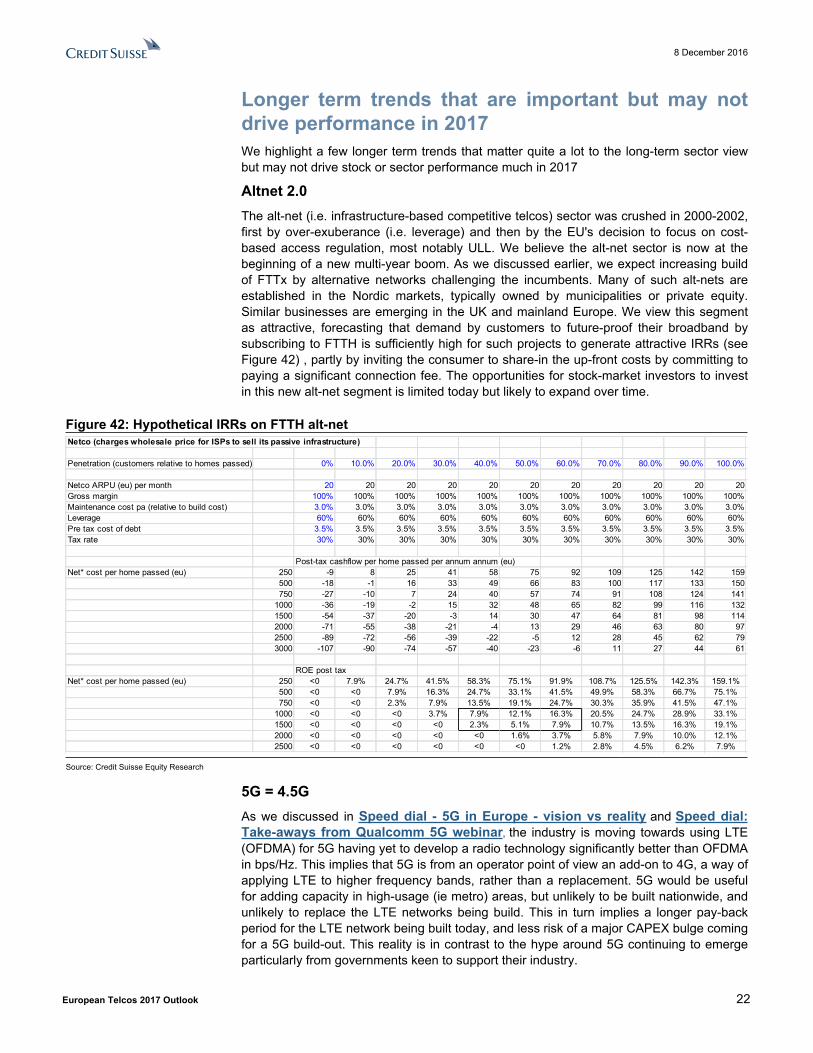
Altnet 2.0The alt-net (i.e. infrastructure-based competitive telcos) sector was crushed in 2000-2002, first by over-exuberance (i.e. leverage) and then by the EU's decision to focus on cost-based access regulation, most notably ULL. We believe the alt-net sector is now at the beginning of a new multi-year boom. As we discussed earlier, we expect increasing build of FTTx by alternative networks challenging the incumbents. Many of such alt-nets are established in the Nordic markets, typically owned by municipalities or private equity. Similar businesses are emerging in the UK and mainland Europe. We view this segment as attractive, forecasting that demand by customers to future-proof their broadband by subscribing to FTTH is sufficiently high for such projects to generate attractive IRRs (see Figure 42) , partly by inviting the consumer to share-in the up-front costs by committing to paying a significant connection fee. The opportunities for stock-market investors to invest in this new alt-net segment is limited today but likely to expand over time.
Figure 42: Hypothetical IRRs on FTTH alt-netNetco (charges wholesale price for ISPs to sell its passive infrastructure)
Penetration (customers relative to homes passed) 0% 10.0% 20.0% 30.0% 40.0% 50.0% 60.0% 70.0% 80.0% 90.0% 100.0%
Netco ARPU (eu) per month 20 20 20 20 20 20 20 20 20 20 20Gross margin 100% 100% 100% 100% 100% 100% 100% 100% 100% 100% 100%Maintenance cost pa (relative to build cost) 3.0% 3.0% 3.0% 3.0% 3.0% 3.0% 3.0% 3.0% 3.0% 3.0% 3.0%Leverage 60% 60% 60% 60% 60% 60% 60% 60% 60% 60% 60%Pre tax cost of debt 3.5% 3.5% 3.5% 3.5% 3.5% 3.5% 3.5% 3.5% 3.5% 3.5% 3.5%Tax rate 30% 30% 30% 30% 30% 30% 30% 30% 30% 30% 30%
Post-tax cashflow per home passed per annum annum (eu)Net* cost per home passed (eu) 250 -9 8 25 41 58 75 92 109 125 142 159
500 -18 -1 16 33 49 66 83 100 117 133 150750 -27 -10 7 24 40 57 74 91 108 124 141
1000 -36 -19 -2 15 32 48 65 82 99 116 1321500 -54 -37 -20 -3 14 30 47 64 81 98 1142000 -71 -55 -38 -21 -4 13 29 46 63 80 972500 -89 -72 -56 -39 -22 -5 12 28 45 62 793000 -107 -90 -74 -57 -40 -23 -6 11 27 44 61
ROE post taxNet* cost per home passed (eu) 250 <0 7.9% 24.7% 41.5% 58.3% 75.1% 91.9% 108.7% 125.5% 142.3% 159.1%
500 <0 <0 7.9% 16.3% 24.7% 33.1% 41.5% 49.9% 58.3% 66.7% 75.1%750 <0 <0 2.3% 7.9% 13.5% 19.1% 24.7% 30.3% 35.9% 41.5% 47.1%
1000 <0 <0 <0 3.7% 7.9% 12.1% 16.3% 20.5% 24.7% 28.9% 33.1%1500 <0 <0 <0 <0 2.3% 5.1% 7.9% 10.7% 13.5% 16.3% 19.1%2000 <0 <0 <0 <0 <0 1.6% 3.7% 5.8% 7.9% 10.0% 12.1%2500 <0 <0 <0 <0 <0 <0 1.2% 2.8% 4.5% 6.2% 7.9%
Source: Credit Suisse Equity Research
5G = 4.5GAs we discussed in Speed dial - 5G in Europe - vision vs reality and Speed dial: Take-aways from Qualcomm 5G webinar, the industry is moving towards using LTE (OFDMA) for 5G having yet to develop a radio technology significantly better than OFDMA in bps/Hz. This implies that 5G is from an operator point of view an add-on to 4G, a way of applying LTE to higher frequency bands, rather than a replacement. 5G would be useful for adding capacity in high-usage (ie metro) areas, but unlikely to be built nationwide, and unlikely to replace the LTE networks being build. This in turn implies a longer pay-back period for the LTE network being built today, and less risk of a major CAPEX bulge coming for a 5G build-out. This reality is in contrast to the hype around 5G continuing to emerge particularly from governments keen to support their industry.
8 December 2016
European Telcos 2017 Outlook 23
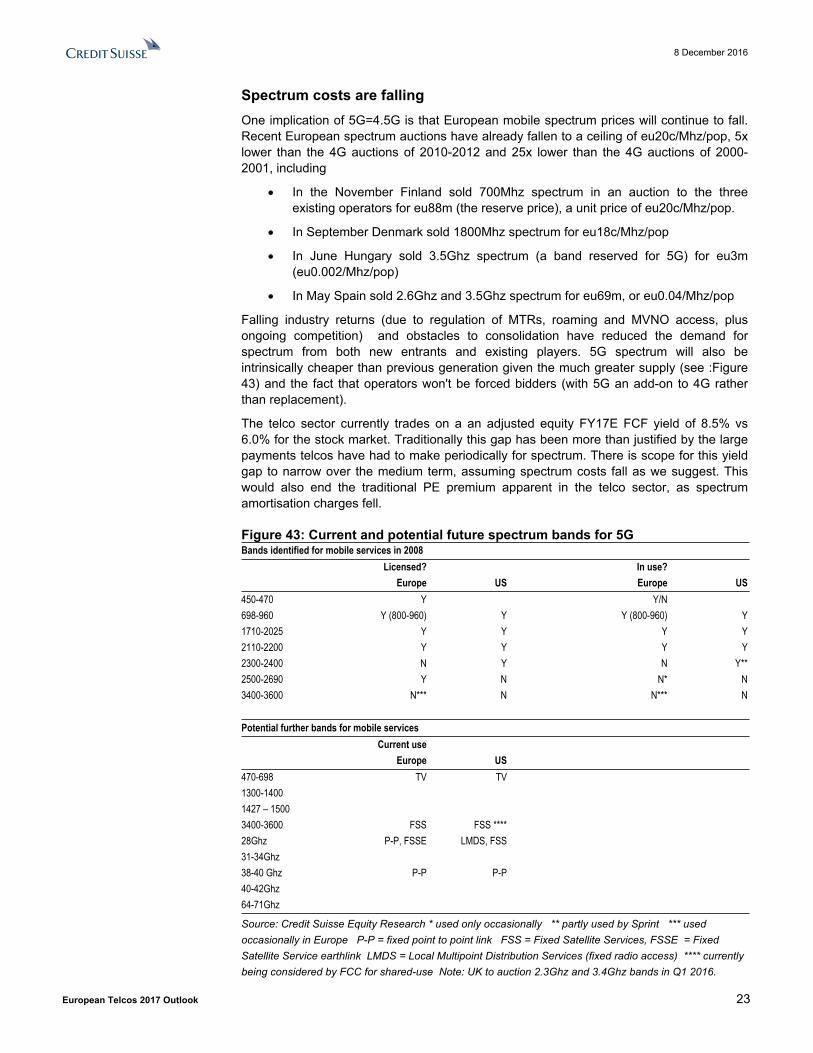
Spectrum costs are fallingOne implication of 5G=4.5G is that European mobile spectrum prices will continue to fall. Recent European spectrum auctions have already fallen to a ceiling of eu20c/Mhz/pop, 5x lower than the 4G auctions of 2010-2012 and 25x lower than the 4G auctions of 2000-2001, including
In the November Finland sold 700Mhz spectrum in an auction to the three existing operators for eu88m (the reserve price), a unit price of eu20c/Mhz/pop.
In September Denmark sold 1800Mhz spectrum for eu18c/Mhz/pop
In June Hungary sold 3.5Ghz spectrum (a band reserved for 5G) for eu3m (eu0.002/Mhz/pop)
In May Spain sold 2.6Ghz and 3.5Ghz spectrum for eu69m, or eu0.04/Mhz/pop
Falling industry returns (due to regulation of MTRs, roaming and MVNO access, plus ongoing competition) and obstacles to consolidation have reduced the demand for spectrum from both new entrants and existing players. 5G spectrum will also be intrinsically cheaper than previous generation given the much greater supply (see :Figure 43) and the fact that operators won't be forced bidders (with 5G an add-on to 4G rather than replacement).
The telco sector currently trades on a an adjusted equity FY17E FCF yield of 8.5% vs 6.0% for the stock market. Traditionally this gap has been more than justified by the large payments telcos have had to make periodically for spectrum. There is scope for this yield gap to narrow over the medium term, assuming spectrum costs fall as we suggest. This would also end the traditional PE premium apparent in the telco sector, as spectrum amortisation charges fell.
Figure 43: Current and potential future spectrum bands for 5GBands identified for mobile services in 2008
Licensed? In use?Europe US Europe US
450-470 Y Y/N698-960 Y (800-960) Y Y (800-960) Y1710-2025 Y Y Y Y2110-2200 Y Y Y Y2300-2400 N Y N Y**2500-2690 Y N N* N3400-3600 N*** N N*** N
Potential further bands for mobile servicesCurrent use
Europe US470-698 TV TV1300-14001427 – 1500 3400-3600 FSS FSS ****28Ghz P-P, FSSE LMDS, FSS31-34Ghz38-40 Ghz P-P P-P40-42Ghz64-71Ghz
Source: Credit Suisse Equity Research * used only occasionally ** partly used by Sprint *** used occasionally in Europe P-P = fixed point to point link FSS = Fixed Satellite Services, FSSE = Fixed Satellite Service earthlink LMDS = Local Multipoint Distribution Services (fixed radio access) **** currently being considered by FCC for shared-use Note: UK to auction 2.3Ghz and 3.4Ghz bands in Q1 2016.
8 December 2016
European Telcos 2017 Outlook 24
Unbundling the phoneDue to the high cost of phones, the mobile industry in Europe grew-up bundling the phone with the service contract, offering a subsidy up-front for a higher monthly payment in return. A number of trends are helping to gradually unbundle the handset from the service contract:
Growing on-line sales of mobile connections has encouraged customers to start to buy their SIM separately from their device. 4P plans that bundle in extra SIMs have also encouraged adoption of SIM-only/ contracts.
Premium devices (e.g. iPhone) have become more expensive whilst the device innovation is slowing –encouraging customers to hold onto their phone rather than upgrade every 18-24m. So customers have become more interested in buying the phone separately and signing instead to a much cheaper SIM-only contracts.
As the mobile market has matured customer credit history has developed to a point where third party finance can efficiently fund deferred payments for devices. A global secondary market for smartphones has also emerged. These trends have there is an efficient market for third party of handset receivables
IAS accounting standards have created opportunities for telcos to offer handset leases in a way that maximises EBITDA.
These trends generally lower the speed at which customers upgrade their smartphones, a trend that has eaten into the earnings growth of the OEM segment (Apple, Samsung et al). Ultimately we are left wondering why the OEMs don’t start financing the device purchase themselves, and thereby take much more control of the smartphone upgrade cycle. TMUS CEO John Legere said on the recent TMUS Q3 16 call that he would welcome such a move. Certainly it would reduce distribution costs (shutting 1000s of mobile phone shops), reduce telco working capital needs and overall balance sheet requirements, and transfer bad debt risks to the OEMs, altogether improving Telco CFROI. However longer-term, it could hasten the full disintermediation of the telco relationship with the end-customer, particularly if the OEM evolved towards an eSim, roaming over competing mobile networks. We continue to see RLAH as a long-term catalyst for such a business model for the OEMs, allowing those with market power (currently Apple, maybe Samsung) to preinstall a one-SIM/one-price service for devices sold across the EU and arbitrage the MNOs. This is viable if the wholesale roaming caps are set low enough, as the Parliament for example is proposing (eu1/GB by 2021). As well as giving the OEMs more control over device upgrades, this approach would give them a new service stream. So we see a trend by the mobile operators towards fully unbundling the device from the service contract as a rather risky long-term move, with some positives up-front.
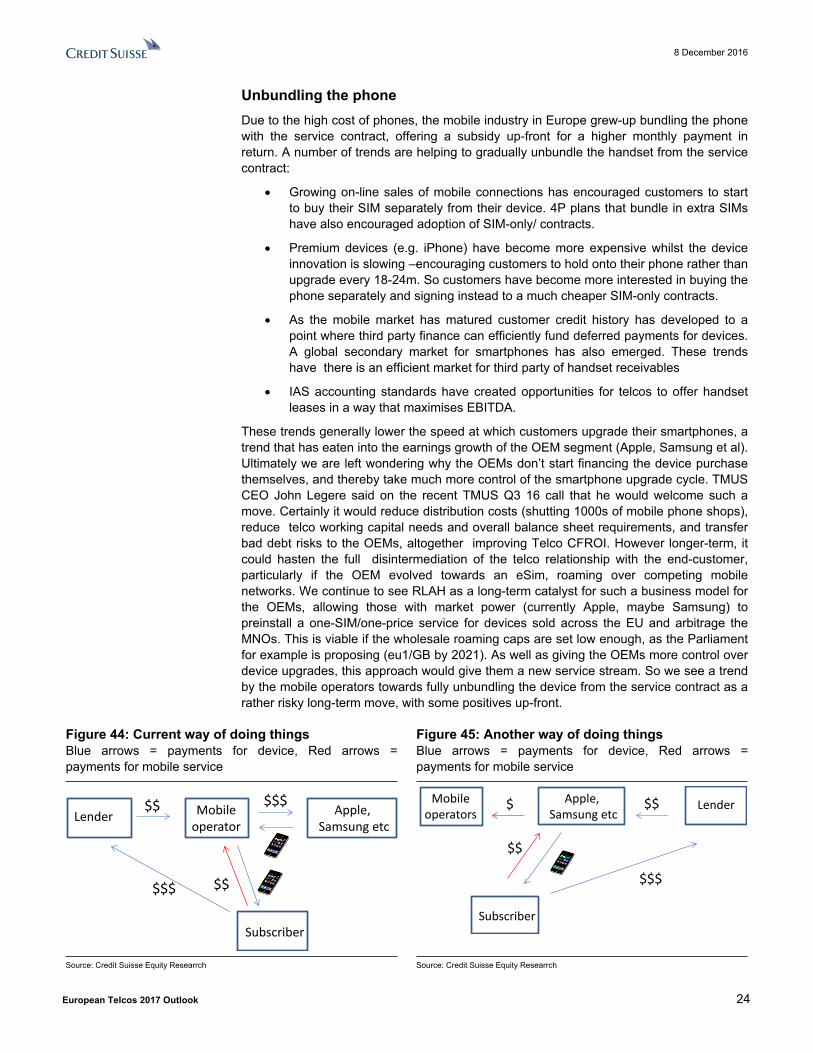
Figure 44: Current way of doing thingsBlue arrows = payments for device, Red arrows = payments for mobile service
Figure 45: Another way of doing thingsBlue arrows = payments for device, Red arrows = payments for mobile service
Apple,Samsung etc
$$$Mobile
operator
Subscriber
Lender
$$$
$$
$$
Apple,Samsung etc
Mobileoperators
Subscriber
Lender
$$$
$$
$$
$
Source: Credit Suisse Equity Researrch Source: Credit Suisse Equity Researrch
8 December 2016
European Telcos 2017 Outlook 25
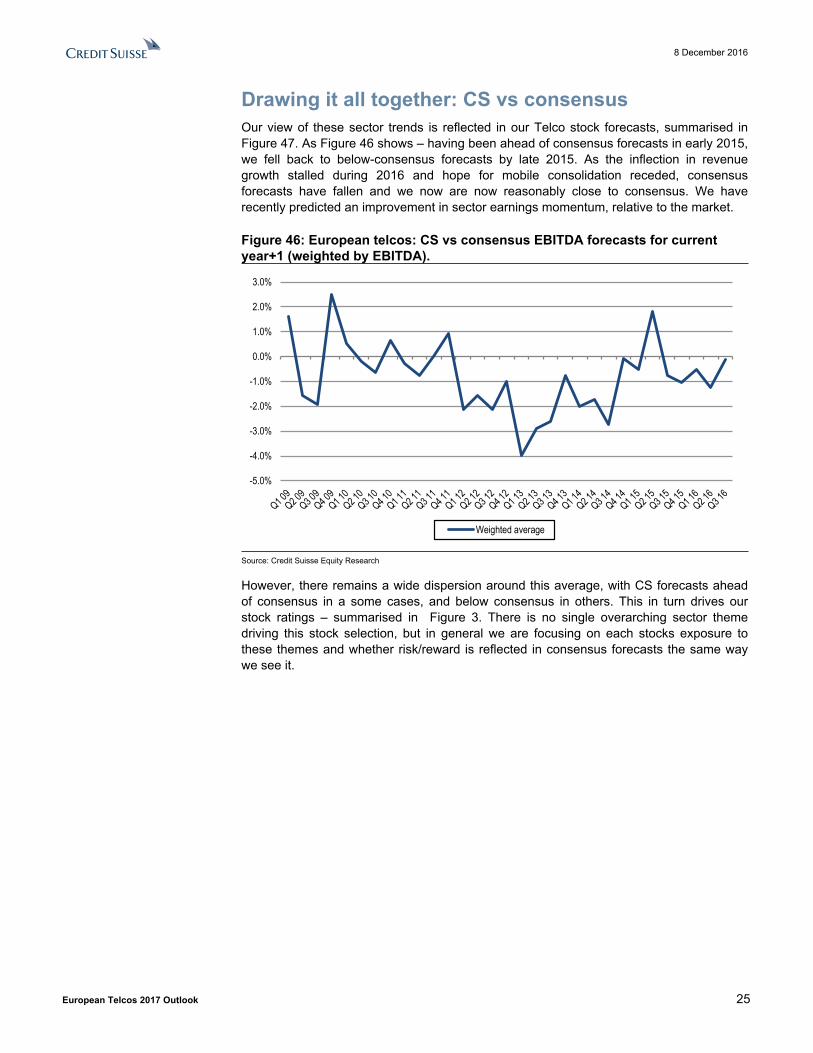
Drawing it all together: CS vs consensusOur view of these sector trends is reflected in our Telco stock forecasts, summarised in Figure 47. As Figure 46 shows – having been ahead of consensus forecasts in early 2015, we fell back to below-consensus forecasts by late 2015. As the inflection in revenue growth stalled during 2016 and hope for mobile consolidation receded, consensus forecasts have fallen and we now are now reasonably close to consensus. We have recently predicted an improvement in sector earnings momentum, relative to the market.
Figure 46: European telcos: CS vs consensus EBITDA forecasts for current year+1 (weighted by EBITDA).
-5.0%
-4.0%
-3.0%
-2.0%
-1.0%
0.0%
1.0%
2.0%
3.0%
Weighted average
Source: Credit Suisse Equity Research
However, there remains a wide dispersion around this average, with CS forecasts ahead of consensus in a some cases, and below consensus in others. This in turn drives our stock ratings – summarised in Figure 3. There is no single overarching sector theme driving this stock selection, but in general we are focusing on each stocks exposure to these themes and whether risk/reward is reflected in consensus forecasts the same way we see it.
8 Decem
ber 2016
European Telcos 2017 Outlook
26
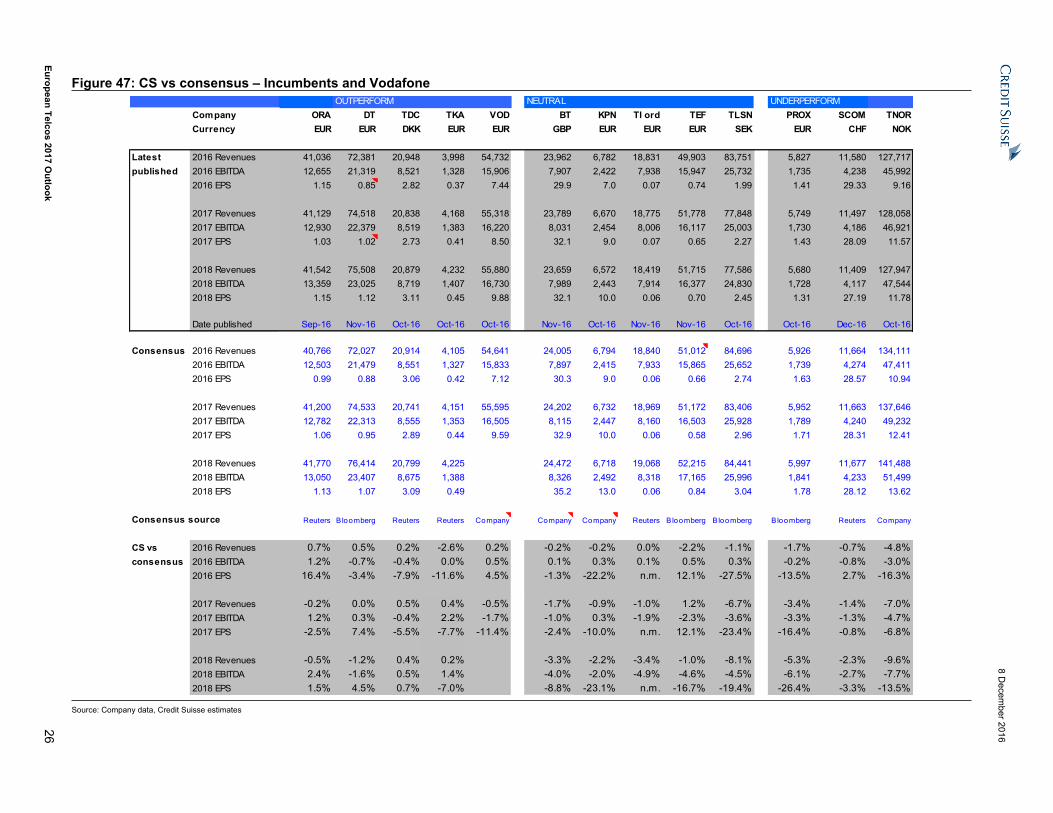
Figure 47: CS vs consensus – Incumbents and VodafoneOUTPERFORM NEUTRAL UNDERPERFORM
Company ORA DT TDC TKA VOD BT KPN TI ord TEF TLSN PROX SCOM TNORCurrency EUR EUR DKK EUR EUR GBP EUR EUR EUR SEK EUR CHF NOK
Latest 2016 Revenues 41,036 72,381 20,948 3,998 54,732 23,962 6,782 18,831 49,903 83,751 5,827 11,580 127,717published 2016 EBITDA 12,655 21,319 8,521 1,328 15,906 7,907 2,422 7,938 15,947 25,732 1,735 4,238 45,992
2016 EPS 1.15 0.85 2.82 0.37 7.44 29.9 7.0 0.07 0.74 1.99 1.41 29.33 9.16
2017 Revenues 41,129 74,518 20,838 4,168 55,318 23,789 6,670 18,775 51,778 77,848 5,749 11,497 128,0582017 EBITDA 12,930 22,379 8,519 1,383 16,220 8,031 2,454 8,006 16,117 25,003 1,730 4,186 46,9212017 EPS 1.03 1.02 2.73 0.41 8.50 32.1 9.0 0.07 0.65 2.27 1.43 28.09 11.57
2018 Revenues 41,542 75,508 20,879 4,232 55,880 23,659 6,572 18,419 51,715 77,586 5,680 11,409 127,9472018 EBITDA 13,359 23,025 8,719 1,407 16,730 7,989 2,443 7,914 16,377 24,830 1,728 4,117 47,5442018 EPS 1.15 1.12 3.11 0.45 9.88 32.1 10.0 0.06 0.70 2.45 1.31 27.19 11.78
Date published Sep-16 Nov-16 Oct-16 Oct-16 Oct-16 Nov-16 Oct-16 Nov-16 Nov-16 Oct-16 Oct-16 Dec-16 Oct-16
Consensus 2016 Revenues 40,766 72,027 20,914 4,105 54,641 24,005 6,794 18,840 51,012 84,696 5,926 11,664 134,1112016 EBITDA 12,503 21,479 8,551 1,327 15,833 7,897 2,415 7,933 15,865 25,652 1,739 4,274 47,4112016 EPS 0.99 0.88 3.06 0.42 7.12 30.3 9.0 0.06 0.66 2.74 1.63 28.57 10.94
2017 Revenues 41,200 74,533 20,741 4,151 55,595 24,202 6,732 18,969 51,172 83,406 5,952 11,663 137,6462017 EBITDA 12,782 22,313 8,555 1,353 16,505 8,115 2,447 8,160 16,503 25,928 1,789 4,240 49,2322017 EPS 1.06 0.95 2.89 0.44 9.59 32.9 10.0 0.06 0.58 2.96 1.71 28.31 12.41
2018 Revenues 41,770 76,414 20,799 4,225 24,472 6,718 19,068 52,215 84,441 5,997 11,677 141,4882018 EBITDA 13,050 23,407 8,675 1,388 8,326 2,492 8,318 17,165 25,996 1,841 4,233 51,4992018 EPS 1.13 1.07 3.09 0.49 35.2 13.0 0.06 0.84 3.04 1.78 28.12 13.62
Consensus source Reuters Bloomberg Reuters Reuters Company Company Company Reuters Bloomberg Bloomberg Bloomberg Reuters Company
CS vs 2016 Revenues 0.7% 0.5% 0.2% -2.6% 0.2% -0.2% -0.2% 0.0% -2.2% -1.1% -1.7% -0.7% -4.8%consensus 2016 EBITDA 1.2% -0.7% -0.4% 0.0% 0.5% 0.1% 0.3% 0.1% 0.5% 0.3% -0.2% -0.8% -3.0%
2016 EPS 16.4% -3.4% -7.9% -11.6% 4.5% -1.3% -22.2% n.m. 12.1% -27.5% -13.5% 2.7% -16.3%
2017 Revenues -0.2% 0.0% 0.5% 0.4% -0.5% -1.7% -0.9% -1.0% 1.2% -6.7% -3.4% -1.4% -7.0%2017 EBITDA 1.2% 0.3% -0.4% 2.2% -1.7% -1.0% 0.3% -1.9% -2.3% -3.6% -3.3% -1.3% -4.7%2017 EPS -2.5% 7.4% -5.5% -7.7% -11.4% -2.4% -10.0% n.m. 12.1% -23.4% -16.4% -0.8% -6.8%
2018 Revenues -0.5% -1.2% 0.4% 0.2% -3.3% -2.2% -3.4% -1.0% -8.1% -5.3% -2.3% -9.6%2018 EBITDA 2.4% -1.6% 0.5% 1.4% -4.0% -2.0% -4.9% -4.6% -4.5% -6.1% -2.7% -7.7%2018 EPS 1.5% 4.5% 0.7% -7.0% -8.8% -23.1% n.m. -16.7% -19.4% -26.4% -3.3% -13.5%
Source: Company data, Credit Suisse estimates
8 December 2016
European Telcos 2017 Outlook 27
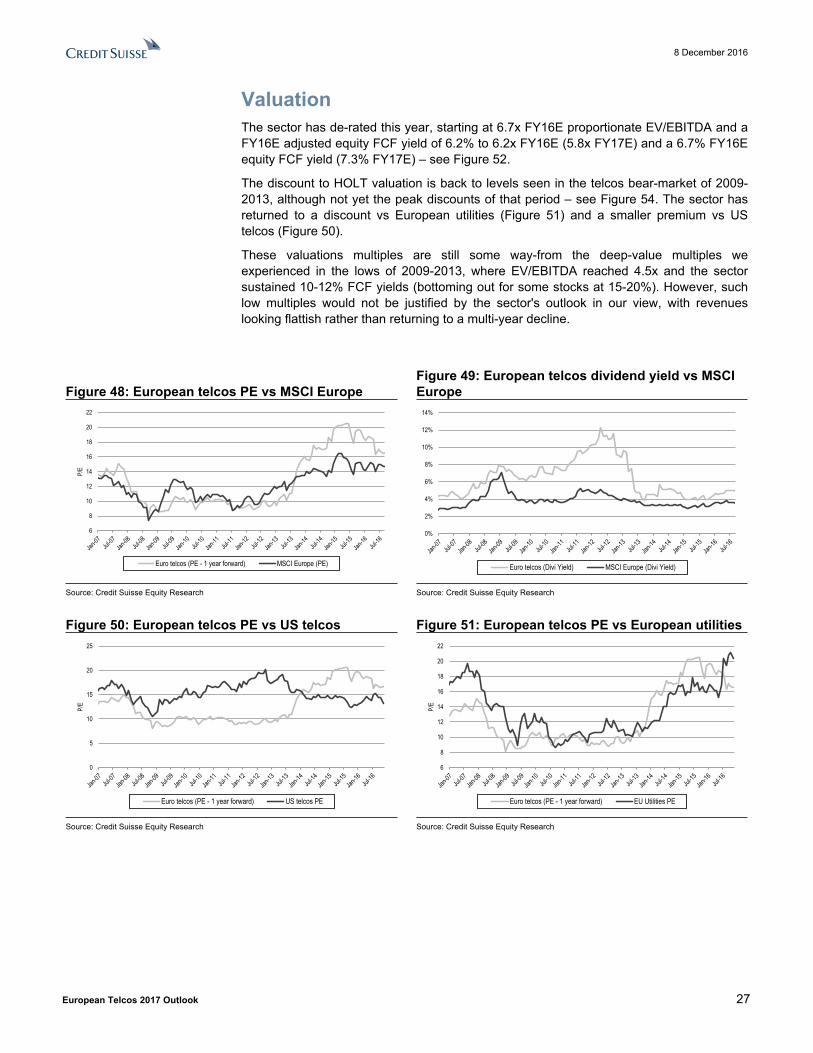
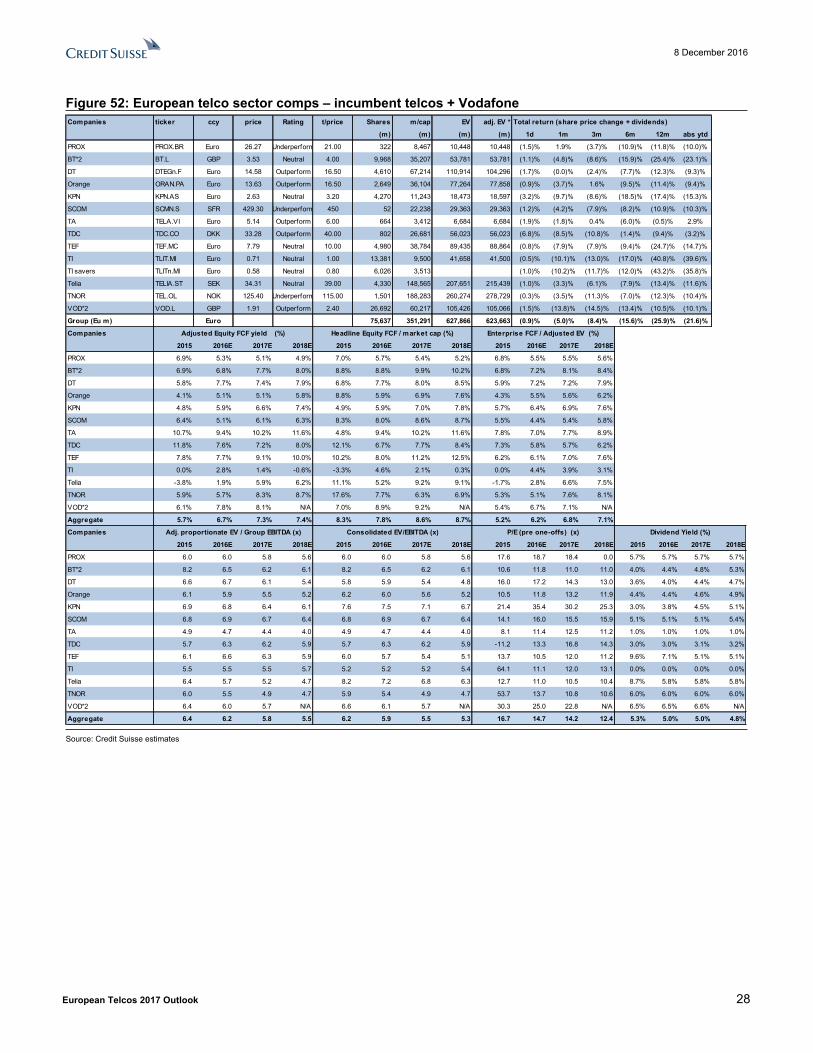
ValuationThe sector has de-rated this year, starting at 6.7x FY16E proportionate EV/EBITDA and a FY16E adjusted equity FCF yield of 6.2% to 6.2x FY16E (5.8x FY17E) and a 6.7% FY16E equity FCF yield (7.3% FY17E) – see Figure 52.
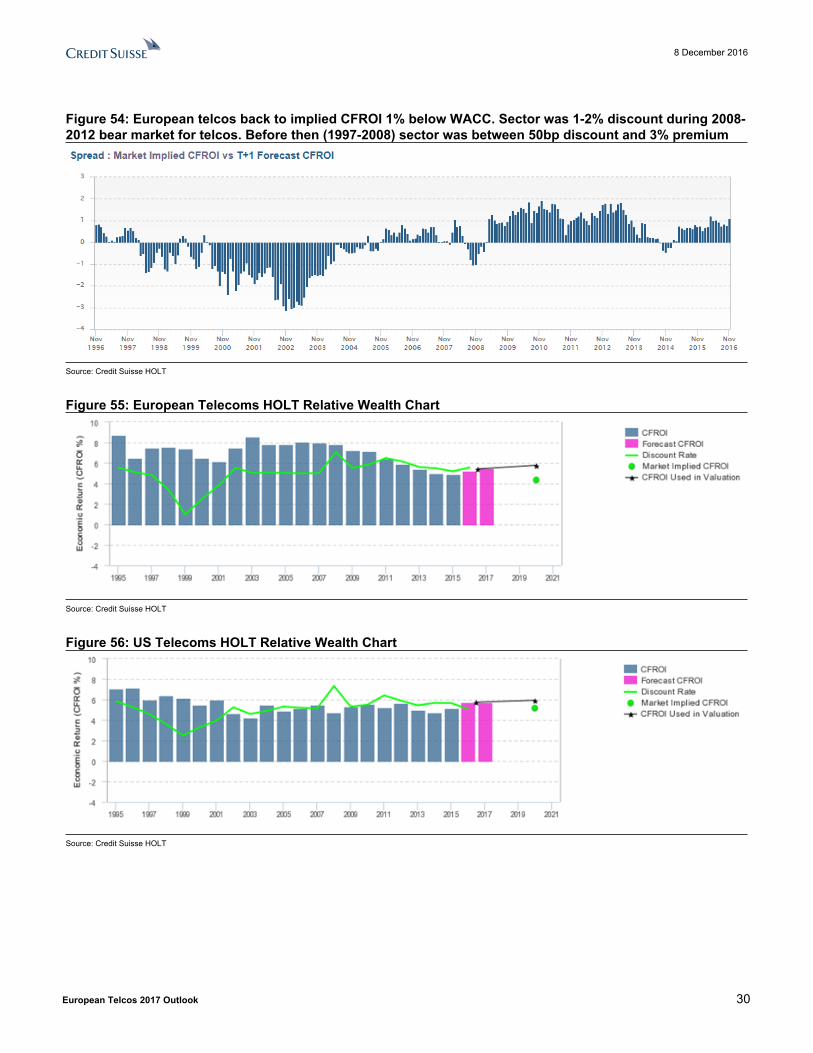
The discount to HOLT valuation is back to levels seen in the telcos bear-market of 2009-2013, although not yet the peak discounts of that period – see Figure 54. The sector has returned to a discount vs European utilities (Figure 51) and a smaller premium vs US telcos (Figure 50).
These valuations multiples are still some way-from the deep-value multiples we experienced in the lows of 2009-2013, where EV/EBITDA reached 4.5x and the sector sustained 10-12% FCF yields (bottoming out for some stocks at 15-20%). However, such low multiples would not be justified by the sector's outlook in our view, with revenues looking flattish rather than returning to a multi-year decline.
Figure 48: European telcos PE vs MSCI EuropeFigure 49: European telcos dividend yield vs MSCI Europe
6
8
10
12
14
16
18
20
22
P/E
Euro telcos (PE - 1 year forward) MSCI Europe (PE)
0%
2%
4%
6%
8%
10%
12%
14%
Euro telcos (Divi Yield) MSCI Europe (Divi Yield)
Source: Credit Suisse Equity Research Source: Credit Suisse Equity Research
Figure 50: European telcos PE vs US telcos Figure 51: European telcos PE vs European utilities
0
5
10
15
20
25
P/E
Euro telcos (PE - 1 year forward) US telcos PE
6
8
10
12
14
16
18
20
22
P/E
Euro telcos (PE - 1 year forward) EU Utilities PE
Source: Credit Suisse Equity Research Source: Credit Suisse Equity Research
8 December 2016
European Telcos 2017 Outlook 28
Figure 52: European telco sector comps – incumbent telcos + VodafoneCompanies ticker ccy price Rating t/price Shares m/cap EV adj. EV * Total return (share price change + dividends)
(m) (m) (m) (m) 1d 1m 3m 6m 12m abs ytd
PROX PROX.BR Euro 26.27 Underperform 21.00 322 8,467 10,448 10,448 (1.5)% 1.9% (3.7)% (10.9)% (11.8)% (10.0)%
BT*2 BT.L GBP 3.53 Neutral 4.00 9,968 35,207 53,781 53,781 (1.1)% (4.8)% (8.6)% (15.9)% (25.4)% (23.1)%
DT DTEGn.F Euro 14.58 Outperform 16.50 4,610 67,214 110,914 104,296 (1.7)% (0.0)% (2.4)% (7.7)% (12.3)% (9.3)%
Orange ORAN.PA Euro 13.63 Outperform 16.50 2,649 36,104 77,264 77,858 (0.9)% (3.7)% 1.6% (9.5)% (11.4)% (9.4)%
KPN KPN.AS Euro 2.63 Neutral 3.20 4,270 11,243 18,473 18,597 (3.2)% (9.7)% (8.6)% (18.5)% (17.4)% (15.3)%
SCOM SCMN.S SFR 429.30 Underperform 450 52 22,238 29,363 29,363 (1.2)% (4.2)% (7.9)% (8.2)% (10.9)% (10.3)%
TA TELA.VI Euro 5.14 Outperform 6.00 664 3,412 6,684 6,684 (1.9)% (1.8)% 0.4% (6.0)% (0.5)% 2.9%
TDC TDC.CO DKK 33.28 Outperform 40.00 802 26,681 56,023 56,023 (6.8)% (8.5)% (10.8)% (1.4)% (9.4)% (3.2)%
TEF TEF.MC Euro 7.79 Neutral 10.00 4,980 38,784 89,435 88,864 (0.8)% (7.9)% (7.9)% (9.4)% (24.7)% (14.7)%
TI TLIT.MI Euro 0.71 Neutral 1.00 13,381 9,500 41,658 41,500 (0.5)% (10.1)% (13.0)% (17.0)% (40.8)% (39.6)%
TI savers TLITn.MI Euro 0.58 Neutral 0.80 6,026 3,513 (1.0)% (10.2)% (11.7)% (12.0)% (43.2)% (35.8)%
Telia TELIA.ST SEK 34.31 Neutral 39.00 4,330 148,565 207,651 215,439 (1.0)% (3.3)% (6.1)% (7.9)% (13.4)% (11.6)%
TNOR TEL.OL NOK 125.40 Underperform 115.00 1,501 188,283 260,274 278,729 (0.3)% (3.5)% (11.3)% (7.0)% (12.3)% (10.4)%
VOD*2 VOD.L GBP 1.91 Outperform 2.40 26,692 60,217 105,426 105,066 (1.5)% (13.8)% (14.5)% (13.4)% (10.5)% (10.1)%
Group (Eu m) Euro 75,637 351,291 627,866 623,663 (0.9)% (5.0)% (8.4)% (15.6)% (25.9)% (21.6)%
Companies
2015 2016E 2017E 2018E 2015 2016E 2017E 2018E 2015 2016E 2017E 2018E
PROX 6.9% 5.3% 5.1% 4.9% 7.0% 5.7% 5.4% 5.2% 6.8% 5.5% 5.5% 5.6%
BT*2 6.9% 6.8% 7.7% 8.0% 8.8% 8.8% 9.9% 10.2% 6.8% 7.2% 8.1% 8.4%
DT 5.8% 7.7% 7.4% 7.9% 6.8% 7.7% 8.0% 8.5% 5.9% 7.2% 7.2% 7.9%
Orange 4.1% 5.1% 5.1% 5.8% 8.8% 5.9% 6.9% 7.6% 4.3% 5.5% 5.6% 6.2%
KPN 4.8% 5.9% 6.6% 7.4% 4.9% 5.9% 7.0% 7.8% 5.7% 6.4% 6.9% 7.6%
SCOM 6.4% 5.1% 6.1% 6.3% 8.3% 8.0% 8.6% 8.7% 5.5% 4.4% 5.4% 5.8%
TA 10.7% 9.4% 10.2% 11.6% 4.8% 9.4% 10.2% 11.6% 7.8% 7.0% 7.7% 8.9%
TDC 11.8% 7.6% 7.2% 8.0% 12.1% 6.7% 7.7% 8.4% 7.3% 5.8% 5.7% 6.2%
TEF 7.8% 7.7% 9.1% 10.0% 10.2% 8.0% 11.2% 12.5% 6.2% 6.1% 7.0% 7.6%
TI 0.0% 2.8% 1.4% -0.6% -3.3% 4.6% 2.1% 0.3% 0.0% 4.4% 3.9% 3.1%
Telia -3.8% 1.9% 5.9% 6.2% 11.1% 5.2% 9.2% 9.1% -1.7% 2.8% 6.6% 7.5%
TNOR 5.9% 5.7% 8.3% 8.7% 17.6% 7.7% 6.3% 6.9% 5.3% 5.1% 7.6% 8.1%
VOD*2 6.1% 7.8% 8.1% N/A 7.0% 8.9% 9.2% N/A 5.4% 6.7% 7.1% N/A
Aggregate 5.7% 6.7% 7.3% 7.4% 8.3% 7.8% 8.6% 8.7% 5.2% 6.2% 6.8% 7.1%
Companies
2015 2016E 2017E 2018E 2015 2016E 2017E 2018E 2015 2016E 2017E 2018E 2015 2016E 2017E 2018E
PROX 6.0 6.0 5.8 5.6 6.0 6.0 5.8 5.6 17.6 18.7 18.4 0.0 5.7% 5.7% 5.7% 5.7%
BT*2 8.2 6.5 6.2 6.1 8.2 6.5 6.2 6.1 10.6 11.8 11.0 11.0 4.0% 4.4% 4.8% 5.3%
DT 6.6 6.7 6.1 5.4 5.8 5.9 5.4 4.8 16.0 17.2 14.3 13.0 3.6% 4.0% 4.4% 4.7%
Orange 6.1 5.9 5.5 5.2 6.2 6.0 5.6 5.2 10.5 11.8 13.2 11.9 4.4% 4.4% 4.6% 4.9%
KPN 6.9 6.8 6.4 6.1 7.6 7.5 7.1 6.7 21.4 35.4 30.2 25.3 3.0% 3.8% 4.5% 5.1%
SCOM 6.8 6.9 6.7 6.4 6.8 6.9 6.7 6.4 14.1 16.0 15.5 15.9 5.1% 5.1% 5.1% 5.4%
TA 4.9 4.7 4.4 4.0 4.9 4.7 4.4 4.0 8.1 11.4 12.5 11.2 1.0% 1.0% 1.0% 1.0%
TDC 5.7 6.3 6.2 5.9 5.7 6.3 6.2 5.9 -11.2 13.3 16.8 14.3 3.0% 3.0% 3.1% 3.2%
TEF 6.1 6.6 6.3 5.9 6.0 5.7 5.4 5.1 13.7 10.5 12.0 11.2 9.6% 7.1% 5.1% 5.1%
TI 5.5 5.5 5.5 5.7 5.2 5.2 5.2 5.4 64.1 11.1 12.0 13.1 0.0% 0.0% 0.0% 0.0%
Telia 6.4 5.7 5.2 4.7 8.2 7.2 6.8 6.3 12.7 11.0 10.5 10.4 8.7% 5.8% 5.8% 5.8%
TNOR 6.0 5.5 4.9 4.7 5.9 5.4 4.9 4.7 53.7 13.7 10.8 10.6 6.0% 6.0% 6.0% 6.0%
VOD*2 6.4 6.0 5.7 N/A 6.6 6.1 5.7 N/A 30.3 25.0 22.8 N/A 6.5% 6.5% 6.6% N/A
Aggregate 6.4 6.2 5.8 5.5 6.2 5.9 5.5 5.3 16.7 14.7 14.2 12.4 5.3% 5.0% 5.0% 4.8%
Dividend Yield (%)
Adjusted Equity FCF yield (%) Headline Equity FCF / market cap (%) Enterprise FCF / Adjusted EV (%)
Adj. proportionate EV / Group EBITDA (x) Consolidated EV/EBITDA (x) P/E (pre one-offs) (x)
Source: Credit Suisse estimates
8 December 2016
European Telcos 2017 Outlook 29
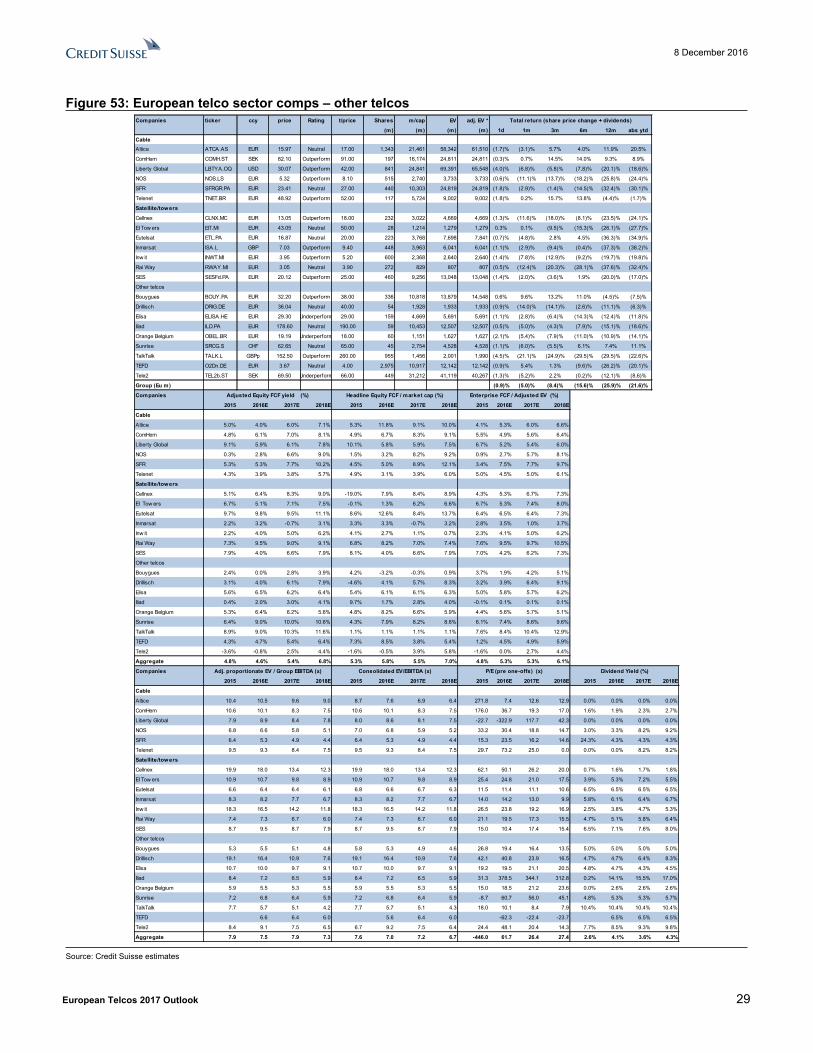
Figure 53: European telco sector comps – other telcosCompanies ticker ccy price Rating t/price Shares m/cap EV adj. EV *
(m) (m) (m) (m) 1d 1m 3m 6m 12m abs ytdCableAltice ATCA.AS EUR 15.97 Neutral 17.00 1,343 21,461 58,342 61,510 (1.7)% (3.1)% 5.7% 4.0% 11.9% 20.5%
ComHem COMH.ST SEK 82.10 Outperform 91.00 197 16,174 24,811 24,811 (0.3)% 0.7% 14.5% 14.0% 9.3% 8.9%
Liberty Global LBTYA.OQ USD 30.07 Outperform 42.00 841 24,841 69,391 65,548 (4.0)% (6.8)% (5.8)% (7.8)% (20.1)% (18.6)%
NOS NOS.LS EUR 5.32 Outperform 8.10 515 2,740 3,733 3,733 (0.6)% (11.1)% (13.7)% (18.2)% (25.8)% (24.4)%
SFR SFRGR.PA EUR 23.41 Neutral 27.00 440 10,303 24,819 24,819 (1.8)% (2.9)% (1.4)% (14.5)% (32.4)% (30.1)%
Telenet TNET.BR EUR 48.92 Outperform 52.00 117 5,724 9,002 9,002 (1.8)% 0.2% 15.7% 13.8% (4.4)% (1.7)%
Satellite/towers
Cellnex CLNX.MC EUR 13.05 Outperform 18.00 232 3,022 4,669 4,669 (1.3)% (11.6)% (18.0)% (8.1)% (23.5)% (24.1)%
EI Tow ers EIT.MI EUR 43.05 Neutral 50.00 28 1,214 1,279 1,279 0.3% 0.1% (9.5)% (15.3)% (26.1)% (27.7)%
Eutelsat ETL.PA EUR 16.87 Neutral 20.00 223 3,768 7,698 7,841 (0.7)% (4.8)% 2.8% 4.5% (36.3)% (34.9)%
Inmarsat ISA.L GBP 7.03 Outperform 9.40 448 3,963 6,041 6,041 (1.1)% (2.9)% (9.4)% (0.4)% (37.3)% (38.2)%
Inw it INWT.MI EUR 3.95 Outperform 5.20 600 2,368 2,640 2,640 (1.4)% (7.8)% (12.9)% (9.2)% (19.7)% (19.8)%
Rai Way RWAY.MI EUR 3.05 Neutral 3.90 272 829 807 807 (0.5)% (12.4)% (20.3)% (28.1)% (37.6)% (32.4)%
SES SESFd.PA EUR 20.12 Outperform 25.00 460 9,256 13,048 13,048 (1.4)% (2.0)% (3.6)% 1.9% (20.0)% (17.0)%
Other telcos
Bouygues BOUY.PA EUR 32.20 Outperform 38.00 336 10,818 13,879 14,548 0.6% 9.6% 13.2% 11.0% (4.5)% (7.5)%
Drillisch DRIG.DE EUR 36.04 Neutral 40.00 54 1,928 1,933 1,933 (0.9)% (14.0)% (14.1)% (2.6)% (11.1)% (6.3)%
Elisa ELISA.HE EUR 29.30 Underperform 29.00 159 4,669 5,691 5,691 (1.1)% (2.8)% (6.4)% (14.3)% (12.4)% (11.8)%
Iliad ILD.PA EUR 178.60 Neutral 190.00 59 10,453 12,507 12,507 (0.5)% (5.0)% (4.3)% (7.9)% (15.1)% (18.6)%
Orange Belgium OBEL.BR EUR 19.19 Underperform 18.00 60 1,151 1,627 1,627 (2.1)% (5.4)% (7.9)% (11.0)% (10.9)% (14.1)%
Sunrise SRCG.S CHF 62.65 Neutral 65.00 45 2,754 4,528 4,528 (1.1)% (6.0)% (5.5)% 6.1% 7.4% 11.1%
TalkTalk TALK.L GBPp 152.50 Outperform 260.00 955 1,456 2,001 1,990 (4.5)% (21.1)% (24.9)% (29.5)% (29.5)% (22.6)%
TEFD O2Dn.DE EUR 3.67 Neutral 4.00 2,975 10,917 12,142 12,142 (0.9)% 5.4% 1.3% (9.6)% (26.2)% (20.1)%
Tele2 TEL2b.ST SEK 69.50 Underperform 66.00 449 31,212 41,119 40,267 (1.3)% (5.2)% 2.2% (0.2)% (12.1)% (8.6)%
Group (Eu m) (0.9)% (5.0)% (8.4)% (15.6)% (25.9)% (21.6)%
Companies
2015 2016E 2017E 2018E 2015 2016E 2017E 2018E 2015 2016E 2017E 2018E
Cable
Altice 5.0% 4.0% 6.0% 7.1% 5.3% 11.8% 9.1% 10.0% 4.1% 5.3% 6.0% 6.6%
ComHem 4.8% 6.1% 7.0% 8.1% 4.9% 6.7% 8.3% 9.1% 5.5% 4.9% 5.6% 6.4%
Liberty Global 9.1% 5.9% 6.1% 7.8% 10.1% 5.8% 5.9% 7.5% 6.7% 5.2% 5.4% 6.0%
NOS 0.3% 2.8% 6.6% 9.0% 1.5% 3.2% 8.2% 9.2% 0.9% 2.7% 5.7% 8.1%
SFR 5.3% 5.3% 7.7% 10.2% 4.5% 5.0% 8.9% 12.1% 3.4% 7.5% 7.7% 9.7%
Telenet 4.3% 3.9% 3.8% 5.7% 4.9% 3.1% 3.9% 6.0% 5.0% 4.5% 5.0% 6.1%
Satellite/towers
Cellnex 5.1% 6.4% 8.3% 9.0% -19.0% 7.9% 8.4% 8.9% 4.3% 5.3% 6.7% 7.3%
EI Tow ers 6.7% 5.1% 7.1% 7.5% -0.1% 1.3% 6.2% 6.6% 6.7% 5.3% 7.4% 8.0%
Eutelsat 9.7% 9.8% 9.5% 11.1% 8.6% 12.6% 8.4% 13.7% 6.4% 6.5% 6.4% 7.3%
Inmarsat 2.2% 3.2% -0.7% 3.1% 3.3% 3.3% -0.7% 3.2% 2.8% 3.5% 1.0% 3.7%
Inw it 2.2% 4.0% 5.0% 6.2% 4.1% 2.7% 1.1% 0.7% 2.3% 4.1% 5.0% 6.2%
Rai Way 7.3% 9.5% 9.0% 9.1% 6.8% 8.2% 7.0% 7.4% 7.6% 9.5% 9.7% 10.5%
SES 7.9% 4.0% 6.6% 7.9% 8.1% 4.0% 6.6% 7.9% 7.0% 4.2% 6.2% 7.3%
Other telcos
Bouygues 2.4% 0.0% 2.8% 3.9% 4.2% -3.2% -0.3% 0.9% 3.7% 1.9% 4.2% 5.1%
Drillisch 3.1% 4.0% 6.1% 7.9% -4.6% 4.1% 5.7% 8.3% 3.2% 3.9% 6.4% 9.1%
Elisa 5.6% 6.5% 6.2% 6.4% 5.4% 6.1% 6.1% 6.3% 5.0% 5.8% 5.7% 6.2%
Iliad 0.4% 2.0% 3.0% 4.1% 9.7% 1.7% 2.8% 4.0% -0.1% 0.1% 0.1% 0.1%
Orange Belgium 5.3% 6.4% 6.2% 5.6% 4.8% 8.2% 6.6% 5.9% 4.4% 5.6% 5.7% 5.1%
Sunrise 6.4% 9.0% 10.0% 10.6% 4.3% 7.9% 8.2% 8.8% 6.1% 7.4% 8.6% 9.6%
TalkTalk 8.9% 9.0% 10.3% 11.6% 1.1% 1.1% 1.1% 1.1% 7.6% 8.4% 10.4% 12.9%
TEFD 4.3% 4.7% 5.4% 6.4% 7.3% 8.5% 3.8% 5.4% 1.2% 4.5% 4.9% 5.9%
Tele2 -3.6% -0.8% 2.5% 4.4% -1.6% -0.5% 3.9% 5.8% -1.6% 0.0% 2.7% 4.4%
Aggregate 4.8% 4.6% 5.4% 6.8% 5.3% 5.8% 5.5% 7.0% 4.8% 5.3% 5.3% 6.1%
Companies
2015 2016E 2017E 2018E 2015 2016E 2017E 2018E 2015 2016E 2017E 2018E 2015 2016E 2017E 2018E
Cable
Altice 10.4 10.5 9.6 9.0 8.7 7.6 6.9 6.4 271.8 7.4 12.6 12.9 0.0% 0.0% 0.0% 0.0%
ComHem 10.6 10.1 8.3 7.5 10.6 10.1 8.3 7.5 176.0 36.7 19.3 17.0 1.6% 1.9% 2.3% 2.7%
Liberty Global 7.9 8.9 8.4 7.8 8.0 8.6 8.1 7.5 -22.7 -322.9 117.7 42.3 0.0% 0.0% 0.0% 0.0%
NOS 6.8 6.6 5.8 5.1 7.0 6.8 5.9 5.2 33.2 30.4 18.8 14.7 3.0% 3.3% 8.2% 9.2%
SFR 6.4 5.3 4.9 4.4 6.4 5.3 4.9 4.4 15.3 23.5 16.2 14.6 24.3% 4.3% 4.3% 4.3%
Telenet 9.5 9.3 8.4 7.5 9.5 9.3 8.4 7.5 29.7 73.2 25.0 0.0 0.0% 0.0% 8.2% 8.2%
Satellite/towers
Cellnex 19.9 18.0 13.4 12.3 19.9 18.0 13.4 12.3 62.1 50.1 26.2 20.0 0.7% 1.6% 1.7% 1.8%
EI Tow ers 10.9 10.7 9.8 8.9 10.9 10.7 9.8 8.9 25.4 24.8 21.0 17.5 3.9% 5.3% 7.2% 5.5%
Eutelsat 6.6 6.4 6.4 6.1 6.8 6.6 6.7 6.3 11.5 11.4 11.1 10.6 6.5% 6.5% 6.5% 6.5%
Inmarsat 8.3 8.2 7.7 6.7 8.3 8.2 7.7 6.7 14.0 14.2 13.0 9.9 5.8% 6.1% 6.4% 6.7%
Inw it 18.3 16.5 14.2 11.8 18.3 16.5 14.2 11.8 26.5 23.8 19.2 16.9 2.5% 3.8% 4.7% 5.3%
Rai Way 7.4 7.3 6.7 6.0 7.4 7.3 6.7 6.0 21.1 19.5 17.3 15.5 4.7% 5.1% 5.8% 6.4%
SES 8.7 9.5 8.7 7.9 8.7 9.5 8.7 7.9 15.0 10.4 17.4 15.4 6.5% 7.1% 7.6% 8.0%
Other telcos
Bouygues 5.3 5.5 5.1 4.8 5.8 5.3 4.9 4.6 26.8 19.4 16.4 13.5 5.0% 5.0% 5.0% 5.0%
Drillisch 19.1 16.4 10.9 7.6 19.1 16.4 10.9 7.6 42.1 40.8 23.9 16.5 4.7% 4.7% 6.4% 8.3%
Elisa 10.7 10.0 9.7 9.1 10.7 10.0 9.7 9.1 19.2 19.5 21.1 20.5 4.8% 4.7% 4.3% 4.5%
Iliad 8.4 7.2 6.5 5.9 8.4 7.2 6.5 5.9 31.3 378.5 344.1 312.8 0.2% 14.1% 15.5% 17.0%
Orange Belgium 5.9 5.5 5.3 5.5 5.9 5.5 5.3 5.5 15.0 18.5 21.2 23.6 0.0% 2.6% 2.6% 2.6%
Sunrise 7.2 6.8 6.4 5.9 7.2 6.8 6.4 5.9 -8.7 60.7 56.0 45.1 4.8% 5.3% 5.3% 5.7%
TalkTalk 7.7 5.7 5.1 4.2 7.7 5.7 5.1 4.3 18.0 10.1 8.4 7.9 10.4% 10.4% 10.4% 10.4%
TEFD 6.6 6.4 6.0 5.6 6.4 6.0 -62.3 -22.4 -23.7 6.5% 6.5% 6.5%
Tele2 8.4 9.1 7.5 6.5 6.7 9.2 7.5 6.4 24.4 48.1 20.4 14.3 7.7% 8.5% 9.3% 9.8%
Aggregate 7.9 7.5 7.9 7.3 7.6 7.0 7.2 6.7 -446.0 61.7 26.4 27.4 2.6% 4.1% 3.6% 4.3%
Dividend Yield (%)Consolidated EV/EBITDA (x) P/E (pre one-offs) (x)Adj. proportionate EV / Group EBITDA (x)
Total return (share price change + dividends)
Adjusted Equity FCF yield (%) Headline Equity FCF / market cap (%) Enterprise FCF / Adjusted EV (%)
Source: Credit Suisse estimates
8 December 2016
European Telcos 2017 Outlook 30
Figure 54: European telcos back to implied CFROI 1% below WACC. Sector was 1-2% discount during 2008-2012 bear market for telcos. Before then (1997-2008) sector was between 50bp discount and 3% premium
Source: Credit Suisse HOLT
Figure 55: European Telecoms HOLT Relative Wealth Chart
Source: Credit Suisse HOLT
Figure 56: US Telecoms HOLT Relative Wealth Chart
Source: Credit Suisse HOLT
8 December 2016
European Telcos 2017 Outlook 31
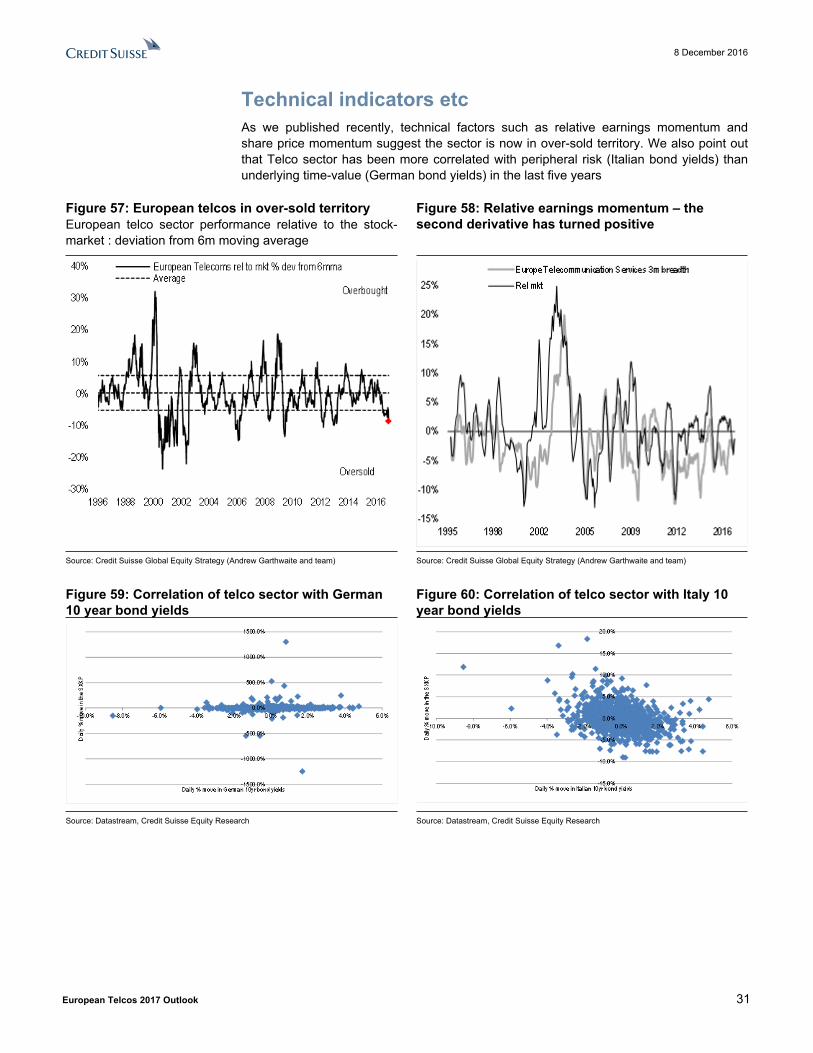
Technical indicators etcAs we published recently, technical factors such as relative earnings momentum and share price momentum suggest the sector is now in over-sold territory. We also point out that Telco sector has been more correlated with peripheral risk (Italian bond yields) than underlying time-value (German bond yields) in the last five years
Figure 57: European telcos in over-sold territoryEuropean telco sector performance relative to the stock-market : deviation from 6m moving average
Figure 58: Relative earnings momentum – the second derivative has turned positive
Source: Credit Suisse Global Equity Strategy (Andrew Garthwaite and team) Source: Credit Suisse Global Equity Strategy (Andrew Garthwaite and team)
Figure 59: Correlation of telco sector with German 10 year bond yields
Figure 60: Correlation of telco sector with Italy 10 year bond yields
Source: Datastream, Credit Suisse Equity Research Source: Datastream, Credit Suisse Equity Research
8 December 2016
European Telcos 2017 Outlook 32
Global satellite—Government to boost growth over 2016; HTS capacity debate set to continueAs we set out in a research note after Eutelsat's major profit warning (Global Satellite: Growth outlook worsening; Cut ETL to Neutral, dated 17 May 2016) our positive view on the outlook for Global satellite revenue growth held 12 months ago has proved overly optimistic. In particular, we underestimated the impact of a weakening global economy on certain regions (particularly Latam and Africa) and rising competition from Intelsat Epic in Latam. That said we believe assessing the impact of High Throughput Satellite (HTS) capacity is more complicated than a simplistic view of only creating additional supply as we believe it potentially opens up new markets for satellite broadband services i.e. potentially drives up incremental demand—we discuss this in more detail below.
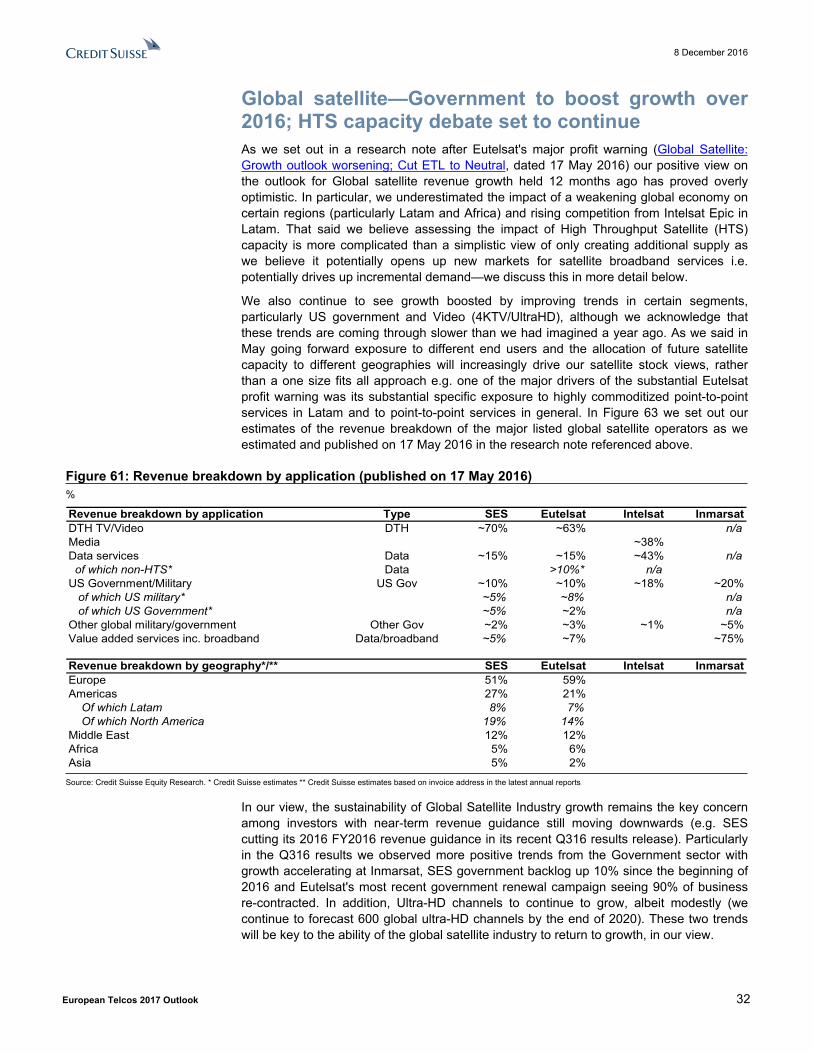
We also continue to see growth boosted by improving trends in certain segments, particularly US government and Video (4KTV/UltraHD), although we acknowledge that these trends are coming through slower than we had imagined a year ago. As we said in May going forward exposure to different end users and the allocation of future satellite capacity to different geographies will increasingly drive our satellite stock views, rather than a one size fits all approach e.g. one of the major drivers of the substantial Eutelsat profit warning was its substantial specific exposure to highly commoditized point-to-point services in Latam and to point-to-point services in general. In Figure 63 we set out our estimates of the revenue breakdown of the major listed global satellite operators as we estimated and published on 17 May 2016 in the research note referenced above.
Figure 61: Revenue breakdown by application (published on 17 May 2016)%
Revenue breakdown by application Type SES Eutelsat Intelsat InmarsatDTH TV/Video DTH ~70% ~63% n/aMedia ~38%Data services Data ~15% ~15% ~43% n/a of which non-HTS* Data >10%* n/aUS Government/Military US Gov ~10% ~10% ~18% ~20% of which US military* ~5% ~8% n/a of which US Government* ~5% ~2% n/aOther global military/government Other Gov ~2% ~3% ~1% ~5%Value added services inc. broadband Data/broadband ~5% ~7% ~75%
Revenue breakdown by geography*/** SES Eutelsat Intelsat InmarsatEurope 51% 59%Americas 27% 21% Of which Latam 8% 7% Of which North America 19% 14%Middle East 12% 12%Africa 5% 6%Asia 5% 2%
Source: Credit Suisse Equity Research. * Credit Suisse estimates ** Credit Suisse estimates based on invoice address in the latest annual reports
In our view, the sustainability of Global Satellite Industry growth remains the key concern among investors with near-term revenue guidance still moving downwards (e.g. SES cutting its 2016 FY2016 revenue guidance in its recent Q316 results release). Particularly in the Q316 results we observed more positive trends from the Government sector with growth accelerating at Inmarsat, SES government backlog up 10% since the beginning of 2016 and Eutelsat's most recent government renewal campaign seeing 90% of business re-contracted. In addition, Ultra-HD channels to continue to grow, albeit modestly (we continue to forecast 600 global ultra-HD channels by the end of 2020). These two trends will be key to the ability of the global satellite industry to return to growth, in our view.
8 December 2016
European Telcos 2017 Outlook 33
HTS capacity impact more complex than just excess supplyIn our view the ongoing debate impact of High Throughput Satellite (HTS) capacity on demand for traditional wide-beam capacity is not just one of additional supply. Many HTS operators (e.g. ViaSat) have made comments that they expect HTS capacity to open up new addressable markets (e.g. consumer broadband in rural areas) and revenue streams rather than just providing a potential straight substitute for existing wide-beam capacity. SES also expects HTS capacity to potentially grow revenue/user by providing a much faster speeds and greater bandwidth (analogous to fibre vs. basic DSL in terrestrial wireline). The degree to which HTS cannibalizes traditional wide-beam capacity remains the key driver of future industry growth, in our view, but we believe traditional Video and point-to-multi-point services will be very difficult for HTS to substitute while we have only really seen pressure in HTS substituting basic point-to-point services in Latam so far.
CS global satellite capacity supply and demand model (incremental 36MHz transponder equivalents)We update our Global supply and demand model for satellite capacity although we acknowledge that it is becoming increasingly difficult to model global satellite capacity supply and demand accurately in traditional transponder (36MHz equivalent) terms due to:
■ The emergence of more HTS capacity that is typically measured in Gbps throughput terms and not transponders; and
■ The difficulty in modelling the demand for satellite capacity in new markets and regions that HTS will likely open up e.g. global consumer broadband services and in-flight WiFi for commercial aircraft. ViaSat currently has around 700k consumer broadband subs in the US while inflight connectivity is expected by us to become increasingly available on aircraft globally going forward—many European airlines signed initial contracts in 2016.
Figure 62: CS Global incremental Global Satellite Demand/Supply model 36MHz transponder equivalents
0
100
200
300
400
500
600
700
800
2012 2013 2014 2015E 2016E 2017E 2018E 2019E 2020E
C-an
d Ku-b
and 3
6Mz t
ransp
onde
rs
Incremental supply Incremental demand
Source: Credit Suisse Equity Research
We update our global satellite supply and demand model in Figure 64 . Our demand assumptions remain broadly unchanged but our supply assumptions have been pushed out due to recent launch delays (e.g. SES-10, SES-11, ViaSat-2 & AsiaSat9), some delays caused by the recent SpaceX launch pad incident in September which resulted in a satellite loss. In addition a number of satellite projects and national satellite plans have been postponed over the past 12mths e.g. NigComSat2 (Nigeria government), AOneSat1 & Supremesat3 (Sri Lankan government) for which we have updated our model.
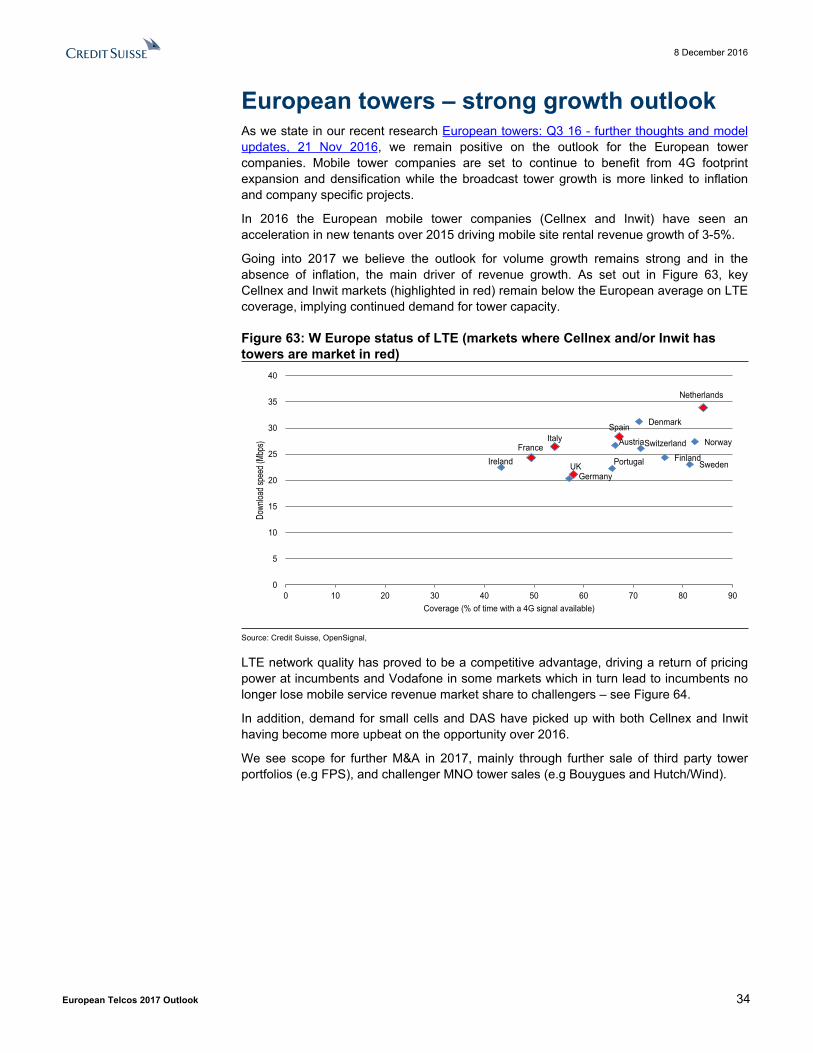
8 December 2016
European Telcos 2017 Outlook 34
European towers – strong growth outlookAs we state in our recent research European towers: Q3 16 - further thoughts and model updates, 21 Nov 2016, we remain positive on the outlook for the European tower companies. Mobile tower companies are set to continue to benefit from 4G footprint expansion and densification while the broadcast tower growth is more linked to inflation and company specific projects.
In 2016 the European mobile tower companies (Cellnex and Inwit) have seen an acceleration in new tenants over 2015 driving mobile site rental revenue growth of 3-5%.
Going into 2017 we believe the outlook for volume growth remains strong and in the absence of inflation, the main driver of revenue growth. As set out in Figure 63, key Cellnex and Inwit markets (highlighted in red) remain below the European average on LTE coverage, implying continued demand for tower capacity.
Figure 63: W Europe status of LTE (markets where Cellnex and/or Inwit has towers are market in red)
Netherlands
DenmarkSpainNorwayAustriaItaly Switzerland
FinlandFrance
SwedenIreland PortugalUKGermany
0
5
10
15
20
25
30
35
40
0 10 20 30 40 50 60 70 80 90
Down
load s
peed
(Mbp
s)
Coverage (% of time with a 4G signal available)
Source: Credit Suisse, OpenSignal,
LTE network quality has proved to be a competitive advantage, driving a return of pricing power at incumbents and Vodafone in some markets which in turn lead to incumbents no longer lose mobile service revenue market share to challengers – see Figure 64.
In addition, demand for small cells and DAS have picked up with both Cellnex and Inwit having become more upbeat on the opportunity over 2016.
We see scope for further M&A in 2017, mainly through further sale of third party tower portfolios (e.g FPS), and challenger MNO tower sales (e.g Bouygues and Hutch/Wind).
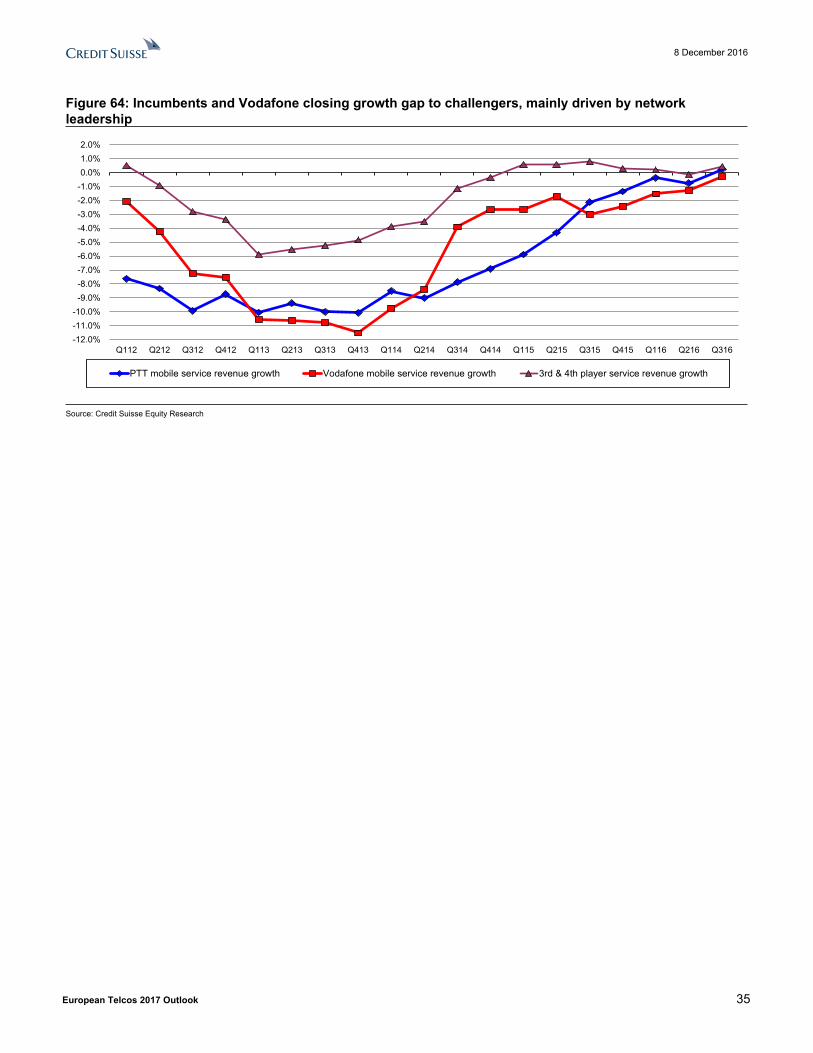
8 December 2016
European Telcos 2017 Outlook 35
Figure 64: Incumbents and Vodafone closing growth gap to challengers, mainly driven by network leadership
-12.0%-11.0%-10.0%
-9.0%-8.0%-7.0%-6.0%-5.0%-4.0%-3.0%-2.0%-1.0%0.0%1.0%2.0%
Q112 Q212 Q312 Q412 Q113 Q213 Q313 Q413 Q114 Q214 Q314 Q414 Q115 Q215 Q315 Q415 Q116 Q216 Q316
PTT mobile service revenue growth Vodafone mobile service revenue growth 3rd & 4th player service revenue growth
Source: Credit Suisse Equity Research
8 December 2016
European Telcos 2017 Outlook 36
Companies Mentioned (Price as of 07-Dec-2016)AT&T (T.N, $39.35)Altice (ATCA.AS, €16.04)America Movil (AMX.N, $12.12)Apple Inc (AAPL.OQ, $109.95)BT Group (BT.L, 352.1p)Bouygues (BOUY.PA, €32.2)Cellnex Telecom (CLNX.MC, €13.4)Com Hem Holding (COMH.ST, Skr81.5)Deutsche Telekom (DTEGn.F, €15.04)EI Towers (EIT.MI, €43.86)Elisa Corporation (ELISA.HE, €28.95)Eutelsat Communications (ETL.PA, €17.48)INWIT (INWT.MI, €3.98)Iliad (ILD.PA, €173.85)Inmarsat PLC (ISA.L, 699.0p)KPN (KPN.AS, €2.64)Liberty Global (LBTYA.OQ, $29.91)NOS (NOS.LS, €5.25)Oi SA (OIBR4.SA, R$2.4)Orange (ORAN.PA, €13.42)Orange Belgium (OBEL.BR, €18.92)Proximus (PROX.BR, €26.02)Rai Way (RWAY.MI, €3.16)Reliance Steel & Aluminum Co. (RS.N, $84.85)SES (SESFd.PA, €19.82)SFR (SFRGR.PA, €23.03)Sprint Corp (S.N, $8.17)Sunrise (SRCG.S, SFr62.8)Swisscom (SCMN.S, SFr433.3)T-Mobile US Inc (TMUS.OQ, $55.99)TDC (TDC.CO, Dkr34.2)TIM Participacoes (TIMP3.SA, R$8.17)TalkTalk (TALK.L, 156.3p)Tele2 AB (TEL2b.ST, Skr68.05)Telecom Italia (TLIT.MI, €0.72)Telefonica (TEF.MC, €7.85)Telefonica Brasil (VIVT4.SA, R$43.61)Telefonica Deutschland (O2Dn.DE, €3.86)Telekom Austria (TELA.VI, €5.28)Telenet (TNET.BR, €50.0)Telenor (TEL.OL, Nkr123.3)Telia Company (TELIA.ST, Skr34.21)Verizon Communications Inc (VZ.N, $50.36)Vodafone Group (VOD.L, 191.75p)
Disclosure AppendixAnalyst Certification Justin Funnell, Jakob Bluestone, Paul Sidney and Henrik Herbst each certify, with respect to the companies or securities that the individual analyzes, that (1) the views expressed in this report accurately reflect his or her personal views about all of the subject companies and securities and (2) no part of his or her compensation was, is or will be directly or indirectly related to the specific recommendations or views expressed in this report.The analyst(s) responsible for preparing this research report received Compensation that is based upon various factors including Credit Suisse's total revenues, a portion of which are generated by Credit Suisse's investment banking activitiesAs of December 10, 2012 Analysts’ stock rating are defined as follows:Outperform (O) : The stock’s total return is expected to outperform the relevant benchmark* over the next 12 months.Neutral (N) : The stock’s total return is expected to be in line with the relevant benchmark* over the next 12 months.Underperform (U) : The stock’s total return is expected to underperform the relevant benchmark* over the next 12 months. *Relevant benchmark by region: As of 10th December 2012, Japanese ratings are based on a stock’s total return relative to the analyst's coverage universe which consists of all companies covered by the analyst within the relevant sector, with Outperforms representing the most attractive, Neutrals the less attractive, and Underperforms the least attractive investment opportunities. As of 2nd October 2012, U.S. and Canadian as well as European ratings are based on a stock’s total return relative to the analyst's coverage universe which consists of all companies covered by the analyst within the relevant sector, with Outperforms representing the most attractive, Neutrals the less attractive, and Underperforms the least attractive investment opportunities. For Latin American and non-Japan Asia stocks, ratings are based on a stock’s total return relative to the average total return of the relevant country or regional benchmark; prior to 2nd October 2012 U.S. and Canadian ratings were based on (1) a stock’s absolute total return potential to its current share price and (2) the relative attractiveness of a stock’s total return potential within an analyst’s coverage universe. For Australian and New Zealand stocks, the expected total return (ETR) calculation includes 12-month rolling dividend yield. An Outperform rating is assigned where an ETR is greater than or equal to 7.5%; Underperform where an ETR less than or equal to 5%. A Neutral may be assigned where the ETR is between -5% and 15%. The overlapping rating range allows analysts to assign a rating that puts ETR in the context of associated risks. Prior to 18 May 2015, ETR ranges for Outperform and Underperform ratings did not overlap with Neutral thresholds between 15% and 7.5%, which was in operation from 7 July 2011.Restricted (R) : In certain circumstances, Credit Suisse policy and/or applicable law and regulations preclude certain types of communications, including an investment recommendation, during the course of Credit Suisse's engagement in an investment banking transaction and in certain other circumstances.Not Rated (NR) : Credit Suisse Equity Research does not have an investment rating or view on the stock or any other securities related to the company at this time.Not Covered (NC) : Credit Suisse Equity Research does not provide ongoing coverage of the company or offer an investment rating or investment view on the equity security of the company or related products.
8 December 2016
European Telcos 2017 Outlook 37
Volatility Indicator [V] : A stock is defined as volatile if the stock price has moved up or down by 20% or more in a month in at least 8 of the past 24 months or the analyst expects significant volatility going forward.Analysts’ sector weightings are distinct from analysts’ stock ratings and are based on the analyst’s expectations for the fundamentals and/or valuation of the sector* relative to the group’s historic fundamentals and/or valuation:Overweight : The analyst’s expectation for the sector’s fundamentals and/or valuation is favorable over the next 12 months.Market Weight : The analyst’s expectation for the sector’s fundamentals and/or valuation is neutral over the next 12 months.Underweight : The analyst’s expectation for the sector’s fundamentals and/or valuation is cautious over the next 12 months. *An analyst’s coverage sector consists of all companies covered by the analyst within the relevant sector. An analyst may cover multiple sectors.
Credit Suisse's distribution of stock ratings (and banking clients) is:
Global Ratings DistributionRating Versus universe (%) Of which banking clients (%)Outperform/Buy* 44% (63% banking clients)Neutral/Hold* 38% (60% banking clients)Underperform/Sell* 14% (54% banking clients)Restricted 3%*For purposes of the NYSE and NASD ratings distribution disclosure requirements, our stock ratings of Outperform, Neutral, and Underperform most closely correspond to Buy, Hold, and Sell, respectively; however, the meanings are not the same, as our stock ratings are determined on a relative basis. (Please refer to definitions above.) An investor's decision to buy or sell a security should be based on investment objectives, current holdings, and other individual factors.
Important Global Disclosures Credit Suisse’s research reports are made available to clients through our proprietary research portal on CS PLUS. Credit Suisse research products may also be made available through third-party vendors or alternate electronic means as a convenience. Certain research products are only made available through CS PLUS. The services provided by Credit Suisse’s analysts to clients may depend on a specific client’s preferences regarding the frequency and manner of receiving communications, the client’s risk profile and investment, the size and scope of the overall client relationship with the Firm, as well as legal and regulatory constraints. To access all of Credit Suisse’s research that you are entitled to receive in the most timely manner, please contact your sales representative or go to https://plus.credit-suisse.com . Credit Suisse’s policy is to update research reports as it deems appropriate, based on developments with the subject company, the sector or the market that may have a material impact on the research views or opinions stated herein.Credit Suisse's policy is only to publish investment research that is impartial, independent, clear, fair and not misleading. For more detail please refer to Credit Suisse's Policies for Managing Conflicts of Interest in connection with Investment Research: http://www.csfb.com/research-and-analytics/disclaimer/managing_conflicts_disclaimer.html . Credit Suisse's policy is only to publish investment research that is impartial, independent, clear, fair and not misleading. For more detail please refer to Credit Suisse's Policies for Managing Conflicts of Interest in connection with Investment Research:See the Companies Mentioned section for full company names The subject company (EIT.MI, BT.L, BOUY.PA, LBTYA.OQ, CLNX.MC, TELA.VI, TEF.MC, COMH.ST, ORAN.PA, ATCA.AS, TELIA.ST, ILD.PA, TEL.OL, OBEL.BR, DTEGn.F, KPN.AS, TALK.L, VOD.L, TNET.BR, SESFd.PA, O2Dn.DE, RWAY.MI, ISA.L, TLIT.MI, TDC.CO, PROX.BR, ETL.PA, SCMN.S, SFRGR.PA, TMUS.OQ, RS.N, S.N, VZ.N, T.N, AAPL.OQ, OIBR4.SA, TIMP3.SA, AMX.N) currently is, or was during the 12-month period preceding the date of distribution of this report, a client of Credit Suisse.Credit Suisse provided investment banking services to the subject company (EIT.MI, LBTYA.OQ, TELA.VI, TEF.MC, ATCA.AS, ILD.PA, TEL.OL, DTEGn.F, KPN.AS, TNET.BR, O2Dn.DE, ISA.L, TLIT.MI, PROX.BR, SCMN.S, SFRGR.PA, TMUS.OQ, VZ.N, T.N, AAPL.OQ, TIMP3.SA, AMX.N) within the past 12 months.Credit Suisse has managed or co-managed a public offering of securities for the subject company (ATCA.AS, TEL.OL, DTEGn.F, KPN.AS, ISA.L, TLIT.MI, SCMN.S, TMUS.OQ, TIMP3.SA) within the past 12 months.Credit Suisse has received investment banking related compensation from the subject company (EIT.MI, LBTYA.OQ, TELA.VI, TEF.MC, ATCA.AS, ILD.PA, TEL.OL, DTEGn.F, KPN.AS, TNET.BR, O2Dn.DE, ISA.L, TLIT.MI, PROX.BR, SCMN.S, SFRGR.PA, TMUS.OQ, VZ.N, T.N, AAPL.OQ, TIMP3.SA, AMX.N) within the past 12 monthsCredit Suisse expects to receive or intends to seek investment banking related compensation from the subject company (EIT.MI, BT.L, BOUY.PA, LBTYA.OQ, CLNX.MC, TELA.VI, TEF.MC, COMH.ST, ORAN.PA, ATCA.AS, TELIA.ST, ILD.PA, TEL.OL, OBEL.BR, TEL2b.ST, DTEGn.F, KPN.AS, TALK.L, VOD.L, TNET.BR, SESFd.PA, O2Dn.DE, RWAY.MI, ISA.L, TLIT.MI, TDC.CO, PROX.BR, ETL.PA, SCMN.S, SFRGR.PA, TMUS.OQ, RS.N, S.N, VZ.N, T.N, AAPL.OQ, OIBR4.SA, TIMP3.SA, AMX.N) within the next 3 months.As of the end of the preceding month, Credit Suisse beneficially own 1% or more of a class of common equity securities of (TEF.MC, TLIT.MI, TDC.CO).As of the end of the preceding month, Credit Suisse beneficially own between 1-3% of a class of common equity securities of (SCMN.S).Credit Suisse beneficially holds >0.5% short position of the total issued share capital of the subject company (BOUY.PA).Credit Suisse has a material conflict of interest with the subject company (LBTYA.OQ) . Credit Suisse International is acting as financial advisor to Liberty Global plc in relation to the announced acquisition of Multimedia Polska S.A. through its subsidiary UPC Poland.Credit Suisse has a material conflict of interest with the subject company (DTEGn.F) . Detusche Telekom AG - Wulf Bernotat, a Senior Advisor of Credit Suisse, is a supervisory board member of Deutsche Telekom AG (DTE)Credit Suisse has a material conflict of interest with the subject company (TMUS.OQ) . Credit Suisse Securities (USA) LLC is acting as financial advisor to MetroPCS Communications Inc on the announced proposed merger with Deutsche Telekom.Credit Suisse has a material conflict of interest with the subject company (S.N) . Credit Suisse acted as financial advisor to a shareholder of Clearwire in connection with the announced proposed acquisition of Clearwire by Sprint.

8 December 2016
European Telcos 2017 Outlook 38
For other important disclosures concerning companies featured in this report, including price charts, please visit the website at https://rave.credit-suisse.com/disclosures or call +1 (877) 291-2683. For date and time of production, dissemination and history of recommendation for the subject company(ies) featured in this report, disseminated within the past 12 months, please refer to the link: https://rave.credit-suisse.com/disclosures/view/report?i=274301&v=-4qiaahe10mu9ilx3n2djy3iqx . Important Regional Disclosures Singapore recipients should contact Credit Suisse AG, Singapore Branch for any matters arising from this research report.The analyst(s) involved in the preparation of this report may participate in events hosted by the subject company, including site visits. Credit Suisse does not accept or permit analysts to accept payment or reimbursement for travel expenses associated with these events.Restrictions on certain Canadian securities are indicated by the following abbreviations: NVS--Non-Voting shares; RVS--Restricted Voting Shares; SVS--Subordinate Voting Shares.Individuals receiving this report from a Canadian investment dealer that is not affiliated with Credit Suisse should be advised that this report may not contain regulatory disclosures the non-affiliated Canadian investment dealer would be required to make if this were its own report.For Credit Suisse Securities (Canada), Inc.'s policies and procedures regarding the dissemination of equity research, please visit https://www.credit-suisse.com/sites/disclaimers-ib/en/canada-research-policy.html.Credit Suisse Securities (Europe) Limited (Credit Suisse) acts as broker to (TALK.L, ISA.L).The following disclosed European company/ies have estimates that comply with IFRS: (BT.L, BOUY.PA, TELA.VI, TEF.MC, ORAN.PA, TELIA.ST, ILD.PA, TEL.OL, OBEL.BR, TEL2b.ST, DTEGn.F, ELISA.HE, KPN.AS, TALK.L, VOD.L, ISA.L, TLIT.MI, TDC.CO, PROX.BR, SCMN.S).Credit Suisse has acted as lead manager or syndicate member in a public offering of securities for the subject company (LBTYA.OQ, TEF.MC, ATCA.AS, TEL.OL, DTEGn.F, KPN.AS, O2Dn.DE, NOS.LS, RWAY.MI, ISA.L, TLIT.MI, SCMN.S, SFRGR.PA, TMUS.OQ, S.N, VZ.N, T.N, AAPL.OQ, OIBR4.SA, TIMP3.SA, AMX.N) within the past 3 years.Principal is not guaranteed in the case of equities because equity prices are variable.Commission is the commission rate or the amount agreed with a customer when setting up an account or at any time after that.This research report is authored by:Credit Suisse International ......................................................................................Justin Funnell ; Jakob Bluestone ; Paul Sidney ; Henrik HerbstTo the extent this is a report authored in whole or in part by a non-U.S. analyst and is made available in the U.S., the following are important disclosures regarding any non-U.S. analyst contributors: The non-U.S. research analysts listed below (if any) are not registered/qualified as research analysts with FINRA. The non-U.S. research analysts listed below may not be associated persons of CSSU and therefore may not be subject to the NASD Rule 2711 and NYSE Rule 472 restrictions on communications with a subject company, public appearances and trading securities held by a research analyst account.Credit Suisse International ......................................................................................Justin Funnell ; Jakob Bluestone ; Paul Sidney ; Henrik HerbstFor Credit Suisse disclosure information on other companies mentioned in this report, please visit the website at https://rave.credit-suisse.com/disclosures or call +1 (877) 291-2683.
8 December 2016
European Telcos 2017 Outlook 39
This report is produced by subsidiaries and affiliates of Credit Suisse operating under its Global Markets Division. For more information on our structure, please use the following link: https://www.credit-suisse.com/who-we-are This report may contain material that is not directed to, or intended for distribution to or use by, any person or entity who is a citizen or resident of or located in any locality, state, country or other jurisdiction where such distribution, publication, availability or use would be contrary to law or regulation or which would subject Credit Suisse or its affiliates ("CS") to any registration or licensing requirement within such jurisdiction. All material presented in this report, unless specifically indicated otherwise, is under copyright to CS. None of the material, nor its content, nor any copy of it, may be altered in any way, transmitted to, copied or distributed to any other party, without the prior express written permission of CS. All trademarks, service marks and logos used in this report are trademarks or service marks or registered trademarks or service marks of CS or its affiliates.The information, tools and material presented in this report are provided to you for information purposes only and are not to be used or considered as an offer or the solicitation of an offer to sell or to buy or subscribe for securities or other financial instruments. CS may not have taken any steps to ensure that the securities referred to in this report are suitable for any particular investor. CS will not treat recipients of this report as its customers by virtue of their receiving this report. The investments and services contained or referred to in this report may not be suitable for you and it is recommended that you consult an independent investment advisor if you are in doubt about such investments or investment services. Nothing in this report constitutes investment, legal, accounting or tax advice, or a representation that any investment or strategy is suitable or appropriate to your individual circumstances, or otherwise constitutes a personal recommendation to you. CS does not advise on the tax consequences of investments and you are advised to contact an independent tax adviser. Please note in particular that the bases and levels of taxation may change. Information and opinions presented in this report have been obtained or derived from sources believed by CS to be reliable, but CS makes no representation as to their accuracy or completeness. CS accepts no liability for loss arising from the use of the material presented in this report, except that this exclusion of liability does not apply to the extent that such liability arises under specific statutes or regulations applicable to CS. This report is not to be relied upon in substitution for the exercise of independent judgment. CS may have issued, and may in the future issue, other communications that are inconsistent with, and reach different conclusions from, the information presented in this report. Those communications reflect the different assumptions, views and analytical methods of the analysts who prepared them and CS is under no obligation to ensure that such other communications are brought to the attention of any recipient of this report. Some investments referred to in this report will be offered solely by a single entity and in the case of some investments solely by CS, or an associate of CS or CS may be the only market maker in such investments. Past performance should not be taken as an indication or guarantee of future performance, and no representation or warranty, express or implied, is made regarding future performance. Information, opinions and estimates contained in this report reflect a judgment at its original date of publication by CS and are subject to change without notice. The price, value of and income from any of the securities or financial instruments mentioned in this report can fall as well as rise. The value of securities and financial instruments is subject to exchange rate fluctuation that may have a positive or adverse effect on the price or income of such securities or financial instruments. Investors in securities such as ADR's, the values of which are influenced by currency volatility, effectively assume this risk. Structured securities are complex instruments, typically involve a high degree of risk and are intended for sale only to sophisticated investors who are capable of understanding and assuming the risks involved. The market value of any structured security may be affected by changes in economic, financial and political factors (including, but not limited to, spot and forward interest and exchange rates), time to maturity, market conditions and volatility, and the credit quality of any issuer or reference issuer. Any investor interested in purchasing a structured product should conduct their own investigation and analysis of the product and consult with their own professional advisers as to the risks involved in making such a purchase. Some investments discussed in this report may have a high level of volatility. High volatility investments may experience sudden and large falls in their value causing losses when that investment is realised. Those losses may equal your original investment. Indeed, in the case of some investments the potential losses may exceed the amount of initial investment and, in such circumstances, you may be required to pay more money to support those losses. Income yields from investments may fluctuate and, in consequence, initial capital paid to make the investment may be used as part of that income yield. Some investments may not be readily realisable and it may be difficult to sell or realise those investments, similarly it may prove difficult for you to obtain reliable information about the value, or risks, to which such an investment is exposed. This report may provide the addresses of, or contain hyperlinks to, websites. Except to the extent to which the report refers to website material of CS, CS has not reviewed any such site and takes no responsibility for the content contained therein. Such address or hyperlink (including addresses or hyperlinks to CS's own website material) is provided solely for your convenience and information and the content of any such website does not in any way form part of this document. Accessing such website or following such link through this report or CS's website shall be at your own risk.
This report is issued and distributed in European Union (except Switzerland): by Credit Suisse Securities (Europe) Limited, One Cabot Square, London E14 4QJ, England, which is authorised by the Prudential Regulation Authority and regulated by the Financial Conduct Authority and the Prudential Regulation Authority. Germany: Credit Suisse Securities (Europe) Limited Niederlassung Frankfurt am Main regulated by the Bundesanstalt fuer Finanzdienstleistungsaufsicht ("BaFin"). United States and Canada: Credit Suisse Securities (USA) LLC; Switzerland: Credit Suisse AG; Brazil: Banco de Investimentos Credit Suisse (Brasil) S.A or its affiliates; Mexico: Banco Credit Suisse (México), S.A. (transactions related to the securities mentioned in this report will only be effected in compliance with applicable regulation); Japan: by Credit Suisse Securities (Japan) Limited, Financial Instruments Firm, Director-General of Kanto Local Finance Bureau ( Kinsho) No. 66, a member of Japan Securities Dealers Association, The Financial Futures Association of Japan, Japan Investment Advisers Association, Type II Financial Instruments Firms Association; Hong Kong: Credit Suisse (Hong Kong) Limited; Australia: Credit Suisse Equities (Australia) Limited; Thailand: Credit Suisse Securities (Thailand) Limited, regulated by the Office of the Securities and Exchange Commission, Thailand, having registered address at 990 Abdulrahim Place, 27th Floor, Unit 2701, Rama IV Road, Silom, Bangrak, Bangkok10500, Thailand, Tel. +66 2614 6000; Malaysia: Credit Suisse Securities (Malaysia) Sdn Bhd; Singapore: Credit Suisse AG, Singapore Branch; India: Credit Suisse Securities (India) Private Limited (CIN no.U67120MH1996PTC104392) regulated by the Securities and Exchange Board of India as Research Analyst (registration no. INH 000001030) and as Stock Broker (registration no. INB230970637; INF230970637; INB010970631; INF010970631), having registered address at 9th Floor, Ceejay House, Dr.A.B. Road, Worli, Mumbai - 18, India, T- +91-22 6777 3777; South Korea: Credit Suisse Securities (Europe) Limited, Seoul Branch; Taiwan: Credit Suisse AG Taipei Securities Branch; Indonesia: PT Credit Suisse Securities Indonesia; Philippines:Credit Suisse Securities (Philippines ) Inc., and elsewhere in the world by the relevant authorised affiliate of the above.Additional Regional DisclaimersHong Kong: Credit Suisse (Hong Kong) Limited ("CSHK") is licensed and regulated by the Securities and Futures Commission of Hong Kong under the laws of Hong Kong, which differ from Australian laws. CSHKL does not hold an Australian financial services licence (AFSL) and is exempt from the requirement to hold an AFSL under the Corporations Act 2001 (the Act) under Class Order 03/1103 published by the ASIC in respect of financial services provided to Australian wholesale clients (within the meaning of section 761G of the Act). Research on Taiwanese securities produced by Credit Suisse AG, Taipei Securities Branch has been prepared by a registered Senior Business Person. Australia (to the extent services are offered in Australia): Credit Suisse Securities (Europe) Limited (“CSSEL”) and Credit Suisse International (“CSI”) are authorised by the Prudential Regulation Authority and regulated by the Financial Conduct Authority (“FCA”) and the Prudential Regulation Authority under UK laws, which differ from Australian Laws. CSSEL and CSI do not hold an Australian Financial Services Licence (“AFSL”) and are exempt from the requirement to hold an AFSL under the Corporations Act (Cth) 2001 (“Corporations Act”) under Class Order 03/1099 published by the Australian Securities and Investments Commission (“ASIC”), in respect of the financial services provided to Australian wholesale clients (within the meaning of section 761G of the Corporations Act). This material is not for distribution to retail clients and is directed exclusively at Credit Suisse's professional clients and eligible counterparties as defined by the FCA, and wholesale clients as defined under section 761G of the Corporations Act. Credit Suisse (Hong Kong) Limited (“CSHK”) is licensed and regulated by the Securities and Futures Commission of Hong Kong under the laws of Hong Kong, which differ from Australian laws. CSHKL does not hold an AFSL and is exempt from the requirement to hold an AFSL under the Corporations Act under Class Order 03/1103 published by the ASIC in respect of financial services provided to Australian wholesale clients (within the meaning of section 761G of the Corporations Act). Credit Suisse Securities (USA) LLC (CSSU) and Credit Suisse Asset Management LLC (CSAM LLC) are licensed and regulated by the Securities Exchange Commission of the United States under the laws of the United States, which differ from Australian laws. CSSU and CSAM LLC do not hold an AFSL and is exempt from the requirement to hold an AFSL under the Corporations Act under Class Order 03/1100 published by the ASIC in respect of financial services provided to Australian wholesale clients (within the meaning of section 761G of the Corporations Act). Malaysia: Research provided to residents of Malaysia is authorised by the Head of Research for Credit Suisse Securities (Malaysia) Sdn Bhd, to whom they should direct any queries on +603 2723 2020. Singapore: This report has been prepared and issued for distribution in Singapore to institutional investors, accredited investors and expert investors (each as defined under the Financial Advisers Regulations) only, and is also distributed by Credit Suisse AG, Singapore Branch to overseas investors (as defined under the Financial Advisers Regulations). Credit Suisse AG, Singapore Branch may distribute reports produced by its foreign entities or affiliates pursuant to an arrangement under Regulation 32C of the Financial Advisers Regulations. Singapore recipients should contact Credit Suisse AG, Singapore Branch at +65-6212-2000 for matters arising from, or in connection with, this report. By virtue of your status as an institutional investor, accredited investor, expert investor or overseas investor, Credit Suisse AG, Singapore Branch is exempted from complying with certain compliance requirements under the Financial Advisers Act, Chapter 110 of Singapore (the “FAA”), the Financial Advisers Regulations and the relevant Notices and Guidelines issued thereunder, in respect of any financial advisory service which Credit Suisse AG, Singapore Branch may provide to you. UAE: This information is being distributed by Credit Suisse AG (DIFC Branch), duly licensed and regulated by the Dubai Financial Services Authority (“DFSA”). Related financial services or products are only made available to Professional Clients or Market Counterparties, as defined by the DFSA, and are not intended for any other persons. Credit Suisse AG (DIFC Branch) is located on Level 9 East, The Gate Building, DIFC, Dubai, United Arab Emirates. EU: This report has been produced by subsidiaries and affiliates of Credit Suisse operating under its Global Markets Division This research may not conform to Canadian disclosure requirements. In jurisdictions where CS is not already registered or licensed to trade in securities, transactions will only be effected in accordance with applicable securities legislation, which will vary from jurisdiction to jurisdiction and may require that the trade be made in accordance with applicable exemptions from registration or licensing requirements. Non-US customers wishing to effect a transaction should contact a CS entity in their local jurisdiction unless governing law permits otherwise. US customers wishing to effect a transaction should do so only by contacting a representative at Credit Suisse Securities (USA) LLC in the US. Please note that this research was originally prepared and issued by CS for distribution to their market professional and institutional investor customers. Recipients who are not market professional or institutional investor customers of CS should seek the advice of their independent financial advisor prior to taking any investment decision based on this report or for any necessary explanation of its contents. This research may relate to investments or services of a person outside of the UK or to other matters which are not authorised by the Prudential Regulation Authority and regulated by the Financial Conduct Authority and the Prudential Regulation Authority or in respect of which the protections of the Prudential Regulation Authority and Financial Conduct Authority for private customers and/or the UK compensation scheme may not be available, and further details as to where this may be the case are available upon request in respect of this report. CS may provide various services to US municipal entities or obligated persons ("municipalities"), including suggesting individual transactions or trades and entering into such transactions. Any services CS provides to municipalities are not viewed as "advice" within the meaning of Section 975 of the Dodd-Frank Wall Street Reform and Consumer Protection Act. CS is providing any such services and related information solely on an arm's length basis and not as an advisor or fiduciary to the municipality. In connection with the provision of the any such services, there is no agreement, direct or indirect, between any municipality (including the officials,management, employees or agents thereof) and CS for CS to provide advice to the municipality. Municipalities should consult with their financial, accounting and legal advisors regarding any such services provided by CS. In addition, CS is not acting for direct or indirect compensation to solicit the municipality on behalf of an unaffiliated broker, dealer, municipal securities dealer, municipal advisor, or investment adviser for the purpose of obtaining or retaining an engagement by the municipality for or in connection with Municipal Financial Products, the issuance of municipal securities, or of an investment adviser to provide investment advisory services to or on behalf of the municipality. If this report is being distributed by a financial institution other than Credit Suisse AG, or its affiliates, that financial institution is solely responsible for distribution. Clients of that institution should contact that institution to effect a transaction in the securities mentioned in this report or require further information. This report does not constitute investment advice by Credit Suisse to the clients of the distributing financial institution, and neither Credit Suisse AG, its affiliates, and their respective officers, directors and employees accept any liability whatsoever for any direct or consequential loss arising from their use of this report or its content. Principal is not guaranteed. Commission is the commission rate or the amount agreed with a customer when setting up an account or at any time after that. Copyright © 2016 CREDIT SUISSE AG and/or its affiliates. All rights reserved. Investment principal on bonds can be eroded depending on sale price or market price. In addition, there are bonds on which investment principal can be eroded due to changes in redemption amounts. Care is required when investing in such instruments. When you purchase non-listed Japanese fixed income securities (Japanese government bonds, Japanese municipal bonds, Japanese government guaranteed bonds, Japanese corporate bonds) from CS as a seller, you will be requested to pay the purchase price only.