Embed Size (px)
Citation preview
Words into Action Guidelines:National Disaster Risk AssessmentHazard Specific Risk Assessment
7. Coastal Erosion Hazard and Risk Assessment
Key words: Coastal erosion hazard and risk assessment, built environment, risk mitigation
UNISDR 2017
1
Description of the Hazard, Sources and Setting Coastal erosion (or shoreline retreat) is the loss of coastal lands due to the net removal of sediments or bedrock from the shoreline. Erosion is typically driven by the action of waves and currents, and by mass wasting processes on slopes, and subsidence (particularly on muddy coasts). Significant episodes of coastal erosion are often associated with extreme weather events (coastal storms, storm surge and flooding) but also with tsunami, both because the waves and currents tend to have greater intensity, and because the associated storm surge or tsunami inundation may allow waves and currents to attack landforms that are normally out of their reach.
On coastal headlands, such processes may lead to the undercutting of cliffs and steep slopes and contribute to mass wasting. In addition, heavy rainfall can enhance the saturation of soils, with high saturation leading to a reduction in the shear strength of the soil and a corresponding increase in the chance of slope failure. Coastal erosion is a natural process that occurs whenever the transport of material away from the shoreline is not balanced by the deposition of new material onto the shoreline. Many coastal landforms naturally undergo quasi-periodic cycles of erosion and accretion on timescales of days to years – this is especially evident on sandy landforms such as beaches, dunes, and intermittently closed and open lagoon entrances.
However, human activities can also strongly influence the propensity of landforms to erode. For example, the construction of coastal structures (e.g. breakwaters, groynes (coastal barriers) and seawalls) can lead to changes in coastal sediment transport pathways, resulting in erosion in some areas and accretion in others. The removal of sediments from the coastal system (e.g. 1by dredging, sand mining), or a reduction in the supply of sediments (e.g. by the regulation of rivers) may also be associated with unintended erosion.
Cooper, A. and O.H. Pilkey (2012). Pitfalls of Shoreline Stabilization. Selected Case Studies. 1Coastal Research Library 3, DOI 10.1007/978-94-007-4123-2_1. Dordrecht : Springer Netherlands.
2
Shoreline retreat in the highly populated mega-deltas of Asia is partly attributed to regulation of rivers, reducing the sediment supply to the shoreline and associated deltaic plains, in addition to groundwater extraction, which has increased subsidence rates . On larger scales, natural and human-2induced climate change can modulate the likelihood and rate of coastal erosion. For example, mean sea level is predicted to increase in the coming decades/centuries due to anthropogenic climate change, and this is expected to increase the frequency of coastal inundation events and thus opportunities for shoreline erosion. 3
Coastal erosion becomes a hazard when society does not adapt to its effects on people, the built environment and infrastructure. Many human settlements are constructed in areas vulnerable to coastal erosion, with early estimates suggesting that around 70 per cent of the global coastline is eroding. But it is 4
difficult to accurately quantify the global distribution of the hazard and risk, since coastal landforms and human settlements can vary significantly over spatial scales of metres to kilometres, and current global scale data sets are inadequate for assessments at this scale. National scale assessments 5
highlight that there is considerable spatial variability in the risk at these fine scales.
Queensland Government (2013). Coastal hazard technical guide: Determining coastal hazard 2areas (last accessed 26 Jan. 2017 www.ehp.qld.gov.au/coastalplan/pdf/hazards-guideline.pdf)
Intergovernmental Oceanographic Commission (2012). Guide on adaptation options in coastal 3areas for local decision makers: Guidance for decision making to cope with coastal changes in West Africa. IOC Manual and Guide No. 62, ICAM Dossier No. 7 (last accessed 26 Jan. 2017 www.accc-africa.org/sites/default/files/documents/2012/09/14/une-guide_acca_en_bd.pdf)
Bird, C. F. (1985). Coastline Changes. New York: John Wiley.4
Department of Climate Change (2009). Climate Change Risks to Australia’s Coast: A First Pass 5National Assessment. Department of Climate Change, Australia. Available from www.environment.gov.au/climate-change/adaptation/publications/climate-change-risks-australias-coasts, last accessed 16 Feb. 2017)
3
Examples of coastal erosionRapid:
• Storm surge: Australia has experienced a number of coastal erosion events, some dating from the 1800s. One of Australia’s most damaging storms was the 1974 sequence, impacting Queensland and New South Wales. 6
• Tsunami: The 2004 Indian Ocean Tsunami caused severe coastal erosion in a number of locations, including Thailand. Impact was also observed on 7
coral reefs, sea grass and mangroves. 8
Slow (sea-level rise):
• Happisburgh (United Kingdom), on Norfolk’s North Sea coast, was once some distance from the sea. Historic records indicate that over 250m land was lost between 1600 and 1850. It is likely that the Norfolk cliffs have been eroding at the present rate for about the last 5,000 years when the sea level rose to within a metre or two of its present elevation.
• From most countries in the Pacific region there are many anecdotal reports that sea-level rise is already causing significant erosion and loss of land. Evidence of erosion includes beach scarps, undercutting of vegetation, including coconut palms, and outcrops of beach rock that have become uncovered by shoreline changes.
• The coastline of Tongatapu (Tonga) is subject to a range of coastal protection studies and works. The Ministry of Meteorology, Energy, Information, Disaster management, Climate Change and Communications has recognized the vulnerability of that coastline to coastal erosion processes, launching the Coastal protection Project in 2015.
Hazard assessment A wide range of methodologies have been applied for coastal erosion hazard assessment. The key factors influencing these methodologies include:
• The spatial and temporal scale of the analysis. This may range from an entire continent as part of a national assessment to a regional analysis at local government level or a single sediment compartment to inform a particular erosion issue.
Callaghan, J. and P. Helman (2008). Severe storms on the east coast of Australia 1770-2008. 6Griffith Centre for Coastal Management (last accessed 26 Jan. 2017 www.goldcoast.qld.gov.au/documents/bf/storms-east-coast-1770-2008.pdf)
Choowong, M. and others (2007). Erosion and Deposition by the 2004 Indian Ocean Tsunami in 7Phuket and Phang-nga Provinces, Thailand. Journal of Coastal Research, vol. 23, issue 5, pp. 1270-1276.
Thom, B. (2014) Coastal Compartments Project - Summary for policy makers. (last accessed 24 8April 2017 www.environment.gov.au/climate-change/adaptation/publications/coastal-compartments-project-summary-policy-makers)
4
Likewise, the timescale of analysis can range from short-term (subannual) to better understand coastal behaviour across the seasonal weather cycle or long-term (decadal) to incorporate climate variability and inform planning decisions. Geological timescales are also relevant on those coasts where sea-level rise is ongoing due to natural subsidence (e.g. deltaic coasts such as in the Gulf of Mexico) or continued adjustments of land masses following deglaciation after the last ice age (e.g. eastern Canada and northeastern United States). These natural changes across various timescales provide important context for understanding coastal erosion processes on short time scales and when making planning decisions (see figure 1 in [18]). The timeline then 9
defines the range of events that should be considered. For example, residential buildings in Australia (life of asset expected to be at least 50 years) are designed for events with an annual probability of exceedance of 1/500 (for wind and earthquake).
• The nature of the coastal landforms and the offshore environment in the area of interest. At a general level, the form and composition of coastal landforms and the presence of barrier islands and reefs in the offshore environment determines the sets of physical processes that should be considered in an erosion assessment. Sandy shorelines, coastal cliffs, fringing reef coasts and deltaic coasts are each affected by somewhat different processes.
• The nature of the sea action being considered. The underlying driver for erosion (e.g. sea-level rise, storms or tsunami) will determine the types of analysis or modelling that will inform an assessment. In addition, future trends associated with climate change are critical and the event being considered (e.g. design event (specified event possibly based on consequence or likelihood criteria) or extreme event (largest event believed possible) or the full range of events (e.g. via a probabilistic analysis).
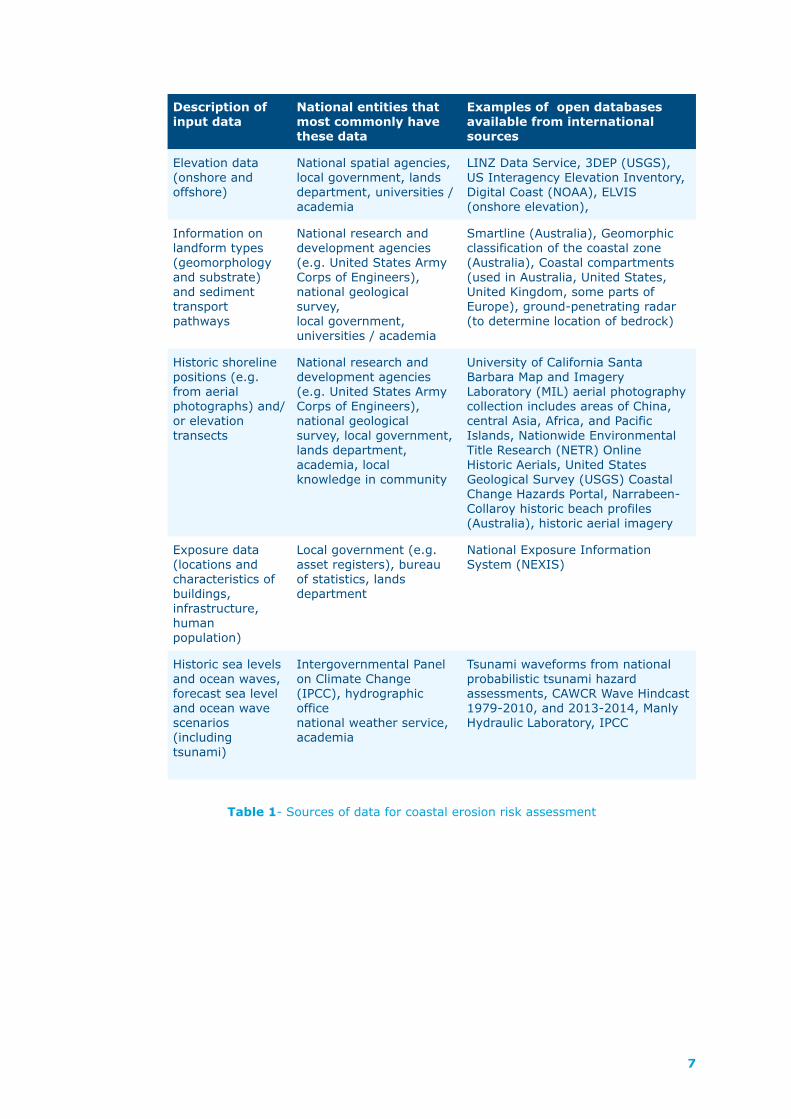
Our understanding of the coastal environment, and particularly how and where sediment is transported (i.e. the sediment budget) will critically affect the appropriate choice of spatial scale for the study. Data availability place limitations on the nature of the hazard assessment (see table below for examples of input data for hazard assessments).
Coastal compartments represent one way to define the scales that should be considered when taking actions that could affect sediment budgets. For example, construction of a groynes may protect a community as intended but cut off sediment supply to another part of the same coastal compartment, thereby leading to coastal erosion downdrift. A typical coastal compartment
Ibid. 9
5
identifying the sediment transport pathways can be found in the Climate Change Adaptation Guidelines published by Engineers Australia (see figure 4). 10
When data are sparse or non-existent, it is helpful to understand the physical context and history of an eroding beach through available imagery (e.g. Google Earth), conduct site surveys to assess the wave climate and beach state, map coastal infrastructure (such as groynes) and features that may be controlling the sediment supply to the coastal zone of interest, and engage with the local community. Establishing a baseline may also be necessary if suitable data do not exist. For example, shoreline mapping to record erosion lines and subsequent recovery over time will assist in understanding the impact of seasonal cycles in beach dynamics.
Estimating how a shoreline will change over time is an evolving science. State-of-the-science approaches include some form of shoreline response modelling that can be applied to coastal erosion hazard assessments. Modelling can be done to provide information to address questions such as:
• How far would the shoreline retreat for the design level scenario?
• Which parts of the shoreline are more vulnerable to coastal erosion?
• Are there offshore features (e.g. reefs, barrier islands) that are vulnerable to sea-level rise?
• What is the probability of 1m, 5m or 10m of shoreline retreat (shown spatially for the region of interest)?
• What is the confidence (and uncertainty) in these estimates?
• What is the effectiveness of coastal defence options?
However, complex shoreline evolution models may not necessarily outperform simpler approaches and are not suitable for national-scale assessments. 11
Engineers Australia (2012). Climate Change Adaptation Guidelines in Coastal Management and 10Planning (last accessed 24 April 2017 www.engineersaustralia.org.au/sites/default/files/content-files/2016-12/climate_change_adaptation_guidelines.pdf)
Kinsela, M.A. and D.J. Hanslow (2013). Coastal erosion risk assessment in New South Wales: 11limitations and potential future directions. Proceedings of the NSW Coastal Conference, 2013 (last accessed 16 Feb. 2017 www.coastalconference.com/2013/papers2013/NSWCC_Kinsela_Hanslow_2013.pdf)
6
Description of input data
National entities that most commonly have these data
Examples of open databases available from international sources
Elevation data (onshore and offshore)
National spatial agencies, local government, lands department, universities / academia
LINZ Data Service, 3DEP (USGS), US Interagency Elevation Inventory, Digital Coast (NOAA), ELVIS (onshore elevation),
Information on landform types (geomorphology and substrate) and sediment transport pathways
National research and development agencies (e.g. United States Army Corps of Engineers), national geological survey, local government, universities / academia
Smartline (Australia), Geomorphic classification of the coastal zone (Australia), Coastal compartments (used in Australia, United States, United Kingdom, some parts of Europe), ground-penetrating radar (to determine location of bedrock)
Historic shoreline positions (e.g. from aerial photographs) and/or elevation transects
National research and development agencies (e.g. United States Army Corps of Engineers), national geological survey, local government, lands department, academia, local knowledge in community
University of California Santa Barbara Map and Imagery Laboratory (MIL) aerial photography collection includes areas of China, central Asia, Africa, and Pacific Islands, Nationwide Environmental Title Research (NETR) Online Historic Aerials, United States Geological Survey (USGS) Coastal Change Hazards Portal, Narrabeen-Collaroy historic beach profiles (Australia), historic aerial imagery
Exposure data (locations and characteristics of buildings, infrastructure, human population)
Local government (e.g. asset registers), bureau of statistics, lands department
National Exposure Information System (NEXIS)
Historic sea levels and ocean waves, forecast sea level and ocean wave scenarios (including tsunami)
Intergovernmental Panel on Climate Change (IPCC), hydrographic office national weather service, academia
Tsunami waveforms from national probabilistic tsunami hazard assessments, CAWCR Wave Hindcast 1979-2010, and 2013-2014, Manly Hydraulic Laboratory, IPCC
7
Table 1- Sources of data for coastal erosion risk assessment
Tsunami risk assessment use in national DRR measures A risk assessment will typically be determined by combining the knowledge of the hazard, the elements at risk (e.g. built environment) and an understanding of the vulnerability of those elements. This vulnerability is often described by classes of damage, ranging from “no damage” through to “complete damage” (e.g. total destruction of an asset). In the case of the coastal erosion hazard, buildings (residential, commercial, public, etc.) can be considered as requiring complete replacement or as being uninhabitable where their foundations are undermined. If the risk assessment process considers other elements at risk – such as parts of the surrounding landforms and ecosystem (e.g. dunes, mangroves, saltmarsh) – vulnerability models describing the level of damage to these elements will need to be determined. Coastal inundation hazards may also be included in the risk assessment, in which case suitable vulnerability models would need to be sourced (a starting point could be to employ flood damage models).
Case study: The New South Wales (Australia) coastal erosion risk assessment is a broad-scale assessment for the entire coastline of that 12
State, (over 2,000 km) combining the elements described above. Over several decades, New South Wales has seen a number of severe coastal erosion events, and with population increasing in the coastal zone, the risk profile is changing.
The assessment led to the identification of coastal erosion hotspots, and this information allows the government to prioritize its coastal management activities. The study also suggests that the assessment should be guided by the level of risk, and that there needs to be agreement among stakeholders on the acceptable thresholds of that risk.
Recommendations to reduce risk should be based on these assessments, and may take many forms, including:
• Land-use policy and/or regulation, such as planning laws to limit development in at-risk areas (e.g. by defining coastal setback lines)
• Physical shoreline protection, such as beach nourishment, sea walls and groynes to maintain sediment volumes and help stabilize shoreline position
• Physical offshore protection, such as breakwaters and artificial reefs, to modify and redistribute the energy of storm waves
• Environmental remediation approaches, such as maintaining or restoring natural ecosystems (e.g. mangrove forests, coral reefs and dune vegetation) to provide natural buffers to storm events.
Intergovernmental Panel on Climate Change (2014). Climate Change 2014: Impacts, 12Adaptation and Vulnerability. Fifth Assessment Report of the Intergovernmental Panel on Climate Change.
8
Recent examples of the implementation of risk reduction measures:
• United Kingdom. Clacton coastal defences 13
• United States. Barrier Islands, New Jersey https://toolkit.climate.gov/case-studies/restoring-natural-dunes-enhance-coastal-protection
• United States. Ventura, California https://toolkit.climate.gov/case-studies/restoring-surfers-point-partnerships-persistence-pays
• United States. Hawaii. O’ahu North Shore https://toolkit.climate.gov/case-studies/confronting-shoreline-erosion-o%E2%80%98ahu
• New Zealand, Bay of Plenty dune rehabilitation www.mfe.govt.nz/publications/climate-change/coast-care-bay-plenty-dune-restoration/coast-care-bay-plenty-dune
National case study
The National Coastal Risk Assessment for Australia, which was conducted in 2010 and 2011, identified the spatial extent of settlements and 14
infrastructure, ecosystems and industries in the coastal zone which would be impacted from inundation and erosion for a range of sea-level rise scenarios. The infrastructure assessed included residential, commercial, light-industry buildings, and transport systems. The assessment was led by the Federal Department of Climate Change with input from a range of technical experts (government science agencies, research institutions and consultants), as well as from State government departments responsible for coastal management.
The assessment required the development of national data sets, including: the digital elevation model (necessary for inundation modelling); high water level and storm tide (necessary for inundation modelling) and coastal geomorphology (to identify segments of the coast which are susceptible to erosion).
Through the assessment, a number of key areas emerged where various kinds of data were lacking on the national scale: estuaries and knowledge of their shoreline geomorphology; national exposure of important infrastructure; regional and local influences on coastal instability (i.e. inputs for coastal erosion models) and higher resolution digital elevation models (as coarse resolution models were not suitable for modelling inundation in low gradient coastal plains).
Environment Agency (2016). Managing flood and coastal erosion risks in England 1 April 2015 13to 31 March 2016 (last accessed 24 April 2017 www.gov.uk/government/uploads/system/uploads/attachment_data/file/575139/National_Flood_Risk_Report_LIT_10517.pdf)
Kinsela, M.A. and D.J. Hanslow (2013). Coastal erosion risk assessment in New South Wales: 14limitations and potential future directions. Proceedings of the NSW Coastal Conference, 2013 (last accessed 16 Feb www.coastalconference.com/2013/papers2013/NSWCC_Kinsela_Hanslow_2013.pdf)
9
Key findings from the assessment were:
• Between $41 and $63 billion AUD (2008 replacement value) of existing residential buildings are potentially at risk of inundation from a 1.1 m sea-level rise (between 157,000 and 247,600 individual buildings of the 711,000 existing buildings).
• Nearly 39,000 buildings located within 110 m of “soft” shorelines were at risk from accelerated erosion due to sea-level rise and changing climate conditions.
• The concentration of infrastructure in the coastal zone around population centres will bring risks to those assets which could have consequences for the delivery of community and essential services, regional economies and possibly the national economy. For example, there are 258 police, fire and ambulance stations, 5 power stations/substations, 75 hospitals and health services, 41 landfill sites, 3 water treatment plants and 11 emergency services facilities located within 200 m of the shoreline.
• While there is a lack of information on social vulnerability to climate change, remote Indigenous communities in the north of Australia and communities living on the low-lying Torres Strait Islands are particularly vulnerable to sea-level rise.
The assessment provided a case for early action to reduce risk. There is a large legacy risk in the coastal zone from buildings and other infrastructure constructed in the past, without regard to climate change and the instability of some coastal landforms. For “at-risk” areas, strategies to protect, accommodate or retreat will need to be developed, as sea level is projected to continue rising for several centuries. Triggers will be needed to identify when on-ground responses are needed to manage increasing risks. State and local government, industry and communities will have a primary role to play in on-ground coastal adaptation action.
Continued work is required on developing standards and benchmarks, providing information, auditing infrastructure at risk, on-ground demonstrations of adaptation options, and local capacity-building. Areas of uncertainty for the science components also need to be addressed.
10
Resources for further information
Climate change adaptation guidelines are another source of information for coastal managers:
• The Intergovernmental Oceanographic Commission (IOC) advises policy makers and managers on reducing risks from tsunamis, storm surges, harmful algal blooms (HABs) and other coastal hazards by focusing on implementing adaptation measures to strengthen the resilience of vulnerable coastal communities, their infrastructure and service-providing ecosystems. IOC is implementing the project “Adaptation to climate change in coastal zones of West Africa” 15
• United Nations Environment Programme (UNEP) 16
• United Nations Development Programme (UNDP) Climate change adaptation – coastal zone development programme http://adaptation-undp.org/thematic-areas/coastal-zone-development (example case studies in Africa, Samoa)
Other substantial peer-reviewed guidelines from reputable institutions:
• National Oceanic and Atmospheric Administration (NOAA) Office for Coastal Management https://coast.noaa.gov/digitalcoast/tools/hazards-portal.html
• Engineers Australia: Climate Change Adaptation Guidelines in Coastal Management and Planning, includes information on coastal processes and sediment budgets www.engineersaustralia.org.au/sites/default/files/content-files/2016-12/climate_change_adaptation_guidelines.pdf
• CATALYST project (funded by the European Commission) Capacity development for hazard risk reduction and adaptation www.catalyst-project.eu and Hare et al. 2013
• United States Army Corps of Engineers – Manuals: www.publications.usace.army.mil/USACE-Publications/Engineer-Manuals/
• Environmental Engineering for Coastal Shore Protection • Design of Coastal Revertments, Seawalls, and Bulkheads
• Coastal Engineering Manual - Part I to Part VI and Appendix A
Intergovernmental Oceanographic Commission (2012) Guide on adaptation options in coastal 15areas for local decision makers: Guidance for decision making to cope with coastal changes in West Africa. IOC Manual and Guide No. 62, ICAM Dossier No. 7 (last accessed 26 Jan. 2017 www.accc-africa.org/sites/default/files/documents/2012/09/14/une-guide_acca_en_bd.pdf)
United Nations Environment Programe (2010). Technologies for Climate Change Adaptation: 16Coastal Erosion and Flooding. TNA guidebook series (last accessed 26 Jan. www.unep.org/pdf/TNAhandbook_CoastalErosionFlooding.pdf)
11
Open source hazard and risk modelling tools:
• United States Army Corps of Engineers (USACE) Coastal Modeling System www.erdc.usace.army.mil/Media/Fact-Sheets/Fact-Sheet-Article-View/Article/484188/coastal-modeling-system/
• USACE Beach-fx. Analyzing Evolution and Cost-Benefits of Shore Protection Projectswww.erdc.usace.army.mil/Media/Fact-Sheets/Fact-Sheet-Article-View/Article/476718/beach-fx/
• Deltares – XBeach. https://oss.deltares.nl/web/xbeach/
• University of Southampton – SCAPE+ (Soft Cliff And Platform Erosion)
• United States Geological Survey Digital Shoreline Analysis System (shoreline change) – requires ArcGIS 9.x or above
• https://woodshole.er.usgs.gov/project-pages/DSAS/
• SWAN (wave model) http://www.swan.tudelft.nl/
• NIWA Beach Profile Analysis Toolbox (BPAT) – free licence for academic (with restriction on number of regions), NZ$850 for first commercial licence https://www.niwa.co.nz/our-science/coasts/tools-and-resources/tides/bpat
Successful and well-documented national hazard and risk assessment with results used in DRR:
• The U.S. Climate Resilience Toolkit shows a number of case studies relating to coastal erosion - https://toolkit.climate.gov/topics/coastal-flood-risk/coastal-erosion
• The synthesis report shows a number of case studies where assessments 17
were made that led to adaptation measures being implemented to reduce the risk of coastal erosion.
Hare, M, C., J. van Bers and J. Mysiak, eds. (2013). A Best Practices Notebook for Disaster 17Risk Reduction and Climate Change Adaptation: Guidance and Insights for Policy and Practice from the CATALYST Project. Trieste: The World Academy of Sciences (last accessed 26 Jan. www.catalyst-project.eu/doc/CATALYST_D65_Best_Practices_Policy_Notebook.pdf)
12

Authors:
Martine Woolfe (Geoscience Australia)
Contributors and Peer Reviewers:
Tom Baldock (University of Queensland)
13