Embed Size (px)
Citation preview
7Anatomy, Physiology, and Function of Auditory End-Organs in the FrogInner Ear
Dwayne D. Simmons, Sebastiaan W.F. Meenderink, and Pantelis N. Vassilakis
1. Overview
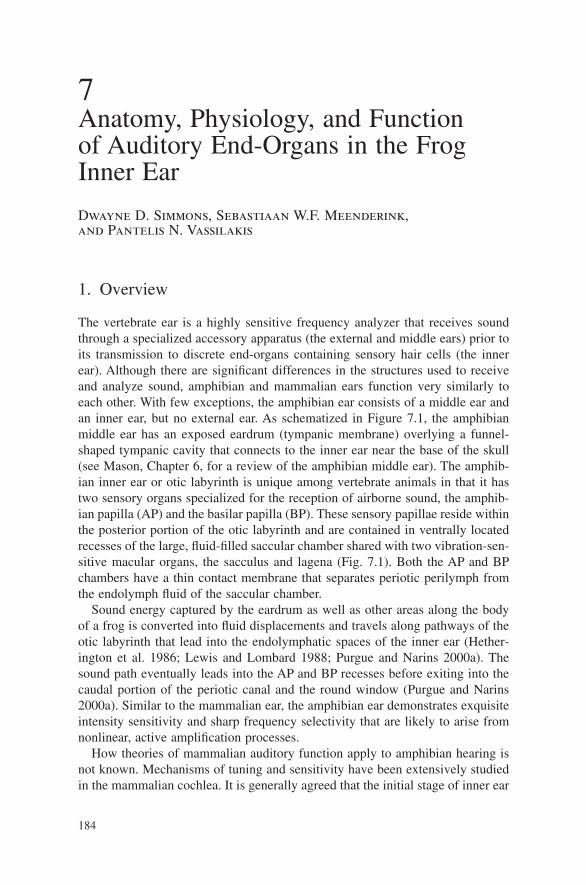
The vertebrate ear is a highly sensitive frequency analyzer that receives soundthrough a specialized accessory apparatus (the external and middle ears) prior toits transmission to discrete end-organs containing sensory hair cells (the innerear). Although there are significant differences in the structures used to receiveand analyze sound, amphibian and mammalian ears function very similarly toeach other. With few exceptions, the amphibian ear consists of a middle ear andan inner ear, but no external ear. As schematized in Figure 7.1, the amphibianmiddle ear has an exposed eardrum (tympanic membrane) overlying a funnel-shaped tympanic cavity that connects to the inner ear near the base of the skull(see Mason, Chapter 6, for a review of the amphibian middle ear). The amphib-ian inner ear or otic labyrinth is unique among vertebrate animals in that it hastwo sensory organs specialized for the reception of airborne sound, the amphib-ian papilla (AP) and the basilar papilla (BP). These sensory papillae reside withinthe posterior portion of the otic labyrinth and are contained in ventrally locatedrecesses of the large, fluid-filled saccular chamber shared with two vibration-sen-sitive macular organs, the sacculus and lagena (Fig. 7.1). Both the AP and BPchambers have a thin contact membrane that separates periotic perilymph fromthe endolymph fluid of the saccular chamber.
Sound energy captured by the eardrum as well as other areas along the bodyof a frog is converted into fluid displacements and travels along pathways of theotic labyrinth that lead into the endolymphatic spaces of the inner ear (Hether-ington et al. 1986; Lewis and Lombard 1988; Purgue and Narins 2000a). Thesound path eventually leads into the AP and BP recesses before exiting into thecaudal portion of the periotic canal and the round window (Purgue and Narins2000a). Similar to the mammalian ear, the amphibian ear demonstrates exquisiteintensity sensitivity and sharp frequency selectivity that are likely to arise fromnonlinear, active amplification processes.
How theories of mammalian auditory function apply to amphibian hearing isnot known. Mechanisms of tuning and sensitivity have been extensively studiedin the mammalian cochlea. It is generally agreed that the initial stage of inner ear
184
7. Auditory End-Organs 185
frequency selectivity is achieved through the specialized mechanical propertiesof the basilar membrane, giving rise to a traveling wave (Von Békésy 1960; West1985). Such traveling waves may be enhanced by electrically driven somaticmovements of specialized outer hair cells that provide the work required for theactive process (Dallos 1992; Nobili et al. 1998; Ashmore et al. 2000). Althoughouter hair cell-like motility has not been demonstrated in reptiles and birds, theirpapillae contain structures analogous to those in the mammalian cochlea such asa basilar membrane. However, one of the most striking anomalies concerning thefrog AP is that it lacks a basilar membrane, and yet it clearly demonstrates sharpfrequency resolution and sensitivity as well as otoacoustic emissions (OAEs) thatare comparable to those found in mammals. In amphibians, reptiles, and birds,the best candidate for an active process may be the active motility of theirmechanically sensitive hair bundles (Hudspeth et al. 2000; Fettiplace et al. 2001;Bozovic and Hudspeth 2003).
Although amphibian auditory organs may (Wever 1973) or may not (Will and Fritzsch 1988) have arisen independently and separately from those of othervertebrates, studies of these organs provide an opportunity to explore the detailsof what may be convergent design and function. Do analogous physiologicalresponses arise from similar or different anatomical features? Does the sensoryend-organs’ fine structure and innervation follow common principles acrossspecies? Although there have been extensive investigations into the physiologyof these organs, much less is known about the detailed structure of anatomical
Figure 7.1. A schematic representation of the frog’s ear. Modified from Wever, ErnestGlen; the Amphibian Ear. © 1985 Princeton University Press. Reprinted by permission ofPrinceton University Press.
186 D.D. Simmons et al.
correlates of this physiology such as the relationship between conduction veloc-ities and response latencies. Much of the physiology of hair cell and eighth-nerveresponses of the AP and BP has been reviewed previously (Lewis and Narins1999; Smotherman and Narins 2000). Sections 2 and 3 focus on the basic structural correlates of physiological responses of ranid frogs within the auditorypapillae and nerve, respectively, and Section 4 focuses on what is known aboutamphibian OAEs, and discusses the relationship of their properties to the underlying hearing mechanisms as well as the differences between sensoryorgans.
2. AP and BP Sensory Organs
2.1 Structural Organization of the AP and BP
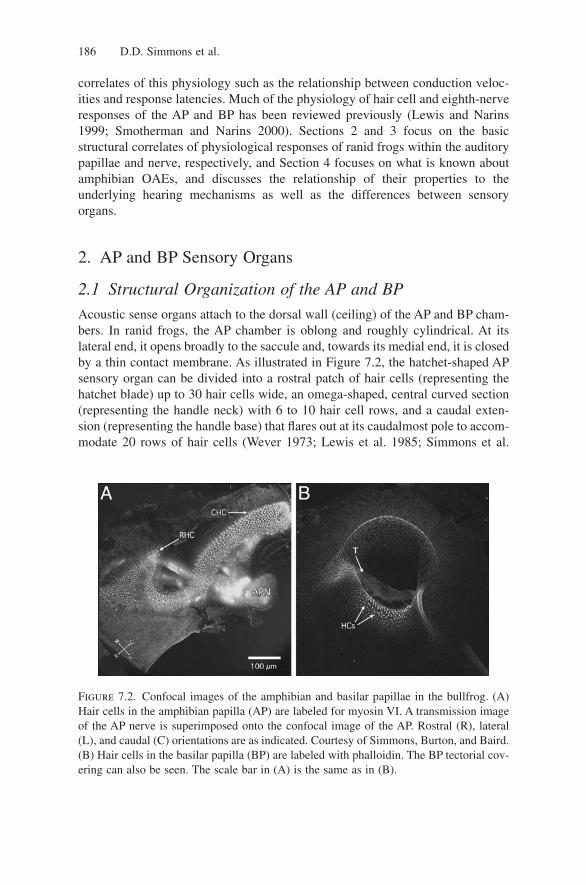
Acoustic sense organs attach to the dorsal wall (ceiling) of the AP and BP cham-bers. In ranid frogs, the AP chamber is oblong and roughly cylindrical. At itslateral end, it opens broadly to the saccule and, towards its medial end, it is closedby a thin contact membrane. As illustrated in Figure 7.2, the hatchet-shaped APsensory organ can be divided into a rostral patch of hair cells (representing thehatchet blade) up to 30 hair cells wide, an omega-shaped, central curved section(representing the handle neck) with 6 to 10 hair cell rows, and a caudal exten-sion (representing the handle base) that flares out at its caudalmost pole to accom-modate 20 rows of hair cells (Wever 1973; Lewis et al. 1985; Simmons et al.
Figure 7.2. Confocal images of the amphibian and basilar papillae in the bullfrog. (A)Hair cells in the amphibian papilla (AP) are labeled for myosin VI. A transmission imageof the AP nerve is superimposed onto the confocal image of the AP. Rostral (R), lateral(L), and caudal (C) orientations are as indicated. Courtesy of Simmons, Burton, and Baird.(B) Hair cells in the basilar papilla (BP) are labeled with phalloidin. The BP tectorial cov-ering can also be seen. The scale bar in (A) is the same as in (B).
7. Auditory End-Organs 187
1994b, 2004). Overlying the sensory surface of the AP is a honeycomb mesh-work of gelatinous tissue called the tectorium. A thin net of tectorial tissue (tec-torial curtain) is suspended across the AP chamber between the AP nerve and themiddle region of the AP tectorium. In contrast, the organization of the BP is quitesimple. The cylindrical and much smaller BP chamber also opens to the sacculeat its lateral end and is likewise closed by a thin contact membrane towards itsmedial end. Hair cells in the BP are organized into five or six rows containingup to 20 hair cells each (Wever 1985). The BP has a thin, semi-lunar tectoriumstretching across a short tubular passage with an underlying sensory epithelium(Fig. 7.2B). In contrast to the mammalian cochlea, hair cells in both the AP andthe BP are rigidly fixed to the cartilaginous wall of the respective papillarrecesses, rather than over a flexible membrane. In mammals, traveling waves onthe flexible basilar membrane are thought to contribute importantly to the func-tionality of the cochlea.
There are many features of the frog auditory system that may influence its sen-sitivity and tuning. The tectorial structures of each papilla, the size of the haircell, its position within the papilla, as well as its stereovillar morphology all con-tribute to the thresholds and tuning characteristics of afferent nerve fibers. In addi-tion, the synaptic area and number of synapses per hair cell, the region andnumber of hair cells innervated, and the diameter and length of each afferent fiberalso contribute to the fiber’s threshold, latency, and/or tuning responses. However,how the tectorium, hair cells, and synaptic architecture impose limits on eighth-nerve responses is not at all well understood.
For the gross tuning of frog auditory organs, Purgue and Narins (2000a,b)suggest that the frequency difference in neural responses between the AP and BPmay be largely explained on the basis of the mechanical tuning of their respec-tive contact membranes. However, only a few studies have attempted to charac-terize the micromechanics of the tectorium (Lewis and Leverenz 1983; Shofnerand Feng 1983; Lewis et al. 1992). With the exception of Wever’s hypothesis thatthe tectorial curtain intercepts the motion of the fluid in the AP chamber and trans-fers it to the tectorium (Wever 1985), very little is known or has been hypothe-sized about the dynamics between the point of auditory interception and theinitiation of action potentials in the auditory nerve fiber (Smotherman and Narins2000). In general, the degree to which the fine structure of the auditory end-organand its nerve fibers are related to physiological parameters such as acoustictuning, threshold responses, response latencies, and spontaneous activity is notas well understood in frogs as it is in the mammalian cochlea.
2.2 Hair Cell Stereovilli and the Tectorium
In frogs, auditory hair cells exhibit a variety of distinctive hair bundle mor-phologies that contain both stereovilli and a true cilium (kinocilium). The hairbundle consists of stereovilli having a graded series of heights with the tallestones adjacent to the kinocilium. Deflection of the hair bundle towards the kinocil-
188 D.D. Simmons et al.
ium opens tip-linked transduction channels, resulting in a depolarization of thehair cell. Deflection of the hair bundle away from the kinocilium hyperpolarizesthe hair cell. Lewis and colleagues (Lewis and Li 1975; Lewis 1976; Baird andLewis 1986; Lewis and Lombard 1988) have studied amphibian hair bundlesextensively. In general, hair cells on one or more margins of these organs displaybundles with an immature or juvenile pattern, suggesting that they make up amarginal growth zone that develops hair cells (Corwin and Warchol 1991; Bairdet al. 2000). In contrast to marginal growth zones, hair cells within central regionsof the papillae have mature-looking hair bundles. Lewis and colleagues furtherdistinguished at least two categories of mature bundles: those in which thekinocilium extends just beyond the tips of the tallest stereovilli (class 1) and thosein which the kinocilium extends well beyond the tallest stereovilli (class 2). Class1 bundles can be further classified by the presence (1a) or absence (1b) of a con-spicuous enlargement or bulb at the tip of the kinocilium and by the bundle height(tall, type E or short, type D).
Hair bundle morphology varies along the transverse axis of the AP, but has notbeen observed to vary significantly along the (rostrocaudal) axis of tonotopy(Lewis 1976). However, the hair cell polarization (i.e., the orientation of thetallest stereovilli within the bundle) varies along the tonotopic axis, rather thanalong the transverse direction. Hair bundles rostral to the tectorial curtain (or APnerve branchlet) are oriented along the rostrocaudal axis, whereas hair bundlescaudal to the tectorial curtain are oriented along the transverse (mediolateral) axisof the caudal extension (Lewis and Li 1975; Lewis 1976). Because maximumhair cell response occurs when hair bundles are displaced along their axis of orientation (Flock 1965; Hudspeth and Corey 1977), the optimal stimulus for hair cells requires the tectorium to vibrate along the mediolateral axis in caudal regions and along the rostrocaudal axis in more rostral regions (Lewis and Lombard 1988; Smotherman and Narins 2000). These polarization patterns suggest that the acoustically induced motion of the AP tectorium iscomplex.
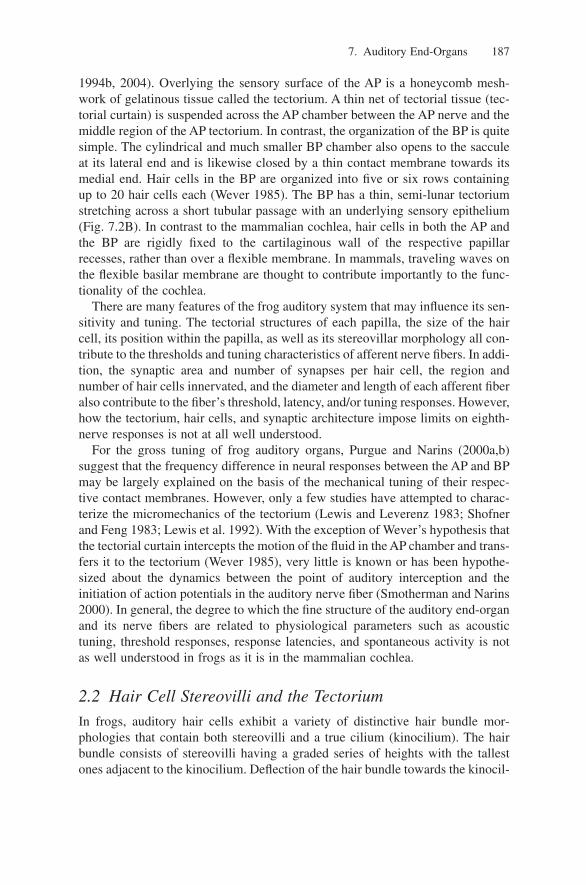
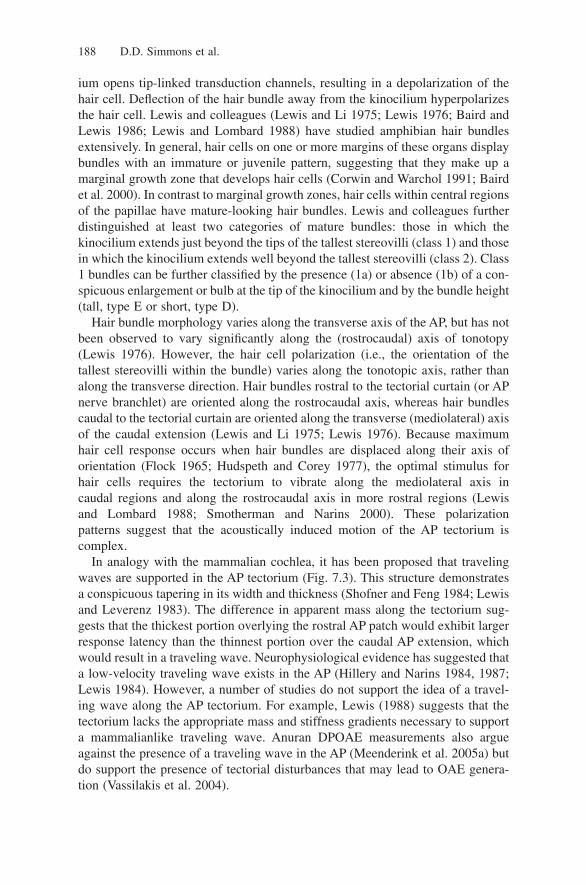
In analogy with the mammalian cochlea, it has been proposed that travelingwaves are supported in the AP tectorium (Fig. 7.3). This structure demonstratesa conspicuous tapering in its width and thickness (Shofner and Feng 1984; Lewisand Leverenz 1983). The difference in apparent mass along the tectorium sug-gests that the thickest portion overlying the rostral AP patch would exhibit largerresponse latency than the thinnest portion over the caudal AP extension, whichwould result in a traveling wave. Neurophysiological evidence has suggested thata low-velocity traveling wave exists in the AP (Hillery and Narins 1984, 1987;Lewis 1984). However, a number of studies do not support the idea of a travel-ing wave along the AP tectorium. For example, Lewis (1988) suggests that thetectorium lacks the appropriate mass and stiffness gradients necessary to supporta mammalianlike traveling wave. Anuran DPOAE measurements also argueagainst the presence of a traveling wave in the AP (Meenderink et al. 2005a) butdo support the presence of tectorial disturbances that may lead to OAE genera-tion (Vassilakis et al. 2004).
7. Auditory End-Organs 189
2.3 Hair Cell Morphometry
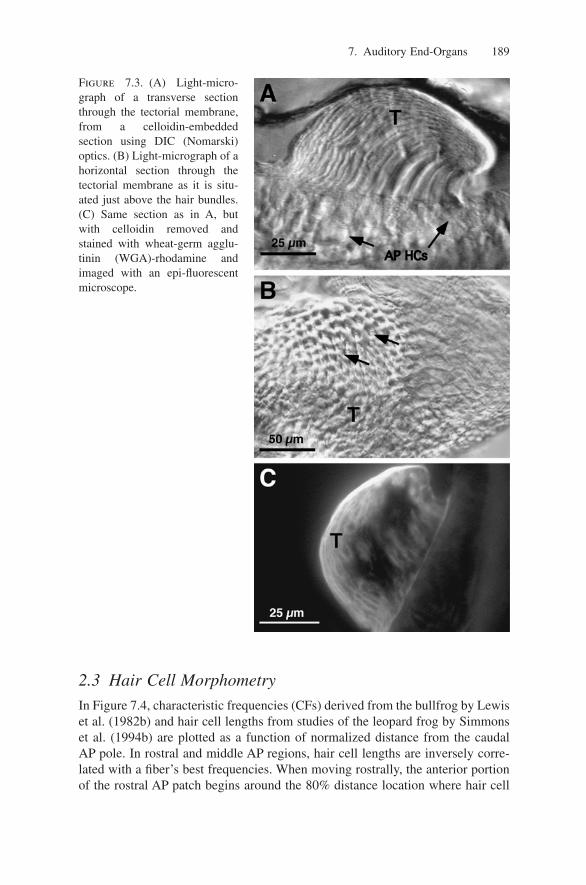
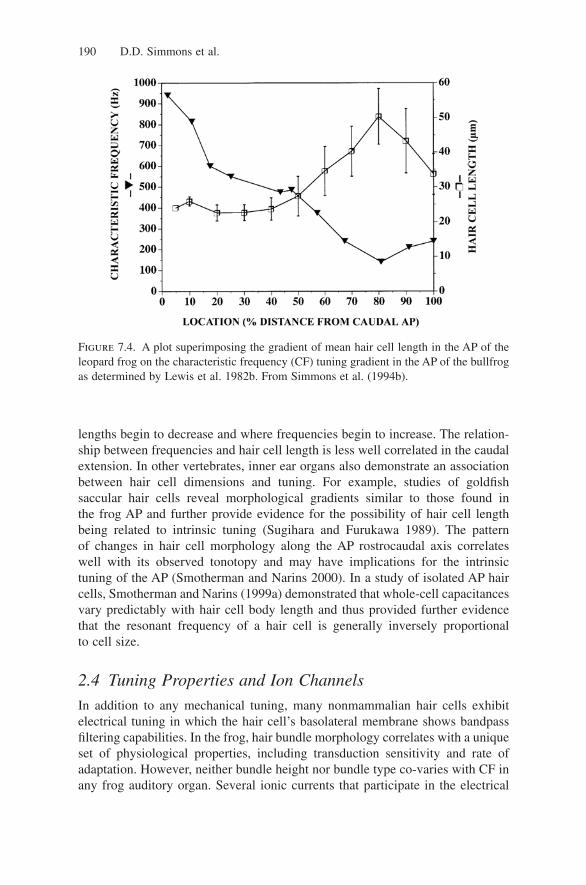
In Figure 7.4, characteristic frequencies (CFs) derived from the bullfrog by Lewiset al. (1982b) and hair cell lengths from studies of the leopard frog by Simmonset al. (1994b) are plotted as a function of normalized distance from the caudalAP pole. In rostral and middle AP regions, hair cell lengths are inversely corre-lated with a fiber’s best frequencies. When moving rostrally, the anterior portionof the rostral AP patch begins around the 80% distance location where hair cell
Figure 7.3. (A) Light-micro-graph of a transverse sectionthrough the tectorial membrane,from a celloidin-embeddedsection using DIC (Nomarski)optics. (B) Light-micrograph of ahorizontal section through thetectorial membrane as it is situ-ated just above the hair bundles.(C) Same section as in A, butwith celloidin removed andstained with wheat-germ agglu-tinin (WGA)-rhodamine andimaged with an epi-fluorescentmicroscope.
190 D.D. Simmons et al.
lengths begin to decrease and where frequencies begin to increase. The relation-ship between frequencies and hair cell length is less well correlated in the caudalextension. In other vertebrates, inner ear organs also demonstrate an associationbetween hair cell dimensions and tuning. For example, studies of goldfish saccular hair cells reveal morphological gradients similar to those found in the frog AP and further provide evidence for the possibility of hair cell lengthbeing related to intrinsic tuning (Sugihara and Furukawa 1989). The pattern of changes in hair cell morphology along the AP rostrocaudal axis correlates well with its observed tonotopy and may have implications for the intrinsic tuning of the AP (Smotherman and Narins 2000). In a study of isolated AP haircells, Smotherman and Narins (1999a) demonstrated that whole-cell capacitancesvary predictably with hair cell body length and thus provided further evidencethat the resonant frequency of a hair cell is generally inversely proportional to cell size.
2.4 Tuning Properties and Ion Channels
In addition to any mechanical tuning, many nonmammalian hair cells exhibitelectrical tuning in which the hair cell’s basolateral membrane shows bandpassfiltering capabilities. In the frog, hair bundle morphology correlates with a uniqueset of physiological properties, including transduction sensitivity and rate ofadaptation. However, neither bundle height nor bundle type co-varies with CF inany frog auditory organ. Several ionic currents that participate in the electrical
Figure 7.4. A plot superimposing the gradient of mean hair cell length in the AP of theleopard frog on the characteristic frequency (CF) tuning gradient in the AP of the bullfrogas determined by Lewis et al. 1982b. From Simmons et al. (1994b).
7. Auditory End-Organs 191
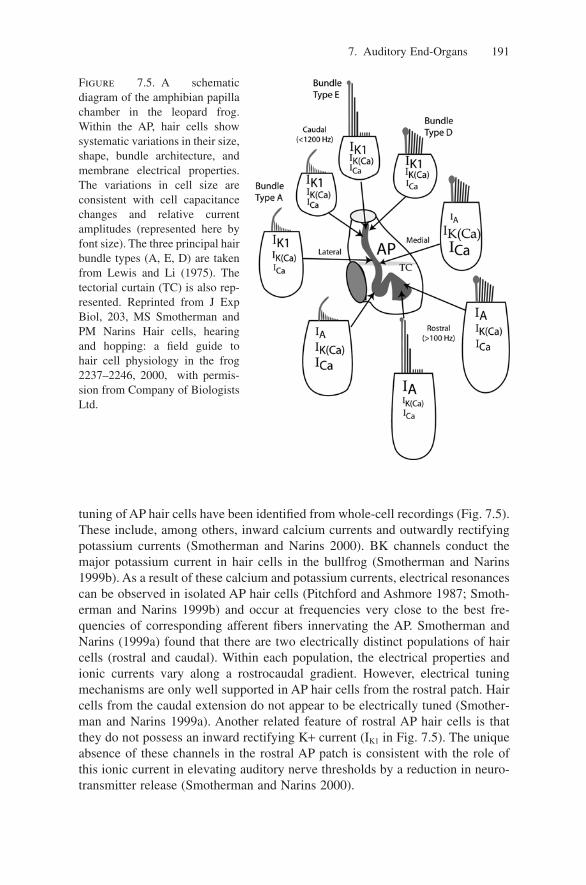
tuning of AP hair cells have been identified from whole-cell recordings (Fig. 7.5).These include, among others, inward calcium currents and outwardly rectifyingpotassium currents (Smotherman and Narins 2000). BK channels conduct themajor potassium current in hair cells in the bullfrog (Smotherman and Narins1999b). As a result of these calcium and potassium currents, electrical resonancescan be observed in isolated AP hair cells (Pitchford and Ashmore 1987; Smoth-erman and Narins 1999b) and occur at frequencies very close to the best fre-quencies of corresponding afferent fibers innervating the AP. Smotherman andNarins (1999a) found that there are two electrically distinct populations of haircells (rostral and caudal). Within each population, the electrical properties andionic currents vary along a rostrocaudal gradient. However, electrical tuningmechanisms are only well supported in AP hair cells from the rostral patch. Haircells from the caudal extension do not appear to be electrically tuned (Smother-man and Narins 1999a). Another related feature of rostral AP hair cells is thatthey do not possess an inward rectifying K+ current (IK1 in Fig. 7.5). The uniqueabsence of these channels in the rostral AP patch is consistent with the role ofthis ionic current in elevating auditory nerve thresholds by a reduction in neuro-transmitter release (Smotherman and Narins 2000).
Figure 7.5. A schematicdiagram of the amphibian papillachamber in the leopard frog.Within the AP, hair cells showsystematic variations in their size,shape, bundle architecture, andmembrane electrical properties.The variations in cell size areconsistent with cell capacitancechanges and relative currentamplitudes (represented here byfont size). The three principal hairbundle types (A, E, D) are takenfrom Lewis and Li (1975). Thetectorial curtain (TC) is also rep-resented. Reprinted from J ExpBiol, 203, MS Smotherman andPM Narins Hair cells, hearing and hopping: a field guide to hair cell physiology in the frog2237–2246, 2000, with permis-sion from Company of BiologistsLtd.
2.5 Synaptic Ultrastructure
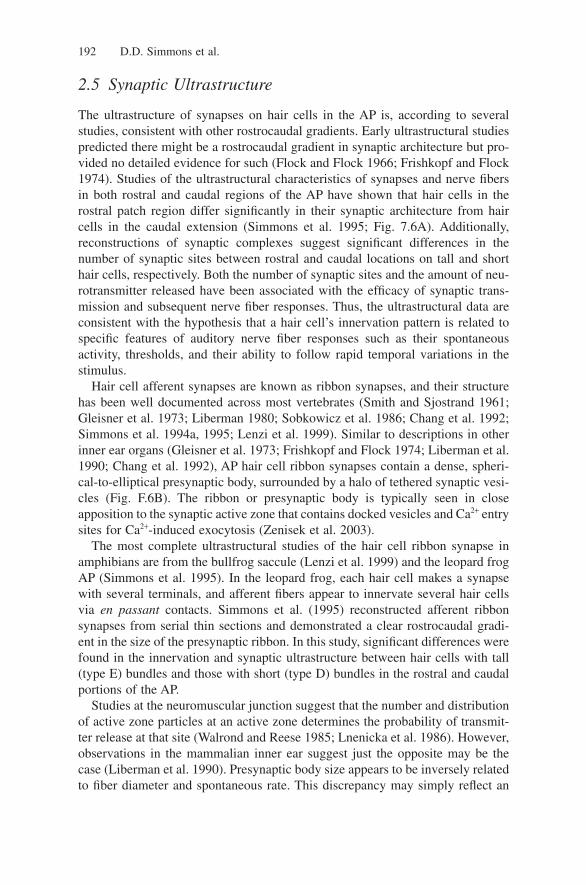
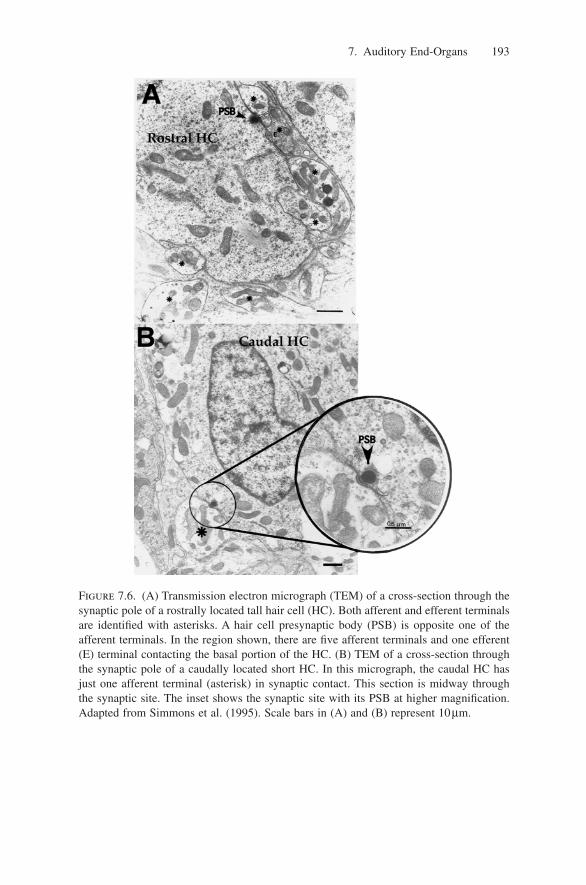
The ultrastructure of synapses on hair cells in the AP is, according to severalstudies, consistent with other rostrocaudal gradients. Early ultrastructural studiespredicted there might be a rostrocaudal gradient in synaptic architecture but pro-vided no detailed evidence for such (Flock and Flock 1966; Frishkopf and Flock1974). Studies of the ultrastructural characteristics of synapses and nerve fibersin both rostral and caudal regions of the AP have shown that hair cells in therostral patch region differ significantly in their synaptic architecture from haircells in the caudal extension (Simmons et al. 1995; Fig. 7.6A). Additionally,reconstructions of synaptic complexes suggest significant differences in thenumber of synaptic sites between rostral and caudal locations on tall and shorthair cells, respectively. Both the number of synaptic sites and the amount of neu-rotransmitter released have been associated with the efficacy of synaptic trans-mission and subsequent nerve fiber responses. Thus, the ultrastructural data areconsistent with the hypothesis that a hair cell’s innervation pattern is related tospecific features of auditory nerve fiber responses such as their spontaneous activity, thresholds, and their ability to follow rapid temporal variations in thestimulus.
Hair cell afferent synapses are known as ribbon synapses, and their structurehas been well documented across most vertebrates (Smith and Sjostrand 1961;Gleisner et al. 1973; Liberman 1980; Sobkowicz et al. 1986; Chang et al. 1992;Simmons et al. 1994a, 1995; Lenzi et al. 1999). Similar to descriptions in otherinner ear organs (Gleisner et al. 1973; Frishkopf and Flock 1974; Liberman et al.1990; Chang et al. 1992), AP hair cell ribbon synapses contain a dense, spheri-cal-to-elliptical presynaptic body, surrounded by a halo of tethered synaptic vesi-cles (Fig. F.6B). The ribbon or presynaptic body is typically seen in closeapposition to the synaptic active zone that contains docked vesicles and Ca2+ entrysites for Ca2+-induced exocytosis (Zenisek et al. 2003).
The most complete ultrastructural studies of the hair cell ribbon synapse inamphibians are from the bullfrog saccule (Lenzi et al. 1999) and the leopard frogAP (Simmons et al. 1995). In the leopard frog, each hair cell makes a synapsewith several terminals, and afferent fibers appear to innervate several hair cellsvia en passant contacts. Simmons et al. (1995) reconstructed afferent ribbonsynapses from serial thin sections and demonstrated a clear rostrocaudal gradi-ent in the size of the presynaptic ribbon. In this study, significant differences werefound in the innervation and synaptic ultrastructure between hair cells with tall(type E) bundles and those with short (type D) bundles in the rostral and caudalportions of the AP.
Studies at the neuromuscular junction suggest that the number and distributionof active zone particles at an active zone determines the probability of transmit-ter release at that site (Walrond and Reese 1985; Lnenicka et al. 1986). However,observations in the mammalian inner ear suggest just the opposite may be thecase (Liberman et al. 1990). Presynaptic body size appears to be inversely relatedto fiber diameter and spontaneous rate. This discrepancy may simply reflect an
192 D.D. Simmons et al.
7. Auditory End-Organs 193
Figure 7.6. (A) Transmission electron micrograph (TEM) of a cross-section through thesynaptic pole of a rostrally located tall hair cell (HC). Both afferent and efferent terminalsare identified with asterisks. A hair cell presynaptic body (PSB) is opposite one of theafferent terminals. In the region shown, there are five afferent terminals and one efferent(E) terminal contacting the basal portion of the HC. (B) TEM of a cross-section throughthe synaptic pole of a caudally located short HC. In this micrograph, the caudal HC hasjust one afferent terminal (asterisk) in synaptic contact. This section is midway throughthe synaptic site. The inset shows the synaptic site with its PSB at higher magnification.Adapted from Simmons et al. (1995). Scale bars in (A) and (B) represent 10µm.
inadequate understanding of the presynaptic body and its functional significance.Although the exact role of a morphological parameter such as synaptic ultra-structure in sculpting the physiological responses of the auditory nerve fibers isunknown, it is likely to correlate with the spatial and temporal analysis resolu-tion applied to the incoming stimulus.
Few hair cell organs lack efferent synapses, the basilar papilla of the frog beingone (Frishkopf and Flock 1974). Flock and Flock (1966) reported that efferent-type terminals were more abundant on rostral AP hair cells than on caudal APhair cells. In a more detailed study of hair cell synapses, Simmons et al. (1995)found densely packed, vesiculated efferent terminals mostly on the tall hair cellsin the rostral AP patch (Fig. 7.6A). Rostral hair cells are contacted by at least oneand as many as three efferent terminals. Efferent terminals have punctateswellings rather than being en passant fibers, characteristic of the majority of theafferent terminals. Although generally smaller, efferent terminals can be as largeas afferent terminals with diameters generally ranging from 0.2 to 2.0µm.
3. AP and BP Nerve Fibers
3.1 AP and BP Nerve Fiber Responses
By selectively lesioning the eighth-nerve branchlets innervating individualsensory maculae within the otic capsule of the bullfrog inner ear, it was demon-strated that fibers tuned to low- and mid-frequencies innervate the AP and fiberstuned to higher frequencies innervate the BP (Feng et al. 1975). Subsequentstudies assumed that similar organization held for other frog species (Capranicaand Moffat 1975, 1983; Capranica 1978; Zakon and Capranica 1981; Narins1983; Hödl et al. 2004). The only neurophysiologically derived tonotopic mapavailable for any amphibian is for the bullfrog, R. catesbeiana (Lewis et al.1982a,b). In the bullfrog AP, nerve fibers innervating the rostral AP patch exhibitCFs between 100 and 300Hz. Fibers that innervate the caudal extension exhibitCFs roughly between 400 and 1000Hz. Nerve fibers innervating the bullfrog BPhave CFs between 1000 and 3000Hz without any apparent tonotopy.
Typically, frog auditory nerve fibers are characterized in the frequency domainby frequency tuning curves (FTC), that is, a plot of their response threshold to asinusoidal input (typically in decibels SPL, or re 0.0002 dynes/cm2) as a functionof the input frequency. Each fiber has its lowest threshold to one (characteristic)frequency (CF) and behaves as a bandpass filter; that is, its threshold rises as thestimulus frequency deviates in either direction from CF. The tuning curves of frogauditory nerve fibers are V-shaped when plotted on a log–log scale. The FTCshape (i.e., the relative degree of sharpness) reflects the underlying tuning mech-anisms. In the frog, the sharpness of tuning as measured by the Q10dB decreaseswith CF (Ronken 1990, 1991; Stiebler and Narins 1990). In the AP, afferent fiberswith low CFs (rostral regions) have Q10dB values as high as 5. Afferent fibers withhigh CFs from either caudal AP regions or the BP are more broadly tuned and
194 D.D. Simmons et al.
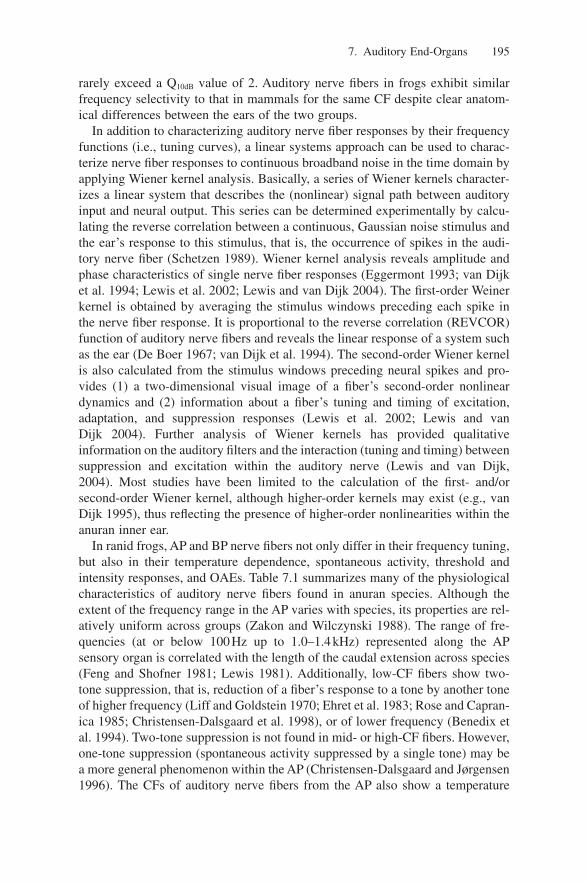
rarely exceed a Q10dB value of 2. Auditory nerve fibers in frogs exhibit similarfrequency selectivity to that in mammals for the same CF despite clear anatom-ical differences between the ears of the two groups.
In addition to characterizing auditory nerve fiber responses by their frequencyfunctions (i.e., tuning curves), a linear systems approach can be used to charac-terize nerve fiber responses to continuous broadband noise in the time domain byapplying Wiener kernel analysis. Basically, a series of Wiener kernels character-izes a linear system that describes the (nonlinear) signal path between auditoryinput and neural output. This series can be determined experimentally by calcu-lating the reverse correlation between a continuous, Gaussian noise stimulus andthe ear’s response to this stimulus, that is, the occurrence of spikes in the audi-tory nerve fiber (Schetzen 1989). Wiener kernel analysis reveals amplitude andphase characteristics of single nerve fiber responses (Eggermont 1993; van Dijket al. 1994; Lewis et al. 2002; Lewis and van Dijk 2004). The first-order Weinerkernel is obtained by averaging the stimulus windows preceding each spike inthe nerve fiber response. It is proportional to the reverse correlation (REVCOR)function of auditory nerve fibers and reveals the linear response of a system suchas the ear (De Boer 1967; van Dijk et al. 1994). The second-order Wiener kernelis also calculated from the stimulus windows preceding neural spikes and pro-vides (1) a two-dimensional visual image of a fiber’s second-order nonlineardynamics and (2) information about a fiber’s tuning and timing of excitation,adaptation, and suppression responses (Lewis et al. 2002; Lewis and van Dijk 2004). Further analysis of Wiener kernels has provided qualitative information on the auditory filters and the interaction (tuning and timing) betweensuppression and excitation within the auditory nerve (Lewis and van Dijk, 2004). Most studies have been limited to the calculation of the first- and/orsecond-order Wiener kernel, although higher-order kernels may exist (e.g., vanDijk 1995), thus reflecting the presence of higher-order nonlinearities within theanuran inner ear.
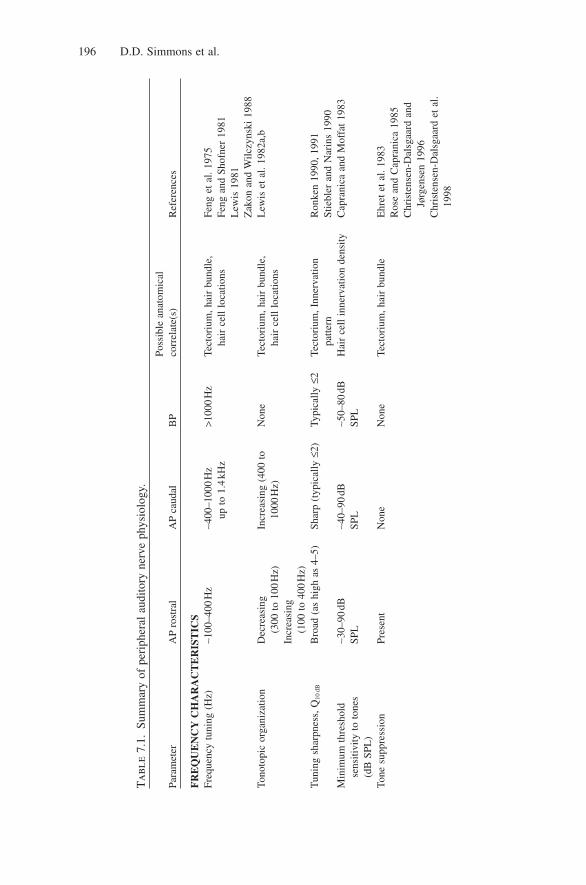
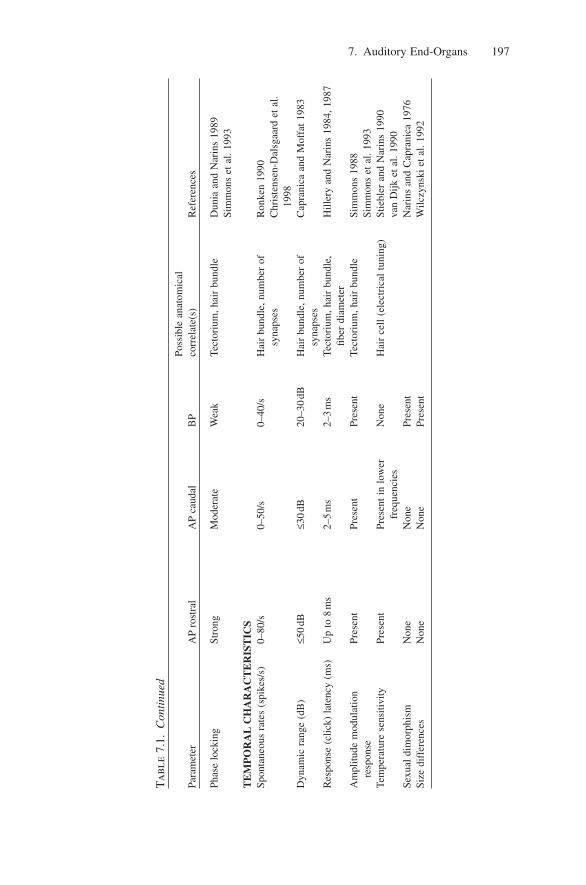
In ranid frogs, AP and BP nerve fibers not only differ in their frequency tuning,but also in their temperature dependence, spontaneous activity, threshold andintensity responses, and OAEs. Table 7.1 summarizes many of the physiologicalcharacteristics of auditory nerve fibers found in anuran species. Although theextent of the frequency range in the AP varies with species, its properties are rel-atively uniform across groups (Zakon and Wilczynski 1988). The range of fre-quencies (at or below 100Hz up to 1.0–1.4kHz) represented along the APsensory organ is correlated with the length of the caudal extension across species(Feng and Shofner 1981; Lewis 1981). Additionally, low-CF fibers show two-tone suppression, that is, reduction of a fiber’s response to a tone by another toneof higher frequency (Liff and Goldstein 1970; Ehret et al. 1983; Rose and Capran-ica 1985; Christensen-Dalsgaard et al. 1998), or of lower frequency (Benedix etal. 1994). Two-tone suppression is not found in mid- or high-CF fibers. However,one-tone suppression (spontaneous activity suppressed by a single tone) may bea more general phenomenon within the AP (Christensen-Dalsgaard and Jørgensen1996). The CFs of auditory nerve fibers from the AP also show a temperature
7. Auditory End-Organs 195
196 D.D. Simmons et al.
Tab
le7.
1.Su
mm
ary
of p
erip
hera
l au
dito
ry n
erve
phy
siol
ogy.
Poss
ible
ana
tom
ical
Para
met
erA
Pro
stra
lA
Pca
udal
BP
corr
elat
e(s)
Ref
eren
ces
FR
EQ
UE
NC
YC
HA
RA
CT
ER
IST
ICS
Freq
uenc
y tu
ning
(H
z)∼1
00–4
00H
z∼4
00–1
000
Hz
>100
0H
zTe
ctor
ium
, hai
r bu
ndle
, Fe
ng e
t al
. 197
5up
to
1.4
kHz
hair
cel
l lo
catio
nsFe
ng a
nd S
hofn
er 1
981
Lew
is 1
981
Zak
on a
nd W
ilczy
nski
198
8To
noto
pic
orga
niza
tion
Dec
reas
ing
Incr
easi
ng (
400
toN
one
Tect
oriu
m, h
air
bund
le,
Lew
is e
t al
. 198
2a,b
(300
to
100
Hz)
1000
Hz)
hair
cel
l lo
catio
nsIn
crea
sing
(100
to
400
Hz)
Tun
ing
shar
pnes
s, Q
10dB
Bro
ad (
as h
igh
as 4
–5)
Shar
p (t
ypic
ally
≤2)
Typi
cally
≤2
Tect
oriu
m, I
nner
vatio
nR
onke
n 19
90, 1
991
patte
rnSt
iebl
er a
nd N
arin
s 19
90M
inim
um t
hres
hold
∼3
0–90
dB∼4
0–90
dB∼5
0–80
dBH
air
cell
inne
rvat
ion
dens
ityC
apra
nica
and
Mof
fat
1983
sens
itivi
ty t
o to
nes
SPL
SPL
SPL
(dB
SPL
)To
ne s
uppr
essi
onPr
esen
tN
one
Non
eTe
ctor
ium
, hai
r bu
ndle
Ehr
et e
t al
. 198
3R
ose
and
Cap
rani
ca 1
985
Chr
iste
nsen
-Dal
sgaa
rd a
nd
Jørg
ense
n 19
96C
hris
tens
en-D
alsg
aard
et
al.
1998
7. Auditory End-Organs 197
Tab
le7.
1.C
onti
nued
Poss
ible
ana
tom
ical
Para
met
erA
Pro
stra
lA
Pca
udal
BP
corr
elat
e(s)
Ref
eren
ces
Phas
e lo
ckin
gSt
rong
Mod
erat
eW
eak
Tect
oriu
m, h
air
bund
leD
unia
and
Nar
ins
1989
Sim
mon
s et
al.
1993
TE
MP
OR
AL
CH
AR
AC
TE
RIS
TIC
SSp
onta
neou
s ra
tes
(spi
kes/
s)0–
80/s
0–50
/s0–
40/s
Hai
r bu
ndle
, num
ber
ofR
onke
n 19
90sy
naps
esC
hris
tens
en-D
alsg
aard
et
al.
1998
Dyn
amic
ran
ge (
dB)
≤50
dB≤3
0dB
20–3
0dB
Hai
r bu
ndle
, num
ber
ofC
apra
nica
and
Mof
fat
1983
syna
pses
Res
pons
e (c
lick)
lat
ency
(m
s)U
p to
8m
s2–
5m
s2–
3m
sTe
ctor
ium
, hai
r bu
ndle
, H
iller
y an
d N
arin
s 19
84, 1
987
fiber
dia
met
erA
mpl
itude
mod
ulat
ion
Pres
ent
Pres
ent
Pres
ent
Tect
oriu
m, h
air
bund
leSi
mm
ons
1988
resp
onse
Sim
mon
s et
al.
1993
Tem
pera
ture
sen
sitiv
ityPr
esen
tPr
esen
t in
low
erN
one
Hai
r ce
ll (e
lect
rica
l tu
ning
)St
iebl
er a
nd N
arin
s 19
90fr
eque
ncie
sva
n D
ijk e
t al
. 199
0Se
xual
dim
orph
ism
Non
eN
one
Pres
ent
Nar
ins
and
Cap
rani
ca 1
976
Size
dif
fere
nces
Non
eN
one
Pres
ent
Wilc
zyns
ki e
t al
. 199
2
dependence: lowering the animal’s core temperature decreases a fiber’s CF(Stiebler and Narins 1990; van Dijk et al. 1990). Although BP nerve fibers aretypically tuned to frequencies >1.0kHz and to a narrow range of CFs, tuning char-acteristics of nerve fibers are species-specific and, within a species, can vary withsize, sex, or geographical location (Narins and Capranica 1976; Capranica 1978;Capranica and Moffat 1983). As a rule, the BP of large-sized species is tuned tolower frequencies than that of smaller-sized species and males have BPs tunedto generally higher frequencies than females (Narins and Capranica 1976;Wilczynski et al. 1992, 1993). Auditory nerve fibers of the BP show little or nochange in their physiological properties when the animal’s temperature is exper-imentally varied (Stiebler and Narins 1990; van Dijk et al. 1990, 1997; Carey andZelick 1993; Benedix et al. 1994).
Auditory nerve fibers in the frog exhibit spontaneous activity, although reportsas to the exact level vary widely based on the methods and species used. Earlierreports of spontaneous activity suggested that low-CF fibers generally have thelowest spontaneous rates, typically less than five spikes per second, whereashigher-CF fibers generally have higher spontaneous rates (Feng et al. 1975;Capranica 1978; Capranica and Moffat 1980, 1983; Zelick and Narins 1985;Ronken 1990; Ronken et al. 1993). However, more recent reports (Christensen-Dalsgaard et al. 1998) find no correlation between spontaneous activity and CF,but between spontaneous activity and threshold (fibers with low thresholdresponses to sounds tend to have higher spontaneous rates). Interestingly, lowauditory thresholds in the frog have also been correlated with high DPOAE amplitudes (van Dijk et al. 2002; Vassilakis et al. 2004; and see Section 4.3.).
3.2 Fiber Morphometry, Conduction Velocity, and Response Latency
The physiological parameters of amphibian auditory nerve fibers can be definedby a structural unit that includes the tectorial membrane, the hair cells innervatedby a single neuron, and the synaptic architecture and pattern of afferent innerva-tion. However, how the anatomical patterns of hair cells and synaptic arrange-ments affect physiological responses is poorly understood. It has been temptingto associate such patterns with the observed physiological distribution of primaryaxons: low frequency, suppressible units, and mid-frequency, nonsuppressibleunits (Feng et al. 1975; Lewis 1976; Smotherman and Narins 2000).
In auditory organs, one of the best-characterized examples of structure–function relationships has been in the mammalian cochlea, where different spon-taneous rate categories of auditory afferent fibers have been correlated with thesize, location on the hair cell, synaptic arrangement, and mitochondrial contentof nerve fiber terminals (Liberman 1980; Liberman and Simmons 1985; Gleichand Wilson 1993). To date, structure–function relationships have not been inves-tigated at the same level of detail in the frog.
The innervation patterns of individual auditory neurons within AP and BPorgans have been reconstructed in both leopard frogs and bullfrogs (Lewis et al.
198 D.D. Simmons et al.
1982b; Simmons et al. 1992). Most notably, the innervation of both AP and BPorgans is highly convergent; that is, individual neurons make synaptic contactwith multiple hair cells. Nerve fibers in the AP terminate on varying numbers ofreceptor hair cells (Simmons et al. 1992), with the physiological gradients fol-lowing roughly the rostrocaudal gradient of hair cell innervation (Lewis et al.1982b; Simmons et al. 1994b, 1995). Nerve fibers that respond best to lower frequencies contact more hair cells than fibers that respond best to higher fre-quencies. Retrograde-labeling studies suggest that (1) response latencies and conduction velocities may be correlated with the papillar location as well as the number of hair cells innervated and afferent fiber size (Lewis et al. 1982b;Simmons et al. 1992) and (2) the pattern of hair cell innervation may in part deter-mine physiological parameters of auditory nerve fiber responses such as tuningsharpness and sensitivity. For example, large innervation areas (i.e., dendriticfields) might be correlated with broad tuning observed in a given auditory nervefiber and quite possibly with poor frequency resolution.
3.3 AP Nerve Structural Correlates
Nerve fibers terminating in the caudal (high-frequency) end of the AP havesmaller diameters than fibers terminating in the rostral (low frequency) end ofthe AP (Simmons et al. 1992; Simmons and Narins 1995). Both caudal and rostralAP fibers have nearly equal lengths from the ganglion to their terminations andvirtually all of the fibers are myelinated (average ± s.d. myelin thickness of 0.13± 0.05µm; Simmons and Narins 1995). Larger diameter fibers appear moreheavily myelinated and are situated within the center of the nerve bundle. Thesedata suggest that fiber size is directly correlated with the area of innervation. Incombination with previous neurophysiological results (Hillery and Narins 1984,1987), such differences in fiber size may also relate to the differences found inresponse latencies to click stimuli (Hau et al. 2004).
The relationship between fiber morphometry and conduction velocity may play a significant role in understanding response latencies. Auditory nerve latencyis an important feature of the acoustic transformation process and may encodeadditional information about the acoustic stimuli, including the directionality and periodicity of the source of sound (Bleeck and Langner 2001). In the frogAP as well as the mammalian cochlea, auditory nerve fibers that respond best to high-frequency stimuli have short response latencies and nerve fibers thatrespond best to low-frequency stimuli have longer response latencies (Kiang et al. 1965; Hillery and Narins 1987; Fitzgerald et al. 2001; Hau et al. 2004). In mammals, this observation has been linked to the traveling wave transit time along the basilar membrane in addition to the differences in path lengthbetween high-frequency (with short distances to the brain) and low-frequency(with longer distances to the brain) fibers. Although a similar latency–frequencyrelationship exists in the frog AP, this organ neither has a basilar membrane norexhibits a significant difference in path length between high- and low-frequencyfibers. However, an observation not suspected to play a significant role in
7. Auditory End-Organs 199
mammalian response latencies is that frog auditory nerve fibers responding tohigh frequencies are typically thin and fibers responding to lower frequencies arethicker.
Previous theoretical studies of conduction velocities in nerve fibers (Rushton1951; Deutsch 1969; Smith and Koles 1970) indicate that myelin thickness innerve fibers is such that, for a fiber of given external diameter, conduction veloc-ity is maximized. For fibers with the same myelin thickness, fibers with largediameters conduct impulses faster. Based on preliminary estimates of theoreticalconduction velocities [velocity = k (diameter)], rostral AP fibers should have thehighest conduction velocity, caudal AP fibers should have low conduction veloc-ities, and BP fibers should have a range of conduction velocities. The differencebetween theoretical estimates and measured latencies suggests that other vari-ables may be involved in determining response latencies. Two such variables arethe time it takes an acoustic signal to stimulate hair cell stereovilli and the timeit takes hair cells, once stimulated, to give rise to action potentials in auditorynerve fibers (Hau, Simmons, and Narins 2005, unpublished data).
The tectorium may also contribute to the response latencies observed in APnerve fibers, as it is a complex gelatinous structure with its most massive segmentoverlying the rostral AP patch (Shofner and Feng 1983; Hau et al. 2004). Atraveling wave across the tectorium would be expected to stimulate higher-frequency regions before lower-frequency regions by as much as a factor of 10and would be consistent with the observed longer latencies of rostrally innervat-ing fibers.
4. Otoacoustic Emissions
4.1 Introduction
One of the remarkable properties of the vertebrate inner ear is its great sensitiv-ity. From early on it was recognized that such sensitivity could not arise solelyfrom passive responses to sound. Rather, some active amplification mechanismwould be required to enhance the vibration of inner ear structures in response tolow-level acoustic stimuli (Gold 1948). In mammals, this mechanism has beenlinked to outer hair cell (OHC) motility and receptor potential (see reviews byProbst et al. 1991 and Robles and Ruggero 2001) and is termed the “cochlearamplifier” (Davis 1983). It utilizes bioelectrochemical energy (Zheng et al. 2000;Liberman et al. 2002), which may propagate through the middle ear to the outsidein the form of vibrations in the hearing frequency range. The discovery of low-level sounds corresponding to such vibrations (Kemp 1978) provided the first evi-dence for the presence of an active amplification mechanism within the inner ear.These sounds are now known as OAEs and can be measured by placing a sensi-tive microphone in the ear canal.
Since their discovery in mammals, OAEs have been reported to be present inall classes of terrestrial vertebrates (Köppl 1995; Köppl and Authier 1995), sug-
200 D.D. Simmons et al.
gesting that they reflect a fundamental property of normal hearing. Because OAEscan be recorded noninvasively, they provide an important tool to hearingresearchers. OAEs are often used for diagnostic screening of frequency-depen-dent cochlear function (Lonsbury-Martin et al. 1993; Stover et al. 1996; Wagnerand Plinkert 1999; Abdala 2000; Emmerich et al. 2000) or middle ear damage(Owens et al. 1992, 1993; Zhang and Abbas 1997). In addition, OAEs provide anoninvasive means of examining inner ear mechanisms in mammals (Kössl andVater 1996; Maison et al. 1997; Shera and Guinan 1999) and other vertebrates(Rosowski et al. 1984; Vassilakis et al. 2004), as well as in insects (Kössl andBoyan 1998).
Traditionally, OAEs have been classified into spontaneous OAEs (SOAEs) andevoked OAEs (EOAEs), based on whether an external stimulus is required fortheir generation. Furthermore, based on the type of stimulus required for theirgeneration, EOAEs are classified into (1) stimulus-frequency OAEs or SFOAEs(evoked by single sinusoidal stimuli), (2) transient-evoked OAEs or TEOAEs(evoked by short-duration, low-level signals of various spectra), and (3) distor-tion-product OAEs or DPOAEs (evoked by two continuous sinusoidal stimuli)(Probst et al. 1991). It has been argued that the above classifications do not dojustice to the mechanisms underlying OAE generation (Shera and Guinan 1999;Kalluri and Shera 2001). However for the sake of consistency, the traditional clas-sification scheme is presented. Both the AP and BP exhibit OAEs but their prop-erties differ considerably.
4.2 Stimulus-Frequency and Transient-Evoked Otoacoustic Emissions
Upon stimulation with single continuous sinusoids or short signals of variousspectral distributions (e.g., clicks), the inner ear generates SFOAEs or TEOAEs,respectively, which coincide in frequency with the component(s) of the externalstimulus. It is currently believed that both SFOAEs and TEOAEs arise from thesame inner ear mechanism. Unfortunately, the number of studies exploring thesetypes of OAEs in frogs is limited.
Whitehead et al. (1986) examined SFOAEs and their relationship to body tem-perature in Rana temporaria. The authors were able to evoke SFOAEs only forfrequencies below 1kHz, suggesting that in this species, SFOAEs may arise onlyfrom the AP. Palmer and Wilson (1982) were able to evoke measurable SFOAEsin Rana esculenta for frequencies up to 2kHz, implying that in this species, bothpapillae generate SFOAEs. The effect of body temperature on SFOAE frequen-cies is very pronounced, suggesting that SFOAE generation may involve an elec-trochemical tuning mechanism along, possibly, with some form of mechanicaltuning. In addition, SFOAE levels increase just before the start of the frog breed-ing season (Whitehead et al. 1986), suggesting that OAE generation in frogs maybe seasonal and under hormonal control.
TEOAEs were reported by Palmer and Wilson (1982) but not in enough detailto support an account of TEOAE-properties.
7. Auditory End-Organs 201
4.3 Distortion-Product Otoacoustic Emissions (DPOAEs)
Upon stimulation with two continuous sinusoids (often termed primaries) ofappropriately chosen frequencies ( f1, f2, where f2 > f1) and intensities (L1, L2), theinner ear generates DPOAEs. DPOAE frequencies coincide with the inter-modulation distortion frequencies of the two primaries, whereas the most-studiedDPOAEs coincide in frequency with the third-order intermodulation distortionfrequencies (2f1–f2 and 2f2–f1). As such, DPOAEs are the only type of EOAEsthat do not match in frequency any of the frequencies present in the external stim-ulus, a fortunate property that simplifies their study.
With the exception of early reports (Baker et al. 1989), DPOAEs have beenrecorded in frog species from the families Ranidae, Hylidae, and Pipidae (vanDijk and Manley 2001; van Dijk et al. 2002, 2003; Meenderink and van Dijk2004, 2005a; Vassilakis et al. 2004; Meenderink et al. 2005a,b). No DPOAEswere found in species from the families Bombinatoridae and Pelobatidae (vanDijk et al. 2002). It is thought this apparent difference between frogs from dif-ferent families is related to the overall sensitivity of the hearing apparatus (vanDijk et al. 2002).
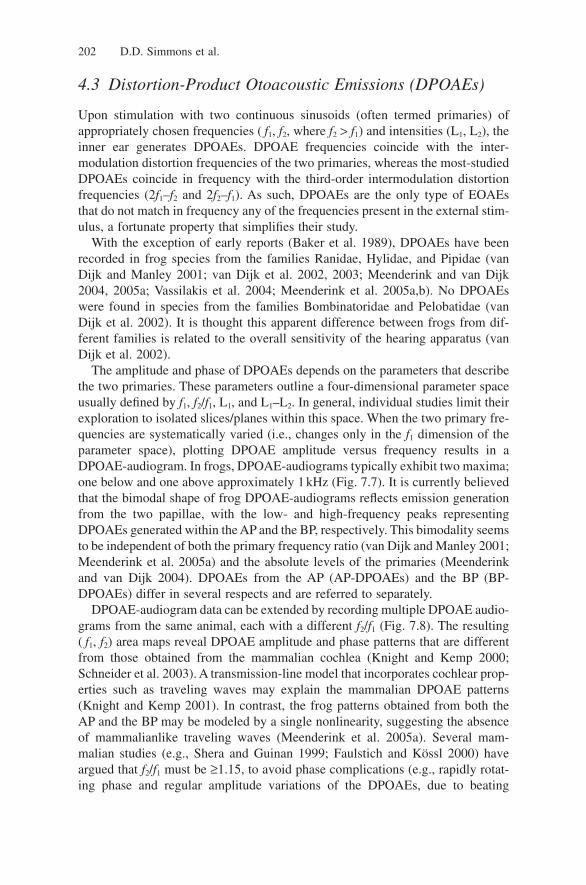
The amplitude and phase of DPOAEs depends on the parameters that describethe two primaries. These parameters outline a four-dimensional parameter spaceusually defined by f1, f2/f1, L1, and L1–L2. In general, individual studies limit theirexploration to isolated slices/planes within this space. When the two primary fre-quencies are systematically varied (i.e., changes only in the f1 dimension of theparameter space), plotting DPOAE amplitude versus frequency results in aDPOAE-audiogram. In frogs, DPOAE-audiograms typically exhibit two maxima;one below and one above approximately 1kHz (Fig. 7.7). It is currently believedthat the bimodal shape of frog DPOAE-audiograms reflects emission generationfrom the two papillae, with the low- and high-frequency peaks representingDPOAEs generated within the AP and the BP, respectively. This bimodality seemsto be independent of both the primary frequency ratio (van Dijk and Manley 2001;Meenderink et al. 2005a) and the absolute levels of the primaries (Meenderinkand van Dijk 2004). DPOAEs from the AP (AP-DPOAEs) and the BP (BP-DPOAEs) differ in several respects and are referred to separately.
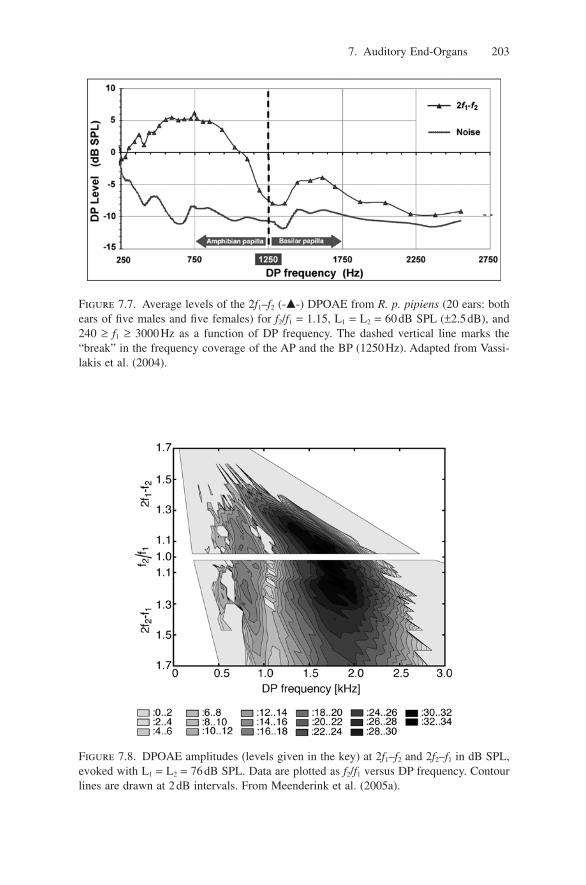
DPOAE-audiogram data can be extended by recording multiple DPOAE audio-grams from the same animal, each with a different f2/f1 (Fig. 7.8). The resulting( f1, f2) area maps reveal DPOAE amplitude and phase patterns that are differentfrom those obtained from the mammalian cochlea (Knight and Kemp 2000;Schneider et al. 2003). A transmission-line model that incorporates cochlear prop-erties such as traveling waves may explain the mammalian DPOAE patterns(Knight and Kemp 2001). In contrast, the frog patterns obtained from both theAP and the BP may be modeled by a single nonlinearity, suggesting the absenceof mammalianlike traveling waves (Meenderink et al. 2005a). Several mam-malian studies (e.g., Shera and Guinan 1999; Faulstich and Kössl 2000) haveargued that f2/f1 must be ≥1.15, to avoid phase complications (e.g., rapidly rotat-ing phase and regular amplitude variations of the DPOAEs, due to beating
202 D.D. Simmons et al.
7. Auditory End-Organs 203
Figure 7.7. Average levels of the 2f1–f2 (-�-) DPOAE from R. p. pipiens (20 ears: bothears of five males and five females) for f2/f1 = 1.15, L1 = L2 = 60dB SPL (±2.5dB), and240 ≥ f1 ≥ 3000Hz as a function of DP frequency. The dashed vertical line marks the“break” in the frequency coverage of the AP and the BP (1250Hz). Adapted from Vassi-lakis et al. (2004).
Figure 7.8. DPOAE amplitudes (levels given in the key) at 2f1–f2 and 2f2–f1 in dB SPL,evoked with L1 = L2 = 76dB SPL. Data are plotted as f2/f1 versus DP frequency. Contourlines are drawn at 2dB intervals. From Meenderink et al. (2005a).
204 D.D. Simmons et al.
between the primaries) that arise as f2/f1 drops below 1.1. Consistent with filter-ing mechanism and two-tone suppression differences between the mammalianand the frog inner ears, no such complications arise for low f2/f1 values in the frog(van Dijk and Manley 2001; Meenderink et al. 2005a).
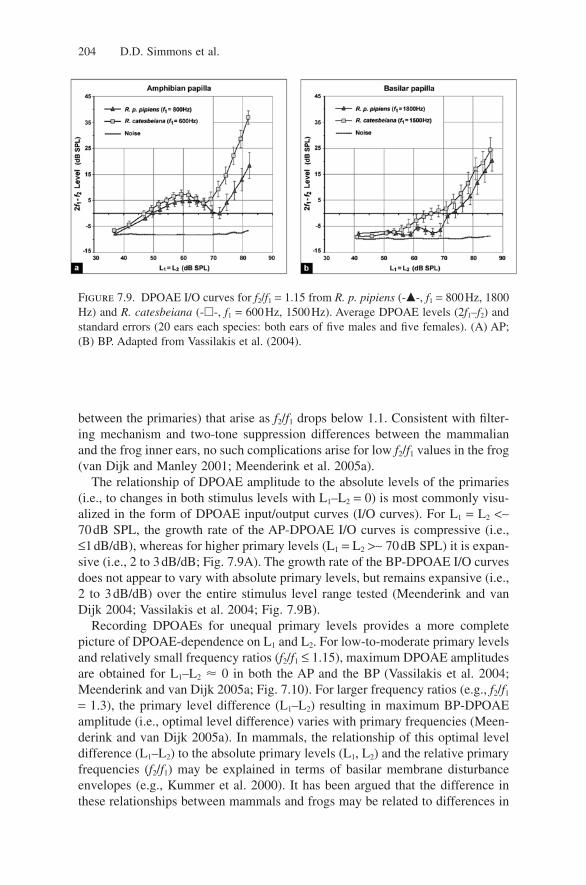
The relationship of DPOAE amplitude to the absolute levels of the primaries(i.e., to changes in both stimulus levels with L1–L2 = 0) is most commonly visu-alized in the form of DPOAE input/output curves (I/O curves). For L1 = L2 <∼70dB SPL, the growth rate of the AP-DPOAE I/O curves is compressive (i.e.,≤1dB/dB), whereas for higher primary levels (L1 = L2 >∼ 70dB SPL) it is expan-sive (i.e., 2 to 3dB/dB; Fig. 7.9A). The growth rate of the BP-DPOAE I/O curvesdoes not appear to vary with absolute primary levels, but remains expansive (i.e.,2 to 3dB/dB) over the entire stimulus level range tested (Meenderink and vanDijk 2004; Vassilakis et al. 2004; Fig. 7.9B).
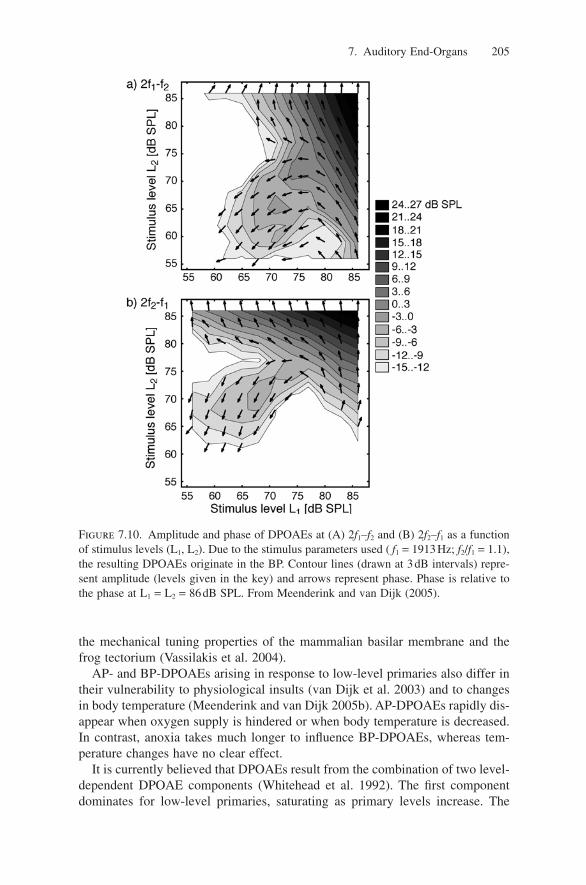
Recording DPOAEs for unequal primary levels provides a more completepicture of DPOAE-dependence on L1 and L2. For low-to-moderate primary levelsand relatively small frequency ratios (f2/f1 ≤ 1.15), maximum DPOAE amplitudesare obtained for L1–L2 � 0 in both the AP and the BP (Vassilakis et al. 2004;Meenderink and van Dijk 2005a; Fig. 7.10). For larger frequency ratios (e.g., f2/f1
= 1.3), the primary level difference (L1–L2) resulting in maximum BP-DPOAEamplitude (i.e., optimal level difference) varies with primary frequencies (Meen-derink and van Dijk 2005a). In mammals, the relationship of this optimal leveldifference (L1–L2) to the absolute primary levels (L1, L2) and the relative primaryfrequencies (f2/f1) may be explained in terms of basilar membrane disturbanceenvelopes (e.g., Kummer et al. 2000). It has been argued that the difference inthese relationships between mammals and frogs may be related to differences in
Figure 7.9. DPOAE I/O curves for f2/f1 = 1.15 from R. p. pipiens (-�-, f1 = 800Hz, 1800Hz) and R. catesbeiana (-�-, f1 = 600Hz, 1500Hz). Average DPOAE levels (2f1–f2) andstandard errors (20 ears each species: both ears of five males and five females). (A) AP;(B) BP. Adapted from Vassilakis et al. (2004).
7. Auditory End-Organs 205
the mechanical tuning properties of the mammalian basilar membrane and thefrog tectorium (Vassilakis et al. 2004).
AP- and BP-DPOAEs arising in response to low-level primaries also differ intheir vulnerability to physiological insults (van Dijk et al. 2003) and to changesin body temperature (Meenderink and van Dijk 2005b). AP-DPOAEs rapidly dis-appear when oxygen supply is hindered or when body temperature is decreased.In contrast, anoxia takes much longer to influence BP-DPOAEs, whereas tem-perature changes have no clear effect.
It is currently believed that DPOAEs result from the combination of two level-dependent DPOAE components (Whitehead et al. 1992). The first componentdominates for low-level primaries, saturating as primary levels increase. The
Figure 7.10. Amplitude and phase of DPOAEs at (A) 2f1–f2 and (B) 2f2–f1 as a functionof stimulus levels (L1, L2). Due to the stimulus parameters used ( f1 = 1913Hz; f2/f1 = 1.1),the resulting DPOAEs originate in the BP. Contour lines (drawn at 3dB intervals) repre-sent amplitude (levels given in the key) and arrows represent phase. Phase is relative tothe phase at L1 = L2 = 86dB SPL. From Meenderink and van Dijk (2005).
206 D.D. Simmons et al.
second component dominates for high-level primaries, with its amplitude drop-ping below that of the low-level component as primary levels decrease. A phasedifference of ∼π rad between these two components is believed to be responsi-ble for the DPOAE I/O-curve notches observed for intermediate primary levels(Mills and Rubel 1994). In contrast to mammalian data, this phase differenceincreases systematically from 0 to π rad with increasing primary frequencies inboth frog papillae (Meenderink and van Dijk 2004).
Vassilakis et al. (2004) compared the frequency ranges of the AP and BPresponse with DPOAE-audiograms plotted as functions of f1, f2, and DP fre-quency, and interpreted their degree of correlation as providing evidence for thesite of DPOAE-generation. Opposite to mammals, they found that the generationof the 2f1–f2 DPOAE in the frog may primarily occur at or near the DPOAE frequency place, whereas the generation of the 2f2–f1 DPOAE may primarilyoccur at a frequency place between the two primaries. This opposite behaviormay be related to various anatomical differences between the mammalian andfrog ears, including the absence, in the frog ear, of a basilar membrane, and maybe a manifestation of differences regarding the possibility of traveling wavedevelopment.
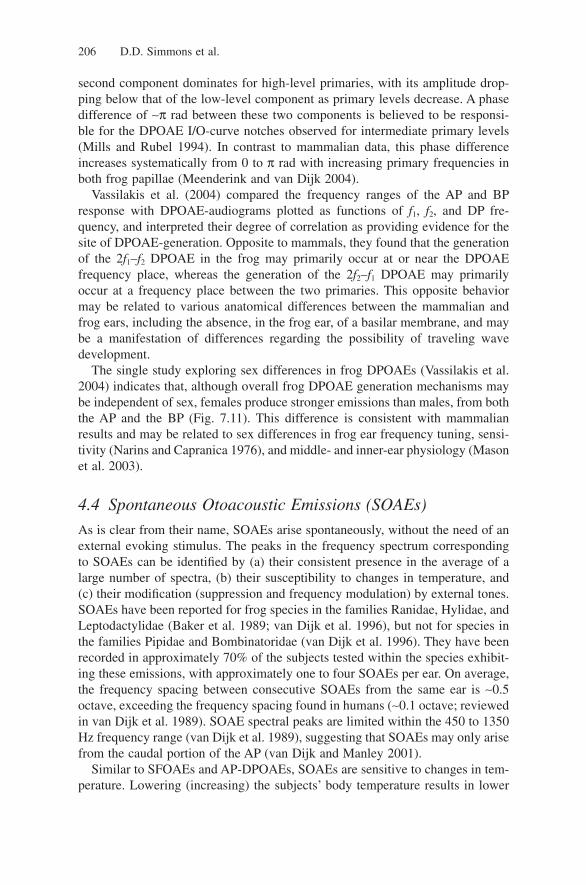
The single study exploring sex differences in frog DPOAEs (Vassilakis et al.2004) indicates that, although overall frog DPOAE generation mechanisms maybe independent of sex, females produce stronger emissions than males, from boththe AP and the BP (Fig. 7.11). This difference is consistent with mammalianresults and may be related to sex differences in frog ear frequency tuning, sensi-tivity (Narins and Capranica 1976), and middle- and inner-ear physiology (Masonet al. 2003).
4.4 Spontaneous Otoacoustic Emissions (SOAEs)
As is clear from their name, SOAEs arise spontaneously, without the need of anexternal evoking stimulus. The peaks in the frequency spectrum correspondingto SOAEs can be identified by (a) their consistent presence in the average of alarge number of spectra, (b) their susceptibility to changes in temperature, and(c) their modification (suppression and frequency modulation) by external tones.SOAEs have been reported for frog species in the families Ranidae, Hylidae, andLeptodactylidae (Baker et al. 1989; van Dijk et al. 1996), but not for species inthe families Pipidae and Bombinatoridae (van Dijk et al. 1996). They have beenrecorded in approximately 70% of the subjects tested within the species exhibit-ing these emissions, with approximately one to four SOAEs per ear. On average,the frequency spacing between consecutive SOAEs from the same ear is ∼0.5octave, exceeding the frequency spacing found in humans (∼0.1 octave; reviewedin van Dijk et al. 1989). SOAE spectral peaks are limited within the 450 to 1350Hz frequency range (van Dijk et al. 1989), suggesting that SOAEs may only arisefrom the caudal portion of the AP (van Dijk and Manley 2001).
Similar to SFOAEs and AP-DPOAEs, SOAEs are sensitive to changes in tem-perature. Lowering (increasing) the subjects’ body temperature results in lower
7. Auditory End-Organs 207
Figure 7.11. Comparison between DPOAE (2f1–f2) audiograms from both ears of fivemale and five female R. p. pipiens (A) and R. catesbeiana (B). DPOAE levels are plottedas a function of DP frequency. Female subjects exhibit stronger emissions than males,especially from the BP (from Vassilakis et al. 2004).
208 D.D. Simmons et al.
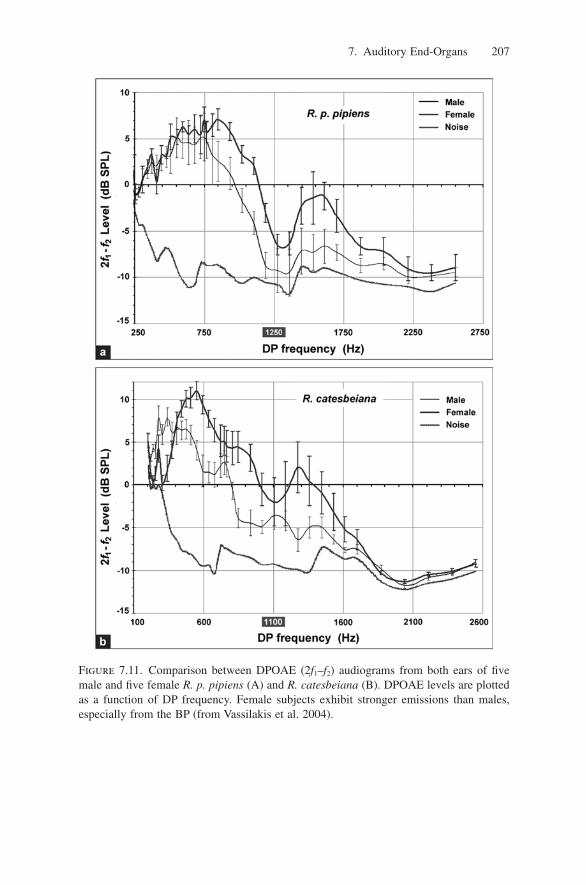
(higher) SOAE frequencies (van Dijk and Wit 1987; van Dijk et al. 1989; Longet al. 1996). The rate of this change appears to depend on emission frequency,with SOAEs <600Hz exhibiting less sensitivity to temperature changes thanSOAEs >600Hz (Long et al. 1996; van Dijk et al. 1996; Fig. 7.12). Temperaturechanges also affect SOAE amplitudes, but in an on–off rather than continuousmanner (van Dijk and Wit 1987).
Both the frequency and amplitude of SOAEs change in the presence of anexternal sinusoidal stimulus. If the external stimulus is both close in frequencyto an SOAE and sufficiently strong, the SOAE frequency will shift to match thefrequency of the stimulus (van Dijk and Wit 1990). On the contrary, if the fre-quency separation between an SOAE and the external stimulus is large, the SOAEfrequency will shift away from that of the external stimulus (Baker et al. 1989;
Figure 7.12. SOAE spectra (64averages per spectrum) and temper-ature changes plotted over time,illustrating the dependence ofSOAE frequencies on temperature.From Long et al. (1996).
7. Auditory End-Organs 209
Long et al. 1996). The presence of an external stimulus may also decrease theamplitude of an SOAE. The amount of suppression depends on the frequency ofthe external stimulus, as seen in isosuppression contours (Baker et al. 1989). Sup-pression is most prominent when the SOAE and the external stimulus coincidein frequency, and decreases as the frequency separation between the twoincreases. The amount of suppression is highest for external stimulus frequenciesbelow the SOAE frequency, resulting in asymmetric isosuppression contours thatare similar in shape to neural tuning curves (Baker et al. 1989).
Although SOAEs could be easily recorded in the summer, they were notdetected in the winter (van Dijk et al. 1989), confirming the earlier observationthat OAE generation may be seasonal.
4.5 OAEs Suggest the BP Acts as a Single Auditory Filter
Due to the BP’s relatively simple anatomy and physiology, it has been suggestedthat this papilla may be functioning as a bandpass filter with a single CF. In ranidfrogs, for example, all BP hair bundles follow the same orientation (Lewis 1978),and almost all BP nerve fibers are tuned to the same frequency and have identi-cally shaped tuning curves (Ronken 1990). Based on such observations, severalfrog DPOAE studies have used the Duffing oscillator as a model for the BP (vanDijk and Manley 2001; Meenderink et al. 2005a,b), successfully predicting thedependence of DPOAE amplitudes and phases on the relative and absoluteprimary frequencies, as well as the observed correlations between DPOAEs andneural tuning curves. These results support the notion of the BP as a single,broadly tuned auditory filter. The uniqueness of this property within vertebratehearing makes the frog an excellent subject for DPOAE studies, inasmuch as BP-DPOAEs are not influenced by auxiliary structures (in contrast to the mammalianear or the frog AP) and only reflect the properties of the nonlinearities directlyinvolved in OAE generation.
4.6 OAEs and Inner Ear Amplification in the Frog
OAE data obtained from the frog support several speculations regarding the func-tioning of the amphibian inner ear. It is generally accepted that mammalian OAEgeneration is closely linked to the cochlear amplifier, a term introduced by Davis(1983) to denote the summed contribution of those mechanisms that appear toenhance the movement of mammalian inner ear structures. Besides the presenceof OAEs, several observations support the involvement of an amplifier in the ear’stransduction of sound. First, the auditory system exhibits higher sensitivity andfrequency selectivity than expected by its passive mechanical properties alone.Second, the system’s response grows compressively, being highly amplified forlow-intensity stimuli and less so as stimulus intensity increases. Third, the systemis highly susceptible to various forms of physical, physiological, and chemicalinsults, consistent with the fact that the cochlear amplifier depends on biochem-ical sources for its energy.
210 D.D. Simmons et al.
SOAEs are the only type of OAEs whose mere occurrence may be interpretedas evidence for the presence of an inner ear amplifier. In the frog, SOAEs havebeen measured only within a frequency range corresponding to the frequencyresponse of the AP, suggesting that an amplification process may be present inthis papilla but not in the BP. Several differences between AP- and BP-DPOAEssupport this observation. Only DPOAE I/O curves from the AP exhibit com-pressive growth at low primary levels. Furthermore, low-level AP-DPOAEs aremuch more sensitive to physiological insults and changes in temperature thanlow-level BP-DPOAEs, suggesting the presence of biochemical energy sourcesin the AP that would power an amplifier.
An amplification process may therefore be present in the frog AP but not inthe BP. This potential difference is consistent with and may be related to severalphysiological differences between the two papillae. In the R. catesbeiana ear, forexample, the AP has approximately fifteen times as many hair cells and is inner-vated by approximately three times as many afferent nerve fibers as the BP(Geisler et al. 1964; Lewis et al. 1985). At the same time, efferent nerve fibers,in most cases, innervate the AP but not the BP (Robbins et al. 1967; Simmons etal. 1995).
It has been suggested that, because the AP is tonotopically organized (Lewiset al. 1982b; Simmons et al. 1992) and the BP responds as a bandpass filter witha single characteristic frequency (van Dijk and Manley 2001), the presence of anamplifier might play the role of increasing the sharpness of tuning of the AP fibers(Vassilakis et al. 2004). The absence of an amplifier from the BP may be bene-ficial as well. Due to their ectothermic physiology, frog bodies may undergo rel-atively large temperature fluctuations. Given the lack of temperature sensitivityof the BP fibers (Stiebler and Narins 1990; van Dijk et al. 1990), such fluctua-tions do not result in the loss of frequency-specific information from this sensoryorgan.
Although specifying the exact location and the underlying molecular motor ofa possible AP amplifier is not essential to understanding whether amplificationoccurs in the frog ear, some relevant speculations can be made. According togeneral consensus, the inner ear amplifier is located within the sensory hair cells.In mammals, a likely candidate for the cochlear amplifier has been identified inthe OHCs. These cells contain within their lateral membrane a protein (prestin)that undergoes voltage-mediated conformational changes (Santos-Sacchi 1991).This deformation alters the OHC shape in synchrony with an incoming stimulus,providing a cycle-by-cycle amplification of the stimulus-induced OHC movement(Zheng et al. 2000). Nonmammalian vertebrates, on the other hand, lack OHCsand there is no evidence of or likelihood for fast somatic motility of their haircells (Manley 2001). Oscillation of the hair bundles has been proposed as an alter-native amplification mechanism. Such oscillations have been observed in vitro inseveral nonmammalian vestibular organs (Hudspeth 1997) and in the hearingorgan of turtles (Crawford and Fettiplace 1985), and in vivo in the bobtail lizard(Manley et al. 2001). Great interest has been generated from recent reports (Chan
and Hudspeth 2005; Jia and He 2005) documenting active hair bundle motion inmammalian hair cell bundles, requiring a reassessment of the role of evolutionin the genesis of motility in auditory hearing organs.
5. Summary
The sensitivity (e.g., spontaneous activity and thresholds) and tuning (e.g., fre-quency responses) of the frog auditory periphery is determined in large part byits unique anatomical and physiological features, not the least of which is thatthere are two organs specialized for the reception of airborne sounds. The frogear relies heavily on an elaborate infrastructure, which subserves conduction, fil-tering, and transduction of auditory information by both the AP (low to mid-frequencies) and the BP (high frequencies).
As the input to the central auditory system, auditory nerve fiber responses aredetermined by the arrangement and number of their connections to hair cells, bythe events at the hair cell synapse, by the intrinsic properties of hair cells andtheir hair bundles, as well as by the bandpass spectral filtering of the overlyingtectorial structures. The frog AP is a uniquely organized tonotopic end-organwhereas the frog BP is a broadly tuned organ that acts as a single auditory filter.In both the AP and BP, hair cells are rigidly fixed to a cartilaginous wall and lacka basilar membrane, a structure common to auditory organs of reptiles, birds, andmammals. The frog AP has a complicated frequency-related distribution of hairbundle types with polarization patterns that grossly correspond to other rostro-caudal gradients in the ear, such as hair cell height and tectorial membrane mass.
In the frog inner ear, frequency selectivity may depend on the mechanics of the tectorium and the fluids as well as their interaction with the hair cells.Movement of the tectorium presumably produces deflection of the stereovilli that leads to the release of transmitter, activating auditory nerve fibers. Thus, theinertial lag times associated with tectorium mechanics along with differences in stereovillar lengths or stiffness may be the primary determinants of responselatency. Determination of the actual travel times of action potentials in auditorynerve fibers from high- and low-frequency locations should give a better under-standing of how the motion of the tectorium is coupled to the stereovillar bundle.
Rostrocaudal variations in hair cell height are inversely related to tonotopysuch that the tallest hair cells are found in the lowest-frequency regions andshorter hair cells are found in higher-frequency regions. Whole-cell capacitancesalso covary with hair cell body length. Thus, basic morphological features (e.g.,hair cell height) can be related to the presence of intrinsic electrical tuning mech-anisms (e.g., capacitance and frequency tuning). The variation of synaptic archi-tecture is consistent with innervation patterns: rostrally located hair cells have agreater number of synapses and nerve fiber contacts than caudally located haircells. Similarly, efferent synapses are predominant in rostral areas and notdetectable in caudal areas. Frog auditory nerve fibers also have anatomical and
7. Auditory End-Organs 211
212 D.D. Simmons et al.
physiological gradients such as larger diameters and longer response latenciesfrom low-frequency rostral fibers, and thinner diameters and shorter responselatencies from higher-frequency caudal fibers.
It is currently well-established that the mammalian cochlea exhibits tonotopicorganization (Von Békésy, 1960). This tonotopy arises from mass and stiffnessgradients along the basilar membrane and can be observed by measuring themechanical response of the basilar membrane (Robles and Ruggero 2001). Oneof the most intriguing manifestations of this gradient-induced tonotopy is thepresence of traveling waves on the basilar membrane. Conversely, tonotopic orga-nization that does not move gradually from low to high frequencies (or vice versa)cannot support a traveling wave. Because the AP is also tonotopically organized,with highest sensitivity to different frequencies distributed at different locationsalong the sensory epithelium, the question arises whether this papilla may alsosupport traveling waves. Neurophysiological evidence (Hillery and Narins 1984)suggests that this may indeed be the case. However, if there is an absence ofappropriate mass and stiffness gradients within the tectorium (or any other froginner ear structure) then the presence of mammalianlike traveling waves in theAP may be excluded (Lewis et al. 1985). This exclusion is further supported bythe patterns present in DPOAE ( f1, f2) area maps (Meenderink et al. 2005a).Rather, it seems more plausible that the tectorium overlying the AP sensoryepithelium functions as a broadband filter, with tonotopy originating in additionalfiltering mechanisms (mechanical and/or electrical) that may be closely associ-ated with the hair cells. Data on the dependence of DPOAE amplitude on primarylevel difference (L1–L2) also suggest that the tectorium may function as a broad-band filter (Vassilakis et al. 2004; Meenderink and van Dijk 2005a), outlining the boundaries of the AP frequency response range. A possible difference inDPOAE generation sites between mammals and frogs observed by Vassilakis etal. (2004) also questions the development of a mammalianlike traveling wave inthe frog ear.
OAEs are indirect manifestations of the vibration of structures within the APand, as such, they can only provide indirect evidence for the types of availablespectral filtering (i.e., the presence or absence of traveling waves). Conclusiveevidence for the presence of a traveling wave can best be obtained by directlyrecording the vibration of the tectorial membrane or of other traveling-wave rel-evant AP structures.
Acknowledgments. The authors are indebted to Peter M. Narins for his superbeditorship, guidance, and assistance. His gentle spirit, encouraging words, andpersistent intellectual rigor were invaluable to the writing of this chapter.
References
Abdala C (2000) Distortion product otoacoustic emission (2f1–f2) amplitude growth inhuman adults and neonates. J Acoust Soc Am 107:446–456.
Ashmore JF, Geleoc GS, Harbott L (2000) Molecular mechanisms of sound amplificationin the mammalian cochlea. Proc Natl Acad Sci USA 97:11759–11764.
Baird RA, Burton MD, Fashena DS, Naeger RA (2000) Hair cell recovery in mitoticallyblocked cultures of the bullfrog saccule. Proc Natl Acad Sci USA 97:11722–11729.
Baird RA, Lewis ER (1986) Correspondences between afferent innervation patterns andresponse dynamics in the bullfrog utricle and lagena. Brain Res 369:48–64.
Baker RJ, Wilson JP, Whitehead ML (1989) Otoacoustic evidence for nonlinear behaviorin frog hearing: suppression but no distortion products. In: Wilson J, Kemp DT (eds.)Cochlear Mechanisms: Structure, Function and Models. Plenum, New York, pp.349–356.
Benedix JH, Jr., Pedemonte M, Velluti R, Narins PM (1994) Temperature dependence oftwo-tone rate suppression in the northern leopard frog, Rana pipiens pipiens. J AcoustSoc Am 96:2738–2745.
Bleeck S, Langner G (2001) Functional significance of latencies. In: Greenberg S, SlaneyM (eds.) Computational Models of Auditory Function (NATO Science Series). IOSPress, Burke, VA, pp. 205–220.
Bozovic D, Hudspeth AJ (2003) Hair-bundle movements elicited by transepithelial elec-trical stimulation of hair cells in the sacculus of the bullfrog. Proc Natl Acad Sci USA100:958–963.
Capranica RR (1978) Auditory processing in anurans. Fed Proc 37:2324–2328.Capranica RR, Moffat AJM (1975) Selectivity of the peripheral auditory system of spade-
foot toads (Scaphiopus couchi) for sounds of biological significance. J Comp Physiol100.
Capranica RR, Moffat AJM (1980) Nonlinear properties of the peripheral auditory systemof anurans. In: Popper AN, Fay RR (eds.) Comparative Studies of Hearing in Verte-brates. Springer, New York, pp. 139–165.
Capranica RR, Moffat AJM (1983) Neurobehavioral correlates of sound communicationin anurans. In: Ewert J, Capranica R, Ingle D (eds.) Advances in Vertebrate Neu-roethology. Plenum, New York, pp. 701–730.
Carey MB, Zelick R (1993) The effect of sound level, temperature and dehydration on the brainstem auditory evoked potential in anuran amphibians. Hear Res 70:216–228.
Chan DK, Hudspeth AJ (2005) Ca2+ current-driven nonlinear amplification by the mam-malian cochlea in vitro. Nat Neurosci 8:149–155.
Chang JS, Popper AN, Saidel WM (1992) Heterogeneity of sensory hair cells in a fish ear.J Comp Neurol 324:621–640.
Christensen-Dalsgaard J, Jørgensen MB (1996) One-tone suppression in the frog auditorynerve. J Acoust Soc Am 100:451–457.
Christensen-Dalsgaard J, Jørgensen MB, Kanneworff M (1998) Basic response character-istics of auditory nerve fibers in the grassfrog (Rana temporaria). Hear Res 119:155–163.
Corwin JT, Warchol ME (1991) Auditory hair cells: Structure, function, development, andregeneration. Ann Rev Neurosci 14:301–333.
Crawford AC, Fettiplace R (1985) The mechanical properties of ciliary bundles of turtlecochlear hair cells. J Physiol 364:359–379.
Dallos P (1992) The active cochlea. J Neurosci 12:4575–4585.Davis H (1983) An active process in cochlear mechanics. Hear Res 9:79–90.De Boer E (1967) Correlation studies applied to the frequency resolution of the cochlea.
J Aud Res 7:209–217.
7. Auditory End-Organs 213
Deutsch S (1969) The maximization of nerve conduction velocity. IEEE Trans Syst SciCybern 5:86–91.
Dunia R, Narins PM (1989) Temporal resolution in frog auditory-nerve fibers. J AcoustSoc Am 85:1630–1638.
Eggermont JJ (1993) Wiener and Volterra analyses applied to the auditory system. HearRes 66:177–201.
Ehret G, Moffat AJM, Capranica RR (1983) Two-tone suppression in auditory nerve fibersof the green treefrog (Hyla cinerea). J Acoust Soc Am 73:2093–2095.
Emmerich E, Richter F, Reinhold U, Linss V, Linss W (2000) Effects of industrial noiseexposure on distortion product otoacoustic emissions (DPOAEs) and hair cell loss ofthe cochlea—long term experiments in awake guinea pigs. Hear Res 148:9–17.
Faulstich M, Kössl M (2000) Evidence for multiple DPOAE components based upongroup delay of the 2f(1)-f(2) distortion in the gerbil. Hear Res 140:99–110.
Feng AS, Narins PM, Capranica RR (1975) Three populations of primary auditory fibersin the bullfrog (Rana catesbeiana): Their peripheral origins and frequency sensitivities.J Comp Physiol 100:221–229.
Feng AS, Shofner WP (1981) Peripheral basis of sound localization in anurans. Acousticproperties of the frog’s ear. Hear Res 5:201–216.
Fettiplace R, Ricci AJ, Hackney CM (2001) Clues to the cochlear amplifier from the turtleear. Trends Neurosci 24:169–175.
Fitzgerald JV, Burkitt AN, Clark GM, Paolini AG (2001) Delay analysis in the auditorybrainstem of the rat: Comparison with click latency. Hear Res 159:85–100.
Flock A (1965) Transducing mechanisms in the lateral line canal organ receptors. ColdSpring Harb Symp Quant Biol 30:133–145.
Flock A, Flock B (1966) Ultrastructure of the amphibian papilla in the bullfrog. J AcoustSoc Am 40:1262.
Frishkopf LS, Flock A (1974) Ultrastructure of the basilar papilla, an auditory organ inthe bullfrog. Acta Otolaryngol 77:176–184.
Geisler CD, Van Bergeijk W, Frishkopf LS (1964) The inner ear of the bullfrog. J Morphol114:43–57.
Gleich O, Wilson S (1993) The diameters of guinea pig auditory nerve fibres: Distribu-tion and correlation with spontaneous rate. Hear Res 71:69–79.
Gleisner L, Flock A, Wersall J (1973) The ultrastructure of the afferent synapse on haircells in the frog labyrinth. Acta Otolaryngol 76:199–207.
Gold T (1948) Hearing. II. The physical basis of the action of the cochlea. Proc Roy SocLondon B, Biological Sciences 135:492–498.
Hau LWT, Simmons DD, Narins PM (2004) Frequency-dependence of auditory-nervelatency in the northern leopard frog, Rana pipiens pipiens. Assoc for Research in Oto-laryngology Abstract 380.
Hetherington TE, Jaslow AP, Lombard RE (1986) Comparative morphology of theamphibian opercularis system: I. General design features and functional interpretation.J Morphol 190:43–61.
Hillery CM, Narins PM (1984) Neurophysiological evidence for a traveling wave in theamphibian inner ear. Science 225:1037–1039.
Hillery CM, Narins PM (1987) Frequency and time domain comparison of low-frequencyauditory fiber responses in two anuran amphibians. Hear Res 25:233–248.
Hödl W, Amezquita A, Narins PM (2004) The role of call frequency and the auditory papil-lae in phonotactic behavior in male dart-poison frogs Epipedobates femoralis (Dendro-batidae). J Comp Physiol A 190:823–829.
214 D.D. Simmons et al.
Hudspeth AJ (1997) How hearing happens. Neuron 19:947–950.Hudspeth AJ, Corey DP (1977) Sensitivity, polarity, and conductance change in the
response of vertebrate hair cells to controlled mechanical stimuli. Proc Natl Acad SciUSA 74:2407–2411.
Hudspeth AJ, Choe Y, Mehta AD, Martin P (2000) Putting ion channels to work: mecha-noelectrical transduction, adaptation, and amplification by hair cells. Proc Natl Acad SciUSA 97:11765–11772.
Jia S, He DZ (2005) Motility-associated hair-bundle motion in mammalian outer hair cells.Nat Neurosci 8:1028–1034.
Kalluri R, Shera CA (2001) Distortion-product source unmixing: A test of the two-mech-anism model for DPOAE generation. J Acoust Soc Am 109:622–637.
Kemp DT (1978) Stimulated acoustic emissions from within the human auditory system.J Acoust Soc Am 64:1386–1391.
Kiang NYS, Watanabe T, Thomas L, Clark L (1965) Discharge Patterns of Single Fibersin the Cat’s Auditory Nerve. MIT Press, Cambridge, MA.
Knight RD, Kemp DT (2000) Indications of different distortion product otoacoustic emission mechanisms from a detailed f1, f2 area study. J Acoust Soc Am 107:457–473.
Knight RD, Kemp DT (2001) Wave and place fixed DPOAE maps of the human ear. JAcoust Soc Am 109:1513–1525.
Köppl C (1995) Otoacoustic emissions as an indicator for active cochlear mechanics: aprimitive property of vertebrate auditory organs. In: Manley GA, Klump GM, Köppl C,Fastl H, Oeckinghaus H (eds.), Advances in Hearing Research, World Scientific, Sin-gapore, pp. 207–216.
Köppl C, Authier S (1995) Quantitative anatomical basis for a model of micromechanicalfrequency tuning in the Tokay gecko, Gekko gecko. Hear Res 82:14–25.
Kössl M, Boyan G (1998) Acoustic distortion products from the ear of a grasshopper. JAcoust Soc Am 104:326–335.
Kössl M, Vater M (1996) Further studies on the mechanics of the cochlear partition in themustached bat. II. A second cochlear frequency map derived from acoustic distortionproducts. Hear Res 94:78–86.
Kummer P, Janssen T, Hulin P, Arnold W (2000) Optimal L(1)–L(2) primary tone level separation remains independent of test frequency in humans. Hear Res 146:47–56.
Lenzi D, Runyeon JW, Crum J, Ellisman MH, Roberts WM (1999) Synaptic vesicle populations in saccular hair cells reconstructed by electron tomography. J Neurosci19:119–132.
Lewis ER (1976) Surface morphology of the bullfrog amphibian papilla. Brain Behav Evol13:196–215.
Lewis ER (1978) Comparative studies of the anuran auditory papillae. Scan ElectronMicrosc 11:633–642.
Lewis ER (1981) Suggested evolution of tonotopic organization in the frog amphibianpapilla. Neurosci Lett 21:131–136.
Lewis ER (1984) On the frog amphibian papilla. Scan Electron Microsc Pt 4:1899–1913.Lewis ER (1988) Tuning in the bullfrog ear. Biophys J 53:441–447.Lewis ER, Leverenz EL (1983) Morphological basis for tonotopy in the anuran amphib-
ian papilla. Scan Electron Microsc Pt 1:189–200.Lewis ER, Li CW (1975) Hair cell types and distributions in the otolithic and auditory
organs of the bullfrog. Brain Res 83:35–50.
7. Auditory End-Organs 215
Lewis ER, Lombard R (1988) The amphibian inner ear. In: Fritzsch B, Ryan M, Wilcyn-ski W, Hetherington T, Walkowiak W (eds.) The Evolution of the Amphibian AuditorySystem. Wiley Interscience, New York, pp. 93–124.
Lewis ER, Narins PM (1999) The acoustic periphery of amphibians: Anatomy and phys-iology. In: Fay R, Popper A (eds.) Comparative Hearing: Fish and Amphibians. Springer,New York, pp. 101–154.
Lewis ER, van Dijk P (2004) New variation on the derivation of spectro-temporal recep-tive fields for primary auditory afferent axons. Hear Res 189:120–136.
Lewis ER, Baird RA, Leverenz EL, Koyama H (1982a) Inner ear: Dye injection revealsperipheral origins of specific sensitivities. Science 215:1641–1643.
Lewis ER, Hecht EI, Narins PM (1992) Diversity of form in the amphibian papilla ofPuerto Rican frogs. J Comp Physiol [A] 171:421–435.
Lewis ER, Henry KR, Yamada WM (2002) Tuning and timing of excitation and inhibi-tion in primary auditory nerve fibers. Hear Res 171:13–31.
Lewis ER, Leverenz EL, Bialek WS (1985) The Vertebrate Inner Ear. CRC, Boca Raton,FL.
Lewis ER, Leverenz EL, Koyama H (1982b) The tonotopic organization of the bullfrogamphibian papilla, an auditory organ lacking a basilar membrane. J Comp Physiol145:437–445.
Liberman MC (1980) Morphological differences among radial afferent fibers in the catcochlea: an electron-microscopic study of serial sections. Hear Res 3:45–63.
Liberman MC, Simmons DD (1985) Applications of neuronal labeling techniques to thestudy of the peripheral auditory system. J Acoust Soc Am 78:312–319.
Liberman MC, Dodds LW, Pierce S (1990) Afferent and efferent innervation of the catcochlea: Quantitative analysis with light and electron microscopy. J Comp Neurol301:443–460.
Liberman MC, Gao J, He DZ, Wu X, Jia S, Zuo J (2002) Prestin is required for electro-motility of the outer hair cell and for the cochlear amplifier. Nature 419:300–304.
Liff HJ, Goldstein MH, Jr. (1970) Peripheral inhibition in auditory fibers in the frog. JAcoust Soc Am 47:1538–1547.
Lnenicka GA, Atwood HL, Marin L (1986) Morphological transformation of synaptic terminals of a phasic motoneuron by long-term tonic stimulation. J Neurosci 6:2252–2258.
Long GR, van Dijk P, Wit HP (1996) Temperature dependence of spontaneous otoacousticemissions in the edible frog (Rana esculenta). Hear Res 98:22–28.
Lonsbury-Martin BL, McCoy MJ, Whitehead ML, Martin GK (1993) Clinical testing ofdistortion-product otoacoustic emissions. Ear Hear 14:11–22.
Maison S, Micheyl C, Collet L (1997) Medial olivocochlear efferent system in humansstudied with amplitude-modulated tones. J Neurophysiol 77:1759–1768.
Manley GA (2001) Evidence for an active process and a cochlear amplifier in nonmam-mals. J Neurophysiol 86:541–549.
Manley GA, Kirk DL, Koppl C, Yates GK (2001) In vivo evidence for a cochlear ampli-fier in the hair-cell bundle of lizards. Proc Natl Acad Sci USA 98:2826–2831.
Mason MJ, Lin CC, Narins PM (2003) Sex differences in the middle ear of the bullfrog(Rana catesbeiana). Brain Behav Evol 61:91–101.
Meenderink SWF, van Dijk P (2004) Level dependence of distortion product otoacousticemissions in the leopard frog, Rana pipiens pipiens. Hear Res 192:107–118.
Meenderink SWF, van Dijk P (2005a) Characteristics of distortion product otoacousticemissions in the frog from L1, L2 maps. J Acoust Soc Am 118:279–286.
216 D.D. Simmons et al.
Meenderink SWF, van Dijk P (2005b) Temperature dependence of distortion product otoacoustic emissions in the frog. in preparation.
Meenderink SWF, Narins PM, van Dijk P (2005a) Detailed f1, f2 area study of distortionproduct otoacoustic emissions in the frog. J Assoc Res Otolaryngol 6:37–47.
Meenderink SWF, van Dijk P, Narins PM (2005b) Comparison between distortion productotoacoustic emissions and nerve fiber responses from the basilar papilla of the frog. JAcoust Soc Am 117:3165–3173.
Mills DM, Rubel EW (1994) Variation of distortion product otoacoustic emissions withfurosemide injection. Hear Res 77:183–199.
Narins PM (1983) Synchronous vocal response mediated by the amphibian papilla in aneotropical treefrog: Behavioral evidence. J Exp Biol 105:95–105.
Narins PM, Capranica RR (1976) Sexual differences in the auditory system of the treefrog,Eleutherodactylus coqui. Science 192:378–380.
Nobili R, Mammano F, Ashmore J (1998) How well do we understand the cochlea? TrendsNeurosci 21:159–167.
Owens JJ, McCoy MJ, Lonsbury-Martin BL, Martin GK (1992) Influence of otitis mediaon evoked otoacoustic emission in children. Seminars in Hearing 13:53–65.
Owens JJ, McCoy MJ, Lonsbury-Martin BL, Martin GK (1993) Otoacoustic emissions inchildren with normal ears, middle ear dysfunction, and ventilating tubes. Am J Otol14:34–40.
Palmer AR, Wilson JP (1982) Spontaneous and evoked acoustic emissions in the frog Ranaesculenta. J Physiol 324:66.
Pitchford S, Ashmore JF (1987) An electrical resonance in hair cells of the amphibianpapilla of the frog Rana temporaria. Hear Res 27:75–83.
Probst R, Lonsbury-Martin BL, Martin GK (1991) A review of otoacoustic emissions. JAcoust Soc Am 89:2027–2067.
Purgue AP, Narins PM (2000a) Mechanics of the inner ear of the bullfrog (Rana cates-beiana): The contact membranes and the periotic canal. J Comp Physiol [A] 186:481–488.
Purgue AP, Narins PM (2000b) A model for energy flow in the inner ear of the bullfrog(Rana catesbeiana). J Comp Physiol [A] 186:489–495.
Robbins RG, Bauknight RS, Honrubia V (1967) Anatomical distribution of efferent fibersin the 8th cranial nerve of the bullfrog (Rana catesbeiana). Acta Otolaryngol 64:436–448.
Robles L, Ruggero MA (2001) Mechanics of the mammalian cochlea. Physiol Rev 81:1305–1352.
Ronken DA (1990) Basic properties of auditory-nerve responses from a “simple” ear: Thebasilar papilla of the frog. Hear Res 47:63–82.
Ronken DA (1991) Spike discharge properties that are related to the characteristic frequency of single units in the frog auditory nerve. J Acoust Soc Am 90:2428–2440.
Ronken DA, Bosch WR, Molnar CE (1993) Effects of spike discharge history on dischargeprobability and latency in frog basilar papilla units. Hear Res 69:55–75.
Rose GJ, Capranica RR (1985) Sensitivity to amplitude modulated sounds in the anuranauditory nervous system. J Neurophysiol 53:446–465.
Rosowski JJ, Peake WT, White JR (1984) Cochlear nonlinearities inferred from two-tonedistortion products in the ear canal of the alligator lizard. Hear Res 13:141–158.
Rushton WA (1951) A theory of the effects of fibre size in medullated nerve. J Physiol115:101–122.
7. Auditory End-Organs 217
Santos-Sacchi J (1991) Reversible inhibition of voltage-dependent outer hair cell motilityand capacitance. J Neurosci 11:3096–3110.
Schetzen M (1989) The Volterra and Weiner Theories of Nonlinear Systems. Krieger,Malabar, FL.
Schneider S, Prijs VF, Schoonhoven R (2003) Amplitude and phase of distortion productotoacoustic emissions in the guinea pig in an (f1,f2) area study. J Acoust Soc Am113:3285–3296.
Shera CA, Guinan JJ, Jr. (1999) Evoked otoacoustic emissions arise by two fundamen-tally different mechanisms: A taxonomy for mammalian OAEs. J Acoust Soc Am 105:782–798.
Shofner WP, Feng AS (1983) A quantitative light microscopic study of the bullfrogamphibian papilla tectorium: Correlation with the tonotopic organization. Hear Res11:103–116.
Shofner WP, Feng AS (1984) Quantitative light and scanning electron microscopic studyof the developing auditory organs in the bullfrog: Implications on their functional char-acteristics. J Comp Neurol 224:141–154.
Simmons AM (1988) Masking patterns in the bullfrog (Rana catesbeiana). I: Behavioraleffects. J Acoust Soc Am 83:1087–1092.
Simmons AM, Reese G, Ferragamo M (1993) Periodicity extraction in the anuran auditory nerve. II: Phase and temporal fine structure. J Acoust Soc Am 93:3374–3389.
Simmons DD, Narins PM (1995) Conduction velocity, fiber diameter and response latencyin auditory nerve fivers of Rana pipiens pipiens: Toward temporal separation of coin-cidence? Proceedings of the 4th International Congress of Neuroethology. 347.
Simmons DD, Bertolotto C, Leong M (1994a) Ultrastructural reconstruction of auditoryhair cells and their synapses in low and high frequency regions of the frog inner ear.Proc Int’l Cong Elctr Micrs 13:629–630.
Simmons DD, Bertolotto C, Narins PM (1994b) Morphological gradients in sensory haircells of the amphibian papilla of the frog, Rana pipiens pipiens. Hear Res 80:71–78.
Simmons DD, Bertolotto C, Leong M (1995) Synaptic ultrastructure within the amphib-ian papilla of Rana pipiens pipiens: rostrocaudal differences. Auditory Neurosci 1:183–193.
Simmons DD, Bertolotto C, Narins PM (1992) Innervation of the amphibian and basilarpapillae in the leopard frog: Reconstructions of single labeled fibers. J Comp Neurol322:191–200.
Simmons DD, Burton MD, Hooper RN, Baird RA (2004) Hair cell damage and recoveryfrom high-level noise exposures in the amphibian papilla of the bullfrog. Associationfor Research in Otolaryngology Abstract #365.
Smith CA, Sjostrand FS (1961) Structure of the nerve endings on the external hair cellsof the guinea pig cochlea as studied by serial section. J Ultrastruc Res 5:184–192.
Smith RS, Koles ZJ (1970) Myelinated nerve fibers: Computed effect of myelin thicknesson conduction velocity. Am J Physiol 219:1256–1258.
Smotherman MS, Narins PM (1999a) The electrical properties of auditory hair cells in thefrog amphibian papilla. J Neurosci 19:5275–5292.
Smotherman MS, Narins PM (1999b) Potassium currents in auditory hair cells of the frogbasilar papilla. Hear Res 132:117–130.
Smotherman MS, Narins PM (2000) Hair cells, hearing and hopping: A field guide to haircell physiology in the frog. J Exp Biol 203:2237–2246.
Sobkowicz HM, Rose JE, Scott GL, Levenick CV (1986) Distribution of synaptic ribbonsin the developing organ of Corti. J Neurocytol 15:693–714.
218 D.D. Simmons et al.
Stiebler IB, Narins PM (1990) Temperature-dependence of auditory nerve response properties in the frog. Hear Res 46:63–81.
Stover L, Gorga MP, Neely ST, Montoya D (1996) Toward optimizing the clinical utilityof distortion product otoacoustic emission measurements. J Acoust Soc Am 100:956–967.
Sugihara I, Furukawa T (1989) Morphological and functional aspects of two different typesof hair cells in the goldfish sacculus. J Neurophysiol 62:1330–1343.
van Dijk P (1995) Polynomial correlation used to estimate the degree of nonlinearity ofthe frog inner ear system. J Acoust Soc Am 97:3414.
van Dijk P, Manley GA (2001) Distortion product otoacoustic emissions in the tree frogHyla cinerea. Hear Res 153:14–22.
van Dijk P, Wit HP (1987) Temperature dependence of frog spontaneous otoacoustic emis-sions. J Acoust Soc Am 82:2147–2150.
van Dijk P, Wit HP (1990) Synchronization of spontaneous otoacoustic emissions to a2f1–f2 distortion product. J Acoust Soc Am 88:850–856.
van Dijk P, Wit HP, Segenhout JM (1989) Spontaneous otoacoustic emissions in the European edible frog (Rana esculenta): Spectral details and temperature dependence.Hear Res 42:273–282.
van Dijk P, Lewis ER, Wit HP (1990) Temperature effects on auditory nerve fiber responsein the American bullfrog. Hear Res 44:231–240.
van Dijk P, Mason MJ, Narins PM (2002) Distortion product otoacoustic emissions infrogs: correlation with middle and inner ear properties. Hear Res 173:100–108.
van Dijk P, Narins PM, Mason MJ (2003) Physiological vulnerability of distortion productotoacoustic emissions from the amphibian ear. J Acoust Soc Am 114:2044–2048.
van Dijk P, Narins PM, Wang J (1996) Spontaneous otoacoustic emissions in seven frogspecies. Hear Res 101:102–112.
van Dijk P, Wit HP, Segenhout JM (1997) Dissecting the frog inner ear with Gaussiannoise. II. Temperature dependence of inner ear function. Hear Res 114:243–251.
van Dijk P, Wit HP, Segenhout JM, Tubis A (1994) Wiener kernel analysis of inner earfunction in the American bullfrog. J Acoust Soc Am 95:904–919.
Vassilakis PN, Meenderink SWF, Narins PM (2004) Distortion product otoacoustic emissions provide clues to hearing mechanisms in the frog ear. J Acoust Soc Am116:3713–3726.
Von Békésy G (1960) Experiments in Hearing. Acoustical Society of America Press, NewYork.
Walrond JP, Reese TS (1985) Structure of axon terminals and active zones at synapses onlizard twitch and tonic muscle fibers. J Neurosci 5:1118–1131.
West CD (1985) The relationship of the spiral turns of the cochlea and the length of thebasilar membrane to the range of audible frequencies in ground dwelling mammals. JAcoust Soc Am 77:1091–1101.
Wever EG (1973) The ear and hearing in the frog, Rana pipiens. J Morphol 141:461–477.
Wever EG (1985) The Amphibian Ear. Princeton University, Princeton, NJ.Whitehead ML, Lonsbury-Martin BL, Martin GK (1992) Evidence for two discrete
sources of 2f1-f2 distortion-product otoacoustic emission in rabbit. II: Differential phys-iological vulnerability. J Acoust Soc Am 92:2662–2682.
Whitehead ML, Wilson JP, Baker RJ (1986) The effects of temperature on otoacousticemission tuning properties. In: Moore B, Patterson R (eds.) Auditory Frequency Selec-tivity. Plenum, New York, pp. 39–48.
7. Auditory End-Organs 219
Wilczynski W, Keddy-Hector AC, Ryan MJ (1992) Call patterns and basilar papilla tuningin cricket frogs. I. Differences among populations and between sexes. Brain Behav Evol39:229–237.
Wilczynski W, McClelland BE, Rand AS (1993) Acoustic, auditory, and morphologicaldivergence in three species of neotropical frog. J Comp Physiol 172:425–438.
Will U, Fritzsch B (1988) The eighth nerve of amphibians. In: Fritzsch B, Ryan M, Walczynski W, Hetherington T, Walkowiak W (eds.) The Evolution of the AmphibianAuditory System. Wiley-Interscience, New York, pp. 159–183.
Zakon HH, Capranica RR (1981) An anatomical and physiological study of regenerationof the eighth nerve in the leopard frog. Brain Res 209:325–338.
Zakon HH, Wilczynski W (1988) The physiology of the anuran eighth nerve. In: FritzschB, Ryan M, Walczynski W, Hetherington T, Walkowiak W (eds.) The Evolution of theAmphibian Auditory System. Wiley-Interscience, New York, pp. 125–155.
Zelick R, Narins PM (1985) Temporary threshold shift, adaptation, and recovery charac-teristics of frog auditory nerve fibers. Hear Res 17:161–176.
Zenisek D, Davila V, Wan L, Almers W (2003) Imaging calcium entry sites and ribbonstructures in two presynaptic cells. J Neurosci 23:2538–2548.
Zhang M, Abbas PJ (1997) Effects of middle ear pressure on otoacoustic emission mea-sures. J Acoust Soc Am 102:1032–1037.
Zheng J, Shen W, He DZ, Long KB, Madison LD, Dallos P (2000) Prestin is the motorprotein of cochlear outer hair cells. Nature 405:149–155.
220 D.D. Simmons et al.