Embed Size (px)
Citation preview

National Paediatric Diabetes Audit Report 2013-14
Part 1: Care Processes and Outcomes
National PaediatricDiabetes Audit
NPDA

National Paediatric Diabetes Audit 2013-14
Report 1:
Care Processes and Outcomes
Published: March 2015
Report produced by theNational Paediatric Diabetes Audit
Royal College of Paediatrics and Child Health
Revised: September 2015
2
National Paediatric Diabetes Audit Report 2013-14
Contents
Foreword ...................................................................................................................................................3
1. Executive Summary ...........................................................................................................................4
2. Introduction...................................................................................................................................... 10
3. Coverage of audit: Prevalence and incidence ............................................................................. 14
3.1 Characteristics of children and young people with diabetes ................................................14
3.2 Prevalence and Incidence of Type 1 diabetes .............................................................................. 17
3.2.1 Prevalence of Type 1 diabetes .............................................................................................18
3.2.2 Incidence of Type 1 diabetes ...............................................................................................20
4. Completion of care processes .......................................................................................................23
4.1 Completion of the seven key care processes..............................................................................24
4.2 Completion of the care processes smoking, thyroid disease screening, coeliac disease screening and psychological assessment ..................................................... 27
5. Outcomes of care ............................................................................................................................30
5.1 HbA1c and treatment regimen ........................................................................................................... 31
5.2 Microvascular disease ..........................................................................................................................45
5.2.1 Kidney disease ..........................................................................................................................45
5.2.2 Eye disease .................................................................................................................................47
5.3 Macrovascular Cardio Vascular Disease (CVD) risk factors ..................................................48
5.3.1 Blood Pressure and lipids .....................................................................................................49
5.3.2 Body Mass Index.......................................................................................................................50
5.3.3 Smoking .......................................................................................................................................53
5.4 Other auto-immune conditions ........................................................................................................54
6. Structured education and psychological support ......................................................................55
7. Conclusion ........................................................................................................................................58
8. List of tables and figures ............................................................................................................... 60
9. References ....................................................................................................................................... 64
10. Acknowledgements ..........................................................................................................................65

3
National Paediatric Diabetes Audit Report 2013-14
ForewordI’m delighted to introduce the 11th annual report of the National Paediatric Diabetes Audit (NPDA), with detailed findings and recommendations for the care of children and young people with diabetes in England and Wales for 2013-2014. The NPDA is commissioned and sponsored by the Healthcare Quality Improvement Partnership (HQIP) as part of their National Clinical Audit Programme. The programme is funded by NHS England and the Welsh Government.
Each year the NPDA becomes a more powerful benchmarking tool to ensure young patients with diabetes are receiving the high standards of care recommended by the National Institute for Health and Care Excellence (NICE). This fourth report published by the Royal College of Paediatrics and Child Health (RCPCH) brings fresh recommendations intended to not only heighten the quality of care and outcomes for children, but also to reduce inequalities in care highlighted by the audit.
A key improvement in results this year has been in the completion rate for individual care processes, which demonstrates that a higher proportion of paediatric diabetes units across the two nations are working towards recommended standards of care. Yet there still remains variability between regional networks in other important measures, suggesting that best practice for diabetes care needs to be more widely shared and applied in order to raise the level of care for all patients to the standard defined by NICE clinical guidelines. We must also acknowledge that overall performance in many other parts of Europe is better than our own and seek to learn from practice in other countries, as well as from the best in England and Wales.
The data on Type 2 diabetes, although representing a small percentage of the total numbers with diabetes, is another indicator of the effects of deprivation on child health, with those affected being 7 times more likely to come from the most deprived parts of the country. All political parties across the UK need to consider the implications and how they will address the impact of poverty on child health.
Children and young people with diabetes have complex needs as they develop and grow, with a risk of complications or serious disease in later life. This is the first year the NPDA has reported on markers that identify the risk of kidney, eye and cardiovascular disease, revealing hypertension in young people with Type 1 diabetes and an increase in obesity. An expanding partnership with the National Diabetes Audit (NDA) for adults, is another way in which the NPDA is working to ensure that young diabetes patients receive more seamless diabetes care as they make the transition into adulthood.
Diabetes is just one of many long-term conditions suffered by children and young people today. But with more cases of paediatric diabetes being reported year on year, the NPDA has never been more relevant. The messages from this 2013/14 report should be of interest not only to paediatric diabetes units, but also as essential reading for Clinical Commissioning Groups, parents, policymakers, advocates and anyone with a stake in the improvement of diabetes care for children and young people in England and Wales.
Dr Hilary CassPresident, Royal College of Paediatrics and Child Health

4
National Paediatric Diabetes Audit Report 2013-14
1. Executive Summary
Paediatric diabetes in children and young people is on the rise in England and Wales. In 2013/14, a thousand more children receiving care from a Paediatric Diabetes Unit (PDU) were reported to the National Paediatric Diabetes Audit (NPDA).
The NPDA has been reporting for 11 years. This latest report on Care Processes and Outcomes 2013/14 from the Royal College of Paediatrics and Child Health (RCPCH) demonstrates that while the quality of care for children and young people with diabetes in England and Wales is improving, there remains considerable variability across the two nations and local regions, with a significant number of patients receiving inadequate diabetes care.
The NPDA is commissioned and sponsored by the Healthcare Quality Improvement Partnership (HQIP) as part of their National Clinical Audit Programme. The programme is funded by NHS England and the Welsh Government. The data provided in this latest report are designed for use by clinical teams to drive improved outcomes in their diabetes services. This Executive Summary provides an overview of the NPDA and the findings in this year’s report to help commissioners, regional diabetes networks and policymakers set priorities for paediatric diabetes care.
The NPDA provides a suite of reports to highlight results for different audiences:
• The Care Processes and Outcomes report compares results across England (by region)and Wales
• The NPDA Individualised Unit Level Reports provide details of each unit’s performance andare available following the release of this report at www.rcpch.ac.uk/npda
• The new lay report designed for patients and families will be available in print and onlinefollowing the release of the main report
• The Hospital Admissions Report measures rates of admission to hospital for complicationssuch as Diabetic Ketoacidosis (DKA) or hypoglycaemia. A combined Hospital AdmissionsReport for 2012/13, 2013/14 and 2014/15 will be published later this year.
The NPDA is a powerful tool for measuring performance, and reports on the delivery of a high quality system of care based on standards set by the National Institute for Health and Care Excellence (NICE). The audit specifically refers to the NICE clinical guideline CG15, Type 1 diabetes: Diagnosis and management of Type 1 diabetes in children, young people and adults, and enables commissioners to monitor progress against the national standards and identify gaps in care; helps families to benchmark local service quality and provides data to support PDUs and regional networks in the improvement of care across the UK.
The NICE CG15, states that all children and young people with diabetes over 12 years of age should receive seven key care processes in order to achieve optimum control over their disease and reduce the potential for serious health complications. The seven care processes include:
1. HbA1c (all ages to receive this process)2. Height and weight3. Blood pressure4. Urinary albumin
5. Cholesterol6. Eye screening7. Foot examination

5
National Paediatric Diabetes Audit Report 2013-14
With just over 16% of children and young people with diabetes in England and Wales receiving all seven of these key diabetes care processes, improvements in care are urgent. Completing and recording these care processes can highlight problems at an early stage and allow action to be taken to reduce the significant risk of complications and lowered life expectancy associated with this life-long chronic disease.
There remains considerable variability across the nations and regional networks in completion rates of care processes, treatment targets and complications. This includes an unacceptable level of inter-unit variability. The reasons behind this require ongoing discussion at regional and local level and several recommendations about possible ways to address this variation are provided throughout the report.
The publication of updated and new standards for paediatric diabetes care by NICE, due to be published in 2015, will promote and support the highest quality of care achievable. The responsibility for addressing any inconsistencies and gaps in care which are failing many children, lies primarily with the PDUs, but also requires a coordinated effort from regional networks, commissioners, local authorities, families and other stakeholders to ensure the high standards are reached and variability in outcomes is reduced.
Where PDUs show under-performance by these measures, Trusts/Health Boards and Commissioners are urged to work with regional networks to ensure that clinical data are captured in their entirety, and to facilitate the submission of the most complete and accurate dataset to better ensure appropriate representation of PDU outcomes.
Key findings and Recommendations
The 2013/14 NPDA Care Processes and Outcomes report identifies some dramatic improvements in outcomes but also recognises significant inequalities in care across England and Wales, leaving some children and young people at serious risk of future complications and poorer quality of life. Below are the key findings and recommendations based on data submitted on 26,598 children and young people with diabetes cared for by PDUs.
HbA1c levels less than 58 mmol/mol indicate good glycaemic levels and as such are defined by NICE as excellent diabetes control. A very high HbA1c greater than 80 mmol/mol is defined as poor control and can be an indicator of serious lifetime risk of complications and action should be taken to improve it.
1. The percentage of children and young people achieving excellent diabetes control has increasedfrom 15.8% in 2012/13 to 18.4% in 2013/14, and the percentage with a very high HbA1c, hasdecreased from 25.9% in 2012/13 to 23.9% in 2013/14, a clinically significant change whenconsidering the large number of patients.
2. There has been a steady improvement in diabetes control, as measured by HbA1c, in Englandand Wales over the last four years. The national average HbA1c has fallen from 73.0 mmol/molin 2012/13 to 71.6 mmol/mol in 2013/14.

6
National Paediatric Diabetes Audit Report 2013-14
3. Better control is achieved in the first year following diagnosis (mean HbA1c 64.0 mmol/mol)compared to long term (77.6 mmol/mol after 10-14 years).
RecommendationThose providing care for children and young people with diabetes should continue to work with patients and their families to achieve the best possible level of HbA1c. Since this marker remains a strong indicator for risk of developing diabetic eye disease (retinopathy), kidney disease (nephropathy) and peripheral vascular disease (microvascular complications), action plans should be in place to optimise control throughout the lifespan of a person with diabetes.
Completion of all seven care processes is important as these act as constant measures of surveillance for potential complications. Early detection of complications allows action to be taken to reduce the risk of any further progression.
4. The completion rate for individual care processes has improved from previous years with morethan 98% of children and young people having their HbA1c measured in 2013/14. However, therate of recording of the other six care processes ranged from 45.0% for foot examination, 48.8%for urinary albumin, 51.9% for eye screening, 54.2% for cholesterol, 80.2% for blood pressureand 94.0% for height and weight.
5. The overall completion rate of all recommended seven care processes (HbA1c, height andweight, blood pressure, urinary albumin, cholesterol, eye screening and foot examination)remains unacceptably low. Only 16.1% of young people aged 12 years and older completed allseven key care processes, but this does show a steady improvement from 12.1% in 2012/13and 6.7% in 2011/12. There is significant variability in the completion rate of all seven careprocesses amongst regional networks and PDUs ranging from below 0% to 94.6%.
Recommendation All care processes completed should be recorded to provide the best possible measure of performance as per NICE recommendations. Commissioners and regional diabetes networks are urged to ensure PDUs have the resource to provide the consistent care in accordance with NICE standards.
Understanding of variability in diabetes control and outcomes related to differences in ethnicity and/or social deprivation is important as it helps PDUs and commissioners plan services around the ‘casemix’ to which they provide services.
6. White ethnic groups achieve better control of diabetes (mean HbA1c 71.7 mmol/mol) whencompared with all other ethnicities (mean HbA1c: Asian 74.2 mmol/mol; Black 78.4 mmol/mol;Mixed 75.6 mmol/mol).
7. Children and young people with diabetes living in the most deprived areas have worseoutcomes in terms of HbA1c than those living in the least deprived areas with a mean HbA1cof 74.7 mmol/mol as compared to 69.0 mmol/mol respectively.

7
National Paediatric Diabetes Audit Report 2013-14
8. Smoking status is recorded in just over two thirds of children and young people. Smoking inyoung people with diabetes is detrimental to outcomes and raises the risk of future complications.
RecommendationEthnicity and social deprivation clearly impacts on diabetes outcomes. PDUs and commissioners need to carefully consider their ‘casemix’ when allocating funding for the population to whom they provide diabetes services.
There needs to be a national networked approach to improving diabetes care with regional diabetes networks collaborating closely with local government, health and education bodies to develop education packages aimed at preventing and reducing smoking in all children and young people.
Thyroid and coeliac disease screening for children and young people with Type 1 diabetes is important because the risk of developing such diseases is increased in those with a pre-existing autoimmune condition. Furthermore, there is a clear treatment pathway if these conditions are identified.
9. Thyroid and coeliac disease screening, as recommended by NICE, is only being achieved inapproximately 50% of children and young people with diabetes.
RecommendationPDUs should ensure children and young people with diabetes are receiving appropriate screening for thyroid, coeliac and other disease associations.
Screening for microvascular complications (eye, kidney and foot disease) aims to detect early abnormalities that can potentially be reversed by improved glycaemic control. Long-term macrovascular complications (such as myocardial infarction resulting from atherosclerosis) are a significant cause of mortality and morbidity in adults with diabetes. Although macrovascular complications are rare in childhood, screening for the risk factors (cholesterol, blood pressure and obesity) are important as modification in these risk factors can prevent future adverse outcomes.
10. There are steady increases in microvascular abnormalities with increasing age with an alarming number of young people aged 12 years and above already showing early signs of complications from their diabetes: 7.1% of young people show increased risk of developing kidney disease in the future, although the proportion of young people with missing data was high (35.2%); 14.1% show early signs of increased risk of blindness.
11. An alarming number of young people with Type 1 diabetes have high blood pressure (27.5%),while 18.1% of children with Type 1 diabetes aged between 0-11 years, and almost a quarteraged over 12 years (23.2%), are obese. Hyperlipidaemia is also evident in childhood diabeteswith 16.1% of young people >12 years of age having a total cholesterol above the cut off limitof 5.0 mmol/l.

8
National Paediatric Diabetes Audit Report 2013-14
RecommendationThere should be a clear emphasis on improving blood glucose control. Achieving this will reduce the future risk and progression of complications of diabetes.
Psychological assessment by multidisciplinary teams of children and young people’s emotional and behavioural needs is recommended by NICE. Timely intervention is important to avoid co-morbidity from depression, eating disorders or drug taking.
12. Assessment for expert psychological review is undertaken in fewer than 50% of children andyoung people with diabetes.
Recommendation PDUs should ensure an adequate annual screening process is in place to identify those needing expert psychological assessment. NICE recommends timely referral for psychology support.
Age appropriate Structured Patient Education Programmes are recommended by NICE for the on-going management of children and young people with diabetes. Currently there is no nationally agreed Structured Education Programme for children and young people, yet there are many examples of good practice across England and Wales.
13. The 2013/14 audit demonstrates that 45.2% are receiving some form of structured educationsteadily on an annual basis but there is considerable regional variability in this number rangingfrom 11.1% in the South West to 62.0% in the North West. The quality and completeness of thedata entry in this field was poor, with 45.0% of data missing. Further investigation by this auditis required for more accurate assessment.
Recommendation Managing blood glucose levels and other risk associated outcomes such as blood pressure and cholesterol are a challenging balancing act for children, young people and parents, which impacts on relationships, emotions, health and well-being. Yet less than half of children and young people have access to Structured Education Programmes and there is limited access to psychological assessment when required.
Regional diabetes networks should explore options for developing regional and national Structured Education Programmes to help avoid such wide variability in treatment target outcomes and ensure every child and young person with diabetes receives optimal care wherever they live.
9
National Paediatric Diabetes Audit Report 2013-14
Conclusion
While overall there are some very positive improvements in the quality of care and outcomes demonstrated within this NPDA report for England and Wales 2013/14, the clear variability of care which exists across the country urgently needs addressing at both regional and local level.
The National Service Framework (NSF) for diabetes in England and Wales recommends an integrated approach to the planning of local diabetes services including managed diabetes networks and supporting links with commissioners.
The NPDA covers a crucial component of this framework. By benchmarking levels of care against standards set by clinical guidelines, the NPDA provides a context for coordinated action planning and quality improvement.
Since 2012, the Best Practice Tariff in England, supported by the Peer Review process has helped make paediatric diabetes a commissioning priority and been the driving force behind 100% participation in the NPDA. As the programme of peer review comes to an end in 2015, it is vital that lessons from the previous two years are captured in order to support participation and excellence of care. Ongoing quality improvement will require the continuation of adequate service funding, effectively managed clinical networks and a robust quality surveillance programme.
10
National Paediatric Diabetes Audit Report 2013-14
2. IntroductionDiabetes mellitus is a chronic disorder where the amount of glucose in your blood is too high because the body cannot use it properly. The prevalence of diabetes increases with age. A small number of children and young people with diabetes have Type 2 diabetes, whilst the vast majority have Type 1 diabetes. In fact, Type 1 diabetes accounts for more than 95% of diabetes in children and young people. Diabetes is slightly more prevalent in males than females (199.8 versus 175.3 per 100,000 respectively). The prevalence and incidence of Type 1 diabetes in children and young people is greatest in the teenage years (prevalence 345.1 per 100,000 aged 10-14 years versus 45.2 per 100,000 aged 0-4 years and incidence of new cases is 31.1 per 100,000 aged 10-14 years versus 12.1 per 100,000 aged 0-4 years). It is alarming that HbA1c levels remain high in the UK as compared with some other European countries, when it is known that this is a strong indicator of later micro and macrovascular risk.
The NPDA analyses routinely collected clinical data which measures care processes against predefined priority clinical standards recommended by the National Institute of Health and Care Excellence (NICE), and makes recommendations for quality improvement. The NPDA specifically uses the CG15, Type 1 diabetes: Diagnosis and management of Type 1 diabetes in children, young people and adults and this report covers the care process and outcome data only, with complications data to follow in a separate report.
Paediatric Diabetes Units (PDUs) can be defined as clinics, hospital wards, hospital departments and any other hospital unit diagnosing and treating children and young people with diabetes. This year the NPDA has made several recommendations to PDUs to encourage best practice and good care for paediatric diabetes. In addition, as part of the quality assurance programme (peer review), every Trust in England and Health Board in Wales was requested to set up a Paediatric Diabetes Management Group. This group is to be responsible for ensuring the coordination and development of care for children and young people who attend the PDU. It should report back to the provider Trust’s clinical governance and/or care quality board.
Scope of the 2013/14 National Paediatric Diabetes Audit Report
The NPDA is an analysis of data provided by healthcare professionals caring for children and young people with diabetes mellitus in England and Wales. This 2013/14 report covers the care processes and outcomes for children and young people with diabetes who have attended PDUs during the period from 1st April 2013 through to 31st March 2014. While important to acknowledge improvements in diabetes care made during this period, this audit also aims to highlight deficits in care and make specific recommendations to commissioners of health services, regional diabetes

11
National Paediatric Diabetes Audit Report 2013-14
networks, as well as to paediatric diabetes units to address the paucity of data for all seven key care processes and the clear inequalities across England and Wales.
Key audit questions
The report aims to address a series of questions relating to paediatric diabetes care which include:
• How many children and young people in England and Wales receive their diabetes carefrom a PDU?
• What proportion of children and young people with diabetes are receiving the key age-specificprocesses of diabetes care, as recommended by NICE?
• How many achieve outcome measures within specified treatment targets and how thischanges with subsequent audits?
• Are children and young people with diabetes demonstrating evidence of microvascularand/or macrovascular complications prior to transition into adult services?
Participation
The cohort group for this 2013/14 audit consists of 26,687 children and young people up to the age of 25 years with diabetes receiving care from all 177 PDUs in England and Wales. The numbers have increased compared to 2012/13 when the cohort consisted of 25,221. There was an increase in numbers across all ages, suggesting that there has been a true increase in the numbers of children and young people with diabetes, as opposed to increases due to changes in transitional age policies. This shift appears to represent either a greater number of children with diabetes, or an improved quality of data submission. Although participation was high, the data quality in some fields was poor. This report sets out issues for clinical practice and data quality to encourage completeness and accuracy.
Diabetes Audits
The National Diabetes Audit (NDA) for adults (National Diabetes Audit, Health & Social Care Information Service) reports on the provision of core diabetes care for everyone with diabetes. This provides commissioners with age, ethnicity and social deprivation-related perspectives across the whole population for which they are responsible. The NDA also reports to participating individual General Practices and adult specialist services, allowing them to benchmark their care against their peers. The NPDA reports separately to individual participating PDUs regarding their provision of diabetes care for the children and young people attending their services. Those reviewing the NDA and NPDA reports side-by-side need to be aware of these differences but, equally, those

12
National Paediatric Diabetes Audit Report 2013-14
wanting to get the most complete picture of local needs and service provision should consider the two reports together**
Using this report
Clinical audits are an essential part of the process for improving the quality of paediatric diabetes care. This report is publicly available and will provide useful information for clinical staff, healthcare managers, commissioners, children and young people with diabetes and their families. By collecting data from all 177 PDUs across England and Wales, the NPDA provides a solid foundation for quality improvement, prioritising the standards of care for paediatric diabetes in England and Wales, as recommended by NICE.
Throughout this report reference is made to variation in outcomes which needs to be addressed. Outcome variation can be associated with variation in expenditure in the current system of care and there is inequity of service provision to children, young people and their families, potentially stalling improvement in health outcomes. This variation in quality of care inevitably results in a variation in outcomes.
The Peer Review Quality Surveillance Programme was set up to examine variation in more detail and just as importantly, was designed to identify good practice and disseminate this widely. The regional diabetes networks are the ideal way of ensuring that individual PDUs scrutinise the content of their peer review reports and their performance as outlined in this audit report. Used together, they have provided valuable information for every multidisciplinary team member to
** Because the care of adults and children with diabetes is mixed between GP services (this includes ALL patients) and hospital, paediatric and community specialist services (these each include SOME patients), the different ‘views’ that the two national audits NDA and NPDA give to the providers of the services will inevitably include overlapping patients. Thus someone with diabetes attending a specialist service should also appear in the relevant GP report. The NDA integrates data from participating specialist and GP services for adults with diabetes so that if a care process or treatment target is recorded by one but not the other both get the complete data reported back to them i.e. a ‘whole person’ view. This makes sense because it reflects the fact that there is no clinical value in duplicating something carried out elsewhere. The population level NDA reports include all people with diabetes in a geographical area irrespective of their mix of provider services and use integrated data where they are available.
The NPDA runs independently of the NDA and of GP services so its data are not integrated making it possible that GP reports do not include all care processes or treatment targets measured in specialist paediatric units and vice versa. Specialist paediatric diabetes units are primarily responsible for the care of most children and young people with diabetes and for the collection of their care process and outcome data. Although GPs do not provide the majority of care for children and young people living with diabetes they do prescribe all their medications. Therefore it is in this age group, and also adults with Type 1 or complex diabetes that attend specialist services not participating in NDA, where lack of data integration is most likely to result in a slightly deficient ‘whole systems’ view. Furthermore, for under-17s, the age cut-off for the QOF GP incentive scheme means that there is no financial value to the practice in replicating results from external services. Nonetheless, because less than 10% of all people with Type 1 diabetes, and less than 1% of people with diabetes in general are under 17 years old, the overall impact on population level NDA results is minimal.
The NDA report, entitled “National Diabetes Audit – 2012-2013: Report 1, Care Processes and Treatment Targets” was published on 02 October 2014. This is now available from the Health and Social Care information Centre and can be found online at http://www.hscic.gov.uk/searchcatalogue?productid=15512&q=%22National+diabetes+audit%22&sort=Relevance&size=10&page=1#top

13
National Paediatric Diabetes Audit Report 2013-14
plan for improving outcomes for their patients. In addition, hospital managers have had the individual responsibility to support PDUs by investing in Best Practice Tariff for the Children and Young People’s Diabetes teams by recruiting adequate staff and supporting their continuous personal development. Since the Peer Review Quality Surveillance Programme in its current form is discontinuing, teams will now need to find other means of sharing best practice to minimise variation and improve outcomes.
Regional networks and PDUsPatient HbA1c outcome data should be scrutinised and funnel plots utilised to benchmark against other units.
Where HbA1c outlier status is identified within a PDU, measures should be taken to explore the possible reasons and a work plan put in place to rectify the situation.
Managers and CommissionersThe results from this report should be discussed at Trust/Health Board wide Management Groups as part of ongoing quality assurance programmes to ensure units within your Trust have the resources and planning in place to keep step with provision of national standards of care.
Data completeness
Over the four years that the RCPCH have been responsible for delivering the NPDA, there has been a slow but steady improvement in both the quality and completeness of data submitted. However, there is also considerable variability across PDUs with respect to their ability to resource adequate IT systems to collect and submit accurate data during the audit year. NPDA results are utilised by commissioners to measure performance and paediatric diabetes units are urged to improve the completeness of their record-keeping and data completeness to ensure it reflects their practice.
Units should ensure that all seven key care processes are performed and recorded in young people 12 years and above. NPDA recommends that PDUs ensure accurate submission of data as non-submission to the audit is interpreted as ‘not done’. Negative outlier status (outside the 95% significance limits) can be identified from the funnel plots in this report and action should be taken by PDUs to improve.

14
National Paediatric Diabetes Audit Report 2013-14
3. Coverage of audit: Prevalence and incidence
Summary
A total of 26,598 children and young people with diabetes were included in the 2013/14 NPDA. The prevalence and incidence of Type 1 diabetes is highest amongst the secondary school age group and varies across regions and countries. There are differences in prevalence and incidence of Type 1 and Type 2 diabetes amongst different ethnic groups and by deprivation quintile.
RecommendationPDUs and commissioners should consider this variability when allocating resource to reflect this difference across age, ethnic and social groups.
3.1 Characteristics of children and young people with diabetes
The cohort group for this audit was 26,687 children and young people aged between 0 and 25 years with diabetes receiving care from all 177 PDUs in England and Wales – a 100% PDU participation rate. There were a total of 121,487 records submitted for 26,687 patients. Records that could not be allocated to a registered PDU (four records, three people), without a valid or consistent date of birth (407 records, 87 people) or relating to people aged 25 years or older (four records, one person) were excluded. After data cleaning there were 121,072 records relating to 26,598 children and young people with diabetes from 177 PDUs in England and Wales.
A total of 26,598 children and young people with diabetes were included in the 2013/14 audit. This is an increase of 1,377 on the number submitted and included in the 2012/13 audit. The increase in children and young people included in the 2013/14 audit is distributed evenly across the age groups and therefore appears to represent either an increase in numbers of children with diabetes or an improved quality of data submission rather than any increase due to changes in transitional age. Table 1 provides a breakdown of submissions to the audit by country, region and age and Table 2 by age, sex and type of diabetes. The vast majority (95.3%) have Type 1 diabetes and a further 1.9% has Type 2 diabetes. 0.9% of children and young people submitted to the audit did not have any information about their type of diabetes. The low levels in the category aged 20 years and above is due to young people transitioning to adult services.

15
National Paediatric Diabetes Audit Report 2013-14
Table 1: Number of children and young people included in the audit by country, region and age, 2013/14
Aged 0-4 years
Aged 5-9 years
Aged 10-14 years
Aged 15-19 years
Aged 20-24 years
Total
England and Wales 1,689 5,523 11,322 8,025 39 26,598
England 1,598 5,209 10,643 7,618 + 25,105
Wales 91 314 679 407 + 1,493
East Midlands 134 439 965 545 + 2,086
East of England 187 614 1,255 994 6 3,056
London 220 742 1,251 964 + 3,180
North East 56 190 456 314 0 1,016
North West 220 723 1,473 903 10 3,329
South East 258 833 1,734 1,218 7 4,050
South West 159 533 1,117 783 + 2,595
West Midlands 161 511 1,107 869 + 2,649
Yorkshire and The Humber
164 511 1,058 827 + 2,562
Unable to allocate to region*
39 113 227 201 + 582
*Due to no valid postcode or an unidentifiable postcode, + data suppressed due to small numbers
Table 2: Number of children and young people included in the audit by age, sex and type of diabetes, 2013/14
Type 1 diabetes
Type 2 diabetes
Cystic fibrosis related
diabetes
Monogenic types of diabetes
Other specified diabetes
Not specified diabetes
Type of diabetes missing
All types
Females
0-4 years 755 0 0 6 9 14 7 791
5-9 years 2,621 7 + 8 12 32 13 2,698
10-14 years 5,244 146 28 17 33 45 20 5,533
15-19 years 3,411 185 35 14 33 34 25 3,737
20-24 years 19 + 0 0 0 0 0 21
All ages 12,050 340 68 45 87 125 65 12,780
Males
0-4 years 864 + 0 8 + + 7 894
5-9 years 2,734 0 + 9 11 32 16 2,881
10-14 years 5,585 64 16 12 24 46 19 5,766
15-19 years 4,054 98 22 18 19 28 27 4,266
20-24 years 17 + 0 0 0 0 0 18
All ages 1,3254 164 47 47 55 119 69 13,755
Unallocated* All ages 53 + 0 0 0 + + 63
Total 25,357 507 115 92 142 248 137 26,598
*Due to no gender information provided, + data suppressed due to small numbers

16
National Paediatric Diabetes Audit Report 2013-14
Table 3 shows the breakdown of Type 1 and Type 2 diabetes by ethnic group. The majority (72.0%) of children and young people with Type 1 diabetes are from White ethnic groups. However, only 36.5% of children and young people with Type 2 diabetes receiving care in PDUs are from White ethnic groups with 26.0% from Asian ethnic groups, 6.1% from Mixed ethnic groups and 5.5% from Black ethnic groups. The distribution of children and young people with Type 1 diabetes by ethnic group (Table 3) reflects the ethnic group distribution in the general population for this age group although there is much variation across the regions. Further information on the prevalence and incidence of Type 1 diabetes by ethnic group is provided later in the report.
Whilst the percentage of children and young people where the information on ethnic group is missing is low (2.0% for those with Type 1 diabetes and 3.2% for those with Type 2 diabetes) the proportion of people in the ‘Not Stated’ category is relatively high. The category ‘Not Stated’ should be used when the individual has been asked for and declined to provide information about their ethnic group. The use of this category is low in Wales and the East Midlands but remains high in the other regions of England (Table 4).
Type 1 diabetes Type 2 diabetes
White 18,253 (72%) 185 (36.5%)
Mixed 637 (2.5%) 31 (6.1%)
Asian 1,233 (4.9%) 132 (26.0%)
Black 425 (1.7%) 28 (5.5%)
Other 359 (1.4%) 18 (3.6%)
Not stated 3,949 (15.6%) 97 (19.1%)
Unallocated ethnic group* 501 (2%) 16 (3.2%)
Table 4: Ethnic group of children and young people with Type 1 by country and region, 2013/14
Table 3: Ethnic group of children and young people with Type 1 and Type 2 diabetes, 2013/14
*Ethnic group not provided or unidentifiable
White Mixed Asian Black Other Not stated Missing ethnic group
England and Wales 18,253 (72%) 637 (2.5%) 1,233 (4.9%) 425 (1.7%) 359 (1.4%) 3,949 (15.6%) 501 (2%)
England 16,884 (70.6%) 621 (2.6%) 1,216 (5.1%) 422 (1.8%) 353 (1.5%) 3,909 (16.4%) 499 (2.1%)
Wales 1,369 (94.2%) 16 (1.1%) 17 (1.2%) + 6 (0.4%) 40 (2.8%) +
East Midlands 1,746 (86.4%) 42 (2.1%) 110 (5.4%) 19 (0.9%) 14 (0.7%) 84 (4.2%) +
East of England 1,959 (68%) 68 (2.4%) 84 (2.9%) 16 (0.6%) 21 (0.7%) 624 (21.7%) 108 (3.8%)
London 1,174 (39.3%) 217 (7.3%) 399 (13.4%) 300 (10%) 166 (5.6%) 528 (17.7%) 203 (6.8%)
North East 641 (64.7%) 6 (0.6%) 7 (0.7%) + + 335 (33.8%) 0 (0%)
North West 2,476 (77.9%) 37 (1.2%) 161 (5.1%) 26 (0.8%) 35 (1.1%) 441 (13.9%) +
South East 2,902 (75.7%) 75 (2%) 85 (2.2%) 12 (0.3%) 26 (0.7%) 581 (15.2%) 151 (3.9%)
South West 2,122 (84.4%) 38 (1.5%) 18 (0.7%) 18 (0.7%) 9 (0.4%) 296 (11.8%) 14 (0.6%)
West Midlands 1,687 (67%) 63 (2.5%) 149 (5.9%) 11 (0.4%) 55 (2.2%) 549 (21.8%) +
Yorkshire and The Humber 1,781 (72.8%) 63 (2.6%) 156 (6.4%) 15 (0.6%) 20 (0.8%) 404 (16.5%) 6 (0.2%)
Unknown region of residence 396 (73.6%) 12 (2.2%) 47 (8.7%) + 6 (1.1%) 67 (12.5%) +
+ Data suppressed due to small numbers

17
National Paediatric Diabetes Audit Report 2013-14
Deprivation index can be derived from postcode using indices of Multiple Deprivation 2010 for England, and Welsh Indices of Multiple Deprivation 2008 for Wales. Although these two countries use slightly differing indices to define deprivation, adjustment can be made to align the two techniques (Payne and Babel, 2012). Table 5 shows the breakdown by deprivation quintile for Type 1 and Type 2 diabetes for England and Wales. Whereas Type 1 diabetes is equally distributed across the deprivation quintiles, there is a clear gradient in distribution for Type 2 diabetes with a greater proportion coming from the most deprived areas compared to the least deprived.
3.2 Prevalence and Incidence of Type 1 diabetes
The aim of this section is to provide a wider context for understanding NPDA data and how the results can be used by PDUs and commissioners to drive quality improvement in paediatric diabetes services. Prevalence relates to the actual number of cases of diabetes and incidence is the rate of newly diagnosed cases of diabetes. These data can be used to support quality improvement with areas of high prevalence and incidence benchmarking themselves against areas of incidence and the corresponding levels of care. Resources and funding would need to be distributed for improved and equal care in the more prevalent areas.
Data on the total number of children and young people with Type 1 diabetes and the number of individuals diagnosed within the audit period (1st April 2013 to 31st March 2014) can be combined with population estimates to give the prevalence and incidence of Type 1 diabetes. In this case, an individual may live in one region but receive care from a PDU in another region. In this section children and young people with Type 1 diabetes have been allocated to regions based on their home postcode. Clearly, incidence and prevalence do not always relate to the same PDU and therefore incidence can strain services outside of the area of prevalence. An understanding of regional differences in prevalence and incidence is important since allocation of resource and funding should be correlated with demand, because this impacts on services.
Type 1 diabetes Type 2 diabetes
Most deprived 5,173 (20.9%) 204 (42.3%)
2nd most deprived 4,863 (19.6%) 125 (25.9%)
3rd most deprived 4,841 (19.5%) 73 (15.1%)
2nd least deprived 4,845 (19.5%) 52 (10.8%)
Least deprived 5,088 (20.5%) 28 (5.8%)
Table 5: Deprivation score of home post code of children and young people, 2013/14

18
National Paediatric Diabetes Audit Report 2013-14
3.2.1 Prevalence of Type 1 diabetes
The prevalence of Type 1 diabetes in children and young people cared for in PDUs in England and Wales is 187.7 per 100,000 (Table 6). The lowest prevalence of Type 1 diabetes is in the London region whereas the highest prevalence is in Wales and the South West, with variation across the regions.
Table 6: Prevalence per 100,000 of Type 1 diabetes aged 0 to 15 years by country and region 2013/14
Females Males All
Number Prevalence Number Prevalence Number Prevalence
England and Wales 9,663 175.3 10,495 199.8 20,200 187.7
England 9,069 173.5 9,869 198.1 18,978 185.9
Wales 594 208.6 626 231.5 1,222 220.1
East Midlands 819 188.8 903 217.4 1,723 202.9
East of England 1,065 184.0 1,157 209.9 2,229 197.2
London 1,220 140.4 1,188 143.0 2,413 141.9
North East 371 156.2 430 190.8 805 173.9
North West 1,291 188.8 1,408 216.4 2,702 202.5
South East 1,477 171.6 1,622 198.9 3,106 185.3
South West 928 192.4 1,114 242.4 2,046 217.2
West Midlands 928 163.5 1,042 193.1 1,977 178.6
Yorkshire and The Humber 970 188.8 1,005 203.7 1,977 196.3
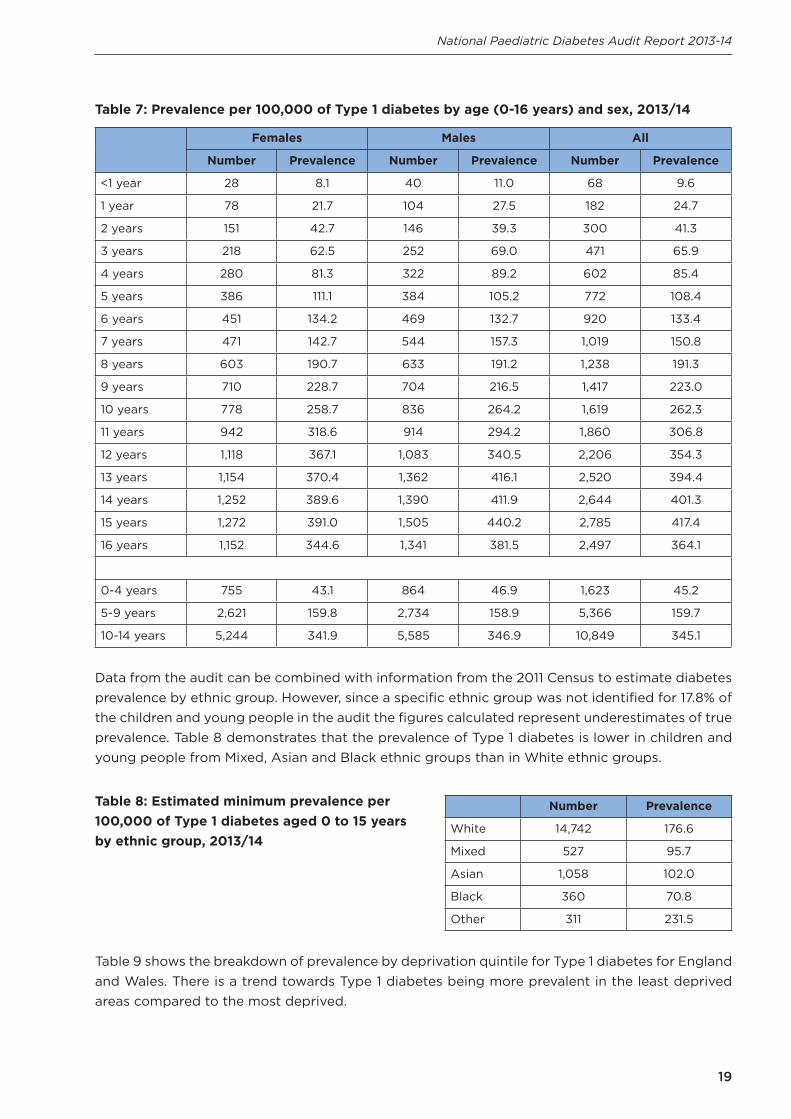
Table 7 shows how the prevalence of Type 1 diabetes increases with age. Among children aged 0 to 4 years old the prevalence of Type 1 diabetes is 45.2 per 100,000 but it increases to 345.1 per 100,000 amongst those aged 10 to 14 years old. The slight decline between the ages of 15 and 16 years could reflect the start of young people transitioning to adult diabetes services. At most ages the prevalence of Type 1 diabetes is higher among males than females.
19
National Paediatric Diabetes Audit Report 2013-14
Table 7: Prevalence per 100,000 of Type 1 diabetes by age (0-16 years) and sex, 2013/14
Females Males All
Number Prevalence Number Prevalence Number Prevalence
<1 year 28 8.1 40 11.0 68 9.6
1 year 78 21.7 104 27.5 182 24.7
2 years 151 42.7 146 39.3 300 41.3
3 years 218 62.5 252 69.0 471 65.9
4 years 280 81.3 322 89.2 602 85.4
5 years 386 111.1 384 105.2 772 108.4
6 years 451 134.2 469 132.7 920 133.4
7 years 471 142.7 544 157.3 1,019 150.8
8 years 603 190.7 633 191.2 1,238 191.3
9 years 710 228.7 704 216.5 1,417 223.0
10 years 778 258.7 836 264.2 1,619 262.3
11 years 942 318.6 914 294.2 1,860 306.8
12 years 1,118 367.1 1,083 340.5 2,206 354.3
13 years 1,154 370.4 1,362 416.1 2,520 394.4
14 years 1,252 389.6 1,390 411.9 2,644 401.3
15 years 1,272 391.0 1,505 440.2 2,785 417.4
16 years 1,152 344.6 1,341 381.5 2,497 364.1
0-4 years 755 43.1 864 46.9 1,623 45.2
5-9 years 2,621 159.8 2,734 158.9 5,366 159.7
10-14 years 5,244 341.9 5,585 346.9 10,849 345.1
Data from the audit can be combined with information from the 2011 Census to estimate diabetes prevalence by ethnic group. However, since a specific ethnic group was not identified for 17.8% of the children and young people in the audit the figures calculated represent underestimates of true prevalence. Table 8 demonstrates that the prevalence of Type 1 diabetes is lower in children and young people from Mixed, Asian and Black ethnic groups than in White ethnic groups.
Number Prevalence
White 14,742 176.6
Mixed 527 95.7
Asian 1,058 102.0
Black 360 70.8
Other 311 231.5
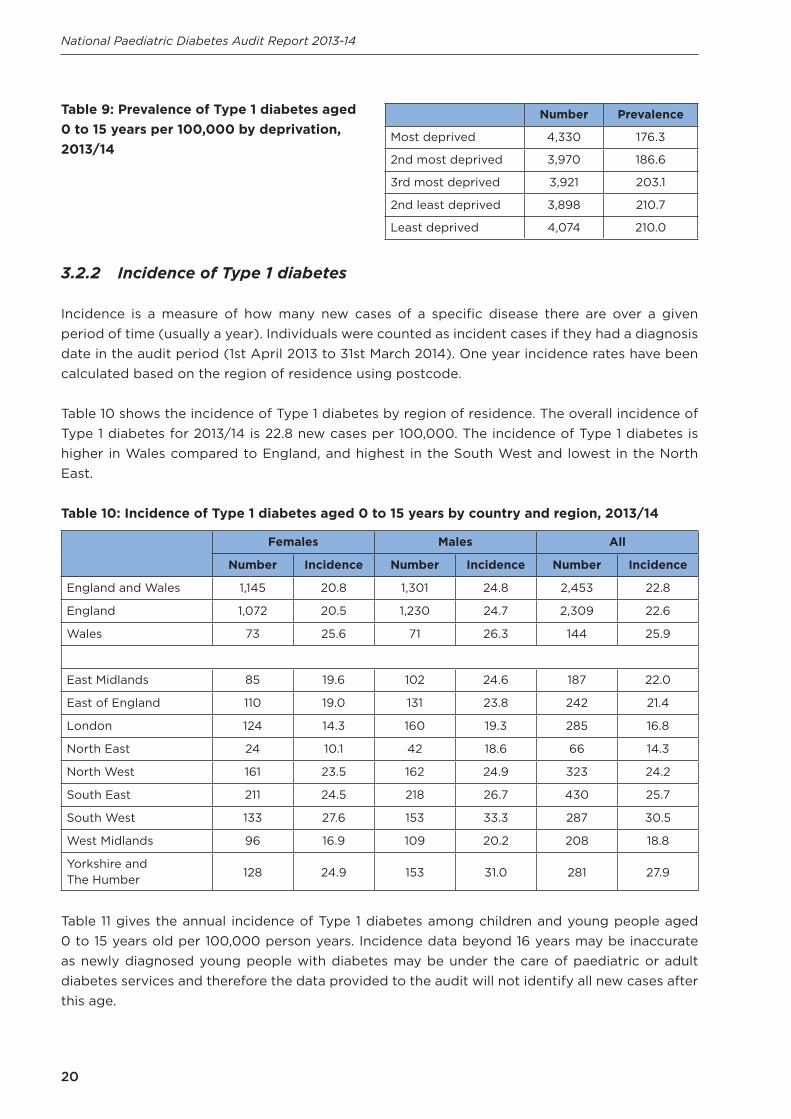
Table 9 shows the breakdown of prevalence by deprivation quintile for Type 1 diabetes for England and Wales. There is a trend towards Type 1 diabetes being more prevalent in the least deprived areas compared to the most deprived.
Table 8: Estimated minimum prevalence per 100,000 of Type 1 diabetes aged 0 to 15 years by ethnic group, 2013/14
20
National Paediatric Diabetes Audit Report 2013-14
Table 9: Prevalence of Type 1 diabetes aged 0 to 15 years per 100,000 by deprivation, 2013/14
Number Prevalence
Most deprived 4,330 176.3
2nd most deprived 3,970 186.6
3rd most deprived 3,921 203.1
2nd least deprived 3,898 210.7
Least deprived 4,074 210.0
3.2.2 Incidence of Type 1 diabetes
Incidence is a measure of how many new cases of a specific disease there are over a given period of time (usually a year). Individuals were counted as incident cases if they had a diagnosis date in the audit period (1st April 2013 to 31st March 2014). One year incidence rates have been calculated based on the region of residence using postcode.
Table 10 shows the incidence of Type 1 diabetes by region of residence. The overall incidence of Type 1 diabetes for 2013/14 is 22.8 new cases per 100,000. The incidence of Type 1 diabetes is higher in Wales compared to England, and highest in the South West and lowest in the North East.
Table 10: Incidence of Type 1 diabetes aged 0 to 15 years by country and region, 2013/14
Females Males All
Number Incidence Number Incidence Number Incidence
England and Wales 1,145 20.8 1,301 24.8 2,453 22.8
England 1,072 20.5 1,230 24.7 2,309 22.6
Wales 73 25.6 71 26.3 144 25.9
East Midlands 85 19.6 102 24.6 187 22.0
East of England 110 19.0 131 23.8 242 21.4
London 124 14.3 160 19.3 285 16.8
North East 24 10.1 42 18.6 66 14.3
North West 161 23.5 162 24.9 323 24.2
South East 211 24.5 218 26.7 430 25.7
South West 133 27.6 153 33.3 287 30.5
West Midlands 96 16.9 109 20.2 208 18.8
Yorkshire and The Humber 128 24.9 153 31.0 281 27.9
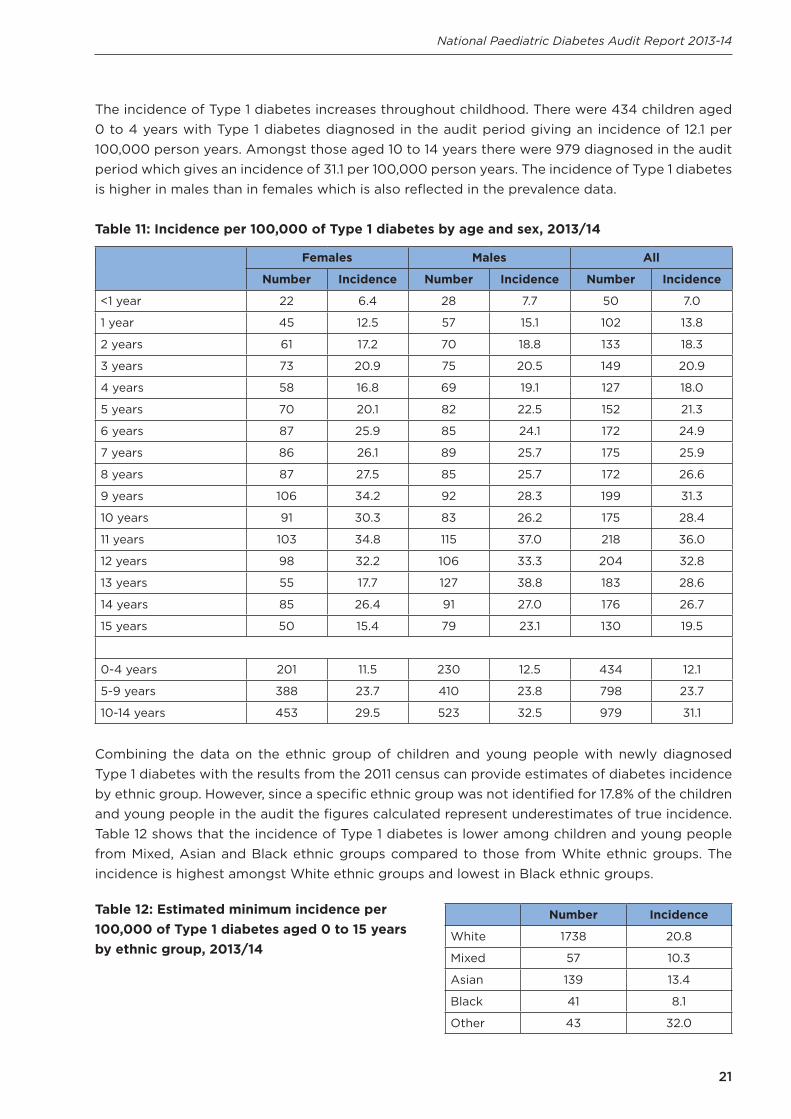
Table 11 gives the annual incidence of Type 1 diabetes among children and young people aged 0 to 15 years old per 100,000 person years. Incidence data beyond 16 years may be inaccurate as newly diagnosed young people with diabetes may be under the care of paediatric or adult diabetes services and therefore the data provided to the audit will not identify all new cases after this age.
21
National Paediatric Diabetes Audit Report 2013-14
The incidence of Type 1 diabetes increases throughout childhood. There were 434 children aged 0 to 4 years with Type 1 diabetes diagnosed in the audit period giving an incidence of 12.1 per 100,000 person years. Amongst those aged 10 to 14 years there were 979 diagnosed in the audit period which gives an incidence of 31.1 per 100,000 person years. The incidence of Type 1 diabetes is higher in males than in females which is also reflected in the prevalence data.
Table 11: Incidence per 100,000 of Type 1 diabetes by age and sex, 2013/14
Females Males All
Number Incidence Number Incidence Number Incidence
<1 year 22 6.4 28 7.7 50 7.0
1 year 45 12.5 57 15.1 102 13.8
2 years 61 17.2 70 18.8 133 18.3
3 years 73 20.9 75 20.5 149 20.9
4 years 58 16.8 69 19.1 127 18.0
5 years 70 20.1 82 22.5 152 21.3
6 years 87 25.9 85 24.1 172 24.9
7 years 86 26.1 89 25.7 175 25.9
8 years 87 27.5 85 25.7 172 26.6
9 years 106 34.2 92 28.3 199 31.3
10 years 91 30.3 83 26.2 175 28.4
11 years 103 34.8 115 37.0 218 36.0
12 years 98 32.2 106 33.3 204 32.8
13 years 55 17.7 127 38.8 183 28.6
14 years 85 26.4 91 27.0 176 26.7
15 years 50 15.4 79 23.1 130 19.5
0-4 years 201 11.5 230 12.5 434 12.1
5-9 years 388 23.7 410 23.8 798 23.7
10-14 years 453 29.5 523 32.5 979 31.1
Combining the data on the ethnic group of children and young people with newly diagnosed Type 1 diabetes with the results from the 2011 census can provide estimates of diabetes incidence by ethnic group. However, since a specific ethnic group was not identified for 17.8% of the children and young people in the audit the figures calculated represent underestimates of true incidence. Table 12 shows that the incidence of Type 1 diabetes is lower among children and young people from Mixed, Asian and Black ethnic groups compared to those from White ethnic groups. The incidence is highest amongst White ethnic groups and lowest in Black ethnic groups.
Number Incidence
White 1738 20.8
Mixed 57 10.3
Asian 139 13.4
Black 41 8.1
Other 43 32.0
Table 12: Estimated minimum incidence per 100,000 of Type 1 diabetes aged 0 to 15 years by ethnic group, 2013/14
22
National Paediatric Diabetes Audit Report 2013-14
Table 13: Incidence of Type 1 diabetes aged 0 to 15 years per 100,000 by deprivation, 2013/14
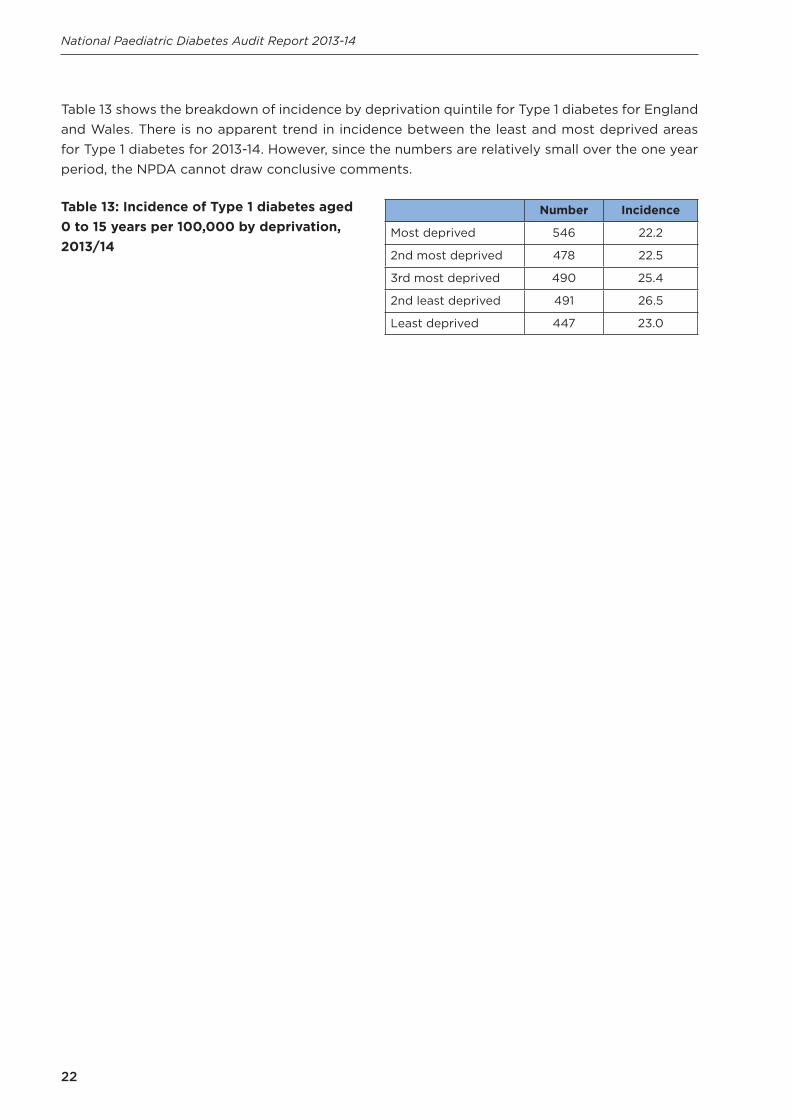
Table 13 shows the breakdown of incidence by deprivation quintile for Type 1 diabetes for England and Wales. There is no apparent trend in incidence between the least and most deprived areas for Type 1 diabetes for 2013-14. However, since the numbers are relatively small over the one year period, the NPDA cannot draw conclusive comments.
Number Incidence
Most deprived 546 22.2
2nd most deprived 478 22.5
3rd most deprived 490 25.4
2nd least deprived 491 26.5
Least deprived 447 23.0

23
National Paediatric Diabetes Audit Report 2013-14
4. Completion of care processes
Audit Question: What proportion of children and young people with diabetes are receiving the key age-specific processes of diabetes care as recommended by the National Institute for Health and Care Excellence (NICE Clinical Guidelines – CG15: Type 1 diabetes)?
Summary
The completion rate for individual care processes has improved compared to previous years with more than 98% of children and young people having their HbA1c measured in 2013/14. However, the rate of recording of the other six care processes ranged from 45.0% for foot examination, 48.8% for urinary albumin, 51.9% for eye screening, 54.2% for cholesterol, 80.2% for blood pressure and 94.0% for height and weight. The overall completion rate of all recommended seven care processes (HbA1c, height and weight, blood pressure, urinary albumin, cholesterol, eye screening and foot examination) remains unacceptably low. Only 16.1% of young people aged 12 years and older complete all seven key care processes, but this does show a steady improvement from 12.1% in 2012/13 and 6.7% in 2011/12. There is significant variability in the completion rate of all seven care processes amongst regional networks and PDUs ranging from below 0% to 94.6%.
• Thyroid and coeliac disease screening, as recommended by NICE, is only being achievedin approximately half of children and young people with diabetes.
• Smoking status is recorded in just over two thirds of children and young people. Smokingin young people with diabetes is detrimental to outcomes and raises the risk of futurecomplications
• Assessment for expert psychological review is undertaken in fewer than half of childrenand young people with diabetes.
Recommendation All care processes completed should be recorded to provide the best possible measure of performance as per NICE recommendations. Commissioners and regional diabetes networks are urged to ensure PDUs have the resource to provide the consistent care in accordance with NICE standards. PDUs should ensure children and young people with diabetes are receiving appropriate screening for thyroid, coeliac and other disease associations. Local government, health and education bodies need to continue to develop education packages aimed at preventing and reducing smoking in all children and young people. PDUs should ensure an adequate annual screening process is in place to identify those needing expert psychological assessment. NICE recommends timely referral for psychology support.

24
National Paediatric Diabetes Audit Report 2013-14
4.1 Completion of the seven key care processes
The NPDA collects information on the key care processes, recommended by NICE for children and young people with diabetes (Clinical Guidelines – CG15: Type 1 diabetes). The NPDA measures the percentage of children and young people with diabetes who are receiving the seven key processes of care which include:
• Glycated Haemoglobin A1c (HbA1c)• Body Mass Index (BMI) (both height and weight being recorded at the same time)• Blood pressure• Urinary albumin• Cholesterol• Eye screening• Foot examination
Key care processes are recorded to monitor diabetes management and detect long-term complications at the earliest treatable stage. Guidelines specify a starting age of 12 years for commencing all care processes with the exception of HbA1c, which should be recorded in children and young people of all ages. The Individualised PDU Aggregated Data 2013-14, available on the RCPCH webpages, shows how each PDU performs in delivering the seven care processes. The data is shown for each PDU against the seven care processes. This would help the PDUs identify under-performance and under-compliance.
The analysis in this section does not include young people with diabetes who transitioned into adult services during the audit period. The audit data will not capture the full set of care received over the 12 months by these individuals. Children and young people who were diagnosed during the audit period, those without a valid diagnosis date and those who died in the audit period are also excluded. Analysis of care processes was carried out on data for 22,550 children and young people with diabetes.
Nine children and young people with diabetes received care in both England and Wales, where care is the same between the two countries, during the audit period whilst 93 received care in more than one region. 258 children and young people received care from more than one PDU in the audit period. This means that the sum of the country, regional and PDU level data will not match exactly the data presented for England and Wales. Regional data relating to the care processes is based on the location of the PDU in which the children and young people received their care (not region of residence).
Table 14 sets out the percentage of children and young people who have received each of the specified care processes. Nearly all (98.3%) children and young people had at least one valid HbA1c reported in the audit period and 94% had one or more valid body mass index (height and weight) measurement. With the exception of urinary albumin tests in those aged 12 years or older at the start of the audit the percentage of children receiving each of the care processes in 2013/14 has
25
National Paediatric Diabetes Audit Report 2013-14
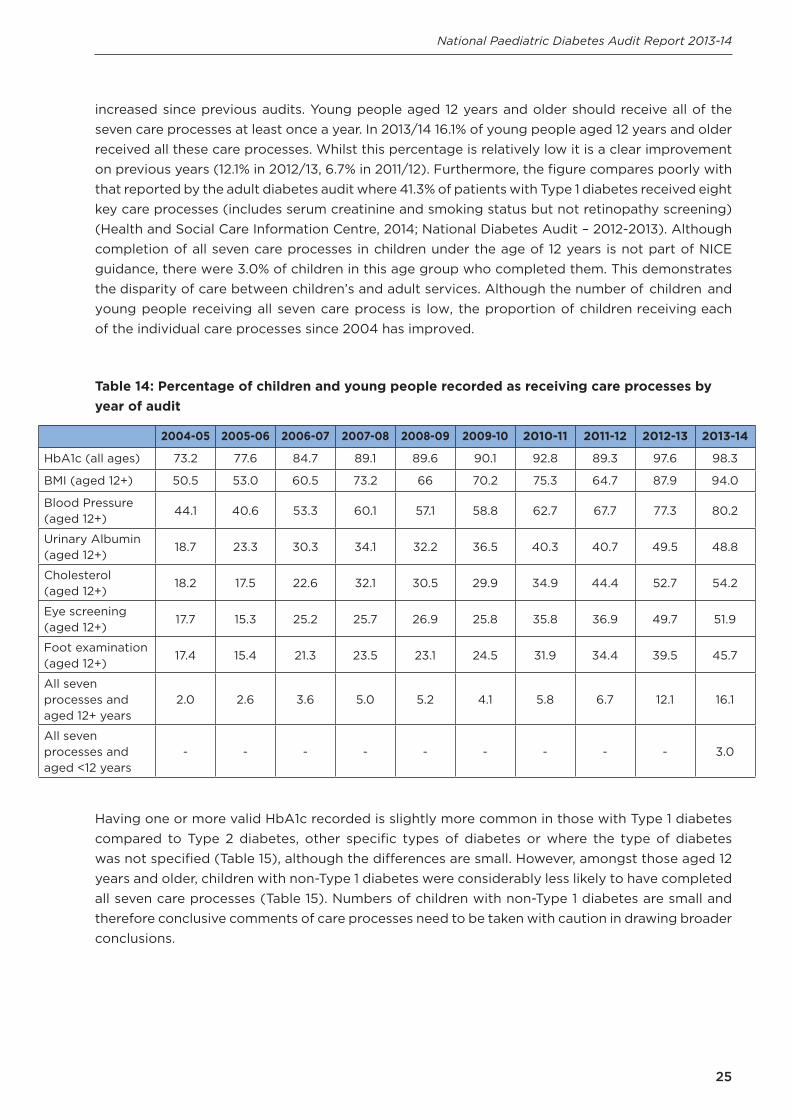
increased since previous audits. Young people aged 12 years and older should receive all of the seven care processes at least once a year. In 2013/14 16.1% of young people aged 12 years and older received all these care processes. Whilst this percentage is relatively low it is a clear improvement on previous years (12.1% in 2012/13, 6.7% in 2011/12). Furthermore, the figure compares poorly with that reported by the adult diabetes audit where 41.3% of patients with Type 1 diabetes received eight key care processes (includes serum creatinine and smoking status but not retinopathy screening) (Health and Social Care Information Centre, 2014; National Diabetes Audit – 2012-2013). Although completion of all seven care processes in children under the age of 12 years is not part of NICE guidance, there were 3.0% of children in this age group who completed them. This demonstrates the disparity of care between children’s and adult services. Although the number of children and young people receiving all seven care process is low, the proportion of children receiving each of the individual care processes since 2004 has improved.
Table 14: Percentage of children and young people recorded as receiving care processes by year of audit
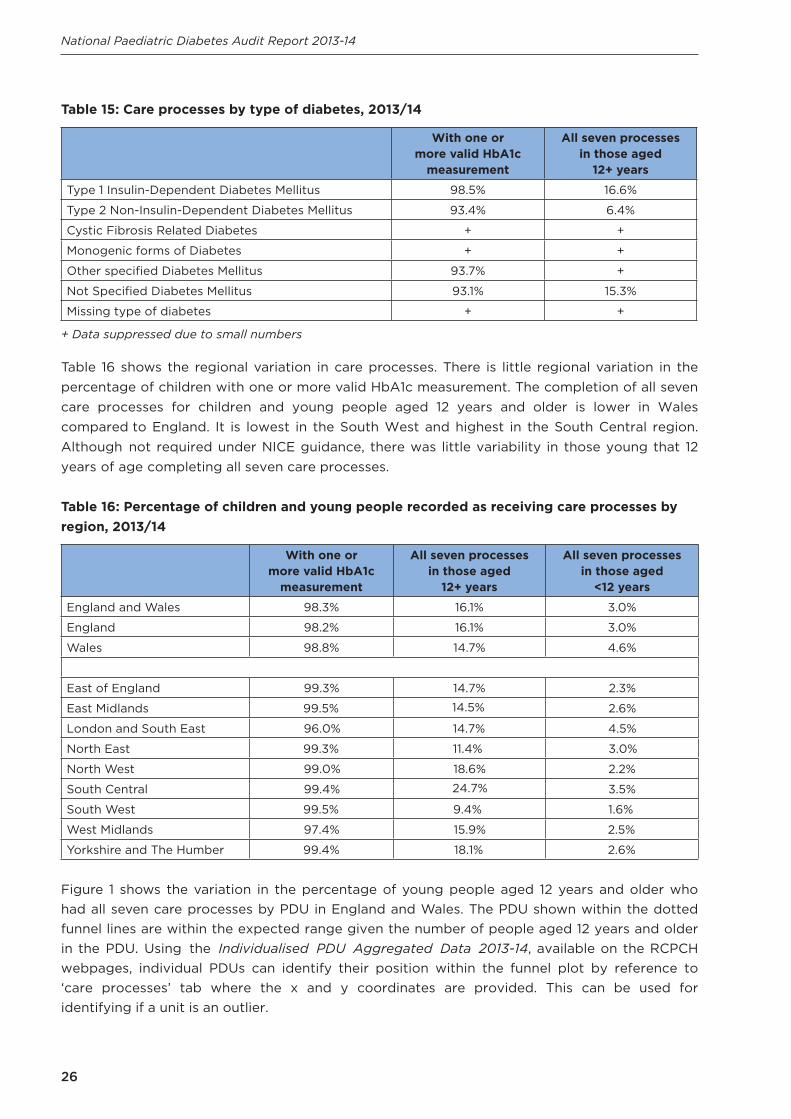
Having one or more valid HbA1c recorded is slightly more common in those with Type 1 diabetes compared to Type 2 diabetes, other specific types of diabetes or where the type of diabetes was not specified (Table 15), although the differences are small. However, amongst those aged 12 years and older, children with non-Type 1 diabetes were considerably less likely to have completed all seven care processes (Table 15). Numbers of children with non-Type 1 diabetes are small and therefore conclusive comments of care processes need to be taken with caution in drawing broader conclusions.
2004-05 2005-06 2006-07 2007-08 2008-09 2009-10 2010-11 2011-12 2012-13 2013-14
HbA1c (all ages) 73.2 77.6 84.7 89.1 89.6 90.1 92.8 89.3 97.6 98.3
BMI (aged 12+) 50.5 53.0 60.5 73.2 66 70.2 75.3 64.7 87.9 94.0
Blood Pressure (aged 12+)
44.1 40.6 53.3 60.1 57.1 58.8 62.7 67.7 77.3 80.2
Urinary Albumin (aged 12+)
18.7 23.3 30.3 34.1 32.2 36.5 40.3 40.7 49.5 48.8
Cholesterol (aged 12+)
18.2 17.5 22.6 32.1 30.5 29.9 34.9 44.4 52.7 54.2
Eye screening (aged 12+)
17.7 15.3 25.2 25.7 26.9 25.8 35.8 36.9 49.7 51.9
Foot examination (aged 12+)
17.4 15.4 21.3 23.5 23.1 24.5 31.9 34.4 39.5 45.7
All seven processes and aged 12+ years
2.0 2.6 3.6 5.0 5.2 4.1 5.8 6.7 12.1 16.1
All seven processes and aged <12 years
- - - - - - - - - 3.0
26
National Paediatric Diabetes Audit Report 2013-14
Table 15: Care processes by type of diabetes, 2013/14
With one or more valid HbA1c
measurement
All seven processes in those aged
12+ years
Type 1 Insulin-Dependent Diabetes Mellitus 98.5% 16.6%
Type 2 Non-Insulin-Dependent Diabetes Mellitus 93.4% 6.4%
Cystic Fibrosis Related Diabetes + +
Monogenic forms of Diabetes + +
Other specified Diabetes Mellitus 93.7% +
Not Specified Diabetes Mellitus 93.1% 15.3%
Missing type of diabetes + +
+ Data suppressed due to small numbers
Table 16 shows the regional variation in care processes. There is little regional variation in the percentage of children with one or more valid HbA1c measurement. The completion of all seven care processes for children and young people aged 12 years and older is lower in Wales compared to England. It is lowest in the South West and highest in the South Central region. Although not required under NICE guidance, there was little variability in those young that 12 years of age completing all seven care processes.
Table 16: Percentage of children and young people recorded as receiving care processes by region, 2013/14
With one or more valid HbA1c
measurement
All seven processes in those aged
12+ years
All seven processes in those aged
<12 years
England and Wales 98.3% 16.1% 3.0%
England 98.2% 16.1% 3.0%
Wales 98.8% 14.7% 4.6%
East of England 99.3% 14.7% 2.3%
East Midlands 99.5% 14.5% 2.6%
London and South East 96.0% 14.7% 4.5%
North East 99.3% 11.4% 3.0%
North West 99.0% 18.6% 2.2%
South Central 99.4% 24.7% 3.5%
South West 99.5% 9.4% 1.6%
West Midlands 97.4% 15.9% 2.5%
Yorkshire and The Humber 99.4% 18.1% 2.6%
Figure 1 shows the variation in the percentage of young people aged 12 years and older who had all seven care processes by PDU in England and Wales. The PDU shown within the dotted funnel lines are within the expected range given the number of people aged 12 years and older in the PDU. Using the Individualised PDU Aggregated Data 2013-14, available on the RCPCH webpages, individual PDUs can identify their position within the funnel plot by reference to ‘care processes’ tab where the x and y coordinates are provided. This can be used for identifying if a unit is an outlier.

27
National Paediatric Diabetes Audit Report 2013-14
Figure 1: Percentage of people aged 12 years and older who had all seven care processes by unit, 2013/14
4.2 Completion of the care processes smoking, thyroid disease screening, coeliac disease screening and psychological assessment
The audit also collects data on four other care processes that have not previously been reported. These include smoking status for those aged 12 years and older, for all children and young people with Type 1 diabetes thyroid function screening, screening for coeliac disease and psychological assessment. NICE currently recommends children and young people with Type 1 diabetes should be offered screening for thyroid disease at diagnosis and annually thereafter, and screening for coeliac disease at diagnosis only (NICE Clinical Guidelines – CG15). However, the guidance about coeliac disease screening changed in June 2009 where previously the recommendation was to screen at diagnosis and three yearly thereafter. Many PDUs continue to screen on an annual basis and there is anecdotal evidence that cases of coeliac disease are recognised through this additional screening.
Across England and Wales 67.2% of young people aged 12 years and older had their smoking status recorded during the audit period (Table 17). Individuals were classed as having a valid thyroid function test if they received a TSH and a free T4 measurement in the audit period and identified as having screening for coeliac disease if they had an indication of either a positive or negative result in the audit period. Across England and Wales 51.8% of children and young people with Type 1 diabetes had a test of thyroid function during the audit period (Table 17). This percentage is higher in Wales than in England (69.5% compared to 50.0%). There is also regional variation

28
National Paediatric Diabetes Audit Report 2013-14
within England ranging from 31.4% in the North East to 66.3% in South Central. Of those with Type 1 diabetes in England 43.7% had been screened for coeliac disease compared to 55.0% in Wales. Across England the region with the most comprehensive screening for coeliac disease is South Central (63.7%) whilst only 29.6% were screened in the North East (Table 17). The care process of psychological assessment is intended to represent whether a patient has been considered for assessment. Therefore the process is complete when a response was given as referral ‘Not Required’ or ‘Referral Made’.
Table 17: Children and young people receiving the care processes of smoking status, thyroid and coeliac disease screening and psychological assessment by country and region, 2013/14
Smoking status recorded
(aged 12+ years)
Thyroid function(Type 1
diabetes only)
Screening for coeliac disease
(Type 1 diabetes only)
Psychological assessment
England and Wales 67.2% 51.8% 45.2% 47.9%
England 66.9% 50.0% 43.7% 47.7%
Wales 67.4% 69.5% 55.0% 51.1%
East of England 46.5% 53.1% 46.0% 44.9%
East Midlands 58.4% 34.1% 40.2% 59.0%
London and South East 68.5% 51.9% 40.9% 38.1%
North East 69.4% 31.4% 29.6% 38.4%
North West 75.6% 57.1% 42.9% 65.7%
South Central 80.0% 66.3% 63.7% 71.1%
South West 46.3% 39.5% 34.7% 37.0%
West Midlands 71.3% 53.8% 47.1% 32.0%
Yorkshire and The Humber 84.5% 54.1% 55.8% 55.7%
The guidance on screening for thyroid and coeliac disease makes particular reference to screening at diagnosis of Type 1 diabetes. Table 18 shows the recorded screening of those with Type 1 diabetes diagnosed in the audit period. A smaller percentage of those recently diagnosed had a record of a thyroid function test (36.4% compared to 51.8% of all children and young people with Type 1 diabetes). Screening for coeliac disease is slightly higher amongst those diagnosed in the audit period across England and Wales (47.6% compared to 45.2% for all children and young people with Type 1 diabetes). There are clear regional variations in the uptake and/or recording of these screening tests and there is a lack of thyroid and coeliac screening tests at diagnosis. In terms of quality improvement, the regional diabetes networks could become more proactive in ensuring that all PDUs review their performance as outlined in this report and use the data to improve quality of care by implementing processes to ensure that such screening is not forgotten.

29
National Paediatric Diabetes Audit Report 2013-14
Table 18: Children and young people diagnosed with Type 1 diabetes during the audit year undergoing screening for thyroid and coeliac disease, 2013/14
Thyroid function(Type 1 diabetes only)
Screening for coeliac disease (Type 1 diabetes only)
England and Wales 36.4% 47.6%
England 36.4% 47.3%
Wales 34.8% 51.8%
East of England 29.4% 53.3%
East Midlands 39.8% 61.8%
London and South East 37.3% 48.0%
North East 36.8% 34.9%
North West 34.3% 37.3%
South Central 39.7% 58.2%
South West 37.3% 35.9%
West Midlands 30.6% 30.6%
Yorkshire and The Humber 41.9% 64.3%

30
National Paediatric Diabetes Audit Report 2013-14
5. Outcomes of care
Audit Question: The collection of outcome measures are an important part of monitoring diabetes control and care. Treatment targets can be viewed as part of the process of care or as an ‘intermediate outcome’ i.e. an intermediary step between a care process of the patient and a ‘hard’ endpoint such as the development of a complication. This section not only covers HbA1c measurements which are recommended as the best indicator of long-term diabetes control, but also other indicators of microvascular, macrovascular and autoimmune disease.
Summary
There has been an improvement in diabetes control, as measured by HbA1c, in England and Wales over the last two years. The national average HbA1c has fallen from 73.0 mmol/mol in 2012/13 to 71.6 mmol/mol in 2013/14.
The percentage of children and young people achieving excellent diabetes control (HbA1c less than 58 mmol/mol) has increased from 15.8% in 2012/13 to 18.4% in 2013/14, and the percentage with a very high HbA1c (greater than 80 mmol/mol), has decreased from 25.9% in 2012/13 to 23.9% in 2013/14, a clinically significant change when considering the large number of patients.
Better control is achieved in the first year following diagnosis (mean HbA1c 64.0 mmol/mol) compared to long term (77.6 mmol/mol after 10-14 years). White ethnic groups achieve better control of diabetes (mean HbA1c 71.7 mmol/mol) when compared to all other ethnicities (mean HbA1c: Asian 74.2 mmol/mol; Black 78.4 mmol/mol; Mixed 75.6 mmol/mol).
Children and young people with diabetes living in the most deprived areas have worse outcomes in terms of HbA1c than those living in the least deprived areas with a mean HbA1c of 74.7 mmol/mol as compared to 69.0 mmol/mol respectively.
There are increases in microvascular abnormalities with increasing age with an alarming number of young people aged 12 years and above already showing early signs of complications from their diabetes: 7.1% of young people show increased risk of developing kidney disease in the future, although the proportion of young people with missing data was high (35.2%); 14.1% show early signs of increased risk of blindness.
An large number of young people with Type 1 diabetes have high blood pressure (27.5%), while 18.1% of children with Type 1 diabetes aged between 0-11 years, and almost a quarter aged over 12 years (23.2%), are obese. Hyperlipidaemia is also evident in childhood diabetes with 16.1% of young people >12 years of age having a total cholesterol above the cut off limit of 5.0 mmol/l .
RecommendationThere should be a clear emphasis on improving blood glucose control. Achieving this will reduce the future risk and progression of complications of diabetes.

31
National Paediatric Diabetes Audit Report 2013-14
Those providing care for children and young people with diabetes should continue to work with patients and their families to achieve the best possible level of HbA1c. Since this marker remains a strong indicator for risk of developing diabetic eye disease (retinopathy), kidney disease (nephropathy) and peripheral vascular disease (microvascular complications), action plans should be in place to optimise control throughout the lifespan of a person with diabetes.
5.1 HbA1c and treatment regimen
HbA1c is a marker of overall diabetes glycaemic control over the preceding six to eight weeks. It is recommended that people with diabetes aim for an HbA1c below 58 mmol/mol. Having a high HbA1c increases the risk of both micro and macrovascular diabetic complications (eye disease, kidney disease and cardiovascular disease). An HbA1c greater than 80 mmol/mol is associated with excess risk of developing these complications. For analysis and presentation purposes all measures of HbA1c submitted as a percentage have been converted to mmol/mol. Although clinically HbA1c is reported as an integer, the analysis has reported aggregated data to one decimal place to allow small differences and changes to be recognised.
All children and young people with a valid HbA1c measurement more than 90 days after diagnosis were included. Young people who transitioned to adult services during the audit period were included. The analysis includes data on 24,665 children and young people with diabetes.
Nine children and young people had a valid HbA1c measured in both England and Wales, 93 had a valid HbA1c in more than one region and 272 had a valid HbA1c from more than one PDU. This means that aggregating the national, regional or PDU level data will not match the figures for England and Wales. Regional data relating to HbA1c is based on the location of the PDU in which the children and young people received their care. The analysis uses the median HbA1c value for each individual patient. Across the audit in 2013/14, 98.4% of children and young people had at least one valid HbA1c measurement. The mean and median HbA1c of all children and young people with diabetes in England and Wales receiving care in a PDU was 71.6 and 69.0 mmol/mol respectively (Table 19). This is lower or similar to the mean and median HbA1c for England and Wales of 73 mmol/mol and 69 mmol/mol respectively reported in 2012/13 (Figure 2). There has also been an increase in the percentage of children and young people with an HbA1c less than 58 mmol/mol from 15.8% in 2012/13 to 18.4% in 2013/14. The percentage of children and young people with a very high HbA1c putting them at high risk of developing diabetic complications (greater than 80 mmol/mol) has decreased from 25.9% in 2012/13 to 23.9% in 2013/14 (Table 19). For the fourth consecutive year there has been a fall in the median HbA1c levels for England and Wales (Figure 2). Such improvements may reflect the quality improvement initiatives that are underway in England and underpinned by the introduction of the Best Practice Tariff, a Quality Surveillance Peer Review Programme, together with the development of robust clinical networks in England. Similar improvements are reported for Wales, which does not have a tariff based format for commissioning paediatric diabetes services but this year has introduced Peer Review and joined up with England’s network structure.

32
National Paediatric Diabetes Audit Report 2013-14
Table 19: HbA1c for all children and young people with one or more valid measurements by country and region, 2013/14
Figure 2: Change in median HbA1c for England and Wales 2005/06 to 2013/14
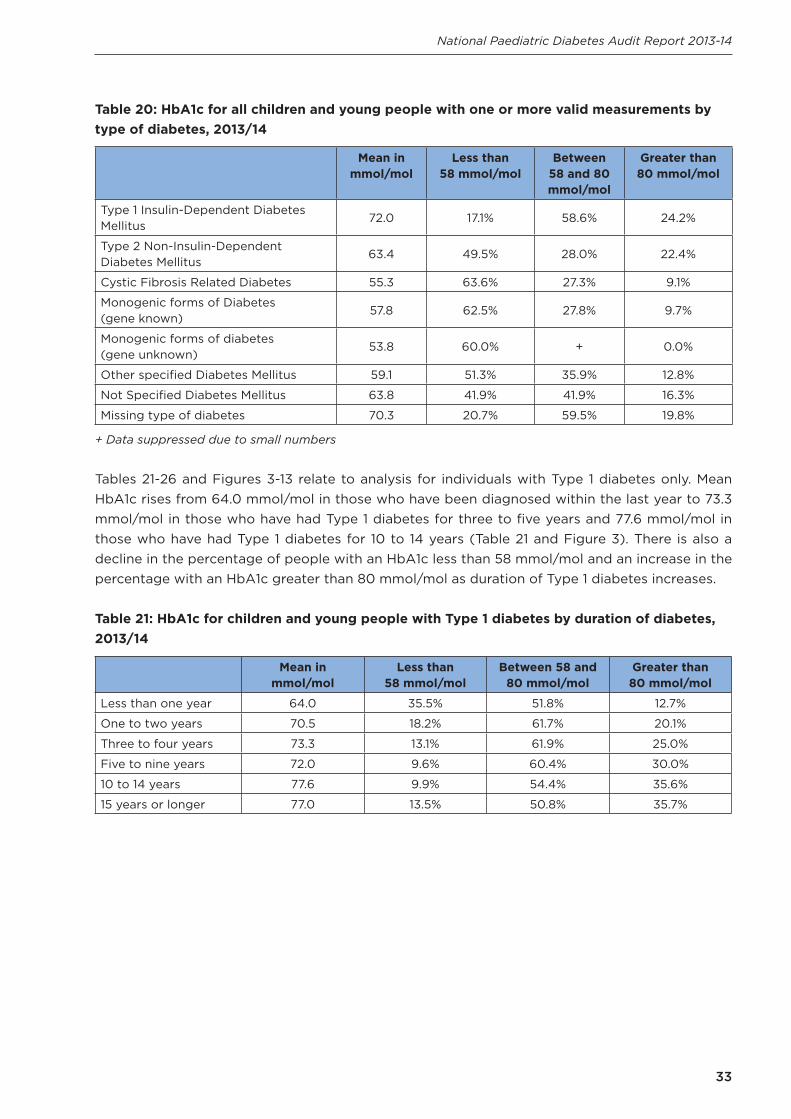
Mean HbA1c and achievement of HbA1c targets varies by type of diabetes (Table 20). Children and young people with Type 1 diabetes have the highest mean HbA1c (72.0 mmol/mol) and are least likely to have an HbA1c less than 58 mmol/mol (17.1%). Children and young people with cystic fibrosis related diabetes and monogenic types of diabetes have the lowest mean HbA1c values and are most likely to meet the less than 58 mmol/mol target.
Number of children
and young people
Mean (mmol/
mol)
Standard deviation (mmol/
mol)
Median (mmol/
mol)
IQR (mmol/
mol)
Less than 58 mmol/
mol
Between 58 and 80
mmol/ mol
Greater than 80 mmol/
mol
England and Wales 24,665 71.6 17.4 69.0 19.0 18.4% 57.7% 23.9%
England 23,342 71.6 17.5 69.0 19.0 18.4% 57.6% 24.0%
Wales 1330 71.5 16.9 69.0 18.5 18.3% 58.3% 23.5%
East of England 2839 72.9 17.6 70.0 19.0 16.2% 57.8% 26.0%
East Midlands 1713 68.9 15.7 67.0 17.8 21.3% 60.8% 17.9%
London and South East 5143 72.0 18.0 69.2 20.0 19.3% 55.2% 25.5%
North East 1263 71.8 17.1 68.5 18.5 16.9% 59.3% 23.8%
North West 3093 71.8 18.0 69.0 20.0 18.7% 57.2% 24.2%
South Central 1992 68.9 15.8 67.0 16.5 21.2% 60.6% 18.2%
South West 2286 71.0 17.2 68.0 19.0 19.2% 58.1% 22.7%
West Midlands 2623 73.6 17.9 70.5 20.0 15.1% 57.3% 27.6%
Yorkshire and The Humber 2476 71.7 17.5 69.4 19.0 18.1% 57.8% 24.1%
33
National Paediatric Diabetes Audit Report 2013-14
Table 20: HbA1c for all children and young people with one or more valid measurements by type of diabetes, 2013/14
Mean in mmol/mol
Less than 58 mmol/mol
Between 58 and 80 mmol/mol
Greater than 80 mmol/mol
Type 1 Insulin-Dependent Diabetes Mellitus
72.0 17.1% 58.6% 24.2%
Type 2 Non-Insulin-Dependent Diabetes Mellitus
63.4 49.5% 28.0% 22.4%
Cystic Fibrosis Related Diabetes 55.3 63.6% 27.3% 9.1%
Monogenic forms of Diabetes (gene known)
57.8 62.5% 27.8% 9.7%
Monogenic forms of diabetes (gene unknown)
53.8 60.0% + 0.0%
Other specified Diabetes Mellitus 59.1 51.3% 35.9% 12.8%
Not Specified Diabetes Mellitus 63.8 41.9% 41.9% 16.3%
Missing type of diabetes 70.3 20.7% 59.5% 19.8%
+ Data suppressed due to small numbers
Tables 21-26 and Figures 3-13 relate to analysis for individuals with Type 1 diabetes only. Mean HbA1c rises from 64.0 mmol/mol in those who have been diagnosed within the last year to 73.3 mmol/mol in those who have had Type 1 diabetes for three to five years and 77.6 mmol/mol in those who have had Type 1 diabetes for 10 to 14 years (Table 21 and Figure 3). There is also a decline in the percentage of people with an HbA1c less than 58 mmol/mol and an increase in the percentage with an HbA1c greater than 80 mmol/mol as duration of Type 1 diabetes increases.
Table 21: HbA1c for children and young people with Type 1 diabetes by duration of diabetes, 2013/14
Mean in mmol/mol
Less than 58 mmol/mol
Between 58 and 80 mmol/mol
Greater than 80 mmol/mol
Less than one year 64.0 35.5% 51.8% 12.7%
One to two years 70.5 18.2% 61.7% 20.1%
Three to four years 73.3 13.1% 61.9% 25.0%
Five to nine years 72.0 9.6% 60.4% 30.0%
10 to 14 years 77.6 9.9% 54.4% 35.6%
15 years or longer 77.0 13.5% 50.8% 35.7%

34
National Paediatric Diabetes Audit Report 2013-14
Figure 3: Mean HbA1c for children and young people with Type 1 diabetes by duration of diabetes, 2013/14
Table 22 and Figures 4-5 show that mean HbA1c and the percentage of people with an HbA1c greater than 80 mmol/mol increases with age. This is partly a reflection of longer duration of Type 1 diabetes in the older age groups. At all ages mean HbA1c is slightly higher in females than in males. Caution should be taken in interpreting the data from 20 years as few patients remain in the care of a PDU after this age.
Table 22: HbA1c for children and young people with Type 1 diabetes by age and sex, 2013/14
Mean in mmol/mol
Less than 58 mmol/mol
Between 58 and 80 mmol/mol
Greater than 80 mmol/mol
Females
0-4 years 66.1 20.9% 71.0% 8.0%
5-9 years 66.5 20.3% 69.4% 10.2%
10-14 years 73.1 15.6% 57.6% 26.8%
15-19 years 78.4 12.1% 49.8% 38.1%
20-24 years 77.4 + 42.9% 42.9%
Males
0-4 years 65.0 25.4% 66.2% 8.4%
5-9 years 66.0 22.1% 68.1% 9.8%
10-14 years 71.6 16.5% 59.7% 23.8%
15-19 years 75.5 16.7% 49.8% 33.5%
20-24 years 67.7 40.0% 46.7% +
+ Data suppressed due to small numbers

35
National Paediatric Diabetes Audit Report 2013-14
Figure 4: HbA1c for female children and young people with Type 1 diabetes by age, 2013/14

36
National Paediatric Diabetes Audit Report 2013-14
Figure 5: HbA1c for male children and young people with Type 1 diabetes by age, 2013/14
HbA1c varies by ethnic group (Table 23 and Figure 6). Children and young people from Black ethnic groups have the highest mean HbA1c (78.4 mmol/mol) whilst those from White ethnic groups have the lowest (71.7 mmol/mol). Furthermore, nearly all non-White ethnic groups have less children and young people with an HbA1c less than 58 mmol/mol but more with an HbA1c above 80 mmol/mol, compared to White ethnicity (Table 23 and Figure 6).
Table 23: HbA1c for children and young people with Type 1 diabetes ethnic group, 2013/14
Mean in mmol/mol
Less than 58 mmol/mol
Between 58 mmol/mol and
80 mmol/mol
Greater than 80 mmol/mol
White 71.7 17.3% 59.3% 23.4%
Mixed 75.6 13.9% 53.6% 32.5%
Asian 74.2 14.7% 57.5% 27.9%
Black 78.4 10.3% 51.1% 38.7%
Other 73.8 17.6% 53.1% 29.3%
Not stated 72.2 16.9% 58.2% 24.8%
Missing ethnic group 66.6 29.0% 55.4% 15.6%

37
National Paediatric Diabetes Audit Report 2013-14
Figure 6: HbA1c for children and young people with Type 1 diabetes ethnic group, 2013/14
There is a clear deprivation gradient in Hba1c levels with children and young people with Type 1 diabetes living in more deprived areas having a higher mean HbA1c, less likely to have HbA1c below 58 mmol/mol and more likely to have a value above 80 mmol/mol (Table 24 and Figure 7).
Table 24: HbA1c for children and young people with Type 1 diabetes by deprivation, 2013/14
Mean in mmol/mol
Less than 58 mmol/mol
Between 58 mmol/mol and
80 mmol/mol
Greater than 80 mmol/mol
Most deprived 74.7 13.9% 56.5% 29.6%
2nd most deprived 74.0 16.0% 54.8% 29.2%
3rd most deprived 72.2 16.6% 59.0% 24.4%
2nd least deprived 70.4 18.3% 61.5% 20.2%
Least deprived 69.0 20.8% 61.3% 18.0%

38
National Paediatric Diabetes Audit Report 2013-14
Figure 7: HbA1c for children and young people with Type 1 diabetes by deprivation, 2013/14
Funnel plots show variation at PDU level in the mean HbA1c (Figure 8), the percentage of children and young people with an HbA1c less than 58 mmol/mol (Figure 9) and the percentage of children and young people with an HbA1c of greater than 80 mmol/mol (Figure 10). 95% and 98% significance levels are shown as dotted lines. If a PDU is below the dotted lines this indicates that they have a significantly lower score on the indicator being shown whilst those above the dotted lines have a significantly higher score. The Individualised PDU Aggregated Data 2013-14 available at www.rcpch.ac.uk/npda, shows how each PDU performs for HbA1c measures. Individual PDUs can identify their position within the funnel plot by reference to the ‘HbA1c’ tab where the x and y coordinates are provided. Box and whisker plots for each PDU by region, showing the median, inter quartile extremes for HbA1c are shown in the ‘Box and whisker plots for individual paediatric diabetes units by region’ available online with this report.
The limits for the outliers have been set as 5% and 2% as recommended by the National Clinical Audit Advisory Group (National Clinical Audit Advisory Group 2011). These limits represent an ‘alert’ or an ‘alarm’ respectively for the performance indicator.

39
National Paediatric Diabetes Audit Report 2013-14
Figure 8: Funnel plot of mean HbA1c for children and young people with Type 1 diabetes by PDU, 2013/14
Figure 9: Funnel plot of percentage of children and young people with Type 1 diabetes with an HbA1c less than 58 mmol/mol by PDU, 2013/14

40
National Paediatric Diabetes Audit Report 2013-14
Figure 10: Funnel plot of percentage of children and young people with Type 1 diabetes with an HbA1c greater than 80 mmol/mol by PDU, 2013/14
The National Clinical Audit Advisory Group recommends that funnel plots should be statistically adjusted to take into account ‘case-mix’ variation between PDUs treatment populations (National Clinical Audit Advisory Group 2011). Adjustment is a method of dealing with over-dispersion in the raw data due to unmeasured risk factors i.e. patient characteristics. Table 25 shows the multivariate regression analysis and demonstrates the significant variables that influence HbA1c.
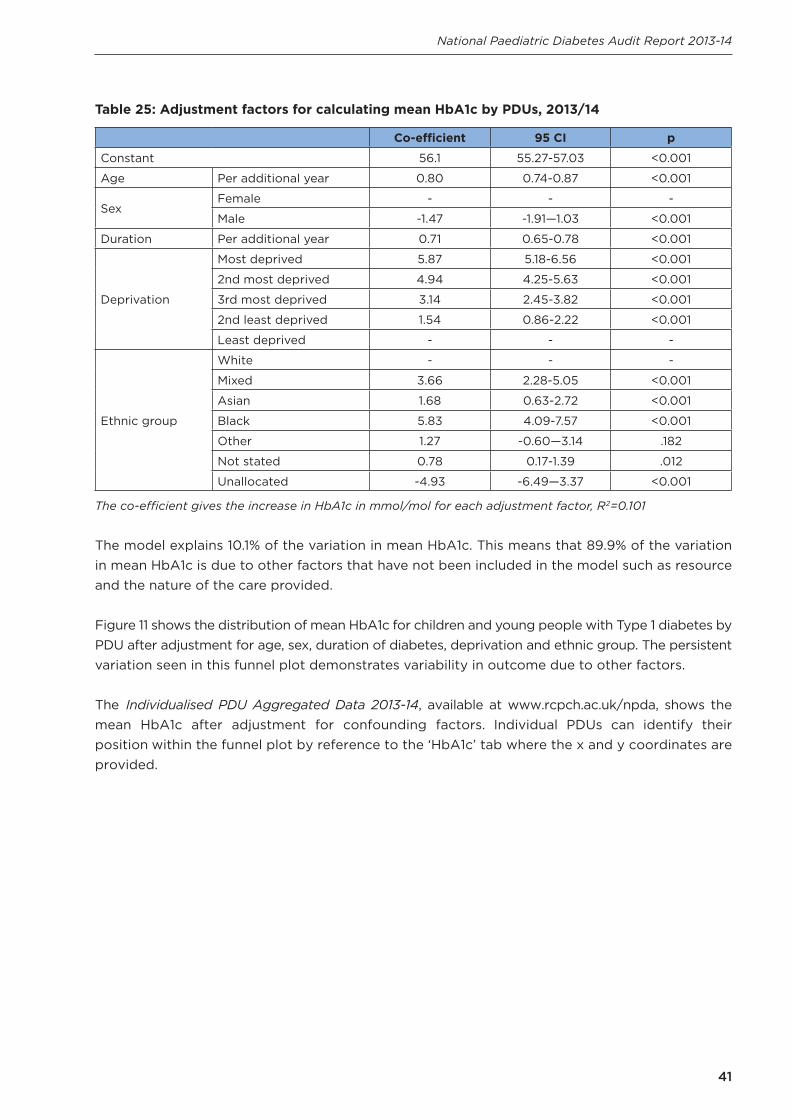
41
National Paediatric Diabetes Audit Report 2013-14
Table 25: Adjustment factors for calculating mean HbA1c by PDUs, 2013/14
Co-efficient 95 CI p
Constant 56.1 55.27-57.03 <0.001
Age Per additional year 0.80 0.74-0.87 <0.001
SexFemale - - -
Male -1.47 -1.91—1.03 <0.001
Duration Per additional year 0.71 0.65-0.78 <0.001
Deprivation
Most deprived 5.87 5.18-6.56 <0.001
2nd most deprived 4.94 4.25-5.63 <0.001
3rd most deprived 3.14 2.45-3.82 <0.001
2nd least deprived 1.54 0.86-2.22 <0.001
Least deprived - - -
Ethnic group
White - - -
Mixed 3.66 2.28-5.05 <0.001
Asian 1.68 0.63-2.72 <0.001
Black 5.83 4.09-7.57 <0.001
Other 1.27 -0.60—3.14 .182
Not stated 0.78 0.17-1.39 .012
Unallocated -4.93 -6.49—3.37 <0.001
The co-efficient gives the increase in HbA1c in mmol/mol for each adjustment factor, R2=0.101
The model explains 10.1% of the variation in mean HbA1c. This means that 89.9% of the variation in mean HbA1c is due to other factors that have not been included in the model such as resource and the nature of the care provided.
Figure 11 shows the distribution of mean HbA1c for children and young people with Type 1 diabetes by PDU after adjustment for age, sex, duration of diabetes, deprivation and ethnic group. The persistent variation seen in this funnel plot demonstrates variability in outcome due to other factors.
The Individualised PDU Aggregated Data 2013-14, available at www.rcpch.ac.uk/npda, shows the mean HbA1c after adjustment for confounding factors. Individual PDUs can identify their position within the funnel plot by reference to the ‘HbA1c’ tab where the x and y coordinates are provided.

42
National Paediatric Diabetes Audit Report 2013-14
Figure 11: Funnel plot of adjusted mean HbA1c for children and young people with Type 1 by PDU diabetes, 2013/14
In a similar manner ‘casemix’ adjustment can be made for the treatment targets for percentage of children and young people with an HbA1c less than 58 mmol/mol and greater than 80 mmol/mol. Table 26 shows the multivariate analysis for each treatment target and Figures 12 and 13 show the ‘casemix’ adjusted funnel plots. Individual PDUs can identify their position within the funnel plot by reference to the ‘HbA1c’ tab in the Individualised PDU Aggregated Data 2013-14 where the x and y coordinates are provided.

43
National Paediatric Diabetes Audit Report 2013-14
Table 26: Adjustment factors for HbA1c targets, 2013/14
HbA1c less than 58 mmol/mol HbA1c greater than 80 mmol/mol
Odds ratio
95 CI p Odds ratio
95 CI p
Age Per additional year 1.01 1.00-1.02 0.032 1.16 1.15-1.17 <0.001
SexFemale - - - - - -
Male 1.16 1.08-1.24 <0.001 0.86 0.81-0.92 <0.001
Duration Per additional year 0.84 0.83-0.85 <0.001 1.04 1.03-1.05 <0.001
Deprivation
Most deprived 0.60 0.53-0.67 <0.001 2.04 1.84-2.25 <0.001
2nd most deprived 0.72 0.65-0.81 <0.001 1.94 1.75-2.15 <0.001
3rd most deprived 0.74 0.66-0.83 <0.001 1.50 1.35-1.66 <0.001
2nd least deprived 0.85 0.76-0.95 0.003 1.18 1.06-1.32 0.002
Least deprived - - - - - -
Ethnic group
White - - - - - -
Mixed 0.80 0.63-1.03 0.081 1.59 1.32-1.91 <0.001
Asian 0.92 0.77-1.10 0.338 1.20 1.04-1.39 0.015
Black 0.61 0.43-0.86 0.005 2.04 1.63-2.55 <0.001
Other 1.20 0.89-1.62 0.236 1.32 1.02-1.71 0.034
Not stated 0.96 0.87-1.06 0.381 1.09 1.00-1.19 0.053
Unallocated 2.35 1.89-2.91 <0.001 0.59 0.46-0.78 <0.001
The model to predict having an HbA1c less than 58 mmol/mol explains 8.5% of the variation and the model to predict having an HbA1c greater than 80 mmol/mol explains 11.8% of the variation.
Figure 12: Funnel plot of adjusted HbA1c less than 58 mmol/mol by PDU for children and young people with Type 1 diabetes by PDU, 2013/14
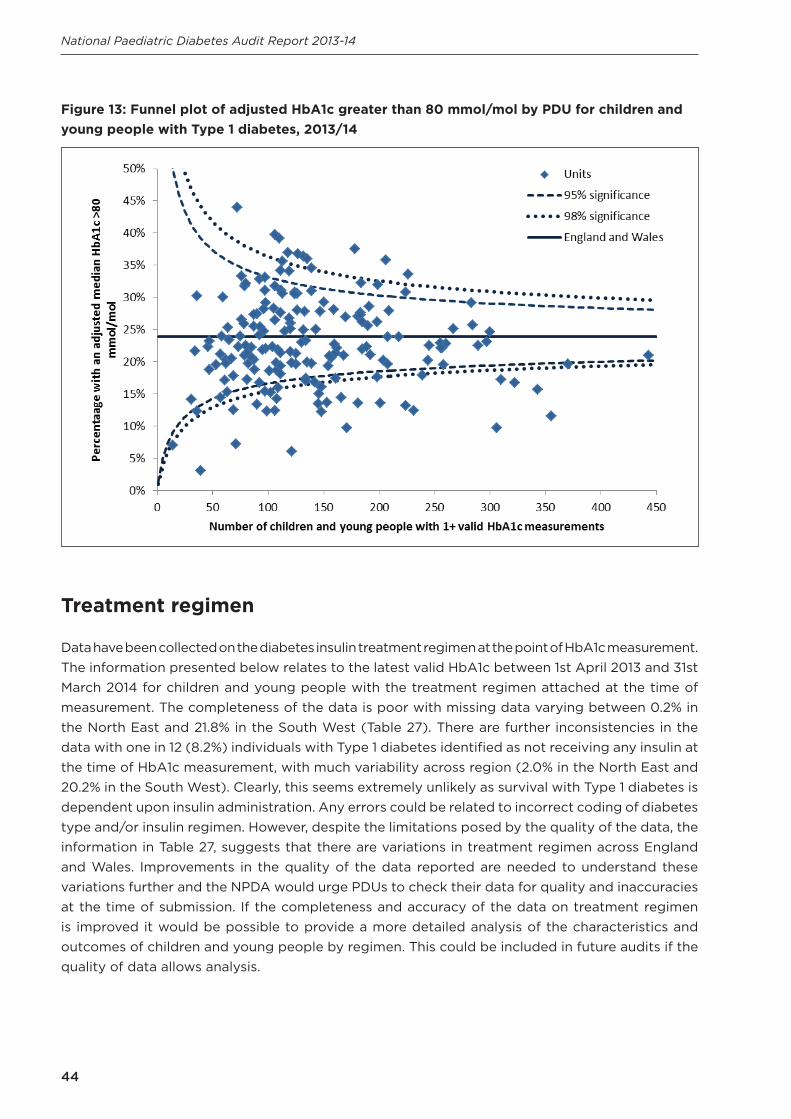
44
National Paediatric Diabetes Audit Report 2013-14
Figure 13: Funnel plot of adjusted HbA1c greater than 80 mmol/mol by PDU for children and young people with Type 1 diabetes, 2013/14
Treatment regimen
Data have been collected on the diabetes insulin treatment regimen at the point of HbA1c measurement. The information presented below relates to the latest valid HbA1c between 1st April 2013 and 31st March 2014 for children and young people with the treatment regimen attached at the time of measurement. The completeness of the data is poor with missing data varying between 0.2% in the North East and 21.8% in the South West (Table 27). There are further inconsistencies in the data with one in 12 (8.2%) individuals with Type 1 diabetes identified as not receiving any insulin at the time of HbA1c measurement, with much variability across region (2.0% in the North East and 20.2% in the South West). Clearly, this seems extremely unlikely as survival with Type 1 diabetes is dependent upon insulin administration. Any errors could be related to incorrect coding of diabetes type and/or insulin regimen. However, despite the limitations posed by the quality of the data, the information in Table 27, suggests that there are variations in treatment regimen across England and Wales. Improvements in the quality of the data reported are needed to understand these variations further and the NPDA would urge PDUs to check their data for quality and inaccuracies at the time of submission. If the completeness and accuracy of the data on treatment regimen is improved it would be possible to provide a more detailed analysis of the characteristics and outcomes of children and young people by regimen. This could be included in future audits if the quality of data allows analysis.

45
National Paediatric Diabetes Audit Report 2013-14
Table 27: Treatment regimen for children and young people with Type 1 diabetes by country and region, 2013/14
5.2 Microvascular disease
People with diabetes are at increased risk of microvascular disease including chronic kidney disease and retinopathy. The data in this section relates to the 15,805 young people with diabetes aged 12 years and older at the start of the audit period including those that transitioned into adult services.
5.2.1 Kidney disease
Young people over the age of 12 years should have their kidney function (urinary albumin) tested at least once a year. Table 14 (Section 4.1) shows that between 1st April 2013 and 31st March 2014 48.8% of young people aged 12 years or older had this recorded at least once in the audit period. The results of these tests are shown in Table 28. Across England and Wales 6.8% (489 patients) of young people aged 12 years and older who had a urinary albumin test in the audit period had microalbuminuria and 0.3% (22 patients) had macroalbuminuria. This may represent an underestimate of the true figures as there is a considerable amount of missing data. Furthermore, the regional variation in the percentage of young people with micro or macroalbuminuria may be a partial reflection of the variation in data completeness as missing data ranges from 17.2% in Yorkshire and the Humber to 56.9% in the South West. The prevalence of micro and macroalbuminuria was higher amongst those with Type 2 diabetes (15.8%) than in those with Type 1 diabetes (7.1%). There appeared to be no significant trend in the prevalence of micro or macroalbuminuria with increasing age (Table 29), although this may be dependent on duration
No insulin
1-2 insulin injections per day
3 insulin injections per day
4 or more insulin
injections per day
Insulin pump
therapy
Oral hypoglycaemic
agents
Oral hypoglycaemic
agents and insulin
Missing data
England and Wales 8.1% 7.1% 3.7% 54.8% 16.1% 0.1% 0.3% 9.8%
England 8.2% 7.2% 3.7% 54.3% 15.8% 0.1% 0.3% 8.2%
Wales 5.6% 5.9% 4.5% 63.6% 20.0% 0.1% 0.0% 5.6%
East of England 5.0% 9.8% 5.3% 54.6% 13.0% 0.0% 0.4% 11.9%
East Midlands 11.2% 1.9% 1.0% 52.1% 21.4% 0.1% 0.4% 12.0%
London and South East
6.5% 10.0% 3.4% 60.9% 16.4% 0.0% 0.4% 2.4%
North East 2.0% 10.9% 13.0% 51.7% 21.7% 0.0% 0.4% 0.2%
North West 13.4% 10.6% 3.8% 48.2% 9.9% 0.1% 0.4% 13.6%
South Central 3.6% 2.9% 3.1% 68.6% 20.7% 0.0% 0.1% 1.1%
South West 20.2% 4.6% 1.9% 42.4% 8.9% 0.1% 0.0% 21.8%
West Midlands 4.8% 5.2% 3.3% 56.8% 15.1% 0.0% 0.3% 14.5%
Yorkshire and The Humber
6.5% 3.8% 1.7% 47.7% 21.8% 0.2% 0.2% 18.0%

46
National Paediatric Diabetes Audit Report 2013-14
of diabetes. There was a trend for a higher incidence in micro or macroalbuminuria in the most deprived areas compared to the least deprived (Table 30). There is no clear trend of differences in albuminuria stage amongst different ethnic groups (Table 31). Once the data quality of this variable improves further analyses exploring variables that might influence the development of albuminuria such as duration of diabetes or age at onset of diabetes can be performed.
Table 28: Albuminuria results for young people aged 12 years and older by country and region, 2013/14
Normoalbuminuria Microalbuminuria or Macroalbuminuria
Missing albumin data
England and Wales 57.7% 7.1% 35.2%
England 60.3% 6.8% 33.3%
Wales 51.1% 12.8% 31.1%
East of England 58.9% 5.5% 35.5%
East Midlands 63.6% 7.9% 28.5%
London and South East 59.1% 9.4% 31.5%
North East 50.1% 6.5% 43.4%
North West 43.6% 2.6% 53.8%
South Central 63.8% 5.4% 30.8%
South West 36.8% 6.3% 56.9%
West Midlands 56.4% 12.6% 31.0%
Yorkshire and The Humber 78.2% 4.6% 17.2%
Table 29: Albuminuria results for young people aged 12 years and older by age, 2013/14
Normoalbuminuria Microalbuminuria or Macroalbuminuria
Missing albumin data
12 years 59.2% 7.1% 33.7%
13 years 57.0% 7.0% 35.9%
14 years 58.4% 6.2% 35.4%
15 years 56.0% 6.8% 37.2%
16 years 54.2% 8.5% 37.3%
17 years 59.5% 7.8% 32.7%
18 years 69.7% 8.1% 22.3%
Table 30: Albuminuria results for young people aged 12 years and older by deprivation, 2013/14
Normoalbuminuria Microalbuminuria or Macroalbuminuria
Missing albumin data
Most deprived 53.7% 9.5% 36.8%
2nd most deprived 57.8% 7.1% 35.1%
3rd most deprived 59.5% 7.3% 33.1%
2nd least deprived 58.7% 6.8% 34.5%
Least deprived 58.2% 5.0% 36.9%

47
National Paediatric Diabetes Audit Report 2013-14
Table 31: Albuminuria results for young people aged 12 years and older by ethnic group, 2013/14
Normoalbuminuria Microalbuminuria or Macroalbuminuria
Missing data
White 58.2% 6.8% 34.9%
Mixed 56.7% 5.8% 37.4%
Asian 53.6% 9.2% 37.2%
Black 53.8% 8.3% 37.9%
Other 62.7% 8.8% 28.4%
Not stated 53.6% 7.7% 38.7%
Unallocated* 73.3% 16.7% 10.0%
*Due to unidentified ethnic group
5.2.2 Eye disease
All young people over the age of 12 years should have annual eye examinations to screen for diabetic eye disease (retinopathy and maculopathy). Data presented in Table 14 (section 4.1) showed that 51.9% of people aged 12 years and older had received eye screening between 1st April 2013 and 31st March 2014. Across England and Wales 14.1% of young people aged 12 years and older who had received eye screening had abnormal findings (evidence of retinopathy and/or maculopathy) (Table 32). The prevalence of abnormal eye screening findings was higher amongst those with Type 1 diabetes (14.3%) than in those with Type 2 diabetes (6.4%). The prevalence of abnormal eye screening findings increased steadily with age from 9.2% in 12 year olds to 18.2% in those aged 16 years old and 21.6% in 18 year olds (Table 33), although this could reflect duration of diabetes. There is no clear deprivation gradient in abnormal eye screening findings (Table 34), but there are small differences in eye disease by ethnic group (Table 35), with the highest prevalence of abnormal findings on eye screening amongst young people from Mixed ethnic groups.
Table 32: Results of eye screening for young people aged 12 years and older, 2013/14
Normal Abnormal Missing eye screening data
England and Wales 80.5% 14.1% 5.4%
England 80.6% 13.8% 5.6%
Wales 78.2% 19.4% 2.5%
East of England 73.3% 13.2% 13.5%
East Midlands 81.5% 14.3% 4.2%
London and South East 85.3% 10.1% 4.5%
North East 85.3% 13.9% 0.8%
North West 79.6% 13.3% 7.1%
South Central 85.9% 10.0% 4.2%
South West 79.0% 17.3% 3.8%
West Midlands 79.6% 14.7% 5.7%
Yorkshire and The Humber 75.8% 19.7% 4.4%

48
National Paediatric Diabetes Audit Report 2013-14
Table 33: Retinopathy screening results for young people aged 12 years and older by age, 2013/14
Normal Abnormal Missing
12 years 85.7% 9.2% 5.1%
13 years 84.3% 11.0% 4.7%
14 years 83.5% 12.1% 4.5%
15 years 80.7% 14.7% 4.6%
16 years 75.3% 18.2% 6.5%
17 years 72.9% 19.8% 7.3%
18 years 68.0% 21.6% 10.4%
Table 34: Results of eye screening by deprivation, 2013/14
Normal Abnormal Missing eye screening data
Most deprived 80.0% 15.6% 4.4%
2nd most deprived 79.6% 14.7% 5.7%
3rd most deprived 81.0% 13.7% 5.4%
2nd least deprived 80.5% 14.0% 5.5%
Least deprived 83.4% 12.9% 3.7%
Table 35: Results of eye screening by ethnic group, 2013/14
Normal Abnormal Missing eye screening data
White 79.4% 14.7% 6.0%
Mixed 80.4% 16.2% 3.4%
Asian 86.0% 11.5% 2.5%
Black 84.6% 13.8% 1.5%
Other 89.4% 7.7% 2.9%
Not stated 84.1% 11.3% 4.7%
Missing 86.0% 14.0% 0.0%
The incidence of microvascular complications at these young ages is both significant and alarming. This strengthens the importance of continuing to improve delivery of care and achievement of HbA1c targets. Investment in the form of the Best Practice Tariff in England, peer review and provider clinical networks for paediatric diabetes are beginning to show improvements in glycaemic control with the long term aim to reduce microvascular disease.
5.3 Macrovascular Cardio Vascular Disease (CVD) risk factors
People with diabetes are at an increased risk of cardiovascular disease secondary to macrovascular risk factors which include high blood pressure, abnormal lipid levels, high body mass index and smoking. The data in this section relates to the 15,805 young people aged 12 years and older at the start of the audit period including those that transitioned into adult services during the audit year.

49
National Paediatric Diabetes Audit Report 2013-14
5.3.1 Blood Pressure and lipids
Data presented in Table 14 (section 4.1) shows that 80.2% of young people aged 12 years and older had at least one valid blood pressure measurement and 54.2% had at least one valid total cholesterol measurement in the audit period. Blood pressure in children and young people varies with age and sex. Reference ranges for the general population aged between 4 and 24 years old have been created using survey data from between 1995 and 1998 (Jackson et al., 2007). These ranges define ‘high normal’ blood pressure as between the 91st and 98th centile and ‘high’ blood pressure as above the 98th centile. Using these definitions 26.6% of young people aged 12 years and older with Type 1 diabetes have a ‘high normal’ diastolic blood pressure, 10.8% have a ‘high normal’ systolic blood pressure and 28.1% had a ‘high normal’ diastolic and/or systolic blood pressure in England and Wales (Table 36). 25.0% of young people with diabetes in England and Wales have a ‘high’ diastolic blood pressure, 6.1% had a ‘high’ systolic blood pressure and 27.5% had a ‘high’ diastolic and/or a ‘high’ systolic blood pressure (Table 36). There is some regional variation in high blood pressure with the greatest prevalence found in the South West and the lowest prevalence in the North East. ‘High’ blood pressure is more prevalent in young people with Type 2 diabetes (40.8% have a systolic and/or diastolic blood pressure above the 98th centile) whilst the percentage with ‘high normal’ blood pressure is similar to those with Type 1 diabetes (25.7%).
Table 36: Blood pressure and total cholesterol targets for young people aged 12 years and older with Type 1 diabetes by country and region, 2013/14
Amongst young people with Type 1 diabetes 83.9% had total cholesterol of 5 mmol/l or less and 54.2% had a measurement of 4.0 mmol/l or less (Table 36). A slightly lower percentage of young people with Type 2 diabetes had total cholesterol measurements within these limits (78.9% and 46.7% respectively).
‘High normal’ blood pressure (91st–98th centile)
‘High’ blood pressure (>98th centile)
Total cholesterol
Diastolic Systolic Diastolic and/or systolic
Diastolic Systolic Diastolic and/or systolic
5 mmol/l or less
4 mmol/l or less
England and Wales 26.6% 10.8% 28.1% 25.0% 6.1% 27.5% 83.9% 54.2%
England 26.7% 10.7% 28.1% 25.1% 6.2% 27.7% 83.8% 54.4%
Wales 24.7% 12.4% 28.4% 22.3% 5.1% 23.9% 85.3% 51.1%
East of England 26.4% 10.6% 27.4% 26.1% 6.5% 28.6% 83.1% 51.7%
East Midlands 26.3% 12.0% 28.4% 26.0% 4.9% 28.3% 85.6% 55.6%
London and South East 28.1% 10.8% 29.7% 23.5% 4.5% 25.6% 83.4% 54.4%
North East 27.3% 3.6% 27.7% 21.1% 2.7% 22.1% 77.0% 53.9%
North West 26.9% 9.2% 27.9% 24.4% 5.2% 26.6% 82.9% 54.1%
South Central 26.5% 11.7% 28.4% 22.1% 6.8% 25.8% 85.3% 52.6%
South West 28.0% 11.9% 29.2% 29.8% 7.7% 32.1% 86.4% 59.8%
West Midlands 24.7% 12.4% 27.8% 26.0% 8.2% 29.6% 83.8% 53.2%
Yorkshire and The Humber 25.8% 11.6% 25.9% 26.4% 7.9% 29.7% 84.6% 55.1%
50
National Paediatric Diabetes Audit Report 2013-14
5.3.2 Body Mass Index
The audit data show concerning trends in prevalence of obesity in Type 1 children as they reach adolescence. Overall 94.0% of children and young people included in the audit had at least one valid body mass index (height and weight) measurement recorded (Table 14, section 4.1). Body mass index can be converted into the following categories using the centile definitions based on the UK1990 standards (Pan and Cole, 2012).
• Underweight is below the 5th centile• Healthy weight is between the 5th and 85th centile• Overweight is between the 85th and 95th centile• Obese is above the 95th centile
Using these categories only 61.8% of children aged 0 to 11 years old and 54.2% aged 12 years and older with Type 1 diabetes are of healthy weight with the expectation based on the 1990 standards being 80% (Table 37). Amongst the younger children 18.5% are overweight (expectation 10%) and 18.1% are obese (expectation 5%). These percentages increase to 20.7% and 23.2% respectively for those aged 12 years and older. There is some regional variation in obesity with the highest prevalence in the North of England and Wales.
Comparisons can be made with the National Child measurement Programme in England (National Child measurement Programme in England 2012/13) and the Child Measurement Programme in Wales (Child Measurement Programme in Wales 2012/13). These programmes measure the height and weight of all children in Reception class (aged 4 to 5 years old) in both countries and Year 6 (aged 10 to 11 years old) in England. In England 32.3% of children aged 4 to 5 years old with Type 1 diabetes are overweight or obese compared to 22.2% in the Child Measurement Programme. A similar pattern is found in Wales where 35.7% of children with Type 1 diabetes in the age group are overweight or obese compared to 26.2% within the Child Measurement Programme. Amongst children aged 10 to 11 years old with Type 1 diabetes the prevalence of overweight and obesity was 40.2% compared to 33.3% in the Child Measurement Programme in England. Therefore, despite the secular trends in body mass index since 1990, comparisons with the National Child Measurement Programmes clearly demonstrate a higher prevalence of obesity among children with Type 1 diabetes.

51
National Paediatric Diabetes Audit Report 2013-14
Table 37: Body mass index categories for children and young people with Type 1 diabetes by country and region, 2013/14
Age 0 to 11 years Age 12+ years
Und
erw
eig
ht
Hea
lthy
wei
ght
Ove
rwei
ght
Ob
ese
Mis
sing
BM
I dat
a
Und
erw
eig
ht
Hea
lthy
wei
ght
Ove
rwei
ght
Ob
ese
Mis
sing
BM
I dat
a
England and Wales 1.4% 61.8% 18.5% 18.1% 0.3% 1.7% 54.2% 20.7% 23.2% 0.2%
England 1.4% 61.9% 18.5% 17.9% 0.3% 1.7% 54.3% 20.6% 23.1% 0.2%
Wales 1.3% 59.8% 18.6% 20.1% 0.2% 1.3% 51.5% 22.5% 24.5% 0.3%
East of England 1.2% 65.2% 15.2% 18.1% 0.3% 1.9% 55.6% 20.4% 21.8% 0.2%
East Midlands 1.6% 65.7% 19.8% 12.8% 0.1% 1.7% 52.3% 21.7% 24.3% 0.1%
London and South East 1.8% 64.6% 16.0% 17.3% 0.2% 2.2% 56.8% 20.0% 20.9% 0.1%
North East + 56.1% 21.5% 20.9% 0.4% 1.8% 48.2% 20.4% 29.4% 0.3%
North West 0.8% 56.6% 22.0% 20.4% 0.2% 1.6% 52.9% 21.1% 24.4% 0.1%
South Central 1.3% 64.4% 18.7% 15.4% 0.2% 1.5% 55.6% 20.5% 21.9% 0.5%
South West 1.0% 61.2% 19.8% 17.7% 0.2% 1.3% 56.0% 20.6% 21.8% 0.3%
West Midlands 0.8% 60.7% 19.2% 18.6% 0.7% 1.7% 53.2% 20.9% 23.8% 0.3%
Yorkshire and The Humber 2.2% 59.6% 18.4% 19.8% 0.1% 1.3% 53.5% 20.4% 24.7% 0.1%
+ Data suppressed due to small numbers
Figure 14 shows the distribution of BMI for 0-11 years and those aged 12 years and over with Type 1 diabetes in comparison to the 1990 standards. A clear shift to the right can be seen demonstrating increased levels of being overweight and obese.

52
National Paediatric Diabetes Audit Report 2013-14
Figure 14: Distribution of body mass index of children and young people with Type 1 diabetes, 2013/14
There is a clear deprivation gradient in the prevalence of obesity in children and young people with Type 1 diabetes (Table 38). Amongst children aged 0 to 11 years 22.4% living in the most deprived neighbourhoods are obese compared to 14.7% in the least deprived areas. The same trend is found in young people aged 12 years and over where 27.5% living in the most deprived locations are obese compared to 19.1% in the least deprived neighbourhoods.
Table 38: Body mass index categories for children and young people with Type 1 diabetes by deprivation, 2013/14
Age 0 to 11 years Age 12+ years
Und
erw
eig
ht
Hea
lthy
wei
ght
Ove
rwei
ght
Ob
ese
Mis
sing
BM
I dat
a
Und
erw
eig
ht
Hea
lthy
wei
ght
Ove
rwei
ght
Ob
ese
Mis
sing
BM
I dat
a
Most deprived 1.5% 56.7% 19.2% 22.4% 0.2% 1.9% 50.2% 20.2% 27.5% 0.3%
2nd most deprived 1.4% 60.8% 18.7% 18.6% 0.4% 2.1% 52.9% 20.4% 24.4% 0.1%
3rd most deprived 1.4% 61.2% 18.3% 18.7% 0.3% 1.7% 53.5% 20.7% 24.0% 0.1%
2nd least deprived 1.4% 63.9% 19.0% 15.4% 0.3% 1.3% 55.6% 21.7% 21.2% 0.2%
Least deprived 1.0% 66.6% 17.4% 14.7% 0.2% 1.5% 58.5% 20.5% 19.1% 0.3%
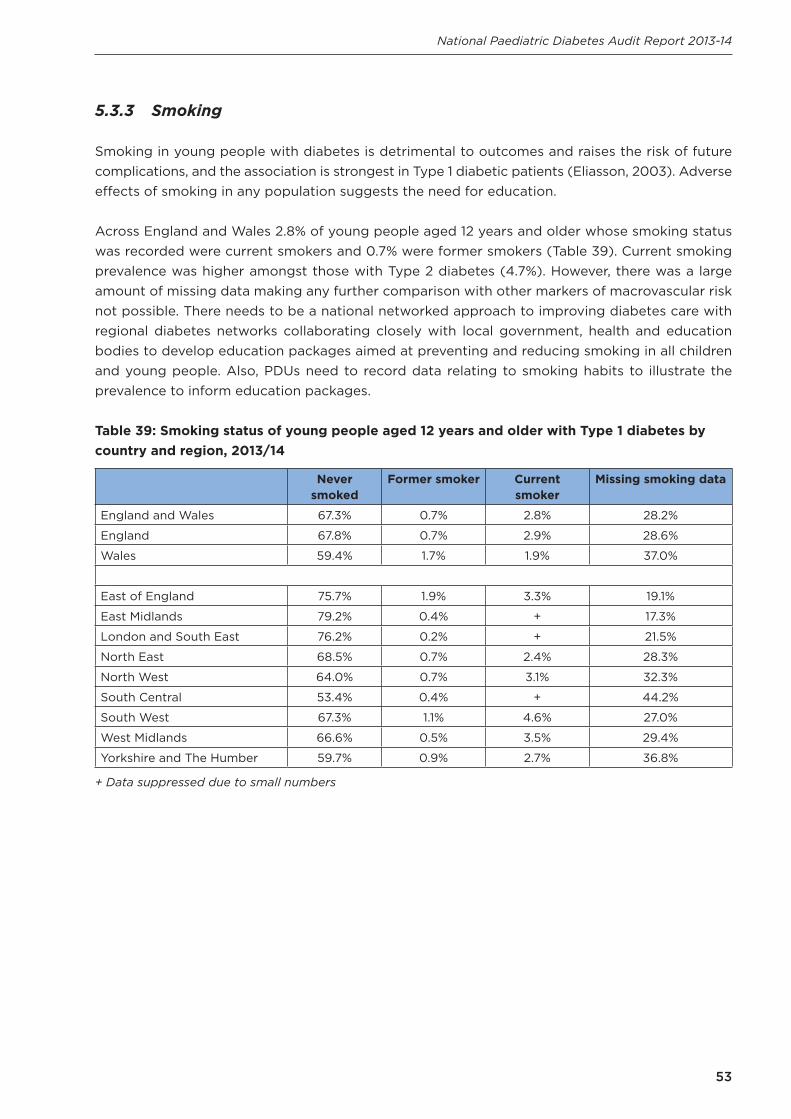
53
National Paediatric Diabetes Audit Report 2013-14
5.3.3 Smoking
Smoking in young people with diabetes is detrimental to outcomes and raises the risk of future complications, and the association is strongest in Type 1 diabetic patients (Eliasson, 2003). Adverse effects of smoking in any population suggests the need for education.
Across England and Wales 2.8% of young people aged 12 years and older whose smoking status was recorded were current smokers and 0.7% were former smokers (Table 39). Current smoking prevalence was higher amongst those with Type 2 diabetes (4.7%). However, there was a large amount of missing data making any further comparison with other markers of macrovascular risk not possible. There needs to be a national networked approach to improving diabetes care with regional diabetes networks collaborating closely with local government, health and education bodies to develop education packages aimed at preventing and reducing smoking in all children and young people. Also, PDUs need to record data relating to smoking habits to illustrate the prevalence to inform education packages.
Table 39: Smoking status of young people aged 12 years and older with Type 1 diabetes by country and region, 2013/14
Never smoked
Former smoker Current smoker
Missing smoking data
England and Wales 67.3% 0.7% 2.8% 28.2%
England 67.8% 0.7% 2.9% 28.6%
Wales 59.4% 1.7% 1.9% 37.0%
East of England 75.7% 1.9% 3.3% 19.1%
East Midlands 79.2% 0.4% + 17.3%
London and South East 76.2% 0.2% + 21.5%
North East 68.5% 0.7% 2.4% 28.3%
North West 64.0% 0.7% 3.1% 32.3%
South Central 53.4% 0.4% + 44.2%
South West 67.3% 1.1% 4.6% 27.0%
West Midlands 66.6% 0.5% 3.5% 29.4%
Yorkshire and The Humber 59.7% 0.9% 2.7% 36.8%
+ Data suppressed due to small numbers
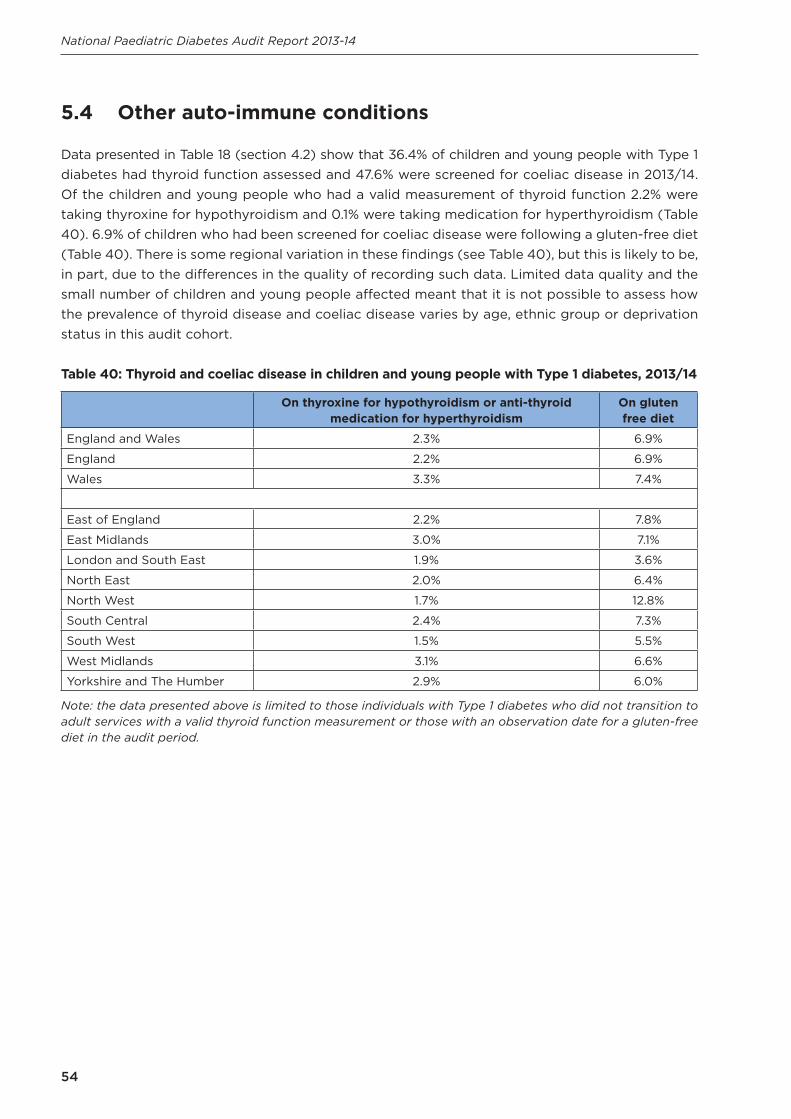
54
National Paediatric Diabetes Audit Report 2013-14
5.4 Other auto-immune conditions
Data presented in Table 18 (section 4.2) show that 36.4% of children and young people with Type 1 diabetes had thyroid function assessed and 47.6% were screened for coeliac disease in 2013/14. Of the children and young people who had a valid measurement of thyroid function 2.2% were taking thyroxine for hypothyroidism and 0.1% were taking medication for hyperthyroidism (Table 40). 6.9% of children who had been screened for coeliac disease were following a gluten-free diet (Table 40). There is some regional variation in these findings (see Table 40), but this is likely to be, in part, due to the differences in the quality of recording such data. Limited data quality and the small number of children and young people affected meant that it is not possible to assess how the prevalence of thyroid disease and coeliac disease varies by age, ethnic group or deprivation status in this audit cohort.
Table 40: Thyroid and coeliac disease in children and young people with Type 1 diabetes, 2013/14
On thyroxine for hypothyroidism or anti-thyroid medication for hyperthyroidism
On gluten free diet
England and Wales 2.3% 6.9%
England 2.2% 6.9%
Wales 3.3% 7.4%
East of England 2.2% 7.8%
East Midlands 3.0% 7.1%
London and South East 1.9% 3.6%
North East 2.0% 6.4%
North West 1.7% 12.8%
South Central 2.4% 7.3%
South West 1.5% 5.5%
West Midlands 3.1% 6.6%
Yorkshire and The Humber 2.9% 6.0%
Note: the data presented above is limited to those individuals with Type 1 diabetes who did not transition to adult services with a valid thyroid function measurement or those with an observation date for a gluten-free diet in the audit period.
55
National Paediatric Diabetes Audit Report 2013-14
6. Structured education and psychologicalsupport
Summary
The 2013/14 audit demonstrates that 45.2% are receiving some form of structured education steadily on an annual basis but there is considerable regional variability in this number ranging from 11.1% in the South West to 62.0% in the North West. The quality and completeness of the data entry in this field was poor, with 45.0% of data missing. Further investigation by this audit is required for more accurate assessment.
Recommendation Managing blood glucose levels and other risk associated outcomes such as blood pressure and cholesterol are a challenging balancing act for children, young people and parents, which impacts on relationships, emotions, health and well-being. Yet less than half of children and young people have access to Structured Education Programmes and there is limited access to psychological assessment when required.
Regional diabetes networks should explore options for developing regional and national Structured Education Programmes to help avoid such wide variability in treatment target outcomes and ensure every child and young person with diabetes receives optimal care wherever they live.
Structured Patient Education Programmes are recommended by NICE as part of the ongoing management of children and young people with diabetes. The NPDA defined a structured education programme for paediatric diabetes as:
‘A programme of self-management education, tailored to the child or young person’s and their family’s needs, both at the time of initial diagnosis and on an ongoing basis throughout the child’s or young person’s attendance at the paediatric diabetes service. This is a programme offered in addition to the education provided at routine outpatient consultations.’
The analysis in this section does not include young people who transitioned into adult services during the audit period as the audit data will not capture the full set of care received by these individuals over the 12 months by these individuals.
Analysis of structured education and psychological support was performed on data for 22,550 children and young people. For the children and young people diagnosed within the audit period 85.4% were recorded as either having received or were receiving structured education before the end of March 2014.

56
National Paediatric Diabetes Audit Report 2013-14
However, when extending the analysis to include all children and young people with diabetes across England and Wales, 45.8% with Type 1 diabetes and 37.9% of those with Type 2 diabetes were recorded as receiving structured education between April 2013 and March 2014 (Table 41). There is clear national and regional variation with only 29.6% of children and young people with all types of diabetes in Wales, as compared to 46.0% in England, receiving structured education. In England this ranged from 11.1% in the South West to 62.0% in the North West. Although some of this variation may be explained by definition of a structured education programme, this analysis nevertheless highlights the paucity of available programmes across England and Wales and calls for a National Programme to be advocated. There are no significant variations in the percentage of children and young people documented as having received structured education by age, sex, ethnic group or deprivation.
Table 41: Percentage of children and young people are documented as having received structured education in the audit period by country and region, 2013/14
Type 1 diabetes Type 2 diabetes All types of diabetes
England and Wales 45.8% 37.9% 45.2%
England 46.7% 38.5% 46.0%
Wales 29.9% 18.2% 29.6%
East of England 39.7% 20.8% 39.0%
East Midlands 51.9% 36.8% 51.4%
London and South East 46.6% 39.5% 45.6%
North East 60.1% 88.9% 60.6%
North West 62.6% 53.1% 62.0%
South Central 61.8% 45.5% 61.3%
South West 11.2% 7.7% 11.1%
West Midlands 38.4% 28.2% 37.8%
Yorkshire and The Humber 54.1% 38.5% 53.0%
Data were collected on the use of Child and Adolescent Mental Health Services (CAMHS) and psychological support but the quality was poor, with data missing for nearly half (45%) of children and young people with diabetes (Table 42). The proportion of children and young people with missing data ranged from 18.2% in South Central to 69.8% in the North East. Across England and Wales 13.1% of children and young people with diabetes had been referred to and seen by CAMHS or psychological support services. A further 1.5% had been referred to these services but there was no evidence that they had been seen yet. The regional variation in use of services is likely to be partially due to the differences in data completeness. There are no significant variations in the use of CAMHS and psychological services by age, sex, ethnic group or deprivation. Better quality data is required before the NPDA can make further comment and analysis around psychological support.

57
National Paediatric Diabetes Audit Report 2013-14
Table 42: Use of Child and Adolescent Mental Health Services and psychological support by country and region, 2013/14
No referral required
Referred and seen
Referred but no evidence of being seen
Missing data
England and Wales 40.4% 13.1% 1.5% 45.0%
England 39.9% 13.5% 1.5% 45.2%
Wales 43.3% 6.2% 1.4% 49.2%
East of England 26.8% 24.3% 1.2% 47.8%
East Midlands 28.5% 28.6% 1.5% 41.4%
London and South East 38.4% 13.0% 1.3% 47.3%
North East 25.3% 4.3% 0.5% 69.8%
North West 54.3% 11.4% 2.3% 32.0%
South Central 59.4% 21.2% 1.2% 18.2%
South West 26.1% 6.9% 1.7% 65.3%
West Midlands 34.8% 3.5% 0.9% 60.8%
Yorkshire and The Humber 59.5% 9.7% 2.3% 28.5%
58
National Paediatric Diabetes Audit Report 2013-14
7. Conclusion
The report has provided useful information for clinical staff, healthcare managers, commissioners, children and young people with diabetes and their families. This report has shown that quality of care for children and young people with diabetes in England and Wales is improving although there remains considerable variability across the two nations and regions.
In summary, the aims of this report were to address questions concerning paediatric diabetes care. Although the percentage of children and young people achieving excellent diabetes control (HbA1c less than 58 mmol/mol) has increased from 15.8% in 2012/13 to 18.4% in 2013/14, some young people are demonstrating evidence of microvascular complications and/or macrovascular risk factors prior to transition into adult services.
Next steps
The variability in care which exists across the country needs addressing both at regional and local level and the recommendations need to be followed in order to observe improvements following the audit periods. There is reliable evidence that quality of care has been improving for children and young people with diabetes in England and Wales, but regional networks need to implement these new recommendations in order to make a significant difference, minimise variation, and maximise best practice to enhance quality improvement.
The NPDA strongly advise healthcare professionals involved in the care of children and young people with diabetes to examine this 2013/14 NPDA report carefully and utilise the results to improve quality of care within their locality. Results from this audit will be utilised by healthcare commissioners and service managers to direct available resource.
The NPDA is an important and powerful measuring arm to facilitate quality improvement and therefore represents an important part of the process for driving up the quality of care provided by PDUs across England and Wales. There is much to learn from each other and PDUs are requested to benchmark themselves against others and explore strategies for quality improvement, while ensuring that data submitted to the audit is both accurate and complete. In doing so, the NPDA will continue to work with PDUs to improve data quality and completeness, drive up quality of care and reduce the risk of long-term morbidity for the future.
Transition
As children and young people with diabetes begin to approach adulthood, developmental and lifestyle changes can impact on their diabetes treatment and levels of glucose control. Currently there is no accepted unifying system for transition from paediatric to adult services. It is therefore important that patients and families are given ample education and support to achieve a good level of glucose control and that provider units work closely with families and patients through transition to maintain it. This is often difficult as young people relocate for education or employment and may access the system on an ad hoc basis – often without recourse to previous care.

59
National Paediatric Diabetes Audit Report 2013-14
The National Diabetes Transition Audit (DTA) is a separate audit linking datasets from both the adult and paediatric national diabetes audits. The DTA will be designed to audit diabetes transition care from paediatric diabetes services to adult diabetes services, as stipulated by the National Service Framework (NSF) for Diabetes. This is a combined project between the Health and Social Care Information Centre (HSCIC) and the NPDA. It is expected that these results will drive improvements by identifying specific deficits that may occur in care process completion and/or glycaemic control during the transition process. A full transition diabetes report is due in June 2016.

60
National Paediatric Diabetes Audit Report 2013-14
8. List of tables and figures
Table number
Title Page number
1Number of children and young people included in the audit by country, region and age, 2013/14
15
2Number of children and young people included in the audit by age, sex and type of diabetes, 2013/14
15
3Ethnic group of children and young people with Type 1 and Type 2 diabetes, 2013/14
16
4Ethnic group of children and young people with Type 1 by country and region, 2013/14
16
5Deprivation score of home post code of children and young people, 2013/14
17
6Prevalence per 100,000 of Type 1 diabetes aged 0 to 15 years by country and region 2013/14
18
7Prevalence per 100,000 of Type 1 diabetes by age (0-16 years) and sex, 2013/14
19
8Estimated minimum prevalence per 100,000 of Type 1 diabetes aged 0 to 15 years by ethnic group, 2013/14
19
9Prevalence of Type 1 diabetes aged 0 to 15 years per 100,000 by deprivation, 2013/14
20
10Incidence of Type 1 diabetes aged 0 to 15 years by country and region, 2013/14
20
11 Incidence per 100,000 of Type 1 diabetes by age and sex, 2013/14 21
12Estimated minimum incidence per 100,000 of Type 1 diabetes aged 0 to 15 years by ethnic group, 2013/14
21
13Incidence of Type 1 diabetes aged 0 to 15 years per 100,000 by deprivation, 2013/14
22
14Percentage of children and young people recorded as receiving care processes by year of audit
25
15 Care processes by type of diabetes, 2013/14 26
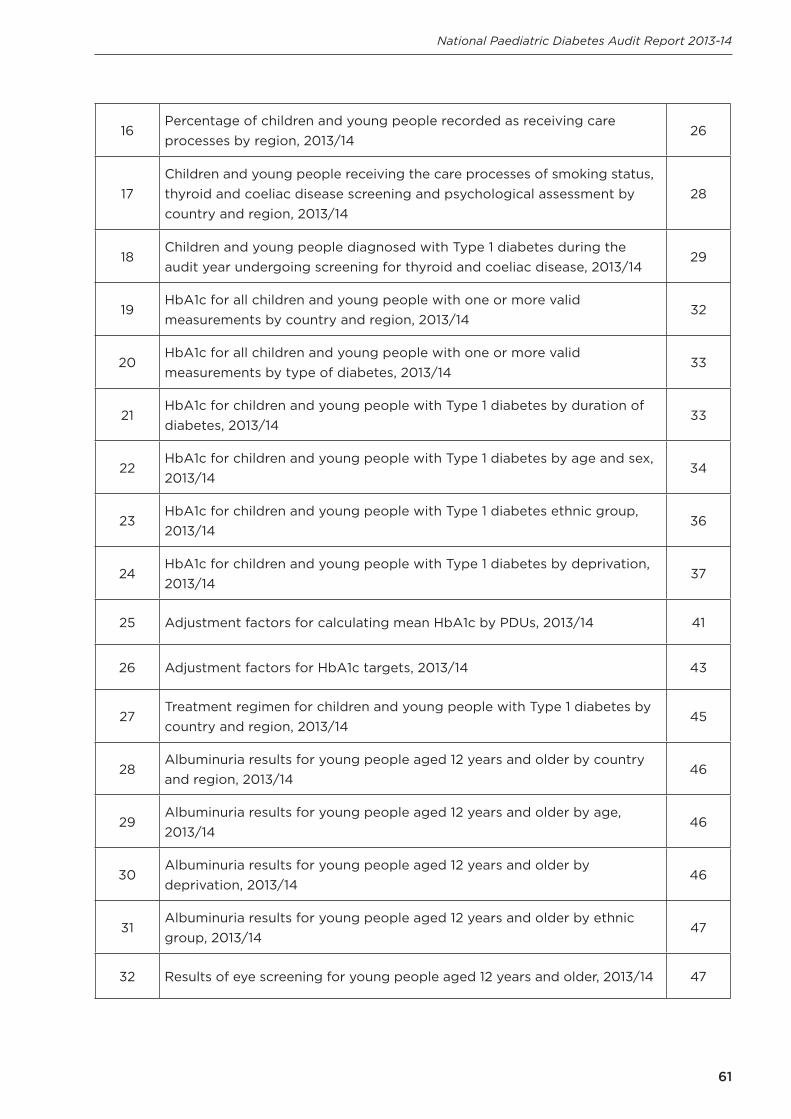
61
National Paediatric Diabetes Audit Report 2013-14
16Percentage of children and young people recorded as receiving care processes by region, 2013/14
26
17Children and young people receiving the care processes of smoking status, thyroid and coeliac disease screening and psychological assessment by country and region, 2013/14
28
18Children and young people diagnosed with Type 1 diabetes during the audit year undergoing screening for thyroid and coeliac disease, 2013/14
29
19HbA1c for all children and young people with one or more valid measurements by country and region, 2013/14
32
20HbA1c for all children and young people with one or more valid measurements by type of diabetes, 2013/14
33
21HbA1c for children and young people with Type 1 diabetes by duration of diabetes, 2013/14
33
22HbA1c for children and young people with Type 1 diabetes by age and sex, 2013/14
34
23HbA1c for children and young people with Type 1 diabetes ethnic group, 2013/14
36
24HbA1c for children and young people with Type 1 diabetes by deprivation, 2013/14
37
25 Adjustment factors for calculating mean HbA1c by PDUs, 2013/14 41
26 Adjustment factors for HbA1c targets, 2013/14 43
27Treatment regimen for children and young people with Type 1 diabetes by country and region, 2013/14
45
28Albuminuria results for young people aged 12 years and older by country and region, 2013/14
46
29Albuminuria results for young people aged 12 years and older by age, 2013/14
46
30Albuminuria results for young people aged 12 years and older by deprivation, 2013/14
46
31Albuminuria results for young people aged 12 years and older by ethnic group, 2013/14
47
32 Results of eye screening for young people aged 12 years and older, 2013/14 47

62
National Paediatric Diabetes Audit Report 2013-14
33Retinopathy screening results for young people aged 12 years and older by age, 2013/14
48
34 Results of eye screening by deprivation, 2013/14 48
35 Results of eye screening by ethnic group, 2013/14 48
36Blood pressure and total cholesterol targets for young people aged 12 years and older with Type 1 diabetes by country and region, 2013/14
49
37 Body mass index categories for children and young people with Type 1 diabetes by country and region, 2013/14
51
38Body mass index categories for children and young people with Type 1 diabetes by deprivation, 2013/14
52
39Smoking status of young people aged 12 years and older with Type 1 diabetes by country and region, 2013/14
53
40Thyroid and coeliac disease in children and young people with Type 1 diabetes, 2013/14
54
41Percentage of children and young people are documented as having received structured education in the audit period by country and region, 2013/14
56
42Use of Child and Adolescent Mental Health Services and psychological support by country and region, 2013/14
57

63
National Paediatric Diabetes Audit Report 2013-14
Figure number
Title Page number
1Percentage of people aged 12 years and older who had all seven care processes by unit, 2013/14
27
2HbA1c for all children and young people with one or more valid measurements by country and region, 2013/14
32
3Mean HbA1c for children and young people with Type 1 diabetes by duration of diabetes, 2013/14
34
4HbA1c for female children and young people with Type 1 diabetes by age, 2013/14
35
5HbA1c for male children and young people with Type 1 diabetes by age, 2013/14
36
6HbA1c for children and young people with Type 1 diabetes ethnic group, 2013/14
37
7HbA1c for children and young people with Type 1 diabetes by deprivation, 2013/14
38
8Funnel plot of mean HbA1c for children and young people with Type 1 diabetes by PDU, 2013/14
39
9Funnel plot of percentage of children and young people with Type 1 diabetes with an HbA1c less than 58 mmol/mol by PDU, 2013/14
39
10Funnel plot of percentage of children and young people with Type 1 diabetes with an HbA1c greater than 80 mmol/mol by PDU, 2013/14
40
11Funnel plot of adjusted mean HbA1c for children and young people with Type 1 by PDU diabetes, 2013/14
42
12Funnel plot of adjusted HbA1c less than 58 mmol/mol by PDU for children and young people with Type 1 diabetes by PDU, 2013/14
43
13Funnel plot of adjusted HbA1c greater than 80 mmol/mol by unit PDU for children and young people with Type 1 diabetes by PDU, 2013/14
44
14Distribution of body mass index of children and young people with Type 1 diabetes, 2013/14
52

64
National Paediatric Diabetes Audit Report 2013-14
9. References
Child Measurement Programme in Wales 2012/13. Available from http://www.wales.nhs.uk/sitesplus/888/page/67795
Eliasson B. (2003) Cigarette smoking and diabetes in Progress in Cardiovascular Diseases. Volume 45, Issue 5, April 2003, pp 405-413.
Health and Social Care Information Centre (2014) National Diabetes Audit – 2012-2013: Report 1, Care Processes and Treatment Targets. Available from http://www.hscic.gov.uk/nda
Jackson L., Thalange N.K.S., Cole T. (2007) Blood pressure centiles for Great Britain in Archives of Disease in Childhood, 2007, Volume 92, pp298-303. BMJ Journals.
National Child Measurement Programme in England 2012/13. Available from http://www.hscic.gov.uk/ncmp
National Clinical Audit Advisory Group (2011) Detection and management of outliers: guidance prepared by National Clinical Audit Advisory Group: Healthcare Quality Improvement Partnership, 2011. Available from http://www.hqip.org.uk/
National Diabetes Audit, Health & Social Care Information Service. Available from http://www.hscic.gov.uk/nda
NICE Clinical Guidelines – CG15: Type 1 diabetes: Diagnosis and management of Type 1 diabetes in children, young people and adults. Available from http://www.nice.org.uk/CG15
Pan H., Cole T.J. (2012) LMS growth, a Microsoft Excel add-in to access growth references based on the LMS method. Version 2.77. Available from http://www.healthforallchildren.co.uk/
Payne R., Babel G. (2012) 'UK indices of multiple deprivation: a way to make comparisons across constituent countries easier' in Health Statistics Quarterly 53, Spring 2012.

65
National Paediatric Diabetes Audit Report 2013-14
10. Acknowledgements
National Paediatric Diabetes Audit Project Board• Professor Anne Greenough, Vice President for Science and Research, RCPCH (Chair)• Dr Fiona Campbell, Consultant Paediatric Diabetologist, Leeds Teaching Hospitals
NHS Trust• Ms Kate Fazakerley, Parent Representative• Ms Helen Thornton, Paediatric Diabetes Specialist Nurse, St Helens and Knowsley
Teaching Hospitals NHS Trust• Dr Justin Warner, Clinical Lead, RCPCH and Consultant in Paediatric Endocrinology
and Diabetes, University of Wales Hospital
National Paediatric Diabetes Audit Clinical Lead• Dr Justin Warner, Clinical Lead, RCPCH and Consultant in Paediatric Endocrinology
and Diabetes, University of Wales Hospital
Project Management• Dr Alison Elderfield (PhD), Project Manager, RCPCH• Mr Siôn Morris, Project Manager, RCPCH• Ms Tyler Moorehead, Programme Manager, RCPCH
Project Support• Ms Naima Hussein, Project Administrator, RCPCH• Ms Melanie David-Feveck, Project Administrator, RCPCH
Data Analysis • Ms Naomi Holman, Data Analyst, University of Glasgow
National Paediatric Diabetes Audit Dataset Working Group• Dr Fiona Campbell, Consultant Paediatric Diabetologist, Leeds Teaching Hospitals
NHS Trust (Chair)• Ms Helen Thornton, Paediatric Diabetes Specialist Nurse, St Helens and Knowsley
Teaching Hospitals NHS Trust• Dr Rakesh Amin, Consultant in Paediatric and Adolescent Endocrinology and
Diabetes, Great Ormond Street Hospital for Children NHS Trust• Dr Jeremy Allgrove, Consultant Paediatric Endocrinologist Bart's Health NHS Trust
(IT solutions Adviser)• Dr James Greening, Consultant Paediatric Endocrinologist and Diabetologist,
University Hospitals Leicester NHS Trust• Dr Piyusha Kapila, Consultant Paediatrician, North Middlesex University Hospital
NHS Trust
National Paediatric Diabetes Audit Patient Reported Experience and Outcome Measures Working Group• Dr Deborah Christie, Consultant Clinical Psychologist and Reader in Paediatric and
Adolescent Psychology, University College London Hospitals NHS Foundation Trust(Chair)

66
National Paediatric Diabetes Audit Report 2013-14
• Ms Judith Campbell, Paediatric Diabetes Specialist Nurse, Central ManchesterUniversity Hospitals NHS Foundation Trust
• Ms Kate Fazakerley, Parent representative• Professor Peter Hindmarsh, Professor of Paediatric Endocrinology, University
College London• Mr Neil Musgrove, Parent representative• Dr Shakeel Rahman, Consultant Paediatrician, Harrogate Health Care NHS Trust• Dr Nicola Trevelyan, Consultant Paediatrician, Southampton University Hospitals
NHS Trust
National Paediatric Diabetes Audit Collaborators• Association of Children’s Diabetes Clinicians• British Dietetic Association• The British Psychological Society• British Society for Paediatric Endocrinology and Diabetes• Diabetes UK• Royal College of Nursing• Juvenile Diabetes Research Foundation (JDRF)

Royal College of Paediatrics and Child Health5-11 Theobalds Road, London, WC1X 8SH
The Royal College of Paediatrics and Child Health (RCPCH) is a registered charity in England and Wales (1057744) and in Scotland (SC038299).
Natio
nal Paed
iatric Diab
etes Aud
it Rep
ort 20
13-14, P
art 1: Care P
rocesses and
Outco
mes
National Paediatric Diabetes Audit Report 2013-14
Part 1: Care Processes and Outcomes