Embed Size (px)
Citation preview
66th Ohio State University Symposium on Molecular Spectroscopy • June 20–24, 2011
HIGH RESOLUTION SPECTROSCOPY AND GLOBAL ANALYSIS OF THE
TETRADECAD REGION OFMETHANE 12CH4
A. NIKITIN,Institute of Atmospheric Optics, 634055 Tomsk, Russia and Laboratoire GSMA, UMR 6089 CNRS-Universit´e de Reims Champagne Ardenne, Moulin de la Housse BP 1039, Cases 16-17, F-51687 Reims Cedex 2, France;
V. BOUDON, C. WENGER,Laboratoire Interdisciplinaire Carnot de Bourgogne, UMR 5209 CNRS-Universit´e de Bourgogne, 9. Av. A. Savary, BP 47870, F-21078 Dijon Cedex, France;
L. R. BROWN,Jet Propulsion Laboratory, California Institute of Technology, 4800 Oak Grove Drive, Pasadena, California 91109, USA;
S. BAUERECKER,Physical Chemistry, ETH Zürich, CH-8093 Zürich, Switzerland and Institut für Physikalische und Theoretische Chemie, Technische Universität Braunschweig, D-38106, Germany;
S. ALBERT, M. QUACK,Physical Chemistry, ETH Zürich, CH-8093 Zürich, Switzerland.

66th Ohio State University Symposium on Molecular Spectroscopy • June 20–24, 2011
Contents
I. The polyads of CH4
II. Analysis of line positions
III. Analysis of line intensities
IV. Conclusions and perspectives

66th Ohio State University Symposium on Molecular Spectroscopy • June 20–24, 2011
I. The polyads of methane

66th Ohio State University Symposium on Molecular Spectroscopy • June 20–24, 2011
The polyads of methane
Glo
bal
fit

66th Ohio State University Symposium on Molecular Spectroscopy • June 20–24, 2011
The Tetradecad vibrational sublevels

66th Ohio State University Symposium on Molecular Spectroscopy • June 20–24, 2011
Tensorial formalism
Systematic expansion of effective Hamiltonian and transition moment up to any order and for any polyad scheme, thanks to group theory and tensorial methods
All interactions are automatically included
Vibrational extrapolation
Global analyses
H Pk{ }
= t s{ } s'{ }Ω K ,nΓ( )ΓvΓv'β RΩ K ,nΓ( ) ⊗ εV s{ } s'{ }
ΓvΓv' Γ( )⎡⎣ ⎤⎦all indexes∑ (A1g )
Parameters Rotation Vibration

66th Ohio State University Symposium on Molecular Spectroscopy • June 20–24, 2011
II. Analysis of line positions
66th Ohio State University Symposium on Molecular Spectroscopy • June 20–24, 2011
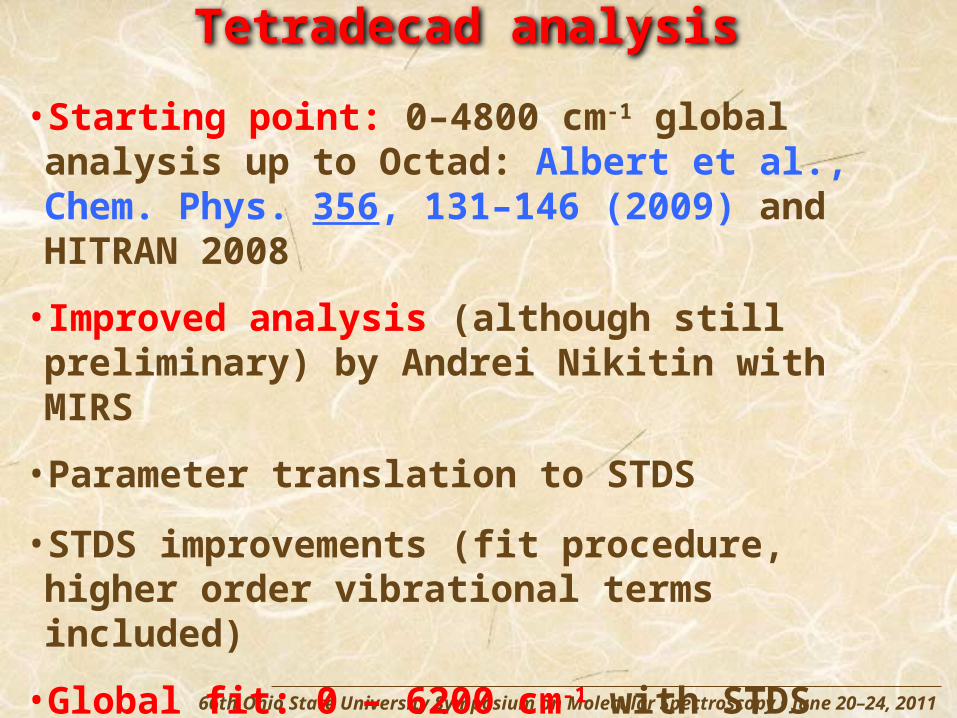
Tetradecad analysis
•Starting point: 0–4800 cm-1 global analysis up to Octad: Albert et al., Chem. Phys. 356, 131–146 (2009) and HITRAN 2008
• Improved analysis (although still preliminary) by Andrei Nikitin with MIRS
•Parameter translation to STDS
•STDS improvements (fit procedure, higher order vibrational terms included)
•Global fit: 0 – 6200 cm-1 with STDS
•Paper to be submitted

66th Ohio State University Symposium on Molecular Spectroscopy • June 20–24, 2011
Fit details
H GS{ } , H Dyad{ } , H Pentad{ } , H Octad{ } , H Tetradecad{ } expanded to order 6, 6, 5, 5, 5, respectively
Total: 19747 data (MW, IR, Raman)
dRMSTetradecad = 23×10−3 cm−1
Number of parameters, ( ) = fitted
Order H GS{ }Tetradecad H Dyad{ }
Tetradecad H Pentad{ }Tetradecad H Octad{ }
Tetradecad H Tetradecad{ }Tetradecad H Tetradecad
0 1 (1) 2 (2) 2 (2) 0 (0) 0 (0) 5 (5)1 0 (0) 2 (2) 5 (5) 0 (0) 0 (0) 7 (7)2 2 (2) 6 (6) 21 (20) 13 (9) 7 (7) 49 (44)3 0 (0) 6 (6) 35 (35) 57 (48) 36 (29) 134 (118)4 3 (3) 13 (13) 71 (65) 183 (147) 219 (113) 489 (341)5 0 (0) 11 (9) 94 (82) 342 (274) 672 (113) 1120 (484)6 4 (4) 22 (20) 0 (0) 0 (0) 0 (0) 26 (24)
Total 10 (10) 62 (53) 228 (209) 596 (478) 896 (747) 1830 (1023)

66th Ohio State University Symposium on Molecular Spectroscopy • June 20–24, 2011
Residuals for line positions
The octad is slightly worse than in Albert et al.(but still OK)

66th Ohio State University Symposium on Molecular Spectroscopy • June 20–24, 2011
Residuals for line positions

66th Ohio State University Symposium on Molecular Spectroscopy • June 20–24, 2011
Calculated levels and mixings

66th Ohio State University Symposium on Molecular Spectroscopy • June 20–24, 2011
Observed levels and mixings

66th Ohio State University Symposium on Molecular Spectroscopy • June 20–24, 2011
III. Analysis of line intensities
66th Ohio State University Symposium on Molecular Spectroscopy • June 20–24, 2011
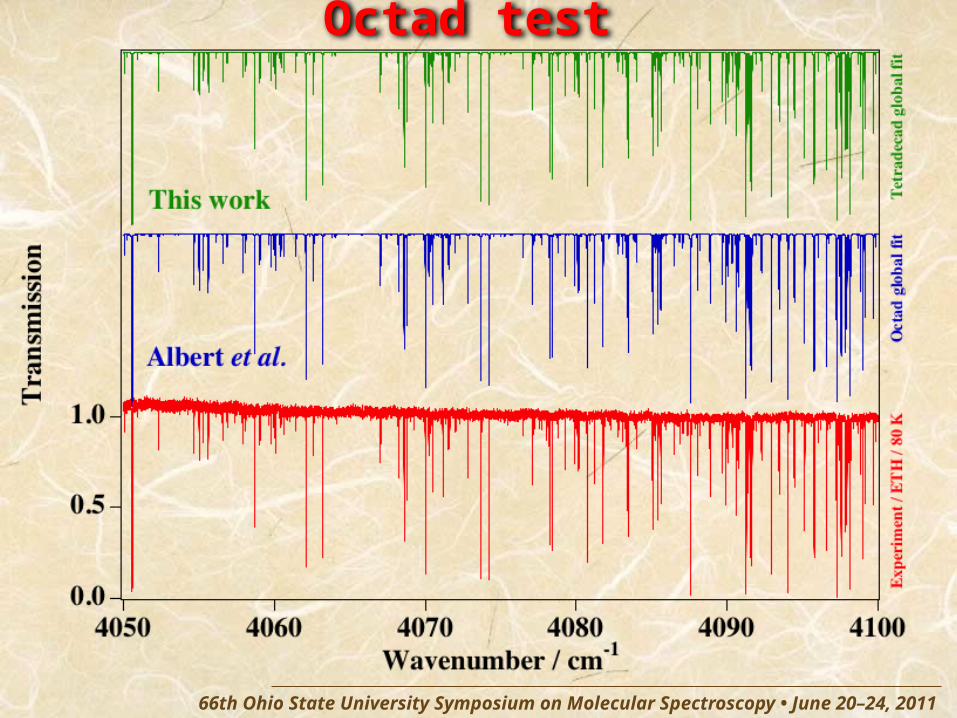
Octad test

66th Ohio State University Symposium on Molecular Spectroscopy • June 20–24, 2011
Residuals for line intensities

66th Ohio State University Symposium on Molecular Spectroscopy • June 20–24, 2011
Global comparison at 296 K

66th Ohio State University Symposium on Molecular Spectroscopy • June 20–24, 2011
Global comparison at 80 K

66th Ohio State University Symposium on Molecular Spectroscopy • June 20–24, 2011
Comparison for 4ν4 at 296 K

66th Ohio State University Symposium on Molecular Spectroscopy • June 20–24, 2011
Comparison for 4ν4 at 78 K

66th Ohio State University Symposium on Molecular Spectroscopy • June 20–24, 2011
IV. Conclusions and perspectives

66th Ohio State University Symposium on Molecular Spectroscopy • June 20–24, 2011
CH4 Spectroscopy: what next?
• Continue the « global fit » approach
• Tetradecad much better but still to improve
• Add new data (positions, intensities, hot bands)
• Icosad, …
• CH4 “windows” (high J, far wings)
• Hot methane (combustions, brown dwarfs, hot jupiters, …)
Titan / Cassini-Huygens Huygens DISR spectra Brown dwarf Gliese 229 B / HST

66th Ohio State University Symposium on Molecular Spectroscopy • June 20–24, 2011
Virtual Atomic and Molecular Data Centerhttp://vamdc.icb.cnrs.fr/PHP/methane.php


![Makerere university 66th Graduation Statistics[1]](https://img.pdfslide.us/doc/110x75/56d6c0571a28ab301699f7d2/makerere-university-66th-graduation-statistics1.jpg)