Embed Size (px)
Citation preview

Section 6.4 The Hypergeometric Probability Distribution 6–1
6.4 THE HYPERGEOMETRIC PROBABILITYDISTRIBUTION
Preparing for This Section Before getting started, review the following:
Objectives 1 Determine whether a probability experiment is a hypergeometricexperiment
2 Compute the probabilities of hypergeometric experiments3 Compute the mean and standard deviation of a hypergeometric
random variable
1 Determine Whether a ProbabilityExperiment Is a HypergeometricExperimentIn Section 6.2, we presented binomial experiments. Recall, the binomial probabilitydistribution can be used to compute the probabilities of experiments when there area fixed number of trials in which there are two mutually exclusive outcomes and theprobability of success for any trial is constant. In addition, the trials must be inde-pendent. Based on the results from Example 6 in Section 5.3, we learned that, whensmall samples are obtained from large finite populations, it is reasonable to assumeindependence of events.That is, when obtaining a sample of size n from a populationwhose size is N, we are willing to assume independence of the events provided that
(the sample size is less than 5% of the population size).What if the requirement of independence is not satisfied? Under these circum-
stances, the experiment is a hypergeometric experiment.
n 6 0.05N
Criteria for a Hypergeometric Probability ExperimentA probability experiment is said to be a hypergeometric experiment provided:
1. The finite population to be sampled has N elements.2. For each trial of the experiment, there are two possible outcomes, successor failure. There are exactly k successes in the population.3. A sample of size n is obtained from the population of size N withoutreplacement.
If a probability experiment satisfies these three requirements, the randomvariable X, the number of successes in n trials of the experiment, follows thehypergeometric probability distribution.We now introduce the notation that we will use.
Notation Used in the Hypergeometric Probability Distribution• The population is size N. The sample is size n.• There are k successes in the population.• Let the random variable X denote the number of successes in the sample of
size n, so x must be greater than or equal to the larger of 0 or and x must be less than or equal to the smaller of n or k.
n - 1N - k2,
• Classical Method (Section 5.1, pp. 263–266)
• Independence (Section 5.3, pp. 286–287)
• Multiplication Rule (Example 6, Section 5.4, p. 297)
• Multiplication Rule of Counting (Section 5.5,pp. 302–305)
• Combinations (Section 5.5, pp. 307–309)
M06_SULL8028_03_SE_C06CD.QXD 7/30/08 6:36 PM Page 6–1
Copyright © 2010 Pearson Education, Inc.
EXAMPLE 1 A Hypergeometric Probability Experiment
Problem: Suppose that a researcher goes to a small college with 200 faculty, 12 ofwhich have blood type O-negative. She obtains a simple random sample of of the faculty and finds that 3 of the faculty have blood type O-negative. Is thisexperiment a hypergeometric probability experiment? List the possible values ofthe random variable X, the number of faculty that have blood type O-negative.
Approach: We need to determine if the three criteria for a hypergeometric exper-iment have been satisfied.
Solution: This is a hypergeometric probability experiment because
1. The population consists of faculty.
2. Two outcomes are possible: the faculty member has blood type O-negative or thefaculty member does not have blood type O-negative. The researcher obtained
successes.
3. The sample is size
The possible values of the random variable are The largest valueof X is 12, because we cannot have more than 12 successes since there are only12 faculty with blood type O-negative in the population.
Notice that we cannot use the binomial probability distribution to determinethe likelihood of obtaining three successes in 20 trials in Example 1 because thesample size is large relative to the population size. That is, is more than 5%of the population size, N = 200.
n = 20
x = 0, 1, 2, Á , 12.
n = 20.
k = 3
N = 200
n = 20
6–2 Chapter 6 Discrete Probability Distributions
The logic behind Formula (1) is based on the Classical Method given on page263, along with the Multiplication Rule of Counting given on page 304. The Classi-cal Method for computing probabilities states that the probability of an event is thenumber of ways the event can occur, divided by the total number of outcomes in
Historical Note
The name hypergeometricis attributed to Leonhard Euler.Eulerwas born in Basel, Switzerland, onApril 15, 1707. His father was aminister and wanted Leonhard tostudy theology as well.However,aftera discussion with Johann Bernoulli, afriend from college, Euler’s fatherallowed him to study mathematicsat the University of Basel. Eulercompleted his studies in 1726. Eulermarried Katharina Gsell on January 7,1734. They had 13 children, only 5 ofwhom survived. Euler claims to havemade many of his greatest discoverieswith a child in his arms and childrencrawling at his feet. In 1740, Euler lostsight in his right eye.One of his famousquotes on this loss is “Now I will haveless distraction.” He eventually lostsight in his other eye as well, but thisdid not slow him down. Euler died onSeptember 18, 1783, in St. Petersburg.
Now Work Problem 5
2 Compute the Probabilities ofHypergeometric ExperimentsThe basis for computing probabilities in a hypergeometric experiment lies in thefact that each sample of size n is equally likely to be chosen. Consider an urn thatcontains 8 white chips and 6 black chips for a total of If we decide torandomly select all possible combinations of chips are equally likely.That is, if we let W1, W2, W8 represent the 8 white chips and B1, B2, B6 rep-resent the 6 black chips, selecting W1, W2, B3 is just as likely as selecting W3, W6, B4.Notice in both cases that we selected 2 white chips and 1 black chip. So, if X repre-sents the number of black chips selected, we have in both cases; however, thechips selected are different (so each represents a different sample).
x = 1
Á ,Á ,n = 3 chips,
N = 14 chips.
Hypergeometric Probability DistributionThe probability of obtaining x successes based on a random sample of size nfrom a population of size N is given by
(1)
where k is the number of successes in the population.
P1x2 =
1kCx21N - kCn - x2 NCn
M06_SULL8028_03_SE_C06CD.QXD 7/30/08 6:36 PM Page 6–2
Copyright © 2010 Pearson Education, Inc.
Section 6.4 The Hypergeometric Probability Distribution 6–3
the experiment. The denominator of Formula (1) represents the number of ways nobjects can be selected from N objects. This represents the number of possible out-comes in the experiment. The numerator consists of two factors. The first factor,
, represents the number of ways we can select the x successes from the k suc-cesses in the population. The second factor, represents the number ofways we can select failures from the failures in the population. Usingthe Multiplication Rule of Counting, we find the number of ways we could obtain xsuccesses from n trials of the experiment.
N - kn - x 1N - k2C1n - x2,
kCx
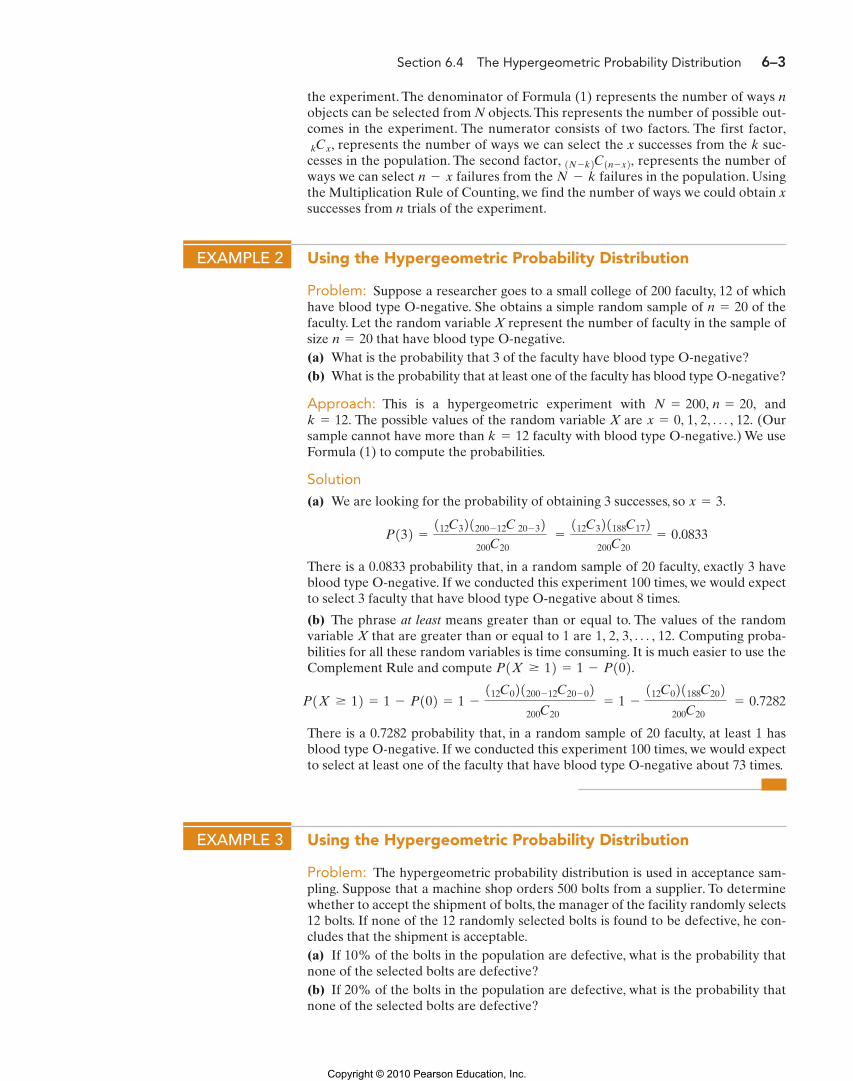
EXAMPLE 2 Using the Hypergeometric Probability Distribution
Problem: Suppose a researcher goes to a small college of 200 faculty, 12 of whichhave blood type O-negative. She obtains a simple random sample of of thefaculty. Let the random variable X represent the number of faculty in the sample ofsize that have blood type O-negative.(a) What is the probability that 3 of the faculty have blood type O-negative?(b) What is the probability that at least one of the faculty has blood type O-negative?
Approach: This is a hypergeometric experiment with andThe possible values of the random variable X are (Our
sample cannot have more than faculty with blood type O-negative.) We useFormula (1) to compute the probabilities.
Solution
(a) We are looking for the probability of obtaining 3 successes, so
There is a 0.0833 probability that, in a random sample of 20 faculty, exactly 3 haveblood type O-negative. If we conducted this experiment 100 times, we would expectto select 3 faculty that have blood type O-negative about 8 times.
(b) The phrase at least means greater than or equal to. The values of the randomvariable X that are greater than or equal to 1 are Computing proba-bilities for all these random variables is time consuming. It is much easier to use theComplement Rule and compute
There is a 0.7282 probability that, in a random sample of 20 faculty, at least 1 hasblood type O-negative. If we conducted this experiment 100 times, we would expectto select at least one of the faculty that have blood type O-negative about 73 times.
P1X Ú 12 = 1 - P102 = 1 -
112C021200 - 12C20 - 02 200C20
= 1 -
112C021188C202 200C20
= 0.7282
P1X Ú 12 = 1 - P102.1, 2, 3, Á , 12.
P132 =
112C321200 - 12C 20 - 32 200C20
= 112C321188C172 200C20
= 0.0833
x = 3.
k = 12x = 0, 1, 2, Á , 12.k = 12.
N = 200, n = 20,
n = 20
n = 20
EXAMPLE 3 Using the Hypergeometric Probability Distribution
Problem: The hypergeometric probability distribution is used in acceptance sam-pling. Suppose that a machine shop orders 500 bolts from a supplier. To determinewhether to accept the shipment of bolts, the manager of the facility randomly selects12 bolts. If none of the 12 randomly selected bolts is found to be defective, he con-cludes that the shipment is acceptable.(a) If 10% of the bolts in the population are defective, what is the probability thatnone of the selected bolts are defective?(b) If 20% of the bolts in the population are defective, what is the probability thatnone of the selected bolts are defective?
M06_SULL8028_03_SE_C06CD.QXD 7/30/08 6:36 PM Page 6–3
Copyright © 2010 Pearson Education, Inc.
6–4 Chapter 6 Discrete Probability Distributions
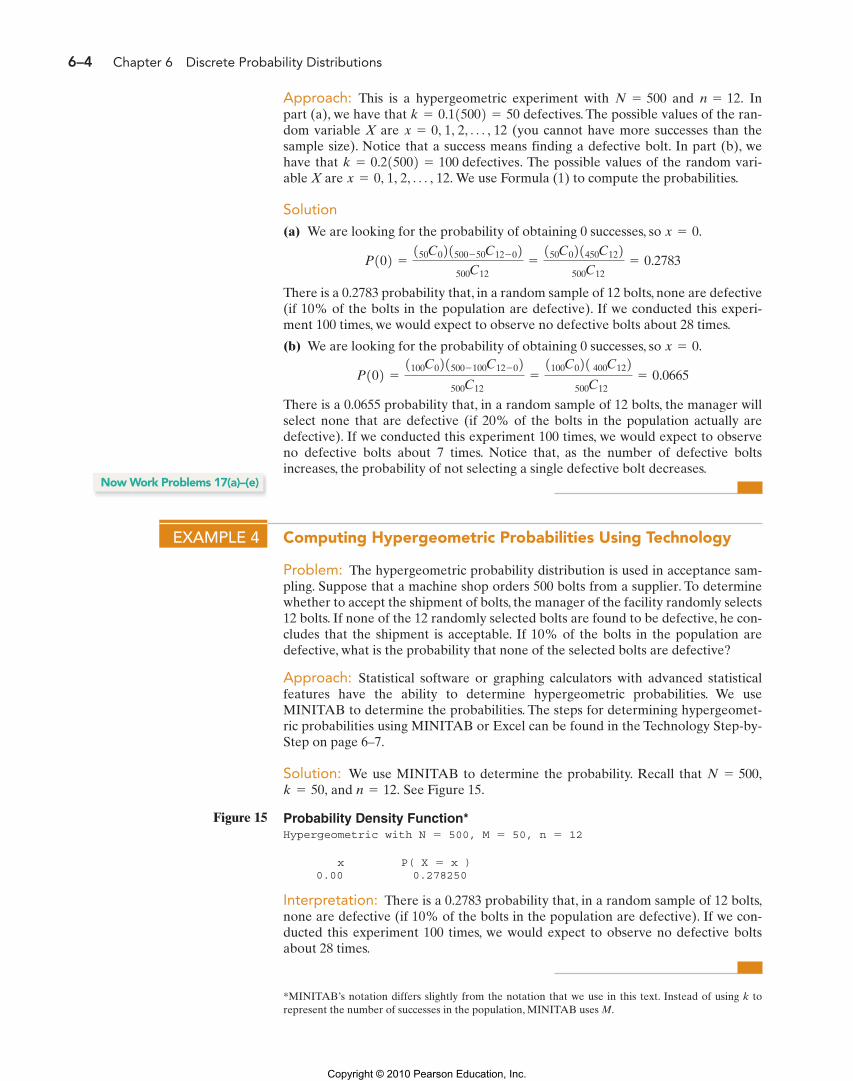
Approach: This is a hypergeometric experiment with and Inpart (a), we have that defectives. The possible values of the ran-dom variable X are (you cannot have more successes than thesample size). Notice that a success means finding a defective bolt. In part (b), wehave that The possible values of the random vari-able X are We use Formula (1) to compute the probabilities.
Solution
(a) We are looking for the probability of obtaining 0 successes, so
There is a 0.2783 probability that, in a random sample of 12 bolts, none are defective(if 10% of the bolts in the population are defective). If we conducted this experi-ment 100 times, we would expect to observe no defective bolts about 28 times.
(b) We are looking for the probability of obtaining 0 successes, so
There is a 0.0655 probability that, in a random sample of 12 bolts, the manager willselect none that are defective (if 20% of the bolts in the population actually aredefective). If we conducted this experiment 100 times, we would expect to observeno defective bolts about 7 times. Notice that, as the number of defective boltsincreases, the probability of not selecting a single defective bolt decreases.
P102 =
1100C021500 - 100C12 - 02 500C12
=
1100C021 400C122 500C12
= 0.0665
x = 0.
P102 =
150C021500 - 50C12 - 02 500C12
=
150C021450C122 500C12
= 0.2783
x = 0.
x = 0, 1, 2, Á , 12.k = 0.215002 = 100 defectives.
x = 0, 1, 2, Á , 12k = 0.115002 = 50
n = 12.N = 500
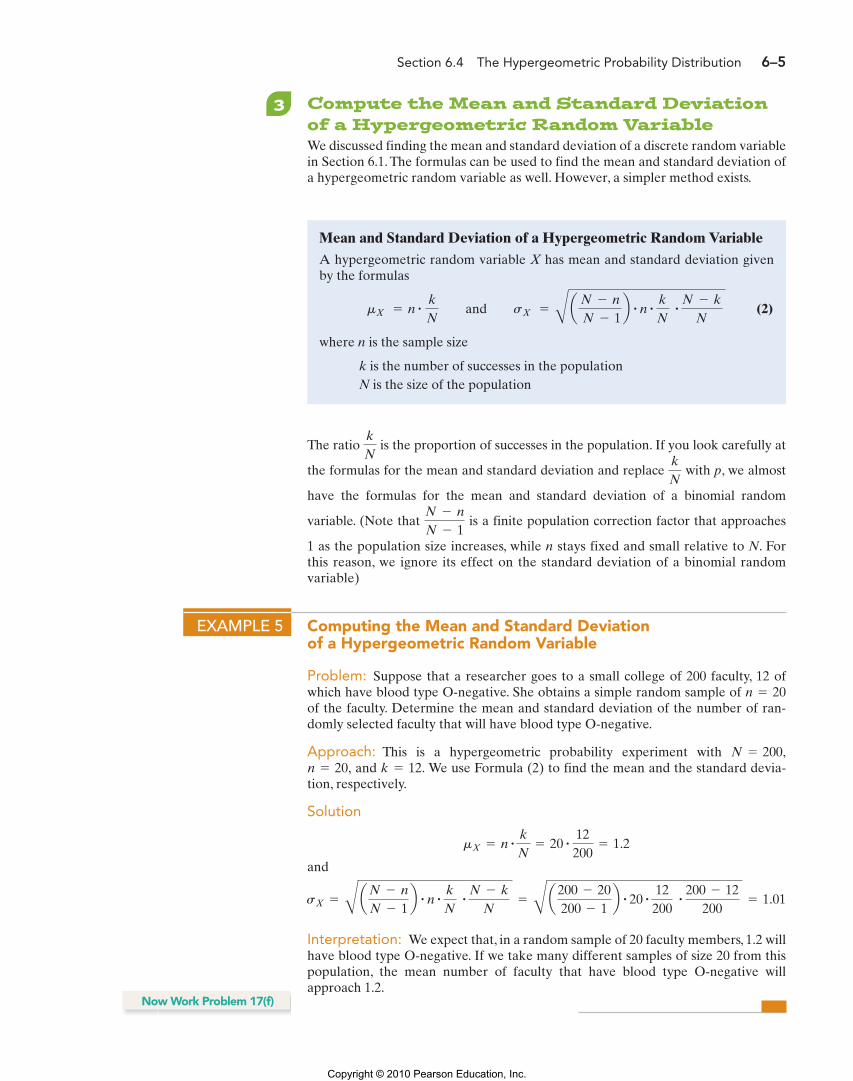
Probability Density Function*Hypergeometric with N � 500, M � 50, n � 12
x P( X � x ) 0.00 0.278250
Figure 15
EXAMPLE 4 Computing Hypergeometric Probabilities Using Technology
Problem: The hypergeometric probability distribution is used in acceptance sam-pling. Suppose that a machine shop orders 500 bolts from a supplier. To determinewhether to accept the shipment of bolts, the manager of the facility randomly selects12 bolts. If none of the 12 randomly selected bolts are found to be defective, he con-cludes that the shipment is acceptable. If 10% of the bolts in the population aredefective, what is the probability that none of the selected bolts are defective?
Approach: Statistical software or graphing calculators with advanced statisticalfeatures have the ability to determine hypergeometric probabilities. We useMINITAB to determine the probabilities. The steps for determining hypergeomet-ric probabilities using MINITAB or Excel can be found in the Technology Step-by-Step on page 6–7.
Solution: We use MINITAB to determine the probability. Recall that and See Figure 15.n = 12.k = 50,
N = 500,
Interpretation: There is a 0.2783 probability that, in a random sample of 12 bolts,none are defective (if 10% of the bolts in the population are defective). If we con-ducted this experiment 100 times, we would expect to observe no defective boltsabout 28 times.
*MINITAB’s notation differs slightly from the notation that we use in this text. Instead of using k torepresent the number of successes in the population, MINITAB uses M.
Now Work Problems 17(a)–(e)
M06_SULL8028_03_SE_C06CD.QXD 8/12/08 4:00 PM Page 6–4
Copyright © 2010 Pearson Education, Inc.
Section 6.4 The Hypergeometric Probability Distribution 6–5
The ratio is the proportion of successes in the population. If you look carefully at
the formulas for the mean and standard deviation and replace with p, we almost
have the formulas for the mean and standard deviation of a binomial random
variable. (Note that is a finite population correction factor that approaches
1 as the population size increases, while n stays fixed and small relative to N. Forthis reason, we ignore its effect on the standard deviation of a binomial randomvariable)
N - n
N - 1
k
N
k
N
3 Compute the Mean and Standard Deviationof a Hypergeometric Random VariableWe discussed finding the mean and standard deviation of a discrete random variablein Section 6.1. The formulas can be used to find the mean and standard deviation ofa hypergeometric random variable as well. However, a simpler method exists.
Mean and Standard Deviation of a Hypergeometric Random VariableA hypergeometric random variable X has mean and standard deviation givenby the formulas
(2)
where n is the sample size
k is the number of successes in the populationN is the size of the population
mX = n # k
N and sX = B a
N - n
N - 1b # n #
k
N #
N - k
N
EXAMPLE 5 Computing the Mean and Standard Deviation of a Hypergeometric Random Variable
Problem: Suppose that a researcher goes to a small college of 200 faculty, 12 ofwhich have blood type O-negative. She obtains a simple random sample of of the faculty. Determine the mean and standard deviation of the number of ran-domly selected faculty that will have blood type O-negative.
Approach: This is a hypergeometric probability experiment with and We use Formula (2) to find the mean and the standard devia-
tion, respectively.
Solution
and
Interpretation: We expect that, in a random sample of 20 faculty members, 1.2 willhave blood type O-negative. If we take many different samples of size 20 from thispopulation, the mean number of faculty that have blood type O-negative willapproach 1.2.
sX = B aN - n
N - 1b # n #
k
N #
N - k
N = B a
200 - 20200 - 1
b # 20 #12200
#200 - 12
200 = 1.01
mX = n #k
N= 20 #
12200
= 1.2
k = 12.n = 20,N = 200,
n = 20
Now Work Problem 17(f)
M06_SULL8028_03_SE_C06CD.QXD 7/30/08 6:36 PM Page 6–5
Copyright © 2010 Pearson Education, Inc.
6–6 Chapter 6 Discrete Probability Distributions
Concepts and Vocabulary1. Explain the similarities and differences between the hyperge-
ometric probability distribution and the binomial probabilitydistribution.
2. What criteria must be satisfied for a random variable X to bea hypergeometric random variable?
3. When listing the possible values of the hypergeometric ran-dom variable X, it must be the case that x is less than or equalto the smaller of n or k. Why?
4. In your own words, explain the logic behind Formula (1).
Skill BuildingIn Problems 5–8, verify that the following probability experimentsrepresent hypergeometric probability experiments.Then determinethe values of N, n, k and list the possible values of the randomvariable X.
5. In Michigan’s Winfall Lottery, a player must choose 6 num-bers between 1 and 49, inclusive. Six balls numberedbetween 1 and 49 are then randomly selected from an urn.The random variable X represents the number of matchingnumbers.
6. In a neighborhood of 95 homes, 35 have pets. Suppose that12 homes are selected at random. The random variable Xrepresents the number of homes in the sample that havepets.
7. A manufacturer received an order of 250 computer chips.Unfortunately, 12 of the chips are defective. To test theshipment, the quality-control engineer randomly selects 20chips from the box of 250 and tests them. The random vari-able X represents the number of defective chips in thesample of 20.
8. A baseball team has 25 players, 7 of whom bat left-handed.Suppose that the manager of this team is frustrated withthe way the team is playing, so he decides to randomlyselect 9 players to play in the upcoming game. The randomvariable X is the number of left-handed batters in thegame.
In Problems 9–12, a hypergeometric probability experiment isconducted with the given parameters. Compute the probabilityof obtaining x successes.
9.
10.
11.
12.
In Problems 13–16, compute the mean and standard deviationof the hypergeometric random variable X.
13.
14.
15.
16. N = 150, n = 10, k = 10
N = 230, n = 15, k = 200
N = 60, n = 8, k = 25
N = 150, n = 20, k = 30
N = 150, n = 10, k = 10, x = 1
N = 230, n = 15, k = 200, x = 12
N = 60, n = 8, k = 25, x = 3
N = 150, n = 20, k = 30, x = 5
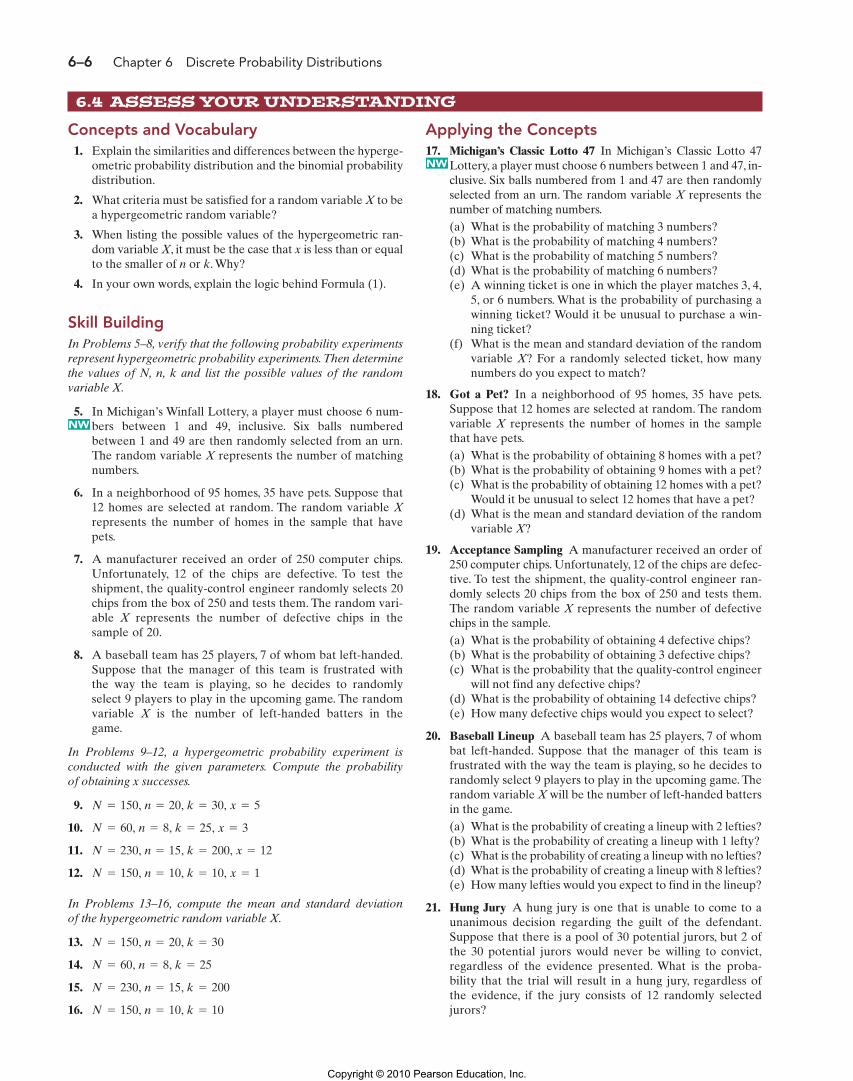
Applying the Concepts17. Michigan’s Classic Lotto 47 In Michigan’s Classic Lotto 47
Lottery, a player must choose 6 numbers between 1 and 47, in-clusive. Six balls numbered from 1 and 47 are then randomlyselected from an urn. The random variable X represents thenumber of matching numbers.(a) What is the probability of matching 3 numbers?(b) What is the probability of matching 4 numbers?(c) What is the probability of matching 5 numbers?(d) What is the probability of matching 6 numbers?(e) A winning ticket is one in which the player matches 3, 4,
5, or 6 numbers. What is the probability of purchasing awinning ticket? Would it be unusual to purchase a win-ning ticket?
(f) What is the mean and standard deviation of the randomvariable X? For a randomly selected ticket, how manynumbers do you expect to match?
18. Got a Pet? In a neighborhood of 95 homes, 35 have pets.Suppose that 12 homes are selected at random. The randomvariable X represents the number of homes in the samplethat have pets.(a) What is the probability of obtaining 8 homes with a pet?(b) What is the probability of obtaining 9 homes with a pet?(c) What is the probability of obtaining 12 homes with a pet?
Would it be unusual to select 12 homes that have a pet?(d) What is the mean and standard deviation of the random
variable X?
19. Acceptance Sampling A manufacturer received an order of250 computer chips. Unfortunately, 12 of the chips are defec-tive. To test the shipment, the quality-control engineer ran-domly selects 20 chips from the box of 250 and tests them.The random variable X represents the number of defectivechips in the sample.(a) What is the probability of obtaining 4 defective chips?(b) What is the probability of obtaining 3 defective chips?(c) What is the probability that the quality-control engineer
will not find any defective chips?(d) What is the probability of obtaining 14 defective chips?(e) How many defective chips would you expect to select?
20. Baseball Lineup A baseball team has 25 players, 7 of whombat left-handed. Suppose that the manager of this team isfrustrated with the way the team is playing, so he decides torandomly select 9 players to play in the upcoming game. Therandom variable X will be the number of left-handed battersin the game.(a) What is the probability of creating a lineup with 2 lefties?(b) What is the probability of creating a lineup with 1 lefty?(c) What is the probability of creating a lineup with no lefties?(d) What is the probability of creating a lineup with 8 lefties?(e) How many lefties would you expect to find in the lineup?
21. Hung Jury A hung jury is one that is unable to come to aunanimous decision regarding the guilt of the defendant.Suppose that there is a pool of 30 potential jurors, but 2 ofthe 30 potential jurors would never be willing to convict,regardless of the evidence presented. What is the proba-bility that the trial will result in a hung jury, regardless ofthe evidence, if the jury consists of 12 randomly selectedjurors?
6.4 ASSESS YOUR UNDERSTANDING
NW
NW
M06_SULL8028_03_SE_C06CD.QXD 7/30/08 6:36 PM Page 6–6
Copyright © 2010 Pearson Education, Inc.
Section 6.4 The Hypergeometric Probability Distribution 6–7
22. Messy Sock Drawer Suppose that you wake up for work inthe dark and find that the lights don’t work in your bed-room. In addition, your sock drawer is a mess and contains12 black socks and 17 blue socks that otherwise look alike.What is the probability that you randomly select two blacksocks if you select exactly 2 socks?
23. Acceptance Sampling Suppose that a concrete manufactur-er has made 200 concrete cylinders that are supposed towithstand 4,000 pounds per square inch of pressure. As thequality-control manager, you decide to randomly test 4 ofthe cylinders to be sure they are manufactured to specifica-tion. You will only accept the shipment if all 4 cylinders pass
the inspection. What is the probability that the shipment isaccepted:(a) If 10% of the 200 cylinders are defective? (b) If 20% of the 200 cylinders are defective?(c) If 40% of the 200 cylinders are defective?(d) If 60% of the 200 cylinders are defective?(e) If 80% of the 200 cylinders are defective?(f) Draw a horizontal axis and label it Percent Defective.
Draw a vertical axis and label it Probability Accept Ship-ment. Plot probability accept shipment against the percentdefective and connect the points in a smooth curve. Thiscurve is referred to as an operating characteristic curve.
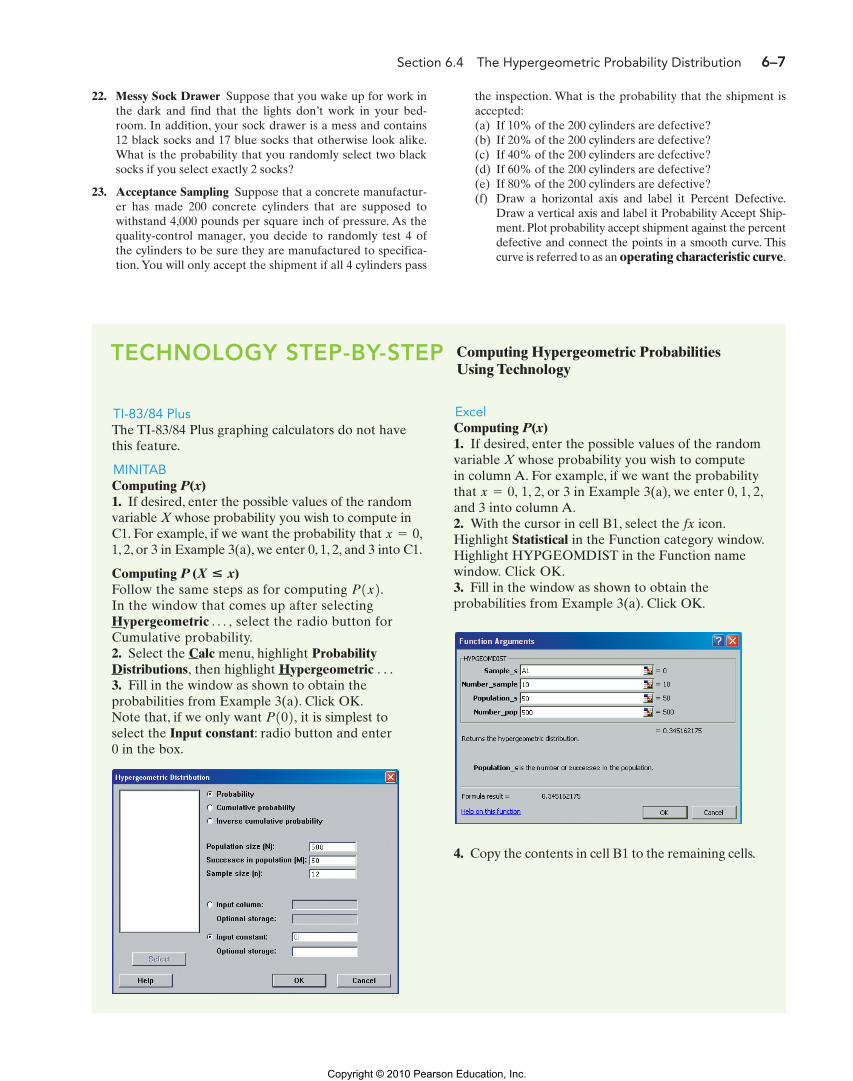
TI-83/84 PlusThe TI-83/84 Plus graphing calculators do not havethis feature.
MINITABComputing P(x)1. If desired, enter the possible values of the randomvariable X whose probability you wish to compute inC1. For example, if we want the probability that 1, 2, or 3 in Example 3(a), we enter 0, 1, 2, and 3 into C1.
Computing Follow the same steps as for computing In the window that comes up after selectingHypergeometric select the radio button forCumulative probability.2. Select the Calc menu, highlight ProbabilityDistributions, then highlight Hypergeometric . . .3. Fill in the window as shown to obtain theprobabilities from Example 3(a). Click OK.Note that, if we only want , it is simplest toselect the Input constant: radio button and enter 0 in the box.
P102
Á ,
P1x2.P (X ◊ x)
x = 0,
TECHNOLOGY STEP-BY-STEP Computing Hypergeometric Probabilities Using Technology
ExcelComputing P(x)1. If desired, enter the possible values of the randomvariable X whose probability you wish to computein column A. For example, if we want the probabilitythat 1, 2, or 3 in Example 3(a), we enter 0, 1, 2,and 3 into column A.2. With the cursor in cell B1, select the fx icon.Highlight Statistical in the Function category window.Highlight HYPGEOMDIST in the Function namewindow. Click OK.3. Fill in the window as shown to obtain theprobabilities from Example 3(a). Click OK.
x = 0,
4. Copy the contents in cell B1 to the remaining cells.
M06_SULL8028_03_SE_C06CD.QXD 7/30/08 6:36 PM Page 6–7
Copyright © 2010 Pearson Education, Inc.

6.4 Assess Your Understanding Answers AN6–1
6.4 Assess Your Understanding (page 000)
5.
7.
9. 0.1856
11. 0.1939
13.
15.
17. (a) 0.01986(b) 0.001146(c) 0.0000229(d) 0.000000093(e) 0.02103(f) 0.766; 0.772; 0.766
19. (a) 0.0087(b) 0.0507(c) 0.3590(d) 0(e) 0.96
21. 0.6483
23. (a) 0.6539(b) 0.4065(c) 0.1270(d) 0.0245(e) 0.0014 (f)
4020 8060 100Percent Defective
0.7
0.6
0.5
0.4
0.3
0.2
0.1
0Pro
babi
lity
Acc
ept S
hipm
ent
mX = 13.0, sX = 1.26
mX = 4, sX = 1.67
N = 250, n = 20, k = 12, X = 0, 1, 2, Á , 12
N = 49, n = 6, k = 6, X = 0, 1, 2, Á , 6
Z01_SULL8028_03_SE_ANS_C06CD.QXD 7/4/08 12:18 AM Page 1
Copyright © 2010 Pearson Education, Inc.