Embed Size (px)
Citation preview

6362 IEEE TRANSACTIONS ON VEHICULAR TECHNOLOGY, VOL. 66, NO. 7, JULY 2017
Evaluating the Impact of User Behavior on D2DCommunications in Millimeter-Wave Small Cells
Chuhan Gao, Yong Li, Member, IEEE, Haohao Fu, Yong Niu, Depeng Jin, Member, IEEE,Sheng Chen, Fellow, IEEE, and Han Zhu, Fellow, IEEE
Abstract—Small cells in millimeter-wave (mmWave) band areable to provide multigigabit access data rates and have emergedas a cost-efficient solution to offer interference-free device-to-device (D2D) communications. In order to improve system per-formances and enhance user experiences, direct transmissions be-tween devices need to be scheduled properly. We first proposea transmission scheduling scheme for radio access of small cellsin the mmWave band, termed directional D2D medium accesscontrol (D3MAC), whereby a path-selection criterion is designedto enable D2D transmissions. Through extensive simulations, wedemonstrate that D3MAC achieves near-optimal performancesand outperforms other schemes significantly in terms of delay andthroughput. Based on this near-optimal scheme, we then evaluatethe impact of user behaviors, including the traffic mode and traf-fic load, as well as user density, denseness, and mobility, on theperformance of D2D communications in mmWave small cells. Ourstudy reveals that the performance of D2D communications is im-proved, as the user density and denseness increase, but this effectis only obvious under heavy traffic loads. Furthermore, user mo-bility is shown to be another important factor that influences theperformance of D2D communications. The system performanceis first improved, as the average user speed increases from static,but the performance is degraded significantly when the user speedbecomes high.
Index Terms—Device-to-device (D2D) communications, mil-limeter wave (mmWave), scheduling, small cells, user behavior.
I. INTRODUCTION
MOBILE data traffic is increasing rapidly, and a signifi-cant increase in the next few years is predicted [1]. In
Manuscript received December 10, 2015; revised May 7, 2016; accepted July29, 2016. Date of publication December 20, 2016; date of current version July14, 2017. This work was supported by the National Basic Research Programof China (973 Program) under Grant 2013CB329105, by the National NatureScience Foundation of China under Grant 61301080 and Grant 91338102, andby the Research Fund of Tsinghua University under Grant 20161080099. Thereview of this paper was coordinated by Prof. S. Tomasin. (Correspondingauthor: Yong Li.)
C. Gao, Y. Li, Y. Niu, and D. Jin are with the Department of ElectronicEngineering, Tsinghua University, Beijing 100084, China (e-mail: [email protected]; [email protected]; [email protected]; [email protected]).
H. Fu is with the Princeton International School of Mathematics and Science,Princeton, NJ 08540 USA (e-mail: [email protected]).
S. Chen is with the Department of Electronics and Computer Science, Uni-versity of Southampton, Southampton SO17 1BJ, U.K., and also with King Ab-dulaziz University, Jeddah 21589, Saudi Arabia (e-mail: [email protected]).
H. Zhu is with the Department of Electrical and Computer Engineering,University of Houston, Houston, TX 77004 USA (e-mail: [email protected]).
Color versions of one or more of the figures in this paper are available onlineat http://ieeexplore.ieee.org.
Digital Object Identifier 10.1109/TVT.2016.2642127
order to improve mobile network capacity so as to meet the ever-increasing demand, device-to-device (D2D) communication isproposed to enable devices to communicate directly, which of-fers an underlaying to the cellular network for improving spec-tral efficiency [2], [3]. Under the control of base stations (BSs),user equipments (UEs) can transmit data to each other throughdirect links using cellular resources instead of through BSs. Con-sequently, it enables physical-proximity communication, whichsaves power while improving spectral efficiency dramatically.D2D communication is expected to be a key feature supportedby next-generation cellular networks [3].
On the other hand, there has been an increasing interest in de-ploying small cells underlying the conventional homogeneousmacrocell network in the design of the next-generation mobilecommunication [4]. This network deployment is usually referredto as heterogeneous cellular networks. Small cell in millimeterwave (mmWave) is a promising technology for future cellularnetworks to provide high-data-rate communications. Unlike ex-isting communication systems that use lower carrier frequen-cies (e.g., from 900 MHz to 5 GHz), mmWave-band smallcells suffer from high propagation loss. The free-space prop-agation loss at 60-GHz band is 28 dB more than that occurred at2.4 GHz [5]. Due to the directionality and high propagation loss,however, the interference between mmWave links is minimal.This is highly advantageous to D2D communications, whichinvolve discovering and communicating with nearby devices.Therefore, the potential of D2D communications in mmWavesmall cells to enhance the network performance is great. Properscheduling over radio access for D2D transmissions in mmWavesmall cells is vital to fully realize this potential.
Moreover, it is necessary to investigate the fundamental fac-tors that influence the achievable performance. Suffering fromhigh propagation loss, mmWave D2D communications can onlyachieve high transmission rates when two UEs are located nearto each other with a line of sight (LOS) between them. The dis-tribution of UEs is, therefore, a key factor, and consequently, theinfluence of the density and denseness of UEs to the achievablesystem performance must be carefully investigated. In a cellularnetwork, D2D communications exploit spatial reuse by offload-ing mobile traffic. However, the offloading capability varies un-der different traffic loads and modes. These factors also impactthe performance of D2D communications. Moreover, currentrelated works mainly considered network scenarios with a staticUE distribution. In other words, the issue of mobility has notbeen fully investigated. Although current research studies are
0018-9545 © 2016 IEEE. Personal use is permitted, but republication/redistribution requires IEEE permission.See http://www.ieee.org/publications standards/publications/rights/index.html for more information.

GAO et al.: EVALUATING THE IMPACT OF USER BEHAVIOR ON D2D COMMUNICATIONS IN MILLIMETER-WAVE SMALL CELLS 6363
meaningful for studying specific cases or snapshots of D2Dcommunications in real-world cellular networks, they did notunveil the impact of user mobility on the achievable system per-formance. UE mobility not only causes the dynamic changesof network topologies, but also results in frequent change ofD2D pairs. Given that 3GPP has recommended several mobil-ity models for performance evaluation [6], it is meaningful andimportant to evaluate and assess the impact of mobility on D2Dperformances.
Aiming to address the above problems, we propose a trans-mission scheduling scheme, termed directional D2D mediumaccess control (D3MAC), for D2D transmissions in mmWavesmall cells. In a D3MAC-enabled cellular system, whenever adirect link between the sender and the receiver of a flow has highchannel quality, the direct transmission will be adopted insteadof transmission through BSs and backhaul networks. Therefore,the proposed D3MAC fully exploits direct transmissions be-tween devices to improve the network performance in terms ofthroughput and delay. Based on our proposed scheme, we eval-uate the D2D communication performance in both static anddynamic networks. Specifically, we assess the system perfor-mance under different UE density and denseness, traffic loads,and modes, as well as user mobility, to analyze how these factorsaffect D2D communications. The contribution of this paper isthreefold, as summarized in the following.
1) We formulate the scheduling problem over radio accesswith direct transmissions between devices into a mixed-integer nonlinear program (MINLP), which minimizes thenumber of time slots to accommodate the transmission de-mand. Concurrent transmissions, i.e., spatial reuses, areexplicitly considered. To solve this problem, we proposean efficient near-optimal scheduling scheme, referred toas D3MAC, which consists of a path selection criterionand a transmission scheduling algorithm. The priority ofD2D transmission is characterized by the path selectionparameter of the path selection criterion, while concur-rent transmissions are fully utilized in the transmissionscheduling to maximize the gain of spatial reuse.
2) We evaluate the impacts of the UE distribution and traf-fic demand as well as the traffic mode jointly on D2Dcommutations underlaying mmWave small cells. Specifi-cally, we observe that generally increasing UE density anddenseness benefit D2D communications, but, under lighttraffic loads, this improvement is barely observable. Inaddition, highly erratically arriving traffic flow degradesthe D2D performance, especially under heavy traffic loadsand with low UE density and denseness. Explanations aregiven on how these factors affect D2D communicationsand network performances.
3) We carry out the study not only in static networks butalso in dynamic networks to evaluate the impact of UEmobility on D2D communications. It is observed that theperformance is improved under low UE speed, where themobility enables more D2D pairs to establish, comparedwith the static case. However, D2D communications per-form poorly in high-UE-mobility networks as a result ofthe frequent changes of D2D pairs.
This paper is organized as follows. After presentingthe related work in mmWave cellular networks and D2Dcommunications in Section II, Section III introduces the systemmodel and overview. In Section IV, we formulate the schedul-ing problem for radio access in mmWave small cells, whileSection V is devoted to our proposed D3MAC scheme, whichincludes a path selection criterion and a transmission schedulingalgorithm. In Section VI, we demonstrate that D3MAC is ableto achieve a near-optimal performance in terms of networkthroughput and transmission delay. We also evaluate the impactof UE density and denseness as well as traffic loads and trafficmodes on the performance of D2D communications in staticnetworks. We then involve UE mobility in the discussion andevaluate its impact on the D2D communications in Section VII.We conclude the paper in Section VIII.
II. RELATED WORK
Recently, a number of studies have investigated the mmWavetechnology for cellular networks. Wei et al. [7] discussed six keyelements to enable mmWave communications in future 5G net-works and addressed some possible approaches. Scott-Haywardet al. [8] defined and evaluated important metrics to characterizemultimedia quality of service (QoS) and designed a QoS-awarescheduling scheme. In terms of small cells in the mmWavebands, most works focused on using bands in 28, 38, and 73 GHzto attain communication ranges in the order of 200 m or evenmore [9]. Zhu et al. [10] proposed a 60-GHz picocell architec-ture to augment with the existing LTE networks for achieving asignificant increase in capacity.
We focus on the performance of D2D communications inmmWave cellular networks. By contrast, the majority of the ex-isting research studies have been conducted on D2D communi-cations at lower frequencies. Lin et al. [6] provided an overviewof D2D standardization activities in 3GPP and identified sev-eral technical challenges. Qiao et al. [11] proposed an effectiveresource-sharing scheme by allowing noninterfering D2D linksto operate concurrently. Although D2D communication maybring enhancement for spectral efficiency, it also causes inter-ference as the result of spectrum sharing. For mmWave D2Dcommunications, current research works have mainly studiedthe problems of power control [12], resource allocation [13],and interference management [14], [15]. Taking advantage ofhigh propagation loss and directional antennas, D2D links canbe supported in mmWave 5G networks to enhance network ca-pacity and improve spectrum efficiency. Instead of just focusingon transmission schemes or power control, we further investi-gate the factors that have important impacts on D2D communi-cation and evaluate how these factors influence the achievableperformance.
Some of the existing studies have analyzed the performance ofD2D communications underlaying systems. Yu et al. [12] eval-uated the performance of D2D communication by considering ascenario, where only limited interference coordination betweenthe cellular and D2D communications is possible. Works [16],[17] evaluated the D2D systems under different transmissionschemes or mode selection mechanisms. The existing work has

6364 IEEE TRANSACTIONS ON VEHICULAR TECHNOLOGY, VOL. 66, NO. 7, JULY 2017
Fig. 1. Illustration of dense deployment of mmWave small cells underlying amacrocell network.
focused on the scenario of microscale cellular networks withlower frequencies. By contrast, we extensively consider the keyfactors related to the user distribution and traffic demand andinvestigate their impacts on the performance of D2D commu-nications in mmWave small cells. To the best of our knowl-edge, there exists no previous study evaluating the influences ofuser behavior and traffic demands on D2D communications inmmWave small cells.
III. SYSTEM MODEL AND PROBLEM OVERVIEW
A. System Model
Fig. 1 illustrates a typical scenario for dense deployment ofmmWave small cells underlying the cellular network. In eachsmall cell, there are several UEs and an access point (AP),which synchronizes the clocks of UEs and provides access ser-vices within the small cell. The APs form a mmWave wirelessbackhaul network, and the backhaul links are optimized in orderto achieve high channel quality and reduce interference. There-fore, we assume that the backhaul links are fixed with optimalscheduling, and we focus on the radio access, where D2D com-munications are enabled and traffic demands can be transmittedthrough direct links between nearby UEs instead of throughthe backhaul network. Some APs are connected to the Internetvia high-speed wired connections, which are called gateways.The remaining APs must communicate with a gateway in or-der to send (receive) data to (from) the Internet. To overcomehuge path attenuation, both the UEs and APs achieve directionaltransmissions with electronically steerable directional antennasby beamforming techniques [18].
In the system, there is a centralized controller in the network[19], which usually resides on a gateway. The system resourceis partitioned into nonoverlapping time slots of equal length,and the controller synchronizes the clocks of APs. Then, theclocks of UEs are synchronized by their corresponding APs.There is a bootstrapping program in the system, by which thecentral controller knows the up-to-date network topology andthe location information of APs and UEs [20], [21].
In this system, transmissions occur on two types of paths:ordinary and direct paths. A direct path is a direct transmissionpath from source (a UE) to destination (another UE), which
does not pass through the backhaul network. An ordinary path isa transmission path through APs, which may include the accesslink from the source to its associated AP, the backhaul pathfrom the source’s AP to the destination’s AP or gateway, andthe access link from the destination’s associated AP to the des-tination. The achievable transmission rates for ordinary pathsand direct paths can be obtained via a channel transmission-ratemeasurement procedure [22]. In this procedure, the transmitterof each link transmits measurement packets to the receiverfirst. Then, with the measured signal-to-noise ratio (SNR)of received packets, the receiver estimates the achievabletransmission rate and determines the appropriate modulationand coding scheme by the table related to the SNR value withthe appropriate modulation and coding scheme.
With directional transmissions, there exists less interferencebetween links. Under low multiuser interference (MUI), con-current transmissions can be utilized [23]. The definition ofadjacent flows in our system is given as follows: Any two flowsare adjacent if the selected links of them share a common node,which can either be an BS or a user device. Two adjacent flowscannot be scheduled concurrently, since all nodes are assumedto be half-duplex, and each of them has at most one connec-tion with one neighbor [24]. We denote link i from sender si todestination ri by (si, ri), and its transmission rate by csi ,ri
. Fortwo nonadjacent links, we adopt the interference model in [23].Specifically, for links (si, ri) and (sj , rj ), the received powerfrom si to rj can be calculated according to
Prj ,si= fsi ,rj
k0Ptl−γsi ,rj
(1)
where Pt is the transmission power that is fixed, k0 =10PL(d0)/10 is the constant scaling factor corresponding to thereference path loss PL(d0), with d0 being equal to 1 m, lsi ,rj
is the distance between node si and node rj , and γ is the pathloss exponent [23]. The directional indicator fsi ,rj
indicateswhether si and rj direct their beams toward each other. If thisis the case, fsi ,rj
= 1; otherwise, fsi ,rj= 0. Thus, the desired
signal-to-interference-plus-noise ratio (SINR) at rj , denoted bySINRsj ,rj
, can be calculated according to
SINRsj ,rj=
k0Ptl−γsj ,rj
WN0 + ρ∑
i �=j fsi ,rjk0Ptl
−γsi ,rj
(2)
where ρ is the MUI factor related to the cross correlation of thesignals from different links, W is the bandwidth, and N0 is theone-sided power spectra density of white Gaussian noise [23].For link (si, ri), the minimum SINR to support its transmis-sion rate csi ,ri
is denoted as MS(csi ,ri
). Therefore, concurrent
transmissions can be supported if the SINR of each link (si, ri)is larger than or equal to MS
(csi ,ri
).
There are two kinds of flows transmitted in the network:the flows between UEs and the flows from or to the Internet(gateway). We assume that there are Nf flows in the network.For flow i, its traffic demand is denoted as di . The traffic demandvector for all the flows is denoted by d, a 1 × Nf row vectorwhose ith element is di . For each flow, there are two possibletransmission paths in the system: ordinary path and direct path.A flow transmitted via an ordinary path is inherently multihop,

GAO et al.: EVALUATING THE IMPACT OF USER BEHAVIOR ON D2D COMMUNICATIONS IN MILLIMETER-WAVE SMALL CELLS 6365
while a flow transmitted via a direct path is single hop. For thelth hop link of the ordinary path for flow i, we denote its senderas so
l(i) and receiver as rol(i) and denote this link as
(so
l(i) , rol(i)
).
We denote the direct link of flow i as(sd
i , rdi
), with sd
i as thesource and rd
i as the destination. If no confusion is caused, thesuperscripts o and/or d may be dropped.
Let the maximum number of hops of the ordinary paths beHmax . Then, for each flow i, its 1 × Hmax transmission-ratevector on the ordinary path is denoted as co
i , where each elementcol(i) represents the transmission rate of the lth hop. We also
denote the Nf × Hmax transmission-rate matrix for the ordinarypaths of all flows by Co , whose ith row is simply co
i . Thetransmission rate of the direct path for flow i is denoted as cd
i ,and the 1 × Nf transmission-rate vector for the direct paths ofall flows is denoted as cd , whose ith element is cd
i .
B. Operation Procedure and Problem Overview
The proposed D3MAC is a frame-based medium access con-trol (MAC) protocol similar to the frame-based scheduling di-rectional MAC (FDMAC) of [24]. Each frame consists of ascheduling phase and a transmission phase, and the schedulingoverhead in the scheduling phase can be amortized over multi-ple concurrent transmissions in the transmission phase as in theFDMAC of [24]. In the scheduling phase, AP polls its associ-ated UEs successively for their traffic demands and reports tothe central controller through the backhaul network. Based onthe transmission rates of links, the central controller computes aschedule to accommodate the traffic demands of all flows. Then,the central controller pushes the schedule to the APs throughthe backhaul network, and each AP pushes the schedule to itsUEs. In the transmission phase, UEs and APs communicate witheach other following the schedule until the traffic demands ofall flows are accommodated. The transmission phase consists ofmultiple stages, and in each stage, multiple flows are activatedsimultaneously for concurrent transmissions. In a stage, severalselected flows transmit the packets through the path selected bythe path selection algorithm of D3MAC. Since each flow mayconsist of different hops, the number of hops of each stage isalso unfixed. The number of slots of a stage is not fixed, eitherdue to the fact that the transmissions of each flow require differ-ent number of slots. Both the number of hops and the number ofslots of a stage depend on which flows are activated. A stage fin-ishes after all the selected flows clear their traffic. In the schedulecomputation, the transmission path needs be selected optimallybetween the direct path and ordinary path for each flow, and theschedule should accommodate the traffic demands of flows witha minimum number of time slots to fully exploit spatial reuse.It should be noted that the number of hops of a flow is unknownuntil D3MAC determines which path to select for transmission.
Let us illustrate the basic idea of D3MAC with Fig. 2, wherethere are three small cells. In cell 1, UEs A and C are associatedwith AP1; in cell 2, UE B is associated with AP2; and in cell3, UE D is associated with AP3. Assume that there are twoflows in the network: A→B and C→D. The traffic demandsof A→B and C→D are 6 and 8, respectively, and thus, d =[6 8]. Numerically, they are equal to the number of packets
Fig. 2. Example of D3MAC with three small cells.
to be transmitted, assuming that the packet length is fixed. Thetransmission-rate matrix for the ordinary paths of flows obtainedby the measuring procedure is
Co =
[2 3 2
2 4 2
]
(3)
which indicates that the transmission rates of links A→AP1,AP1→AP2, and AP2→B are 2, 3, and 2, respectively, while therates of links C→AP1, AP1→AP3, and AP3→D are 2, 4, and 2,respectively. If direct transmission is not enabled, AP1 cannotbe scheduled to serve the transmissions of UE A and UE B at thesame time due to the half-duplex restriction. In addition, AP 2should wait to receive all the packets from UE A before startingtransmitting them to UE B, since it is not able to transmit to UEB and receive packets from AP 1 at the same time. According toCo and d, these two flows need eight and ten time slots to clearall the traffic demands, respectively. Assume that AP 1 servesUE A first and serves UE C after it forwarded the traffic of A toAP2; 15 time slots are required to clear all the traffic in total. Onthe other hand, the transmission-rate vector for the two directpaths is measured to be cd = [3 2]. This indicates that the directlink of A→B can transmit three packets in one time slot, and thedirect link of C→D can transmit two packets in one time slot.
Clearly, for each flow, we need to first select the optimaltransmission path between its direct path and ordinary path.The optimal schedule needs to accommodate the traffic demandof flows with a minimum number of time slots. In other words,concurrent transmission should be fully exploited in the sched-ule. For the example in Fig. 2, the direct links of the both flowsshould be enabled to enhance performances. According to cd
and d, these two flows need two and four slots to clear theirtraffic demands, respectively. Moreover, the two direct pathscan be scheduled for concurrent transmission, since they haveno common node. Therefore, only four time slots are neededin total. This simple example clearly shows that the selectionof transmission paths for flows has a significant impact on the
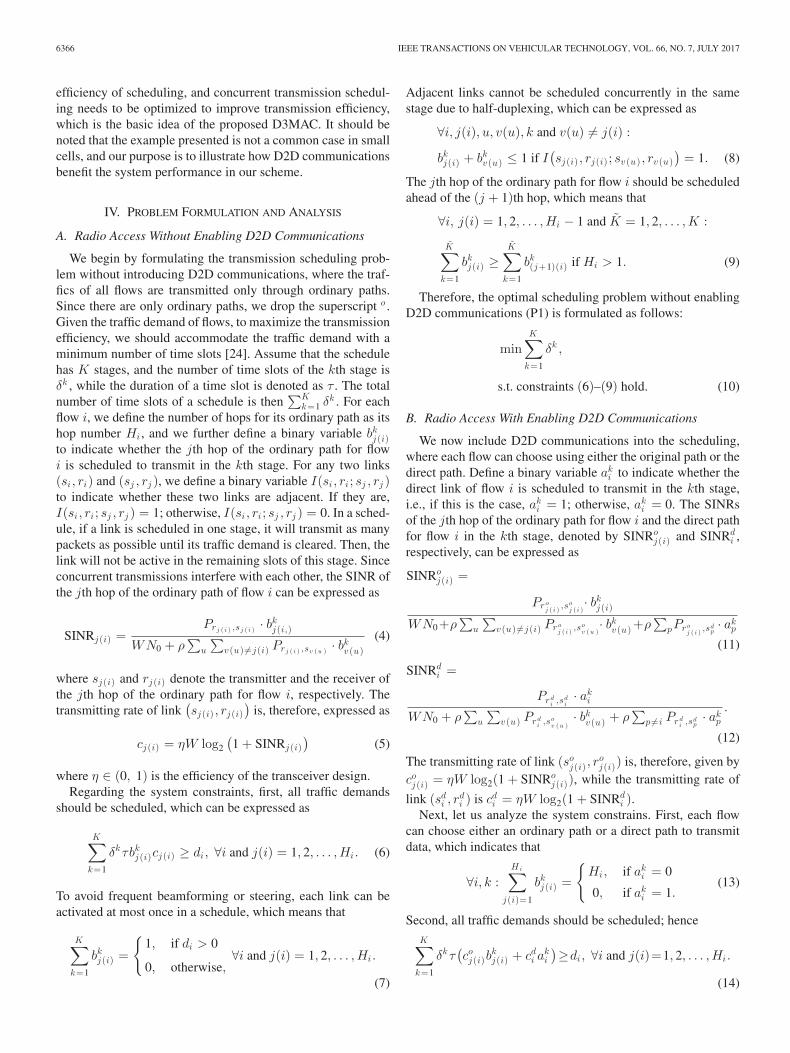
6366 IEEE TRANSACTIONS ON VEHICULAR TECHNOLOGY, VOL. 66, NO. 7, JULY 2017
efficiency of scheduling, and concurrent transmission schedul-ing needs to be optimized to improve transmission efficiency,which is the basic idea of the proposed D3MAC. It should benoted that the example presented is not a common case in smallcells, and our purpose is to illustrate how D2D communicationsbenefit the system performance in our scheme.
IV. PROBLEM FORMULATION AND ANALYSIS
A. Radio Access Without Enabling D2D Communications
We begin by formulating the transmission scheduling prob-lem without introducing D2D communications, where the traf-fics of all flows are transmitted only through ordinary paths.Since there are only ordinary paths, we drop the superscript o .Given the traffic demand of flows, to maximize the transmissionefficiency, we should accommodate the traffic demand with aminimum number of time slots [24]. Assume that the schedulehas K stages, and the number of time slots of the kth stage isδk , while the duration of a time slot is denoted as τ . The totalnumber of time slots of a schedule is then
∑Kk=1 δk . For each
flow i, we define the number of hops for its ordinary path as itshop number Hi , and we further define a binary variable bk
j (i)to indicate whether the jth hop of the ordinary path for flowi is scheduled to transmit in the kth stage. For any two links(si, ri) and (sj , rj ), we define a binary variable I(si, ri ; sj , rj )to indicate whether these two links are adjacent. If they are,I(si, ri ; sj , rj ) = 1; otherwise, I(si, ri ; sj , rj ) = 0. In a sched-ule, if a link is scheduled in one stage, it will transmit as manypackets as possible until its traffic demand is cleared. Then, thelink will not be active in the remaining slots of this stage. Sinceconcurrent transmissions interfere with each other, the SINR ofthe jth hop of the ordinary path of flow i can be expressed as
SINRj (i) =Prj ( i ) ,sj ( i ) · bk
j (i,)
WN0 + ρ∑
u
∑v (u) �=j (i) Prj ( i ) ,sv (u ) · bk
v (u)(4)
where sj (i) and rj (i) denote the transmitter and the receiver ofthe jth hop of the ordinary path for flow i, respectively. Thetransmitting rate of link
(sj (i) , rj (i)
)is, therefore, expressed as
cj (i) = ηW log2
(1 + SINRj (i)
)(5)
where η ∈ (0, 1) is the efficiency of the transceiver design.Regarding the system constraints, first, all traffic demands
should be scheduled, which can be expressed as
K∑
k=1
δk τbkj (i)cj (i) ≥ di, ∀i and j(i) = 1, 2, . . . ,Hi. (6)
To avoid frequent beamforming or steering, each link can beactivated at most once in a schedule, which means that
K∑
k=1
bkj (i) =
{1, if di > 0
0, otherwise,∀i and j(i) = 1, 2, . . . ,Hi.
(7)
Adjacent links cannot be scheduled concurrently in the samestage due to half-duplexing, which can be expressed as
∀i, j(i), u, v(u), k and v(u) �= j(i) :
bkj (i) + bk
v (u) ≤ 1 if I(sj (i) , rj (i) ; sv (u) , rv (u)
)= 1. (8)
The jth hop of the ordinary path for flow i should be scheduledahead of the (j + 1)th hop, which means that
∀i, j(i) = 1, 2, . . . ,Hi − 1 and K = 1, 2, . . . , K :
K∑
k=1
bkj (i) ≥
K∑
k=1
bk(j+1)(i) if Hi > 1. (9)
Therefore, the optimal scheduling problem without enablingD2D communications (P1) is formulated as follows:
minK∑
k=1
δk ,
s.t. constraints (6)–(9) hold. (10)
B. Radio Access With Enabling D2D Communications
We now include D2D communications into the scheduling,where each flow can choose using either the original path or thedirect path. Define a binary variable ak
i to indicate whether thedirect link of flow i is scheduled to transmit in the kth stage,i.e., if this is the case, ak
i = 1; otherwise, aki = 0. The SINRs
of the jth hop of the ordinary path for flow i and the direct pathfor flow i in the kth stage, denoted by SINRo
j (i) and SINRdi ,
respectively, can be expressed as
SINRoj (i) =
Proj ( i ) ,s
oj ( i )
· bkj (i)
WN0+ρ∑
u
∑v (u) �=j (i) Pro
j ( i ) ,sov (u )
· bkv (u) +ρ
∑pPro
j ( i ) ,sdp· ak
p
(11)
SINRdi =
Prdi ,sd
i· ak
i
WN0 + ρ∑
u
∑v (u) Prd
i ,sov (u )
· bkv (u) + ρ
∑p �=i Prd
i ,sdp· ak
p
.
(12)
The transmitting rate of link (soj (i) , r
oj (i)) is, therefore, given by
coj (i) = ηW log2(1 + SINRo
j (i)), while the transmitting rate of
link (sdi , r
di ) is cd
i = ηW log2(1 + SINRdi ).
Next, let us analyze the system constrains. First, each flowcan choose either an ordinary path or a direct path to transmitdata, which indicates that
∀i, k :Hi∑
j (i)=1
bkj (i) =
{Hi, if ak
i = 0
0, if aki = 1.
(13)
Second, all traffic demands should be scheduled; hence
K∑
k=1
δk τ(coj (i)b
kj (i) + cd
i aki
)≥di, ∀i and j(i)=1, 2, . . . ,Hi.
(14)
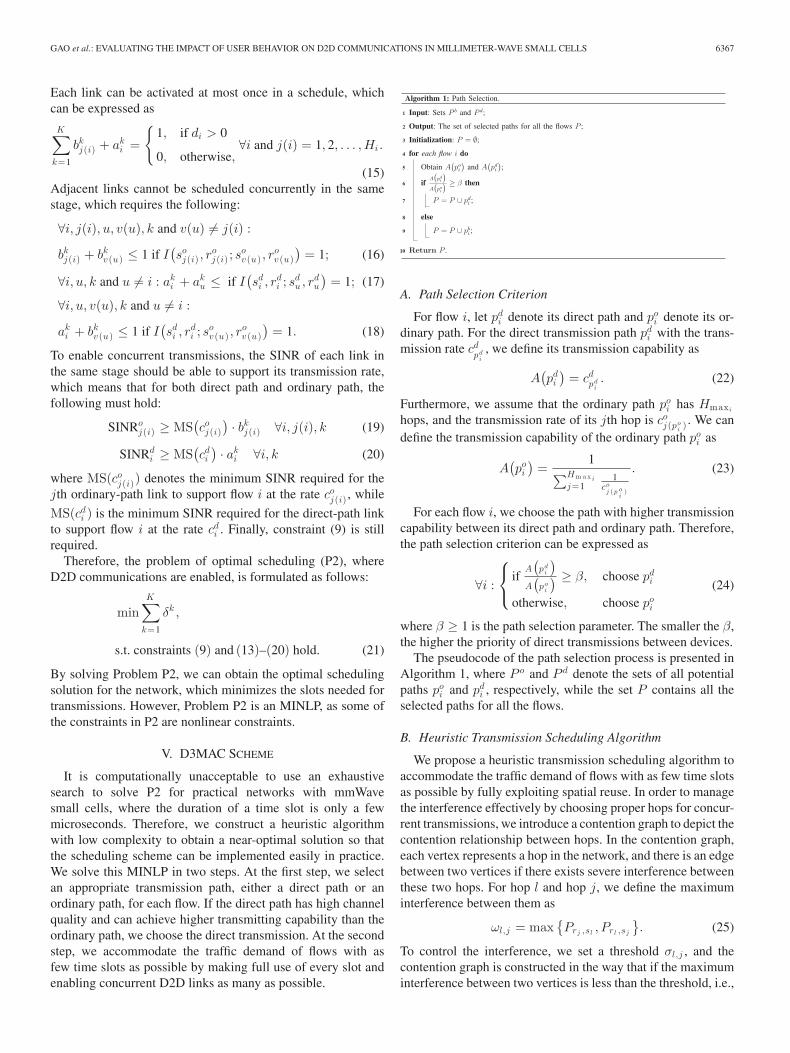
GAO et al.: EVALUATING THE IMPACT OF USER BEHAVIOR ON D2D COMMUNICATIONS IN MILLIMETER-WAVE SMALL CELLS 6367
Each link can be activated at most once in a schedule, whichcan be expressed as
K∑
k=1
bkj (i) + ak
i =
{1, if di > 0
0, otherwise,∀i and j(i) = 1, 2, . . . ,Hi.
(15)Adjacent links cannot be scheduled concurrently in the samestage, which requires the following:
∀i, j(i), u, v(u), k and v(u) �= j(i) :
bkj (i) + bk
v (u) ≤ 1 if I(so
j (i) , roj (i) ; s
ov (u) , r
ov (u)
)= 1; (16)
∀i, u, k and u �= i : aki + ak
u ≤ if I(sd
i , rdi ; sd
u , rdu
)= 1; (17)
∀i, u, v(u), k and u �= i :
aki + bk
v (u) ≤ 1 if I(sd
i , rdi ; so
v (u) , rov (u)
)= 1. (18)
To enable concurrent transmissions, the SINR of each link inthe same stage should be able to support its transmission rate,which means that for both direct path and ordinary path, thefollowing must hold:
SINRoj (i) ≥ MS
(coj (i)
) · bkj (i) ∀i, j(i), k (19)
SINRdi ≥ MS
(cdi
) · aki ∀i, k (20)
where MS(coj (i)) denotes the minimum SINR required for the
jth ordinary-path link to support flow i at the rate coj (i) , while
MS(cdi ) is the minimum SINR required for the direct-path link
to support flow i at the rate cdi . Finally, constraint (9) is still
required.Therefore, the problem of optimal scheduling (P2), where
D2D communications are enabled, is formulated as follows:
minK∑
k=1
δk ,
s.t. constraints (9) and (13)–(20) hold. (21)
By solving Problem P2, we can obtain the optimal schedulingsolution for the network, which minimizes the slots needed fortransmissions. However, Problem P2 is an MINLP, as some ofthe constraints in P2 are nonlinear constraints.
V. D3MAC SCHEME
It is computationally unacceptable to use an exhaustivesearch to solve P2 for practical networks with mmWavesmall cells, where the duration of a time slot is only a fewmicroseconds. Therefore, we construct a heuristic algorithmwith low complexity to obtain a near-optimal solution so thatthe scheduling scheme can be implemented easily in practice.We solve this MINLP in two steps. At the first step, we selectan appropriate transmission path, either a direct path or anordinary path, for each flow. If the direct path has high channelquality and can achieve higher transmitting capability than theordinary path, we choose the direct transmission. At the secondstep, we accommodate the traffic demand of flows with asfew time slots as possible by making full use of every slot andenabling concurrent D2D links as many as possible.
A. Path Selection Criterion
For flow i, let pdi denote its direct path and po
i denote its or-dinary path. For the direct transmission path pd
i with the trans-mission rate cd
pdi, we define its transmission capability as
A(pd
i
)= cd
pdi. (22)
Furthermore, we assume that the ordinary path poi has Hmaxi
hops, and the transmission rate of its jth hop is coj (po
i ) . We candefine the transmission capability of the ordinary path po
i as
A(po
i
)=
1∑Hm a x i
j=11
coj ( p o
i)
. (23)
For each flow i, we choose the path with higher transmissioncapability between its direct path and ordinary path. Therefore,the path selection criterion can be expressed as
∀i :
⎧⎨
⎩
ifA(pd
i
)
A(po
i
) ≥ β, choose pdi
otherwise, choose poi
(24)
where β ≥ 1 is the path selection parameter. The smaller the β,the higher the priority of direct transmissions between devices.
The pseudocode of the path selection process is presented inAlgorithm 1, where Po and Pd denote the sets of all potentialpaths po
i and pdi , respectively, while the set P contains all the
selected paths for all the flows.
B. Heuristic Transmission Scheduling Algorithm
We propose a heuristic transmission scheduling algorithm toaccommodate the traffic demand of flows with as few time slotsas possible by fully exploiting spatial reuse. In order to managethe interference effectively by choosing proper hops for concur-rent transmissions, we introduce a contention graph to depict thecontention relationship between hops. In the contention graph,each vertex represents a hop in the network, and there is an edgebetween two vertices if there exists severe interference betweenthese two hops. For hop l and hop j, we define the maximuminterference between them as
ωl,j = max{Prj ,sl
, Prl ,sj
}. (25)
To control the interference, we set a threshold σl,j , and thecontention graph is constructed in the way that if the maximuminterference between two vertices is less than the threshold, i.e.,

6368 IEEE TRANSACTIONS ON VEHICULAR TECHNOLOGY, VOL. 66, NO. 7, JULY 2017
if ωl,j < σl,j , there will be no edge between these two vertices.Otherwise, there will be an edge between them. There is alwaysan edge between any two adjacent hops, since they cannot bescheduled for concurrent transmissions due to the half-duplexassumption. We denote the contention graph by G(V,E), whereV denotes the set of vertices in the contention graph, and Edenotes the set of edges in the contention graph. We refer to twovertices as neighbors if there is one edge between them in thecontention graph. For any vertex v ∈ V , we denote the set ofits neighboring vertices by N(v). We further define the weightof vertex v as the number of time slots that hop v needs fortransmission, denoted by Wv .
The pseudocode of our transmission scheduling algorithm ispresented in Algorithm 2. To manage the interference betweenconcurrent transmitting hops, the hops with an edge betweenthem in the contention graph should not be scheduled in the sametime. Hence, we first obtain all the hops that can be scheduledcurrently at stage k and build the contention graph (lines 6 and 7),based on the which we schedule the unscheduled hops of flowsiteratively in a nonincreasing order of weight with the conditionsfor concurrent transmissions satisfied (lines 8–19). In line 11, ahop in Hk
u can either be a hop of an ordinary path or a link of adirect path, and we have draped the corresponding superscript o
or d . Also, if it is a direct link, we have i(j) = i. In line 16, � is the integer floor operator. In this inner loop, scheduling stopswhen no possible hop can be scheduled concurrently any more.The algorithm carries out this process iteratively until all thehops of all the flows considered in stage k are properly scheduled(lines 4–21). In the output of the algorithm, Uk is the maximumnumber of hops for the longest multihop flow scheduled at stagek, and for 1 ≤ u ≤ Uk , Hk
u contains the hops or links that arescheduled for concurrent transmissions, while δk is the number
of time slots required for{Hk
u
}U k
u=1. Note that if n denotes
the number of UEs in the network, the number of concurrenttransmission links should be no more than �n [24], due tothe nonadjacent constraint. The computational complexities ofthe path selection algorithm and the transmission schedulingare O(Nf ) and O(Nf
3), respectively. Therefore, D3MAC hasa complexity of O(Nf
3), which is a pseudopolynomial timesolution and can be implemented in practice.
VI. STATIC NETWORK EVALUATION AND ANALYSIS
A. Comparison With Optimal Solution and Other Protocols
Under a static network environment, we first give the exten-sive performance evaluation for our proposed D3MAC scheme,given various traffic patterns. Specifically, we compare its per-formance with those of the optimal solution, obtained by solvingthe problem P2 with YALMIP [25], and some of the existingprotocols. In the simulation, the transmission rate R betweenUEs as well as between UEs and associated APs is set to 2, 4,and 6 Gbps, respectively, according to the distances betweendevices, path loss as well as the antenna gain. Due to betterchannel qualities, the transmission rate of backhaul links is setto 6 Gbps. With R = 2 Gbps, a packet can be transmitted in onetime slot. The packets with transmission delay larger than thedelay threshold are declared as unsuccessful transmission anddiscarded. Generally, the central controller is able to completetraffic polling, schedule computation, and schedule pushing in afew time slots. Two traffic modes, the Poisson process (PP) andinterrupted PP (IPP), are used in the performance evaluation.
1) PP packets arrive at each flow following the PP with arrivalrate λ. The traffic load, denoted by Tload , in a PP traffic isdefined as
Tload =λ · L · Nf
R(26)
where L is the size of data packets.2) IPP packets arrive at each flow following the IPP with
parameters λ1, p1, λ2, and p2. The arrival intervals of theIPP obey the second-order hyperexponential distributionwith a mean of
E(X) =p1
λ1+
p2
λ2. (27)
The traffic load Tload in this case is defined as
Tload =L · Nf
E(X) · R. (28)
We do not consider fading in our simulations due to thefact that 60-GHz channels are extremely sparse. The spatialchannel response is dominated by a few paths from a fewangular directions [29], [30]. Such sparsity is because mmWavesignal energy tends to concentrate around the LOS path and afew non-LOS paths from strong reflectors due to beamformingachieved by phased array antennas, which causes channelhardening to weaken fading significantly.
In present LTE systems, the amount of D2D traffic is gener-ally smaller than in our traffic model. We adopted such a trafficmodel in order to prove that D3MAC is able to exploit the po-tential and benefit of D2D communications to a great extent.
GAO et al.: EVALUATING THE IMPACT OF USER BEHAVIOR ON D2D COMMUNICATIONS IN MILLIMETER-WAVE SMALL CELLS 6369
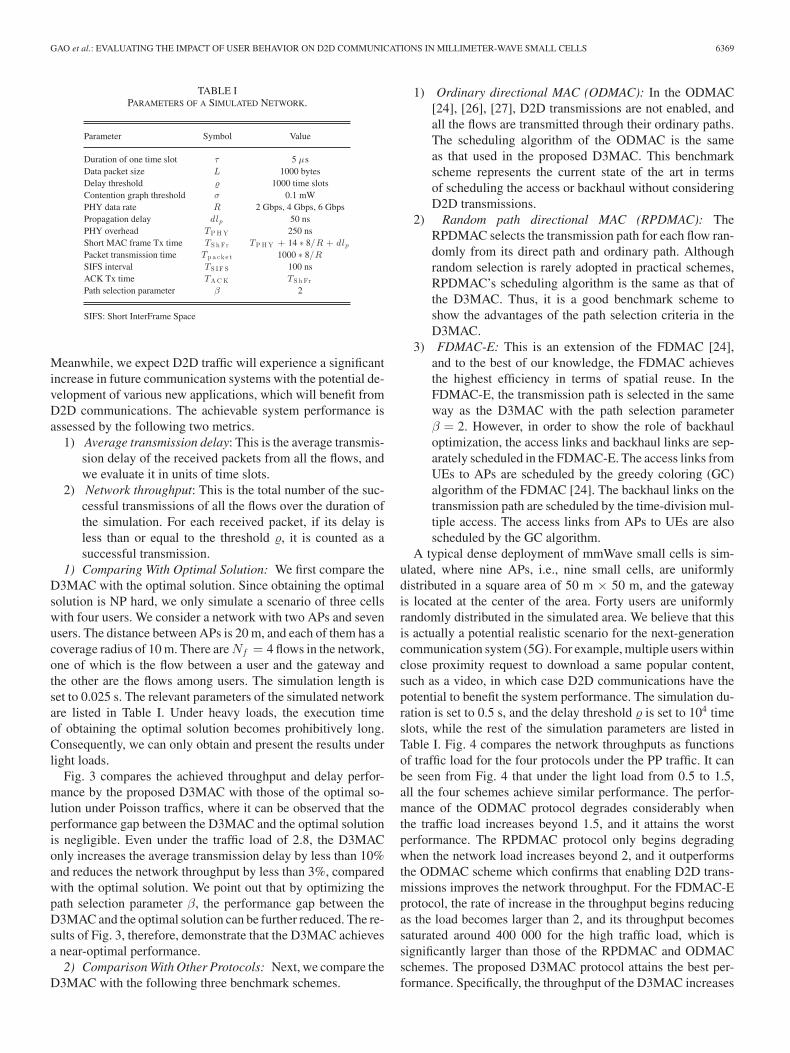
TABLE IPARAMETERS OF A SIMULATED NETWORK.
Parameter Symbol Value
Duration of one time slot τ 5 μsData packet size L 1000 bytesDelay threshold 1000 time slotsContention graph threshold σ 0.1 mWPHY data rate R 2 Gbps, 4 Gbps, 6 GbpsPropagation delay dlp 50 nsPHY overhead TP H Y 250 nsShort MAC frame Tx time TS h Fr TP H Y + 14 ∗ 8/R + dlpPacket transmission time Tp a ck e t 1000 ∗ 8/R
SIFS interval TS IF S 100 nsACK Tx time TA C K TS h Fr
Path selection parameter β 2
SIFS: Short InterFrame Space
Meanwhile, we expect D2D traffic will experience a significantincrease in future communication systems with the potential de-velopment of various new applications, which will benefit fromD2D communications. The achievable system performance isassessed by the following two metrics.
1) Average transmission delay: This is the average transmis-sion delay of the received packets from all the flows, andwe evaluate it in units of time slots.
2) Network throughput: This is the total number of the suc-cessful transmissions of all the flows over the duration ofthe simulation. For each received packet, if its delay isless than or equal to the threshold , it is counted as asuccessful transmission.
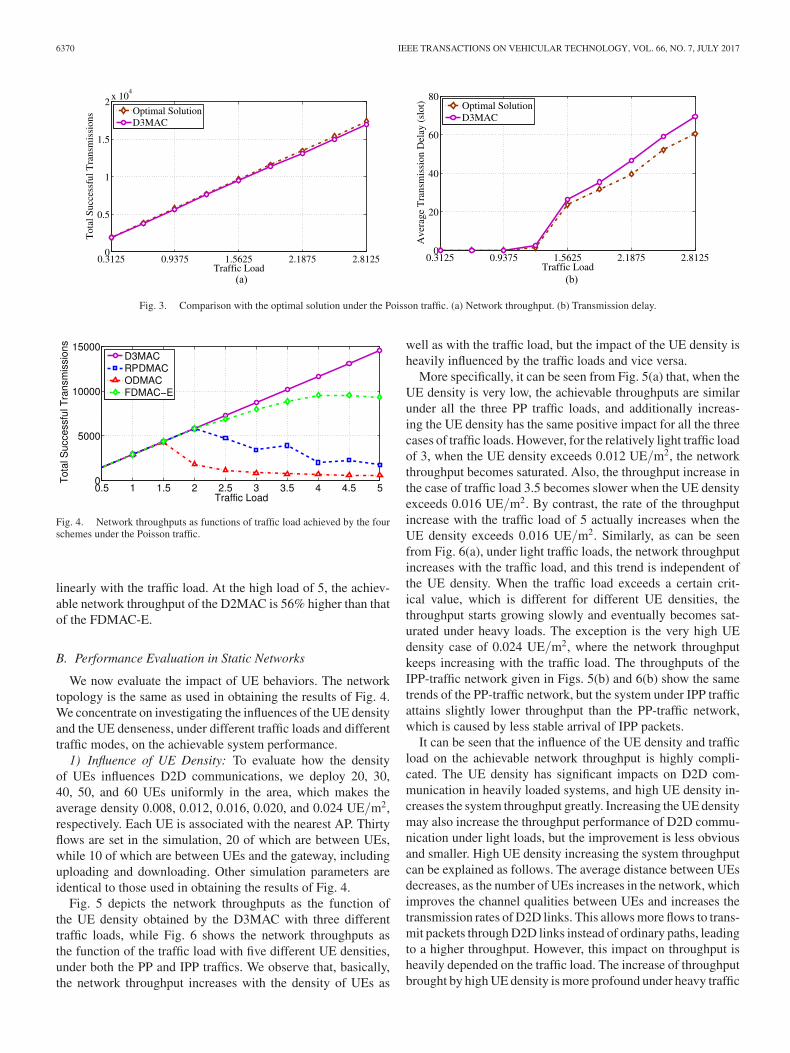
1) Comparing With Optimal Solution: We first compare theD3MAC with the optimal solution. Since obtaining the optimalsolution is NP hard, we only simulate a scenario of three cellswith four users. We consider a network with two APs and sevenusers. The distance between APs is 20 m, and each of them has acoverage radius of 10 m. There are Nf = 4 flows in the network,one of which is the flow between a user and the gateway andthe other are the flows among users. The simulation length isset to 0.025 s. The relevant parameters of the simulated networkare listed in Table I. Under heavy loads, the execution timeof obtaining the optimal solution becomes prohibitively long.Consequently, we can only obtain and present the results underlight loads.
Fig. 3 compares the achieved throughput and delay perfor-mance by the proposed D3MAC with those of the optimal so-lution under Poisson traffics, where it can be observed that theperformance gap between the D3MAC and the optimal solutionis negligible. Even under the traffic load of 2.8, the D3MAConly increases the average transmission delay by less than 10%and reduces the network throughput by less than 3%, comparedwith the optimal solution. We point out that by optimizing thepath selection parameter β, the performance gap between theD3MAC and the optimal solution can be further reduced. The re-sults of Fig. 3, therefore, demonstrate that the D3MAC achievesa near-optimal performance.
2) Comparison With Other Protocols: Next, we compare theD3MAC with the following three benchmark schemes.
1) Ordinary directional MAC (ODMAC): In the ODMAC[24], [26], [27], D2D transmissions are not enabled, andall the flows are transmitted through their ordinary paths.The scheduling algorithm of the ODMAC is the sameas that used in the proposed D3MAC. This benchmarkscheme represents the current state of the art in termsof scheduling the access or backhaul without consideringD2D transmissions.
2) Random path directional MAC (RPDMAC): TheRPDMAC selects the transmission path for each flow ran-domly from its direct path and ordinary path. Althoughrandom selection is rarely adopted in practical schemes,RPDMAC’s scheduling algorithm is the same as that ofthe D3MAC. Thus, it is a good benchmark scheme toshow the advantages of the path selection criteria in theD3MAC.
3) FDMAC-E: This is an extension of the FDMAC [24],and to the best of our knowledge, the FDMAC achievesthe highest efficiency in terms of spatial reuse. In theFDMAC-E, the transmission path is selected in the sameway as the D3MAC with the path selection parameterβ = 2. However, in order to show the role of backhauloptimization, the access links and backhaul links are sep-arately scheduled in the FDMAC-E. The access links fromUEs to APs are scheduled by the greedy coloring (GC)algorithm of the FDMAC [24]. The backhaul links on thetransmission path are scheduled by the time-division mul-tiple access. The access links from APs to UEs are alsoscheduled by the GC algorithm.
A typical dense deployment of mmWave small cells is sim-ulated, where nine APs, i.e., nine small cells, are uniformlydistributed in a square area of 50 m × 50 m, and the gatewayis located at the center of the area. Forty users are uniformlyrandomly distributed in the simulated area. We believe that thisis actually a potential realistic scenario for the next-generationcommunication system (5G). For example, multiple users withinclose proximity request to download a same popular content,such as a video, in which case D2D communications have thepotential to benefit the system performance. The simulation du-ration is set to 0.5 s, and the delay threshold is set to 104 timeslots, while the rest of the simulation parameters are listed inTable I. Fig. 4 compares the network throughputs as functionsof traffic load for the four protocols under the PP traffic. It canbe seen from Fig. 4 that under the light load from 0.5 to 1.5,all the four schemes achieve similar performance. The perfor-mance of the ODMAC protocol degrades considerably whenthe traffic load increases beyond 1.5, and it attains the worstperformance. The RPDMAC protocol only begins degradingwhen the network load increases beyond 2, and it outperformsthe ODMAC scheme which confirms that enabling D2D trans-missions improves the network throughput. For the FDMAC-Eprotocol, the rate of increase in the throughput begins reducingas the load becomes larger than 2, and its throughput becomessaturated around 400 000 for the high traffic load, which issignificantly larger than those of the RPDMAC and ODMACschemes. The proposed D3MAC protocol attains the best per-formance. Specifically, the throughput of the D3MAC increases
6370 IEEE TRANSACTIONS ON VEHICULAR TECHNOLOGY, VOL. 66, NO. 7, JULY 2017
Fig. 3. Comparison with the optimal solution under the Poisson traffic. (a) Network throughput. (b) Transmission delay.
Fig. 4. Network throughputs as functions of traffic load achieved by the fourschemes under the Poisson traffic.
linearly with the traffic load. At the high load of 5, the achiev-able network throughput of the D2MAC is 56% higher than thatof the FDMAC-E.
B. Performance Evaluation in Static Networks
We now evaluate the impact of UE behaviors. The networktopology is the same as used in obtaining the results of Fig. 4.We concentrate on investigating the influences of the UE densityand the UE denseness, under different traffic loads and differenttraffic modes, on the achievable system performance.
1) Influence of UE Density: To evaluate how the densityof UEs influences D2D communications, we deploy 20, 30,40, 50, and 60 UEs uniformly in the area, which makes theaverage density 0.008, 0.012, 0.016, 0.020, and 0.024 UE/m2,respectively. Each UE is associated with the nearest AP. Thirtyflows are set in the simulation, 20 of which are between UEs,while 10 of which are between UEs and the gateway, includinguploading and downloading. Other simulation parameters areidentical to those used in obtaining the results of Fig. 4.
Fig. 5 depicts the network throughputs as the function ofthe UE density obtained by the D3MAC with three differenttraffic loads, while Fig. 6 shows the network throughputs asthe function of the traffic load with five different UE densities,under both the PP and IPP traffics. We observe that, basically,the network throughput increases with the density of UEs as
well as with the traffic load, but the impact of the UE density isheavily influenced by the traffic loads and vice versa.
More specifically, it can be seen from Fig. 5(a) that, when theUE density is very low, the achievable throughputs are similarunder all the three PP traffic loads, and additionally increas-ing the UE density has the same positive impact for all the threecases of traffic loads. However, for the relatively light traffic loadof 3, when the UE density exceeds 0.012 UE/m2, the networkthroughput becomes saturated. Also, the throughput increase inthe case of traffic load 3.5 becomes slower when the UE densityexceeds 0.016 UE/m2. By contrast, the rate of the throughputincrease with the traffic load of 5 actually increases when theUE density exceeds 0.016 UE/m2. Similarly, as can be seenfrom Fig. 6(a), under light traffic loads, the network throughputincreases with the traffic load, and this trend is independent ofthe UE density. When the traffic load exceeds a certain crit-ical value, which is different for different UE densities, thethroughput starts growing slowly and eventually becomes sat-urated under heavy loads. The exception is the very high UEdensity case of 0.024 UE/m2, where the network throughputkeeps increasing with the traffic load. The throughputs of theIPP-traffic network given in Figs. 5(b) and 6(b) show the sametrends of the PP-traffic network, but the system under IPP trafficattains slightly lower throughput than the PP-traffic network,which is caused by less stable arrival of IPP packets.
It can be seen that the influence of the UE density and trafficload on the achievable network throughput is highly compli-cated. The UE density has significant impacts on D2D com-munication in heavily loaded systems, and high UE density in-creases the system throughput greatly. Increasing the UE densitymay also increase the throughput performance of D2D commu-nication under light loads, but the improvement is less obviousand smaller. High UE density increasing the system throughputcan be explained as follows. The average distance between UEsdecreases, as the number of UEs increases in the network, whichimproves the channel qualities between UEs and increases thetransmission rates of D2D links. This allows more flows to trans-mit packets through D2D links instead of ordinary paths, leadingto a higher throughput. However, this impact on throughput isheavily depended on the traffic load. The increase of throughputbrought by high UE density is more profound under heavy traffic

GAO et al.: EVALUATING THE IMPACT OF USER BEHAVIOR ON D2D COMMUNICATIONS IN MILLIMETER-WAVE SMALL CELLS 6371
Fig. 5. Network throughput as the function of UE density attained by the D3MAC, given different traffic loads. (a) PP traffic. (b) IPP traffic.
Fig. 6. Network throughput as the function of traffic load attained by the D3MAC, given different UE densities. (a) PP traffic. (b) IPP traffic.
loads. This is because in a heavily loaded system, the networkmay originally be unable to transmit all packets within the delaythreshold. By increasing the UE density, these originally unsuc-cessful transmissions can be transmitted successfully throughmore and better D2D links. Under light loads, on the otherhand, the network is originally able to transmit almost all pack-ets within the delay threshold, and there is less need to relyingon the improvement brought by high UE density for increasingsuccessful transmissions. Thus, the UE density has less impacton light-load networks.
Fig. 7 shows the average transmission delays as the functionof the UE density obtained by the D3MA with three differenttraffic loads, while Fig. 8 depicts the average transmission de-lays as the function of the traffic load with five different UEdensities. We can clearly see that the transmission delay is re-duced as the UE density increases, while the transmission delayincreases with the network traffic load. We also observe that theaverage transmission delay performance of the IPP-traffic net-work is worse than that of the PP-traffic network, since the IPPtraffic has lower arriving stability than the PP traffic, and thiserratically arriving traffic demand causes longer waiting time atthe transmitting devices’ queues and hence longer transmissiondelay.
The reason why the transmission delay decreases as the UEdensity increases is simple. With the increase of the UE den-sity, the transmission opportunities increases, and this reducesthe waiting time of the packets to be transmitted. In addition,a higher UE density also improves the channel quality, whichimproves the successful transmission rate and reduces retrans-missions. This also helps improve the transmission delay per-formance. The reason why increasing the traffic load worsensthe transmission delay performance is also obvious. Increas-ing the network traffic load simply means more packets to betransmitted, which increases the packets’ waiting time in thetransmission queues of the transmitting devices, leading to ahigher transmission delay.
In the above analysis, 20 out of the 30 flows are between UEs,and the rest are flows between UEs and the gateway. In order toinvestigate the impact of portions of traffic between UEs, we plotthe throughput and delay of D3MAC under different portionsof flows between UEs in Fig. 9. The results are obtained underPP traffic. The traffic load is set to 5, and the user densitiesare set to 0.008, 0.016, and 0.024 UE/m2. We can observe thatincreasing the portions of traffic between UEs actually benefitsD3MACs throughput and delay performance under all three userdensities we set. However, the impact of traffic portion is not
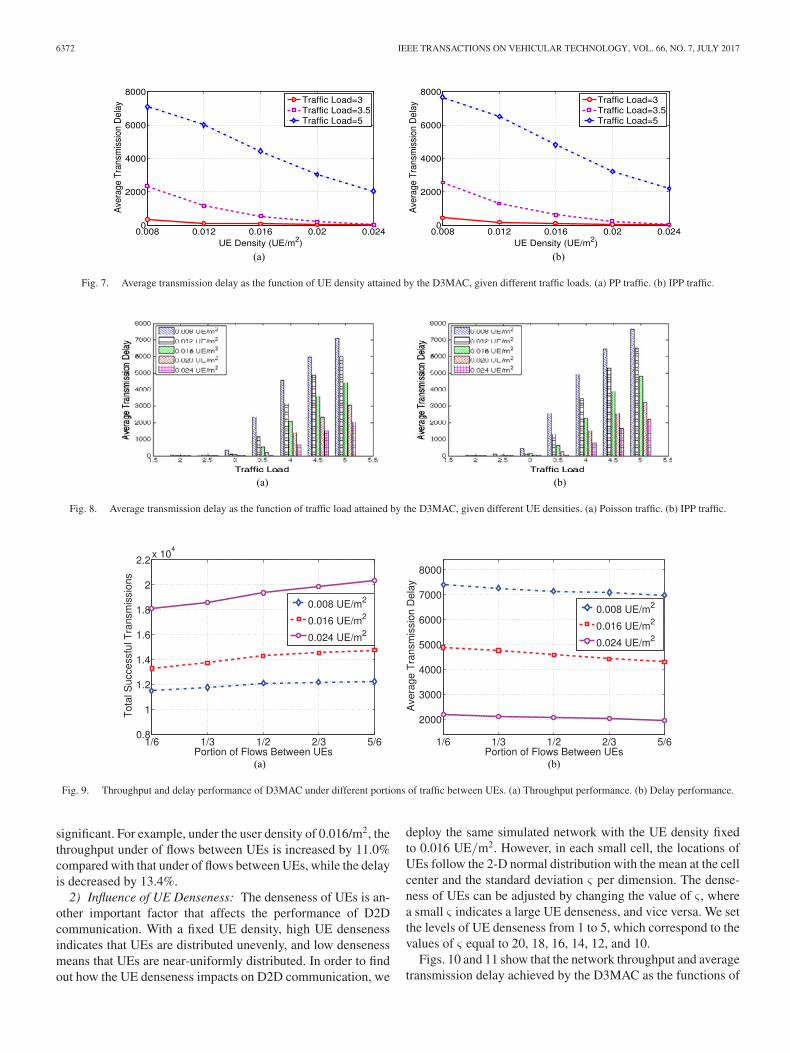
6372 IEEE TRANSACTIONS ON VEHICULAR TECHNOLOGY, VOL. 66, NO. 7, JULY 2017
Fig. 7. Average transmission delay as the function of UE density attained by the D3MAC, given different traffic loads. (a) PP traffic. (b) IPP traffic.
Fig. 8. Average transmission delay as the function of traffic load attained by the D3MAC, given different UE densities. (a) Poisson traffic. (b) IPP traffic.
Fig. 9. Throughput and delay performance of D3MAC under different portions of traffic between UEs. (a) Throughput performance. (b) Delay performance.
significant. For example, under the user density of 0.016/m2, thethroughput under of flows between UEs is increased by 11.0%compared with that under of flows between UEs, while the delayis decreased by 13.4%.
2) Influence of UE Denseness: The denseness of UEs is an-other important factor that affects the performance of D2Dcommunication. With a fixed UE density, high UE densenessindicates that UEs are distributed unevenly, and low densenessmeans that UEs are near-uniformly distributed. In order to findout how the UE denseness impacts on D2D communication, we
deploy the same simulated network with the UE density fixedto 0.016 UE/m2. However, in each small cell, the locations ofUEs follow the 2-D normal distribution with the mean at the cellcenter and the standard deviation ς per dimension. The dense-ness of UEs can be adjusted by changing the value of ς , wherea small ς indicates a large UE denseness, and vice versa. We setthe levels of UE denseness from 1 to 5, which correspond to thevalues of ς equal to 20, 18, 16, 14, 12, and 10.
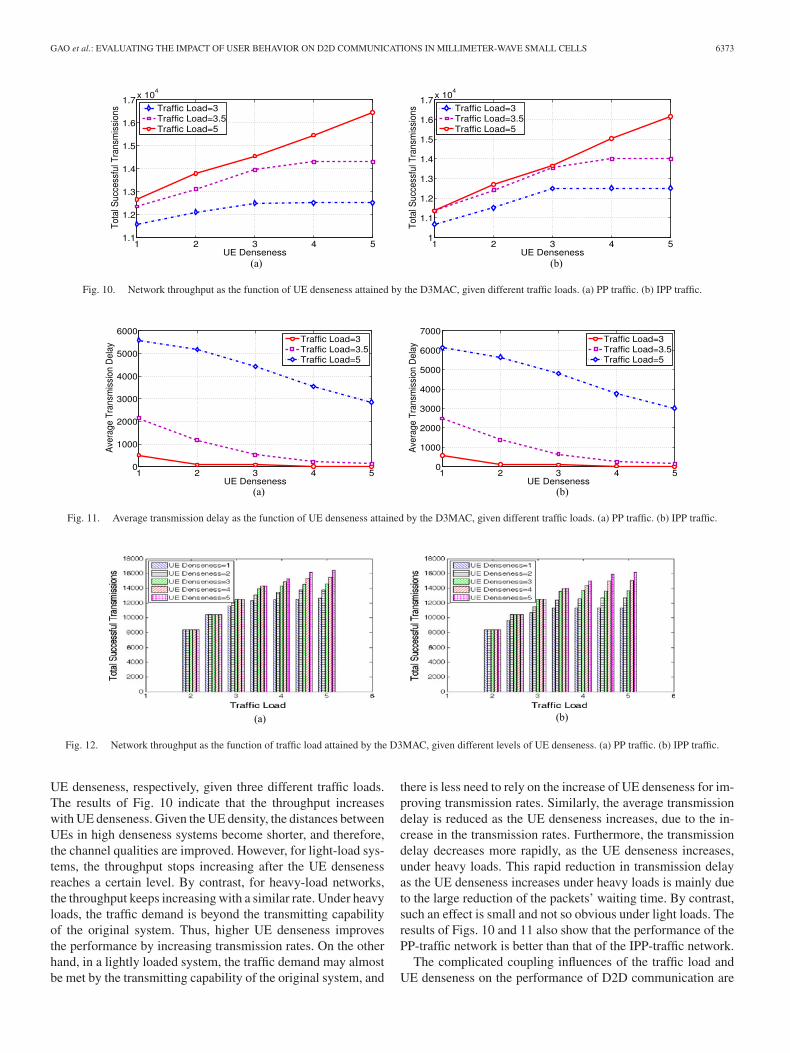
Figs. 10 and 11 show that the network throughput and averagetransmission delay achieved by the D3MAC as the functions of
GAO et al.: EVALUATING THE IMPACT OF USER BEHAVIOR ON D2D COMMUNICATIONS IN MILLIMETER-WAVE SMALL CELLS 6373
Fig. 10. Network throughput as the function of UE denseness attained by the D3MAC, given different traffic loads. (a) PP traffic. (b) IPP traffic.
Fig. 11. Average transmission delay as the function of UE denseness attained by the D3MAC, given different traffic loads. (a) PP traffic. (b) IPP traffic.
Fig. 12. Network throughput as the function of traffic load attained by the D3MAC, given different levels of UE denseness. (a) PP traffic. (b) IPP traffic.
UE denseness, respectively, given three different traffic loads.The results of Fig. 10 indicate that the throughput increaseswith UE denseness. Given the UE density, the distances betweenUEs in high denseness systems become shorter, and therefore,the channel qualities are improved. However, for light-load sys-tems, the throughput stops increasing after the UE densenessreaches a certain level. By contrast, for heavy-load networks,the throughput keeps increasing with a similar rate. Under heavyloads, the traffic demand is beyond the transmitting capabilityof the original system. Thus, higher UE denseness improvesthe performance by increasing transmission rates. On the otherhand, in a lightly loaded system, the traffic demand may almostbe met by the transmitting capability of the original system, and
there is less need to rely on the increase of UE denseness for im-proving transmission rates. Similarly, the average transmissiondelay is reduced as the UE denseness increases, due to the in-crease in the transmission rates. Furthermore, the transmissiondelay decreases more rapidly, as the UE denseness increases,under heavy loads. This rapid reduction in transmission delayas the UE denseness increases under heavy loads is mainly dueto the large reduction of the packets’ waiting time. By contrast,such an effect is small and not so obvious under light loads. Theresults of Figs. 10 and 11 also show that the performance of thePP-traffic network is better than that of the IPP-traffic network.
The complicated coupling influences of the traffic load andUE denseness on the performance of D2D communication are
6374 IEEE TRANSACTIONS ON VEHICULAR TECHNOLOGY, VOL. 66, NO. 7, JULY 2017
Fig. 13. Average Transmission delay as the function of traffic load attained by the D3MAC, given different levels of UE denseness. (a) PP traffic. (b) IPP traffic.
Fig. 14. Network performance as the function of traffic load under PP and IPP traffics and with different UE densities. (a) Network throughtput. (b) Averagetransmission delay.
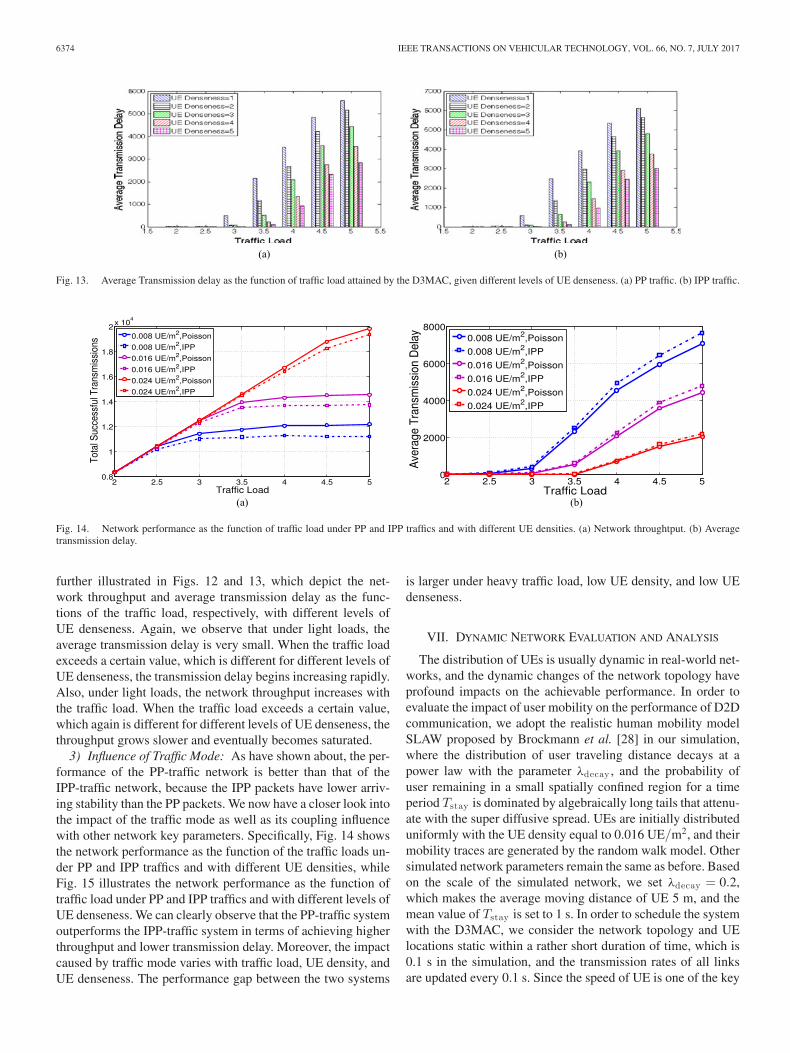
further illustrated in Figs. 12 and 13, which depict the net-work throughput and average transmission delay as the func-tions of the traffic load, respectively, with different levels ofUE denseness. Again, we observe that under light loads, theaverage transmission delay is very small. When the traffic loadexceeds a certain value, which is different for different levels ofUE denseness, the transmission delay begins increasing rapidly.Also, under light loads, the network throughput increases withthe traffic load. When the traffic load exceeds a certain value,which again is different for different levels of UE denseness, thethroughput grows slower and eventually becomes saturated.
3) Influence of Traffic Mode: As have shown about, the per-formance of the PP-traffic network is better than that of theIPP-traffic network, because the IPP packets have lower arriv-ing stability than the PP packets. We now have a closer look intothe impact of the traffic mode as well as its coupling influencewith other network key parameters. Specifically, Fig. 14 showsthe network performance as the function of the traffic loads un-der PP and IPP traffics and with different UE densities, whileFig. 15 illustrates the network performance as the function oftraffic load under PP and IPP traffics and with different levels ofUE denseness. We can clearly observe that the PP-traffic systemoutperforms the IPP-traffic system in terms of achieving higherthroughput and lower transmission delay. Moreover, the impactcaused by traffic mode varies with traffic load, UE density, andUE denseness. The performance gap between the two systems
is larger under heavy traffic load, low UE density, and low UEdenseness.
VII. DYNAMIC NETWORK EVALUATION AND ANALYSIS
The distribution of UEs is usually dynamic in real-world net-works, and the dynamic changes of the network topology haveprofound impacts on the achievable performance. In order toevaluate the impact of user mobility on the performance of D2Dcommunication, we adopt the realistic human mobility modelSLAW proposed by Brockmann et al. [28] in our simulation,where the distribution of user traveling distance decays at apower law with the parameter λdecay , and the probability ofuser remaining in a small spatially confined region for a timeperiod Tstay is dominated by algebraically long tails that attenu-ate with the super diffusive spread. UEs are initially distributeduniformly with the UE density equal to 0.016 UE/m2, and theirmobility traces are generated by the random walk model. Othersimulated network parameters remain the same as before. Basedon the scale of the simulated network, we set λdecay = 0.2,which makes the average moving distance of UE 5 m, and themean value of Tstay is set to 1 s. In order to schedule the systemwith the D3MAC, we consider the network topology and UElocations static within a rather short duration of time, which is0.1 s in the simulation, and the transmission rates of all linksare updated every 0.1 s. Since the speed of UE is one of the key
GAO et al.: EVALUATING THE IMPACT OF USER BEHAVIOR ON D2D COMMUNICATIONS IN MILLIMETER-WAVE SMALL CELLS 6375
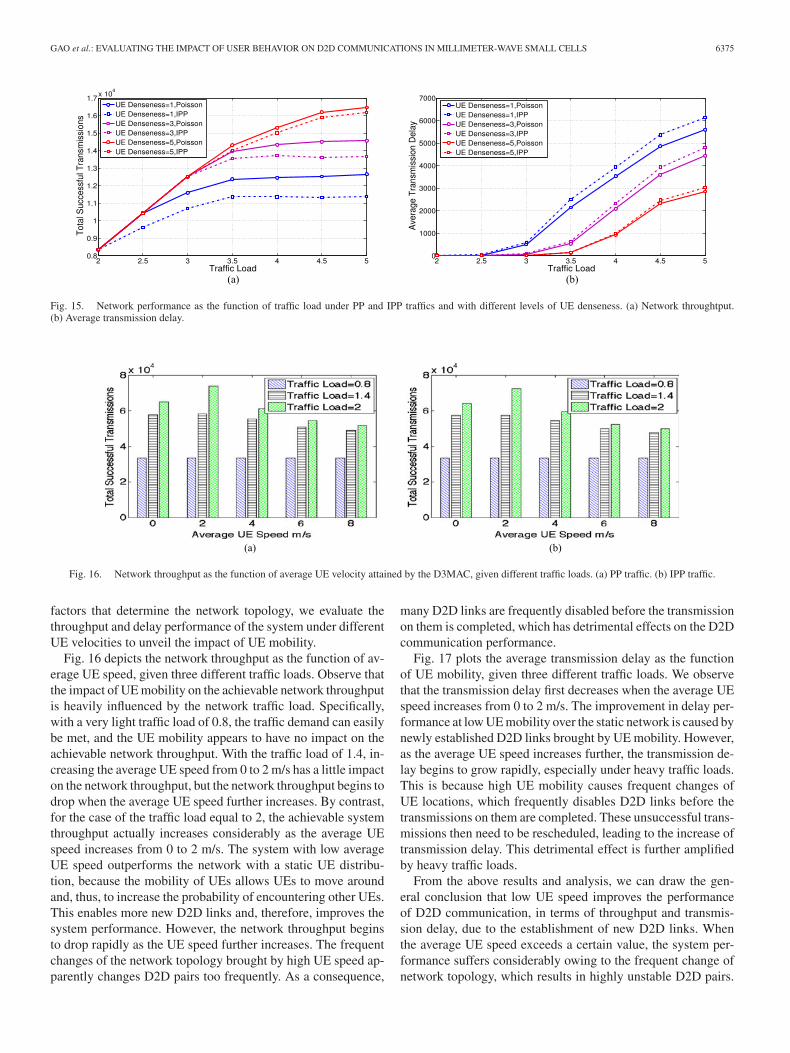
Fig. 15. Network performance as the function of traffic load under PP and IPP traffics and with different levels of UE denseness. (a) Network throughtput.(b) Average transmission delay.
Fig. 16. Network throughput as the function of average UE velocity attained by the D3MAC, given different traffic loads. (a) PP traffic. (b) IPP traffic.
factors that determine the network topology, we evaluate thethroughput and delay performance of the system under differentUE velocities to unveil the impact of UE mobility.
Fig. 16 depicts the network throughput as the function of av-erage UE speed, given three different traffic loads. Observe thatthe impact of UE mobility on the achievable network throughputis heavily influenced by the network traffic load. Specifically,with a very light traffic load of 0.8, the traffic demand can easilybe met, and the UE mobility appears to have no impact on theachievable network throughput. With the traffic load of 1.4, in-creasing the average UE speed from 0 to 2 m/s has a little impacton the network throughput, but the network throughput begins todrop when the average UE speed further increases. By contrast,for the case of the traffic load equal to 2, the achievable systemthroughput actually increases considerably as the average UEspeed increases from 0 to 2 m/s. The system with low averageUE speed outperforms the network with a static UE distribu-tion, because the mobility of UEs allows UEs to move aroundand, thus, to increase the probability of encountering other UEs.This enables more new D2D links and, therefore, improves thesystem performance. However, the network throughput beginsto drop rapidly as the UE speed further increases. The frequentchanges of the network topology brought by high UE speed ap-parently changes D2D pairs too frequently. As a consequence,
many D2D links are frequently disabled before the transmissionon them is completed, which has detrimental effects on the D2Dcommunication performance.
Fig. 17 plots the average transmission delay as the functionof UE mobility, given three different traffic loads. We observethat the transmission delay first decreases when the average UEspeed increases from 0 to 2 m/s. The improvement in delay per-formance at low UE mobility over the static network is caused bynewly established D2D links brought by UE mobility. However,as the average UE speed increases further, the transmission de-lay begins to grow rapidly, especially under heavy traffic loads.This is because high UE mobility causes frequent changes ofUE locations, which frequently disables D2D links before thetransmissions on them are completed. These unsuccessful trans-missions then need to be rescheduled, leading to the increase oftransmission delay. This detrimental effect is further amplifiedby heavy traffic loads.
From the above results and analysis, we can draw the gen-eral conclusion that low UE speed improves the performanceof D2D communication, in terms of throughput and transmis-sion delay, due to the establishment of new D2D links. Whenthe average UE speed exceeds a certain value, the system per-formance suffers considerably owing to the frequent change ofnetwork topology, which results in highly unstable D2D pairs.

6376 IEEE TRANSACTIONS ON VEHICULAR TECHNOLOGY, VOL. 66, NO. 7, JULY 2017
Fig. 17. Average transmission delay as the function of average UE velocity attained by the D3MAC, given different traffic loads. (a) PP traffic. (b) IPP traffic.
This detrimental impact of high UE speed is further amplifiedunder heavy traffic loads.
VIII. CONCLUSION
In this paper, we have investigated the optimal schedulingproblem of radio access of small cells in the mmWave bandthat enables D2D communications and fully utilizes the spatialreuse. Because the optimal solution for this scheduling prob-lem is computationally prohibitive for large-scale networks, wehave proposed a centralized MAC scheduling scheme, referredto as the D3MAC, to solve this scheduling problem efficiently.Through extensive simulations, we have demonstrated that theD3MAC achieves a near-optimal performance, in terms of net-work throughput and transmission delay, and it outperformsother existing protocols. Our other main contribution has in-cluded the comprehensive evaluation of how the user behaviorimpacts the achievable D2D communication performance in thenetwork consisting of mmWave small cells, based on our pro-posed D3MAC protocol. Specifically, we have investigated thefive key factors related to user behaviors, namely, UE density,UE denseness, UE mobility, traffic load, and traffic mode. Ourstudy has unveiled intriguing patterns and complex interactionsof these factors in influencing the achievable performance ofD2D communications in mmWave small cells. Our results andobservations thus offer valuable lessons and useful guidelinesin designing future networks of mmWave-based small cells.
REFERENCES
[1] J. Andrews, “How can cellular networks handle 1000x the data?” TechnicalTalk, Univ. Notre Dame, Notre Dame, IN, USA, 2011.
[2] G. Fodor et al., “Design aspects of network assisted device-to-devicecommunications,” IEEE Commun. Mag., vol. 50, no. 3, pp. 170–177,Mar. 2012.
[3] L. Lei, Z. Zhong, C. Lin, and X. Shen, “Operator controlled device-to-device communications in LTE-advanced networks,” IEEE WirelessCommun., vol. 19, no. 3, pp. 96–104, Jun. 2012.
[4] M. N. Islam, A. Sampath, A. Maharshi, O. Koymen, and N. B. Mandayam,“Wireless backhaul node placement for small cell networks,” in Proc. 48thAnnu. Conf. Inf. Sci. Syst., Princeton, NJ, USA, Mar. 19–21, 2014, pp. 1–6.
[5] S. Singh, R. Mudumbai, and U. Madhow, “Interference analysis for highlydirectional 60-GHz mesh networks: The case for rethinking medium ac-cess control,” IEEE/ACM Trans. Netw., vol. 19, no. 5, pp. 1513–1527,Oct. 2011.
[6] X. Lin, J. G. Andrews, A. Ghosh, and R. Ratasuk, “An overview of3GPP device-to-device proximity services,” IEEE Commun. Mag., vol. 52,no. 4, pp. 40–48, Apr. 2014.
[7] L. Wei, R. Hu, Y. Qian, and G. Wu, “Key elements to enable millimeterwave communications for 5G wireless systems,” IEEE Wireless Commun.,vol. 21, no. 6, pp. 136–143, Dec. 2014.
[8] S. Scott-Hayward and E. Garcia-Palacios, “Multimedia resource alloca-tion in mmwave 5G networks,” IEEE Commun. Mag., vol. 53, no. 1,pp. 240–247, Jan. 2015.
[9] S. Rangan, T. S. Rappaport, and E. Erkip, “Millimeter-wave cellular wire-less networks: Potentials and challenges,” Proc. IEEE, vol. 102, no. 3,pp. 366–385, Mar. 2014.
[10] Y. Zhu et al., “Demystifying 60 GHz outdoor picocells,” in Proc. 20thAnnu. Int. Conf. Mobile Comput. Network., Maui, HI, USA, Sep. 7–11,2014, pp. 5–16.
[11] J. Qiao, X. Shen, J. Mark, Q. Shen, Y. He, and L. Lei, “Enabling device-to-device communications in millimeter-wave 5G cellular networks,” IEEECommun. Mag., vol. 53, no. 1, pp. 209–215, Jan. 2015.
[12] C.-H. Yu, O. Tirkkonen, K. Doppler, and C. Ribeiro, “On the performanceof device-to-device underlay communication with simple power control,”in Proc. IEEE 69th Veh. Technol. Conf., Barcelona, Spain, Apr. 26–29,2009, pp. 1–5.
[13] C. Xu et al., “Efficiency resource allocation for device-to-device underlaycommunication systems: A reverse iterative combinatorial auction basedapproach,” IEEE J. Sel. Areas Commun., vol. 31, no. 9, pp. 348–358,Sep. 2013.
[14] P. Janis, V. Koivunen, C. Ribeiro, J. Korhonen, K. Doppler, and K. Hugl,“Interference-aware resource allocation for device-to-device radio un-derlaying cellular networks,” in Proc. IEEE 69th Veh. Technol. Conf.,Barcelona, Spain, Apr. 26–29, 2009, pp. 1–5.
[15] S. Xu, H. Wang, T. Chen, Q. Huang, and T. Peng, “Effective interferencecancellation scheme for device-to-device communication underlaying cel-lular networks,” in Proc. IEEE 72nd Veh. Technol. Conf., Ottawa, ON,Canada, Sep. 6–9, 2010, pp. 1–5.
[16] S. Hakola, T. Chen, J. Lehtomaki, and T. Koskela, “Device-to-device(D2D) communication in cellular network—Performance analysis of op-timum and practical communication mode selection,” in Proc. IEEEWireless Commun. Netw. Conf., Sydney, Australia, Apr. 18–21, 2010,pp. 1–6.
[17] M. Belleschi, G. Fodor, and A. Abrardo, “Performance analysis of adistributed resource allocation scheme for D2D communications,” in Proc.GLOBECOM Workshops, Houston, TX, USA, Dec. 5–9, 2011, pp. 358–362.
[18] S. Singh, F. Ziliotto, U. Madhow, E. M. Belding, and M. Rodwell, “Block-age and directivity in 60 GHz wireless personal area networks: From cross-layer model to multi hop MAC design,” IEEE J. Sel. Areas Commun.,vol. 27, no. 8, pp. 1400–1413, Oct. 2009.
[19] Y. Niu, Y. Li, and D. Jin, “Poster: Promoting the spatial reuse of millimeterwave networks via software-defined cross-layer design,” in Proc. 20thAnnu. Int. Conf. Mobile Comput. Netw., Maui, HI, USA, Sep. 7–11, 2014,pp. 395–396.
[20] J. Ning, T.-S. Kim, S. V. Krishnamurthy, and C. Cordeiro, “Directionalneighbor discovery in 60 GHz indoor wireless networks,” in Proc. 12thACM Int. Conf. Model., Anal. Simul. Wireless Mobile Syst., Tenerife,Spain, Oct. 26–30, 2009, pp. 365–373.

GAO et al.: EVALUATING THE IMPACT OF USER BEHAVIOR ON D2D COMMUNICATIONS IN MILLIMETER-WAVE SMALL CELLS 6377
[21] F. Yildirim and H. Liu, “A cross-layer neighbor-discovery algorithm fordirectional 60-GHz networks,” IEEE Trans. Veh. Technol., vol. 58, no. 8,pp. 4598–4604, Oct. 2009.
[22] Y. Niu, Y. Li, D. Jin, L. Su, and D. Wu, “Blockage robust and efficientscheduling for directional mmWave WPANs,” IEEE Trans. Veh. Technol.,vol. 64, no. 2, pp. 728–742, Feb. 2015.
[23] J. Qiao, L. X. Cai, X. Shen, and J. W. Mark, “STDMA-based schedulingalgorithm for concurrent transmissions in directional millimeter wavenetworks,” in Proc. IEEE Int. Conf. Commun., Ottawa, ON, Canada,Jun. 10–15, 2012, pp. 5221–5225.
[24] I. K. Son, S. Mao, M. X. Gong, and Y. Li, “On frame-based scheduling fordirectional mmWave WPANs,” in Proc. INFOCOM, Orlando, FL, USA,Mar. 25–30, 2012, pp. 2149–2157.
[25] J. Lofberg, “YALMIP: A toolbox for modeling and optimization in MAT-LAB,” in Proc. IEEE Int. Conf. Robot. Autom., Taipei, China, Sep. 4,2004, pp. 284–289.
[26] A. Lebedev et al., “Feasibility study and experimental verification ofsimplified fiber-supported 60-GHz picocell mobile backhaul links,” IEEEPhoton. J., vol. 5, no. 4, pp. 1–14, Aug. 2013.
[27] D. Bojic et al., “Advanced wireless and optical technologies for small-cell mobile backhaul with dynamic software-defined management,” IEEECommun. Mag., vol. 51, no. 9, pp. 86–93, Sep. 2013.
[28] D. Brockmann, L. Hufnagel, and T. Geisel, “The scaling laws of humantravel,” Nature, vol. 439, no. 7075, pp. 462–465, Jan. 2006.
[29] S. Sur, X. Zhang, P. Ramanathan, and R. Chandra, “BeamSpy: Enablingrobust 60 GHz links under blockage,” in Proc. 13th Usenix Conf. Netw.Syst. Des. Implementation, Santa Clara, CA, USA, Mar. 16–18, 2016,pp. 193–206.
[30] S. Sur, V. Venkateswaran, X. Zhang, and P. Ramanathan, “60 GHz indoornetworking through flexible beams: A link-level profiling,” in Proc. ACMSIGMETRICS Int. Conf. Meas, Model. Comput. Syst., Portland, OR, USA,Jun. 15–19, 2015, pp. 71–84.
Authors’ photographs and biographies not available at the time of publication.