Embed Size (px)
Citation preview

�
Central Bank of Sudan
56th
ANNUAL REPORT
2016
Website: http://www.cbos.gov.sd

IN THE NAME OF ALLAH
THE MOST GRACIOUS, THE MOST MERCIFUL
We are pleased to present the 56th annual report of Central Bank of Sudan, which explains the latest developments in the Sudanese economy during the year 2016. The report contains ten chapters, the first is a summary of global and regional economic developments, while the remaining chapters indicate the performance of the domestic economy including: monetary and banking sector, the financial sector, the real sector, government and the external sector (foreign trade and balance of payments). On behalf of the Central Bank of Sudan I would like to express my thanks and gratitude to the Ministries, Institutions and Government Units for their cooperation in providing the necessary data and information for preparing this report. Also I would like to thank the Board of Directors of the Central Bank of Sudan and the committee entitled to review this report, and those who contributed or exerted an effort in preparing it. We hope that this report will meet the needs and requirements of all the concerned parties, researchers and academics, beside the specialists on economic, financial and banking affairs from the local, regional and international institutions.
Hazim Abdelgadir Ahmed
Chairman of the Board of Directors
and the Governor of the
Central Bank of Sudan
AND GOVERNOR OF THE CENTRAL BANK OF SUDAN

BOARD OF DIRECTORS
OF THE CENTRAL BANK OF SUDAN
Mr. Hazim Abdelgadir Ahmed Governor and Chairman of the Board of directors.
Dr. Bader Eldeen Gurashi Mustafa First Deputy Governor and Member of the Board.
Mr. Hussein Yahia Jangoul Deputy Governor and Member of the Board.
Mr. Mustafa Yousif Holi Under Secretary- Ministry of finance, Member of the Board.
Prof. Mohamed El-Fatih Hamed Member of the Board.
Mr. Gindeel Ibrahim Gindeel Member of the Board.
Dr. Ibrahim Abdel Moneim Sobahi Member of the Board.
Prof. Awatif Yousif Mohamed Member of the Board Mr. Mohamed Osman Ahmed Mohamed Khair Secretary of the Board
CONTENTS
Subject Page
Introduction 1
Chapter One : Major International Economic Developments During 2016 7
Chapter Two : Central Bank of Sudan Policies (CBOS) for 2016 25 25
Chapter Three: Money Supply 35
Chapter Four: Banks and Nonbanks Financial Institutions 47
Chapter Five: Central Bank of Sudan Accounts for 2016 85
Chapter Six: General Government Budget Performance 95
Chapter Seven: Gross Domestic Product (GDP) 111
Chapter Eight: Production 131
Chapter Nine: Foreign Trade 161
Chapter Ten: Balance of Payments 179
Appendices 193


|56thANNUALREPORT2016
1
INTRODUCTION
The annual report of the Central Bank of Sudan in the year 2016 was issued under intricate conditions and challenges at the global, regional and national levels. These conditions led to the divergence of performance in most economic sectors. The report includes ten chapters, the first gives a summary of global and regional economic developments, while the other chapters present the performance of the domestic economy, namely: monetary and financial sector, public finance sector, real sector, foreign trade and balance of payments sector. At the global level, the world economy registered a growth rate of 3.1% in 2016, (growth rate in industrial and developing countries remained as it was in 2015). The economies of emerging markets and developing countries' achieved a remarkable growth rate due to the increase in the prices of commodity exports, as well as rising capital flows to developing countries in 2016. In the developed and industrial economies, the growth in the United States was affected by the continued weakness of non-residential investments, as well as the impact of the decline in manufacturing activity after Britain's vote to exit from the European Union. Japan's growth rates affected by the decline in external demand and investment of companies. In general, the growth rate in industrial countries has declined from 2% in 2015 to 1.6% in 2016 due to lower growth rates in the United States, the United Kingdom and Japan, Despite the slowdown in growth rates in 2016. The International Monetary Fund (IMF) expected that economic activity will be improved in 2017. At the regional level, the growth rate of Middle East and North Africa (MENA) countries increased from 0.7% in 2015 to 2.1% in 2016, the growth rate of the Great Arab Free Trade Area countries (GAFTA) increased from 0.7% in 2015 to 2.1% in 2016. The growth rate in some Arab countries increased due to the improvement in oil prices, also growth rate of the COMESA countries increased from 2.9% in 2015 to 3.0% in 2016, due to the improvement in the growth rate of Eritrea, the Comoros, Seychelles and Madagascar. The current account position as a ratio to GDP of the Middle East and North Africa (MENA) declined from minus 4.4% in 2015 to minus 5.0% in 2016 due to the deterioration in the current account position of both oil exporting and importing countries. At the domestic level, the Central Bank of Sudan's policies for 2016, issued in coordination with fiscal policies and other economic policies, aimed at achieving a real GDP growth rate of 6.4% and reducing the average annual inflation rate to 13% by
|56thANNUALREPORT2016
2
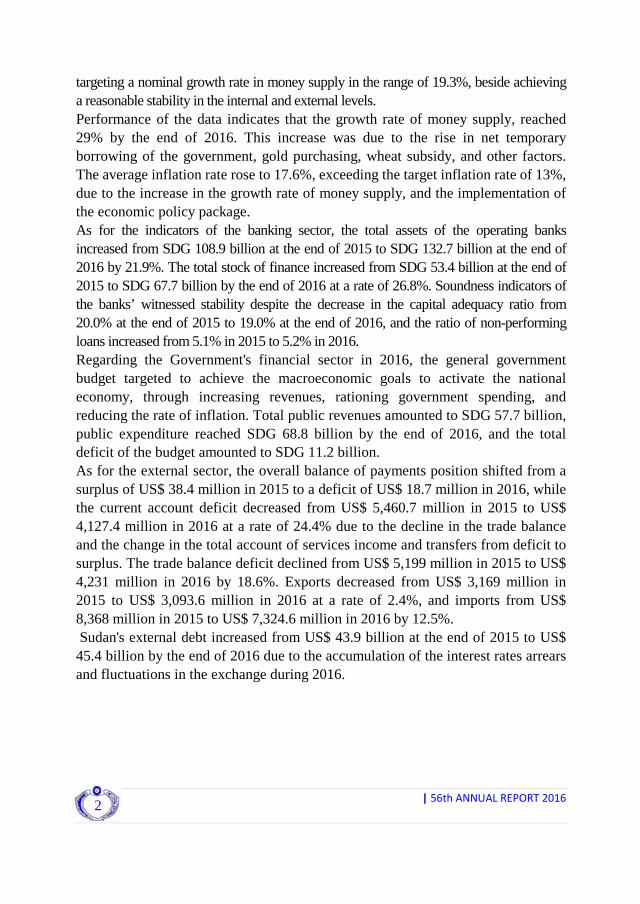
targeting a nominal growth rate in money supply in the range of 19.3%, beside achieving a reasonable stability in the internal and external levels. Performance of the data indicates that the growth rate of money supply, reached 29% by the end of 2016. This increase was due to the rise in net temporary borrowing of the government, gold purchasing, wheat subsidy, and other factors. The average inflation rate rose to 17.6%, exceeding the target inflation rate of 13%, due to the increase in the growth rate of money supply, and the implementation of the economic policy package. As for the indicators of the banking sector, the total assets of the operating banks increased from SDG 108.9 billion at the end of 2015 to SDG 132.7 billion at the end of 2016 by 21.9%. The total stock of finance increased from SDG 53.4 billion at the end of 2015 to SDG 67.7 billion by the end of 2016 at a rate of 26.8%. Soundness indicators of the banks’ witnessed stability despite the decrease in the capital adequacy ratio from 20.0% at the end of 2015 to 19.0% at the end of 2016, and the ratio of non-performing loans increased from 5.1% in 2015 to 5.2% in 2016. Regarding the Government's financial sector in 2016, the general government budget targeted to achieve the macroeconomic goals to activate the national economy, through increasing revenues, rationing government spending, and reducing the rate of inflation. Total public revenues amounted to SDG 57.7 billion, public expenditure reached SDG 68.8 billion by the end of 2016, and the total deficit of the budget amounted to SDG 11.2 billion. As for the external sector, the overall balance of payments position shifted from a surplus of US$ 38.4 million in 2015 to a deficit of US$ 18.7 million in 2016, while the current account deficit decreased from US$ 5,460.7 million in 2015 to US$ 4,127.4 million in 2016 at a rate of 24.4% due to the decline in the trade balance and the change in the total account of services income and transfers from deficit to surplus. The trade balance deficit declined from US$ 5,199 million in 2015 to US$ 4,231 million in 2016 by 18.6%. Exports decreased from US$ 3,169 million in 2015 to US$ 3,093.6 million in 2016 at a rate of 2.4%, and imports from US$ 8,368 million in 2015 to US$ 7,324.6 million in 2016 by 12.5%. Sudan's external debt increased from US$ 43.9 billion at the end of 2015 to US$ 45.4 billion by the end of 2016 due to the accumulation of the interest rates arrears and fluctuations in the exchange during 2016.

|56thANNUALREPORT2016
3
Global, Regional and Domestic Economic Indicators for the years 2015 and 2016 2016* 2015**
Global Economic Indicators 3.1 3.1 - Global Economy Growth Rate (%) 1.6 2.0 - Industrial Economies Growth Rate (%) 0.8 0.3 - Industrial Economies Inflation Rate (%) 6.2 6.8 - Industrial Economies Unemployment Rate (%)
0.7 0.5 - Industrial Economies Current A/C position as percent of GDP (% )
4.2 4.0 - Developing Economies Growth Rate (%) 4.5 5.6 - Developing Economies Inflation Rate (%)
(0.3) (0.1) - Developing Economies Current A/C position as percent of GDP (% )
Regional Economic Indicator 1.4 3.8 - Growth Rate in Sub-saharan African Countries (%) 6.5 6.5 - Growth Rate in Asian countries (%) 3.2 2.1 - Growth Rate in Middle-East and North Africa Countries (%) (0.6) (0.3) - Growth Rate in Latin America and Caribbean Countries (%) 11.3 6.9 - Inflation Rate in Sub-Saharan African Countries (%) 3.1 3.0 - Inflation Rate in Asian Countries (%) 5.4 6.0 - Inflation Rate in Middle-East and North Africa Countries (%) 5.8 11.2 - Inflation Rate in Latin America and Caribbean countries (%)
(4.5) (5.7) - Current A/C position as percent of GDP in Sub-Saharan African Countries (%)
1.6 2.0 - Current A/C position as percent of GDP in Asian Countries (%)
)5.0( )4.4( - Current A/C position as percent of GDP in Middle-East and North Africa Countries (%)
(2.3) (3.3) - Current A/C position as percent of GDP in Latin America and Caribbean Countries (%)
2.1 0.7 - Growth Rate in Arab Free Trade Area Countries (%) 4.4 5.8 - Inflation Rate in Arab Free Trade Area Countries (%)
(10.7) (10.2) - Current A/C position as percent of GDP in Arab Free Trade Area Countries (%)
3.0 2.9 - Growth Rate in COMESA Countries (%) 7.4 7.2 - Inflation Rate in COMESA Countries (%) (9.7) (11.1) - Current A/C position as percent of GDP in COMESA Countries (%)
Domestic Economic Indicators 693,514.0 582,937.4 - GDP in Current prices (million SDG) 4.9 4.3 - Real GDP Growth Rate (%) 17.6 16.9 - Annual Average Inflation Rate (%) 30.5 12.6 - End of year Inflation Rate (%) 11,234.9 6,976.4 - Overall Fiscal Deficit (-) (SDG million) 1.6 1.2 - Fiscal Deficit (-) (including grants) as percent of GDP (%)

|56thANNUALREPORT2016
4
2016* 2015** 1.7 1.2 - Fiscal Deficit (-) (excluding grants) as percent of GDP (%) 89.7 105.8 - Financing Fiscal Deficit (-) from Internal Sources 10.2 (5.8) - Financing Fiscal Deficit (-) from External Sources 57,864.6 55,499.8 - Total Revenues (SDG million) 81.7 77.0 - Tax revenues as percent of total Revenues (%) 69,099.60 61,497.50 - Total Expenditure (SDG million) 90.0 89.2 - Current Expenditure as percent of total Expenditure (%) 10.0 10.8 - Development Expenditure as percent of total Expenditure (%) 120,800.1 93,642.6 - Money supply (M2) (SDG million) 29.0 20.5 - Money Supply Growth Rate (%) 1.841 1.820 - Money Multiplier ( times) 5.786 6.225 - Velocity of Money (times) 0.173 0.161 - Degree of Monetization
)36,321.0( )26,153.5( - Net Foreign Assets (NFA) – SDG million 130,493.2 97,027.1 - Net Domestic Assets (NDA) - SDG million 83,355.3 54,193.2 - Total Finance (SDG million) 54,216.7 42,124.5 - Net Claim on Government (SDG million) 57,352.2 45,555.6 - Net Claim on Private Sector (SDG million) 132,713.5 108,937.6 - Banks Assets (SDG million) (18.7) 38.4 - Overall Balance of Payments (US$ million) (4,127.4) (5,460.7) - Net Current accounts (US$ million) 3,093.6 3,169.0 - Exports (FoB) (US$ million) 7,324.6 8,368.0 - Imports (FoB) (US$ million) (4,231.0) )5,199( - Trade Balance (US$ million)
2,859.8 3,066.1 - Invisible Receipts (US$ million) 2,756.2 3,327.8 - Invisible Payments (US$ million)
3,517.8 5,375.7 - Current and Financial Account (US$ million) 1,063.8 1,728.4 - Foreign Direct Investment (US$ million) 7.4 5.8 - Net Official Loans Inward (+) Outward (-)
45.4 43.9 - External Debt (US$ million) 40.0 45.0 - External Debt as a percent of GDP (%) 489 484 - External Debt as a percent of Revenues (%) 1,468.0 1,385.0 - External Debt as a percent of Exports (%)
* Preliminary Data ** Amended Data ( ) means minus Sources: IMF, World Economic Outlook, 2016 Chapter 6 - Table (1-6) - Central Bank of Sudan – Annual Report,2016. Chapter 3 - Table (3-1) - Central Bank of Sudan – Annual Report,2016. Chapter 6 - Table (6.2) - Central Bank of Sudan – Annual Report,2016. Chapter 10 -Table (10-4) - Central Bank of Sudan – Annual Report,2016. Chapter 10 - Table (10 - 9) - Central Bank of Sudan – Annual Report,2016.

|56thANNUALREPORT2016
5
MAJOR INTERNATIONAL ECONOMIC
DEVELOPMENTS DURING 2016

|56thANNUALREPORT2016
6

|56thANNUALREPORT2016
7
Major International Economic Developments During 2016
First: Major International and Regional Economic Developments During 2016: The global economy recorded a growth rate of 3.1% in 2016, the same growth rate in 2015. Growth rates in the United States, the United Kingdom and Japan declined. The decline in growth in the United States was attributed to continued weak investment in other non-residential sectors. The UK's sharp decline in manufacturing activity followed Britain's exit from the European Union. Japan's growth rate was adversely affected by lower external demand and corporate investment, while growth in emerging markets economies and developing economies rose after five successive years of decline. The improvement in growth rates in these countries was attributed to the rise in commodity prices, the increase in capital flows to emerging markets in the light of continued low interest rates in developed economies, as well as the stability of exchange rates and financial markets in those countries . The global economy has begun to recover from the sharp drop in oil prices and its impact on oil-exporting countries, as well as the rise in prices of non-fuel commodities. The following is a review of the performance of some economic indicators in industrial countries and developing countries in general and the Middle East and North Africa Region in particular, in addition to reviewing the economic indicators of Sudan's most important trade and investment partners, as well as reviewing the economic performance of the regional blocs in which Sudan is a member.
(1)Indicators of Growth, Inflation, Unemployment Rates and Current Account Position for Major Industrial Countries:
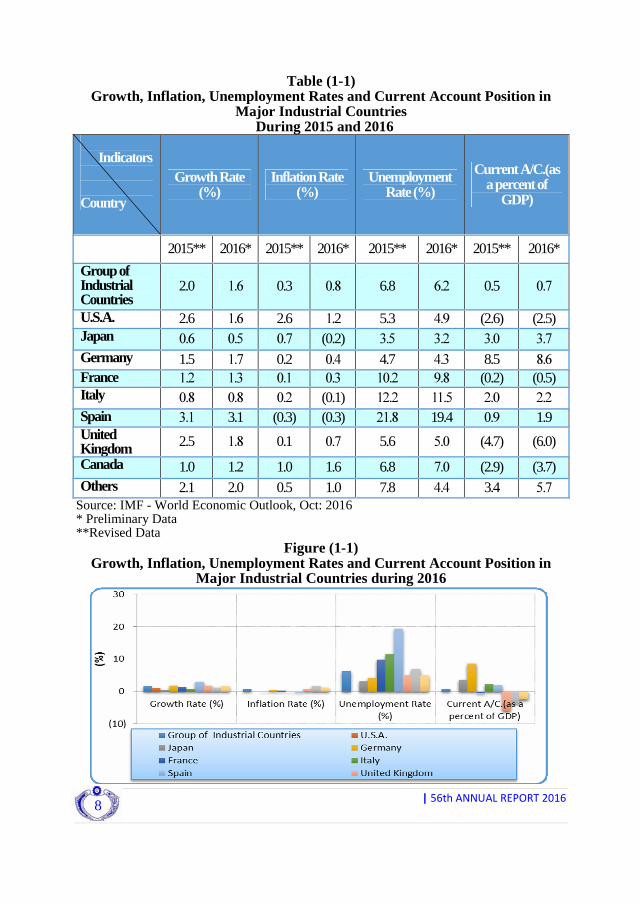
Table (1-1) shows the indicators of growth rates, inflation and current account ratio to GDP in the major industrial countries during 2015 and 2016. Figure (1-1)shows the performance of these indicators during 2016.
|56thANNUALREPORT2016
8
Table (1-1) Growth, Inflation, Unemployment Rates and Current Account Position in
Major Industrial Countries During 2015 and 2016
Indicators Country
Growth Rate (%)
Inflation Rate (%)
Unemployment Rate (%)
Current A/C.(as a percent of
GDP)
2015** 2016* 2015** 2016* 2015** 2016* 2015** 2016*
Group of Industrial Countries
2.0 1.6 0.3 0.8 6.8 6.2 0.5 0.7
U.S.A. 2.6 1.6 2.6 1.2 5.3 4.9 (2.6) (2.5) Japan 0.6 0.5 0.7 (0.2) 3.5 3.2 3.0 3.7 Germany 1.5 1.7 0.2 0.4 4.7 4.3 8.5 8.6 France 1.2 1.3 0.1 0.3 10.2 9.8 (0.2) (0.5) Italy 0.8 0.8 0.2 (0.1) 12.2 11.5 2.0 2.2 Spain 3.1 3.1 (0.3) (0.3) 21.8 19.4 0.9 1.9 United Kingdom 2.5 1.8 0.1 0.7 5.6 5.0 (4.7) (6.0)
Canada 1.0 1.2 1.0 1.6 6.8 7.0 (2.9) (3.7) Others 2.1 2.0 0.5 1.0 7.8 4.4 3.4 5.7
Source: IMF - World Economic Outlook, Oct: 2016 * Preliminary Data **Revised Data
Figure (1-1) Growth, Inflation, Unemployment Rates and Current Account Position in
Major Industrial Countries during 2016

|56thANNUALREPORT2016
9
Table (1-1) shows that the rate of growth of the industrial countries combined fell from 2% in 2015 to 1.6% in 2016 due to the low growth rates in the United States, the United Kingdom and Japan. The decline in growth rates in the United States was attributed to the continued weakness of investment in other non-residential sectors, despite the strong growth of consumption, supported by the strength of the labour market and increase in wages. Inflation in the industrial countries combined rose from 0.3% in 2015 to 0.8% in 2016 due to increase in primary commodity prices, especially fuel prices, as well as the prices of metals and agricultural commodities. Unemployment rates in the industrial countries combined fell from 6.8% in 2015 to 6.2% in 2016. It fell in all industrial countries except Canada, where there was a slight increase in unemployment from 6.8% in 2015 to 7% in 2016. The position of the current account surplus as a percentage of GDP in the industrial countries combined improved from 0.5% in 2015 to 0.7% in 2016 due to the rise in international prices of oil and its derivatives, as well as the rise in the prices of financial assets, whereas the prices of shares rose to record higher levels in the United States. (2)Indicators of Growth, Inflation Rates and Current Account Position in Developing Countries:
Table (1-2) presents` indicators of growth rates, inflation and current account ratio to GDP in developing countries during 2015 and 2016, while figure (1-2) shows the performance of these indicators during 2016.
Table (1-2) Growth Rates, Inflation and Current Account Position in Developing
Countries during 2015 and 2016 Indicators
Country Growth Rate (%)
Inflation Rate (%)
Current A/C.(as a percent of GDP)
2015** 2016* 2015** 2016* 2015** 2016*
All Developing Countries 4.0 4.2 5.6 4.5 (0.1) (0.3)
Sub –Saharan Africa 3.8 1.4 6.9 11.3 (5.7) (4.5) Asia 6.5 6.5 3.0 3.1 2.0 1.6
Middle East & North Africa
2.1 3.2 6.0 5.4 (4.4) (5.0)
Latin American & Caribbean Countries
(0.3) (0.6) 11.2 5.8 (3.3) (2.3)
Europe 3.0 1.7 2.9 0.3 (2.1) 3.4
Others (2.7) (0.3) 15.9 8.4 2.4 1.3
Source: IMF - World Economic Outlook, Oct: 2016 * Preliminary Data **Revised Data

|56thANNUALREPORT2016
10
Figure (1-2) Growth Rates, Inflation and Current Account Position in Developing
Countries During 2016
Table (1-2) shows a slight increase in the growth rate of developing countries from 4% in 2015 to 4.2% in 2016, due to the high growth rates in most emerging economies, especially India, China, Thailand, Indonesia and Philippines. Trade and effective measures on the side of policies strengthened foreign reserves in these countries rates, but there is a decline in growth rates in sub-Saharan Africa due to the low productivity caused by the shortage of foreign currency and the decline in the performance of energy sources, especially electricity. Also the growth rates fell in Europe, although most of the emerging countries in Europe witnessed stability in general. The average inflation rate of developing countries combined decreased as a result of the sharp decline in inflation rates in most countries except sub-Saharan Africa and Asia, due to the stability of exchange rates in developing countries in general. The situation of the current account deficit as a percentage of GDP in the developing countries combined deteriorated slightly from 0.1% in 2015 to 0.3% in 2016, despite the improvement in the current account in Europe, Sub-Saharan Africa Latin American countries and Caribbean, as a result of higher capital flows from developed countries.
(3)External Debt of Developing Countries: Table (1-3) shows the performance of some external debt indicators in developing countries
|56thANNUALREPORT2016
11
Table (1-3) External Debt and Service as a Ratio to GDP
for Developing Countries by the end of 2015 and 2016 Year
Indicators 2015** 2016*
External debt to GDP (%)
27.1 28.4
External debt service to GDP (%)
9.7 10.5
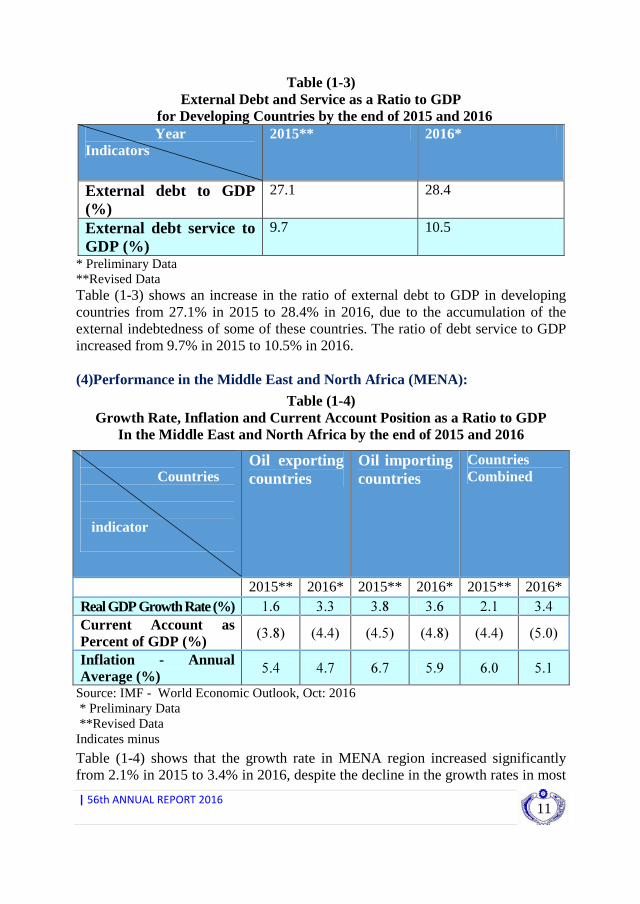
* Preliminary Data **Revised Data Table (1-3) shows an increase in the ratio of external debt to GDP in developing countries from 27.1% in 2015 to 28.4% in 2016, due to the accumulation of the external indebtedness of some of these countries. The ratio of debt service to GDP increased from 9.7% in 2015 to 10.5% in 2016. (4)Performance in the Middle East and North Africa (MENA):
Table (1-4) Growth Rate, Inflation and Current Account Position as a Ratio to GDP
In the Middle East and North Africa by the end of 2015 and 2016
Countries
indicator
Oil exporting countries
Oil importing countries
Countries Combined
2015** 2016* 2015** 2016* 2015** 2016* Real GDP Growth Rate (%) 1.6 3.3 3.8 3.6 2.1 3.4 Current Account as Percent of GDP (%)
)3.8( )4.4( )4.5( )4.8( )4.4( )5.0(
Inflation - Annual Average (%)
5.4 4.7 6.7 5.9 6.0 5.1
Source: IMF - World Economic Outlook, Oct: 2016 * Preliminary Data **Revised Data Indicates minus
Table (1-4) shows that the growth rate in MENA region increased significantly from 2.1% in 2015 to 3.4% in 2016, despite the decline in the growth rates in most

|56thANNUALREPORT2016
12
oil-exporting countries in the region as a result of fiscal austerity measures, as well as political conflicts in some countries such as Syria and Libya. The growth rates in Iraq, Iran and Kuwait increased, while it declined in oil-importing countries from 3.8% in 2015 to 3.6% in 2015. The average inflation rate for the countries in the region declined from 6% in 2015 to 5.1% in 2016 due to the low rates in both exporting and importing countries. The rates of inflation in the exporting countries decreased from 5.4% to 4.7% and in the oil-importing countries declined from 6.7% to 5.9%, due to the implementation of strict fiscal discipline in some countries, especially the GCC countries. The current account deficit as a percentage of GDP of the countries of the region increased from minus 4.4% in 2015 to minus 5% in 2016 due to the deterioration of the current account position in both oil exporting and importing countries. (4) Economic Performance of Sudan's Major Foreign Trade and Investment Partners: Table (1-5) and figure (1-3) show details of growth rate, inflation and current account ratio to GDP of Sudan's major trade and investment partners for 2015 and 2016.
Table (1-5) Growth Rate, Inflation and Current Account Position as a Ratio to GDP In Sudan's Major Trade and Investment Partners during 2015 and 2016
Indicators Country
Growth Rate (%)
Inflation Rate (%)
Current A/C.(as a percent of GDP)
2015** 2016* 2015** 2016* 2015** 2016 *
Sudan 3.5 3.1 19.8 13.5 (5.8) (5.9)
U.A.E 3.0 2.3 3.7 3.6 2.9 1.1
China 6.8 6.7 1.5 2.1 3.1 2.4
Saudi Arabia 3.4 1.2 2.1 4.0 (3.5) (6.6)
Egypt 4.2 3.8 11.0 10.2 (3.7) (5.8)
India 7.3 7.6 5.4 5.5 (1.4) (1.4)
Malaysia 4.7 4.3 2.4 2.1 2.2 1.2
Thailand 2.5 3.2 (0.9) 0.3 6.2 9.7
Turkey 3.0 3.3 7.4 8.4 (4.5) (4.4)
Japan 0.6 0.5 0.7 (0.2) 3.0 3.7
Source: IMF - World Economic Outlook, Oct 2016 * Preliminary Data **Revised Data. ( ) Indicates minus.
|56thANNUALREPORT2016
13
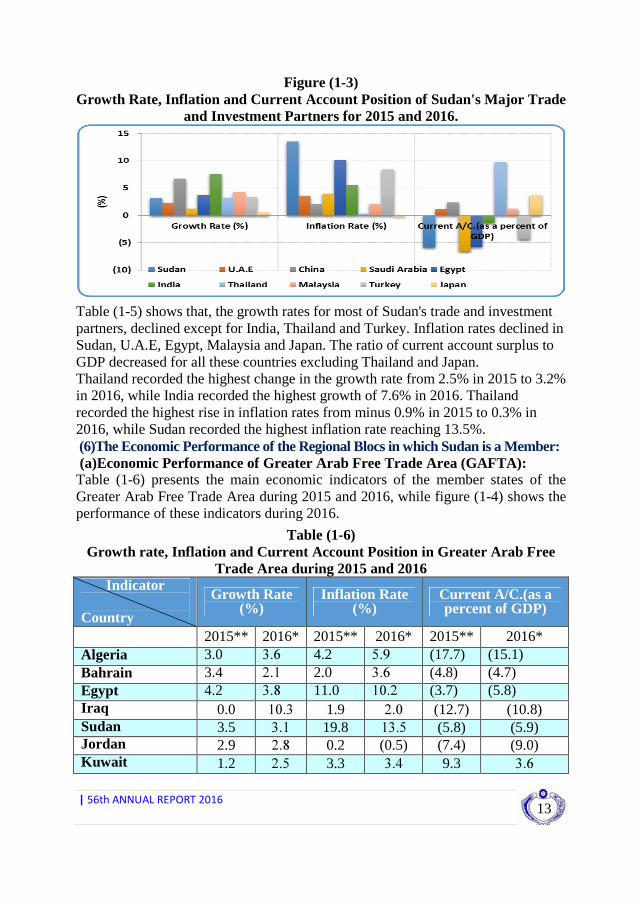
Figure (1-3) Growth Rate, Inflation and Current Account Position of Sudan's Major Trade
and Investment Partners for 2015 and 2016.
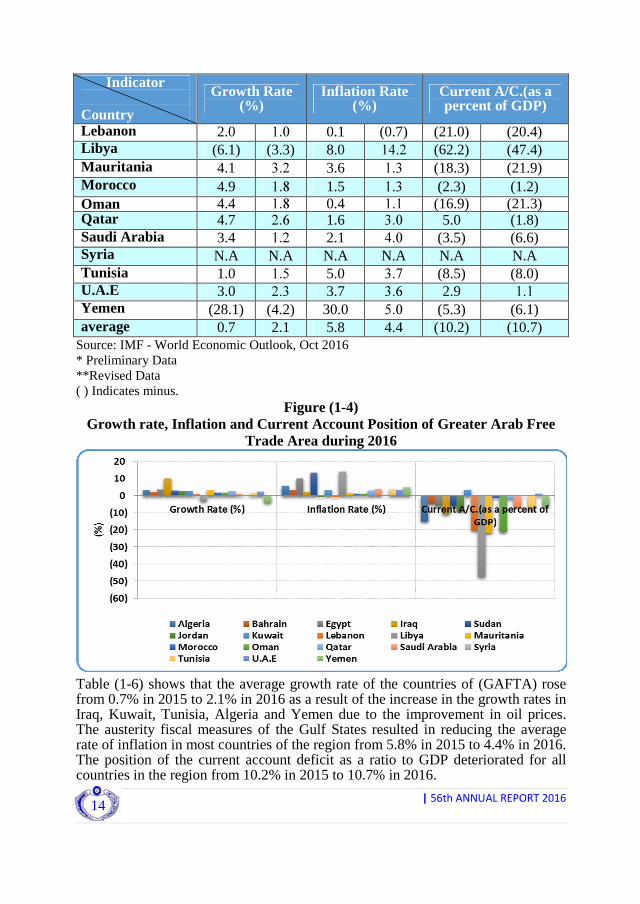
Table (1-5) shows that, the growth rates for most of Sudan's trade and investment partners, declined except for India, Thailand and Turkey. Inflation rates declined in Sudan, U.A.E, Egypt, Malaysia and Japan. The ratio of current account surplus to GDP decreased for all these countries excluding Thailand and Japan. Thailand recorded the highest change in the growth rate from 2.5% in 2015 to 3.2% in 2016, while India recorded the highest growth of 7.6% in 2016. Thailand recorded the highest rise in inflation rates from minus 0.9% in 2015 to 0.3% in 2016, while Sudan recorded the highest inflation rate reaching 13.5%. (6)The Economic Performance of the Regional Blocs in which Sudan is a Member: (a)Economic Performance of Greater Arab Free Trade Area (GAFTA): Table (1-6) presents the main economic indicators of the member states of the Greater Arab Free Trade Area during 2015 and 2016, while figure (1-4) shows the performance of these indicators during 2016.
Table (1-6) Growth rate, Inflation and Current Account Position in Greater Arab Free
Trade Area during 2015 and 2016 Indicator
Country
Growth Rate (%)
Inflation Rate (%)
Current A/C.(as a percent of GDP)
2015** 2016* 2015** 2016* 2015** 2016* Algeria 3.0 3.6 4.2 5.9 (17.7) (15.1) Bahrain 3.4 2.1 2.0 3.6 (4.8) (4.7) Egypt 4.2 3.8 11.0 10.2 (3.7) (5.8) Iraq 0.0 10.3 1.9 2.0 (12.7) (10.8) Sudan 3.5 3.1 19.8 13.5 (5.8) (5.9) Jordan 2.9 2.8 0.2 (0.5) (7.4) (9.0) Kuwait 1.2 2.5 3.3 3.4 9.3 3.6
|56thANNUALREPORT2016
14
Indicator
Country
Growth Rate (%)
Inflation Rate (%)
Current A/C.(as a percent of GDP)
Lebanon 2.0 1.0 0.1 (0.7) (21.0) (20.4) Libya (6.1) (3.3) 8.0 14.2 (62.2) (47.4) Mauritania 4.1 3.2 3.6 1.3 (18.3) (21.9) Morocco 4.9 1.8 1.5 1.3 (2.3) (1.2) Oman 4.4 1.8 0.4 1.1 (16.9) (21.3) Qatar 4.7 2.6 1.6 3.0 5.0 (1.8) Saudi Arabia 3.4 1.2 2.1 4.0 (3.5) (6.6) Syria N.A N.A N.A N.A N.A N.A Tunisia 1.0 1.5 5.0 3.7 (8.5) (8.0) U.A.E 3.0 2.3 3.7 3.6 2.9 1.1 Yemen (28.1) (4.2) 30.0 5.0 (5.3) (6.1) average 0.7 2.1 5.8 4.4 (10.2) (10.7)
Source: IMF - World Economic Outlook, Oct 2016 * Preliminary Data **Revised Data ( ) Indicates minus.
Figure (1-4) Growth rate, Inflation and Current Account Position of Greater Arab Free
Trade Area during 2016
Table (1-6) shows that the average growth rate of the countries of (GAFTA) rose from 0.7% in 2015 to 2.1% in 2016 as a result of the increase in the growth rates in Iraq, Kuwait, Tunisia, Algeria and Yemen due to the improvement in oil prices. The austerity fiscal measures of the Gulf States resulted in reducing the average rate of inflation in most countries of the region from 5.8% in 2015 to 4.4% in 2016. The position of the current account deficit as a ratio to GDP deteriorated for all countries in the region from 10.2% in 2015 to 10.7% in 2016.

|56thANNUALREPORT2016
15
(b) Economic performance of the Common Market for Eastern and Southern Africa (COMESA): Table (1-7) presents the main economic indicators of the members of (COMESA) by the end of 2015 and 2016, while figure (1-5) illustrates the performance of these indicators during 2016
Table (1-7) Growth rates, Inflation and Current Account as a Ratio to the GDP of the
COMESA Countries during 2015 and 2016
Indicators Country
Growth Rate (%)
Inflation Rate (%)
Current A/C.(as a percent of GDP)
2015** 2016* 2015** 2016* 2015** 2016*
Congo 8.4 3.9 1.0 1.7 (7.6) (0.8)
Ethiopia 8.7 6.5 10.0 7.7 (12.5) (10.7)
Sudan 3.5 3.1 19.8 13.5 (5.8) (5.9)
Eritrea 0.2 3.7 12.3 9.0 (2.2) 0.2
Burundi (7.2) (0.5) 7.4 6.3 (11.3) (4.6)
Comoros 1.0 2.2 2.0 2.2 (15.7) (9.0)
Kenya 6.5 6.0 6.3 6.2 (9.6) (6.4)
Libya (6.1) (3.3) 8.0 14.2 (62.2) (47.4)
Swaziland 1.9 0.5 5.2 7.0 1.1 (4.9)
Seychelles 3.5 4.9 4.3 (0.8) (15.2) (18.7)
Madagascar 3.4 4.1 7.6 6.7 (1.3) (2.3)
Malawi 4.0 2.7 20.1 19.8 (2.6) (15.8)
Egypt 4.2 3.8 11.0 10.2 (3.7) (5.8)
Mauritius 3.2 3.5 2.0 1.5 (4.8) (4.3)
Rwanda 6.5 6.0 2.1 5.3 (10.6) (16.6)
Zambia 4.3 3.0 7.3 19.1 (1.4) (4.5)
Zimbabwe 1.4 (0.3) (1.6) (1.6) (22.9) (7.5)
Uganda 5.2 4.9 5.7 5.5 (10.5) (8.7)
Average 2.9 3.0 7.2 7.4 (11.1) (9.7)
Source: IMF - World Economic Outlook, Oct2016 * Preliminary Data **Revised Data

|56thANNUALREPORT2016
16
Figure (1-5) Growth rates, Inflation and Current Account as a Ratio to the GDP of the
COMESA Countries During 2016
Table (1.7) shows the decline in GDP growth rates in most COMESA countries with the exception of Eritrea, the Comoros Islands, Seychelles and Madagascar. However, all these countries achieved positive growth rates except for Zimbabwe, Burundi and Libya, which suffer from political instability and conflicts. The average growth rate of the COMESA countries combined reached 3% in 2016 compared to 2.9% in 2015. Ethiopia recorded the highest growth rate in 2016 at a rate of 6.5%, although it was lower than in 2015. The lowest growth rates were recorded by Burundi (minus 0.5%) and Libya (minus 3.3%). There is a slight rise in the average inflation rate of the COMESA countries from 7.2% in 2015 to 7.4% in 2016 due to the rise in international oil prices and the prices of other commodities such as minerals. The inflation rates fluctuated between decline and rise in these countries, where Seychelles and Sudan recorded the highest rate of inflation decline from 4.3% in 2015 to minus 0.8% in 2016 and from 19.8% in 2015 to 13.5% in 2016 respectively. Zambia recorded the highest rise in inflation from 7.3% in 2015 to 19.1% in 2016. The current account deficit of the COMESA Group's as ratio of GDP fell from 11.1% in 2015 to 9.7% in 2016.
Second: The Most Important Regional Economic and Social Conferences in which Sudan Participated during 2016: (1) The 41st Annual Meeting of the Islamic Development Bank (IDB) Group; The meetings were held in the Indonesian capital Jakarta during the period (18 - 19 May 2016), these meetings discussed the progress that has been made in implementing the ten-years strategy for the group, which includes many important
|56thANNUALREPORT2016
17
initiatives with regard to strengthening institutional performance, governance and organizational effectiveness and ensure financial sustainability; which have been already approved as a framework by the Governors council in its 39th annual meeting in Kuwait as an instruments to help effectively in the requirements of the social and economic changes over the next ten years, in order to reflect the aspirations of member countries, the Islamic communities and the group’s partners of the Group, considering the development plans being implemented at the regional and international levels, including the goals of the sustainable development of the United Nations.
(2)The Eighty-Sixth Annual Meeting of the Bank for International Settlements (BIS): The meeting was held in Basel, Switzerland, during the period (25-26 June 2016) with the participation of central bank governors of member countries, international and regional financial institutions and a number of international banking experts. The Central Bank of Sudan participated as an observer. A number of sessions were held on the current regional and international developments which could affect banks, focusing on the effects of Britain's exit from the European Union
The Bank's annual report was also launched, pointing out that the private sector
and central banks have developed large contingency plans to reduce the turmoil in financial markets, despite the presence of a period of uncertainty and adaptation, especially where the global economy started to witness some arrangements to mitigate the risks. The final report included the following recommendations: - The need to lay the sound and systematic foundations for macro prudential
policies and financial stability. - The importance of rebalancing policies for a more strong and sustainable
growth. - The need to adopt structural reforms to improve productivity and increasing the
flexibility of reallocating resources. - Priority to finalize Basel 3 framework for precautionary policies, and countries
should apply the standards adopted. - Fiscal policy should take a number of positive steps to improve the quality of
public spending by investing in physical and human capital and implementing the necessary infrastructure investments.

|56thANNUALREPORT2016
18
(3)The Twenty-third Annual Meeting of the African Bank for Import and Export: The meeting was held in Seychelles (20-23 July 2016) under the theme: "The New Economy in Africa: African Trade and the Blue Economy as a Catalyst for Structural Transformations in the African Economy". The meeting was accompanied by a series of activities, which included the organization of seminars related to intra-trade and the blue economy and its role in the structural transformations in the African economy, also a group of experts presented the experiences of some countries.
(4)COMESA Meeting:
(a)The Thirty Seventh Annual Meeting of the Executive Office of the COMESA Central Banks Governors Committee: The meeting was held in Kinshasa, Democratic Republic of Congo, from (1-3 August, 2016); it concluded h the following decisions: - Include the Bank of China and the Reserve Bank of India in the COMESA
Clearing House within the banks participating in the regional payment and settlement system, and approve the introduction of the Chinese Yuan and the Indian Rupee as additional payment and settlement currencies in the system and requesting the support of Bank of Mauritius to help to achieve this.
- The Executive Committee experts should work on completing the proposed framework for the next payment and settlement system and submit their recommendations through the next meeting.
- Request the COMESA Secretariat to consolidate the efforts of the COMESA institutions in the exchange of information.
- Coordinate with the African Bank for Import and Export (Afrexim Bank) to use their operations across the system in the COMESA region.
- Requesting central banks that have not done the necessary regional payment and settlement system to complete its activation.
- The COMESA Monetary Institute requested support from the COMESA general Secretariat to finance exchange programs between Central Banks in November 2016.
(b)The Eighteenth Meeting of the Audit and Budget Matters Sub Committee: The meeting was held in Lusaka, Zambia, during the period (15-19 August 2016). The meeting discussed issues related to the status of payment of the obligations of
|56thANNUALREPORT2016
19
the member states in the budget of the General Secretariat and the various COMESA institutions. The Sudan paid its contributions until 2007. It is worth mentioning that the Sudanese delegation explained to the meeting that Sudan has fulfilled its obligations towards the Institute of Leather and Leather Products until the year 2015, as well as paying part of its contributions towards the Secretariat and the COMESA Court of Justice. (c) The Thirty-Sixth Meeting of the Committee on Administrative and Budgetary Matters: The meeting was held in Lusaka-Zambia during the period 14-16 September 2016, in the presence of the delegations of most COMESA member countries in addition to the various COMESA institutions. The meeting discussed the following agenda: - Report of the eighteenth meeting of the sub-committee on administrative
affairs and human resources issues. - Revised terms of reference of the audit and budgetary matters sub-committee. (d) The Meetings of the Governmental Committee, the 36th Ministerial Council and the 19th Summit of Heads of State and Government at COMESA: The meetings were held in Madagascar, during 10 -19 October 2016, the COMESA programs were discussed and new decisions were adopted to assist in developing the mechanism of regional cooperation and integration. The following is a summary of what was discussed in these meetings:
- Meetings of the Governmental Committee: The thirty-Sixth meeting of the governmental committee was held during the period (10-13 October 2016) with the participation of delegates from each member State, in addition to the COMESA institutions.
- Ministerial Meeting: The thirty-Sixth meeting of the Ministerial Council was held during the period (15-14 October 2016), in the presence of delegations that participated in the meetings of the governmental committees, the following reports were passed: - Report of the thirty-sixth meeting of the intergovernmental committee. - Nominations for the posts of the African Union commission.
- Heads of State and Government Summit: The 19th Summit of the Common Market for Eastern and Southern Africa (COMESA) was held during the period (18-19 October 2016) under the theme

|56thANNUALREPORT2016
20
"Comprehensive and Sustainable Industrialization", in the presence of the heads and representatives of the states participating in the meetings. - launch of the annual report of COMESA for 2015, - Call upon COMESA member countries to implement COMESA's
industrialization policy. - Urge member countries to complete work on the development of infrastructure
and pillars of industrial development - Urge member countries to emphasis the importance of financing the removal of
trade barriers and the creation of a COMESA regional market. - Welcome the COMESA regional payment and settlement system as a payment
mechanism within COMESA region. - Adoption of the COMESA Medium-Term Strategic Plan (2016-2020). - Adoption of the COMESA court Medium-Term Strategic Plan(2016-2020).
(e) The Fifteenth Meeting of the COMESA Ministerial Committee: The fifteenth meeting of the Ministerial Committee of the COMESA Fund was held in Lusaka Zambia, during the period (13-16 December 2016). The meetings of the Technical Committee were held during the period (13-15 December 2016) while the Ministerial Meeting was held on 16 December 2016. The meeting issued a number of decisions, the most important of which are: - The COMESA Secretariat shall process all extension requests for project
agreements under the Ninth Program Annex of the European Development Fund of the Regional Integration Support Mechanism by 20 December 2016.
- Urge all Member States that have projects under the Ninth Program of the European Development Fund to expedite the implementation of the remaining project activities before the end of the extension period.
- Expand the 2016 implementation period under the Eighth Call for Applications to June 2017 with a view to enabling member countries to meet their regional commitments.
- Completion of the project agreements for the Comoros, Malawi, Sudan, Uganda and Zambia, whose resources were approved under the Seventh Call by 31 March.
- Extension of the Sudan project under the ninth program of the European Development Fund for a period of one year in view of the delay related to the right of the Sudan under the regional integration support mechanism.
|56thANNUALREPORT2016
21
- Give Kenya, Sudan and Uganda 100% of their indicative allocations for 2016 according to their performance.
- Adoption of the Program of Action for the Regional Integration Support Mechanism, 2017
- Amend the COMESA protocol to include the COMESA Fund for Infrastructure Development.
(5) The 40th Meeting of the Board of Arab Central Banks and Monetary Authorities Governors: The meeting of the Board of Arab Central Banks and Monetary Authorities Governors was held on (22 September 2016) in Rabat-Morocco, which concentrated on: - Council secretariat’s report, which included activities and initiatives of the - Secretariat during 2015. - Regional and global economic and financial developments and their
consequences on Arab economies. - The first draft of the joint Arab economic report 2016. - Activities and recommendations of Arab Committee on Banking Supervision. - Activities and recommendations of Financial inclusion Regional teamwork. - Secretariat report on the Financial Stability teamwork. - The report of The Arab Committee on Credit information. - The report of The Arab Committee for the payment and settlement systems. (6) The Annual Meetings of the IMF and the World Bank: - The meetings were held in Washington, the United States of America during
the period (7-9 October 2016). The meetings witnessed a great deal of discussion among all concerned about the global economy, issues of sustainable development, poverty eradication and financial sector issues. The focus of the events of 2016 has been on commodity prices (the price of oil), the withdrawal of correspondent banks, the issues of climate change, the impact of the conflict and the refugee crisis on the economies of the Middle East and North Africa. These meetings resulted in the following decisions:
- The introduction of the Chinese Yuan into the SDR basket. - Apply zero interest rates to all concessional fund facilities to assist low-income
countries in dealing with future shocks and achieving sustainable development goals. - Adopted an agreement of bilateral borrowing with a total value of US$ 340
billion - which will help the Fund to maintain reserve for crisis.

|56thANNUALREPORT2016
22
On the sidelines of the meetings, the Sudanese delegation held a number of meetings with the officials of the World Bank, the International Monetary Fund and the relevant international bodies, the most important of which are:
- World Bank Vice President for African Affairs. - Management of cash and capital markets in the Fund. - Executive Director of the First African Group of the International Monetary
Fund. - Director of the Middle East and Central Asia Department in the International
Monetary Fund. - Sudan's main creditors. - International Finance Corporation. - Director of the Arab Monetary Fund. - Delegation of the State of South Sudan. These meetings discussed number of issues, important of which include external debt relief of Sudan, and technical assistance.
CENTRAL BANK OF SUDAN POLICIES (CBOS)FOR 2016

|56thANNUALREPORT2016
24

|56thANNUALREPORT2016
25
Central Bank of Sudan Policies (CBOS) for 2016
The CBOS policies for the year 2016 were aligned with the government budget guidelines for the year 2016 and the Five-Year Economic Program (2015-2019) in its second year, aiming at stabilization of the economy, increasing production and productivity by curbing inflation and reducing balance of payments disequilibrium. Beside that the policies also aimed at stabilizing the exchange rate through organizing the foreign exchange market, as well as the creation of suitable environment to stabilize the financial system by launching the financial inclusion and financial deepening throughout the Sudan which will help in attracting deposits and improving the efficiency of allocating resources to finance the productive sector , deepening the financial system and developing the capital market in order to attract foreign and domestic capital to contribute in achieving economic growth and balanced development. The following parts highlight the main objectives and actual performance of the policies of Central Bank of Sudan (CBOS) under the following axis during 2016. First Axis: Monetary Stability: The policies on this axis aimed to contain inflation rate around 13% on average, through tightening monetary policy to absorb excess liquidity in the economy by targeting nominal growth in money supply of 19.3%, to contribute in achieving real GDP growth rate of 6.4%. The actual performance of the CBOS policies under this axis can be summarised as follows: - The growth of money supply reached 29% by the end of 2016 compared with a
target of 19.3%, this deviation was due to the increase in the government net borrowing and guarantees paid on behalf of the governments beside the differences in the purchase and allocation of gold proceeds and wheat subsidy differentials.
- Inflation rate reached 30.5% by the end of 2016. The average annual inflation rate was 17.6% compared to the target of 13%. This deviation was attributed to the increase in the money supply growth rate to 29% and the implementation of the economic policies package in November 2016.
Second Axis: Exchange Rate and External Sector Stability The policies on this axis aimed at achieving stability and flexibility of the exchange rate and reducing external sector disequilibrium. To achieve this, several policy measures were implemented during 2016 represented in the following: (1) Exchange Rate The policies and measures have been taken led to relative stability in the exchange rate in 2016. The gap between the official and the parallel market rates narrowed to an average of 5% in December 2016. The Central Bank of Sudan has taken a number of measures to reduce the gap between supply and demand of foreign exchange.
|56thANNUALREPORT2016
26
(2) Foreign Currency Policies In support to the role of the Central Bank of Sudan to contribute in achieving economic and social development, a number of measures were issued to achieve economic and social stability and to attract more foreign exchange resources to the official market. These measures comprise the following: - Allow the private sector to import and distribute petroleum products by all
means of payment, including nil value, in accordance with policy directorate Circular No. 3/2016.
- In order to maximize the proceeds of coal exports and to ensure the utilization of these resources, the production of coal of mesquite that produced in the Delta Tukar Agricultural Project was allowed to be exported under Policy directorate Circular No. 5/2016.
- To encourage and attract foreign exchange resources, remittances of Sudanese Working Abroad and other sellers of the foreign exchange to banks and exchange companies by applying their exchange rates plus an incentive as determined by the Central Bank of Sudan policy Circular No. 6/2016 and 9/2016.
- In support of the government’s policy to increase and encourage exporters, the allocation of 10% of the non-oil export earnings to import human medicines has been cancelled. All banks have been directed to purchase the proceeds of the exports immediately upon receipt at the exchange rates declared in addition to the incentive according to policy directorate circular no. 7/2016.
- Issuing several guidelines and arrangements for banks to increase the efficiency of using the available resources in the banking system and activating the interbank market under policy directorate Circular No. 11/2016.
- To encourage and attract foreign investments, banks were allowed to purchase foreign currency from foreign exchange accounts for existing or under-establishment entities, owned or contributed to by foreigners of more than 10%, and foreign exchange accounts for entities engaged in the field of import and export, and any amounts sold by foreign investors in the Sudan should be allocated 100% in favour of the Bank at the price of its declared purchase plus incentive, under policy directorate Circular No. 14/2016.
- To encourage companies involved in the field of gold mining and to attract more investments in this area, a number of regulations were adopted to organize the use of gold proceeds under policy directorate Circular No. 16/2016.

|56thANNUALREPORT2016
27
Third Axis: Mobilization and Uses of Resources: The policies within this axis aimed at setting-up banking environment and improving banking system ability to attract domestic savings in local and foreign currencies, achieving financial inclusion, directing and rationalizing the use of these resources to serve the policies objectives through the following: (1) In the Field of Resource Mobilization The policies within this axis aimed at encouraging banks and non-bank savings institutions to attract savings by simplifying the procedures required to open new branches and accounts, in addition to improving the quality of banking services and spreading banking awareness. The financial inclusion strategy was initiated in coordination with the World Bank. Moreover, the reports of financial inclusion were developed and used as a tool to measure the development of financial and banking institutions and to increase the effectiveness of monetary policy. The mentioned policies contributed in achieving the following: - The deposits of bank increased from SDG 63.4 billion by the end of 2015 to
SDG 84 billion by the end of 2016 at a rate of 32.5%. - The number of ATM machines increased from 1,074 by the end of 2015 to
1,190 by the end of 2016 by 10.8%. - The number of points of sale increased from 2,885 by the end of 2015 to 3,447
by the end of 2016 by 19.5%. - The number of commercial banks branches increased from 720 branches by
the end of 2015 to 733 branches by the end of 2016, by 13 L8%. - The number of ATM cards increased from 2.5 million cards by the end of 2015
to 2.8 million cards by the end of 2016 by 11%. - The number of electronic wallets cards increased from 722 thousand cards by
the end of 2015 to 778 thousand cards by the end of 2016; by 8%. The number of financial transfer offices branches increased from 25 branches by the end of 2015 to 32 branches in 2016; by 28%. (2) In the Field of Resource Uses The policies within this axis aimed at directing and rationalizing the use of financial resources in line with the priorities of the macroeconomic policies. The following sections summarize the measures adopted by the Central Bank of Sudan to realize the resource allocation: Encouraging banks to expand its finance to the private sector by focusing on priority sector, which led to an increase in the balance of financing to the private sector from SDG 43 million by the end of 2015 to SDG 54 million by the end of 2016, at a rate of 24%. Finance extended to agriculture, industry, domestic trade, transport and storage sectors recorded the largest share of total finance. On the microfinance side, some controls and procedures have been reviewed, including increasing the minimum level of microfinance operations from SDG 30,000 to SDG 50,000. in addition to the adoption of letters of guarantee issued by the Microfinance Guarantee Agency which increased from SDG 2.6 billion by the end of 2015 to SDG 2.9 billion by the end of 2016, by 12%.

|56thANNUALREPORT2016
28
Fourth Axis: Financial Stability and Banking Soundness: Policies under this axis aimed at maintaining financial stability and
soundness of the banking system to conform with the international standard ratios of non-performing loans, capital adequacy, and the average administrative costs to total expenses, which are achieved through the activation of surveillance and banking supervision procedures in line with international developments. These policies include the following aspects: 1-Organization and Development of the Banking System The Central Bank of Sudan continued implementing its financial inclusion policies besides shedding light on its role and activities to achieve economic stability, through the best utilization of banks resources in financing productive sectors, as well as reducing the consumption finance. As for the development, safety and capacity-building of banks, the Central Bank of Sudan worked to facilitate the implementation of standards and guidelines relevant to the calculation of internal capital adequacy and liquidity risk management, as per Basil requirements. The Central Bank of Sudan is working on the adoption of macro prudential policies, concerning the safety of the overall financial system, through the preparation of guidelines for stress testing, which enables the assessment of banks ability to withstand shocks that may occur. And to publish the results in the Financial Stability Report, after taking into account the recommendation of the IMF and (METAC) Technical Missions recommendations. In the area of combating money laundering and financing of terrorism, efforts continued to activate the regulatory and supervisory procedures of banks and financial institutions, relevant to money laundering and financing of terrorism. As a result, the International Financial Task Force for the Middle East and North Africa, has endorsed Sudan's transition from periodic follow-up to an update each two years, The endorsement was coupled with praising Sudan’s commitment to the international standards related to the combat of money laundering and financing of terrorism. In September 2016, a conference was held in New York about the US sanction on Sudan. Participants were representing the US government, Sudanese banking sector, Sudanese private sector and correspondent banks. Officials from the Office of Foreign Assets Control (OFAC) provided an explanation on how to deal with Sudanese banks under sanction, use of the general license and the permitted activities. The conference was considered as a step towards improving correspondent banking relationship. 2-Banking Supervision CBOS policies in the banking supervision axis aimed at enhancing the banks’ compliance with the international supervisory standards, issued by Basel Committee and Islamic Financial Services Board (IFSB). as well as, the compliance with financial safety indicators for banks, to improve banks financial efficiency, tightening banking supervision, addressing the weaknesses of banks to safeguard depositors’ rights and ensure optimal allocation of resources. Through,

|56thANNUALREPORT2016
29
activating the role of the boards of directors, empowering internal audit, monitoring units and the compliance officers. Despite the unfavourable economic conditions experienced by the country, the CBOS has exerted robust efforts to improve the performance of capital adequacy, corporate governance and risk management indicators. Towards this end, the CBOS policies aimed at reaching the (6%) international standard ratio of Non-performing loans (NPLs), in addition to enhancing the overall position of the banking indicators to improve banks’ ability to compete domestically and internationally. The following part provides a summary of banks performance according to the indicators below: - a. Financial Soundness of Banks - Capital Adequacy ratio has declined from 20.0% in 2015 to 19.0% in 2016 as a
result of an increase in the risk weighted assets and a slight increase in the banks’ capital, given that the standard ratio is 12%.
- Non-Performing Loans ratio remained at 5% in 2015 and 2016, which coincides with CBOS continuous efforts to maintain a better ratio than the standard 6%.
- Finance provisions to NPLs ratio has declined from 65% in 2015 to 60% in 2016. - The return on assets (before tax) ratio has increased from 3.96%in 2015 to
4.66% in 2016. - The return on capital (before tax) ratio has increased from 37% in 2015 to 46%
in 2016 reflecting the ability of banks to use their capital and other resources efficiently. - The liquid assets ratio to total assets has decreased from 37.4% in 2015 to 35% in 2016. b) - Consolidated Balance-Sheet of Banks Total deposits to total liabilities ratio remained at 63 % in 2015 and 2016. Capital and reserves ratio to liabilities has decreased from 10.6% in 2015 to 10.1% in 2016 due to an increase in banks deposits along with stable position of banks capital and reserves. Total finance to total assets ratio has increased from 58% in 2015 to 59% in 2016. Total finance to total deposits ratio has increased from 92% in 2015 to 93% in 2016. c) - Customers Inquiry and Credit Scoring (CIASA) CBOS policies in this context aimed at improving CIASA database, through the continuous efforts to raise credit scoring awareness and the provision of demographic and financial data related to banks and microfinance customers. In this respect, the Agency has provided its services to all banks, microfinance institutions and two Ijara companies; moreover, it continued the efforts to complete customers missing data and to increase the number of registered customers in CIASA database. Thus by the end of 2016 the agency has issued 741,906 credit codes for customers compared to 751,353 in 2015, besides conducting a credit inquiry for 1,308,460 customers by the end of 2016 compared to 915,333 customers by the end of 2015 at a rate of 42%.
|56thANNUALREPORT2016
30
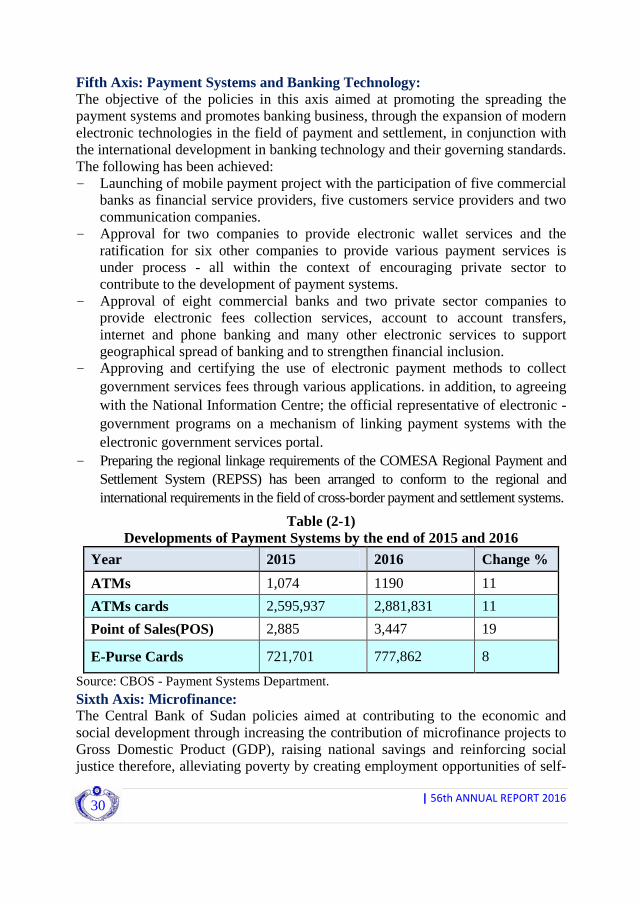
Fifth Axis: Payment Systems and Banking Technology: The objective of the policies in this axis aimed at promoting the spreading the payment systems and promotes banking business, through the expansion of modern electronic technologies in the field of payment and settlement, in conjunction with the international development in banking technology and their governing standards. The following has been achieved: - Launching of mobile payment project with the participation of five commercial
banks as financial service providers, five customers service providers and two communication companies.
- Approval for two companies to provide electronic wallet services and the ratification for six other companies to provide various payment services is under process - all within the context of encouraging private sector to contribute to the development of payment systems.
- Approval of eight commercial banks and two private sector companies to provide electronic fees collection services, account to account transfers, internet and phone banking and many other electronic services to support geographical spread of banking and to strengthen financial inclusion.
- Approving and certifying the use of electronic payment methods to collect government services fees through various applications. in addition, to agreeing with the National Information Centre; the official representative of electronic - government programs on a mechanism of linking payment systems with the electronic government services portal.
- Preparing the regional linkage requirements of the COMESA Regional Payment and Settlement System (REPSS) has been arranged to conform to the regional and international requirements in the field of cross-border payment and settlement systems.
Table (2-1) Developments of Payment Systems by the end of 2015 and 2016
Year 2015 2016 Change %
ATMs 1,074 1190 11
ATMs cards 2,595,937 2,881,831 11
Point of Sales(POS) 2,885 3,447 19
E-Purse Cards 721,701 777,862 8
Source: CBOS - Payment Systems Department.
Sixth Axis: Microfinance: The Central Bank of Sudan policies aimed at contributing to the economic and social development through increasing the contribution of microfinance projects to Gross Domestic Product (GDP), raising national savings and reinforcing social justice therefore, alleviating poverty by creating employment opportunities of self-

|56thANNUALREPORT2016
31
employment, promoting entrepreneurship and innovation to increase income and assets of various economically active poor groups. To achieve these objectives, CBOS continued its efforts to allocate 12% of the total financing portfolio of each bank to microfinance projects. Moreover, microfinance ceiling for individuals was raised from SDG 30,000 to SDG 50,000 together with, the commencement of the wholesale microfinance guarantee agency (TAISEER) in 2016. Accordingly, two guarantee documents have been issued for Microfinance institutions, and a coordinating council has been established, comprising the Microfinance Unit and the Sudanese Company for Development of Microfinance. The year 2016 also witnessed launching of the agricultural season financing program using technology in cooperation with the Ministry of Agriculture and Forestry. As a result of these efforts, the cumulative number of microfinance customers increased from 1.1 million by the end of 2015 to 1.5 million customers by the end of 2016, at a rate of 45%. Whereas banking microfinance increased from SDG 2.6 billion by the end of 2015 to SDG 2.9 billion by the end of 2016, at a rate of 12%.The increase in microfinance customers has been associated with an increase in the number of microfinance institutions from 33 institution in 2015 to 34 by the end of 2016. Capital contribution to microfinance institutions increased from SGD 37 million by the end of 2015 to SDG 39 million by the end of 2016, while the ratio of non-performing loans in microfinance institutions reached 5% in 2016. Seventh Axis: Developing and Deepening Banking Sector Islamization: The policies in this axis aimed at deepening and developing banking sector Islamization, through activation of the Higher Shari’ah Supervisory Board (HSSB) and Shari’ah Supervisory boards in banks, through the implementation of Islamic Shari’ah guidelines relating to interbank market, developing new Islamic compliant finance contracts to assist in monetary policy and microfinance management. Cooperation between the CBOS, Sudanese Banks Union and (HSSB), has continued in order to develop new financing contracts to meet the customer needs that were not satisfied by the current contracts. As for the Fatawas, the Higher Shari’ah Supervisory Board issued a fatwa concerning the financing of health service and another one concerning Murabaha (Purchase Order) between Abu Dhabi National Bank and the Directorate of Strategic Stock Reserve. in order, to improve banking sector employees and clients capacity in Shari’ah aspects particularly, Fiqh Mu’amlat (Islamic Commercial Law), and in cooperation with the relevant authorities, In addition a number of training courses and lectures were organized with respect to Fiqh Mu’amlat of financial and banking transactions , Shari’ah rulings on Sales and issues in the practice and risk associated with the islamic financing contracts in various Sudanese states.. With regards to fostering Sudan’s external relations with Islamic institutions, (HSSB) hosted the public hearing session on draft of gold standard prepared by the Accounting and Auditing Organization of the Islamic Financial Institutions (AAOIFI).
|56thANNUALREPORT2016
32
Eighth Axis: CBOS Branches: The policies under this axis aimed at activating the role of Central Bank of Sudan branches and expanding their responsibilities with respect to economic, financial and banking activities. Therefore contributing to the expansion of financial inclusion and the spread of microfinance programs in the states. in addition, to enhancing the functional tasks and organizational structure of the branches, so as to achieve their objectives of strengthening the supervisory and regulatory role of the banking sector and non-bank financial institutions. Ninth Axis: Currency Management: Policies under this axis aimed at developing and managing currency in line with the requirements of growth and economic stability besides, the provision of banknotes and coins needed by the economy as well as maintaining the optimal volume of the currency issued and their denominations. The Central Bank of Sudan continued the implementation of clean currency policy, replacement policy for the currency that has been withdrawn from circulation and policy to fight counterfeiting and forgery policy. In this context, the needs of the economy for banknotes and coins have been met and many awareness programs have been organized to communicate the characteristics of clean and fit currency to the public through various media outlets.Moreover, the link for the identification of security marks of the national currency on the CBOS website has been improved by introducing dynamic images instead of the static ones, beside providing radiology devices to detect counterfeiting in line with international best practices.

MONEY SUPPLY

|56thANNUALREPORT2016
34
|56thANNUALREPORT2016
35
Money Supply
Money Supply (M2), broadly defined comprises currency with the public, demand deposits and quasi-money (margins on documentary letters of credit, and letters of guarantee, time deposits and investment deposits), whereas the narrow definition of money supply (M1), includes currency with the public and demand deposits. This chapter reviews the most important developments in the money supply and factors affecting it, as well as changes in the monetary base, money multiplier, velocity of money in circulation and the degree of monetization.
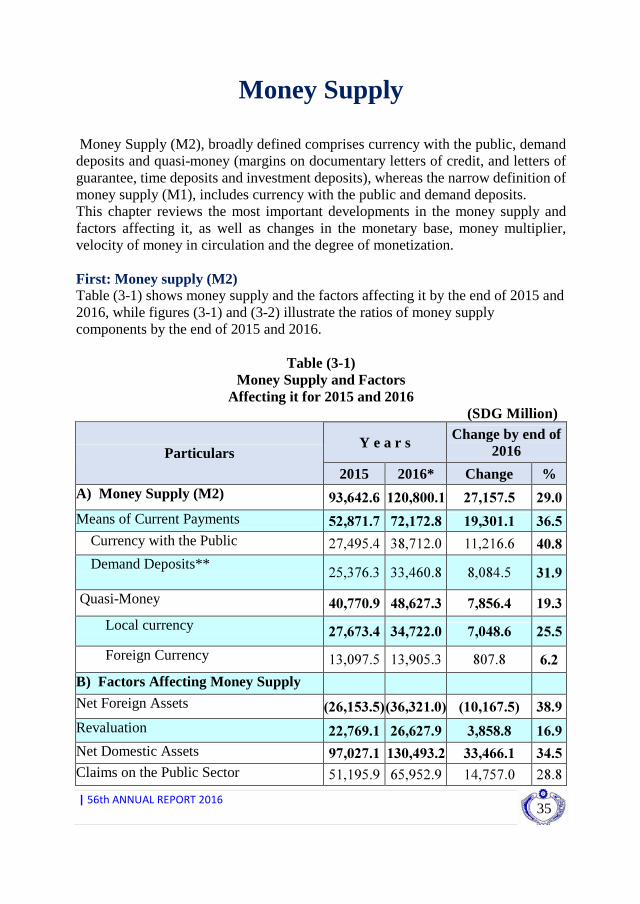
First: Money supply (M2) Table (3-1) shows money supply and the factors affecting it by the end of 2015 and 2016, while figures (3-1) and (3-2) illustrate the ratios of money supply components by the end of 2015 and 2016.
Table (3-1) Money Supply and Factors
Affecting it for 2015 and 2016 (SDG Million)
Y e a r s Change by end of 2016 Particulars
2015 2016* Change % A) Money Supply (M2) 93,642.6 120,800.1 27,157.5 29.0
Means of Current Payments 52,871.7 72,172.8 19,301.1 36.5 Currency with the Public 27,495.4 38,712.0 11,216.6 40.8 Demand Deposits**
25,376.3 33,460.8 8,084.5 31.9
Quasi-Money 40,770.9 48,627.3 7,856.4 19.3
Local currency
27,673.4 34,722.0 7,048.6 25.5
Foreign Currency 13,097.5 13,905.3 807.8 6.2
B) Factors Affecting Money Supply Net Foreign Assets )26,153.5( )36,321.0( )10,167.5( 38.9 Revaluation 22,769.1 26,627.9 3,858.8 16.9 Net Domestic Assets
97,027.1 130,493.2 33,466.1 34.5 Claims on the Public Sector 51,195.9 65,952.9 14,757.0 28.8

|56thANNUALREPORT2016
36
Y e a r s Change by end of 2016 Particulars
2015 2016* Change % 1-1- Central Government 42,124.5 54,216.7 12,092.2 28.7 1-2- Public Enterprises 9,071.4 11,736.2 2,664.8 29.4 Claims on the Private Sector 45,555.6 57,352.2 11,796.6 25.9 Other items( net) 275.6 7,188.1 6,912.5
Total ( A) = (B ) 93,642.6 120,800.1 C) Indicators of Money Supply:
Currency with the Public/Money Supply (%)
29.4 32.0
Demand Deposits/Money Supply (%) 27.1 27.7
Quasi Money/Money Supply (%) 43.5 40.3
Source: Central Bank of Sudan * Preliminary Data * *It includes current deposits of States and Local Governments and Public Enterprises at the Central Bank of Sudan, in addition to current deposits at Commercial Banks.
Figure (3-1) Contribution of Money Supply Components
by the end of 2015
|56thANNUALREPORT2016
37
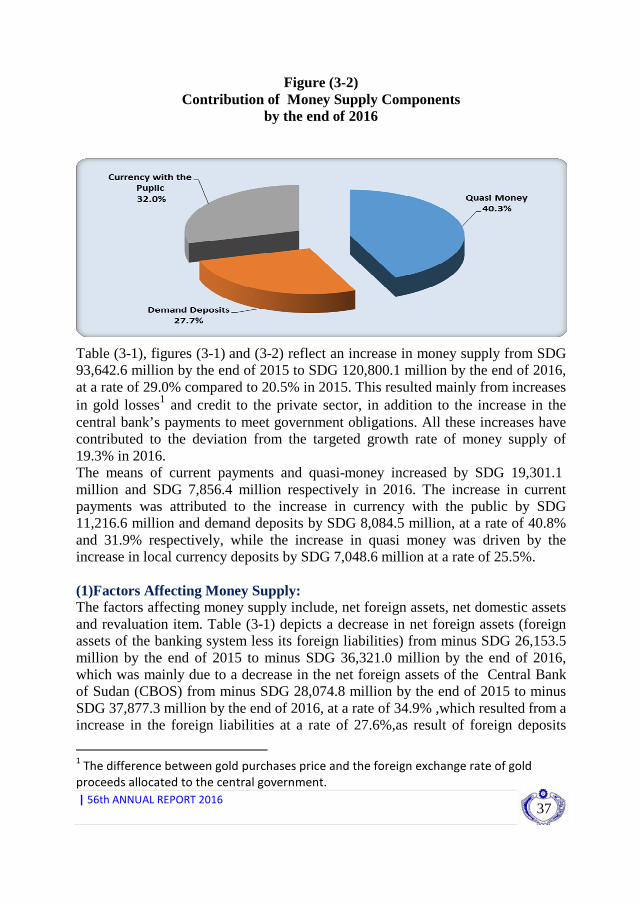
Figure (3-2) Contribution of Money Supply Components
by the end of 2016
Table (3-1), figures (3-1) and (3-2) reflect an increase in money supply from SDG 93,642.6 million by the end of 2015 to SDG 120,800.1 million by the end of 2016, at a rate of 29.0% compared to 20.5% in 2015. This resulted mainly from increases in gold losses1 and credit to the private sector, in addition to the increase in the central bank’s payments to meet government obligations. All these increases have contributed to the deviation from the targeted growth rate of money supply of 19.3% in 2016. The means of current payments and quasi-money increased by SDG 19,301.1 million and SDG 7,856.4 million respectively in 2016. The increase in current payments was attributed to the increase in currency with the public by SDG 11,216.6 million and demand deposits by SDG 8,084.5 million, at a rate of 40.8% and 31.9% respectively, while the increase in quasi money was driven by the increase in local currency deposits by SDG 7,048.6 million at a rate of 25.5%. (1)Factors Affecting Money Supply: The factors affecting money supply include, net foreign assets, net domestic assets and revaluation item. Table (3-1) depicts a decrease in net foreign assets (foreign assets of the banking system less its foreign liabilities) from minus SDG 26,153.5 million by the end of 2015 to minus SDG 36,321.0 million by the end of 2016, which was mainly due to a decrease in the net foreign assets of the Central Bank of Sudan (CBOS) from minus SDG 28,074.8 million by the end of 2015 to minus SDG 37,877.3 million by the end of 2016, at a rate of 34.9% ,which resulted from a increase in the foreign liabilities at a rate of 27.6%,as result of foreign deposits
1 The difference between gold purchases price and the foreign exchange rate of gold
proceeds allocated to the central government.

|56thANNUALREPORT2016
38
decline, in addition to a decrease in the net foreign assets of the commercial banks from SDG 1,921.3 million by the end of 2015 to SDG 1,556.4 million by the end of 2016, at a rate of 19.0%, as result of the decrease in foreign assets and an increase in foreign liabilities of commercial banks .
Net domestic assets increased from SDG 97,027.1 million by the end of 2015 to SDG 130,493.2 million by the end of 2016, at a rate of 34.5%. This was attributed to the increase in the net claims on central government by SDG 12,092.5 million, claims on private sector by SDG 11,796.6 million and other items net by SDG 6,912.5 million.
The revaluation item (changes in the net assets and liabilities in foreign currency when valued at the local currency) increased from SDG 22,769.1 million by the end of 2015 to SDG 26,627.9 million by the end of 2016 at a rate of 16.9 % , this was due to the exchange rate effect . (2)Growth Rate of Money Supply during the period (2012-2016): Figure (3-3) illustrates the growth rate of money supply during (2012-2016)
Figure (3-3)
Growth Rate of Money Supply during (2012-2016)
Figure (3-3) depicts an increase in the growth rate of money supply by the end of 2012 which mainly resulted from an increase in gold purchases as a major source of the foreign exchange; however, by the end of 2013 it sharply decreased because of Central Bank of Sudan policy of reducing gold purchases, but it increased again by the end of 2014, 2015 and 2016 due to the increase in claims of private sector, in addition to the increase in the difference between gold purchases price and the foreign exchange rate of gold proceeds allocated to the central government.
(3)Major Sources of Monetary Expansion: Table (3-2) explains the most important sources of monetary expansion by the end of 2015 and 2016.
2013 2012 2014 2015 2016

|56thANNUALREPORT2016
39
Table (3-2) The Most Important Sources of
Monetary Expansion by the end of 2015 and 2016 (SDG Millions)
Y e a r s Changes %
Particular 2015 2016* Change %
Contribution to the change in money supply
(%)***
Central Bank of Sudan
Gold price variations2
12,237.1 18,935.6 6,698.5 54.7 24.7
CBOS Payments to meet gov. obligations
10,746.7 20,976.1 10,229.4 95.2 37.7
Temporary Advances ** 3,500.0 8,900.0 5,400.0 154.3 19.9
Commercial Banks
Private sector finance
43,509.2 54,010.2 10,501.0 24.1 38.7
Source: Central Bank of Sudan * Preliminary Data ** Amended Data *** Calculated by dividing change in each particular by money supply change.
It was shown in table (3-2) the Central Bank of Sudan and the commercial banks contributed in the monetary expansion in 2016. In Central Bank of Sudan the main source of expansion is the increment in the payments to meet central government obligations from SDG 10,746.7 million by the end of 2015 to SDG 20,976.1 million by the end of 2016 at a rate of 95.2% with a contribution rate of 37.7% in the total expansion of money supply. Also the difference in gold proceeds and assignment of foreign exchange to meet government imports and other obligations increased from SDG 12,237.1 million by the end of 2015 to SDG 18,935.6 million by the end of 2016, by 54.7% contributing 24.7% in the total expansion of money supply, in addition to the increase in temporary advances to the central government from SDG 3,500.0 million by the end of 2015 to SDG 8,900.0 million by the end of 2016, by 154.2%, contributing 19.9% in the total expansion of money supply.
2 The price difference resulting from the purchase of gold at the market price and allocation of the proceeds at an official
rate to import strategic goods.
|56thANNUALREPORT2016
40
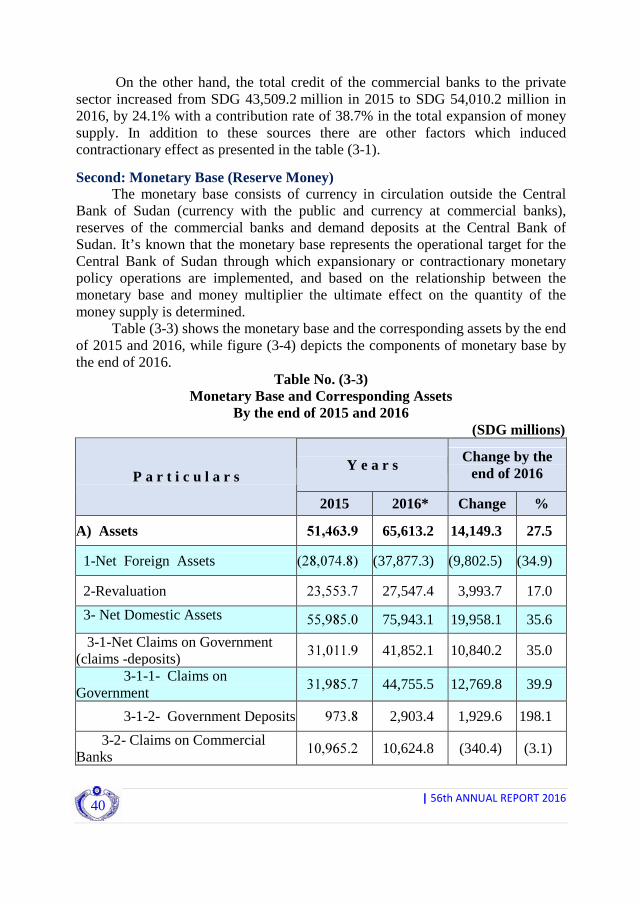
On the other hand, the total credit of the commercial banks to the private sector increased from SDG 43,509.2 million in 2015 to SDG 54,010.2 million in 2016, by 24.1% with a contribution rate of 38.7% in the total expansion of money supply. In addition to these sources there are other factors which induced contractionary effect as presented in the table (3-1).
Second: Monetary Base (Reserve Money) The monetary base consists of currency in circulation outside the Central
Bank of Sudan (currency with the public and currency at commercial banks), reserves of the commercial banks and demand deposits at the Central Bank of Sudan. It’s known that the monetary base represents the operational target for the Central Bank of Sudan through which expansionary or contractionary monetary policy operations are implemented, and based on the relationship between the monetary base and money multiplier the ultimate effect on the quantity of the money supply is determined.
Table (3-3) shows the monetary base and the corresponding assets by the end of 2015 and 2016, while figure (3-4) depicts the components of monetary base by the end of 2016.
Table No. (3-3) Monetary Base and Corresponding Assets
By the end of 2015 and 2016 (SDG millions)
Y e a r s Change by the end of 2016 P a r t i c u l a r s
2015 2016* Change %
A) Assets 51,463.9 65,613.2 14,149.3 27.5
1-Net Foreign Assets )28,074.8( (37,877.3) (9,802.5) (34.9)
2-Revaluation 23,553.7 27,547.4 3,993.7 17.0
3- Net Domestic Assets
55,985.0 75,943.1 19,958.1 35.6
3-1-Net Claims on Government (claims -deposits)
31,011.9 41,852.1 10,840.2 35.0
3-1-1- Claims on Government
31,985.7 44,755.5 12,769.8 39.9
3-1-2- Government Deposits 973.8 2,903.4 1,929.6 198.1
3-2- Claims on Commercial Banks
10,965.2 10,624.8 (340.4) (3.1)

|56thANNUALREPORT2016
41
Y e a r s Change by the end of 2016 P a r t i c u l a r s
2015 2016* Change % 3-3- Claims on Public Enterprises
1,170.2 1,399.8 229.6 19.6
3-4- Instruments of Liquidity Management (Shihab)**
0.0 0.0 0.0 0.0
3-5-Other Items(Net) 12,837.7 22,066.4 9,228.7 71.9
Total Assets (1+2+3)=Liabilities 51,463.9 65,613.2 14,149.3 27.5
B) Liabilities(Reserve Money): 51,463.9 65,613.2 14,149.3 27.5
Currency in Circulation outside CBOS
29,340.4 40,904.3 11,563.9 39.4
With the Public 27,495.4 38,712.0 11,216.6 40.8
With the Commercial Banks 1,845.1 2,192.3 347.2 18.8
2- Banks’ Reserves with the Central Bank of Sudan
19,142.6 21,623.0 2,480.4 13.0
3- Deposits included in money supply at CBOS ***
2,980.9 3,085.9 105.0 3.5
Source: Central Bank of Sudan * Preliminary Data. ** Central Bank of Sudan, Ijarah Certificates. ***Deposits of States and Local Governments and Public Enterprises.
Figure (3-4) Components of the Monetary Base
By the end of 2016

|56thANNUALREPORT2016
42
(1)Assets: The assets corresponding to the monetary base increased from SDG 51,463.9
million by the end of 2015 to SDG 65,613.2 million by the end of 2016 at a rate of 27.5 %. This was attributed to the increase in net domestic assets from SDG 55,985.0 million by the end of 2015 to SDG 75,943.1 million by the end of 2016, at a rate of 35.6%, due to the increase in the net claim on the central government from SDG 31,011.9 million by the end of 2015 to SDG 41,852.1 million by the end of 2016 at a rate of 35.0 % because of the increase in the difference between gold purchases price and the foreign exchange rate of allocation of gold proceeds to the central government ,by SDG 6,698.5 million from 2015 at a rate of 54.7 %. The revaluation item increased from SDG 23,553.7 million by the end of 2015 to SDG 27,547.4 million by the end of 2016, at a rate of 17.0% as a result of the exchange rate effect. Net foreign assets decreased from minus SDG 28,074.8 million by the end of 2015 to minus SDG 37,877.3 million by the end of 2016, at a rate of 34.9% due to the decrease in the foreign assets3 and the increase in the long term foreign liabilities. (2)Liabilities: Banks’ reserves4 with the Central Bank of Sudan increased from SDG 19,142.6 million by the end of 2015 to SDG 21,623.0 million by the end of 2016 at a rate of 13.0 % , also currency in circulation outside the Central Bank of Sudan (including currency with the public and currency at commercial banks) increased from SDG 29,340.4 million by the end of 2015 to SDG 40,904.3 million by the end of 2016 at a rate of 39.4%, due to the increase in the currency issued from SDG 30,707.2 million by the end of 2015 to SDG 42,621.7 million by the end of 2016 at a rate of 38.8%, and states and local governments and public enterprises deposits included in the money supply increased from SDG 2,980.9 million by the end of 2015 to SDG 3,085.9 million by the end of 2016 at a rate of 3.5 %.
Third: Money Multiplier, Velocity of Circulation and the Degree of Monetization Table (3-4), together with figures (3-5), (3-6) and (3-7) explain money multiplier, velocity of circulation and the degree of monetization during the period (2012 – 2016).
3 Foreign assets include: gold, SDRs, international reserves, loans to non-residents, and
participation in foreign banks. 4 Banks’ reserves include: cash , legal reserves ,and the current account.

|56thANNUALREPORT2016
43
Table (3-4) Money Multiplier, Velocity of Circulation and Deepening of Monetization
during (2012–2016) Year
Particulars 2012 2013 2014 2015 2016*
Money multiplier1(%) 1.935 1.822 1.837 1.820 1.841
Velocity of Money in Circulation2(Times)
4.149 5.159 6.121 6.225 5.786
Degree of Monetization3 (%) 0.241 0.194 0.163 0.161 0.173
Currency with the Public/ GDP(%) 0.069 0.056 0.049 0.047 0.055
Deposits4/GDP(%) 0.172 0.138 0.114 0.113 0.177 Source: Central Bank of Sudan, Statistics Department. * Preliminary Data. 1 / Money Multiplier= Broad Money/Monetary Base. 2 / Velocity of Money= GDP / Money supply. 3 / Degree of Monetization= Broad Money /GDP. 4 / Includes current deposits and quasi money deposits.
Figure (3-5) Money Multiplier during (March 2015 – December2016)
Money multiplier is the ratio used as a mean to measure the ability of banks to create money in the national economy. Figure (3-5) depicts a decrease in the money multiplier during 2015 and 2016, due to an increase in the monetary base at a greater rate than the increase in money supply.

|56thANNUALREPORT2016
44
Figure (3-6) Velocity of Money in Circulation during (2012 –2016)
The velocity of money in circulation indicates the number of times that a unit of money used in transactions settlement or economic exchanges during a certain period of time, it is related negatively to the money supply and positively to the Gross Domestic Product. Figure (3-6) reflects proportional increase in the velocity of money in circulation during the period (2014-2015) due to the increase in the Gross Domestic Product at a greater rate than the increase in money supply, while the velocity of money in circulation decreased in 2016.
Figure (3-7) Degree of Monetization during (2012 –2016)
The degree of monetization is the spread of dealing with the banking institutions, it’s related to the monetary policy efficiency and the diversification of its instruments to attract banking system dealers. The decrease in the degree of dealings with the banking system from the public view which is associated with the decrease in incomes, banking literacy, and returns on investment deposits especially under high inflation rates. Also the degree of monetization can be measured by dividing money supply over (GDP), currency in circulation over (GDP), and the deposits over (GDP). Figure (3-7) illustrates a slight increase in the degree of monetization in the 2016 compared to 2014 and 2015.
2013 2012 2014 2015 2016
2013 2012 2014 2015 2016

BANKS AND NON-BANK FINANCIAL INSTITUTIONS

|56thANNUALREPORT2016
46

|56thANNUALREPORT2016
47
Banks and Nonbanks Financial Institutions This chapter reviews the performance of the banking system (Central Bank of Sudan and the operating banks) and the non-bank financial institutions. It analyzes the Central Bank of Sudan balance sheet and the performance of ancillary companies and units which assist the Central Bank of Sudan in implementing different policies and programs, which include the Microfinance Unit, Credit and Information Scoring Agency (CIASA), and Electronic Banking Services Company (EBS). It also explains the most important developments related to banks and performance of non-bank financial institutions such as Exchange Bureaus, Financial Transfers Companies, Sudan Financial Services Company, Tarweej Company for Financial Investment, Bank Deposits Security Fund, Khartoum Stock Exchange, Insurance Market, National Agency for Insurance and Finance of Exports, Inter-bank Liquidity Management Fund and Micro Finance Guarantee Agency (Taiyseer). First: The Banking System: 1)The Central Bank of Sudan: The functions of the Central Bank of Sudan according to Article (6) of its 2002 Act,(amended 2012) are summarized in: maintaining the stability of the exchange rate and efficiency of the banking system, issuing the currency in different denominations and organizing and monitoring it, formulating and implementing monetary policy, organizing, supervising, controlling of and working towards upgrading, developing and enhancing banking business efficiency in a manner that contributes to the attainment of balanced economic and social development, as well as acting as the government's bank, and its advisor and agent in the monetary and financial affairs. The Central Bank of Sudan implements its policies through its 17 branches, as it was at the end of 2015, distributed across the various states of Sudan. Table (4-1) illustrates the balance sheet of the Central Bank of Sudan by the end of December 31, 2015 and December 31, 2016 according to the standard format recommended by the International Monetary Fund authorities for monetary statistics.

|56thANNUALREPORT2016
48
Table (4-1) Central Bank of Sudan Balance Sheet by the end of 2015 and 2016
(SDG Millions) Particulars 31/12/2015**31/12/2016*Change Change%
Assets: Bank Notes and Banks Balances 6,110.2 5,692.7 (417.5) (6.8)
Foreign Securities *** 288.8 415.1 126.3 43.7
Loans and Advances to Banks 8,317.8 7,911.4 (406.4) (4.9)
Temporary Advances to Government under Article (48–1) 3,500.0 8,900.0 5,400.0 154.3
Long - terms Loans to Government 11,939.0 11,939.0 - -
Differences in prices of Gold Sold 12,237.1 18,935.6 6,698.5 54.7 Loans and Advances to Public Enterprises 522.4 669.9 147.5 28.2
Contributions in Local Banks Capital 2,647.4 2,713.4 66.0 2.5
Other Contributions **** 647.9 729.9 82.0 12.7 Other Accounts 52,620.2 69,898.6 17,278.4 32.8 Total Assets 98,830.8 127,805.6 28,974.8 29.3
Liabilities: Notes and Coins in Circulation 29,340.4 40,904.3 11,563.9 39.4
Sight Liabilities: 24,059.4 29,311.2 5,251.8 21.8 Federal Government 973.8 2,903.4 1,929.6 198.2
State and Local Governments 580.3 1,021.5 441.2 76.0
Public Enterprises 2,400.6 2,064.4 (336.2) (14.0)
Banks 20,104.7 23,321.9 3,217.2 16.0
Foreign Correspondents 2,373.5 4,159.4 1,785.9 75.2
Time Liabilities 17,631.3 24,285.7 6,654.4 37.7
Payment Agreements 143.2 159.4 16.2 11.3
Capital and Reserves 732.3 773.6 41.3 5.6 Other Accounts 24,550.7 28,212.0 3,661.3 14.9
Total Liabilities 98,830.8 127,805.6 28,974.8 29.3
Source: Central Bank of Sudan. * Amended Data. ** Preliminary Data. ***Contributions in foreign banks. ****Contributions in local public enterprises.
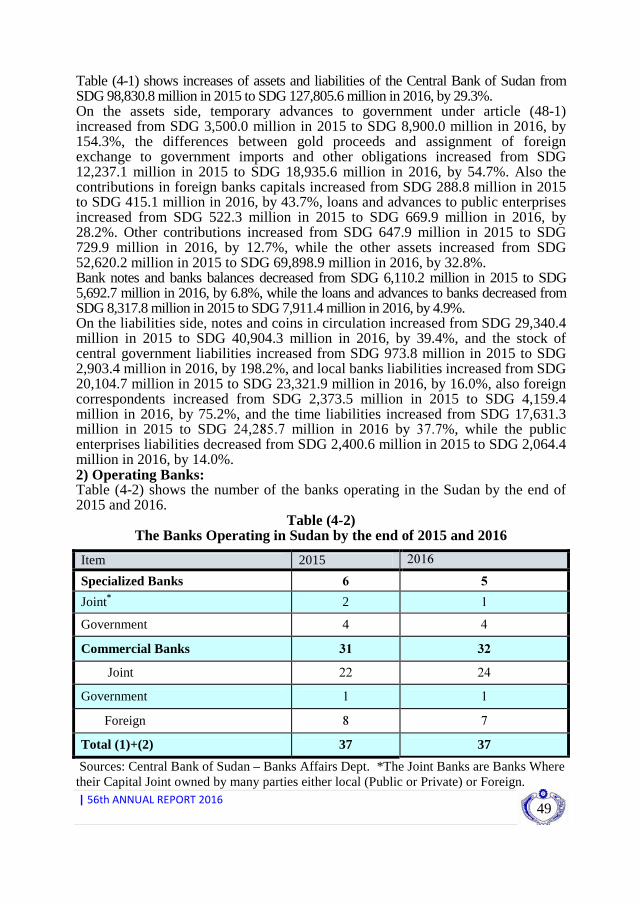
|56thANNUALREPORT2016
49
Table (4-1) shows increases of assets and liabilities of the Central Bank of Sudan from SDG 98,830.8 million in 2015 to SDG 127,805.6 million in 2016, by 29.3%. On the assets side, temporary advances to government under article (48-1) increased from SDG 3,500.0 million in 2015 to SDG 8,900.0 million in 2016, by 154.3%, the differences between gold proceeds and assignment of foreign exchange to government imports and other obligations increased from SDG 12,237.1 million in 2015 to SDG 18,935.6 million in 2016, by 54.7%. Also the contributions in foreign banks capitals increased from SDG 288.8 million in 2015 to SDG 415.1 million in 2016, by 43.7%, loans and advances to public enterprises increased from SDG 522.3 million in 2015 to SDG 669.9 million in 2016, by 28.2%. Other contributions increased from SDG 647.9 million in 2015 to SDG 729.9 million in 2016, by 12.7%, while the other assets increased from SDG 52,620.2 million in 2015 to SDG 69,898.9 million in 2016, by 32.8%. Bank notes and banks balances decreased from SDG 6,110.2 million in 2015 to SDG 5,692.7 million in 2016, by 6.8%, while the loans and advances to banks decreased from SDG 8,317.8 million in 2015 to SDG 7,911.4 million in 2016, by 4.9%. On the liabilities side, notes and coins in circulation increased from SDG 29,340.4 million in 2015 to SDG 40,904.3 million in 2016, by 39.4%, and the stock of central government liabilities increased from SDG 973.8 million in 2015 to SDG 2,903.4 million in 2016, by 198.2%, and local banks liabilities increased from SDG 20,104.7 million in 2015 to SDG 23,321.9 million in 2016, by 16.0%, also foreign correspondents increased from SDG 2,373.5 million in 2015 to SDG 4,159.4 million in 2016, by 75.2%, and the time liabilities increased from SDG 17,631.3 million in 2015 to SDG 24,285.7 million in 2016 by 37.7%, while the public enterprises liabilities decreased from SDG 2,400.6 million in 2015 to SDG 2,064.4 million in 2016, by 14.0%. 2) Operating Banks: Table (4-2) shows the number of the banks operating in the Sudan by the end of 2015 and 2016.
Table (4-2) The Banks Operating in Sudan by the end of 2015 and 2016
2016 2015 Item
5 6 Specialized Banks
1 2 Joint*
4 4 Government
32 31 Commercial Banks
24 22 Joint
1 1 Government
7 8 Foreign
37 37 Total (1)+(2)
Sources: Central Bank of Sudan – Banks Affairs Dept. *The Joint Banks are Banks Where their Capital Joint owned by many parties either local (Public or Private) or Foreign.
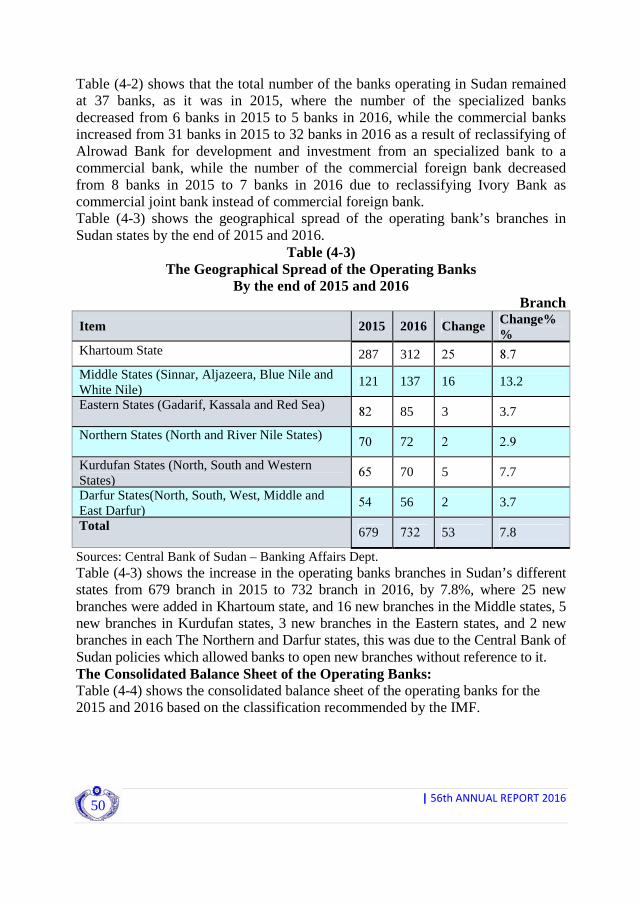
|56thANNUALREPORT2016
50
Table (4-2) shows that the total number of the banks operating in Sudan remained at 37 banks, as it was in 2015, where the number of the specialized banks decreased from 6 banks in 2015 to 5 banks in 2016, while the commercial banks increased from 31 banks in 2015 to 32 banks in 2016 as a result of reclassifying of Alrowad Bank for development and investment from an specialized bank to a commercial bank, while the number of the commercial foreign bank decreased from 8 banks in 2015 to 7 banks in 2016 due to reclassifying Ivory Bank as commercial joint bank instead of commercial foreign bank. Table (4-3) shows the geographical spread of the operating bank’s branches in Sudan states by the end of 2015 and 2016.
Table (4-3) The Geographical Spread of the Operating Banks
By the end of 2015 and 2016 Branch
Item 2015 2016 Change Change% %
Khartoum State 287 312 25 8.7
Middle States (Sinnar, Aljazeera, Blue Nile and White Nile)
121 137 16 13.2
Eastern States (Gadarif, Kassala and Red Sea) 82 85 3 3.7
Northern States (North and River Nile States) 70 72 2 2.9
Kurdufan States (North, South and Western States)
65 70 5 7.7
Darfur States(North, South, West, Middle and East Darfur)
54 56 2 3.7
Total 679 732 53 7.8
Sources: Central Bank of Sudan – Banking Affairs Dept. Table (4-3) shows the increase in the operating banks branches in Sudan’s different states from 679 branch in 2015 to 732 branch in 2016, by 7.8%, where 25 new branches were added in Khartoum state, and 16 new branches in the Middle states, 5 new branches in Kurdufan states, 3 new branches in the Eastern states, and 2 new branches in each The Northern and Darfur states, this was due to the Central Bank of Sudan policies which allowed banks to open new branches without reference to it. The Consolidated Balance Sheet of the Operating Banks: Table (4-4) shows the consolidated balance sheet of the operating banks for the 2015 and 2016 based on the classification recommended by the IMF.

|56thANNUALREPORT2016
51
Table (4-4) The Consolidated Balance Sheet of the Operating Banks
By the end of 2015 and 2016 (SDG Millions)
Particulars 31/12/2015 31/12/2016* Change Change
% Assets:
Local Currency 1,845.1 2,192.3 347.2 18.8
Balances with the Central Bank of Sudan 19,974.0 24,127.8 4,153.8 20.8
Other Banks 3,175.9 3,702.6 526.7 16.6
Foreign Correspondents 3,858.7 3,724.0 (134.7) (3.5)
Total Advances** 53,456.7 67,688.6 14,231.9 26.6
Other Accounts 26,627.2 31,278.2 4,651.0 17.5
Total Assets 108,937.6 132,713.5 23,775.9 21.8 Liabilities:
Deposits of Residents: 63,419.5 79,459.6 16,040.1 25.3 Public 58,883.0 73,409.7 14,526.7 24.7
Government*** 2,503.2 3,223.0 719.8 28.8
Public Enterprises 2,033.3 2,826.9 793.6 39.0
Banks: 7,955.3 6,788.9 (1,166.4) (14.7) Central Bank of Sudan 4,325.8 2,711.9 (1,613.9) (37.3)
Other Banks 1,692.0 1,909.4 217.4 12.8
Foreign correspondents 1,937.5 2,167.6 230.1 11.9
Capital and Reserves 16,254.4 18,423.7 2,169.3 13.3 Other Accounts 21,308.4 28,041.3 6,732.9 31.6
Total Liabilities 108,937.6 132,713.5 23,775.9 21.8
Source: Central Bank of Sudan – Statistics Department. * Preliminary Data. **Does not include the Central Govt. finance. *** Includes the Central Govt. and State and Local Govt.
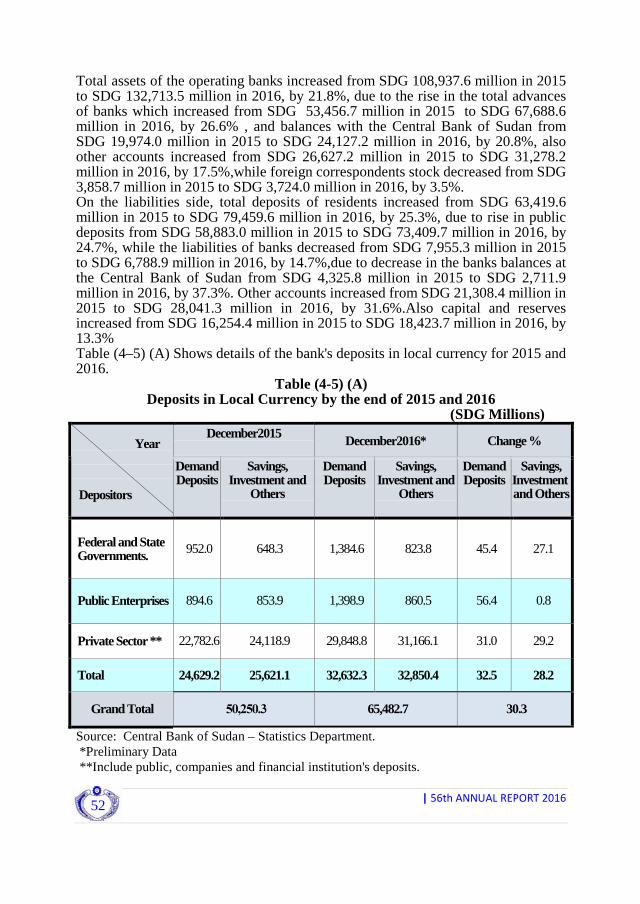
|56thANNUALREPORT2016
52
Total assets of the operating banks increased from SDG 108,937.6 million in 2015 to SDG 132,713.5 million in 2016, by 21.8%, due to the rise in the total advances of banks which increased from SDG 53,456.7 million in 2015 to SDG 67,688.6 million in 2016, by 26.6% , and balances with the Central Bank of Sudan from SDG 19,974.0 million in 2015 to SDG 24,127.2 million in 2016, by 20.8%, also other accounts increased from SDG 26,627.2 million in 2015 to SDG 31,278.2 million in 2016, by 17.5%,while foreign correspondents stock decreased from SDG 3,858.7 million in 2015 to SDG 3,724.0 million in 2016, by 3.5%. On the liabilities side, total deposits of residents increased from SDG 63,419.6 million in 2015 to SDG 79,459.6 million in 2016, by 25.3%, due to rise in public deposits from SDG 58,883.0 million in 2015 to SDG 73,409.7 million in 2016, by 24.7%, while the liabilities of banks decreased from SDG 7,955.3 million in 2015 to SDG 6,788.9 million in 2016, by 14.7%,due to decrease in the banks balances at the Central Bank of Sudan from SDG 4,325.8 million in 2015 to SDG 2,711.9 million in 2016, by 37.3%. Other accounts increased from SDG 21,308.4 million in 2015 to SDG 28,041.3 million in 2016, by 31.6%.Also capital and reserves increased from SDG 16,254.4 million in 2015 to SDG 18,423.7 million in 2016, by 13.3% Table (4–5) (A) Shows details of the bank's deposits in local currency for 2015 and 2016.
Table (4-5) (A) Deposits in Local Currency by the end of 2015 and 2016
(SDG Millions) December2015
December2016* Change % Year
Depositors
Demand Deposits
Savings, Investment and
Others
Demand Deposits
Savings, Investment and
Others
Demand Deposits
Savings, Investment and Others
Federal and State Governments. 952.0 648.3 1,384.6 823.8 45.4 27.1
Public Enterprises 894.6 853.9 1,398.9 860.5 56.4 0.8
Private Sector ** 22,782.6 24,118.9 29,848.8 31,166.1 31.0 29.2
Total 24,629.2 25,621.1 32,632.3 32,850.4 32.5 28.2
Grand Total 50,250.3 65,482.7 30.3
Source: Central Bank of Sudan – Statistics Department. *Preliminary Data **Include public, companies and financial institution's deposits.
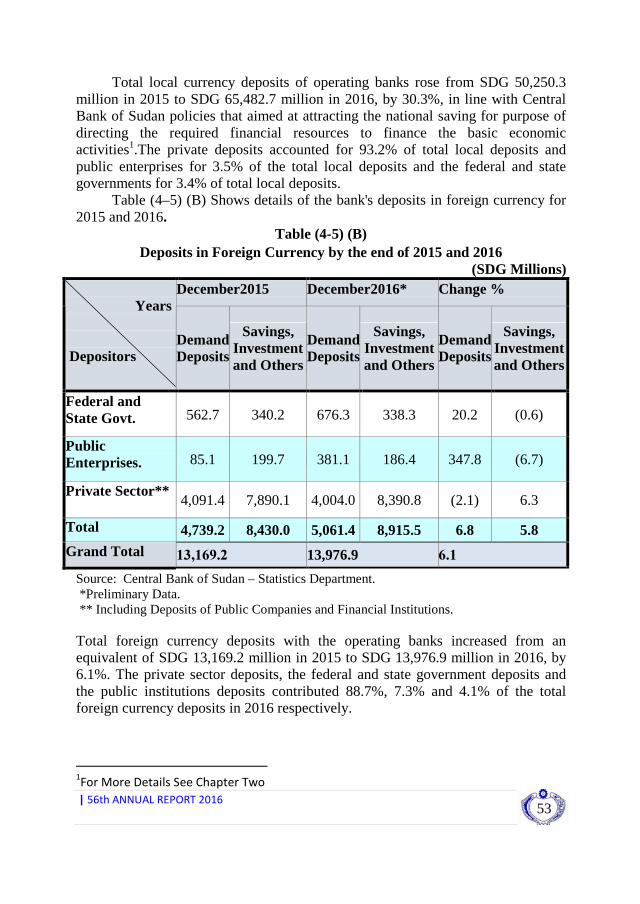
|56thANNUALREPORT2016
53
Total local currency deposits of operating banks rose from SDG 50,250.3 million in 2015 to SDG 65,482.7 million in 2016, by 30.3%, in line with Central Bank of Sudan policies that aimed at attracting the national saving for purpose of directing the required financial resources to finance the basic economic activities1.The private deposits accounted for 93.2% of total local deposits and public enterprises for 3.5% of the total local deposits and the federal and state governments for 3.4% of total local deposits.
Table (4–5) (B) Shows details of the bank's deposits in foreign currency for 2015 and 2016.
Table (4-5) (B)
Deposits in Foreign Currency by the end of 2015 and 2016 (SDG Millions)
December2015
December2016* Change % Years
Depositors
Demand Deposits
Savings, Investment and Others
Demand Deposits
Savings, Investment and Others
Demand Deposits
Savings, Investment and Others
Federal and State Govt. 562.7 340.2 676.3 338.3 20.2 (0.6)
Public Enterprises. 85.1 199.7 381.1 186.4 347.8 (6.7)
Private Sector** 4,091.4 7,890.1 4,004.0 8,390.8 (2.1) 6.3
Total 4,739.2 8,430.0 5,061.4 8,915.5 6.8 5.8
Grand Total 13,169.2 13,976.9 6.1
Source: Central Bank of Sudan – Statistics Department. *Preliminary Data. ** Including Deposits of Public Companies and Financial Institutions. Total foreign currency deposits with the operating banks increased from an equivalent of SDG 13,169.2 million in 2015 to SDG 13,976.9 million in 2016, by 6.1%. The private sector deposits, the federal and state government deposits and the public institutions deposits contributed 88.7%, 7.3% and 4.1% of the total foreign currency deposits in 2016 respectively.
1For More Details See Chapter Two

|56thANNUALREPORT2016
54
B- Bank Finance: Banking finance includes the finance extended by the operating banks to the
private sector, public enterprises and state and local governments in addition to the capital contribution in local and foreign currencies. Stock of Banking Finance:
Table (4-6) and figure (4-1) shows the total stock of banking finance in local currency according to economic activities by the end of 2015 and 2016.
Table (4-6) Stock of Bank Finance by Economic Activities in Local Currency
By the end of 2015 and 2016 (SDG Millions)
% Change
Contribution %
2016* Contribution
%
2015 Sector
40.8 18.4 11,830.3 16.8 8,401.1 Agriculture
17.0 12.6 8,059.1 13.8 6,890.9 Industry
11.3 2.4 1,539.0 2.8 1,383.1 Exports
33.3 6.9 4,439.5 6.7 3,329.8 Transport and Storage
50.0 13.5 8,698.7 11.6 5,799.6 Local Trade
134.1 3.8 2,417.2 2.1 1,032.7 Imports
12.1 15.9 10,194.0 18.2 9,091.8 Construction
92.0 0.9 591.7 0.6 308.1 Mining
19.2 25.6 16,428.0 27.6 13,782.5 Others **
28.3 100.0 64,197.5 100.0 50,019.6 Total of Finance
Source: Central Bank of Sudan – Statistics Department. *Preliminary Data ** Includes stock of finance provided by banks to the services, sector not included in the above mentioned sectors. Note: Does not include the financing of the Central Government.

|56thANNUALREPORT2016
55
Figure (4-1) The Stock of Banks Finance in Local Currency by Economic Activities
By the end of 2015 and 2016
0.0
2,000.0
4,000.0
6,000.0
8,000.0
10,000.0
12,000.0
14,000.0
16,000.0
18,000.0
A g r i c ul t u r e
I n d u s t r yE x p o r t s
T & S t o r a g e
L o c a l T r a d eI m p o r t s
Co n s t r uc t i o
nMi n i n g
O t h e r s ** *
SD
G M
ILLIO
N
2015 2016
Table (4-6) shows that total stock of banking finance in local currency increased from SDG 50,019.6 million in 2015 to SDG 64,197.5 million in 2016, by 28.3%. The stock of finance extended to the priority sectors (agriculture, industry, export and mining) represents 34.3%, of the total finance extended to the sectors, finance provided to construction represents15.9%, local trade finance represents 13.5% and the other sectors constitute 25.6% of the bank’s total financing by the end of 2016. Table (4-7) and figure (4-2) show the stock of bank finance in foreign currency by the end of 2015 and 2016.
Table (4-7) Stock of Bank Finance by Economic Activities
In Foreign Currency by the end of 2015 and 2016 (SDG Millions)
% Change
Contribution %
2016* Contribution
%
2015 Sector
(30.3) 3.4 119.7 5.0 171.8 Agriculture
15.4 25.3 883.7 22.3 766.1 Industry
- - - - Exports

|56thANNUALREPORT2016
56
Table (4-7) continued
% Change
Contribution %
2016* Contribution
%
2015 Sector
(26.3) 14.5 505.3 19.9 685.4 Transport and Storage
4.8 3.9 136.5 3.8 130.3 Local Trade
(34.4) 7.7 268.7 11.9 409.4 Imports
(7.9) 15.0 523.4 16.5 568.6 Construction
951.6 0.9 32.6 0.1 3.1 Mining
45.4 29.3 1,021.2 20.5 702.5 Others **
1.6 100.0 3,491.1 100.0 3,437.2 Total Finance Source: Central Bank of Sudan - Statistics Department. * Preliminary Data ** Includes stock of finance provided by banks to the services, sector and not Included in the above mentioned sectors. Note: Does not include financing to the Central Government.
Figure (4-2) The Stock of Banks Finance in Foreign Currency by Economic Activities
By the end of 2015 and 2016
0.0
200.0
400.0
600.0
800.0
1,000.0
1,200.0
SD
G M
ILLIO
N
2015 2016
Table (4-7) shows increase in the local currency equivalent of the stock of total banks finance in foreign currency from SDG 3,437.2 million in 2015 to SDG 3,491.1 million in 2016, by 1.6%.

|56thANNUALREPORT2016
57
Stock of finance extended to the priority sectors (agriculture, industry, export and mining) contributed 29.7%, of total finance in foreign currency extended to the sectors. Finance extended to transport and storage sector contributed 14.5%, while the finance extended to the construction sector contributed 15.0%, import sector contributed by 7.7%, and the other sectors contributed by 29.3%, of the total banks finance in foreign currency in 2016.
Flow of Banking Finance by Economic Activities: Table (4-8) and figure (4-3) show the flow of banking finance by economic activities in local currency during 2015 and 2016.
Table (4-8) The Flow of Banking Finance by Economic Activity in Local Currency
In 2015 and 2016 (SDG Millions)
2015 2016*
Sector Flow of Finance
Contribution%
Flow of Finance
Contribution%
Change%
Agriculture 11,089.4 20.5 18,893.6 22.7 70.4
Industry 7,899.3 14.6 9,570.9 11.5 21.2
Exports 2,230.5 4.1 1,629.1 2.0 (27.0)
Transport and Storage 2,508.5 4.6 3,455.7 4.1 37.8
Local Trade 9,928.5 18.3 16,627.3 19.9 67.5
Energy and Mining 401.2 0.7 941.6 1.1 134.7
Constructions 5,937.0 11.0 9,873.8 11.8 66.3
Imports 1,568.9 2.9 3,012.6 3.6 92.0
Others** 12,629.9 23.3 19,350.7 23.2 53.2
Total 54,193.2 100.0 83,355.3 100.0 53.8
Source: Central Bank of Sudan-Statistics Department. * Preliminary Data. ** Includes stock of finance provided by banks to the services, sector and not Included in the above mentioned Sectors. Note: Does not include financing of the Central Government.
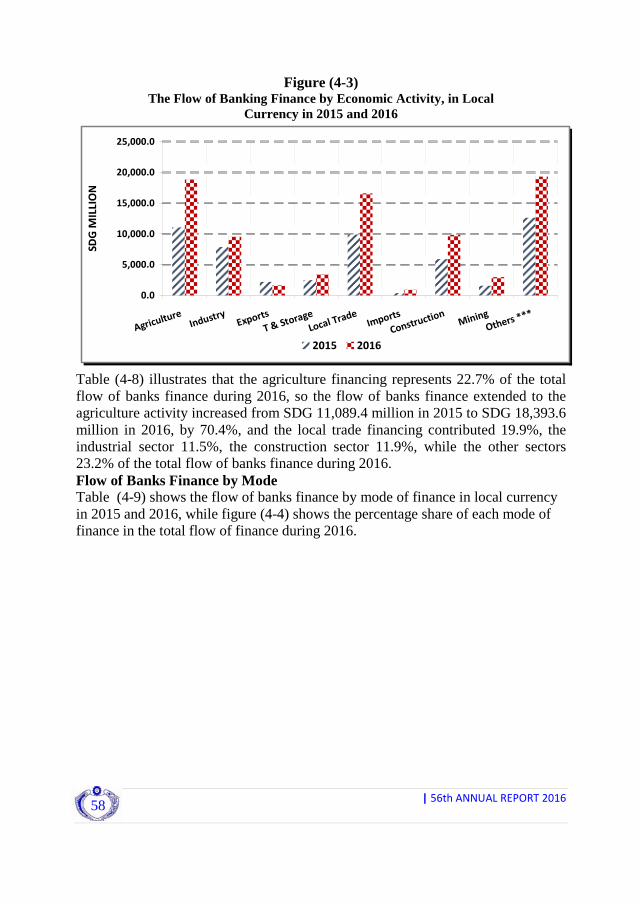
|56thANNUALREPORT2016
58
Figure (4-3) The Flow of Banking Finance by Economic Activity, in Local
Currency in 2015 and 2016
0.0
5,000.0
10,000.0
15,000.0
20,000.0
25,000.0
A g r ic u l t
u r eI n d u
s t r yE x p
o r t s
T & S t o r
a g e
L o c al T r a
d eI m p o r t
s
Co ns t r u
c t i on
Mi n i ng
O t he r s
* * *
SD
G M
ILLIO
N
2015 2016
Table (4-8) illustrates that the agriculture financing represents 22.7% of the total flow of banks finance during 2016, so the flow of banks finance extended to the agriculture activity increased from SDG 11,089.4 million in 2015 to SDG 18,393.6 million in 2016, by 70.4%, and the local trade financing contributed 19.9%, the industrial sector 11.5%, the construction sector 11.9%, while the other sectors 23.2% of the total flow of banks finance during 2016. Flow of Banks Finance by Mode Table (4-9) shows the flow of banks finance by mode of finance in local currency in 2015 and 2016, while figure (4-4) shows the percentage share of each mode of finance in the total flow of finance during 2016.

|56thANNUALREPORT2016
59
Table (4-9) Flow of Banks Finance by Mode of Finance
In Local Currency in 2015 and 2016 (SDG Millions)
Mode of Finance 2015 Contribution% 2016* Contribution
% Change%
Murabaha 26,968.5 49.8 38,518.7 46.2 42.8
Musharaka 3,822.8 7.1 5,594.0 6.7 46.3
Mudaraba 3,582.2 6.6 4,165.5 5.0 16.3
Salam 1,622.9 3.0 2,499.7 3.0 54.0
Mogawala 8,402.2 15.5 17,271.5 20.7 105.6
Ijarah 200.2 0.4 290.4 0.3 45.0
Istisnaa 47.2 0.1 52.3 0.1 10.7
Gard Hassan 120.9 0.2 240.8 0.3 99.2
Others 9,426.3 17.4 14,722.4 17.7 56.2
Total Finance 54,193.2 100.0 83,355.3 100.0 53.8
Source: Central Bank of Sudan - Statistics Dept. * Preliminary Data Note: Does not include the financing of the Central Government.

|56thANNUALREPORT2016
60
Figure (4-4) The Flow of Banks Finance by Mode of Finance
In Local Currency in 2016
Murabaha
46.2%
Mogawala
20.7%
Others
17.7%
Musharaka
6.7%
Mudaraba
5.0%
Salam
3.0%
Ijarah
0.3%
Gard
Hassan
0.3%
Istisnaa
0.1%
Table (4-9) and the figure (4-4) depict that the share of Murabaha amounted to 46.2% of the total flow of finance during 2016, compared to 49.8% during 2015, in line with the Central Bank of Sudan policies that aimed at encouraging the banks to finance through the other modes instead of Murabaha, also the flow of banks finance by Mugawla contributed 20.7%, and Musharaka contributed 6.7%, while other modes contributed 17.7% during 2016. C-Microfinance and Social Dimension Finance - Microfinance in Commercial Banks The Central Bank of Sudan continued its efforts in implementing its policies which target employing at least 12% of the total finance portfolio of each bank to the microfinance, through the direct finance from the banks to the individuals and groups, or through wholesale funding from the banks to the licensed microfinance institutions. Table (4-10) shows the volume of microfinance extended by banks by the end of 2015 and 2016.
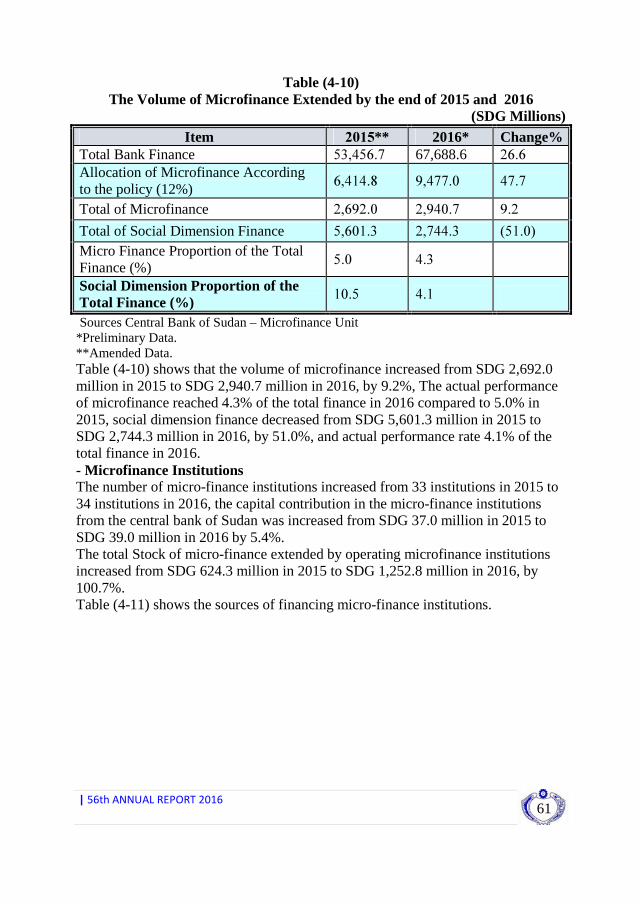
|56thANNUALREPORT2016
61
Table (4-10) The Volume of Microfinance Extended by the end of 2015 and 2016
(SDG Millions) Change% 2016* 2015** Item 26.6 67,688.6 53,456.7 Total Bank Finance
47.7 9,477.0 6,414.8 Allocation of Microfinance According to the policy (12%)
9.2 2,940.7 2,692.0 Total of Microfinance
)51.0( 2,744.3 5,601.3 Total of Social Dimension Finance
4.3 5.0 Micro Finance Proportion of the Total Finance (%)
4.1 10.5 Social Dimension Proportion of the Total Finance (%) Sources Central Bank of Sudan – Microfinance Unit *Preliminary Data. **Amended Data. Table (4-10) shows that the volume of microfinance increased from SDG 2,692.0 million in 2015 to SDG 2,940.7 million in 2016, by 9.2%, The actual performance of microfinance reached 4.3% of the total finance in 2016 compared to 5.0% in 2015, social dimension finance decreased from SDG 5,601.3 million in 2015 to SDG 2,744.3 million in 2016, by 51.0%, and actual performance rate 4.1% of the total finance in 2016. - Microfinance Institutions The number of micro-finance institutions increased from 33 institutions in 2015 to 34 institutions in 2016, the capital contribution in the micro-finance institutions from the central bank of Sudan was increased from SDG 37.0 million in 2015 to SDG 39.0 million in 2016 by 5.4%. The total Stock of micro-finance extended by operating microfinance institutions increased from SDG 624.3 million in 2015 to SDG 1,252.8 million in 2016, by 100.7%. Table (4-11) shows the sources of financing micro-finance institutions.

|56thANNUALREPORT2016
62
Table (4-11) The Sources of Financing Micro-finance Institutions
By the end of 2015 and 2016 (SDG Millions)
Change %
Contribution % 2016* Contribution
% 2015 Source
(0.9) 21.3 217.0 39.9 219.0 Central Bank of Sudan
64.4 19.5 198.9 22.0 121.0 Arab Development Fund
252.1 32.5 331.3 17.1 94.1 Auto Sources 112.7 11.2 114.2 9.8 53.7 Commercial Banks
225.1 13.1 133.3 7.5 41.0
Partnership with Islamic Development Bank - Jeddah
26.9 2.4 25.0 3.6 19.7 Sudanese Company for Developing Micro-finance
)100( 0.0 0.0 0.1 0.6 Others 85.7 100.0 1,019.7 100.0 549.1 Total
Sources Central Bank of Sudan – Microfinance Unit. *Preliminary Data.
- The most Important Efforts in the Area of Microfinance The microfinance coordinating council was formed, including microfinance unit, Sudanese Company for Microfinance Development and Microfinance Guarantee Agency (TAISEER) as a coordinating and supervisory body. The council reviewed the performance of the implemented strategic plan for development, improvement of the microfinance sector and issuing regulations that organize the performance of microfinance institutions for 2016. This regulation allowed the institutions to accept deposits in the countryside so as to achieve the goals of the financial inclusion. Microfinance has also been linked with production through the program of financing the agricultural season using technologies, in cooperation and coordination with the Ministry of Agriculture and Forest, Also microfinance efforts include the followings: • The Partnership Between the Central Bank of Sudan and the Islamic
Development Bank (IDB –Jeddah) Within the context of implementing this project five business training centers were established in Sudan University of Science and technology for training 3,300 beneficiaries in the areas of animal production, software, leather production,

|56thANNUALREPORT2016
63
furniture and garments manufacturing. These projects were linked with microfinance institutions services, and financing 10 microfinance institutions targeting 64,000 beneficiaries. in addition to implementing the Capacity Building Program for micro and small Projects in five states. • Arab Fund for Economic and Social Development Loan Arab Fund for Economic and Social Development extended its a 50.0 million loan;
the first installment (US $ 25.0 million) in May 2015 was used in financing 15 microfinance institutions and the second installment (US $ 12.5 million) in August 2016 was used in financing 6 microfinance institutions and the graduates’ consortium. • Graduates Projects Financing Consortium The graduates consortium in its third edition was formed with a capital amounting to SDG 69.5 million from the Central Bank of Sudan and 21 commercial banks, the Farmer Commercial Bank and Saving Bank were selected as pioneers for the portfolio, the graduate projects financed in the second phase amounted to SDG 73.3 million for 4,656 beneficiaries, with a repayment rate of 95%. • Women Projects Financing Consortium The extended total finance increased from SDG 5.8 million in 2015 to SDG 6.5 million in 2016, by 12.1% where Central Bank of Sudan allocated SDG 6.0 million to finance rural women, projects targeting 373 women in the context of the partnership with the Ministry of Welfare and Social Security through restricted Mudaraba with the Savings and Social Development Bank in the States including (Sennar, Kassala, Northern Kordofan, North and Khartoum). • The Partnership between Zakat Chamber and the Banking System (AL
Amman Consortium) With a capital of the consortium amounted to SDG125.4 million, with the participation of Zakat Chamber and the banks deducted from the portion of 12% assigned in the CBOS policies for the microfinance. The total finance extended by the consortium decreased from SDG 173.6 million in 2015 to SDG 168.0 million in 2016, by 3.2%, also the number of the beneficiaries decreased from 92.207 in 2015 to 81.825 in 2016, by 11.3% distributed over 14 states. • The Agricultural Bank Microfinance Initiative (Abasemi) The initiative was formed by the participation of CBOS, the Agricultural Bank of Sudan (ABS) and the International Fund for Agricultural Development (IFAD). The first phase was implemented in 2011 in three localities in North Kordofan state and then moved on to the rest of the states of Sudan to cover 1 million families in 10 States.The amount of funding granted to Abasemi projects in the Agricultural Bank amounted to SDG 118.2 million, for 23,033 beneficiaries with a recovery rate of 95%. The expansion phase was implemented with US$ 2.5 million targeting 90,000 beneficiary.

|56thANNUALREPORT2016
64
• The technical and Institutional Support to the Banks and Microfinance Institutions
The Central Bank of Sudan continued in the activities of spreading the microfinance culture through providing technical support by organizing a number of forums and workshops, as well as participating in various internal and external training programs including the follow up of the performance of microfinance institutions and financial inclusion, in addition to that, the micro finance unit participated in the conference for the States, Finance Ministers and in the third micro finance forum D-The Financial Soundness indicators and the Consolidated Balance Sheet of Operating Banks: Central Bank of Sudan policies emphasized the importance of maintaining the soundness of the banking sector, therefore, a number of policies and supervisory regulations were adopted targeting at achieving financial stability and bank soundness to ensure the efficiency of the banking system by reducing credit risk through enhancing banking supervision, regulation measures, to comply with the international systems and standards. - The Indicators of Banking Soundness: Table (4-12) and figure (4-5) explain the most important financial soundness indicators of banks by the end of 2015 and 2016.
Table (4-12) Indicators of Banking Soundness by the end of
2015 and 2016. (%)
International Standard 2016* 2015 Item
12 18.7 20.2 Capital Adequacy Ratio
6 5.2 5.1 Total Non-Performing Loans to Total Funding
60.0 65.0 Financing Provision to Non-Performing Loans**
4.7 4.0 Return on Assets (Before Tax)
46.1 37.1 Return on Equity (before Tax)
30 -40 35.1 37.4 Liquid Assets to Total Assets
Sources: Central Bank of Sudan-Prudential Supervision Department. *Preliminary Data. **Amended Data.

|56thANNUALREPORT2016
65
Figure (4-5) Indicators of Banking Soundness by the end of
2015 and 2016
20.2
5.1 4.0
37.1 37.4
18.7
5.2 4.7
46.1
35.1
0.010.020.030.040.050.0
%
2015
2016
Table (4-12) and figure (4-5) explain the most important financial soundness indicators of banks issued by the Islamic Financial Services Board in the context of the requirements of the Basel Committee represented in capital adequacy, and indicators of assets quality, profitability, liquidity and the ability to meet the obligations. Capital adequacy ratio decreased from 20.2% in 2015 to 18.7% in 2016, compared to the Central Bank of Sudan targeted ratio of 12.0%. It has been known that the capital adequacy ratio reflects the ability of regulatory capital1 to cope with banking risks (finance, market and operation risk). The ratio of total non-performing loans to total financing, which measured the asset quality increased from 5.1% in 2015 to 5.2% in 2016, while the ratio of financing provisions to non-performing loans decreased from 65.0% in 2015 to 60.0% in 2016. The return on assets ratio (asset turnover) increased from 4.0% in 2015 to 4.7% in 2016, while the return on equity increased from 37.1% in 2015 to 46.1% in 2016, whereas the ratio of liquid assets to total assets decreased from 37.4% in 2015 to 35.1% in 2016. - The Indicators of the Consolidated Balance Sheet of Operating Banks: Table (4-13) and figure (4-6) show the indicators of the consolidated balance sheet of banks in 2015 and 2016.
1 )Regulatory Capital is the paid-up share capital plus reserve capital less capital reductions
in accordance with the decisions of the Basel Committee and the Islamic Financial Services Board.

|56thANNUALREPORT2016
66
Table (4-13) The Indicators of the Consolidated Balance Sheet of Operating Banks
By the end of 2015 and 2016 (%)
Indicator 2015 2016*
Total Deposits to Total Liabilities 58.2 59.9
Capital and Reserves to Total Liabilities 14.9 13.9
Total Finance to Total Assets 49.1 51.0
Total Finance to Total Deposits 84.3 85.2
Source: Central Bank of Sudan- Statistics Dept. *Preliminary Data
Figure (4-6) The Indicators of the Consolidated Balance Sheet of Operating
Banks by the end of 2015 and 2016
58.2
14.9
49.1
84.3
59.9
13.9
51
85.2
0.0
50.0
100.0
%
2015
2016
Table (4-13) and figure (4-6) show an increase in the ratio of total deposits to total liabilities (which measures the range of bank reliance on depositors money) from 58.2% in 2015 to 59.9% in 2016, while the ratio of capital and reserves to total liabilities (which measures the bank reliance on its own resources) decreased from 14.9% in 2015 to 13.9% in 2016, indicating an increasing the banking risks, while the ratio of total finance to total assets increased from 49.1% in 2015 to 51.0% in 2016, reflecting increase in banks efforts in using their assets to generate profit, also the ratio of total bank finance to total deposits increased from 84.3% in 2015 to 85.2% in 2016, reflecting a decrease in liquidity ratio of the banks.
3- Credit and Information Scoring Agency (CIASA) The Agency continued in its activities during 2016 in the field of providing credit and information scoring on clients for banks, financial institutions and microfinance institutions, and it continued to spread the culture of credit query and expand the utilization of credit query and classification of data. Also the Agency
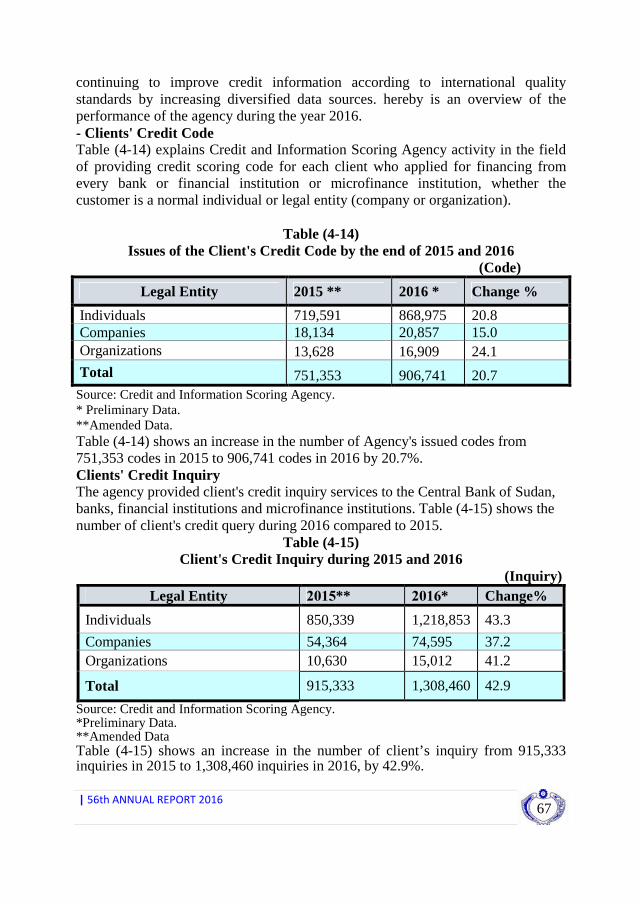
|56thANNUALREPORT2016
67
continuing to improve credit information according to international quality standards by increasing diversified data sources. hereby is an overview of the performance of the agency during the year 2016. - Clients' Credit Code Table (4-14) explains Credit and Information Scoring Agency activity in the field of providing credit scoring code for each client who applied for financing from every bank or financial institution or microfinance institution, whether the customer is a normal individual or legal entity (company or organization).
Table (4-14) Issues of the Client's Credit Code by the end of 2015 and 2016
(Code)
Change % 2016 * 2015 ** Legal Entity
20.8 868,975 719,591 Individuals 15.0 20,857 18,134 Companies 24.1 16,909 13,628 Organizations
20.7 906,741 751,353 Total
Source: Credit and Information Scoring Agency. * Preliminary Data. **Amended Data. Table (4-14) shows an increase in the number of Agency's issued codes from 751,353 codes in 2015 to 906,741 codes in 2016 by 20.7%. Clients' Credit Inquiry The agency provided client's credit inquiry services to the Central Bank of Sudan, banks, financial institutions and microfinance institutions. Table (4-15) shows the number of client's credit query during 2016 compared to 2015.
Table (4-15) Client's Credit Inquiry during 2015 and 2016
(Inquiry) Change% 2016* 2015** Legal Entity
43.3 1,218,853 850,339 Individuals
37.2 74,595 54,364 Companies 41.2 15,012 10,630 Organizations
42.9 1,308,460 915,333 Total
Source: Credit and Information Scoring Agency. *Preliminary Data. **Amended Data Table (4-15) shows an increase in the number of client’s inquiry from 915,333 inquiries in 2015 to 1,308,460 inquiries in 2016, by 42.9%.

|56thANNUALREPORT2016
68
4- Electronic Banking Services Company Ltd (EBS) The company has a significant contribution to the advancement of banking technology in Sudan, through developing the electronic payment system represented in SWIFT and electronic clearing services which connect the banks with the Central Bank of Sudan, in addition to electronic payment which facilitated payments by introducing the banking card which helped in attracting currency into the banking system. Table (4-16) indicates the electronic payment methods during 2015 and 2016.
Table (4-16) Electronic Payment Methods during 2015 and 2016
(Number)
Change% 2016* 2015** Year
13.6 1,189 1,047 ATMs Machines
23.6 1,380,579 1,116,648 Bank Cards
20.6 3,480 2,885 Sale points
(32.7) 1,495,001 2,221,615 Electronic Wallet Cards
Source: Central Bank of Sudan - Payment Systems Department and Electronic Banking Services Company (EBS). * Preliminary Data. **Amended data. Table (4-16) shows an increase in the ATMs machines from 1,047 in 2015 to 1,189 in 2016 by 13.6%, bank's cards from 1,116,648 cards in 2015 to 1,380,579 cards in 2016, by 23.6%.and sale points from 2,885 points in 2015 to 3,480 points in 2016, by 20.6%, the number of electronic wallet cards decreased from 2,221,615 in 2015 to 1,495,001 in 2016, by 32.7%.
Table (4-17) Electronic Banking Dealings
during 2015 and 2016 (Number)
External Electronic Payments (SWIFT) Transactions with Banking
Card Incoming Messages
Outgoing Messages
Year
22,564,336 191,582 91,710 **2015
25,860,051 164,341 75,018 *2016
14.6 )14.2( )18.2( change% Source: Electronic Banking Services Company (EBS). *Preliminary Data. **Amended Data.
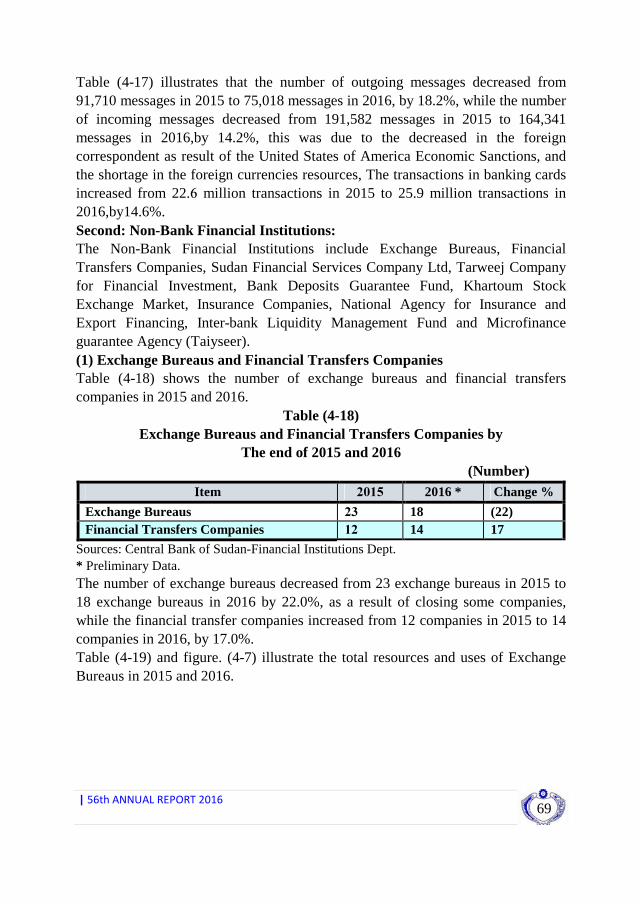
|56thANNUALREPORT2016
69
Table (4-17) illustrates that the number of outgoing messages decreased from 91,710 messages in 2015 to 75,018 messages in 2016, by 18.2%, while the number of incoming messages decreased from 191,582 messages in 2015 to 164,341 messages in 2016,by 14.2%, this was due to the decreased in the foreign correspondent as result of the United States of America Economic Sanctions, and the shortage in the foreign currencies resources, The transactions in banking cards increased from 22.6 million transactions in 2015 to 25.9 million transactions in 2016,by14.6%. Second: Non-Bank Financial Institutions: The Non-Bank Financial Institutions include Exchange Bureaus, Financial Transfers Companies, Sudan Financial Services Company Ltd, Tarweej Company for Financial Investment, Bank Deposits Guarantee Fund, Khartoum Stock Exchange Market, Insurance Companies, National Agency for Insurance and Export Financing, Inter-bank Liquidity Management Fund and Microfinance guarantee Agency (Taiyseer). (1) Exchange Bureaus and Financial Transfers Companies Table (4-18) shows the number of exchange bureaus and financial transfers companies in 2015 and 2016.
Table (4-18) Exchange Bureaus and Financial Transfers Companies by
The end of 2015 and 2016 (Number)
Change % 2016 * 2015 Item
(22) 18 23 Exchange Bureaus 17 14 12 Financial Transfers Companies
Sources: Central Bank of Sudan-Financial Institutions Dept. * Preliminary Data. The number of exchange bureaus decreased from 23 exchange bureaus in 2015 to 18 exchange bureaus in 2016 by 22.0%, as a result of closing some companies, while the financial transfer companies increased from 12 companies in 2015 to 14 companies in 2016, by 17.0%. Table (4-19) and figure. (4-7) illustrate the total resources and uses of Exchange Bureaus in 2015 and 2016.
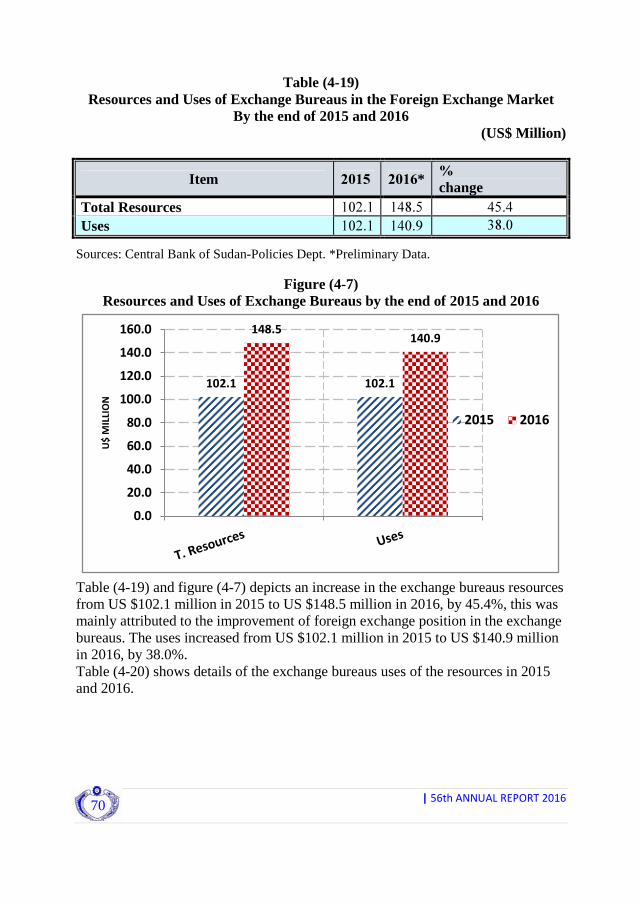
|56thANNUALREPORT2016
70
Table (4-19) Resources and Uses of Exchange Bureaus in the Foreign Exchange Market
By the end of 2015 and 2016 (US$ Million)
% change 2016* 2015 Item
45.4 148.5 102.1 Total Resources 38.0 140.9 102.1 Uses
Sources: Central Bank of Sudan-Policies Dept. *Preliminary Data.
Figure (4-7) Resources and Uses of Exchange Bureaus by the end of 2015 and 2016
102.1 102.1
148.5140.9
0.0
20.0
40.0
60.0
80.0
100.0
120.0
140.0
160.0
U$
MIL
LIO
N
2015 2016
Table (4-19) and figure (4-7) depicts an increase in the exchange bureaus resources from US $102.1 million in 2015 to US $148.5 million in 2016, by 45.4%, this was mainly attributed to the improvement of foreign exchange position in the exchange bureaus. The uses increased from US $102.1 million in 2015 to US $140.9 million in 2016, by 38.0%. Table (4-20) shows details of the exchange bureaus uses of the resources in 2015 and 2016.
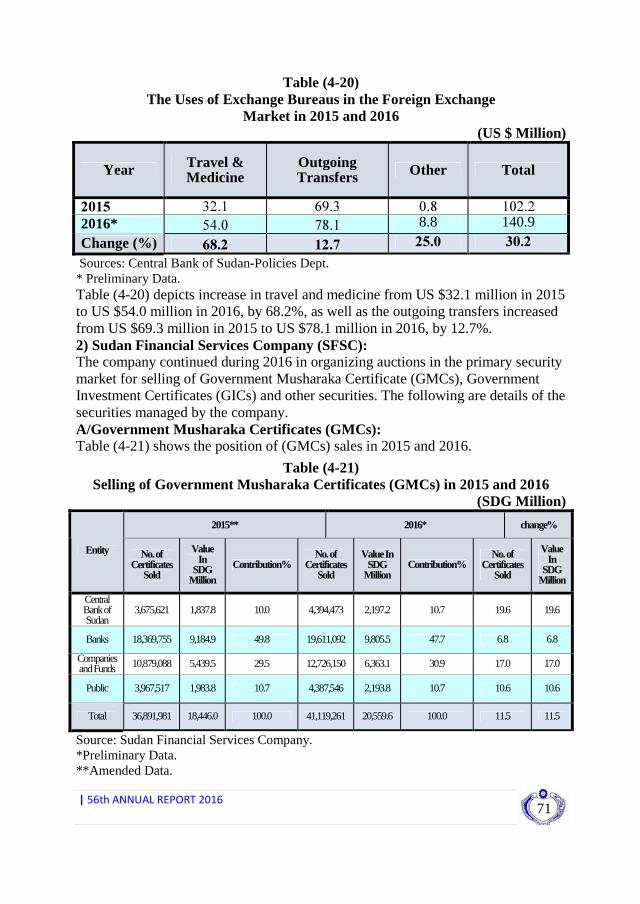
|56thANNUALREPORT2016
71
Table (4-20) The Uses of Exchange Bureaus in the Foreign Exchange
Market in 2015 and 2016 (US $ Million)
Total Other Outgoing Transfers
Travel & Medicine Year
102.2 0.8 69.3 32.1 2015 140.9 8.8 78.1 54.0 2016* 30.2 25.0 12.7 68.2 Change (%)
Sources: Central Bank of Sudan-Policies Dept. * Preliminary Data. Table (4-20) depicts increase in travel and medicine from US $32.1 million in 2015 to US $54.0 million in 2016, by 68.2%, as well as the outgoing transfers increased from US $69.3 million in 2015 to US $78.1 million in 2016, by 12.7%. 2) Sudan Financial Services Company (SFSC): The company continued during 2016 in organizing auctions in the primary security market for selling of Government Musharaka Certificate (GMCs), Government Investment Certificates (GICs) and other securities. The following are details of the securities managed by the company. A/Government Musharaka Certificates (GMCs): Table (4-21) shows the position of (GMCs) sales in 2015 and 2016.
Table (4-21) Selling of Government Musharaka Certificates (GMCs) in 2015 and 2016
(SDG Million)
2015** 2016* change%
Entity No. of Certificates
Sold
Value In
SDG Million
Contribution% No. of
Certificates Sold
Value In SDG
Million Contribution%
No. of Certificates
Sold
Value In
SDG Million
Central Bank of Sudan
3,675,621 1,837.8 10.0 4,394,473 2,197.2 10.7 19.6 19.6
Banks 18,369,755 9,184.9 49.8 19,611,092 9,805.5 47.7 6.8 6.8
Companies and Funds 10,879,088 5,439.5 29.5 12,726,150 6,363.1 30.9 17.0 17.0
Public 3,967,517 1,983.8 10.7 4,387,546 2,193.8 10.7 10.6 10.6
Total 36,891,981 18,446.0 100.0 41,119,261 20,559.6 100.0 11.5 11.5
Source: Sudan Financial Services Company. *Preliminary Data. **Amended Data.
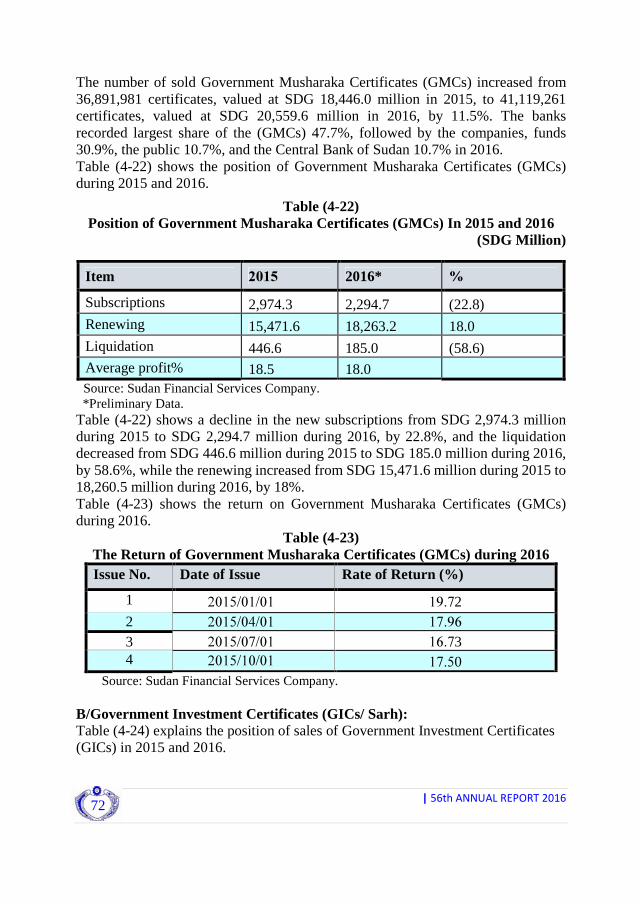
|56thANNUALREPORT2016
72
The number of sold Government Musharaka Certificates (GMCs) increased from 36,891,981 certificates, valued at SDG 18,446.0 million in 2015, to 41,119,261 certificates, valued at SDG 20,559.6 million in 2016, by 11.5%. The banks recorded largest share of the (GMCs) 47.7%, followed by the companies, funds 30.9%, the public 10.7%, and the Central Bank of Sudan 10.7% in 2016. Table (4-22) shows the position of Government Musharaka Certificates (GMCs) during 2015 and 2016.
Table (4-22) Position of Government Musharaka Certificates (GMCs) In 2015 and 2016
(SDG Million)
Item 2015 2016* %
Subscriptions 2,974.3 2,294.7 (22.8) Renewing 15,471.6 18,263.2 18.0 Liquidation 446.6 185.0 (58.6) Average profit% 18.5 18.0
Source: Sudan Financial Services Company. *Preliminary Data. Table (4-22) shows a decline in the new subscriptions from SDG 2,974.3 million during 2015 to SDG 2,294.7 million during 2016, by 22.8%, and the liquidation decreased from SDG 446.6 million during 2015 to SDG 185.0 million during 2016, by 58.6%, while the renewing increased from SDG 15,471.6 million during 2015 to 18,260.5 million during 2016, by 18%. Table (4-23) shows the return on Government Musharaka Certificates (GMCs) during 2016.
Table (4-23) The Return of Government Musharaka Certificates (GMCs) during 2016 Issue No. Date of Issue Rate of Return (%)
1 01/01/2015 19.72 2 01/04/2015 17.96 3 01/07/2015 16.73 4 01/10/2015 17.50
Source: Sudan Financial Services Company. B/Government Investment Certificates (GICs/ Sarh): Table (4-24) explains the position of sales of Government Investment Certificates (GICs) in 2015 and 2016.
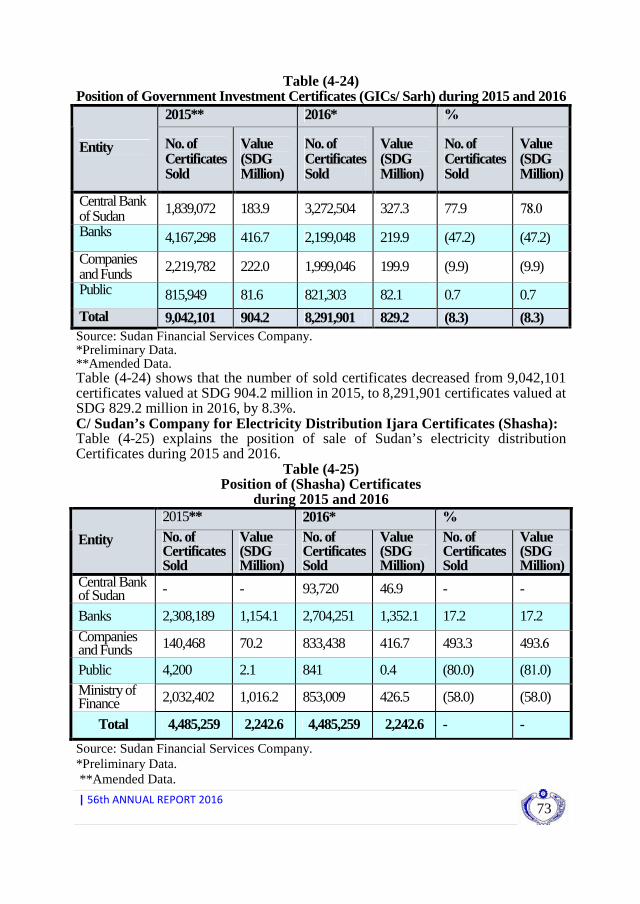
|56thANNUALREPORT2016
73
Table (4-24) Position of Government Investment Certificates (GICs/ Sarh) during 2015 and 2016
2015** 2016* %
Entity No. of Certificates Sold
Value (SDG Million)
No. of Certificates Sold
Value (SDG Million)
No. of Certificates Sold
Value (SDG Million)
Central Bank of Sudan 1,839,072 183.9 3,272,504 327.3 77.9 78.0
Banks 4,167,298 416.7 2,199,048 219.9 (47.2) (47.2)
Companies and Funds 2,219,782 222.0 1,999,046 199.9 (9.9) (9.9)
Public 815,949 81.6 821,303 82.1 0.7 0.7
Total 9,042,101 904.2 8,291,901 829.2 (8.3) (8.3) Source: Sudan Financial Services Company. *Preliminary Data. **Amended Data. Table (4-24) shows that the number of sold certificates decreased from 9,042,101 certificates valued at SDG 904.2 million in 2015, to 8,291,901 certificates valued at SDG 829.2 million in 2016, by 8.3%. C/ Sudan’s Company for Electricity Distribution Ijara Certificates (Shasha): Table (4-25) explains the position of sale of Sudan’s electricity distribution Certificates during 2015 and 2016.
Table (4-25) Position of (Shasha) Certificates
during 2015 and 2016 2015** 2016* %
Entity No. of Certificates Sold
Value (SDG Million)
No. of Certificates Sold
Value (SDG Million)
No. of Certificates Sold
Value (SDG Million)
Central Bank of Sudan - - 93,720 46.9 - -
Banks 2,308,189 1,154.1 2,704,251 1,352.1 17.2 17.2
Companies and Funds 140,468 70.2 833,438 416.7 493.3 493.6
Public 4,200 2.1 841 0.4 (80.0) (81.0) Ministry of Finance 2,032,402 1,016.2 853,009 426.5 (58.0) (58.0)
Total 4,485,259 2,242.6 4,485,259 2,242.6 - -
Source: Sudan Financial Services Company. *Preliminary Data. **Amended Data.

|56thANNUALREPORT2016
74
Table (4-25) shows that the share of Companies and Funds increased from 140,468 certificates in 2015, to 833,438 certificates in 2016, by 493.3%, while the share of Ministry of Finance decreased from 2,032,402 certificates in 2015, to 853,009 certificates in 2016, by 58.0%. It is worth mentioning that the certificates of the Central Bank (Shehab) Ijarah and the certificates of the Sudanese Electricity Transmission Company (Noor) were liquidated. 3) Tarweej Company for Financial Investment: The company aims at executing immediate settlement to all transactions for the purchase and sale of securities for clients, and work as an agent for the Central Bank of Sudan in the secondary market to contribute in achieving the monetary policy objectives through open market operations, beside promoting and marketing of all securities, and the products of the Sudan Financial Services Company in the primary and secondary markets. Table (4 -26) explains the activities of Tarweej Company in 2015 and 2016.
Table (4- 26) Activity of Tarweej Company in
2015 and 2016 (SDG Million)
Market 2015 2016* Change %
Secondary market 1,298.0 904.6 (30.3)
Primary market 71.6 32.8 (54.2)
Total 1,369.6 937.4 (31.6) Source: Tarweej Financial Service Company. *Preliminary Data. Table (4-26) explains a decrease in the volume of the activity in the secondary market from SDG 1,298.0 million in 2015 to SDG 904.6 million in 2016, by 30.3%, also, the volume of the company’s activity in the primary market decreased from SDG 71.6 million in 2015 to SDG 32.8 million in 2016 by 54.2% due to decline in the demand. 4) Deposits Guarantee Fund: Bank deposit security fund was established according to its 1996 Act, with a share of capital by Ministry of Finance and the Central Bank of Sudan and Banks. The Fund aims at providing Islamic insurance for bank deposits. Table (4-27) shows the volume of contributions in the Fund's resources in 2015 and 2016.

|56thANNUALREPORT2016
75
Table (4-27) The Contributions in the Resources of the Bank Deposits Guarantee Fund in
2015 and 2016 (SDG Millions)
Contributors
2015**
contribution %
2016*
contribution %
Change %
Banks 59 47.2 70 47.0 18.6 Ministry of Finance 9 7.2 10 6.7 11.1 Central Bank of Sudan 9 7.2 10 6.7 11.1
Holders of investment deposits
48 38.4 59 39.6 22.9
Total 125 100.0 149 100.0 19.2
Source: Bank Deposits Guarantee Fund. *Preliminary Data. ** Amended Data.
Table (4-27) shows an increase in the volume of owner of Deposits Guarantee Fund resources from SDG 125 million in 2015 to SDG 149 million in 2016, by 19.2%, moreover the percentage contribution of holders of investment deposits, which were paid by banks on behalf of the owners of the investment deposits increased from 38.4% in 2015 to 39.6% in 2016 by 22.9%.
5) Khartoum Stock Exchange: The Khartoum Stock Exchange Law was passed in 2016, abolishing the 1994 law. The law included eight chapters, the most important of which is the issue of converting part of the community’s savings into useful investments that help to complete the capital financing process, which is considered as one of the most important factors of production, besides creating new securities markets. In addition to allowing specialized expert houses to provide financial advice to those interested in dealing in securities. it also regulates the status of the market under the supervision of the regulator of the capital markets (the supervisory authority that has been separated from the executive authority) and allowed the market’s council the right to take the necessary measures to protect the interests of shareholders or dealers in the market if there is any threat. The objectives of the Khartoum stock market includes, regulation and supervision of financial markets, facilitating buying and selling, beside ensuring equal opportunities for dealers in securities and protecting the small investors. Table (4-28) and figure (4-8) show the general index of the Khartoum Stock Exchange Market during the period (2012-2016).

|56thANNUALREPORT2016
76
Table(4-28) The General Index of the Khartoum Stock Exchange
during (2013-2016)
(Point)
Item 2013 2014 2015 2016*
The general index of the Khartoum stock exchange
3,178.1 3,161.6 2,858.5 3,118.9
(%) change 15.6 ) 0.5( )9.6( 9.1
Source: Khartoum Stock Exchange. *Preliminary Data.
Figure (4-8)
The General Index of Khartoum Stock Exchange during (2013–2016)
3178.1 3161.6
2858.5
3118.9
2600
2700
2800
2900
3000
3100
3200
3300
2013 2014 2015 2016
Points
Table (4-28) and figure (4-8) show that the general index of Khartoum Stock Exchange Market increased from 2,858.5 points in 2015 to 3,118.5 points in 2016, by 9.1%. Table (4-29) shows the volume of trading in Khartoum Stock Exchange Market in 2015 and 2016.

|56thANNUALREPORT2016
77
Table (4-29) Volume of Shares Traded in Khartoum Stock Exchange
In 2015 and 2016 (SDG Million)
2015 2016* Sector
No. of Shares Traded (in thousand)
Volume of Trading
Executed Contracts
Contribution (%)
No. of * Shares Traded (in thousand)
Volume of Trading
Executed Contracts
Contribution (%)
Banks & Invt.
230,834 104 545 19.2 199,515 212.7 804 12.0
Insurance 1,664 1 12 0.1 892,419 2.0 21 53.5 Commerce 234,003 2 28 19.5 311,787 5.7 88 18.7 Industry 16,918 6 7 1.4 82,365 21.0 9 4.9 Agricultural 0.45 0.0 1 0.0 9,389 25.0 6 0.6 Telecom. 16,210 34.6 161 1.3 11,487 19.6 153 0.7
Financial Services
697,150 0.8 7 58.0 157,288 0.279 7 9.4
Investment & Development
5,877 14 69 0.5 4,212 13.4 45 0.3
Total 1,202,656.5 162.4 830.0 100.0 1,668,462 299.7 1,133 100.0
Source: Khartoum Stock Exchange. *Preliminary Data. Table (4-29) shows an increase in the volume of trading in the market from SDG 162.4 million in 2015 to SDG 299.7 million in 2016, by 84.5%, also the number of traded shares increased from 1,202.7 million shares in 2015 to 1,668.5 million .
Table (4-30) Volume of Sukok Traded by Sectors in 2015 and 2016
(SDG millions)
2015** 2016*
SECTOR
No. of Sukok Traded (in thousand)
Volume of Trading
Executed Contracts
(%)
No. of Sukok Traded (in thousand)
Volume of Trading
Executed Contracts
(%) change
Funds 1,068 90 174 8.7 724 9 13 8.4 Certificates*** 11,222 5,994 29,303 91.3 7,924 4,054 41,978 91.6
Total 12,290 6,084 29,477 100.0 8,648 4,063 42,108 100.0
Source: Khartoum Stock Exchange market. *Preliminary Data. ** Amended Date. *** All certificates are GMCs.

|56thANNUALREPORT2016
78
Table (4-30) shows the volume of trading sukok decreased from SDG 6,084 million in 2015 to SDG 4,063 million in 2016, by 33.2%, while the number of Sukok decreased from 12.3 million in 2015 to 8.6 million in 2016, by 29.6%, and the number of the executed contracts increased from 29,477 in 2015 to 42,108 in 2016, by 42.9%. 6) Insurance Companies: Insurance companies aim to protect individuals from financial losses arising from occurrence of potentially expected hazards in the future, and not related to the insured, the insurance company will compensate the insured for losses resulting from the occurrence of the insured hazard. Insurance includes the properties, marine, aviation, energy, cars, in addition to medical insurance and engineering besides insuring miscellaneous accidents and other types of insurance. Following is a summary of insurance companies’ activities during 2014 and 2015. Gross and Net Insurance Premium of Insurance Companies: Total gross insurance premiums are represented by the amounts paid by the insured to the insurance companies, while net insurance premiums are represented by the amounts paid by the insured after deducting the amounts paid by the insurance companies to reinsurance companies as insurance premiums. Table (4-31) shows the gross and net premiums for insurance companies and (takaful) in 2014 and 2015.
Table (4-31) Gross and Net Insurance Premiums in 2014 and 2015
(SDG Millions)
Years
Particulars
2014 2015* Change ( % )
Gross Insurance Premiums 1,830.5 2,126.0 16.1
Net Insurance Premiums 1,167.1 1,393.1 19.4
Source: Insurance Supervision Authority. *Preliminary Data. Table (4-31) shows that total gross premiums increased from SDG 1,830.5 million in 2014 to SDG 2,126.0 million in2015, by 16.1%, and the net premiums increased from SDG 1,167.1 million in 2014 to SDG 1,393.1 million in 2015, by19.4%.
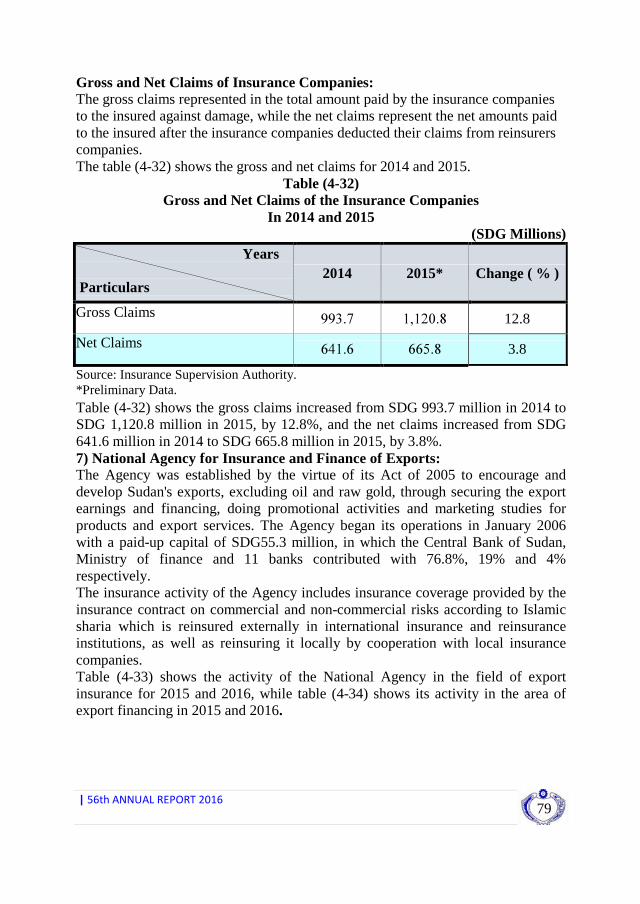
|56thANNUALREPORT2016
79
Gross and Net Claims of Insurance Companies: The gross claims represented in the total amount paid by the insurance companies to the insured against damage, while the net claims represent the net amounts paid to the insured after the insurance companies deducted their claims from reinsurers companies. The table (4-32) shows the gross and net claims for 2014 and 2015.
Table (4-32) Gross and Net Claims of the Insurance Companies
In 2014 and 2015 (SDG Millions)
Years
Particulars
Particulars
2014 2015* Change ( % )
Gross Claims 993.7 1,120.8 12.8
Net Claims 641.6 665.8 3.8
Source: Insurance Supervision Authority. *Preliminary Data.
Table (4-32) shows the gross claims increased from SDG 993.7 million in 2014 to SDG 1,120.8 million in 2015, by 12.8%, and the net claims increased from SDG 641.6 million in 2014 to SDG 665.8 million in 2015, by 3.8%. 7) National Agency for Insurance and Finance of Exports: The Agency was established by the virtue of its Act of 2005 to encourage and develop Sudan's exports, excluding oil and raw gold, through securing the export earnings and financing, doing promotional activities and marketing studies for products and export services. The Agency began its operations in January 2006 with a paid-up capital of SDG55.3 million, in which the Central Bank of Sudan, Ministry of finance and 11 banks contributed with 76.8%, 19% and 4% respectively. The insurance activity of the Agency includes insurance coverage provided by the insurance contract on commercial and non-commercial risks according to Islamic sharia which is reinsured externally in international insurance and reinsurance institutions, as well as reinsuring it locally by cooperation with local insurance companies. Table (4-33) shows the activity of the National Agency in the field of export insurance for 2015 and 2016, while table (4-34) shows its activity in the area of export financing in 2015 and 2016.

|56thANNUALREPORT2016
80
Table (4-33) Activity of the National Agency in the Field of Export
Insurance in 2015 and 2016 (SDG Millions)
Particulars 2015** 2016* %
Total amount of insurance targeted in the plan 1,625.0 1,420.0 (12.6)
Total amount insureds 234.0 370.0 58.1
Total shipment realized 188 128 (31.9)
Percentage of performance ( % ) 14.4 26.1
Source: National Agency for Insurance and Finance of Exports. *Preliminary Data ** Amended Data. Table (4-33) shows that the executed amount for insuring exports decreased from SDG 1,625.0 million in 2015 to SDG 1,420.0 million in 2016, by 12.6%, while the total amount insured increased from 234.0 million documents in 2015 to 370.0 million documents in 2016, by 58.1%. Furthermore, the Agency provides financing to the goods and export services through the commercial banks by a restricted Mudaraba, or by contributing in the consortiums with banks. Table (4-34) shows the activity of the Agency in the area of export financing in 2015 and 2016.
Table (4-34) Activity of the National Agency in the Domain of Export
Financing in 2015 and 2016 (SDG Million)
Years
Particulars
2015** 2016* %
Volume of Executed Finance 0.0 10 100
Volume of Settled Finance (Repayment) 7.5 0.2 (97.3)
Volume of Outstanding Finance by the end of the year 2.1 11.9 466.7
Source: National Agency for Insurance and Finance of Exports. *Preliminary Data. ** Amended Data.

|56thANNUALREPORT2016
81
Table (4-34) shows that the volume of executed finance amounted to SDG 10 million in 2016, while in 2015 did not record any financial operation. The volume of settled finance decreased from SDG 7.5 million in 2015 to SDG0.2 million in 2016, by 97.3%, thus the volume of outstanding finance increased from SDG 2.1 million in 2015 to SDG 11.9 million in 2016, by 466.7%. 8) Inter-Banks Liquidity Management Fund: The Fund was established in August 2015, with an initial capital of SDG 750.0 million, of which 40% of the contribution paid in cash and 60% in government securities. The fund inaugurated its work in September 2016, and its capital increased in October 2016 to reach SDG 900.0 million, due to the contribution of all the operating banks in Sudan; with a nominal value SDG 1,000 for the share. The Fund aims at helping the banks in managing their short term surplus liquidity, and stimulates the instruments trading between them, and achieving suitable return from the fund’s instruments. Table (4-35) shows the actual performance of the Inter-banks Liquidity Management Fund in 2016.
Table (4-35) Inter-banks Liquidity Management Fund
Performance in 2016 (SDG Million)
Particular Years No. Sukok Amount Recovered
Fund’s instruments Recovered 10,634,085 10,690.8 Subscription for the purpose of maintaining the initial contribution 5,034,308 5,138.6
Additional Subscription 5,589,033 5,633.1 Fund’s Advances (Gard Hassan) 598 8,965.8 Sources: Inter-bank Liquidity Management Fund. Table (4-35) shows that the number of the Fund’s advances in 2016 amounted to 598 cases, valued at SDG 8,965.8 million. 9) Microfinance Guarantee Agency (TAISEER) The Microfinance Guarantee Agency (TAISEER) was established under 2013 law approved by National Council, with an initial capital shared between the Ministry of Finance and the Central Bank of Sudan and the Union of Banks. The Objectives of the Agency: The objectives of the agency include the following: - Implementing and support economic policies and programs to reduce poverty and
unemployment in Sudan to contribute in achieving sustainable development. - Activating cooperation between banks and microfinance institutions (MFIs) in
Sudan and encourage them to enter the field of microfinance according to the
|56thANNUALREPORT2016
82
percentage determined by the Central Bank of Sudan to promote economic and social development beside support the stability of the microfinance sector.
- Making the microfinance sector attractive by assisting banks and MFIs in getting finance from different regional and international entities.
- Improving and increase the efficiency of institutions through their dealing with banks according to the international principles and practices.
- Contributing to raise the awareness, developing capacities of the targeted groups, beside developing projects and providing markets for microfinance products.
The Products of the Agency: The products represent the contracts and security documents specified by the law of agency in Chapter 4 and are as follows: - Banks guarantee document and microfinance institutions that accept deposits,
and those do not accept deposits - Cooperative societies guarantee document based on the cooperation law issued
by the national council and the organization law of agricultural and animal production professionals and cooperative societies established under the umbrella of the National Agency for the employment of graduates issued by a law approved by the National Council.
- The credit union guarantee document, which was registered with the Central Bank of Sudan and authorized to start the financing process.
- Non-government organizations guarantee document, which include various
civil society’s organizations working in the field of economic development for
microfinance clients to raise their standard of living and providing non-
financial services such as capacity building, education, training, collection and
marketing the products of the microfinance clients beside assisting them in
accessing the different sources of finance.

THE CENTRAL BANK OF SUDAN ACCOUNTS (FOR 2016)

|56thANNUALREPORT2016
84

|56thANNUALREPORT2016
85
Central Bank of Sudan Accounts for 2016 This chapter presents the Central Bank of Sudan's Balance Sheet (Statement of Financial Position), the Profit and Loss Account (the Income Statement), the Statement of Changes in Owner Equity and the Statement of Cash Flows, for the year ended 31st December 2016 as audited by the Auditor General Chamber.
First: The Financial Position:
Table (5-1) presents the balance sheet for Central Bank of Sudan as at 31st December 2016.

|56thANNUALREPORT2016
86
Table (5 - 1) Central Bank of Sudan Statement of Financial
Position (Balance Sheet) as at 31/12/2016 (SDG Thousands)
Particulars 2015/12/31 2016/12/31 Assets:
Total claims on Government 54,642,552 72,849,904
Foreign Assets 4,751,011 4,377,513 Gold Reserve 302,195 205,538 Short-term investments 12,566,044 12,978,478 Long-term Investments 3,584,071 3,858,383 Other Accounts 21,625,784 32,110,266 Fixed Assets 449,764 2,246,072 Buildings Under Construction 27,387 19,694
Information Technology's Projects Under Construction
24,953 502
Total Assets 97,973,761 128,646,350
Liabilities: Currency in Circulation 29,340,437 40,904,297 Current Accounts 26,145,476 30,466,798 Foreign Liabilities 22,900,825 32,343,075 Other Liabilities 17,686,566 20,876,396 Provisions and Claims 493,398 873,516 Sub-Total 96,566,702 125,464,082
Capital 384,000 384,000
Reserves 348,316 2,139,949 Retained Profits 674,743 658,319 Sub-Total 1,407,059 3,182,268 Total Liabilities, Capital and Reserves 97,973,761 128,646,350
Contra Accounts 49,568,994 55,525,035

|56thANNUALREPORT2016
87
Assets The total assets increased by 31.3% from SDG 97,973.8 million at the end of 2015 to SDG 128,646.3 million at the end of 2016, which was attributed mainly to the following: - - The total claims on government increased by SDG 18,207.3 million at a rate of
33.3% which resulted mainly from; a difference of SDG 6,698.5 million
between buying and selling prices of gold; an increase of SDG 3,628.0 million
in the exchange rates differential; an increase of SDG 5,400.0 million in the
government temporary financing; an increase of SDG 1,352.3 million in
deposits; and an increase of SDG 1,128.5 million in accrued interest on long
term government indebtedness. - Short-term portfolio investments rose by SDG 412.4 million at a rate of 3.3 %
which resulted mainly from an increase of SDG 860.1 million as loans guarantees to Commercial Banks through Liquidity Management Fund; an increase of SDG 675.3 million in government Investment Certificates; investment deposits at the Agricultural Bank as well as an increase of SDG 365.2 million in Portfolio investments. On the other hand, there is a decrease of SDG 1,645.2 million in investment deposits.
- Long-term portfolio investments increased by SDG 274.3 million, at a rate of 7.7%, which resulted from an increase of investment in the equity capital of local banks by SDG 126.3 million and of other financial institutions by SDG 80.0 million.
- Other accounts increased by SDG 10,484.5 million at a rate of 48.5%, which resulted from an increase of SDG 8,877.1 million in foreign and local currency Guarantees and also an increase of SDG 594.1 million in gold shipments and an increase of SDG 376.6 million in wheat prices differentials.
- The gold reserve decreased by SDG 96.6 million at a rate of 32.0 %. - Fixed Assets increased by SDG 1,796.3 million at rate of 399.4%; which
resulted from an increase of SDG 1,319.2 million in land evaluation and an increase of SDG 445.1 million in buildings evaluation.
- Foreign Assets Balance decreased by SDG 373.5 million at a rate of 7.9 % due to the decrease in correspondents accounts balances abroad.
Liabilities and other Equity The main changes in the Liabilities and owner’s equity in 2015, as compared with 2016 comprise the following: - - Currency in circulation rose at the end of the 2016 to SDG 40,904.3 million, an
increase of SDG 11,563.9 million at a rate of 39.4% where Issued currency
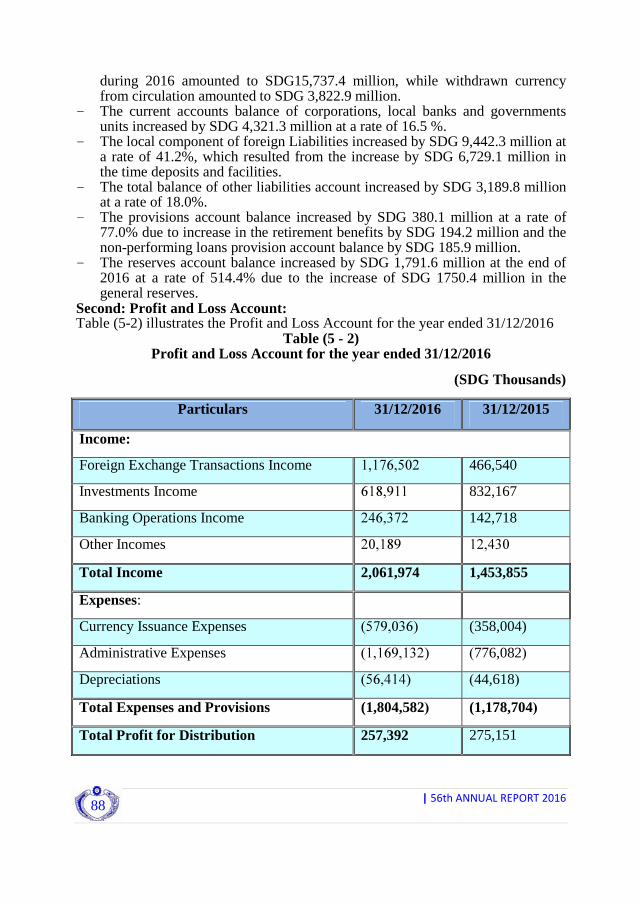
|56thANNUALREPORT2016
88
during 2016 amounted to SDG15,737.4 million, while withdrawn currency from circulation amounted to SDG 3,822.9 million.
- The current accounts balance of corporations, local banks and governments units increased by SDG 4,321.3 million at a rate of 16.5 %.
- The local component of foreign Liabilities increased by SDG 9,442.3 million at a rate of 41.2%, which resulted from the increase by SDG 6,729.1 million in the time deposits and facilities.
- The total balance of other liabilities account increased by SDG 3,189.8 million at a rate of 18.0%.
- The provisions account balance increased by SDG 380.1 million at a rate of 77.0% due to increase in the retirement benefits by SDG 194.2 million and the non-performing loans provision account balance by SDG 185.9 million.
- The reserves account balance increased by SDG 1,791.6 million at the end of 2016 at a rate of 514.4% due to the increase of SDG 1750.4 million in the general reserves.
Second: Profit and Loss Account: Table (5-2) illustrates the Profit and Loss Account for the year ended 31/12/2016
Table (5 - 2) Profit and Loss Account for the year ended 31/12/2016
(SDG Thousands)
Particulars 31/12/2016 31/12/2015
Income:
Foreign Exchange Transactions Income 1,176,502 466,540
Investments Income 618,911 832,167
Banking Operations Income 246,372 142,718
Other Incomes 20,189 12,430
Total Income 2,061,974 1,453,855
Expenses:
Currency Issuance Expenses )579,036( (358,004)
Administrative Expenses )1,169,132( (776,082)
Depreciations )56,414( (44,618)
Total Expenses and Provisions (1,804,582) (1,178,704)
Total Profit for Distribution 257,392 275,151

|56thANNUALREPORT2016
89
The following are details of changes that happened in the profit and loss items for the year end 31/12/2016
1/ Income:
- Total income increased by 41.8% from SDG 1,453.8 million in 2015 to SDG 2,062.0 million in 2016 due to the followings:
- Income from foreign exchange transactions increased by SDG 710.0 million at a rate of 152.2% as a result of an increase by SDG 701.3 million in the commissions on letters of credits and an increased difference in exchange rates by SDG 20.6 million.
- Income from investment fell by SDG 213.3 million at a rate of 25.6%, which resulted from a drop of income from investment certificates by SDG 162.9 million.
2/ Expenditures:
Total expenses increased by 53.1%from SDG 1,178.7million in 2015 to SDG 1,804.6million in 2016 as follows:
- Administrative expenses increased by SDG 393.0 million at a rate of 50.6%. - Provision for depreciation increased by SDG 11.8million at a rate of 26.4%
which resulted from an increase in the balance for depreciation of machineries and equipment by SDG 7.3 million and an increase in depreciation of information technology projects by SDG 7.3 million.
- Currency issuance expenses increased by SDG 221.0 million at a rate of 61.7% which resulted from the increase in the cost of currency printing in 2016 by SDG, 68.5 million and an increase of SDG 157.4 million in the cost of coin minting.
3/ Profits:
Total profit decreased by 6.5% from SDG 275.1 million in 2015 to SDG 257.2 million in 2016.
Third: Changes in Owner Equity:
Table (5-3) shows changes in owner equity for the year ended 31/12/2016, which includes capital, reserves and residual profits from 2015.
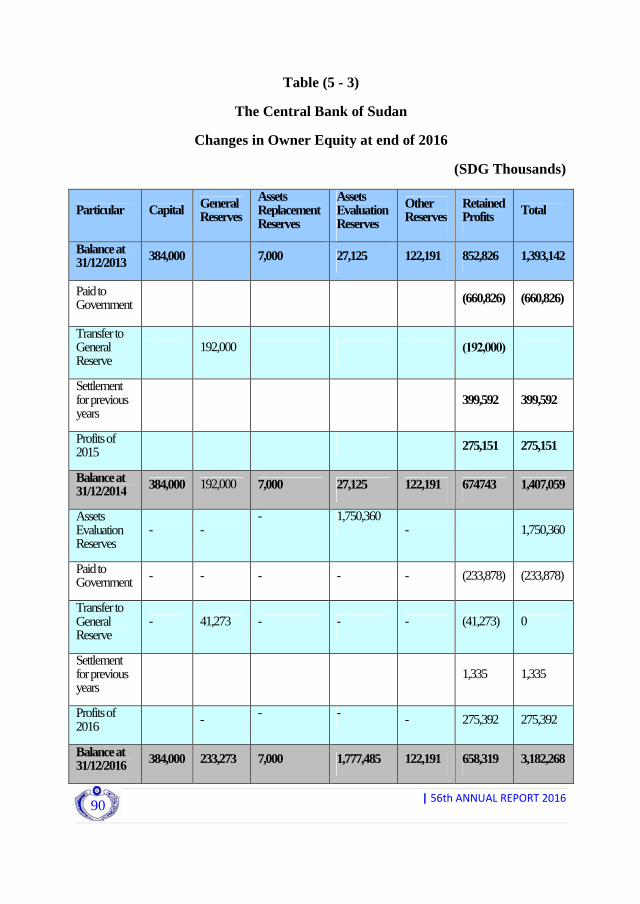
|56thANNUALREPORT2016
90
Table (5 - 3)
The Central Bank of Sudan
Changes in Owner Equity at end of 2016
(SDG Thousands)
Particular Capital General Reserves
Assets Replacement Reserves
Assets Evaluation Reserves
Other Reserves
Retained Profits Total
Balance at 31/12/2013 384,000 7,000 27,125 122,191 852,826 1,393,142
Paid to Government (660,826) (660,826)
Transfer to General Reserve
192,000 )192,000(
Settlement for previous years
399,592 399,592
Profits of 2015 275,151 275,151
Balance at 31/12/2014 384,000 192,000 7,000 27,125 122,191 674743 1,407,059
Assets Evaluation Reserves
- - - 1,750,360
- 1,750,360
Paid to Government - - - - - (233,878) (233,878)
Transfer to General Reserve
- 41,273 - - - (41,273) 0
Settlement for previous years
1,335 1,335
Profits of 2016 - - - - 275,392 275,392
Balance at 31/12/2016 384,000 233,273 7,000 1,777,485 122,191 658,319 3,182,268

|56thANNUALREPORT2016
91
Fourth: Cash Flow:
Table (5-4) illustrates the Cash flow from transactions, investments and financing activities for 2015 and 2016. It also shows the utilization of funds in various activities.
Table (5 - 4)
Central Bank of Sudan Statement of Cash Flow for the year ended 31/12/2016
(SDG Thousands)
Particular 2016 2015
Cash flow from transactions activities
Distributed net profit 275,392 275,151
Adjusted by:
Depreciation of fixed assets 56,414 44,618
Claims and Provisions 185,947 1,392
Retirement benefit Provision 204,108 118,150
Paid Retirement benefit Provision (9,937) (2,536)
Increase in Loans to government (18,207,352) (6,047,364)
Increase in other liabilities accounts (10,484,482) (8,791,218)
Increase in current accounts 4,321,322 2,455,203
Increase in Local component for external liabilities 9,442,250 11,671,004
Increase/decrease in other liabilities 3,189,830 (163,163)
Increase in currency in circulation 11,914,442 3,947,821
Returns of fixed Assets Sale )11( (3,704)
Settlement of previous years 1,335 399,592
Net cash flow from transactions activities 871,258 3,882,946

|56thANNUALREPORT2016
92
Particular 2016 2015
cash flow from (used) investment activities
Purchase of fixed assets (102,364) (44,088)
Increase/decrease in Constructions under implementation
7,693 (16,749)
Increase/decrease in Projects under implementation
24,451 (4,688)
Returns from sales of fixed assets 13 3,881
Increase in short-term investments (412,434) (2,586,614)
Increase in long- term investments (274,312) (428,902)
Net cash flow from(used) investment activities
(756,953) (3,077,160)
cash flow used in financing activities
Paid profits to government (233,878) (627,078)
Net cash flow used in financing activities (233,878) (627,078)
Changes in cash balances and the like during the year
(119,573) 178,708
Cash balances at the beginning of the year 6,420,017 6,241,309
Cash balances at the end of the year 6,300,444 6,420,017
GENERAL BUDGET PERFORMANCE

|56thANNUALREPORT2016
94

|56thANNUALREPORT2016
95
General Government Budget Performance
This chapter provides an overview of the government general budget for 2016. Hence it does reflect the overall picture of the government's revenues and expenditures. This is due to the fact Sudan adopts a federal system of government under which the country is divided into several states each state is mandated to prepare and approve its current and development budgets from the source of revenue authorized by law, including taxes, fees and transfers from the federal government. The states expend the revenues to provide basic services such as healthcare, education, eater supplies. The federal government, in addition finances from its budget some development project in certain states. The government budget structure conforms to the Government Financial Statistics Manual (GFSM) issued by the IMF in 2001. It consists of: public revenues, public expenditures, the overall surplus or deficit and sources of its financing. The public revenues include tax revenues, non-tax revenues and grants. The most important sources of tax revenues comprise income tax, business profits tax, capital gains; value added tax and tax on international trade and production, whereas non-tax revenues include sales of goods and services, ownership income and fees. Public expenditure is divided into three chapters; chapter one covers compensation of employees, purchase of goods and services and social subsidies. Chapter two deals with transfers to the states for finance part of their current and development expenditure; chapter three presents the expenditure on national development projects, known as acquisition of non-financial assets; while the last item of the budget structure shows the overall fiscal surplus or deficit and its sources of finance. First: General Government Budget Performance 2016: The 2016 budget aimed at stimulating the stagnation of the economy and advancing its rate of growth , while at the same time reducing inflation and maintaining the stability of the exchange rate, guides by the following indicators - Raising production and stimulating the economy by targeting a real growth rate
of 6.4% in the GDP. - Reducing the budget deficit to a stable level by targeting a growth in money
supply commensurate with the macro-economic objectives in order to reduce the inflation rate to 13.0%.
- Restoring the external sector stability by enhancing foreign exchange receipts and streaming payments and creating an attractive investment environment conductive to stabilizing foreign exchange rate.
- Providing employment opportunities and reducing unemployment. - Forming intelligent partnership between the private and public sectors for the
objective of developing the infrastructure and participating in achieving balanced regional development.
Table (6-1) summarizes the government budget financial performance for 2015 and 2016, while figure (6-1) presents a summary of the revenues and expenditures together with the overall budget deficit for 2015and 2016.

|56thANNUALREPORT2016
96
Table (6-1) Central Government Budget Performance for 2015 and 2016
(SDG Million) 2015 2016
Item Budget
Estimates Actual
Performance Performance (%)
Budget Estimates
Actual Performance
Performance (%)
Rate of Change (%)
Total Public Revenues 61,350.3 54,499.8 89 68,048.1 57,864.6 85 6
Total Current Expenditure 59,821.0 54,854.3 92 67,114.7 62,195.0 93 13
Current Budget Surplus or Deficit (-)
1,529.3 )354.5( )23( 933.3 )4,330.4( )464( ( ) 1122
Net Acquisition of Non-Financial Assets (Development Expenditure)*
7,414.5 6,012.4 81 10,496.8 6,587.7 63 10
Net Acquisition of Financial Assets (Capital Participation)
549 630.8 115 1,436.7 316.9 22 ) 50(
Total Public Expenditure 67,784.50 61,497.50 91 79,048.20 69,099.60 87 12
Total Budget Deficit )6,434.7( )6,976.4( 108 )11,000.2( )11,234.9( 102 61
Deficit Financing 6,434.7 6,976.4 108 11,000.2 11,234.9 102 61
External Financing (Withdrawals)
3,947.5 1,425.2 36 5,527.0 1605.7 29 13
External Financing (Payments)
)3,477( )1,830.6( 53 )2,551.9( )464.3( 18 )75(
Net External Financing 470.5 )405.4( )86( 2,975.1 1,141.4 38 382
Domestic Financing (Withdrawals)
8,249.2 9,531 116 17,322.5 12,157.4 70 28
Domestic Financing (Payments)
)2,285( )2149.3( 94 )9,297.4( )2,083.2( 22 )3(
Net Domestic Financing 5,964.2 7,381.8 124 8,025.0 10,074.2 126 36
Source: Ministry of Finance and Economic Planning. *Covering disposal of non-financial assets in 2014 and 2015 including of the returns from selling of disposal items by auctions.

|56thANNUALREPORT2016
97
Figure (6-1) Budget Revenues, Expenditures and the Overall Deficit,2015 and 2016
As appears from table (6-1), total public revenues increased by 6% from SDG 55,499.8 million in 2015 to SDG 57,864.6 million in 2016. Public expenditures increased by12% from SDG 61,497.5 million in 2015 to SDG 69,099.6 million in 2016, due to the increase in current expenditures by 13%, the overall budget deficit increased significantly by 61.7% from SDG 6,976.4 million in 2015 to SDG 11,234.9 million in 2016. Details of the performance of public revenues and public expenditures are highlighted below: - 1-Public Revenues: Table (6-2) provides details of public revenues in 2015 and 2016 budgets, while figure (6-2) shows the sources of the two years budgets revenues. Figure (6-3) illustrates the contribution of the revenue items in 2016 budget.
Table (6-2)
Public Revenues for 2015 and 2016
(SDG Million) 2015 2016
Item Budget
Estimates Actual Performance
Performance (%)
% of Total Revenues
Budget Estimates
Actual Performance
Performance (%)
% of Total Revenues
Rate of Change (%)
Tax Revenues 39,276.5 41,963.3 107 77 48,642.6 47,257.6 97 82 13
Taxes on income, business and capital profits
3,028.0 3,103.0 102 5.7 3,499.6 3,387.6 97 6 9
Taxes in ownership
117.8 85.3 72 0.2 108.0 90.0 83 0 6
Taxes on goods and services
26,958.5 29,608.1 110 54 34,627.9 34,597.6 100 60 17
Taxes on international trade
9,158.3 9,063.3 99 17 10,383.1 9,057.7 87 16 0
Other taxes 14.0 103.6 740 0.2 24.0 124.6 519 0 20 Non-tax Revenues
19,861.1 10,856.2 55 20 16,914.3 8,849.0 52 15 )18(
Sales of Gov. 8,477.3 4,162.9 49 8 5,104.0 3,270.3 64 6 )21(
2016 2015

|56thANNUALREPORT2016
98
2015 2016 Item Budget
Estimates Actual Performance
Performance (%)
% of Total Revenues
Budget Estimates
Actual Performance
Performance (%)
% of Total Revenues
Rate of Change (%)
entities market goods* Ownership Income**
2,138.8 1,533.4 72 3 2,600.0 2,038.9 78 4 33
Administrative Charges
1,365.4 1136.6 83 2 1,996.4 1,409.3 71 2 24
Occasional sales of gov. entities non-market goods
16.3 0.0 0 0 18.0 10.0 56 0 0
Fines, penalties and forfeitures
24.5 0.0 0 0 30.0 20.0 67 0 0
Other Revenues
7,838.8 4,023.3 51 7.4 7,165.9 2,100.7 29 4 )48(
(C ) Foreign Grants
2,212.7 1,680.3 76 3 2,491.2 1,758.0 71 3 5
Total Revenues and Grants
61,350.3 54,499.8 89 100 68,048.1 57,864.60 85 100 6
Source: Ministry of Finance and Economic Planning *Including sales of oil and sales of government entities and non-oil market goods ** Government share in profit surpluses of public entities, companies, and from government investments.
Figure (6-2) Sources of Budget Revenues for 2015 and 2016
54,499.80
1,680.30
41,963.30
10,856.20
57,864.60
1,758.0
47,167.60
8,849.0
0.00
10,000.00
20,000.00
30,000.00
40,000.00
50,000.00
60,000.00
70,000.00
Total Revenues
and Grants
Foreign Grants Tax Revenues Non-tax
Revenues
SD
G m
illi
on
2015 2016

|56thANNUALREPORT2016
99
Figure 6-3 Contribution of Revenue Items in 2016 Budget
3%
82%
15%
Foreign Grants Tax Revenues Non-tax Revenues
As illustrated in figure (6-3), the tax revenues accounted for 82% of the total budget revenues in 2016, followed by the non-tax revenues representing 15% and foreign grants by 3%. (A)Tax Revenues Table (6-3) and figure explain actual performance of tax revenue items for 2015 and 2016 compared with budgets estimates.
Table (6-3) Budgets Estimates and Performance 2015-2016
(SDG Million)
2015 2016
Item Budget Estimates
Actual Performance
Performance (%)
Budget Estimates
Actual Performance
Performance (%)
% of Total Tax -Revenues
Rate of Change (%)
Taxes on income, profits and capital gains
3,028.0 3,103.0 102 3,499.6 3,387.6 97 7 9
Taxes on ownership 117.8 85.3 72 108.0 90.0 83 0 6
Taxes on goods and services
26,958.5 29,608.1 110 34,627.9 34,597.6 100 73 17
Taxes on international trade and transactions
9,158.3 9,063.3 99 10,383.1 9,057.7 87 19 0
Other taxes 14.0 103.6 740 24.0 124.6 519 0 20
Total 39,276.5 41,963.3 107 48,642.6 47,257.6 97 100 13
Source: Ministry of Finance and Economic Planning
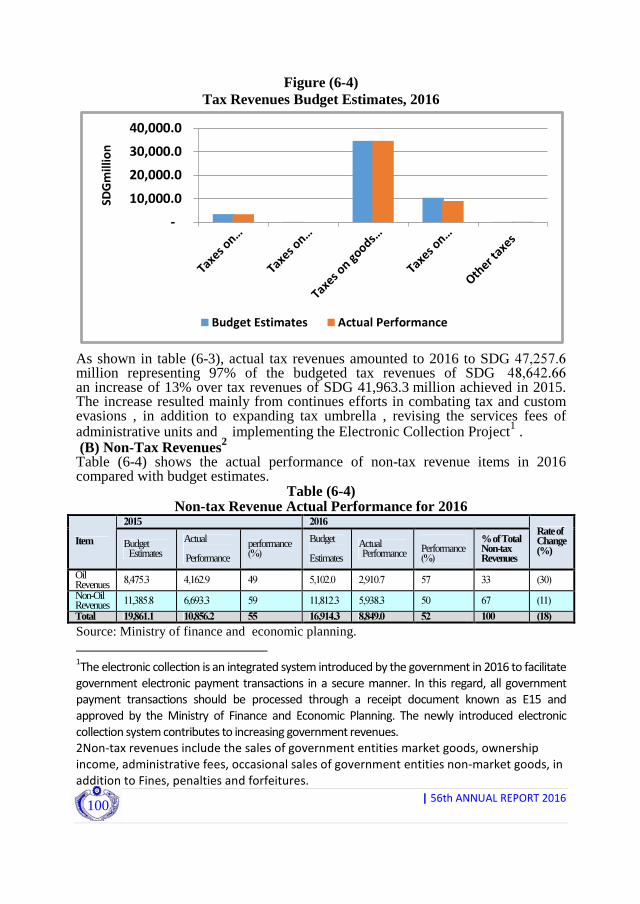
|56thANNUALREPORT2016
100
Figure (6-4) Tax Revenues Budget Estimates, 2016
-
10,000.0
20,000.0
30,000.0
40,000.0
SDGmillion
Budget Estimates Actual Performance
As shown in table (6-3), actual tax revenues amounted to 2016 to SDG 47,257.6 million representing 97% of the budgeted tax revenues of SDG 48,642.66 an increase of 13% over tax revenues of SDG 41,963.3 million achieved in 2015. The increase resulted mainly from continues efforts in combating tax and custom evasions , in addition to expanding tax umbrella , revising the services fees of administrative units and implementing the Electronic Collection Project1 . (B) Non-Tax Revenues2 Table (6-4) shows the actual performance of non-tax revenue items in 2016 compared with budget estimates.
Table (6-4) Non-tax Revenue Actual Performance for 2016
2015 2016
Item Budget Estimates
Actual Performance
performance (%)
Budget Estimates
Actual Performance
Performance (%)
% of Total Non-tax Revenues
Rate of Change (%)
Oil Revenues 8,475.3 4,162.9 49 5,102.0 2,910.7 57 33 )30(
Non-Oil Revenues 11,385.8 6,693.3 59 11,812.3 5,938.3 50 67 )11(
Total 19,861.1 10,856.2 55 16,914.3 8,849.0 52 100 )18(
Source: Ministry of finance and economic planning.
1Theelectroniccollec�onisanintegratedsystemintroducedbythegovernmentin2016tofacilitate
government electronic payment transactions in a secure manner. In this regard, all government
payment transac�ons should be processed through a receipt document known as E15 and
approved by the Ministry of Finance and Economic Planning. The newly introduced electronic
collection system contributes to increasing government revenues.
2Non-tax revenues include the sales of government entities market goods, ownership
income, administrative fees, occasional sales of government entities non-market goods, in
addition to Fines, penalties and forfeitures.
|56thANNUALREPORT2016
101
As illustrated in table (6-4) actual non-tax revenue amounted to SDG 8,849.0 million in 2016 representing 52% of the estimated budget figure of SDG 16,914.3 million. The oil revenue achieved in 2016 reached SDG 2,910.7 million representing 57 % and contributing 33% to the budgeted estimates of SDG 5,102.0 million. Non-oil revenue achieved in 2016, representing 50% of the budgeted estimates. (C) Foreign Grants: As appears from table (6-2) foreign grants increased from SDG 1,680.3 million in 2015 to SDG 1,758.0 million in 2016, representing 71% of the budgeted estimate of SDG 2,491.2 million and 3% of the total revenues. 2-Public Expenditures Total public expenditure amounted to SDG 69,099.6 million in 2016 an increase of 12% compared to 2015 and performing rate of 87% to 2016 budget estimate. The public expenditure included current expenditure in the amount of SDG 62,030.9 million representing 92% of the 2016 budget estimate. The net national development net expenditure amounted to SDG 6,794.6million in 2016, a performance rate of 63% of the budget estimate, while net capital expenditure amounted to SDG 631.9 million representing 22% of the budget estimate. (A)Current Expenditures: Table (6-5) and figure (6-5) show the central government’s actual current expenditures in 2015 and 2016, while figure (6-6) indicates the share of current expenditures items in 2016 federal government general budget.
Table (6-5) Actual Performance of Central Government Current Expenditures, 2015 and 2016
(SDG Million) 2016 2015
Rate of Change (%)
% of Total
Actual Performance
Rate of Change (%)
% of Total Actual Performance Item
24 37 22,909.3 17 34 18,509.2 Employee Compensations 27 14 8,729.2 11 13 6,872.0 Purchase of goods and services
)10( 14 8,978.7 )6( 18 9,930.7 Subsidy for Strategic Goods )17( 5 2,967.6 )5( 7 3,586.7 Cost of Finance
0 0 123.4 79 0 123.9 Subsidies (Allowances) )24( 0 100.8 19 0 133.3 Participation in International Organizations
34 4 2,647.6 29 4 1,976.4 Social Benefits* )74( 0 255.4 188 2 979.0 Other National Expenditure
22 25 15,483.0 6 23 12,743.0 States Transfers 13 100 62,195.0 9 100 54,854.3 Total Current Expenditure
Source: Ministry of Finance and Economic Planning *Including government direct subsidy to households, internal and external healthcare subsidy, subsidy to accidents and child injuries.
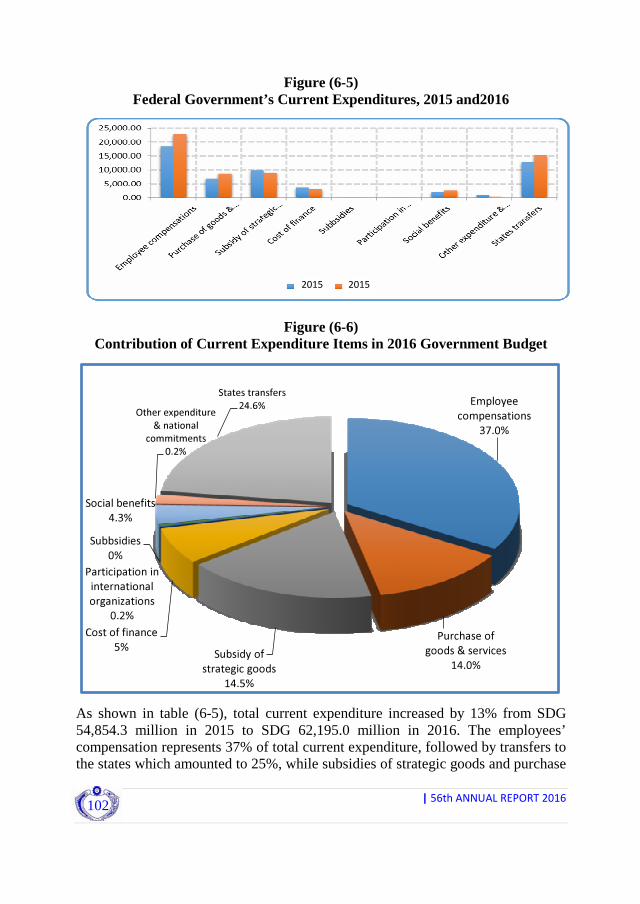
|56thANNUALREPORT2016
102
Figure (6-5) Federal Government’s Current Expenditures, 2015 and2016
Figure (6-6) Contribution of Current Expenditure Items in 2016 Government Budget
Employee
compensations
37.0%
Purchase of
goods & services
14.0%Subsidy of
strategic goods
14.5%
Cost of finance
5%
Subbsidies
0%
Participation in
international
organizations
0.2%
Social benefits
4.3%
Other expenditure & national
commitments0.2%
States transfers24.6%
As shown in table (6-5), total current expenditure increased by 13% from SDG 54,854.3 million in 2015 to SDG 62,195.0 million in 2016. The employees’ compensation represents 37% of total current expenditure, followed by transfers to the states which amounted to 25%, while subsidies of strategic goods and purchase
2015 2015

|56thANNUALREPORT2016
103
of goods and services contributed 14% in total current expenditure. The employees compensation increased by 24% from SDG 18,509.2 million in 2015 to SDG 22,909.3 million in 2016, Expenditure on buying goods and services increased from SDG 6,872.0 million in 2015 to SDG 8, 729.2 million in 2016 by 27%. Subsidies on strategic goods dropped from SDG 9,931.7 million in 2015 to SDG8, 978.7 million in 2016 by 10%, and transfers to the States rose by 25% from SDG12, 743.0 million in 2015 to SDG15, 483.0 million in 2016, while the cost of finance decreased by 17% from SDG3, 586.7 million in 2015 to SDG2, 967.6 million in 2016. National Development Expenditure: Table (6-6) shows the national development expenditure in local and foreign currencies in 2015 and 2016; whereas, table (6-7) and figure (6-7) illustrate national development expenditures, by sectors for 2015 and 2016.
Table (6-6) National Development Expenditure in Local and Foreign Currencies for 2015 and 2016
(SDG Million)
2016 2015 Rate of Change (%)
Contribution %
Actual Performance
Contribution %
Actual Performance
Item
16 82 5,542.1 80 4,797 National Development in Local Currency
3 18 1,252.5 20 1,215.2 National Development in Foreign Currency*
13 100 6,794.6 100 6,012.4 Total
Source: Ministry of Finance and Economic Planning. *valued in local currency at official exchange rate. Development expenditure increased by 13.0% from SDG 6, 012.4 million in 2015 to SDG 6,794.6 million in 2016, while development expenditure in local currency increased by 16.0% from SDG 4,797 million in 2015 to SDG 5,542.1 million in 2016, the development expenditure in foreign currency (equivalent in local currency) increased slightly by 3% from SDG 1,215 million in 2015 to SDG 1,252.5 million in 2016. It can be noted that due to the economic sanctions, the financing of development projects in 2016 depended mainly on the local component which represented 82% of the total development expenditure. Table (6-7) and figure (6-7) show national development expenditure by the different sectors in 2015 and 2016.

|56thANNUALREPORT2016
104
Table (6-7) Development Expenditure by Sectors, 2015 and 2016
(SDG Million)
2016 2015 Rate of Change%
% of the Total
Performance (%)
Actual Performance
Budget Estimate
% of the Total
Performance (%)
Actual Performance
Budget Estimate
Item
)23( 10 49 675.21 1,383.52 15 64 880.30 1,380.34 Agricultural and Livestock
27 6 76 381.27 498.90 5 100 299.20 299.20 Industrial development
31 23 75 1,542.32 2,056.15 20 75 1,177.20
1,577.20 Roads, bridges and transportation
27 38 66 2,613.24 3,969.74 34 84 2,061.4
0 2,461.40
Electricity and Water Resources
)28( 12 56 804.95 1,428.95 18 100 1,112.10
1,112.10 Social Development
61 11 61 777.01 1,283.18 8 82 482.20 588.30 Miscellaneous Sectors
13 100 64 6,794.6 10,620.44 100 81 6,012.4
0 7418.54
Total Acquisition of Non-Financial Assets
Source: Ministry of Finance and Economic Planning.
Figure (6-7) Development Expenditure by Sectors for 2015 and 2016
0.0
1000.0
2000.0
3000.0
4000.0
5000.0
6000.0
7000.0
8000.0
2015 2016
As appears from table (6-7) and figure (6-7), actual expenditure on acquisition of non-financial assets amounted to SDG 6, 794.6 million in 2016 representing 64% of the budget estimate of SDG 10,620.4 million, where the electricity and water resources received the largest share of SDG 2, 4613.2 million representing 38% of total development expenditure, roads and bridges and transportation sector

|56thANNUALREPORT2016
105
representing 23%. In addition, the agricultural sector development expenditure amounted to SDG 675.2 million representing 10% of total development expenditure in 2016, while the share of social development sector and diversified sector recorded 12% and 11% respectively. (3)Budget Deficit and Financing Sources Table (6-8) shows the overall budget deficit and its financing sources in 2015 and 2016, while figure (6-8) explains internal debt instruments which contributed to financing the overall budget deficit.
Table 6-8 Total Budget Deficit and Sources of Financing for 2015 and 2016
(SDG Million)
2015 2016
Item Budget Estimates
Actual Performance
Performance (%)
% of Total Deficit
Budget Estimates
Actual Performance
Performance (%)
% of Total Deficit
Rate of Change
Total Budget Deficit )6,434.7( )6,976.4( 108 100 )11,000.2( )11,234.9( 102 100 61
External Financing (Withdrawals on Loans and Grants)
3,947.5 1,425.2 36 )20.4( 5,527.0 1,605.7 29 )14.3( 13
External Financing (Payments)
)3,477.0( )1,830.6( 53 26.2 )2,551.9( )464.3( 18 4.1 )75(
Net External Financing 470.5 )405.4( )86( 5.8 2,975.1 1,141.4 38 )10.3( 177
Internal Financing (Withdrawals)
8,249.2 9531 116 )137( 17,322.5 12,157.4 70 )108.2( 22
Internal Financing (Payments)
)2,285( )2149.3( 94 31 )9,297.4( )2,083.2( 22 18.5 )3(
Net Internal Financing 5,964.2 7,381.8 124 )106( 8,025.0 10,074.2 126 )89.7( 36
Government Musharaka Certificates
1,300 2,611.2 201 )37.4( 2,000 2,109.4 105 )18.8( )19(
Government Investment Certificates
1,300 )50.3( )4( 0.72 102.6 )206.4( )201( 1.8 310
Debt Amortization )85( )141.4( 166 2.03 0.0 )12.2( 0 0.1 )91(
Letters of Guarantees 2,149.2 3,419.8 159 )49.02( 3,122.5 2,879.7 92 )25.6( )16(
Arrears )2,200( )1,957.6( 89 28.06 )1,200( )96.2( 8 0.9 )95(
Temporary Advances from the Central Bank of Sudan
3,500 3,500 100 )50.17( 4,000 5,400 135 )48.1( 54
Additional Sources 0.0 0.0 0 0 0.0 0.0 0 0 0
Source: Ministry of Finance and Economic Planning.

|56thANNUALREPORT2016
106
Figure (6-8) Budget Domestic Finance for 2015 and 2016
-2000.0
-1000.0
0.0
1000.0
2000.0
3000.0
4000.0
5000.0
6000.0
3500.0
-1957.6
3419.8
-141.4-50.3
2611.2
5400.0
-96.2
3563.2
-12.2 -206.4
2109.4
SDGmillion
2015 2016
The total budget deficit reached SDG 11,234.9 million in 2016 compared with a deficit of SDG 6,976.4 million in 2015. This deficit was financed from internal and external sources as follows:
a) External Financing Withdrawals on foreign loans and grants amounted to SDG 1,605.7 million in 2016, while repayments amounted to SDG 464.3 million, and net external financing amounted to SDG 1, 141.4 million representing 10.3 %of total deficit financing in 2016. b) Internal Financing: The total withdrawals from domestic financing in 2016 amounted to SDG 12,157.4 million, while total repayments amounted to SDG 2,083.2 million. As a result, the net domestic financing amounted to SDG10, 074.2 million representing 90% of total budget deficit financing in 2016.
- Internal Debt Instruments: Internal sources of financing include, the share of GMCs, GICs , debt amortization, letter of guarantees and arrears, whereas the guarantees represented the major share of financing the deficits compared to other debt instruments with share of 26%, followed by GMCs with share of 19% of the total internal financing.

|56thANNUALREPORT2016
107
- Temporary Financing from the Central Bank of Sudan:
As per Article (48-1) of the Central Banks of Sudan Act (2012 Amendment) the
Central Bank of Sudan may grant temporary financing to the government not
exceeding 15% of the total estimated budget revenues for that fiscal year in which
such financing is granted, provided that financing should be repaid within the six
months following the end of the fiscal year in which the financing is granted. In
accordance to the above article, the government was granted temporary financing
amounting to SDG 5,400 million in 2016 representing 9% of total budgeted
revenues, and contributing 48% to the total deficit financing.
Second: Main Budget indictors and ratios for 2015 and 2016
Table (6-9) and figure (6-9) illustrate indictors of the budget items to the Gross
Domestic Product (GDP) 2015 and 2016.
Table (6-9)
Budget Items Ratios to the Gross Domestic Product, 2015 and 2016
Item 2015 2016 Rate of
Change (%)
Total Revenues (SDG Million) 55,499.8 57,864.6 4.3
Total Revenues as a percent of GDP(%) 9.5 8.3 1.2-
Total Expenditure (SDG Million) 61,497.50 69,099.60 12.4
Total Expenditure as a percent of
GDP(%) 10.54 10 )0.5(
Total Budget Deficit (SDG Million) )6,976.4( )11,234.9( 61
Budget Surplus/ Deficit as a percent of
GDP(%) )1.2( )1.6( )0.4(
GDP at Current Prices (SDG Million) 582،937 693,514 19
Source: Ministry of Finance and Economic Planning and Central Bureau of Statistics.
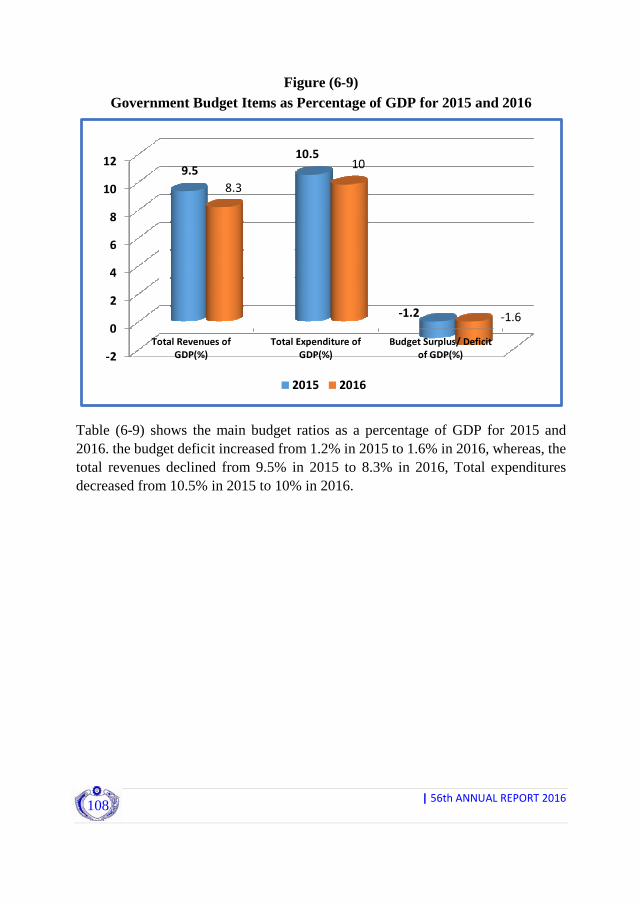
|56thANNUALREPORT2016
108
Figure (6-9) Government Budget Items as Percentage of GDP for 2015 and 2016
-2
0
2
4
6
8
10
12
Total Revenues of
GDP(%)
Total Expenditure of
GDP(%)
Budget Surplus/ Deficit
of GDP(%)
9.5
10.5
-1.2
8.3
10
-1.6
2015 2016
Table (6-9) shows the main budget ratios as a percentage of GDP for 2015 and 2016. the budget deficit increased from 1.2% in 2015 to 1.6% in 2016, whereas, the total revenues declined from 9.5% in 2015 to 8.3% in 2016, Total expenditures decreased from 10.5% in 2015 to 10% in 2016.
GROSS DOMESTIC PRODUCT (GDP)

|56thANNUALREPORT2016
110

|56thANNUALREPORT2016
111
Gross Domestic Product (GDP)
Gross Domestic Product (GDP) is the sum of the market values of final goods and services produced in a country during a specific time period (usually one year). The System of National Accounts (SNA) uses three core methods to compute GDP. (1) The Production Method or value added, according to this method, GDP is the
sum of values added in all sectors of the economy within a specific period. It computes the values of final goods and services at current prices excluding the values of intermediate goods and services involved in the production process.
(2) The Income Method, defines the GDP as the sum of income of the factors of production that contribute in the production process which includes compensation of employees that comprises wages, salaries and other labour cost plus gross operating surplus of business enterprises and taxes minus goods subsides.
(3) The Expenditure Method defines GDP as the sum of consumption, investment spending, and net foreign transactions of good and service in a country within specific period of time. Sudan adopt the first and the third methods.
First: Gross Domestic Product at Constant Prices by Economic Activities (product method) Table (7-1) and figure (7-1) demonstrate the growth rate of GDP and its component sectors at constant prices for 2015 and 2016 (calculation is based on year (1981/82 prices)).
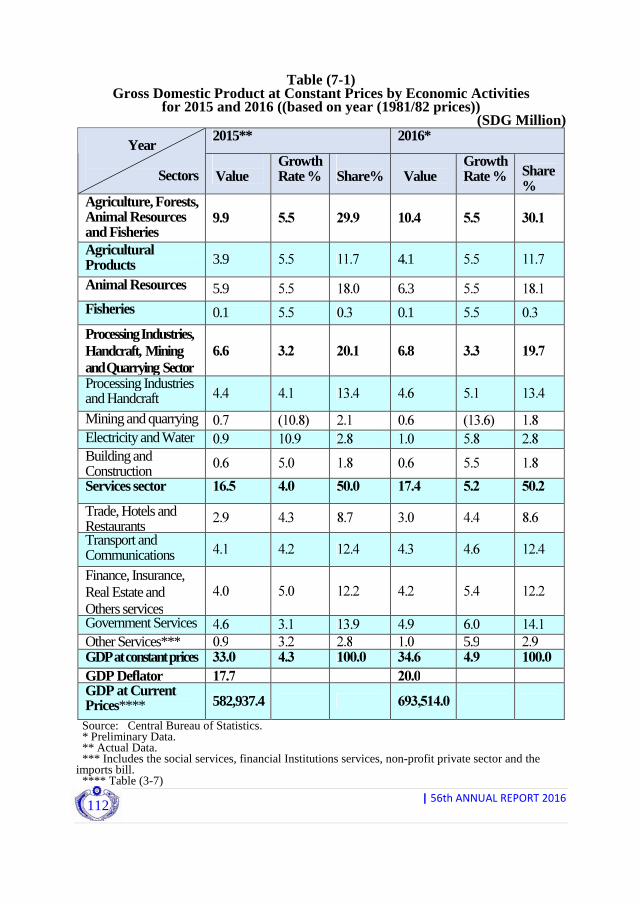
|56thANNUALREPORT2016
112
Table (7-1) Gross Domestic Product at Constant Prices by Economic Activities
for 2015 and 2016 ((based on year (1981/82 prices)) (SDG Million)
2015** 2016* Year
Sectors
Value
Growth Rate %
Share%
Value
Growth Rate % Share
% Agriculture, Forests, Animal Resources and Fisheries
9.9 5.5 29.9 10.4 5.5 30.1
Agricultural Products 3.9 5.5 11.7 4.1 5.5 11.7
Animal Resources 5.9 5.5 18.0 6.3 5.5 18.1 Fisheries 0.1 5.5 0.3 0.1 5.5 0.3
Processing Industries, Handcraft, Mining and Quarrying Sector
6.6 3.2 20.1 6.8 3.3 19.7
Processing Industries and Handcraft 4.4 4.1 13.4 4.6 5.1 13.4
Mining and quarrying 0.7 )10.8( 2.1 0.6 )13.6( 1.8 Electricity and Water 0.9 10.9 2.8 1.0 5.8 2.8 Building and Construction
0.6 5.0 1.8 0.6 5.5 1.8
Services sector 16.5 4.0 50.0 17.4 5.2 50.2
Trade, Hotels and Restaurants
2.9 4.3 8.7 3.0 4.4 8.6
Transport and Communications 4.1 4.2 12.4 4.3 4.6 12.4
Finance, Insurance, Real Estate and Others services
4.0 5.0 12.2 4.2 5.4 12.2
Government Services 4.6 3.1 13.9 4.9 6.0 14.1 Other Services*** 0.9 3.2 2.8 1.0 5.9 2.9 GDP at constant prices 33.0 4.3 100.0 34.6 4.9 100.0 GDP Deflator 17.7 20.0 GDP at Current Prices**** 582,937.4 693,514.0
Source: Central Bureau of Statistics. * Preliminary Data. ** Actual Data. *** Includes the social services, financial Institutions services, non-profit private sector and the imports bill. **** Table (3-7)

|56thANNUALREPORT2016
113
Figure (7-1) Sectors Growth Rate for 2015 and 2016
5.5
3.2
4
5.5
3.3
5.2
0
1
2
3
4
5
6
Agricultural Sector Industerial Sector Services Sector
%
2015 2016
according to table (7-1) GDP growth rate at constant prices witnesses a considerable increase from 4.3% in 2015 to 4.9% in 2016 due to the increase in some sectors such as the industrial sector in which the growth rate increase to some extent from 3.2% in 2015 to 3.3% in 2016, there was also a remarkable increase in the growth rate of the services sector from 4.0% in 2015 to 5.2% in 2016, while the agricultural sector growth rate, however, remained without change at 5.5% in 2015 and 2016. The increase in the industrial sector growth rate can be attributed mostly to the boost in the growth rate of some of its sub sectors, such as the handcraft and processing, which grew significantly from 4.1% in 2015 to 5.1% in 2016, building and construction also show a significant growth rate from 5.0% in 2015 to 5.5% in 2016, never the less, growth rate of mining and quarrying sub sector decreased from minus 10.8% in 2015 to minus 13.6% in 2016, and the electricity and water growth rate decreased from 10.9% in 2015 to 5.8% in 2016. In the Service sector, the growth rate increased from 4.0% in 2015 to 5.2% in 2016. This was attributed to the increase in the production in all its subsectors which include, hotels and restaurants from 4.3% in 2015 to 4.4% in 2016, transport and communications from 4.2% in 2015 to 4.6% in 2016, finance, Insurance, real estate and business services from 5.0% in 2015 to 5.4% in 2016, government services
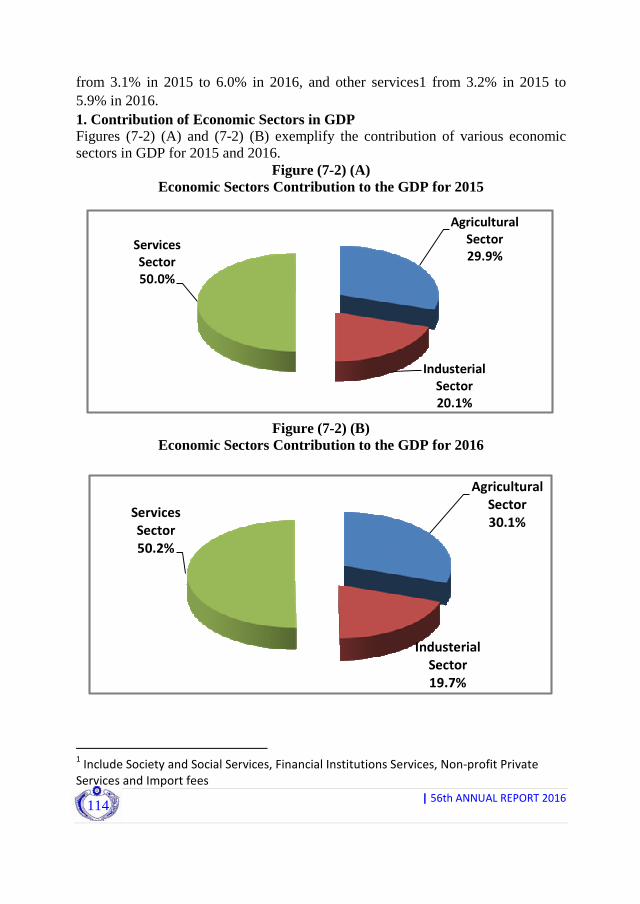
|56thANNUALREPORT2016
114
from 3.1% in 2015 to 6.0% in 2016, and other services1 from 3.2% in 2015 to 5.9% in 2016. 1. Contribution of Economic Sectors in GDP Figures (7-2) (A) and (7-2) (B) exemplify the contribution of various economic sectors in GDP for 2015 and 2016.
Figure (7-2) (A) Economic Sectors Contribution to the GDP for 2015
Agricultural
Sector
29.9%
Industerial
Sector
20.1%
Services
Sector
50.0%
Figure (7-2) (B)
Economic Sectors Contribution to the GDP for 2016
Agricultural
Sector
30.1%
Industerial
Sector
19.7%
Services
Sector
50.2%
1 Include Society and Social Services, Financial Institutions Services, Non-profit Private
Services and Import fees

|56thANNUALREPORT2016
115
The Agricultural Sector The agricultural sector contributes by 30.1% to the GDP in 2016, which is a bit higher than its contribution in 2015 by 29.9% , while the contributions of its major sub-sector remained without major change in 2015 and 2016. The Industrial Sector However, the contribution of the industrial sector to GDP in real terms decreased from 20.1% in 2015 to 19.7% in 2016 by 0.4%, due to the decrease in the contribution of its some sub sectors. The contribution of mining and quarrying decreased from 2.1% in 2015 to 1.8% in 2016, while the contributions of some of its subsectors such as processing and manufacturing, electricity and water, building and construction remained without change at 13.4%, 2.8% and 1.8% respectively in 2015 and 2016. The Services Sector The contribution of the services sector to GDP in real terms increased from 50.0% in 2015 to 50.2% in 2016, due to the increase in contribution of some of its sub-sectors, government services contribution increased from 13.9% in 2015 to 14.1% in 2016, and other services increased fairly from 2.8% in 2015 to 2.9% in 2016, the contribution of transport and communications, finance, insurance, real estate and business services remained without change in 2015 and 2016, while the contribution of hotels and restaurants decreased from 8.7% in 2015 to 8.6% in 2016. 2. Trend of GDP Growth Rate during the period (2012-2016) Table (7-2) and figure (7-3) demonstrate GDP growth rates over the period (2012-2016).
Table (7-2) GDP Growth Rates during
the period (2012-2016) at Constant Prices (based on 1981/82 prices)
Year 2012** 2013** 2014** 2015** 2016*
GDP growth rate (%) 2.4 6.8 7.0 4.3 4.9
Source: Central Bureau of Statistics. * Preliminary Data. ** Actual Data.

|56thANNUALREPORT2016
116
Figure (7-3) GDP Growth Rate during the Period (2012-2016)
at Constant Prices (based on 1981/82 prices)
2.4
6.87.0
4.3
4.9
-
1.0
2.0
3.0
4.0
5.0
6.0
7.0
8.0
2012 2013 2014 2015 2016
%
GDP Growth Rate
Table (7.2) and figure (7-3) show the increase in the GDP growth rate over the period (2012-2014) from 2.4% in 2012 to 7.0% in 2014, as the result of the increase in the industrial sector growth rate from minus 17.5% in 2012 to 8.1% in 2014, and the increase in the service sector growth rate from 9.9% in 2012 to 22.3% in 2014, then GDP growth rate declined to 4.3% in 2015, as result of the decreased in the agricultural sector growth rate from 9.5% in 2014 to 5.5% in 2015, and the services sector growth rate from 9.5% in 2014 to 4.0% in 2015. GDP growth rate increased to 4.9% in 2016, as result of the increase in the services sector growth rate from 4.0% in 2015, to 5.2% in 2016. Second: Gross Domestic Product at Current Prices by Economic Activities (Product Method) Table (7-3) displays GDP at current prices for 2015 and 2016.
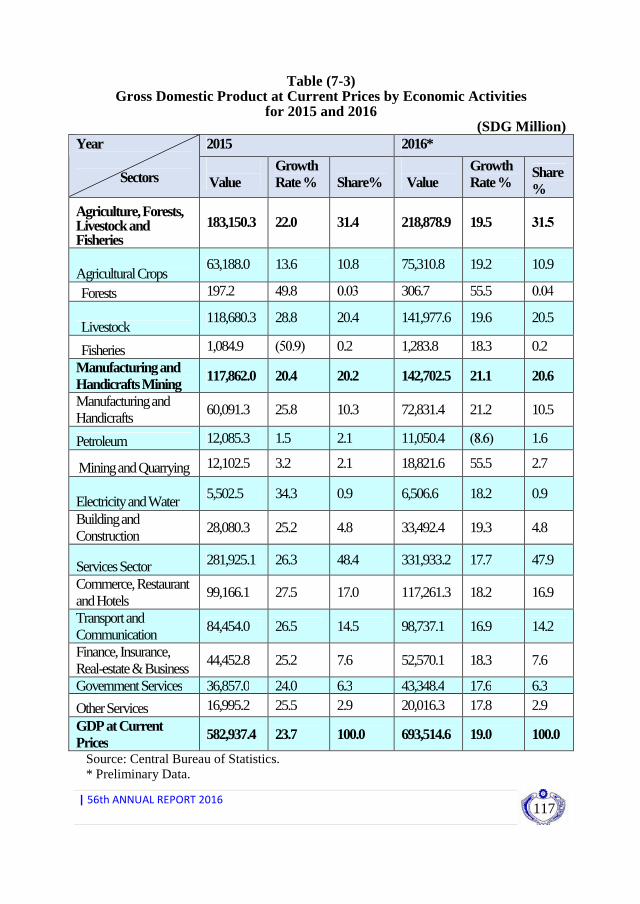
|56thANNUALREPORT2016
117
Table (7-3) Gross Domestic Product at Current Prices by Economic Activities
for 2015 and 2016 (SDG Million)
2015 2016* Year Sectors
Value
Growth Rate %
Share%
Value
Growth Rate %
Share %
Agriculture, Forests, Livestock and Fisheries
183,150.3 22.0 31.4 218,878.9 19.5 31.5
Agricultural Crops 63,188.0 13.6 10.8 75,310.8 19.2 10.9
Forests 197.2 49.8 0.03 306.7 55.5 0.04
Livestock 118,680.3 28.8 20.4 141,977.6 19.6 20.5
Fisheries 1,084.9 )50.9( 0.2 1,283.8 18.3 0.2
Manufacturing and Handicrafts Mining 117,862.0 20.4 20.2 142,702.5 21.1 20.6
Manufacturing and Handicrafts
60,091.3 25.8 10.3 72,831.4 21.2 10.5
Petroleum 12,085.3 1.5 2.1 11,050.4 )8.6( 1.6
Mining and Quarrying 12,102.5 3.2 2.1 18,821.6 55.5 2.7
Electricity and Water 5,502.5 34.3 0.9 6,506.6 18.2 0.9
Building and Construction
28,080.3 25.2 4.8 33,492.4 19.3 4.8
Services Sector 281,925.1 26.3 48.4 331,933.2 17.7 47.9
Commerce, Restaurant and Hotels
99,166.1 27.5 17.0 117,261.3 18.2 16.9
Transport and Communication
84,454.0 26.5 14.5 98,737.1 16.9 14.2
Finance, Insurance, Real-estate & Business
44,452.8 25.2 7.6 52,570.1 18.3 7.6
Government Services 36,857.0 24.0 6.3 43,348.4 17.6 6.3
Other Services 16,995.2 25.5 2.9 20,016.3 17.8 2.9
GDP at Current Prices 582,937.4 23.7 100.0 693,514.6 19.0 100.0
Source: Central Bureau of Statistics. * Preliminary Data.
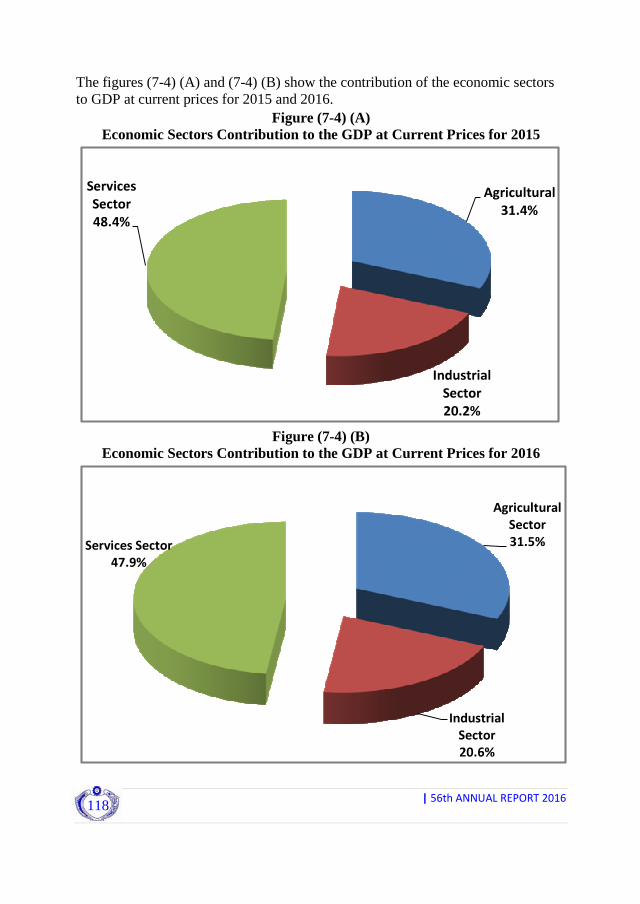
|56thANNUALREPORT2016
118
The figures (7-4) (A) and (7-4) (B) show the contribution of the economic sectors to GDP at current prices for 2015 and 2016.
Figure (7-4) (A) Economic Sectors Contribution to the GDP at Current Prices for 2015
Agricultural
31.4%
Industrial
Sector
20.2%
Services
Sector
48.4%
Figure (7-4) (B) Economic Sectors Contribution to the GDP at Current Prices for 2016
Agricultural
Sector
31.5%
Industrial
Sector
20.6%
Services Sector
47.9%
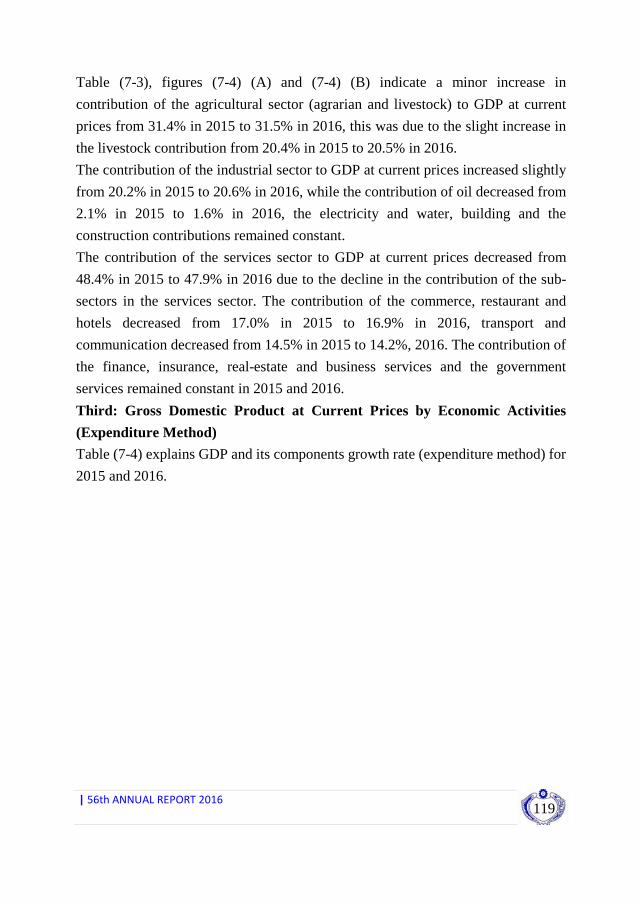
|56thANNUALREPORT2016
119
Table (7-3), figures (7-4) (A) and (7-4) (B) indicate a minor increase in
contribution of the agricultural sector (agrarian and livestock) to GDP at current
prices from 31.4% in 2015 to 31.5% in 2016, this was due to the slight increase in
the livestock contribution from 20.4% in 2015 to 20.5% in 2016.
The contribution of the industrial sector to GDP at current prices increased slightly
from 20.2% in 2015 to 20.6% in 2016, while the contribution of oil decreased from
2.1% in 2015 to 1.6% in 2016, the electricity and water, building and the
construction contributions remained constant.
The contribution of the services sector to GDP at current prices decreased from
48.4% in 2015 to 47.9% in 2016 due to the decline in the contribution of the sub-
sectors in the services sector. The contribution of the commerce, restaurant and
hotels decreased from 17.0% in 2015 to 16.9% in 2016, transport and
communication decreased from 14.5% in 2015 to 14.2%, 2016. The contribution of
the finance, insurance, real-estate and business services and the government
services remained constant in 2015 and 2016.
Third: Gross Domestic Product at Current Prices by Economic Activities
(Expenditure Method)
Table (7-4) explains GDP and its components growth rate (expenditure method) for
2015 and 2016.

|56thANNUALREPORT2016
120
Table ( 7-4 ) Gross Domestic Product at Current Prices by Expenditure Method
for 2015 and 2016 (SDG Million)
2015 2016* Year Expenditure type
Value
Growth Rate %
Share%
Value
Growth Rate %
Share %
Consumption 495,862.3 22.8 85.1 573,930.1 15.7 82.8
Government consumption 56,626.0 23.5 9.7 63,382.8 11.9 9.1
Private consumption 439,236.3 22.8 75.4 510,547.3 16.2 73.6
Investment 121,793.0 34.3 20.9 145,794.4 19.7 21.0
Government investment 16,379.0 180.0 2.8 25,950.5 58.4 3.7
Private investment 105,414.0 24.3 18.1 119,843.9 13.7 17.3
The net foreign transactions )34,718.6( 50.6 )6.0( )26,210.5( (24.5) (3.8)
Exports of goods and services 19,369.4 )6.1( 3.3 18,857.2 (2.6) 2.7
Imports of goods and services 54,088.0 23.8 9.3 45,067.7 (16.7) 6.5
GDP at Current Prices 582,937.4 23.7 100.0 693,514.0 19.0 100.0
Source: Central Bureau of Statistics. *Preliminarily Data. Table (7-4) shows a decline in the growth rate of GDP at current prices from 23.7% in 2015 to 19.0% in 2016, this was due to the decrease in growth rate of the total investment from 34.3% in 2015 to 19.7% in 2016, and the decrease in growth rate of the total consumption from 22.8% in 2015 to 15.7% in 2016. Investment Investment is defined as the capital expenditure on the new projects in the public utilities and infrastructures sectors, in addition to the expenditure on the projects related to the economic activities to produce goods and services in productive sectors such as the industrial, agricultural, housing, health, education and tourism, while the gross investment is defined as the total market value of the new establishments and durable goods in addition to change in value of the inventories of the business establishments.
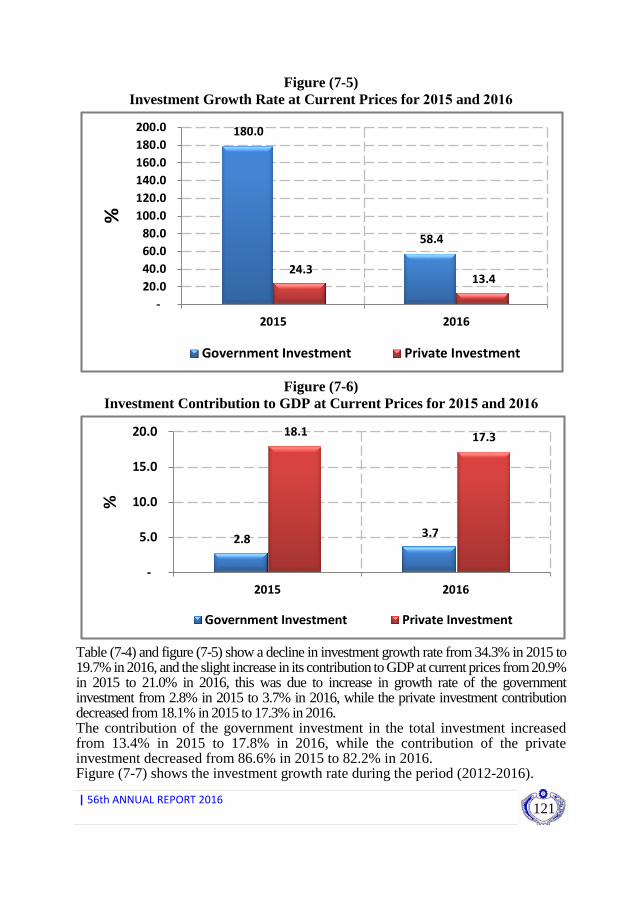
|56thANNUALREPORT2016
121
Figure (7-5) Investment Growth Rate at Current Prices for 2015 and 2016
180.0
58.4
24.313.4
-
20.0
40.0
60.0
80.0
100.0
120.0
140.0
160.0
180.0
200.0
2015 2016
%
Government Investment Private Investment
Figure (7-6) Investment Contribution to GDP at Current Prices for 2015 and 2016
2.83.7
18.117.3
-
5.0
10.0
15.0
20.0
2015 2016
%
Government Investment Private Investment
Table (7-4) and figure (7-5) show a decline in investment growth rate from 34.3% in 2015 to 19.7% in 2016, and the slight increase in its contribution to GDP at current prices from 20.9% in 2015 to 21.0% in 2016, this was due to increase in growth rate of the government investment from 2.8% in 2015 to 3.7% in 2016, while the private investment contribution decreased from 18.1% in 2015 to 17.3% in 2016. The contribution of the government investment in the total investment increased from 13.4% in 2015 to 17.8% in 2016, while the contribution of the private investment decreased from 86.6% in 2015 to 82.2% in 2016. Figure (7-7) shows the investment growth rate during the period (2012-2016).

|56thANNUALREPORT2016
122
Figure (7-7) The Investment Growth Rate During the Period (2012-2016)
26.1
31.234.2 34.3
19.7
0
10
20
30
40
2012 2013 2014 2015 2016
%
Investment Growth Rate
Figure (7-7) shows an increase in the investment growth rate during the period (2012-2015) from 26.1% in 2012 to 34.3% in 2015, and declined to 19.7% in 2016. The average growth rate during the period amounted to 29.1%. Consumption Consumption is divided into government and private, government consumption includes all current expenditures which includes workers' compensation, purchases of goods and services, transfers to states and management of government institutions , while the private consumption includes the consumption of all families and individuals. Figure (7-8) shows consumption growth rate at current prices for 2015 and 2016.
Figure (7-8) Consumption growth rate at Current Prices for 2015 and 2016
23.5
11.9
22.8
16.2
0
5
10
15
20
25
2015 2016
%
Government Consumption Private Consumption
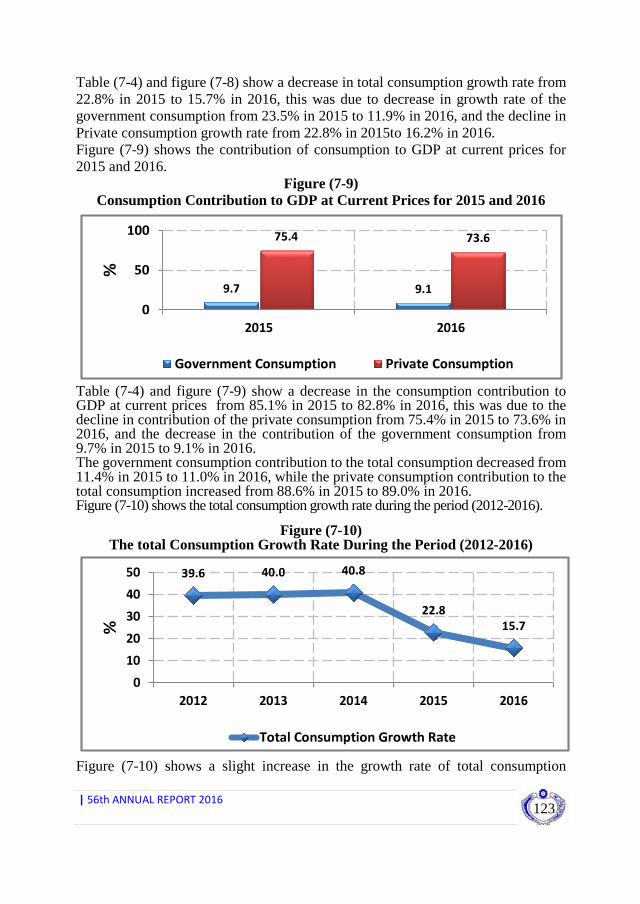
|56thANNUALREPORT2016
123
Table (7-4) and figure (7-8) show a decrease in total consumption growth rate from 22.8% in 2015 to 15.7% in 2016, this was due to decrease in growth rate of the government consumption from 23.5% in 2015 to 11.9% in 2016, and the decline in Private consumption growth rate from 22.8% in 2015to 16.2% in 2016. Figure (7-9) shows the contribution of consumption to GDP at current prices for 2015 and 2016.
Figure (7-9) Consumption Contribution to GDP at Current Prices for 2015 and 2016
9.7 9.1
75.4 73.6
0
50
100
2015 2016
%
Government Consumption Private Consumption
Table (7-4) and figure (7-9) show a decrease in the consumption contribution to GDP at current prices from 85.1% in 2015 to 82.8% in 2016, this was due to the decline in contribution of the private consumption from 75.4% in 2015 to 73.6% in 2016, and the decrease in the contribution of the government consumption from 9.7% in 2015 to 9.1% in 2016. The government consumption contribution to the total consumption decreased from 11.4% in 2015 to 11.0% in 2016, while the private consumption contribution to the total consumption increased from 88.6% in 2015 to 89.0% in 2016. Figure (7-10) shows the total consumption growth rate during the period (2012-2016).
Figure (7-10)
The total Consumption Growth Rate During the Period (2012-2016)
39.6 40.0 40.8
22.8
15.7
0
10
20
30
40
50
2012 2013 2014 2015 2016
%
Total Consumption Growth Rate
Figure (7-10) shows a slight increase in the growth rate of total consumption
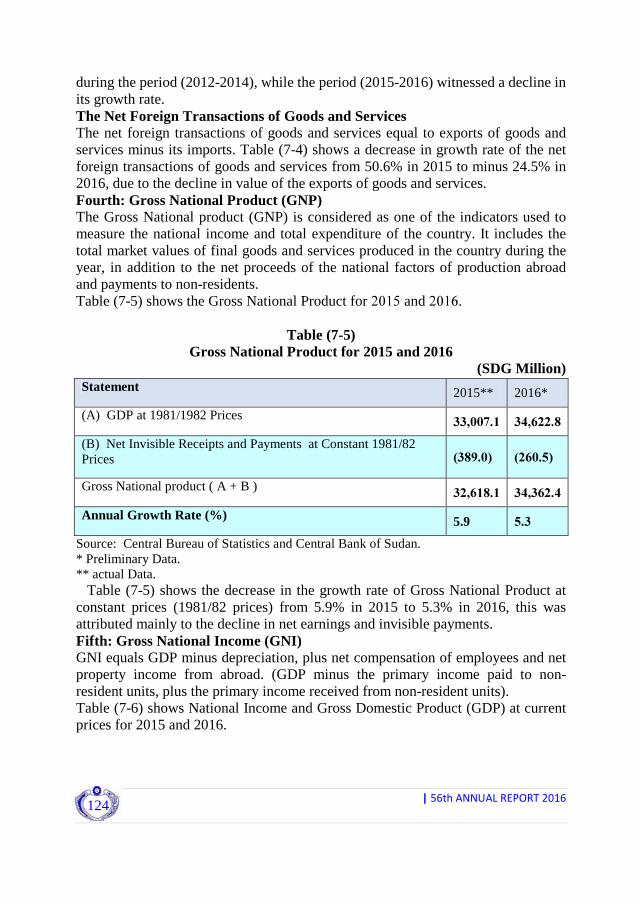
|56thANNUALREPORT2016
124
during the period (2012-2014), while the period (2015-2016) witnessed a decline in its growth rate. The Net Foreign Transactions of Goods and Services The net foreign transactions of goods and services equal to exports of goods and services minus its imports. Table (7-4) shows a decrease in growth rate of the net foreign transactions of goods and services from 50.6% in 2015 to minus 24.5% in 2016, due to the decline in value of the exports of goods and services. Fourth: Gross National Product (GNP) The Gross National product (GNP) is considered as one of the indicators used to measure the national income and total expenditure of the country. It includes the total market values of final goods and services produced in the country during the year, in addition to the net proceeds of the national factors of production abroad and payments to non-residents. Table (7-5) shows the Gross National Product for 2015 and 2016.
Table (7-5) Gross National Product for 2015 and 2016
(SDG Million)
Statement 2015** 2016*
(A) GDP at 1981/1982 Prices 33,007.1 34,622.8
(B) Net Invisible Receipts and Payments at Constant 1981/82 Prices )389.0( )260.5(
Gross National product ( A + B ) 32,618.1 34,362.4
Annual Growth Rate (%) 5.9 5.3
Source: Central Bureau of Statistics and Central Bank of Sudan. * Preliminary Data. ** actual Data. Table (7-5) shows the decrease in the growth rate of Gross National Product at constant prices (1981/82 prices) from 5.9% in 2015 to 5.3% in 2016, this was attributed mainly to the decline in net earnings and invisible payments. Fifth: Gross National Income (GNI) GNI equals GDP minus depreciation, plus net compensation of employees and net property income from abroad. (GDP minus the primary income paid to non-resident units, plus the primary income received from non-resident units). Table (7-6) shows National Income and Gross Domestic Product (GDP) at current prices for 2015 and 2016.

|56thANNUALREPORT2016
125
Table (7-6) Gross National Income and Gross Domestic Product at Current Prices
for 2015 and 2016 (SDG Millions)
Year GDP at Current price GNI GNI Growth Rate %
2015** 582,937.4 536,511.8 26.0
2016* 693,514.0 640,954.0 19.5
Source: Central Bureau of Statistics. * Preliminary Data. ** Actual Data. Table (7-6) shows the decrease in the growth rate of Gross National Income (GNI) growth rate from 26.0% in 2015 to 19.5% in 2016, this resulted mainly from the decrease in the net compensation of employees and net property income from aboard. Sixth: Price Indices and Inflation Rates Consumer Price Index (CPI) CPI) is an index measures the over-all changes on the prices of goods and services purchased by consumers over specific period of time. In other words, it is a measurement of the average change of prices on consumption items required on daily basis. Due to the change in the consumption pattern as a consequence of the fluctuation in the economic conditions, it is possible to substitute some commodities with others within the components of the consumers basket. In Sudan, there are 12 commodity groups includes foods and beverages, tobacco, clothing and footwear, housing, household, equipments, health, transport, communication, recreation and culture, education, hotels and restaurants and others. Average (CPI) by Commodity Groups and the Inflation Rates for 2015 and 2016. Table (7-7) shows average CPI by commodity groups and the inflation rates for 2015 and 2016 (base year 2007).
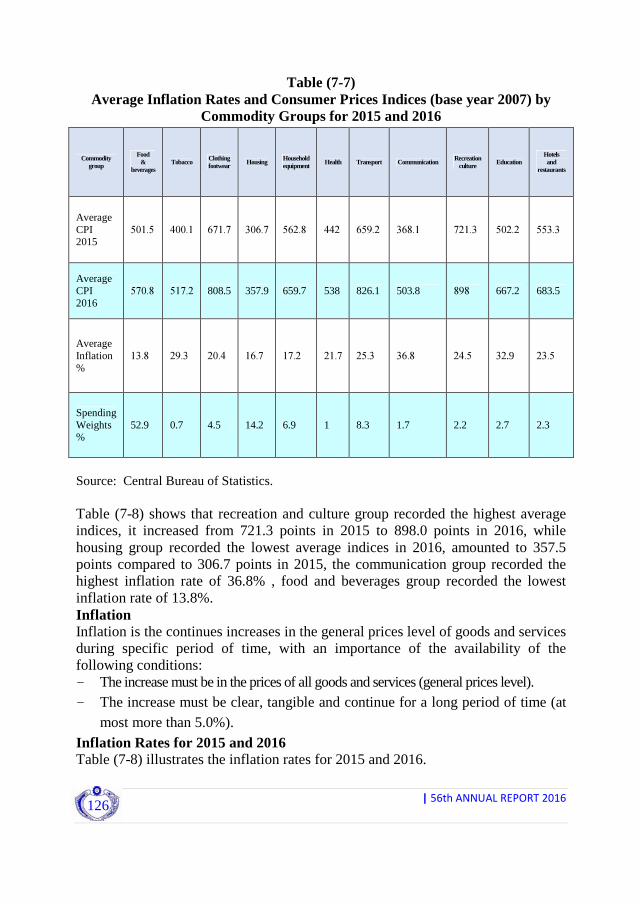
|56thANNUALREPORT2016
126
Table (7-7) Average Inflation Rates and Consumer Prices Indices (base year 2007) by
Commodity Groups for 2015 and 2016
Commodity group
Food &
beverages Tobacco Clothing
footwear Housing Household equipment Health Transport Communication Recreation
culture Education Hotels and
restaurants
Average CPI 2015
501.5 400.1 671.7 306.7 562.8 442 659.2 368.1 721.3 502.2 553.3
Average CPI 2016
570.8 517.2 808.5 357.9 659.7 538 826.1 503.8 898 667.2 683.5
Average Inflation %
13.8 29.3 20.4 16.7 17.2 21.7 25.3 36.8 24.5 32.9 23.5
Spending Weights %
52.9 0.7 4.5 14.2 6.9 1 8.3 1.7 2.2 2.7 2.3
Source: Central Bureau of Statistics. Table (7-8) shows that recreation and culture group recorded the highest average indices, it increased from 721.3 points in 2015 to 898.0 points in 2016, while housing group recorded the lowest average indices in 2016, amounted to 357.5 points compared to 306.7 points in 2015, the communication group recorded the highest inflation rate of 36.8% , food and beverages group recorded the lowest inflation rate of 13.8%. Inflation Inflation is the continues increases in the general prices level of goods and services during specific period of time, with an importance of the availability of the following conditions: - The increase must be in the prices of all goods and services (general prices level). - The increase must be clear, tangible and continue for a long period of time (at
most more than 5.0%). Inflation Rates for 2015 and 2016 Table (7-8) illustrates the inflation rates for 2015 and 2016.

|56thANNUALREPORT2016
127
Table (7-8) Inflation Rates for 2015 and 2016
(%)
Particular 2015 2016
Headline Inflation 16.9 17.8
Average Inflation Rate 17.3 17.6
Inflation rate by the End of the Year 12.6 30.5
Source: Central Bureau of Statistics.
Table (7-8) Shows that the headline inflation increased from 16.9% in 2015 to 17.8% in 2016, also the inflation rate by the end of the year increased from 12.6% by the end of December 2015 to 30.5% by the end of December 2016, due to the monetary expansion, the exchange rate amendment, the increase in the public expenditure and the gradual removal of the subsidies from the strategic commodities. The Trend of the Headline Inflation Rates during the Period (2012- 2016) Figure (7-11) depicts the trend of headline inflation rate during the period (2012-2016).
Figure (7-11) The Trend of the Headline Inflation Rate during (2012-2016)
Figure (7-11) shows that the headline inflation increased from 35.1% in 2012 to 37.1% in 2013, then declined to 16.9% in 2015, and increased to 17.8% in 2016. The average annual headline inflation rate recorded 27.2% during the period (2012-2016).
2013 2012 2014 2015 2016
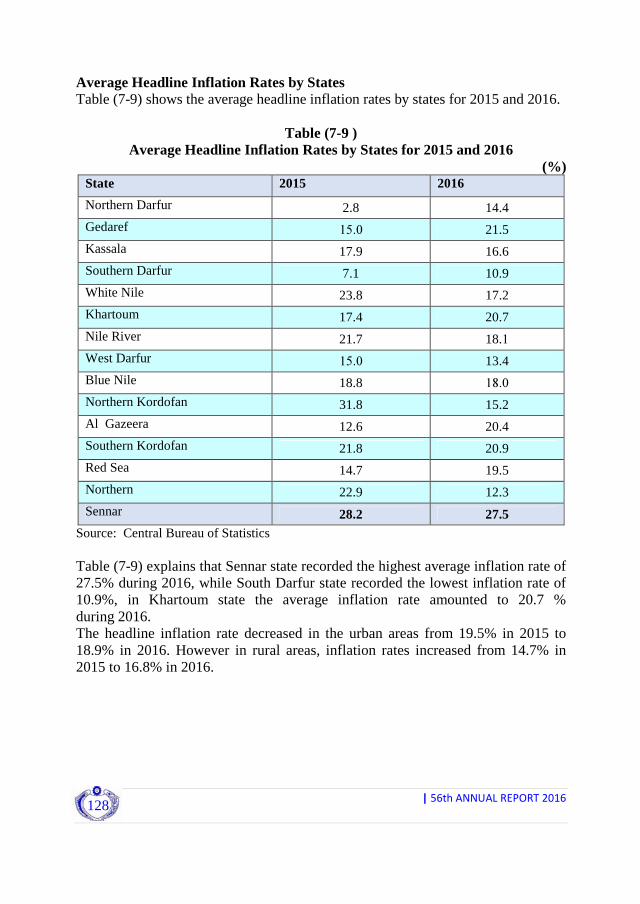
|56thANNUALREPORT2016
128
Average Headline Inflation Rates by States Table (7-9) shows the average headline inflation rates by states for 2015 and 2016.
Table (7-9 ) Average Headline Inflation Rates by States for 2015 and 2016
(%) State 2015 2016
Northern Darfur 2.8 14.4
Gedaref 15.0 21.5
Kassala 17.9 16.6
Southern Darfur 7.1 10.9
White Nile 23.8 17.2
Khartoum 17.4 20.7
Nile River 21.7 18.1
West Darfur 15.0 13.4
Blue Nile 18.8 18.0
Northern Kordofan 31.8 15.2
Al Gazeera 12.6 20.4
Southern Kordofan 21.8 20.9
Red Sea 14.7 19.5
Northern 22.9 12.3
Sennar 28.2 27.5 Source: Central Bureau of Statistics Table (7-9) explains that Sennar state recorded the highest average inflation rate of 27.5% during 2016, while South Darfur state recorded the lowest inflation rate of 10.9%, in Khartoum state the average inflation rate amounted to 20.7 % during 2016. The headline inflation rate decreased in the urban areas from 19.5% in 2015 to 18.9% in 2016. However in rural areas, inflation rates increased from 14.7% in 2015 to 16.8% in 2016.
PRODUCTION

|56thANNUALREPORT2016
130

|56thANNUALREPORT2016
131
Production
This chapter deals with the performance of the real economy which includes the agricultural Sector; consisting both Agrarian and Animal sub-sectors; The Industrial Sector which includes: petroleum, mining, quarrying, processing industries, water and electricity; while the Services Sector comprises several important sub-sectors; including health, education, transport, telecommunications, roads, bridges together with hotels and tourism services. The following is an overview of the performance of the respective sectors during 2015 and 2016:- First: The Agricultural Sector: The Agricultural Sector includes: agrarian, animal and fisheries production. The contribution of the agricultural sector to the Gross Domestic Product increased from 29.4% in 2015 to 30.1% in 2016; while the rate of growth increased from 2.8% in 2015 to 6.1% in 2016. Below is a resume of the performance of the main components of this sector:- Agrarian Production:- Agrarian Production comprises rain fed (traditional and mechanized), irrigated agriculture and forestry. The main crops produced are: cotton, gum Arabic, food crops and oil seeds.
Table (8-1)
The Cultivated Areas during Seasons 2014/2015 and 2015/2016 (Area in Millions Feddans)
sector Irrigated agriculture
Rain fed agriculture
Total cultivated area
2014/2015 3.8 50.5 54.3 2015/2016* 3.6 39.6 43.2
Rate of change% (5.3) (21.6) (20.4) Source: Ministry of Agriculture and Irrigation - General Department for Planning and Agricultural Economics *Preliminary Data.
Table (8-1) shows a reduction in total cultivated areas by 20.4% from 54.3 million feddans in season 2014/2015 to 43.2 million feddans in season 2015/2016, mainly due to 21.6% drop in rain fed agricultural areas from 50.5 million feddans in season 2014/2015 to 39.6 million feddans in season 2015/2016; in addition to 5.3% drop in irrigated agricultural areas from 3.8 million feddans in season 2014/2015 to 3.6 million feddans in season 2015/2016.
Below is an analysis of performance of production in the agricultural sector:-

|56thANNUALREPORT2016
132
Production of the main crops during 2015/2016 Season:- The 2015/2016 agricultural season witnessed a significant improvement in production; the 5 years Economic Reform Program (2015-2019); which emphasized the production and productivity of the agricultural sector to achieve self – sufficiency and increase exports. a-Gum Arabic: Table (8-2) shows the Gum Arabic production in the two years 2015/2016; while figure (8-1) indicates the general trend for Gum Arabic production during the period (2011-2015).
Table (8-2) Gum Arabic Production for 2015 and 2016
(Thousand Metric Tons) Year
Crop 2015 *2016 Contribution % change
% Gum Talh 18.90 58.45 66.7 209.3 Gum Hashab 16.85 26.01 29.7 54.3 Gum Luban 1.81 2.32 2.6 28.3 Gum Kakamot 0.65 0.88 1.0 36.7 Total 38.21 87.66 100 129.4 Source: Ministry of Forestry, Environment and Urban Development - National forests Agency *Preliminary Data. Table (8-2) shows an increase of 129.4% in the production of all types of Gum Arabic from 38.21 thousand tons in 2015 to 87.66 thousand tons in 2016.
Figure (8-1)
General Trend for Gum Arabic Production during the Period (2011-2016)
Figure (8-1) indicates an upward trend in the overall production of Gum Arabic with its peak in 2013; this situation was attributed to the policies adopted by the

|56thANNUALREPORT2016
133
Council of Gum Arabic; reflected in the attention given to gum Arabic production, The support of producers throughout the stages of production, storage and processing; besides focusing on the quality of the Gum Arabic and the improvement of its standard specifications. However; the years 2014 and 2015 witnessed a drop in the general trend followed by a rise in 2016. b- Cotton: Table (8-3) illustrates the areas under cotton cultivation and its production in (2014/2015 and 2015/2016)seasons, while figure (8-2) displays the general trend for cotton production during (2012-2016).
Table (8-3) Cotton Cultivated Areas and Production during 2014/2015 and 2015/2016 seasons
Area: thousands feddans), (production: thousands tons), (Productivity: tons / feddans)
2014/2015 season 2015/2016* season
Cultivated area Production Productivity
** Cultivated
area Production Productivity **
176 176 1.0 222 205 1.01 Source: Ministry of Agriculture and Irrigation - General Department for Planning and Agricultural Economics *Preliminary Data. **Productivity is a result of dividing production by the harvested area, which is sometimes different from the cultivated area. Table (8-3) shows that cotton production rose by 16.5% from 176 thousand tons in season 2014/2015 to 205 thousand tons in season 2015/2016; as a result of 8.8% increase in the cultivated area from 176 thousand feddans in season 2014/2015 to 222 thousand feddans in 2015/2016 season.
Figure (8-2) The General Trend in Cotton Production
during (2011-2016)
Figure (8-2) shows a continuous upward trend that denominated cotton production during the (2011-2016); as a result of the application of modern technologies in cotton cultivation.

|56thANNUALREPORT2016
134
C-Main food crops:- The staple food crops are mainly sorghum (dura), wheat and millet. Table (8-4) shows the production of food crops in the two seasons 2014/2015 and 2015/2016;
whereas figure (8-4) presents the general trend for the production of staple food crops during (2011-2016).
Table (8-4) Production of Staple Food Crops for the two Seasons 2014/2015,
2015/2016* Cultivated areas (thousands/feddans), Production (thousands/metric tons), Productivity kg/feddans)
Sorghum Millet Wheat Crop
season
Cultivated area
Production Productivity** Cultivate area
Production Productivity** Cultivated area
Production Productivity**
2014/2015 24,808 6,208 306 9,826 1,084 158 564 473 884
2015/2016* 19,832 2,744 222 7,120 486 120 548 779 1,400
change% )20.1( )55.8( )27.5( )27.5( )55.2( )24.1( )2.8( 64.7 58.4
Source : Ministry of Agriculture and Irrigation - General Department for Planning and Agricultural Economics *Preliminary data. ** Productivity is a result of dividing production by the harvested area.
Figure (8-3) The Production of the Main Food Crops For the Seasons 2014/2015 and 2015/2016
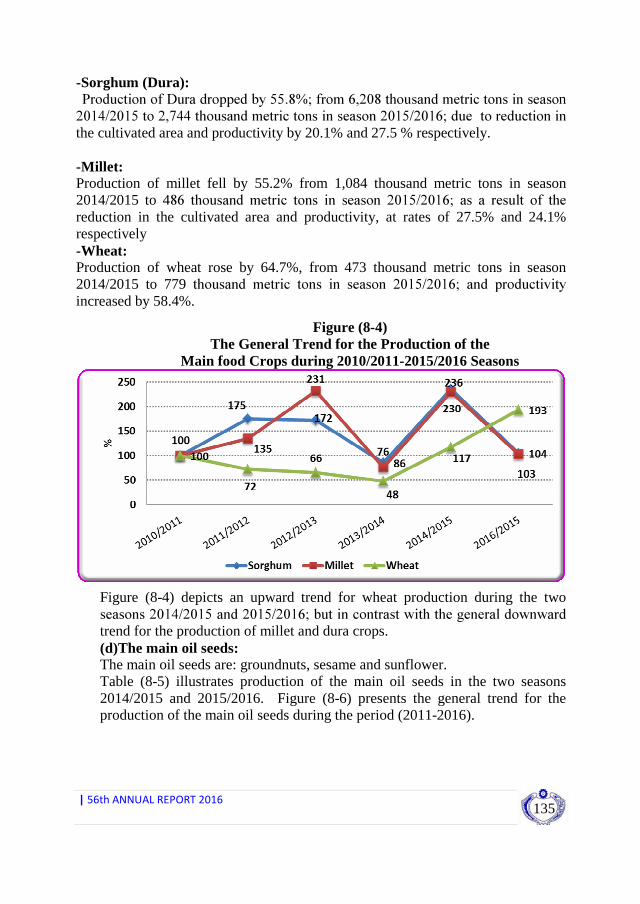
|56thANNUALREPORT2016
135
-Sorghum (Dura): Production of Dura dropped by 55.8%; from 6,208 thousand metric tons in season
2014/2015 to 2,744 thousand metric tons in season 2015/2016; due to reduction in the cultivated area and productivity by 20.1% and 27.5 % respectively.
-Millet: Production of millet fell by 55.2% from 1,084 thousand metric tons in season 2014/2015 to 486 thousand metric tons in season 2015/2016; as a result of the reduction in the cultivated area and productivity, at rates of 27.5% and 24.1% respectively -Wheat: Production of wheat rose by 64.7%, from 473 thousand metric tons in season 2014/2015 to 779 thousand metric tons in season 2015/2016; and productivity increased by 58.4%.
Figure (8-4) The General Trend for the Production of the
Main food Crops during 2010/2011-2015/2016 Seasons
Figure (8-4) depicts an upward trend for wheat production during the two seasons 2014/2015 and 2015/2016; but in contrast with the general downward trend for the production of millet and dura crops. (d)The main oil seeds: The main oil seeds are: groundnuts, sesame and sunflower. Table (8-5) illustrates production of the main oil seeds in the two seasons 2014/2015 and 2015/2016. Figure (8-6) presents the general trend for the production of the main oil seeds during the period (2011-2016).
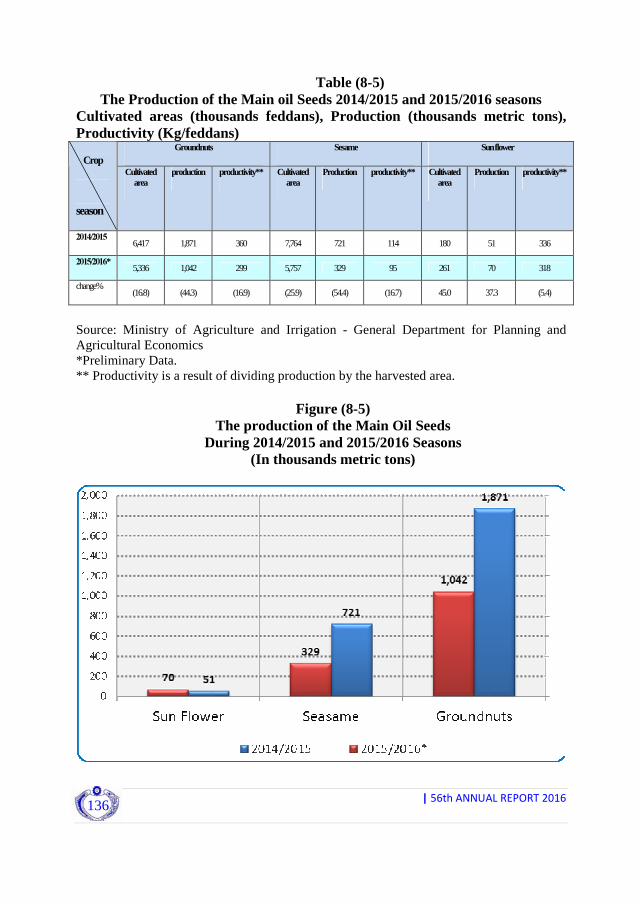
|56thANNUALREPORT2016
136
Table (8-5) The Production of the Main oil Seeds 2014/2015 and 2015/2016 seasons
Cultivated areas (thousands feddans), Production (thousands metric tons), Productivity (Kg/feddans)
Groundnuts Sesame Sun flower Crop
season
Cultivated area
production productivity** Cultivated area
Production productivity** Cultivated area
Production productivity**
2014/2015 6,417 1,871 360 7,764 721 114 180 51 336
2015/2016* 5,336 1,042 299 5,757 329 95 261 70 318
change% (16.8) (44.3) (16.9) (25.9) (54.4) (16.7) 45.0 37.3 (5.4)
Source: Ministry of Agriculture and Irrigation - General Department for Planning and Agricultural Economics *Preliminary Data. ** Productivity is a result of dividing production by the harvested area.
Figure (8-5)
The production of the Main Oil Seeds During 2014/2015 and 2015/2016 Seasons
(In thousands metric tons)

|56thANNUALREPORT2016
137
-Groundnuts: Production of groundnuts declined by 44.3% from 1,871 thousand metric tons in 2014/2015 to 1,042 thousand metric tons in 2015/2016; due to a reduction in the cultivated area by 16.8% and deterioration in productivity by 16.9%. -Sesame: Production of sesame fell by 54.4% from 721 thousand metric tons in season 2014/2015 to 329 thousand metric tons in season 2015/2016; because of reduction in the cultivated area by 25.9% and a drop in productivity by 16.7%.
-Sunflower: Production of sunflower increased by 37.3% from 51 thousand metric tons in season 2014/2015 to 70 thousand metric tons in 2015/2016; which resulted from the expansion in the cultivated area by 45%.
Figure (8-6)
General Trend of changes in the Production of the Main Oil Seeds (2011-2016)
Figure (8-6) shows a downward trend for the production of sesame and groundnuts during 2015/2016 season; because of volatility in rates of rainfall and contraction in the cultivated areas. The production of sunflower on the other hands witnessed an upward trend in 2015/2016 season. 2- Animal Resources and their by-product:- Production of animal resources comprises various kinds of: livestock, fish, and poultry in addition to their by-products such as meat, milk, hides and eggs.
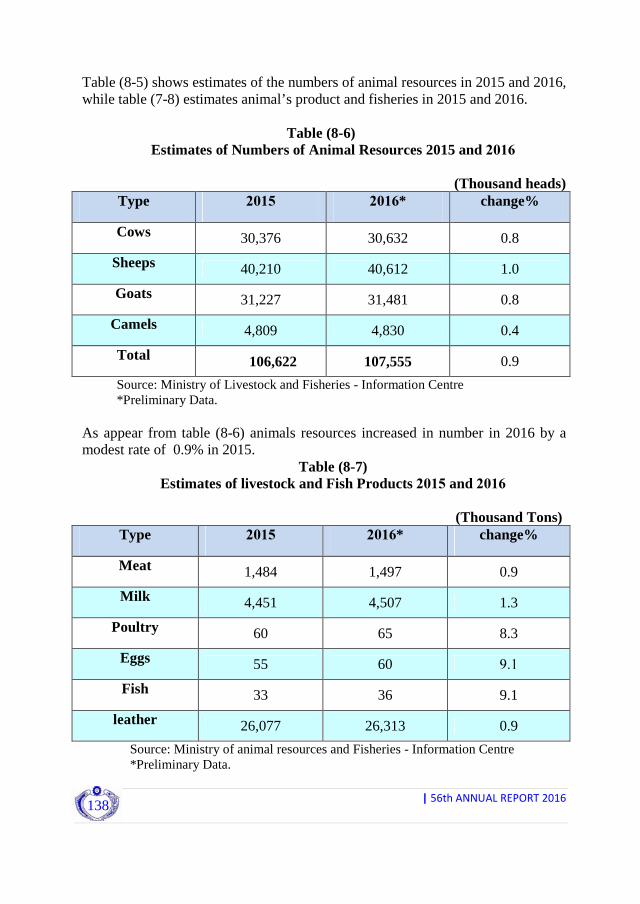
|56thANNUALREPORT2016
138
Table (8-5) shows estimates of the numbers of animal resources in 2015 and 2016, while table (7-8) estimates animal’s product and fisheries in 2015 and 2016.
Table (8-6)
Estimates of Numbers of Animal Resources 2015 and 2016
(Thousand heads) Type 2015 2016* change%
Cows 30,376 30,632 0.8
Sheeps 40,210 40,612 1.0
Goats 31,227 31,481 0.8
Camels 4,809 4,830 0.4
Total 106,622 107,555 0.9
Source: Ministry of Livestock and Fisheries - Information Centre *Preliminary Data.
As appear from table (8-6) animals resources increased in number in 2016 by a modest rate of 0.9% in 2015.
Table (8-7) Estimates of livestock and Fish Products 2015 and 2016
(Thousand Tons)
Type 2015 2016* change%
Meat 1,484 1,497 0.9
Milk 4,451 4,507 1.3
Poultry 60 65 8.3
Eggs 55 60 9.1
Fish 33 36 9.1
leather 26,077 26,313 0.9
Source: Ministry of animal resources and Fisheries - Information Centre *Preliminary Data.

|56thANNUALREPORT2016
139
In 2016, all animal products registered varying increases; where production of eggs and fish achieved the highest rate of increase of 9.1% above other animal products; followed by poultry, milk,, meat and hides at 8.3%, 1.3% and 0.9% respectively. Second: The Industrial Sector:- The Industrial Sector comprises: petroleum, mining, quarrying, processing industries, handicrafts, water and electricity. The contribution of the industrial sector to the Gross Domestic Product rose slightly from 26% in 2015 to 26.1% in 2016.
The following is a review of the important sub-sectors of the industrial sector:- (1)Crude Oil and its products:- Table (8-8) and figure show the production of crude oil and its products for 2015 and 2016, and figure (7-8) shows the contribution of oil products in total petroleum products, while figure (8-8) displays the general trend for the production of petroleum products.
Table (8-8)
Production of Crude Oil and its Products 2015 and 2016* 2015 2016 Year
Item
production contribution% production contribution% Change
%
Crude oil* 28.7 - 31.0 - 8
Oil derivatives Gasoline 1,906.0 45.7 1,666.1 40.3 (12.6) Kerosene 1,037.9 24.9 1,196.3 29.0 15.3 Furnace 304.0 7.3 373.2 9.0 22.8 Benzene 293.8 7 .0 294.0 7.1 0.1 Butagas 284.5 6.8 299.4 7.2 5.2 Nafta 207.73 5.6 134.6 7.1 (35.2) Jet 118.5 2.9 155.9 3.8 31.6 Heavy gasoline
17.4 0.4 10.9 0.3 (37.4)
Petroleum coal
17.4 0.4 - - -
total 4,187.2 100.0 4,130.4 100.0 (1.4) Source: Sudanese Petroleum Corporation – Ministry of Petroleum *crude oil data in million barrels.
Table (8-8) indicates 8% rise in crude oil production, from 28.7 million barrels in 2015 to 31 million barrels in 2016; though, total production of petroleum products fell by 1.4% from 4,187.2 thousand metric tons in 2015 to 4,130.4 thousand metric tons in 2016.

|56thANNUALREPORT2016
140
Table (8-8) illustrates an increase in the production of; benzene, Butagas, heavy gasoline, petroleum coal and jet, by 15.3%, 22.8%, 0.1%, 5.2% and 31.6%, respectively. The production of gasoline, furnace, kerosene, fell by 12.6%, 35.2%, and 37.4%, respectively.
Figure (8-7) The Contribution of Petroleum Products in total
Petroleum Production in 2016
Figure (8-8) The General Trend for the Production of Petroleum Products
(2011-2016)
Figure (8-8) displays fluctuating changes in the production rate for petroleum products, where production deteriorated during ( 2012 – 2014) due to lack of the

|56thANNUALREPORT2016
141
availability of sufficient crude oil for the refineries in the production areas, however production increased in 2015 and 2016 as a result of several agreements concluded with the government of Southern Sudan. 2-Minerals and other products: The companies involved in the mining of gold, production in 2016 amounted to 15 tons in 2016, produced about 93.4 tons of which the share of concession companies amounted to 6.0 tons, traditional mining recorded 78.2 tons and 9.2 tons of fossil gold.
Table (8-9) The Production of Minerals and Other Products for 2015 and 2016
(Production by ton) Change% 2016* 2015 Production
13.3 93.4 82.4 Gold (74.5) 3,862 15,143 Chrome (68.8) 9,800 31,400 Manganese 617.7 104,000** 14,490 Kaolin 1347.0 349,236 24,136 Gypsum 1009.4 223,397 20,136 Salt
NA NA NA Mica NA NA NA Marble(Cubic meters) 37.8 3,874,447 2,810,956 Clinker NA NA NA Iron
226.4 92,172 28,238 Feldspar 42 4,250 3,000 Talc NA NA 46 Zinc
Source: Ministry of Mining Table (8-9) shows production of minerals and other products in 2015 and 2016. Table (8-9) depicts a notable increase in the production of gold, kaolin, gypsum, clinker, feldspar and talc, by: 14.22%, 617.7%, 134.7%, 37.8%, 226.4% and 42.0% respectively; the production of other minerals declined significantly due to the increase in cost of production and deterioration of international prices, for some minerals. 3-Processing industries:- The processing industries play significant role; in achieving value added to the various sectors, providing job opportunities and enhancing the competitive capabilities of national products; The contribution of the sectors as in 2015 to the Gross National Product remained at 13.4% in 2016. The following is a review of the performance of the most important processing industries:
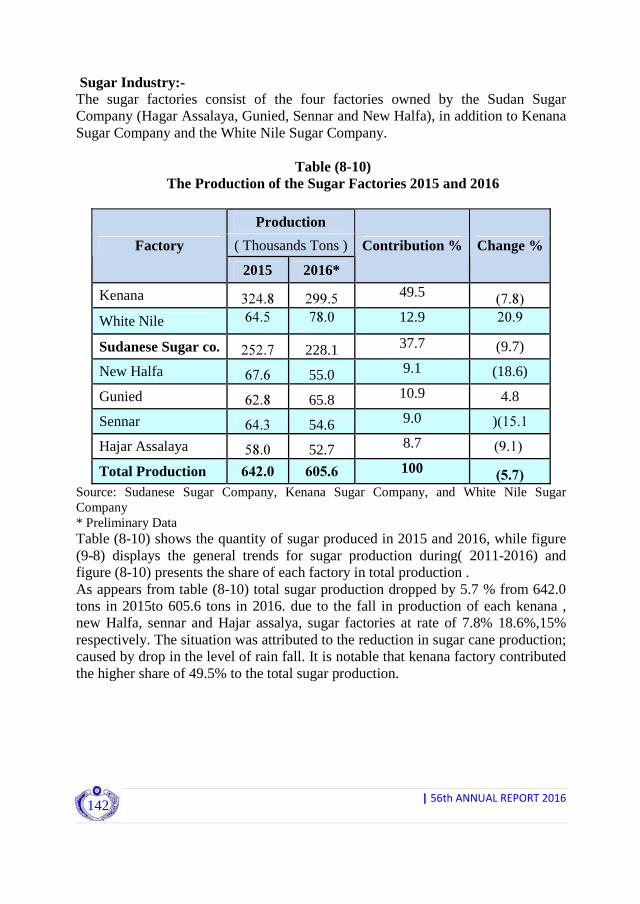
|56thANNUALREPORT2016
142
Sugar Industry:- The sugar factories consist of the four factories owned by the Sudan Sugar Company (Hagar Assalaya, Gunied, Sennar and New Halfa), in addition to Kenana Sugar Company and the White Nile Sugar Company.
Table (8-10)
The Production of the Sugar Factories 2015 and 2016
Production
( Thousands Tons ) Factory
2015 2016*
Contribution % Change %
Kenana 324.8 299.5 49.5 )7.8(
White Nile 64.5 78.0 12.9 20.9
Sudanese Sugar co. 252.7 228.1 37.7 (9.7)
New Halfa 67.6 55.0 9.1 (18.6)
Gunied 62.8 65.8 10.9 4.8
Sennar 64.3 54.6 9.0 ) 15.1(
Hajar Assalaya 58.0 52.7 8.7 ) 9.1(
Total Production 642.0 605.6 100 )5.7(
Source: Sudanese Sugar Company, Kenana Sugar Company, and White Nile Sugar Company * Preliminary Data Table (8-10) shows the quantity of sugar produced in 2015 and 2016, while figure (9-8) displays the general trends for sugar production during( 2011-2016) and figure (8-10) presents the share of each factory in total production . As appears from table (8-10) total sugar production dropped by 5.7 % from 642.0 tons in 2015to 605.6 tons in 2016. due to the fall in production of each kenana , new Halfa, sennar and Hajar assalya, sugar factories at rate of 7.8% 18.6%,15% respectively. The situation was attributed to the reduction in sugar cane production; caused by drop in the level of rain fall. It is notable that kenana factory contributed the higher share of 49.5% to the total sugar production.
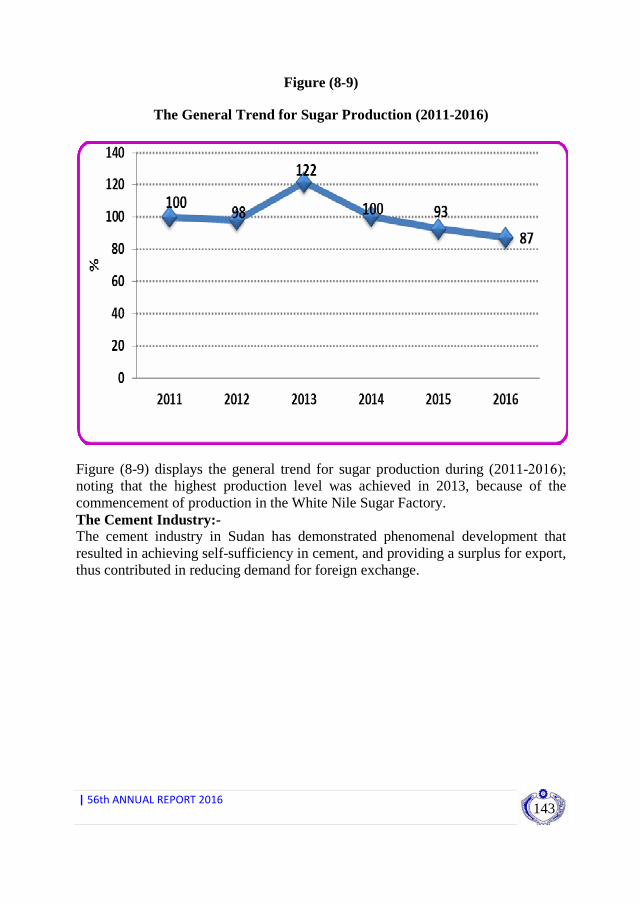
|56thANNUALREPORT2016
143
Figure (8-9)
The General Trend for Sugar Production (2011-2016)
Figure (8-9) displays the general trend for sugar production during (2011-2016); noting that the highest production level was achieved in 2013, because of the commencement of production in the White Nile Sugar Factory. The Cement Industry:- The cement industry in Sudan has demonstrated phenomenal development that resulted in achieving self-sufficiency in cement, and providing a surplus for export, thus contributed in reducing demand for foreign exchange.
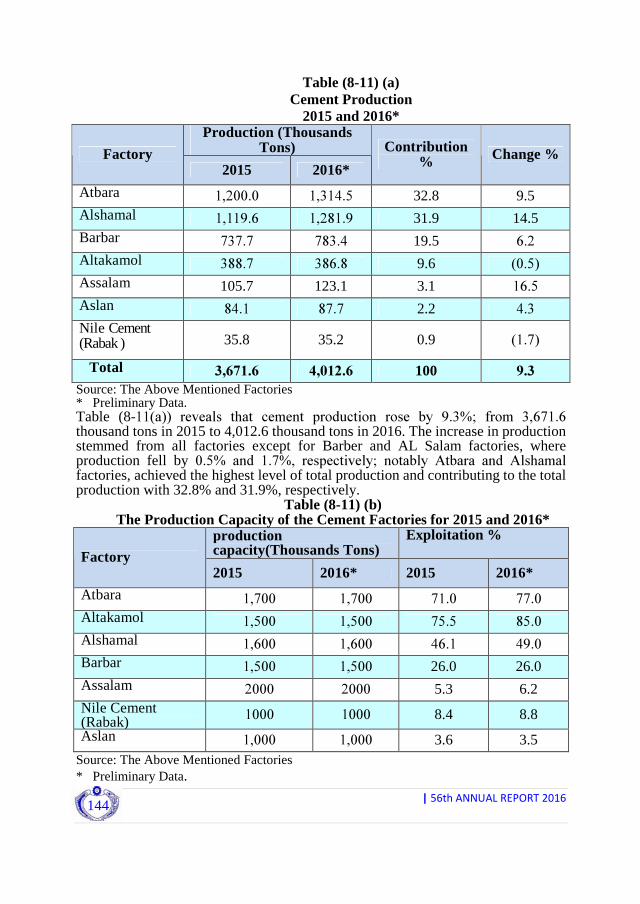
|56thANNUALREPORT2016
144
Table (8-11) (a) Cement Production
2015 and 2016* Production (Thousands
Tons) Factory 2015 2016*
Contribution % Change %
Atbara
1,200.0 1,314.5 32.8 9.5 Alshamal 1,119.6 1,281.9 31.9 14.5 Barbar 737.7 783.4 19.5 6.2 Altakamol 388.7 386.8 9.6 )0.5( Assalam 105.7 123.1 3.1 16.5 Aslan 84.1 87.7 2.2 4.3 Nile Cement (Rabak ) 35.8 35.2 0.9 )1.7(
Total 3,671.6 4,012.6 100 9.3 Source: The Above Mentioned Factories * Preliminary Data. Table (8-11(a)) reveals that cement production rose by 9.3%; from 3,671.6 thousand tons in 2015 to 4,012.6 thousand tons in 2016. The increase in production stemmed from all factories except for Barber and AL Salam factories, where production fell by 0.5% and 1.7%, respectively; notably Atbara and Alshamal factories, achieved the highest level of total production and contributing to the total production with 32.8% and 31.9%, respectively.
Table (8-11) (b) The Production Capacity of the Cement Factories for 2015 and 2016*
production capacity(Thousands Tons)
Exploitation %
Factory 2015 2016* 2015 2016*
Atbara
1,700 1,700 71.0 77.0 Altakamol 1,500 1,500 75.5 85.0 Alshamal 1,600 1,600 46.1 49.0 Barbar 1,500 1,500 26.0 26.0 Assalam 2000 2000 5.3 6.2 Nile Cement (Rabak) 1000 1000 8.4 8.8
Aslan 1,000 1,000 3.6 3.5 Source: The Above Mentioned Factories * Preliminary Data.

|56thANNUALREPORT2016
145
The exploited capacity in 2016 was declined for all cement factories expect for Atbara and Alshamal. This could be attributed to many factors, the important ones include increase in the price of ferns and other energy source, such as the electric power beside the difficulties in importing the spare parts due the American economic embargo.
Figure (8-10) The General Trend for Cement Production (2011-2016)
Figure (8-10) depicts fluctuations in the general trend for cement production (2011-2016); where the upward trend for production is noticeable during the period; except for the two years 2012 and 2014.
Figure (8-11)
The Contribution of Cement Factories to Total Production in 2016

|56thANNUALREPORT2016
146
4- The pharmaceutical industry:- The important pharmaceutical products include: tablets, capsules and suspensions (powder and liquids).
Table (8-12) The Production of Pharmaceuticals in 2015 and 2016
Products Unit 2015 2016* Change%
Human Medicines
Tablets million tablets 2,017 1,089 -46.0
Capsules million capsules 391 395 1
Liquid Suspensions
million bottles 35 15 -57.1
Drink Suspensions
million bottles 7 29 314.3
Vena solution million bottles 0 654 0
Medical Injection million injection 20 40 100
Powder million sachet 0 172 0
Ointments Thousand tube 0 33 0
Dialysis fluids Thousand bottles 10 liter 209 247 18.2
Veterinary Drugs
Drink uspensions
Thousand bottles 0 924 0
Injection million bottles 0 2,568 0
Powder Thousand kilo 0 138 0 Source: Ministry of Industry * Preliminary Data.

|56thANNUALREPORT2016
147
Table (8-12) indicates an increase in the production of various types of human medicines, except for the production of tablets and liquid suspensions; where the production of tablets decreased by 45.6% from 2,017 million tablets in 2015 to 1098 million tablets in 2016. 5- The Other Processing Industries:- Table (8-13) displays the production of the other processing industries in 2015 and 2016.
Table (8-13)
The Production of the Other Processing Industries In 2015 and 2016
Item Unit 2015 2016* Change %
Ethanol Million liter 36 24 (33.3)
School Exercise-books Million Dozens 15 NA (100)
School books Million Book 30 NA (100)
Edible Oil Thousand Ton 148 256 73.0
Soft drinks Million liter 455 434 (4.6)
Wheat Floor Thousands Ton 2,000 2,126 6.3
Sweets & Tahnia Thousand Ton NA NA NA Refrigerators Thousand Unit 119 141 18.5 Biscuits Thousand Ton NA NA NA Jams Thousand Ton NA 14 NA Iron (Steel Bars) Thousand Ton 624 NA NA Water Coolers & Air Conditioners
Thousand Unit 280 189 (32.5)
Paints Thousand Ton 100 NA NA Ceramics Million (M 3) 11.5 18 56.5 Source: Ministry of Industry * Preliminary Data.
Table (8-13) shows a noticeable decrease in the production of the most of the other processing industries in 2016 compared with 2015 except: edible-oils, flour, refrigerators, ceramics, and porcelain; whose production increased, by 73%, 6.3%, 18.5% and 56.5% respectively. 6-Giad industrial Town:- Table (8-14) displays the production of metal industries in the 2015 and 2016.
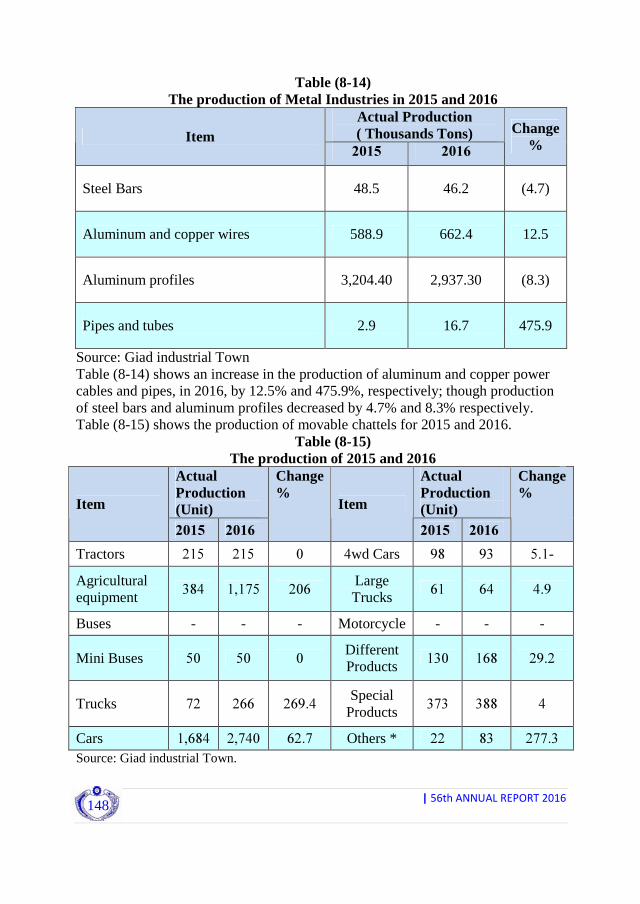
|56thANNUALREPORT2016
148
Table (8-14) The production of Metal Industries in 2015 and 2016
Actual Production ( Thousands Tons) Item 2015 2016
Change %
Steel Bars 48.5 46.2 (4.7)
Aluminum and copper wires 588.9 662.4 12.5
Aluminum profiles 3,204.40 2,937.30 (8.3)
Pipes and tubes 2.9 16.7 475.9
Source: Giad industrial Town Table (8-14) shows an increase in the production of aluminum and copper power cables and pipes, in 2016, by 12.5% and 475.9%, respectively; though production of steel bars and aluminum profiles decreased by 4.7% and 8.3% respectively. Table (8-15) shows the production of movable chattels for 2015 and 2016.
Table (8-15) The production of 2015 and 2016
Actual Production (Unit)
Actual Production (Unit) Item
2015 2016
Change %
Item
2015 2016
Change %
Tractors 215 215 0 4wd Cars 98 93 -5.1
Agricultural equipment
384 1,175 206 Large Trucks
61 64 4.9
Buses - - - Motorcycle - - -
Mini Buses 50 50 0 Different Products
130 168 29.2
Trucks 72 266 269.4 Special
Products 373 388 4
Cars 1,684 2,740 62.7 Others * 22 83 277.3 Source: Giad industrial Town.

|56thANNUALREPORT2016
149
Table (8-15) illustrates noticeable increase in the production of all types of locomotives; with the exception of four-wheel drive cars, which production decreased by 5.1%. 6- Electricity and water:- a- Electricity:- Five specialized companies are engaged in production and distribution of electricity namely: Merawi Dam electricity company ltd, Sudanese Hydro Generation Company ltd, Sudanese Thermal Generation Company ltd, Sudanese Electricity Transmission Company Ltd and Sudanese Electricity Distribution Company ltd. The following is an over view of the performance of generated and consumed electric power in 2015 and 2016:- Electric power generation:- Table (8-16) shows electric power generated in Sudan in 2015 and 2016; whereas, figure (8-12) presents the contribution of the sources of generates electric power to total electric power generated in 2016.
Table (8-16) Electric Power Generated in 2015 and 2016
(Giga Watt/ hr)
Generated Power 2015 2016* Contribution %
Change %
Water Generation 8,365.8 8,051.4 54.1 (3.8) Thermal Generation 4,636.1 6,379.6 42.9 37.6 Steam 3,054.3 4,360.5 29.3 42.8 B. Gas - 102.3 0.7 - C. Diesel 277.8 330.1 2.2 18.8 D. Combined 1,304 1,586.7 10.7 21.7 Ethiopian Transmission 130.8 440 3.0 236.4 Total Generated Power 13,132.7 14,871 100 13.2 Source: Ministry of Water Resources and Electricity * Preliminary Data.
Figure (8-12) The Contribution of Electric power Generation Sources
in total Electric Power Generated in 2016

|56thANNUALREPORT2016
150
Table (8-16) indicates an increase by 13.2% in total electric power generated in 2016, from 13,132.7 giga watt/hr in 2015 to 14,871 giga watt/hr in 2016;which is attributable to 37.6% increase in the volume of power generated from thermal generation; from 4,636.1 giga watt/hr in 2015 to 6379.6 giga watt/hr in 2016, representing 42.9% contribution rate to total electric power generated in 2016; in addition to a rise in Ethiopian transmission by 236.4%; while water generation fell by 3%. -Electric Power Consumption:- Table (8-17) shows power consumption by sectors in 2015 and 2016; while figure (8-13) illustrates electric power consumption by sectors in 2016.
Table (8-17) Consumed Electric Power by Sectors in 2015 and 2016
(Giga watt/hr)
Sector 2015 2016* Consumption Share % Change%
Residential 5,955.1 6,693.3 56.7 12.4
Industrial 1,500.3 1,794.1 15.2 19.6
Agricultural 646.1 718.9 6.1 11.3
Governmental 1,060.4 1,115.1 9.5 5.2
Standardized ** 1,328.8 1,474.1 12.5 10.9
Total 10,490.7 11,795.5 100 12.4 Source: Ministry of Water Resources and Electricity. * Preliminary Data ** Includes Commercial and Light Freight Sectors.
Figure (8-13) Electrical Power Consumption by Sectors in 2016
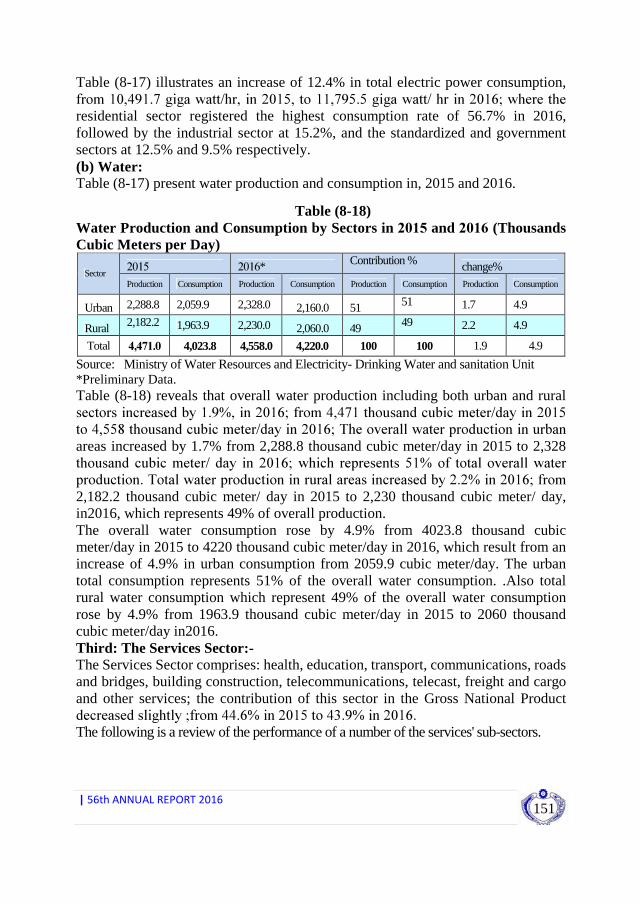
|56thANNUALREPORT2016
151
Table (8-17) illustrates an increase of 12.4% in total electric power consumption, from 10,491.7 giga watt/hr, in 2015, to 11,795.5 giga watt/ hr in 2016; where the residential sector registered the highest consumption rate of 56.7% in 2016, followed by the industrial sector at 15.2%, and the standardized and government sectors at 12.5% and 9.5% respectively. (b) Water: Table (8-17) present water production and consumption in, 2015 and 2016.
Table (8-18) Water Production and Consumption by Sectors in 2015 and 2016 (Thousands Cubic Meters per Day)
2015 2016* Contribution % change% Sector
Production Consumption Production Consumption Production Consumption Production Consumption
Urban 2,288.8 2,059.9 2,328.0 2,160.0 51 51 1.7 4.9
Rural 2,182.2 1,963.9 2,230.0 2,060.0 49 49 2.2 4.9
Total 4,471.0 4,023.8 4,558.0 4,220.0 100 100 1.9 4.9
Source: Ministry of Water Resources and Electricity- Drinking Water and sanitation Unit *Preliminary Data. Table (8-18) reveals that overall water production including both urban and rural sectors increased by 1.9%, in 2016; from 4,471 thousand cubic meter/day in 2015 to 4,558 thousand cubic meter/day in 2016; The overall water production in urban areas increased by 1.7% from 2,288.8 thousand cubic meter/day in 2015 to 2,328 thousand cubic meter/ day in 2016; which represents 51% of total overall water production. Total water production in rural areas increased by 2.2% in 2016; from 2,182.2 thousand cubic meter/ day in 2015 to 2,230 thousand cubic meter/ day, in2016, which represents 49% of overall production. The overall water consumption rose by 4.9% from 4023.8 thousand cubic meter/day in 2015 to 4220 thousand cubic meter/day in 2016, which result from an increase of 4.9% in urban consumption from 2059.9 cubic meter/day. The urban total consumption represents 51% of the overall water consumption. .Also total rural water consumption which represent 49% of the overall water consumption rose by 4.9% from 1963.9 thousand cubic meter/day in 2015 to 2060 thousand cubic meter/day in2016. Third: The Services Sector:- The Services Sector comprises: health, education, transport, communications, roads and bridges, building construction, telecommunications, telecast, freight and cargo and other services; the contribution of this sector in the Gross National Product decreased slightly ;from 44.6% in 2015 to 43.9% in 2016. The following is a review of the performance of a number of the services' sub-sectors.

|56thANNUALREPORT2016
152
(a)Health:- Health institutions include local hospitals, family health centers and basic health units (health clinics, dressing points and primary health units). Table (8-18) displays the numbers of health institutions in Sudan in 2015 and 2016.
Table (8-19) Health Institutions in Sudan - 2015 and 2016
(Unit) 2015 2016* Year
State
Local hospitals
Number of beds Citizen/bed Health
centres
Basic health units
Local hospitals
Number of beds Citizen/bed Health
centres
Basic health units
North 29 105 136 270 1,571 33 43 235 311 1,571
River Nile 31 120 29 180 1,846 37 217 89 343 1,825
Khartoum 20 79 88 187 1,199 28 95 23 146 1,208
Red Sea 28 73 245 346 1,339 31 68 234 333 854
Kassla 16 138 127 281 1,135 26 112 115 253 1,135
AL-Gedaref 44 - - 44 5,339 48 65 167 280 6,821
Al-Gazira 74 237 229 540 4,097 65 464 425 954 3,927
Sennar 25 40 60 125 492 26 112 223 361 1,456
Blue Nile 23 - - 23 1,614 30 136 33 199 1,613
White Nile 3 - - 3 1,318 3 50 56 109 500
North Kordofan 21 26 107 154 1,745 22 26 107 155 1,745
South Kordofan 11 62 98 171 632 7 62 98 167 1,174
North Darfur 8 2 3 13 527 8 79 101 188 438
West Kordofan 9 26 17 52 873 4 129 115 248 852
South Darfur 5 - - 5 413 9 40 40 89 438
West Darfur 5 - - 5 347 9 40 40 89 347
Middle Darfur 13 24 56 93 465 13 24 56 93 465
East Darfur 4 29 11 44 6 36 11 53 258
Total 369 961 1,206 2,536 25,912 405 1,798 2,168 4,371 26,627
Source: Federal Ministry of Health – Health Information and Research Unit.. * Preliminary Data Table (8-19) reveals a rise in the number of local hospitals by 9.8% in 2016; from 369 hospital in 2015 to 405 hospital in 2016; the number of beds rose by 87.1% in 2016; from 1,206 thousand beds in 2015 to 1,798 thousand beds in 2016 and the

|56thANNUALREPORT2016
153
number of health centres increased by 72.4% in 2016; from 2,536 health centers in 2015 to 4,371 health centers in 2016; The number of basic health units increased by 2.8% in 2016, from 25,912 basic health units, in 2015 to 26,627 basic health units in 2016. (b)Education:- The educational sector in Sudan comprises general education and higher education. Table (8-19) illustrates the numbers of pupils enrolled in government and private schools in respect of each of the basic and secondary school stages, for the two school years, 2014/2015 and 2014/2016.
Table (8-20) The Number of Pupils Enrolled in Public and Private Schools
In Each of the two School years 2014/2015 and 2015/2016 School Year 2014/2015 2015 /2016 *
No. of Students (1000’s Students)
No. of Students (1000’s Students)
Absorption rate% )1 ( 2015/2016* Item No. of Schools
Male Female
No. of Schools
Male Female Male Female Primary Stage Governmental 14,723 2,691 2,421 15,584 2,721 2,468 Non Governmental
2,566 241 192 3,296 293 247
Total 17,289 2,933 2,613 18,880 3,014 2,715
72.5 68.4
Secondary Stage Governmental Academic
3,406 378 419 2,852 357 374
Non Governmental non Academic
712 101 91 1,237 100 89
Technical 122 27 13 108 25 7 Islamic Studies 34 2 0 77 7 1 Total 4,274 508 523 4,274 489 471
36.0 37.4
Source: Ministry of Education * Preliminary Data.
1Absorption rate % = number of students/population in the same age group (ages 6-13 basic stage from age 14
– 16 for secondary).

|56thANNUALREPORT2016
154
Table (8-21) The Number of Students registered in Public and Private Universities and
Colleges in the two Academic years 2014/2015 and 2015/2016 (Unit)
2014/2015 2015 /2016 *
BSc Students Diploma students BSc Students Diploma
students
Year
Institution Male Female Male Female
Total
Male Female Male Female
Total
Governmental Universities& Technical Colleges
80,069 80,813 31,666 20,468 213,016 62,166 63,317 23,373 19,773 168,629
Private Universities & Colleges
25,028 18,769 6,182 3,996 53,975 24,443 20,190 6,097 5,214 55,944
105,097 99,582 37,848 24,464 86,609 83,507 29,470 24,987 Grand total
204,679 62,312 266,991
170,116 54,457 224,573
Source: Ministry of Higher Education and Scientific Research * Preliminary Data.
Table (8-21) shows an increase of 7.4% in the total number of schools at the basic and secondary levels from 21566 schools in 2014/15 school year to 23154 schools in 2015/16 school year which led to an increase of 1.7% in the total number of pupils; at the two levels of which the number of pupils of the basic level rose by 3.3% from 5545 thousand in 2014/15 school year to 5729 thousand in 2015/16 school year. The number of students at the secondary level dropped by 6.9% from 1031 thousand pupils in 2014/15 school year to 960 thousand pupils in 2015/16 school year. As appears from table (8-21) the number of students registered for a baccalaureate degree increased by 1.8% from 167.38 students in 2014/15 academic year to 170116 students in 2015/16 academic year and the number of students registered for the diplomas increase by 1.0 % from 53906 students in 2014/15 to 54457 students in 2015/16 academic year.
C-Transport and communications:- This sector comprises means of transport in Sudan, including road, sea, river and air. Table (8-21) gives the volume of goods and the number of passengers carried by the above means of transport.

|56thANNUALREPORT2016
155
Table (8-22) Performance of The means of Transport of Goods and Passengers in
2015 and 2016
2015 2016* Change% Transport Goods
in Thousands tons
Passengers in thousands
Goods in Thousands tons
Passengers in thousands
Goods %
Passengers %
Land Transport
13,684 19,174 14,086 25,703 3 34.1
Sudan Railways
718 179 618 210 )14( 17.3
Air Transport**
33 2,717 30 2,927 )9( 7.7
Sudan Shipping Line
1,820 25 - - - NA
River Transport***
25 12 - - - NA
Total 16,280 22,107 14,734 28,840 )9( 30.5 Source: Ministry of Transport , Roads and bridges - Land Transport unit , Sudan Railways Corporation, Khartoum International Airport Co. , Nile Company for River Transport and Transport Associations * Preliminary Data. ** (Includes Lorries, Trucks, petroleum and liquid transportation means, Minibuses and Buses). -Road Transport:- The volume of goods conveyed by road transport increased by 3%; from 13,684 thousand tons in 2015 to 14,086 thousand tons in 2016; the number of passengers increased by 34.1% from 19,179 thousand passengers in 2015 to 25,703 thousand passengers in 2016. -Sudan Railways:- The volume of goods transported by Sudan railways dropped by 14%, in 2016; from 718 thousand tons in 2015 to 618 thousand tons in 2016; on the other hand, the number of railway passengers rose by 17.3% in 2016; from 179 thousand passengers in 2015 to 201 thousand passengers in 2016; due to the introduction of new passenger trains, in addition to the rehabilitation of some old railway lines. -Air Transport:- The volume of cargo carried by all national and foreign airlines through Khartoum International Airport decreased by 9 % in 2016; from 33 thousand tons, in 2015, to 30 thousand tons in 2016; but the number of passengers increased by 7.7% in 2016; from 2,717 thousand passengers in 2015 to 2,927 thousand passengers in 2016.
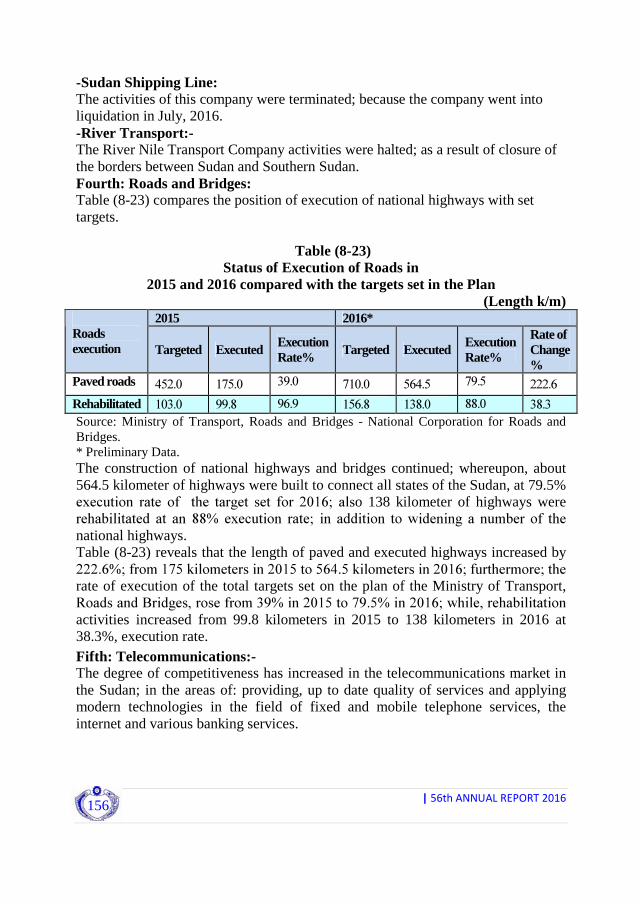
|56thANNUALREPORT2016
156
-Sudan Shipping Line: The activities of this company were terminated; because the company went into liquidation in July, 2016. -River Transport:- The River Nile Transport Company activities were halted; as a result of closure of the borders between Sudan and Southern Sudan. Fourth: Roads and Bridges: Table (8-23) compares the position of execution of national highways with set targets.
Table (8-23)
Status of Execution of Roads in 2015 and 2016 compared with the targets set in the Plan
(Length k/m) 2015 2016*
Roads execution Targeted Executed
Execution Rate%
Targeted Executed Execution Rate%
Rate of Change %
Paved roads 452.0 175.0 39.0 710.0 564.5 79.5 222.6
Rehabilitated Roads
103.0 99.8 96.9 156.8 138.0 88.0 38.3 Source: Ministry of Transport, Roads and Bridges - National Corporation for Roads and Bridges. * Preliminary Data. The construction of national highways and bridges continued; whereupon, about 564.5 kilometer of highways were built to connect all states of the Sudan, at 79.5% execution rate of the target set for 2016; also 138 kilometer of highways were rehabilitated at an 88% execution rate; in addition to widening a number of the national highways. Table (8-23) reveals that the length of paved and executed highways increased by 222.6%; from 175 kilometers in 2015 to 564.5 kilometers in 2016; furthermore; the rate of execution of the total targets set on the plan of the Ministry of Transport, Roads and Bridges, rose from 39% in 2015 to 79.5% in 2016; while, rehabilitation activities increased from 99.8 kilometers in 2015 to 138 kilometers in 2016 at 38.3%, execution rate.
Fifth: Telecommunications:- The degree of competitiveness has increased in the telecommunications market in the Sudan; in the areas of: providing, up to date quality of services and applying modern technologies in the field of fixed and mobile telephone services, the internet and various banking services.

|56thANNUALREPORT2016
157
Table (8-23) Subscribers of Telecommunications Companies and the Internet
In 2015 and 2016
1,000 Subscribers Company
2015 2016*
Change %
Sudan Telecommunication Co. (Sudatel) 7,653 7,818 2.2 Thabit Co. 91 89 (2.2) Sudani Co. for Telecommunications 7,562 7,729 2.2 (ZAIN) Co. for Telecommunications 11,909 12,588 5.7 (MTN) Co. for Mobile-phone Services 8,467 7,491 (11.5) CANAR Co. for Telecommunications 27 48 77.8 Internet Services Subscribers 11,677 10,231 (12.4)
Source: National Telecommunication Corporation * Preliminary Data – Until Sep 2016.
Figure (8-14)
Telecommunications and Internet Subscribers in 2015 and 2016
The Sudanese Telecommunications Co. (Sudatel) comprises Thabit telecommunications Co. and Sudani Telecommunications Co. The number of its subscriber increased by 2.2%, from 7,653 thousand subscribers in 2015, to 7,818 thousand in 2016; also, the
number of subscribers in Zain and Canar companies rose by 5.7% and 77.8%, respectively. The number of subscribers in MTN declined by 11.5%; similarly the total
number of internet users decreased by 12.4% from 11,677 thousand declined in 2015, to 10,231 thousand subscribers in 2016.
2015 2016

|56thANNUALREPORT2016
158
Sixth: Hotel Services and Tourism:- The tourism sector is considered one of the more important sources of foreign exchange, both on the global and local levels. In this regard and within the framework of a plan aimed at diversifying and generating additional resources, the Ministry of Tourism and other related government units and organizations, gave significant attention towards the development of tourism and archaeological areas in the Sudan to attract greater numbers of tourists and visitors. Table (8-24) explains the number of tourists and their expenditures in 2015 and 2016.
Table (8-24)
The Numbers of Tourists and their Spending for 2015 and 2016
Item 2015 2016 * Rate of Change %
Number of tourists (tourist) 741,000 799,644 7.9
Tourists Spending (US $ million) 930.7 982.7 5.6 Source: The Ministry of tourism, Relics and wildlife * Preliminary Data.
Table (8-24) indicates an increase by 7.9% in the number of tourists; from 741,000 tourists in 2015 to 799,644 tourist in 2016; together with an increase by 5.6% in travel receipts, including tourism; from US$930.7 million in 2015 to US$ 982.7 million in 2016.
|56thANNUALREPORT2016
159
FOREIGN TRADE

|56thANNUALREPORT2016
160
|56thANNUALREPORT2016
161
Foreign Trade
Foreign trade is considered as vital sector for countries, it links them with each
other, it is a mechanism to achieve economic growth, and helps in increasing
prosperity of nations by providing varies options in the production, consumption
and investment.
This chapter presents in some details the volume of foreign trade between republic
of Sudan and the rest of the world.
Republic of Sudan foreign trade policy for 2016 aimed to increase non-oil exports
through issuing policies to encourage non-oil exports (gold, metals, livestock, oil
seeds, gum arabic, fodder, and industrial exports), in addition to improve the
competitiveness of exports in general and open new markets, also the policies
aimed at rationalizing imports through reducing the imports of luxury and non-
essential goods that can be produced locally.
The government also emphasized the organization of border trade, and enhancing
the economic cooperation with the Common Market for Eastern and Southern
Africa (COMESA) and Greater Arab Free Trade Area (GAFTA); in order to open
more markets for Sudanese exports.
First: Trade Balance:
Table and figure (9-1) show trade balance for 2015 and 2016.

|56thANNUALREPORT2016
162
Table (9-1) Trade Balance for 2015 and 2016*
(US $ Millions)
YEARS Change %
2016* 2015 Particulars
(2.4) 3,093.6 3,169.0 Exports (F.O.B)
(46.5) 335.7 627.2 Oil Exports
8.5 2,757.9 2,541.8 Non-oil Exports
(12.5) 8,323.4 9,509.1 Imports (C.I.F)
(17.5) (5,229.8) (6,340.1) Trade Balance Source: Sudan Customs Authority and ministry of petroleum. * Preliminary data.
As shown in table (9-1) trade balance improved by17.5% from a deficit of US $ 6,340.1 million in 2015 to a deficit of US $ 5,229.8 million in 2016, this was due to the decline in the value of imports by 12.5%.
Figure (9-1) Trade Balance for 2015 and 2016
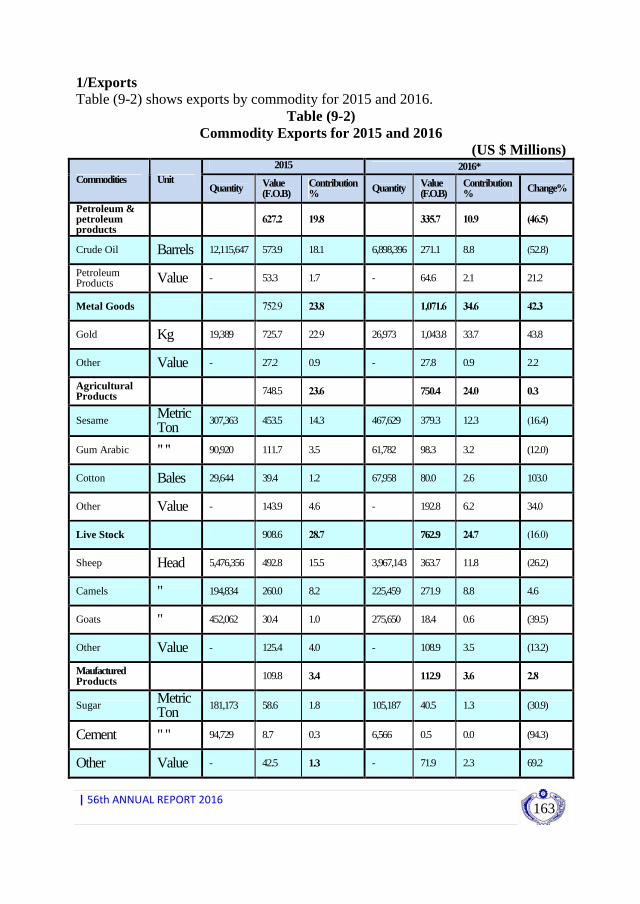
|56thANNUALREPORT2016
163
1/Exports Table (9-2) shows exports by commodity for 2015 and 2016.
Table (9-2) Commodity Exports for 2015 and 2016
(US $ Millions) 2015 2016*
Commodities Unit Quantity Value
(F.O.B) Contribution % Quantity Value
(F.O.B) Contribution % Change%
Petroleum & petroleum products
627.2 19.8 335.7 10.9 )46.5(
Crude Oil Barrels 12,115,647 573.9 18.1 6,898,396 271.1 8.8 (52.8)
Petroleum Products Value - 53.3 1.7 - 64.6 2.1 21.2
Metal Goods 752.9 23.8 1,071.6 34.6 42.3
Gold Kg 19,389 725.7 22.9 26,973 1,043.8 33.7 43.8
Other Value - 27.2 0.9 - 27.8 0.9 2.2
Agricultural Products 748.5 23.6 750.4 24.0 0.3
Sesame Metric Ton
307,363 453.5 14.3 467,629 379.3 12.3 (16.4)
Gum Arabic " " 90,920 111.7 3.5 61,782 98.3 3.2 (12.0)
Cotton Bales 29,644 39.4 1.2 67,958 80.0 2.6 103.0
Other Value - 143.9 4.6 - 192.8 6.2 34.0
Live Stock 908.6 28.7 762.9 24.7 )16.0(
Sheep Head 5,476,356 492.8 15.5 3,967,143 363.7 11.8 (26.2)
Camels " 194,834 260.0 8.2 225,459 271.9 8.8 4.6
Goats " 452,062 30.4 1.0 275,650 18.4 0.6 (39.5)
Other Value - 125.4 4.0 - 108.9 3.5 (13.2)
Maufactured Products 109.8 3.4 112.9 3.6 2.8
Sugar Metric Ton
181,173 58.6 1.8 105,187 40.5 1.3 (30.9)
Cement " " 94,729 8.7 0.3 6,566 0.5 0.0 (94.3)
Other Value - 42.5 1.3 - 71.9 2.3 69.2

|56thANNUALREPORT2016
164
2015 2016* Commodities Unit
Quantity Value (F.O.B)
Contribution % Quantity Value
(F.O.B) Contribution % Change%
Other Exports Value - 22 0.7 - 60.1 1.9 173.2
Non- Oil Export Total 2,541.80 80.2 2,757.9 89.1 8.5
Grand Total 3,169.0 100 3,093.6 100 (2.4)
Source: Sudan Customs Authority and Ministry of Petroleum. * Preliminary Data. Table (9-2) shows a decrease in the value of exports from US $ 3,169.0 million in 2015 to US $ 3,093.6 million in 2016 by 2.4% . Petroleum Exports: The value of petroleum exports declined from US $ 627.2 million in 2015 to US $ 335.7 million in 2016 by 46.5%, where as the value of crude oil exports decreased from US $ 573.9 million in 2015 to US $ 271.1 million in 2016 due to the decline in quantities and prices, while the value of other petroleum products exports increased by 21.2% as a result of increase in quantities. Non – Oil Exports: The non-oil exports increased from US $ 2,541.8 million in 2015 to US $ 2,757.9 million in 2016, by 8.5% due to the increase in the value of metal, manufactured, and agriculture commodities, beside some other exports, despite the slight decrease in the value of livestock exports by 16%. Metal Commodities: The metal commodities exports increased from US $ 752.9 million in 2015 to US $ 1,071.6 million in 2016, by 42.3% as a result of the increase in the gold exports from US $ 725.7 million in 2015 to US $ 1,043.8 million in 2016, by 43.8% (not including the gold for manufacturing), this was attributed to the increase in quantities of gold exports from 19,389 kg in 2015 to 26,973 kg in 2016. Agricultural Exports: The value of agricultural exports increased from US $ 748.5 million in 2015 to U$ 750.4 million in 2016 by 0.3%, due to increase in value of cotton exports by 103%, despite of the decline in sesame exports by 16.4% as a result of decline in prices. Also the value of Gum Arabic exports decreased by 12.0% as a result of decrease in quantities. Livestock: The value of Livestock exports declined from US $ 908.6 million in 2015 to US $ 762.9 million in 2016 by 16.0%, as a result of decline in the value of goat and sheep exports by 39.5% and 26.2% respectively due to decline in quantity exported.

|56thANNUALREPORT2016
165
Manufactured Products: The value of manufactured products exports increased from US $ 109.8 million in 2015 to US $ 112.9 million in 2016 by 2.8%.
Figure (9-2) Commodity Structure of Non-oil
Exports for 2015 and 2016
Figure (9-3) Contribution of Exports in 2016
Figure (9-3) explains that the contribution of metal commodities exports represent the highest ratio of total exports 34.6%, followed by livestock and fisheries 24.3%,

|56thANNUALREPORT2016
166
agricultural commodities 24.3%, petroleum exports 10.9%, manufactured products 3.6%, and other exports 1.9%. 2/ Imports: Table (9-3) shows imports by commodity for 2015 and 2016.
Table (9-3) Imports by Commodity for 2015 and 2016
(US $ Million) 2015 2016*
Commodities Unit Quantity
Value (CIF)
Contribution %
Quantity Value (CIF)
Contribution %
Change %
Foodstuffs: 2,132.9 22.4 1,775.4 21.3 ) 16.8( Wheat M.T 1,522,731 532.2 5.6 1,343,681 449.0 5.4 )15.6( Wheat flower " " 441,389 223.6 2.3 608,497 287.3 3.5 28.5 Sugar " " 1,299,255 550.1 5.8 611,984 272.6 3.3 )50.4( Animal Fats and Edible Oils
" " 273,946 243.2 2.6 244,689 197.2 2.4 )18.9(
Other Foodstuffs
value - 583.8 6.1 - 569.3 6.8 (2.5)
Manufactured goods
" - 1,941.3 20.4 - 1,749.6 21.0 )9.9(
Machinery and Equipment
" - 1,649.7 17.3 - 1,613.3 19.4 )2.2(
Raw materials
" - 1,446.9 15.2 - 918.2 11.0 )36.5(
Of which: Petroleum Commodities
" - 1,189.4 12.5 - 687.5 8.2 )42.2(
Other Raw materials
value
- 257.5 2.7 - 230.7 2.8 )10.4(
Means of transport
" - 910.6 9.6 - 915.5 11.0 0.5
Chemicals Products
" - 929.0 9.8 - 869.1 10.4 )6.4(
Of which: Medicines
" - 461.0 4.9 - 385.4 4.6 )16.4(
Other Chemicals Commodities
" - 468.0 4.9 - 483.7 5.8 3.4
Textiles " - 395.3 4.2 - 378.5 4.6 )4.2( Beverages and Tobacco
" - 79.3 0.8 - 80.2 1.0 1.1
Other Commodities
" - 24.2 0.3 - 23.6 0.3 )2.5(
Grand Total 9,509.1 100 8,323.4 100 (12.5) Source: Sudan Customs Authority and Ministry of Petroleum. * Preliminary Data.

|56thANNUALREPORT2016
167
Figure (9-4) Commodity Structure of Imports for 2015 and 2016
Table (9-3) explains a decrease of imports value (CIF) from US $ 9,509.1 million in 2015 to US $ 8,323.4 million in 2016 by 12.5%, due to the decline in the imports of manufactures, chemicals, raw materials, textiles, machinery and equipments, and other commodities. Foodstuffs: The value of foodstuffs imports declined from US $ 2,132.9 million in 2015 to US $ 1,775.5 million in 2016 by 16.8%, due to a decrease in the value of wheat imports from US $ 532.2 million in 2015 to US $ 449.0 million in 2016 by 15.6%, also Sugar imports declined from US $ 550.1 million in 2015 to US $ 272.6 million in 2016 by 50.4%. Manufactured Goods: The value of manufactured goods imports declined from US $ 1,941.3 million in 2015 to US $ 1,749.6 million in 2016 by 9.9%. Machinery and Equipments: The value of machinery and equipment imports decreased from US $ 1,649.7 million in 2015 to US $ 1,613.3 million in 2016 by 2.2%. Raw Materials: The value of raw materials imports (petroleum products, raw plastic, raw rubber, grease, seeds, and wrapping papers) declined from US $ 1,446.9 million in 2015 to US $ 918.2 million in 2016 by 36.5%, whereas the value of petroleum products imports decreased from US $ 1,189.4 million in 2015 to US $ 687.5 million in 2016 by 42.2%, as a result of the decrease in the imported quantities.

|56thANNUALREPORT2016
168
Means of Transportation: The value of means of transportation imports increased from US $ 910.5 million in 2015 to US $ 915.5 million in 2016 by 0.5%. Chemicals: The value of chemicals imports decreased from US $ 929.0 million in 2015 to US $ 869.1 million in 2016 by 6.4%. Textiles: The value of textiles imports declined from US $ 395.3 million in 2015 to US $ 378.5 million in 2016 by 4.2%. Beverages and Tobacco: The value of imports of beverages and tobacco increased from US $ 79.3 million in 2015 to US $ 80.2 million in 2016 by 1.1%.
Figure (9-5)
Contribution of imports in 2016
Figure (9-5) explains that the contribution of foodstuffs imports represent the highest ratio of total imports 21.3% followed by manufactured goods 21.0%, machinery and equipments 19.4%, means of transportation 11.0%, chemicals imports 10.4%, and petroleum products 8.2%. Second: The Trade Balance with the Foreign Trade Partners: Table (9-4) shows the trade balance with the main foreign trade partners for 2015 and 2016

|56thANNUALREPORT2016
169
Table (9-4) The Trade Balance with the Main
Foreign Trade Partners for 2015 and 2016
(US $ Million) 2015 2016*
Country Exports Imports Trade
Balance Exports Imports Trade Balance
China 739.5 2,159.2 (1,419.7) 459.4 2,192.7 (1,733.3) United Arab Emirates
740.3 836.0 (95.7) 1,115.7 868.9 246.8
India 37.4 794.7 (757.3) 88.4 632.9 (544.5) Egypt 304.4 569.4 (265.0) 411.9 591.3 (179.4) Saudi Arabia 657.6 436.7 220.9 506.5 523.4 (16.9) Turkey 35.0 410.4 (375.4) 46.1 502.8 (456.7) Japan 2.3 301.8 (299.5) 3.4 283.1 (279.7) Thailand 1.1 353.8 (352.7) 0.4 103.6 (103.2) Malaysia 0.3 317.1 (316.8) 3.2 48.9 (45.7) Source: Sudan Customs Authority and Ministry of Petroleum. * Preliminary Data Note: Exports FOB, Imports CIF. Table (9-4) indicates a deficit in the trade balance with all trade partners in 2016 except United Arab Emirates, where the trade balance recorded a surplus of US $ 246.8 million in 2016 due to the increase in Sudan exports of gold, livestock, sesame and groundnuts. The shift of trade balance with Saudi Arabia from a surplus of US $ 220.9 million in 2015 to a deficit of US $ 16.9 million in 2016, was due to the decline in the exports of sesame, livestock, meat, hides and skins, and the increase in imports of foodstuffs from Saudi Arabia. Third: Sudan’s Foreign Trade with Regional Blocs: Table (9-5) (A) shows Sudan’s foreign trade with Common Market for Eastern and Southern Africa (COMESA), and Greater Arab Free Trade Area (GAFTA) for 2015 and 2016.

|56thANNUALREPORT2016
170
Table (9-5) Trade Balance with (COMESA) and (GAFTA) For 2015 and 2016
(US $ Million) 2015 2016*
Region Exports Imports Trade
Balance Exports Imports Trade Balance
Common Market for Eastern and Southern Africa COMESA
415.3 775.2 (359.9) 507.1 806.3 (299.2)
Djibouti 0.1 0.0 0.1 0.2 0.0 0.2 Ethiopia 86.7 43.8 42.9 71.8 40.8 31.0 Kenya 1.2 55.1 (53.9) 0.1 62.6 (62.5) Uganda 0.1 45.6 (45.5) 0.2 41.7 (41.5) Zimbabwe 0.0 29.7 (29.7) 0.0 36.2 (36.2) Egypt 304.4 569.4 (265.0) 411.9 591.3 (179.4) Zambia 0.0 7.2 (7.2) 0.0 4.3 (4.3) Rwanda 0.2 2.1 (1.9) 0.0 1.4 (1.4) Burundi 0.4 1.3 (0.9) 0.0 1.1 (1.1) Seychelles 0.0 0.0 0.0 0.0 0.1 (0.1) Eritrea 21.4 0.0 21.4 20.8 0.1 20.7 Malawi 0.0 0.5 (0.5) 0.0 0.4 (0.4) Mauritius 0.0 0.0 0.0 0.0 0.0 0.0 Libya 0.5 1.2 (0.7) 0.6 1.0 (0.4) Comoros 0.0 0.0 0.0 0.0 0.0 0.0 Madagascar 0.0 0.0 0.0 0.0 0.0 0.0 Swaziland 0.3 19.3 (19.0) 1.5 25.3 (23.8) Congo 0 0 0.0 0 0 0.0 Greater Arab Free Trade Area (GAFTA)
1,833.70 2,058.50 (224.8) 2,154.00 2,136.9 17.1
Egypt 304.4 569.4 (265.0) 411.9 591.3 (179.4) Libya 0.5 1.2 (0.7) 0.6 1.0 (0.4) Morocco 5.1 4.4 0.7 5.4 21.2 (15.8) Tunisia 13 12.4 0.6 8.7 5.4 3.3

|56thANNUALREPORT2016
171
2015 2016* Region
Exports Imports Trade Balance Exports Imports Trade
Balance Algeria 3.5 0.1 3.4 2.1 0.0 2.1 United Arab Emirates 740.3 836 (95.7) 1,115.70
869.0 246.8
Bahrain 0.5 2.9 (2.4) 1.2 3.5 (2.3) Iraq 0.2 0 0.2 1.8 0.0 1.8 Jordan 29 126.1 (97.1) 29.7 75.7 (46.0) Kuwait 6.7 17.8 (11.1) 5.2 10.3 (5.1) Lebanon 36.9 12.9 24.0 24.3 16.2 8.2 Oman 0.4 15.3 (14.9) 2.3 10.5 (8.2) Qatar 21.9 18.6 3.3 15.3 3.3 12.0 Saudi Arabia 657.6 436.7 220.9 506.5 523.4 (16.9) Syria 10.8 4.5 6.3 13.1 5.8 7.3 Yemen 2.9 0.2 2.7 10.2 0.3 9.9 Source: Sudan Customs Authority and Ministry of Petroleum. * Preliminary Data. Note: Egypt and Libya data included in both (COMESA) and (GAFTA). Table (9-5) explains that the trade balance deficit with (COMESA) decreased from US $ 359.9 million in 2015 to US $ 299.2 million in 2016, whereas exports to (COMESA) has increased from US $ 415.3 million in 2015 to US $ 507.1 million in 2016 by 22.1%. Exports to (COMESA) countries represent 16.4% of the total exports, of which 81.2% exported to Egypt. Imports from the (COMESA) countries rose from US $ 775.2 million in 2015 to US $ 806.3 million in 2016 by 4.0%.Imports from the (COMESA) represent 9.7% of total imports, of which 73.3% imported from Egypt. The trade balance deficit with the (GAFTA) shifted from a deficit of US $ 224.8 million in 2015 to a surplus of US $ 17.1 million in 2016 by 17.5%. Exports to (GAFTA) countries represent 69.6% of total exports, of which 51.8% exported to the United Arab Emirates. Imports from the (GAFTA) countries increased from US $ 2,058.5 million to US $ 2,136.9 million in 2016 by 3.8%. Imports from (GAFTA) represent 25.7% of total imports, of which 40.7% imported from United Arab Emirates.

|56thANNUALREPORT2016
172
Table (9-6) Sudan Exports to
(COMESA) and (GAFTA) For 2015 and 2016
(US $ Million) 2015 2016*
Group Commodities GAFTA COMESA
Other Countries GAFTA COMESA
Other Countries
Gold 691.3 0.4 34.0 1,034.3 0.1 9.6
Livestock 777.3 222.9 27.0 710.9 275.6 0.3 Fodder 0.0 0.1 24.1 5.1 0.0 23.7
Groundnuts 2.0 0.6 0.9 10.0 1.9 16.3
Hides and Skins 19.1 2.3 13.1 8.1 1.0 6.0 Sesame 188.1 44.3 265.4 169.4 60.8 209.9
Meat 45.1 0.9 25.0 37.1 21.5 0.0
Cotton 11.8 12.2 27.2 30.8 30.4 49.1 Petroleum and Its Products
- 53.3 573.9 - 64.7 271.1
Gum Arabic 2.9 5.2 104.0 2.8 4.7 91.4
Other 96.1 73.1 130.3 145.5 46.3 167.9
Total 1,833.7 415.3 1,224.9 2,154.0 507.0 845.3 Source: Sudan Customs Authority and Ministry of Petroleum. * Preliminary data Note: Egypt and Libya data included in both (COMESA) and (GAFTA). Table (9-6) shows an increase in the value of exports to (GAFTA) area from US $ 1,833.7 million in 2015 to US $ 2,154.0 million in 2016 at a rate of 17.5%. This was due to the increase in gold exports from US $ 691.3 million in 2015 to US $ 1,034.3 million in 2016 at a rate of 49.6% and cotton exports from US $ 11.8 million in 2015 to US $ 30.8 million in 2016 at a rate of 161%, in addition to the rise of groundnuts exports from US $ 2 million in 2015 to US $ 10 million in 2016 by 400%. Exports to the (COMESA) increased from US $ 415.3 million in 2015 to US $ 507.1 million in 2016 by 22.1%, this was due to a rise in livestock exports from US $ 222.9 million in 2015 to US $ 275.6 million in 2016 at 23.6%, and the increase in peanut exports from US $ 0.6 million in 2015 to US $ 1.9 million in 2016 at a rate of 216.7%, and sesame exports from US $ 44.3 million in 2015 to US $ 60.8 million in 2016 at a rate of 37.2%, and cotton exports from US $ 12.2 million in

|56thANNUALREPORT2016
173
2015 to US $ 30.4 million in 2016 at a rate of 149.2%, and meat exports increased from US $ 0.9 million in 2015 to US $ 21.5 million in 2016 at a rate of 2,288.9%.
Table (9-7) Sudan Imports from (COMESA) and (GAFTA)
For 2015 and 2016 (US $ Million)
2015 2016* Group Commodities
(GAFTA) (COMESA) Other
Countries (GAFTA) (COMESA) Other Countries
Petroleum products
498.4 33.8 691.0 610.7 7.7 76.8
Raw materials 184.0 34.0 73.3 165.6 33.9 64.9
Chemicals 405.4 89.2 507.1 358.0 91.0 494.4
Manufactured goods
479.4 216.9 1454.5 484.1 249.0 1257.7
Machinery and Equipment
211.9 70.0 1434.2 176.0 47.5 1427.7
Textiles 38.3 18.2 356.5 45.3 22.0 332.4
Foodstuffs 173.0 241.5 1829.6 236.9 262.0 1426.5
Beverages and Tobacco
12.7 48.6 27.5 10.9 53.4 23.1
Means of transport
53.9 15.6 856.6 48.9 18.5 866.5
Other 1.5 7.4 15.6 0.5 21.3 1.1
Total 2058.5 775.2 7245.9 2136.9 806.3 5971.1
Source: Sudan Customs Authority and Ministry of Petroleum. * Preliminary Data Note: Egypt and Libya data included in both (COMESA) and (GAFTA).
Table (9-7) Shows an increase in imports from (GAFTA) from US $ 2,058.5 million in 2015 to US $ 2,136.9 million in 2016 at a rate of 3.8%, and an increase of the value of imports from the (COMESA) from US $ 775.2 million in 2015 to US $ 806.3 million in 2016 at a rate of 4.0%, (GAFTA) was the main source of imports of petroleum products, manufactures, chemicals and foodstuffs. The imports of petroleum products and foodstuffs increased by 22.5% and 36.9% respectively in 2016 compared with 2015. Food and manufactures are the most important imports from the area of (COMESA), increased by 8.5%, 14.8% respectively in 2016 compared to 2015. Forth: Direction of Sudan's Foreign Trade: Arab countries represent the main market for exports by 69.6% of the total value of exports during 2016, compared to 57.9% in 2015. Asian countries remained the main source of imports by 44% of the total value of imports during 2016 compared
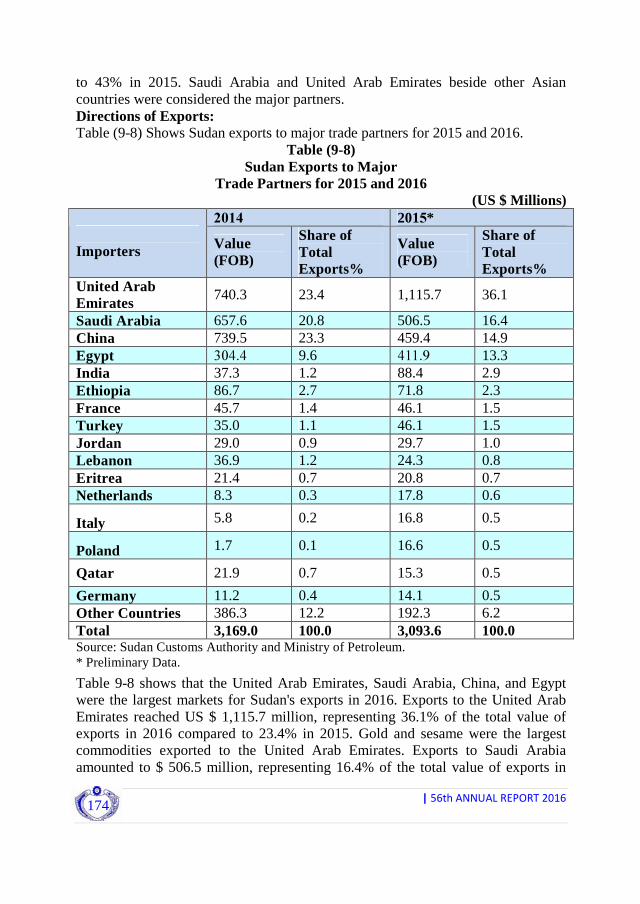
|56thANNUALREPORT2016
174
to 43% in 2015. Saudi Arabia and United Arab Emirates beside other Asian countries were considered the major partners. Directions of Exports: Table (9-8) Shows Sudan exports to major trade partners for 2015 and 2016.
Table (9-8) Sudan Exports to Major
Trade Partners for 2015 and 2016 (US $ Millions)
2014 2015* Importers Value
(FOB)
Share of Total Exports%
Value (FOB)
Share of Total Exports%
United Arab Emirates
740.3 23.4 1,115.7 36.1
Saudi Arabia 657.6 20.8 506.5 16.4 China 739.5 23.3 459.4 14.9 Egypt 304.4 9.6 411.9 13.3 India 37.3 1.2 88.4 2.9 Ethiopia 86.7 2.7 71.8 2.3 France 45.7 1.4 46.1 1.5 Turkey 35.0 1.1 46.1 1.5 Jordan 29.0 0.9 29.7 1.0 Lebanon 36.9 1.2 24.3 0.8 Eritrea 21.4 0.7 20.8 0.7 Netherlands 8.3 0.3 17.8 0.6
Italy 5.8 0.2 16.8 0.5
Poland 1.7 0.1 16.6 0.5
Qatar 21.9 0.7 15.3 0.5
Germany 11.2 0.4 14.1 0.5 Other Countries 386.3 12.2 192.3 6.2 Total 3,169.0 100.0 3,093.6 100.0 Source: Sudan Customs Authority and Ministry of Petroleum. * Preliminary Data.
Table 9-8 shows that the United Arab Emirates, Saudi Arabia, China, and Egypt were the largest markets for Sudan's exports in 2016. Exports to the United Arab Emirates reached US $ 1,115.7 million, representing 36.1% of the total value of exports in 2016 compared to 23.4% in 2015. Gold and sesame were the largest commodities exported to the United Arab Emirates. Exports to Saudi Arabia amounted to $ 506.5 million, representing 16.4% of the total value of exports in
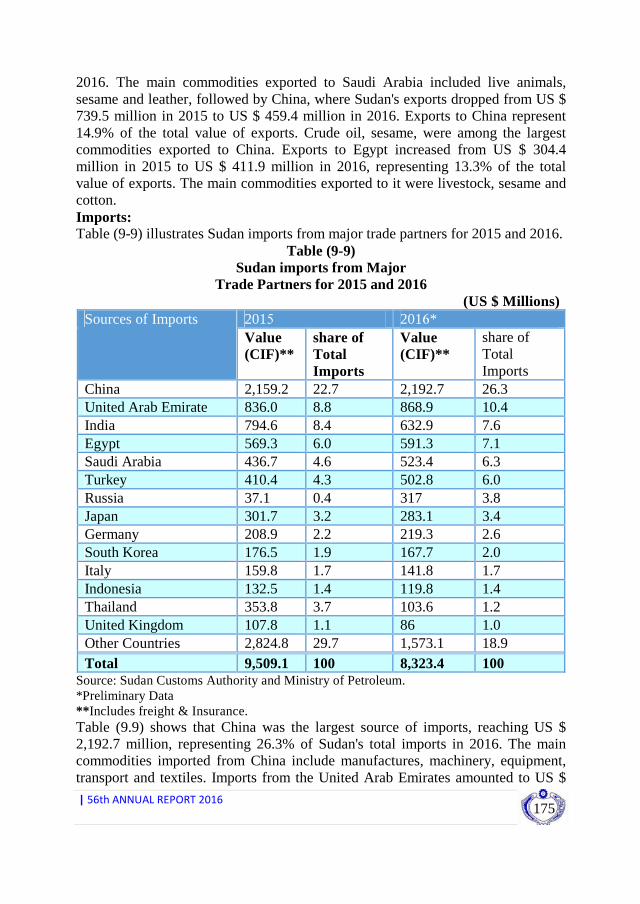
|56thANNUALREPORT2016
175
2016. The main commodities exported to Saudi Arabia included live animals, sesame and leather, followed by China, where Sudan's exports dropped from US $ 739.5 million in 2015 to US $ 459.4 million in 2016. Exports to China represent 14.9% of the total value of exports. Crude oil, sesame, were among the largest commodities exported to China. Exports to Egypt increased from US $ 304.4 million in 2015 to US $ 411.9 million in 2016, representing 13.3% of the total value of exports. The main commodities exported to it were livestock, sesame and cotton. Imports: Table (9-9) illustrates Sudan imports from major trade partners for 2015 and 2016.
Table (9-9) Sudan imports from Major
Trade Partners for 2015 and 2016 (US $ Millions)
2015 2016* Sources of Imports Value (CIF)**
share of Total Imports
Value (CIF)**
share of Total Imports
China 2,159.2 22.7 2,192.7 26.3 United Arab Emirate 836.0 8.8 868.9 10.4 India 794.6 8.4 632.9 7.6 Egypt 569.3 6.0 591.3 7.1 Saudi Arabia 436.7 4.6 523.4 6.3 Turkey 410.4 4.3 502.8 6.0 Russia 37.1 0.4 317 3.8 Japan 301.7 3.2 283.1 3.4 Germany 208.9 2.2 219.3 2.6 South Korea 176.5 1.9 167.7 2.0 Italy 159.8 1.7 141.8 1.7 Indonesia 132.5 1.4 119.8 1.4 Thailand 353.8 3.7 103.6 1.2 United Kingdom 107.8 1.1 86 1.0 Other Countries 2,824.8 29.7 1,573.1 18.9 Total 9,509.1 100 8,323.4 100
Source: Sudan Customs Authority and Ministry of Petroleum. *Preliminary Data ** Includes freight & Insurance. Table (9.9) shows that China was the largest source of imports, reaching US $ 2,192.7 million, representing 26.3% of Sudan's total imports in 2016. The main commodities imported from China include manufactures, machinery, equipment, transport and textiles. Imports from the United Arab Emirates amounted to US $

|56thANNUALREPORT2016
176
868.9 million, representing 10.4% of the total value of Sudan's imports, the main commodities imported were petroleum products, manufactures, machinery, equipment and chemicals. Followed by imports from India which amounted to US $ 632.9 million, representing 7.6% of the total value of Sudan's imports, the main commodities imported were food, manufactures, machinery, equipment, chemicals and textiles. Imports from Egypt amounted to US $ 591.3 million, representing 7.1% of the total value of imports, the main commodities imported from Egypt were manufactures, foodstuffs, chemicals, machinery and equipment, other raw materials and textiles. Imports from Saudi Arabia amounted to US $ 523.4 million, representing 6.3% of the total value of imports, the main commodities imported were petroleum products, manufactures, chemicals, other raw materials, machinery and equipment.
BALANCE OF PAYMENTS (BOPs)

|56thANNUALREPORT2016
178

|56thANNUALREPORT2016
179
Balance of Payments The balance of payments (BOPs) can be defined as a statistical statement that summarizes all economic transactions between residents and non-residents of a country during a certain period of time. The statistics of BOPs is compiled according to the Fifth Edition of the Balance of Payments Manual issued by the International Monetary Fund (IMF) in September 1993. In 2015, the statistical compilation of BOPs has switched to the sixth Edition of the Balance of Payments and International Investment Position Manual “BPM6” issued in 2009.The data published in the Central Bank of Sudan periodicals is based on the analytical presentation, whereas (IMF) periodicals use BPM6 methodology. The balance of payments (BOPs) consists of the current account, the capital and financial account and the reserve assets in addition to errors and omissions item. Current Account: This account presents all transactions of goods and services, and consists of two components: - Trade Balance (Visible Transactions) it consists of the difference between
exports and imports of goods during a specified period of time. - The balance of services, income and transfers (Invisible Transactions) that
records all transactions related to services, income and current transfers, such as transportations, corporate profits, workers’ remittances, grants, gifts … etc.
Capital and Financial Account: It includes the capital account and the financial account, where the entitlements to non-residents are treated as assets, and the obligations against them treated as liabilities. The two parties of a transaction in assets and liabilities are usually a resident and a non-resident. It includes two sub- accounts: - Capital Account: It consists of capital movements and transfers of ownership of fixed assets, or external debt cancellation by the creditor for free of charge. Also it includes acquisition/disposal of non-produced nonfinancial assets, such as intellectual property rights, brand or goodwill, patent, copyright and other intangible assets. - Financial Account: registers all transactions associated with changes of ownership in the foreign financial assets and liabilities of an economy. It includes foreign direct investments, portfolio investments )1( as well as other investments 1 )
The portfolio investment, defined as the transactions and positions across the borders which involves debt bills or equity other than those included in direct investment or reserve assets, generally includes equity securities and debt securities in the form of bills and bonds issued by public and private institutions as well as money market instruments, the portfolio investment percentage should not exceed 10% of the invested capital.
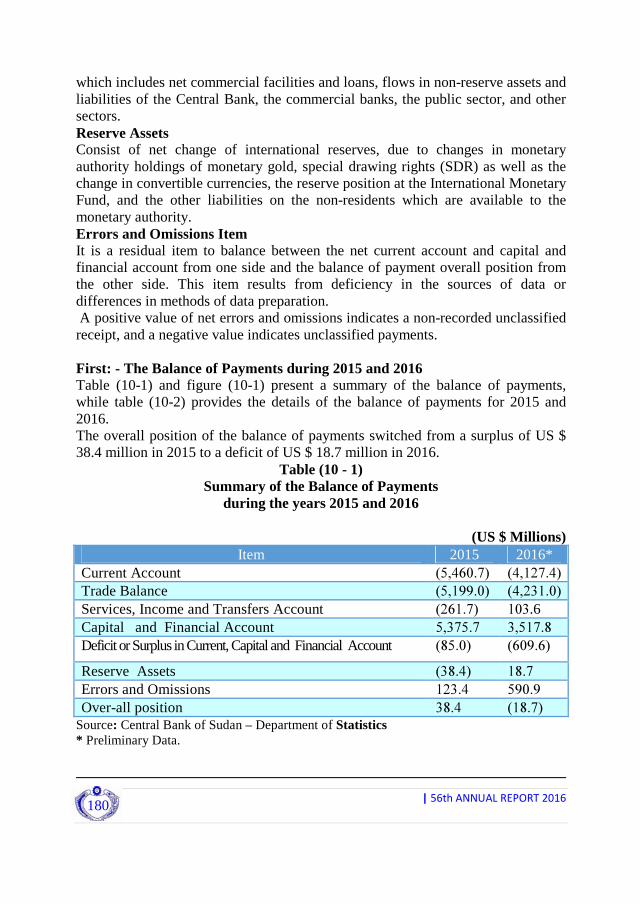
|56thANNUALREPORT2016
180
which includes net commercial facilities and loans, flows in non-reserve assets and liabilities of the Central Bank, the commercial banks, the public sector, and other sectors. Reserve Assets Consist of net change of international reserves, due to changes in monetary authority holdings of monetary gold, special drawing rights (SDR) as well as the change in convertible currencies, the reserve position at the International Monetary Fund, and the other liabilities on the non-residents which are available to the monetary authority. Errors and Omissions Item It is a residual item to balance between the net current account and capital and financial account from one side and the balance of payment overall position from the other side. This item results from deficiency in the sources of data or differences in methods of data preparation. A positive value of net errors and omissions indicates a non-recorded unclassified receipt, and a negative value indicates unclassified payments. First: - The Balance of Payments during 2015 and 2016 Table (10-1) and figure (10-1) present a summary of the balance of payments, while table (10-2) provides the details of the balance of payments for 2015 and 2016. The overall position of the balance of payments switched from a surplus of US $ 38.4 million in 2015 to a deficit of US $ 18.7 million in 2016.
Table (10 - 1) Summary of the Balance of Payments
during the years 2015 and 2016
(US $ Millions) Item 2015 2016*
Current Account )5,460.7( )4,127.4( Trade Balance )5,199.0( )4,231.0( Services, Income and Transfers Account )261.7( 103.6 Capital and Financial Account 5,375.7 3,517.8 Deficit or Surplus in Current, Capital and Financial Account )85.0( )609.6(
Reserve Assets )38.4( 18.7 Errors and Omissions 123.4 590.9 Over-all position 38.4 )18.7(
Source: Central Bank of Sudan – Department of Statistics * Preliminary Data.
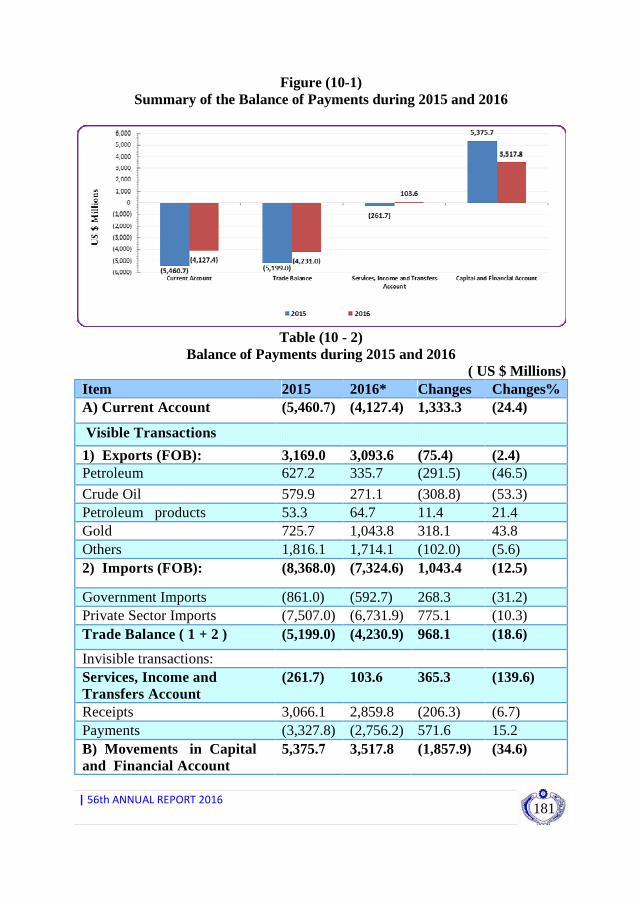
|56thANNUALREPORT2016
181
Figure (10-1) Summary of the Balance of Payments during 2015 and 2016
Table (10 - 2) Balance of Payments during 2015 and 2016
( US $ Millions) Changes% Changes 2016* 2015 Item (24.4) 1,333.3 (4,127.4) (5,460.7) A) Current Account
Visible Transactions
(2.4) (75.4) 3,093.6 3,169.0 1) Exports (FOB): (46.5) (291.5) 335.7 627.2 Petroleum
(53.3) (308.8) 271.1 579.9 Crude Oil 21.4 11.4 64.7 53.3 Petroleum products 43.8 318.1 1,043.8 725.7 Gold (5.6) (102.0) 1,714.1 1,816.1 Others (12.5) 1,043.4 (7,324.6) (8,368.0) 2) Imports (FOB):
(31.2) 268.3 (592.7) (861.0) Government Imports (10.3) 775.1 (6,731.9) (7,507.0) Private Sector Imports (18.6) 968.1 (4,230.9) (5,199.0) Trade Balance ( 1 + 2 )
Invisible transactions: (139.6) 365.3 103.6 (261.7) Services, Income and
Transfers Account (6.7) (206.3) 2,859.8 3,066.1 Receipts 15.2 571.6 (2,756.2) (3,327.8) Payments (34.6) (1,857.9) 3,517.8 5,375.7 B) Movements in Capital
and Financial Account

|56thANNUALREPORT2016
182
Changes% Changes 2016* 2015 Item (41.0) (102.6) 147.7 250.3 Capital Account (34.2) (1,755.3) 3,370.1 5,125.4 Financial Account (38.5) (664.6) 1,063.8 1,728.4 Direct Investment (Net) (85.7) 2.4 (0.4) (2.8) Portfolio Investment (Net) (32.2) (1,093.1) 2,306.7 3,399.8 Other Investments (Net) 27.9 1.6 7.4 5.8 Official Loans (53.3) (229.6) 201.2 430.8 Drawings (54.4) 231.2 (193.8) (425.0) Repayments ** (26.2) (135.2) 380.6 515.8 Trade Facilities (Net) 75.5 366.2 851.1 485.0 General Government Net
Foreign Assets (6.8) (14.2) 192.8 207.0 Commercial Banks Net
Foreign Assets (57.1) (1,181.5) 886.8 2,068.2 Monetary Authority Net
Foreign Assets (110.2) (130.0) (12.0) 118.0 Other Net Foreign Assets 616.3 (524.5) (609.6) (85.0) C) Deficit or Surplus in
Current, Capital and Financial Account
378.2 467.4 590.9 123.4 D) Errors and Omissions (148.7) 57.1 18.7 (38.4) Official Reserve Assets of
Convertible Currencies (148.7) (57.1) (18.7) 38.4 E) Overall balance
Source: Central Bank of Sudan – Department of Statistics * Preliminary Data. ** include the principal loan arrears, which have not been repaid through the year. The Current Account Table (10 - 2) indicates a decrease in the current account deficit from US $ 5,460.7 million in 2015 to US $ 4,127.4 million in 2016 by 24.4%, this was mainly due to the decrease in the trade balance deficit, in addition to the invisible transactions of services, income and transfers account which has turned from a deficit to a surplus. (a) Visible Transactions ( Trade Balance): The exports decreased from US $ 3,169.0 million in 2015 to US $ 3,093.6 in 2016 by 2.4%, due to the decrease of crude oil exports from US $ 627.2 million in 2015 to US $ 335.7 in 2016 by 46.5%. This was attributed to the decrease of crude oil exports (the share of foreign companies working in petroleum field), as a result of decrease in quantities and international price of oil, The gold exports increased from US $ 725.7 million in 2015 to US $ 1,043.8 in 2016 by 43.8% due to an increase in the exported quantities from 19.4 ton in 2015 to 27.0 ton in 2016.
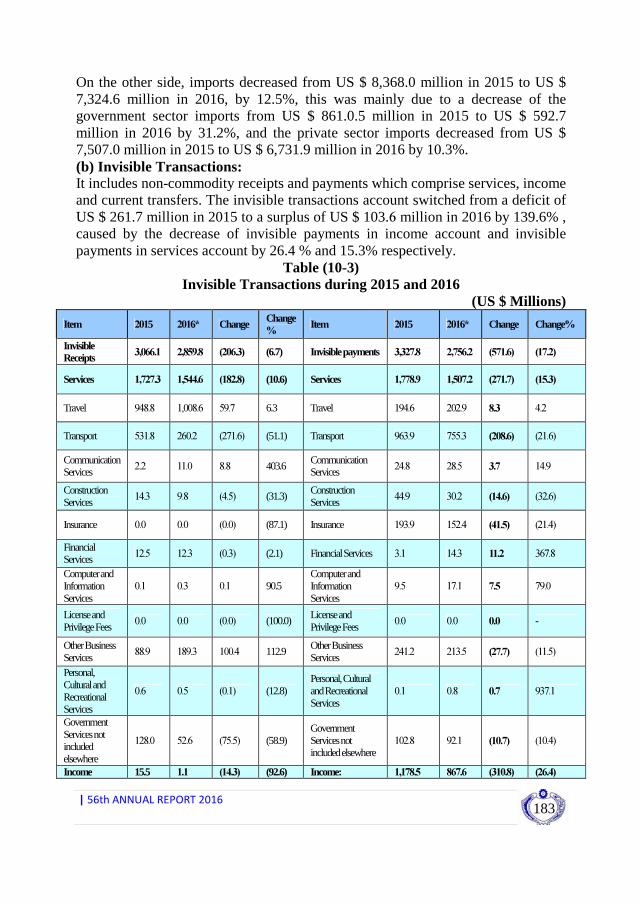
|56thANNUALREPORT2016
183
On the other side, imports decreased from US $ 8,368.0 million in 2015 to US $ 7,324.6 million in 2016, by 12.5%, this was mainly due to a decrease of the government sector imports from US $ 861.0.5 million in 2015 to US $ 592.7 million in 2016 by 31.2%, and the private sector imports decreased from US $ 7,507.0 million in 2015 to US $ 6,731.9 million in 2016 by 10.3%. (b) Invisible Transactions: It includes non-commodity receipts and payments which comprise services, income and current transfers. The invisible transactions account switched from a deficit of US $ 261.7 million in 2015 to a surplus of US $ 103.6 million in 2016 by 139.6% , caused by the decrease of invisible payments in income account and invisible payments in services account by 26.4 % and 15.3% respectively.
Table (10-3) Invisible Transactions during 2015 and 2016
(US $ Millions)
Change% Change 2016* 2015 Item Change %
Change 2016* 2015 Item
)17.2( )571.6( 2,756.2 3,327.8 Invisible payments (6.7) )206.3( 2,859.8 3,066.1 Invisible Receipts
)15.3( )271.7( 1,507.2 1,778.9 Services (10.6) )182.8( 1,544.6 1,727.3 Services
4.2 8.3 202.9 194.6 Travel 6.3 59.7 1,008.6 948.8 Travel
)21.6( )208.6( 755.3 963.9 Transport (51.1) )271.6( 260.2 531.8 Transport
14.9 3.7 28.5 24.8 Communication Services
403.6 8.8 11.0 2.2 Communication Services
)32.6( )14.6( 30.2 44.9 Construction Services
(31.3) )4.5( 9.8 14.3 Construction Services
)21.4( )41.5( 152.4 193.9 Insurance (87.1) )0.0( 0.0 0.0 Insurance
367.8 11.2 14.3 3.1 Financial Services (2.1) )0.3( 12.3 12.5 Financial Services
79.0 7.5 17.1 9.5 Computer and Information Services
90.5 0.1 0.3 0.1 Computer and Information Services
- 0.0 0.0 0.0 License and Privilege Fees
(100.0) )0.0( 0.0 0.0 License and Privilege Fees
)11.5( )27.7( 213.5 241.2 Other Business Services
112.9 100.4 189.3 88.9 Other Business Services
937.1 0.7 0.8 0.1 Personal, Cultural and Recreational Services
(12.8) )0.1( 0.5 0.6
Personal, Cultural and Recreational Services
)10.4( )10.7( 92.1 102.8 Government Services not included elsewhere
(58.9) )75.5( 52.6 128.0
Government Services not included elsewhere
)26.4( )310.8( 867.6 1,178.5 Income: (92.6) )14.3( 1.1 15.5 Income

|56thANNUALREPORT2016
184
Change% Change 2016* 2015 Item Change % Change 2016* 2015 Item
51.4 35.2 103.6 68.4 Compensations of Employees.
(64.4) )1.5( 0.8 2.3 Compensations of Employees.
)31.2( )346.0( 764.1 1,110.1 Investment Income: (97.5) )12.9( 0.3 13.2 Investment Income:
)56.2( )221.3( 172.3 393.6 Direct Investment (98.9) )4.6( 0.1 4.7 Direct Investment
74.3 0.3 0.7 0.4 Portfolio Investment (92.3) )0.1( 0.0 0.1 Portfolio Investment
)17.5( )125.0( 591.0 716.0 Other Investment** (96.7) )8.1( 0.3 8.4 Other Investment
2.9 10.9 381.4 370.5 Current Transfers:
(0.7) )9.3( 1,314.0 1,323.3 Current Transfers:
59.4 26.6 71.3 44.7 Government (28.9) )182.5( 449.4 631.9 Government
25.1 173.2 864.6 691.4 Private Sector
2.3 3.5 152.6 149.1 Workers' remittances (4.8) (15.6) 310.1 325.8 Private Sector
31.3 169.7 712.0 542.3 Other
(139.6) 365.3 103.6 (261.7) Deficit(-) or Surplus(+)
Source: Central Bank of Sudan – Department of Statistics * Preliminary Data. ** Includes the interest arrears (Contractual and the Penalty). Invisible receipts decreased from US $ 3,066.1 million in 2015 to US $ 2,859.8 million in 2016 by 6.7 %, as a result of a decrease in the receipts of services account by 6.7% and decreased in the receipts of income account by 92.6%. The receipts of services account decreased from US $ 1,727.3 million in 2015 to US $ 1,544.6 million in 2016 by 10.6 %, caused mainly by the decrease in Government Services receipts from US $ 128.0 million in 2015 to US $ 52.6 million in 2016 by 58.9% and a decrease in construction services receipts from US $ 14.3 million in 2015 to US $ 9.8 million in 2016 by 31.3%. The receipts of income account also decreased from US $ 15.5 million in 2015 to US $ 1.1 million in 2016 by 92.6 %, caused mainly by the decline in compensations of employees receipts from US $ 2.3 million in 2015 to US $ 0.8 million in 2016 by 64.4% and a decrease in investment income receipts from US $ 13.2 million in 2015 to US $ 0.3 million in 2016 by 97.5% The receipts of current transfers decreased slightly from US $ 1,323.3 million in 2015 to US $ 1,314.0 million in 2016 by 0.7 %, caused by the decrease in government sector receipts from US $ 631.9 million in 2015 to US $ 449.4 million in 2016 by 28.9%, while the private sector transfer increased from US $ 691.4 million in 2015 to US $ 864.6 million in 2016 by 25.1%. The invisible payments decreased from US $ 3,327.8 million in 2015 to US $ 2,756.2 million in 2016 by 17.2 %, as a result of the decline in the payments of services account and in the payment of income account by 15.3% and 26.4% respectively.

|56thANNUALREPORT2016
185
The payments of services account decreased from US $ 1,778.9 million in 2015 to US $ 1,507.2 million in 2016 by 15.3 %, caused by the decrease in transport services payments by 21.6% and a decrease in construction and insurance services payments by 32.6% and 21.4% respectively. Also the payments of income account decreased from US $ 1,178.5 million in 2015 to US $ 867.6 million in 2016 by 26.4 %, caused mainly by the decrease in investment income payments by 31.2%. The payments of current transfers increased from US $ 370.5 million in 2015 to US $ 381.4 million in 2016 by 2.9 % , due to the increase in government sector transfer by 59.4%. Capital and Financial Account: Table (10-4) shows the details of capital and financial account during 2015 and 2016. The net capital and financial account decreased from US $ 5,375.7 million in 2015 to US $ 3,517.8 million in 2016, by 34.6 %, due to the decrease in the inflows of direct investments and other investments by 38.5% and 32.2 % respectively.
Table (10-4) Capital and Financial Account during 2015 and 2016
(US $ Millions)
Item 2015 2016* Change Change%
Capital and Financial Account: 5,375.7 3,517.8 (1,857.8) (34.6)
1- Capital Account 250.3 147.7 (102.6) (41.0)
2- Financial Account 5,125.4 3,370.1 (1,755.2) (34.2)
Direct Investment ( Net ) 1,728.4 1,063.8 (664.6) (38.5)
In Sudan 1,873.0 1,132.1 (740.9) (39.6)
Equity Capital (Direct Investment )
(144.6) (68.3) 76.3 (52.8)
Portfolio Investments( Net ) (2.8) (0.4) 2.4 (85.7)
Assets (2.8) (0.4) 2.4 (85.7)
Liabilities 0.0 0.0 0.0 0.0
Other Investments ( Net ) 3,399.8 2,306.7 (1,093.0) (32.2)
A. Official Loans Liabilities 5.8 7.4 1.6 27.6
Drawings 430.8 201.2 (229.6) (53.3)
Repayments ** (425.0) (193.8) 231.2 (54.4)
B. Trade Credits and Facilities (Short-term movements)
515.8 380.6 (135.2) (26.2)
Assets
(312.7) (229.8) 82.9 (26.5)

|56thANNUALREPORT2016
186
Item 2015 2016* Change Change%
Liabilities 828.5 610.4 (218.1) (26.3)
C. Public sector Net Foreign Assets
485.0 851.1 366.2 75.5
Assets 0.0 0.0 0.0 0.0
Liabilities 485.0 851.1 366.2 75.5
D. Monetary Authorities Net Foreign Assets
2,068.2 886.8 (1,181.5) (57.1)
E. Commercial Banks Net Foreign Assets
207.0 192.9 (14.1) (6.8)
Assets 220.5 364.2 143.6 65.1 Liabilities (13.6) (171.3) (157.8) 1,159.6
F. Other net foreign assets 118.0 (12.0) (130.0) (110.2) Assets 118.0 (12.0) (130.0) (110.2)
Liabilities 0.0 0.0 0.0 0.0 Source: Central Bank of Sudan. * Preliminary Data. ** includes the principal loan arrears, which has not been repaid through the year. Table (10-4) shows a decrease in foreign direct investment inflows from US $ 1,728.4 million in 2015 to US $ 1,063.8 million in 2016 by 38.5%, and the net portfolio investment from of US $ 2.8 million in 2015 to US $ 0.4 million in 2016 by 84.8%. The net inflows of other investments decreased from US $ 3,399.8 million in 2015 to US $ 2,306.7 million in 2016 by 32.2%, this was attributed to the decrease in the net foreign assets of the monetary authority from US $ 2,068.2 million in 2015 to US $ 886.8 million in 2016 by 57.1%, beside the decrease of the net Trade Credits and Facilities (Short-term movements) from US $ 515.8 million in 2015 to US $ 380.6 million in 2016 by 26.3%. Table (10-5) and (10-6) present details of foreign loans position during 2015 and 2016.
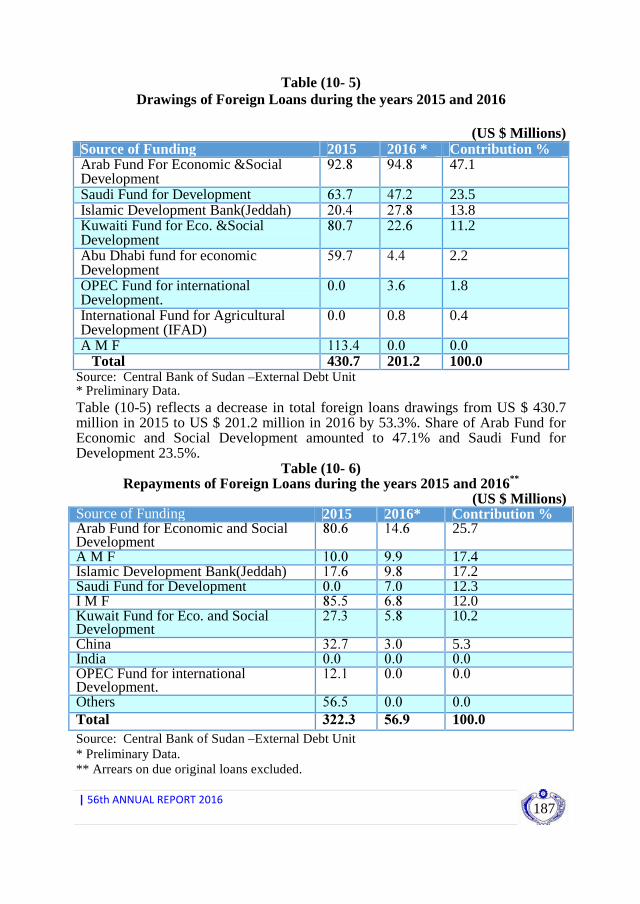
|56thANNUALREPORT2016
187
Table (10- 5) Drawings of Foreign Loans during the years 2015 and 2016
(US $ Millions)
Source of Funding 2015 2016 * Contribution % Arab Fund For Economic &Social Development
92.8 94.8 47.1
Saudi Fund for Development 63.7 47.2 23.5 Islamic Development Bank(Jeddah) 20.4 27.8 13.8 Kuwaiti Fund for Eco. &Social Development
80.7 22.6 11.2
Abu Dhabi fund for economic Development
59.7 4.4 2.2
OPEC Fund for international Development.
0.0 3.6 1.8
International Fund for Agricultural Development (IFAD)
0.0 0.8 0.4
A M F 113.4 0.0 0.0 Total 430.7 201.2 100.0
Source: Central Bank of Sudan –External Debt Unit * Preliminary Data.
Table (10-5) reflects a decrease in total foreign loans drawings from US $ 430.7 million in 2015 to US $ 201.2 million in 2016 by 53.3%. Share of Arab Fund for Economic and Social Development amounted to 47.1% and Saudi Fund for Development 23.5%.
Table (10- 6) Repayments of Foreign Loans during the years 2015 and 2016**
(US $ Millions) Source of Funding 2015 2016* Contribution % Arab Fund for Economic and Social Development
80.6 14.6 25.7
A M F 10.0 9.9 17.4 Islamic Development Bank(Jeddah) 17.6 9.8 17.2 Saudi Fund for Development 0.0 7.0 12.3 I M F 85.5 6.8 12.0 Kuwait Fund for Eco. and Social Development
27.3 5.8 10.2
China 32.7 3.0 5.3 India 0.0 0.0 0.0 OPEC Fund for international Development.
12.1 0.0 0.0
Others 56.5 0.0 0.0 Total 322.3 56.9 100.0 Source: Central Bank of Sudan –External Debt Unit * Preliminary Data. ** Arrears on due original loans excluded.

|56thANNUALREPORT2016
188
Table (10-6) shows a decrease in foreign loans repayments from US $ 322.3 million in 2015 to US $ 56.9 million in 2016 by 82.3 %. In which payment to the Arab Fund For Economic and Social Development was 25.7% and payment to the IMF was 17.4% of the total Foreign loans repayments in 2016. Second: Sudan External Obligations: The total external obligations of Sudan increased from US $ 43.9 billion by the end of 2015 to US $ 45.4 billion by the end of 2016 by 3.4%, including all sources of financing as shown in table (10-7), the slight increase in total external debt was mainly due to an increase in total delay interest and exchange rate fluctuations 1 during 2016. The major creditors contributed to Sudan external debt include Non Paris Club member countries 38.9%, Paris Club countries 30.9% and Foreign Commercial Banks 12.6%.
Table (10 - 7) Position of Sudan External Debt for 2015 and 2016
(US $ billions) 2015 ** 2016 *
Year
Source of Funding
Total Debt Principle Contractual
Interests Delay Interests
Total Debt
Weights out of total Debt %
Non Paris Club countries 16.9 5.7 2.2 9.7 17.6 38.9
Paris Club countries 13.5 2.3 1.6 10.0 14.0 30.9
International and Regional Institutions
5.4 4.0 0.5 1.1 5.6 12.2
Foreign Commercial Banks
5.6 2.8 0.2 2.7 5.7 12.6
Foreign Suppliers Facilities
2.5 2.5 - - 2.5 5.4
Total 43.9 17.3 4.5 23.6 45.4 100.0 Source: Central Bank of Sudan - External Debt Unit. * Preliminary Data. * * Amended Data.
1 ) The US dollar exchange rate fluctuations against the other currencies.
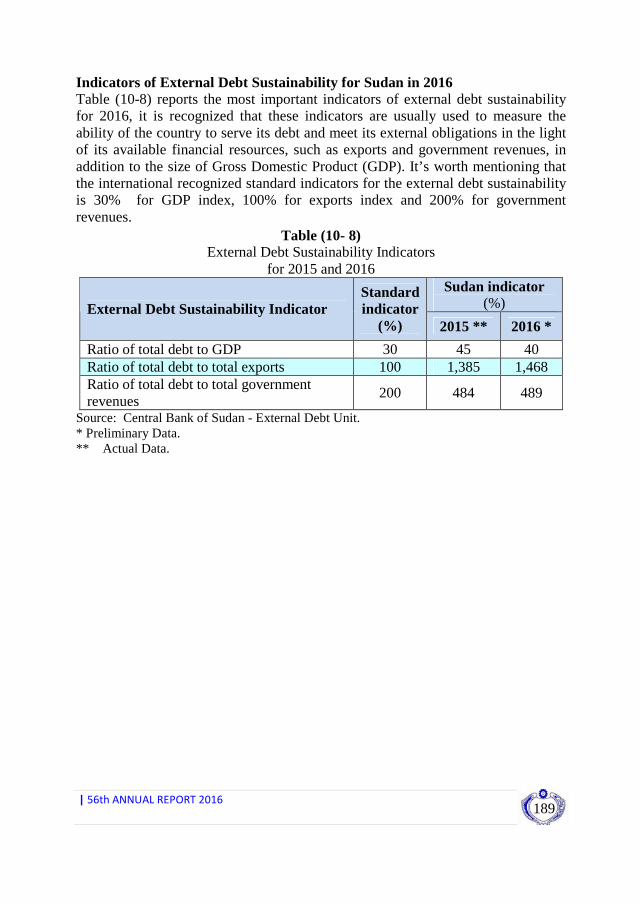
|56thANNUALREPORT2016
189
Indicators of External Debt Sustainability for Sudan in 2016 Table (10-8) reports the most important indicators of external debt sustainability for 2016, it is recognized that these indicators are usually used to measure the ability of the country to serve its debt and meet its external obligations in the light of its available financial resources, such as exports and government revenues, in addition to the size of Gross Domestic Product (GDP). It’s worth mentioning that the international recognized standard indicators for the external debt sustainability is 30% for GDP index, 100% for exports index and 200% for government revenues.
Table (10- 8) External Debt Sustainability Indicators
for 2015 and 2016 Sudan indicator
(%) External Debt Sustainability Indicator Standard indicator
(%) 2015 ** 2016 *
Ratio of total debt to GDP 30 45 40 Ratio of total debt to total exports 100 1,385 1,468 Ratio of total debt to total government revenues
200 484 489
Source: Central Bank of Sudan - External Debt Unit. * Preliminary Data. ** Actual Data.


|56thANNUALREPORT2016
191
APPENDICES

|56thANNUALREPORT2016
192
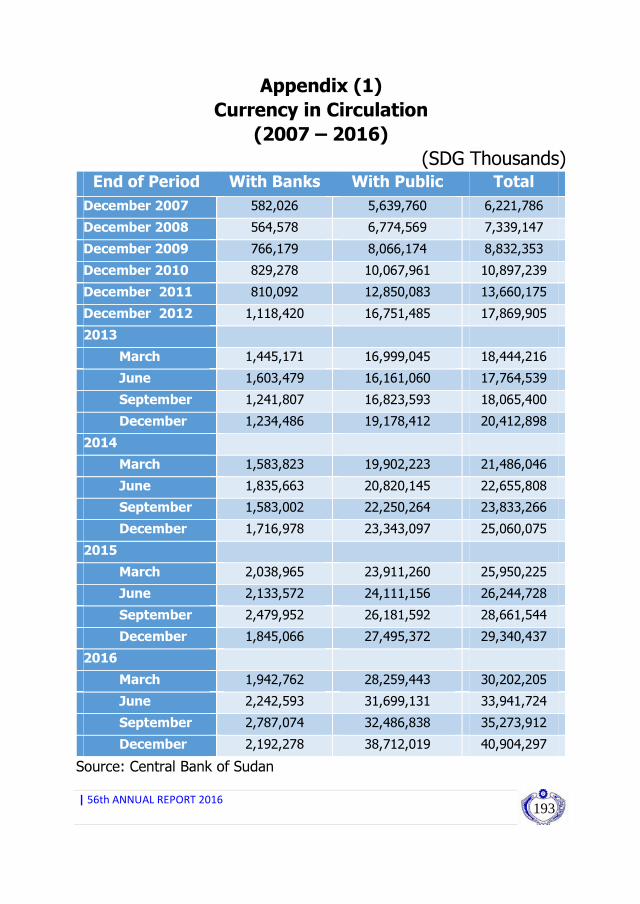
|56thANNUALREPORT2016
193
Appendix (1)
Currency in Circulation
(2007 – 2016)
(SDG Thousands) End of Period With Banks With Public Total
December 2007 582,026 5,639,760 6,221,786
December 2008 564,578 6,774,569 7,339,147
December 2009 766,179 8,066,174 8,832,353
December 2010 829,278 10,067,961 10,897,239
December 2011 810,092 12,850,083 13,660,175
December 2012 1,118,420 16,751,485 17,869,905
2013
March 1,445,171 16,999,045 18,444,216
June 1,603,479 16,161,060 17,764,539
September 1,241,807 16,823,593 18,065,400
December 1,234,486 19,178,412 20,412,898
2014
March 1,583,823 19,902,223 21,486,046
June 1,835,663 20,820,145 22,655,808
September 1,583,002 22,250,264 23,833,266
December 1,716,978 23,343,097 25,060,075
2015
March 2,038,965 23,911,260 25,950,225
June 2,133,572 24,111,156 26,244,728
September 2,479,952 26,181,592 28,661,544
December 1,845,066 27,495,372 29,340,437
2016
March 1,942,762 28,259,443 30,202,205
June 2,242,593 31,699,131 33,941,724
September 2,787,074 32,486,838 35,273,912
December 2,192,278 38,712,019 40,904,297
Source: Central Bank of Sudan
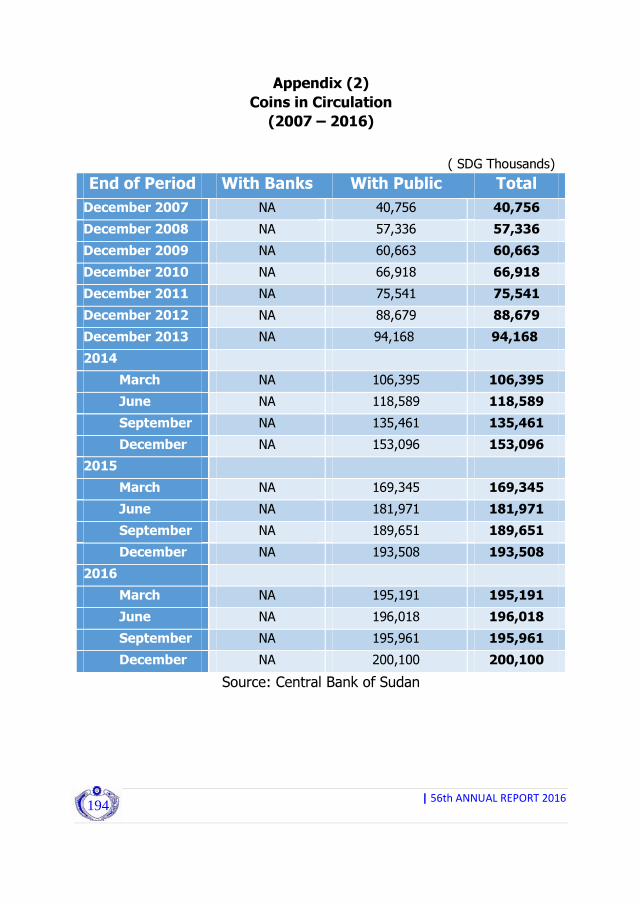
|56thANNUALREPORT2016
194
Appendix (2)
Coins in Circulation
(2007 – 2016)
( SDG Thousands)
End of Period With Banks With Public Total
December 2007 NA 40,756 40,756
December 2008 NA 57,336 57,336
December 2009 NA 60,663 60,663
December 2010 NA 66,918 66,918
December 2011 NA 75,541 75,541
December 2012 NA 88,679 88,679
December 2013 NA 94,168 94,168
2014
March NA 106,395 106,395
June NA 118,589 118,589
September NA 135,461 135,461
December NA 153,096 153,096
2015
March NA 169,345 169,345
June NA 181,971 181,971
September NA 189,651 189,651
December NA 193,508 193,508
2016
March NA 195,191 195,191
June NA 196,018 196,018
September NA 195,961 195,961
December NA 200,100 200,100
Source: Central Bank of Sudan

|56thANNUALREPORT2016
195
Appendix (3)
Analysis of Currency in Circulation
By Denomination
As at December, 2015 and December, 2016
(SDG Thousands)
2015 2016
Notes:
50 SDG 20,236,720.0 28,548,595.4
20 SDG 5,926,907.2 7,723,160.8
10 SDG 2,361,114.4 3,610,491.0
5 SDG 350,652.5 520,259.7
2 SDG 187,791.2 218,129.1
1 SDG 83,744.0 83,560.7
Total 29,146,929.3 40,704,196.5
Coins:
1 SDG 116,941.1 123,269.5
50 PTs 47,894.5 48,285.0
20 PTs 18,196.2 18,100.1
10 PTs 9,011.7 8,995.6
5 PTs 1,423.0 1,448.0
1 PTs 41.3 1.9
Total 193,507.9 200,100.1
Grand Total 29,340,437.1 40,904,296.6
Source: Central Bank of Sudan

|56thANNUALREPORT2016
196
Appendix (4)
Money Supply
(S
DG
Mil
lio
n)
PARTICULAR
December
2007
December
2008
December
2009
December
2010
December
2011
December
2012
December
2013
December
2014
December
2015
December
2016
Money Supply :
19
,71
4.6
2
2,9
33
.2
28
,31
4.5
3
5,4
97
.9
41
,85
3.1
5
8,6
63
.0
66
,44
5.7
7
7,7
39
.0
93
,64
2.6
1
20
,80
0.1
Currency
With Public
5,6
39.7
6,7
74.6
8,0
66.2
10,0
68.0
12,8
50.1
16,7
51.0
19,1
78.4
23,3
43.1
27,4
95.4
38,7
12.0
Demand
Deposits
5,7
27.8
6,8
55.4
8,0
40.2
9,8
40.3
12,0
00.0
14,2
42.0
16,4
86.9
19,7
43.0
25,3
76.3
33,4
60.8
Quasi –
Money
8,3
47.0
9,3
03.2
12,2
08.1
15,5
89.6
17,0
03.0
27,6
70.0
30,7
80.4
34,6
52.9
40,7
70.9
48,6
27.2
Net Foreign
Assets:
(2,5
40
.1)
(2,3
20
.6)
(4,5
89
.7)
(4,0
20
.3)
(5,6
59
.1)
(6,8
79
.7)
(12
,26
6.2
) (1
2,0
94
.0)
(26
,15
3.5
) (3
6,3
20
.9)
CBOS External
Assets
3,5
52.3
4,0
77.6
3,1
80.7
4,0
44.6
3,6
71.7
7,7
17.3
9,4
96.2
9,0
29.9
6,4
01.0
6,1
09.8
Fund Accounts
(3,2
91.4
) (3
,335.8
) (3
,480.7
) (3
,816.8
) (4
,052.2
) (6
,665.9
) (8
,606.8
) (8
,448.3
) (8
,215.0
) (8
,580.8
) Foreign Short
Term
Liabilities
(39.0
) (2
46.0
) (2
51.2
) (4
0.3
) (7
7.4
) (3
3.4
) (3
3.0
) (7
5.2
) (1
3.5
) (2
21.3
)
Payment
Agreements
(89.1
) (7
9.8
) (6
2.3
) (5
7.3
) (6
1.5
) (1
02.4
) (1
35.7
) (1
40.9
) (1
43.2
) (1
59.4
)
Rescheduling
Accounts
(991.9
) (1
,055.4
) (1
,082.4
) (1
,210.2
) (1
,293.6
) (2
,130.7
) (2
,753.0
) (2
,886.1
) (2
,944.1
) (3
,186.7
)
Foreign Long
Term
Liabilities
(2,0
23.4
) (2
,307.5
) (2
,418.7
) (2
,854.5
) (3
,215.9
) (5
,525.0
) (7
,465.5
) (7
,999.8
) (1
7,6
43.8
) (2
4,2
99.2
)
Other Foreign
Liabilities
(1,1
80.8
) (1
,449.8
) (1
,643.7
) (2
,328.0
) (2
,343.5
) (3
,239.6
) (5
,468.4
) (4
,725.7
) (5
,516.2
) (7
,539.6
)
Net Foreign
Assets (
Commercial
Banks)
1,5
23.2
2,0
76.1
1,1
68.6
2,2
42.3
1,7
13.3
3,1
00.0
2,7
00.0
3,1
52.0
1,9
21.3
1,5
56.4
Ev
alu
atio
n
Ad
ju
stm
en
t
7,4
57
.6
7,7
78
.3
8,5
66
.5
9,4
33
.6
8,2
24
.7
15
,98
6.2
2
4,7
40
.7
23
,79
0.5
2
2,7
69
.1
26
,62
7.9
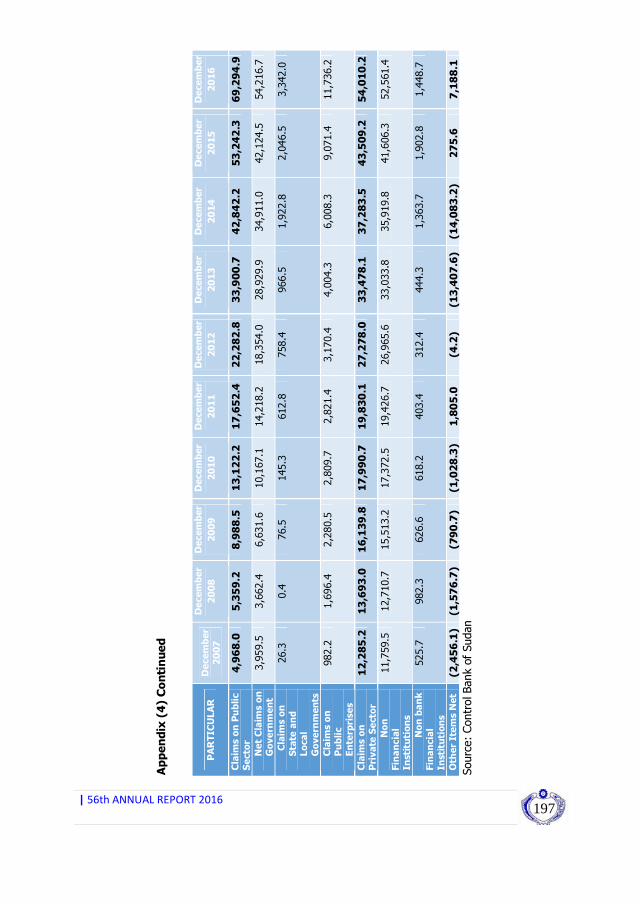
|56thANNUALREPORT2016
197
Appendix (4) Continued
PARTICULAR
December
2007
December
2008
December
2009
December
2010
December
2011
December
2012
December
2013
December
2014
December
2015
December
2016
Claims on Public
Sector
4,9
68
.0
5,3
59
.2
8,9
88
.5
13
,12
2.2
1
7,6
52
.4
22
,28
2.8
3
3,9
00
.7
42
,84
2.2
5
3,2
42
.3
69
,29
4.9
Net Claims on
Government
3,9
59.5
3,6
62.4
6,6
31.6
10,1
67.1
14,2
18.2
18,3
54.0
28,9
29.9
34,9
11.0
42,1
24.5
54,2
16.7
Claims on
State and
Local
Governments
26.3
0.4
76.5
145.3
612.8
758.4
966.5
1,9
22.8
2,0
46.5
3,3
42.0
Claims on
Public
Enterprises
982.2
1,6
96.4
2,2
80.5
2,8
09.7
2,8
21.4
3,1
70.4
4,0
04.3
6,0
08.3
9,0
71.4
11,7
36.2
Claims on
Private Sector
12
,28
5.2
1
3,6
93
.0
16
,13
9.8
1
7,9
90
.7
19
,83
0.1
2
7,2
78
.0
33
,47
8.1
3
7,2
83
.5
43
,50
9.2
5
4,0
10
.2
Non
Financial
Institutions
11,7
59.5
12,7
10.7
15,5
13.2
17,3
72.5
19,4
26.7
26,9
65.6
33,0
33.8
35,9
19.8
41,6
06.3
52,5
61.4
Non bank
Financial
Institutions
525.7
982.3
626.6
618.2
403.4
312.4
444.3
1,3
63.7
1,9
02.8
1,4
48.7
Other Items Net
(2,4
56
.1)
(1,5
76
.7)
(79
0.7
) (1
,02
8.3
) 1
,80
5.0
(4
.2)
(13
,40
7.6
) (1
4,0
83
.2)
27
5.6
7
,18
8.1
Sourc
e:
Contr
ol Bank o
f Sudan
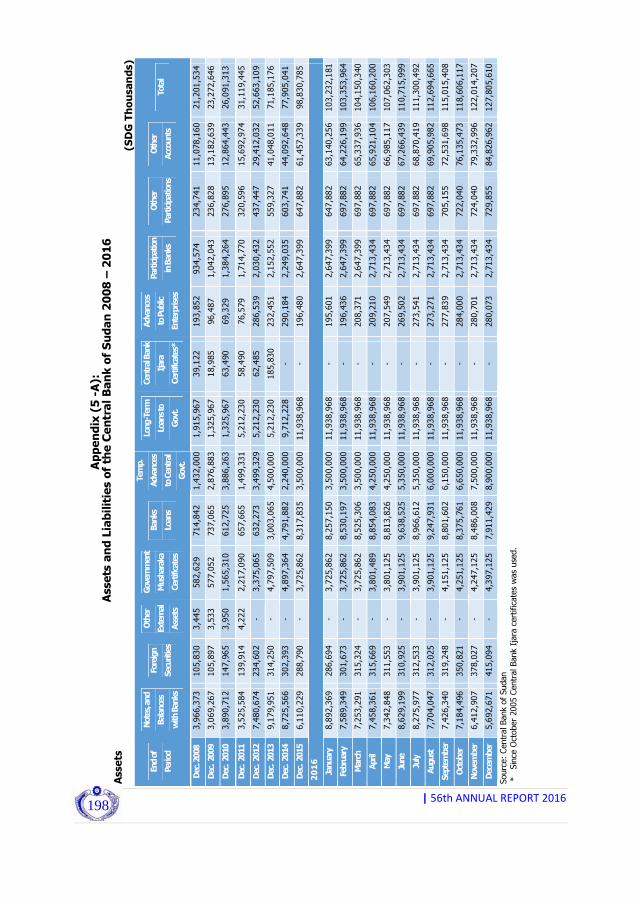
|56thANNUALREPORT2016
198
Appendix (5 -A):
Assets and Liabilities of the Central Bank of Sudan 2008 – 2016
Assets
(SDG Thousands)
End of
Period
Notes, and
Balances
with Banks
Foreign
Securities
Other
External
Assets
Government
Musharaka
Certificates
Banks
Loans
Temp.
Advances
to Central
Govt.
Long-Term
Loans to
Govt.
Central Bank
Ijara
Certificates*
Advances
to Public
Enterprises
Participation
in Banks
Other
Participations
Other
Accounts
Total
Dec. 2008
3,966,373
105,830
3,445
582,629
714,842
1,432,000
1,915,967
39,122
193,852
934,574
234,741
11,078,160
21,201,534
Dec. 2009
3,069,267
105,897
3,533
577,052
737,065
2,876,883
1,325,967
18,985
96,487
1,042,043
236,828
13,182,639
23,272,646
Dec. 2010
3,890,712
147,965
3,950
1,565,310
612,725
3,886,263
1,325,967
63,490
69,329
1,384,264
276,895
12,864,443
26,091,313
Dec. 2011
3,525,584
139,914
4,222
2,217,090
657,665
1,499,331
5,212,230
58,490
76,579
1,714,770
320,596
15,692,974
31,119,445
Dec. 2012
7,480,674
234,602
- 3,375,065
632,273
3,499,329
5,212,230
62,485
286,539
2,030,432
437,447
29,412,032
52,663,109
Dec. 2013
9,179,951
314,250
- 4,797,509
3,003,065 4,500,000
5,212,230
185,830
232,451
2,152,552
559,327
41,048,011
71,185,176
Dec. 2014
8,725,566
302,393
- 4,897,364
4,791,882 2,240,000
9,712,228
- 290,184
2,249,035
603,741
44,092,648
77,905,041
Dec. 2015
6,110,229
288,790
- 3,725,862
8,317,835 3,500,000 11,938,968
- 196,480
2,647,399
647,882
61,457,339
98,830,785
2016
January
8,892,369
286,694
- 3,725,862
8,257,150 3,500,000 11,938,968
- 195,601
2,647,399
647,882
63,140,256 103,232,181
February
7,589,349
301,673
- 3,725,862
8,530,197 3,500,000 11,938,968
- 196,436
2,647,399
697,882
64,226,199 103,353,964
March
7,253,291
315,324
- 3,725,862
8,525,306 3,500,000 11,938,968
- 208,371
2,647,399
697,882
65,337,936 104,150,340
April
7,458,361
315,669
- 3,801,489
8,854,083 4,250,000 11,938,968
- 209,210
2,713,434
697,882
65,921,104 106,160,200
May
7,342,848
311,553
- 3,801,125
8,813,826 4,250,000 11,938,968
- 207,549
2,713,434
697,882
66,985,117 107,062,303
June
8,629,199
310,925
- 3,901,125
9,638,525 5,350,000 11,938,968
- 269,502
2,713,434
697,882
67,266,439 110,715,999
July
8,275,977
312,533
- 3,901,125
8,966,612 5,350,000 11,938,968
- 273,541
2,713,434
697,882
68,870,419 111,300,492
August
7,704,047
312,025
- 3,901,125
9,247,931 6,000,000 11,938,968
- 273,271
2,713,434
697,882
69,905,982 112,694,665
September
7,426,340
319,248
- 4,151,125
8,801,602 6,150,000 11,938,968
- 277,839
2,713,434
705,155
72,531,698 115,015,408
October
7,184,496
350,821
- 4,251,125
8,375,761 6,650,000 11,938,968
- 284,000
2,713,434
722,040
76,135,473 118,606,117
November
6,412,907
378,027
- 4,247,125
8,486,008 7,500,000 11,938,968
- 280,701
2,713,434
724,040
79,332,996 122,014,207
December
5,692,671
415,094
- 4,397,125
7,911,429 8,900,000 11,938,968
- 280,073
2,713,434
729,855
84,826,962 127,805,610
Source: Central Bank of Sudan
* Since October 2005 Central Bank Ijara certificates was used.

|56thANNUALREPORT2016
199
Appendix (5 -B): Assets and Liabilities of the Central Bank of Sudan
Liabilities
(SDG Thousands)
End of Period
Currency in
Circulation
Government
A/Cs
Central Bank
Musharaka
Certificates
Bank's
Accounts
Other
Accounts
Payment
Agreements
Other Sight
Liabilities
Time
Liabilities
Capital and
Reserves
Others
Total
December-
2007
6,221,786
87,484
-
2,866,562
2,175,051
89,113
39,333
2,023,427
221,255
1,689,321
15,413,332
December-
2008
7,339,147
1,796,378
-
3,645,153
2,508,084
79,786
246,286
2,307,475
256,243
3,022,982
21,201,534
December-
2009
8,832,353
1,072,488
-
5,878,616
2,729,044
62,321
251,528
2,418,711
253,341
1,774,244
23,272,646
December-
2010
10,897,239
591,304
-
5,594,931
3,057,132
57,299
525,102
2,854,524
291,328
2,222,454
26,091,313
December-
2011
13,660,175
755,331
-
6,250,950
3,125,554
61,541
593,108
3,215,901
283,265
3,173,621
31,119,445
December-
2012
17,869,905
853,826
-
10,183,003
4,528,245
102,434
883,017
5,524,968
314,766
12,402,945
52,663,109
December-
2013
20,412,898
1,006,327
-
13,255,191
7,132,437
135,748
1,132,027
7,465,488
526,589
20,118,470
71,185,176
December-
2014
25,060,075
1,426,284
-
16,864,056
6,538,829
140,897
1,159,132
7,999,773
540,316
18,175,679
77,905,041
December-
2015
29,340,437
973,837
- 20,092,217
7,414,103
143,226
1,070,900
17,643,810
732,316
21,419,937
98,830,785
2016 January
28,732,032
2,202,554
-
19,609,740
8,524,907
142,032
1,067,971
20,702,688
732,316
21,517,940
103,232,181
February
29,528,299
1,882,050
-
19,533,730
8,273,910
141,238
1,067,088
20,739,337
732,316
21,455,996
103,353,964
March
30,202,205
1,474,943
-
19,621,564
8,489,252
142,229
1,088,837
20,718,566
732,316
21,680,427
104,150,340
April
31,056,095
3,088,797
-
18,978,868
8,923,414
142,649
1,090,706
20,723,916
732,316
21,423,439
106,160,200
May
32,115,318
2,529,950
-
19,069,807
9,337,258
142,904
1,082,416
20,707,243
732,316
21,345,092
107,062,303
June
33,941,724
2,221,810
-
19,149,826
9,575,362
140,270
1,079,767
21,935,508
773,589
21,898,144
110,715,999
July
32,688,574
2,656,186
-
19,887,256
10,018,542
139,934
1,090,719
21,944,920
773,589
22,100,772
111,300,492
August
34,273,296
2,914,907
-
19,778,825
9,314,454
139,654
1,093,663
21,941,523
773,589
22,464,753
112,694,665
September
35,273,912
2,747,882
-
19,844,826
9,697,361
142,625
1,118,196
22,399,232
773,589
23,017,786
115,015,408
October
35,396,272
2,786,855
-
21,603,099
9,839,834
148,008
1,130,875
23,367,410
773,589
23,560,177
118,606,117
November
37,225,073
2,930,202
-
21,787,287
9,779,645
148,645
1,112,744
23,328,754
773,589
24,928,267
122,014,207
December
40,904,297
2,903,373
-
23,308,352
9,628,745
159,419
1,331,252
24,299,242
773,589
24,497,342
127,805,610
Source: Central Bank of Sudan

|56thANNUALREPORT2016
200
Appendix (6 -
A)
Consolidated Balance Sheet of the Commercial Banks
) 2
01
6 -
20
07
(
Assets
(SDG Thousands)
End of Period
Cash
Due From Central
Bank of Sudan
Due from
Banks
Foreign
Corespondents
Central Government
Certificates
Advances *
Other
Accounts
Total
December-
2007
582,026
2,353,619
298,206
2,114,382
1,533,035
12,998,544
6,317,613
26,197,425
December-
2008
564,578
2,888,919
402,638
2,690,473
2,292,739
14,961,089
6,849,427
30,649,863
December-
2009
766,179
4,983,554
1,120,122
2,221,219
3,594,167
18,163,469
5,818,178
36,666,888
December-
2010
829,278
5,001,407
1,446,020
3,494,093
4,906,753
20,599,396
6,830,789
43,107,736
December-
2011
810,092
6,027,415
1,510,667
2,489,283
6,131,694
22,867,050
6,667,883
46,504,084
December-
2012
1,118,420
12,015,294
1,470,676
4,893,611
7,277,005
30,482,751
9,791,805
67,049,562
December-
2013
1,234,486
13,205,260
2,165,731
4,696,049
7,589,658
37,657,122
10,931,453
77,479,759
December-
2014
1,716,978
17,174,095
2,719,939
5,148,873
8,773,292
44,320,716
12,463,156
92,317,049
December-
2015
1,845,066
19,973,900
3,175,897
3,858,707
11,191,416
53,456,764
15,435,820
108,937,570
20
16
January
2,188,960
19,339,251
3,069,081
4,198,737
11,226,604
54,079,269
16,595,578
110,697,480
February
2,230,957
19,694,995
3,209,228
4,603,454
11,215,904
55,181,328
17,055,811
113,191,677
March
1,942,762
19,686,118
3,107,084
4,458,289
11,346,234
56,690,995
18,271,804
115,503,286
April
2,166,480
20,276,436
3,511,845
4,390,842
11,332,601
57,068,168
19,076,707
117,823,079
May
2,672,160
19,513,320
3,528,204
4,355,514
11,404,919
58,524,806
21,419,277
121,418,200
June
2,242,593
19,703,729
3,518,634
4,426,642
11,601,322
60,437,759
21,328,421
123,259,100
July
2,825,167
20,427,113
3,484,650
4,520,787
11,511,225
60,900,367
21,419,166
125,088,473
August
2,790,950
20,325,108
3,733,578
4,368,628
11,414,053
62,345,005
21,456,608
126,433,930
September
2,787,074
20,477,848
3,666,597
4,069,780
11,592,667
63,660,571
21,811,325
128,065,861
October
3,045,587
22,280,050
3,690,303
4,398,834
11,512,839
63,481,800
22,746,770
131,156,182
November
2,692,815
23,160,574
3,471,297
4,395,487
11,676,477
65,194,877
23,058,129
133,649,657
December
2,192,278
24,127,809
3,702,574
3,724,012
12,469,181
67,688,597
18,809,094
132,713,544
Source: Central Bank of Sudan.
* Total advances in local and foreign currency.

|56thANNUALREPORT2016
201
Appendix (6 -
B)
Consolidated Balance Sheet of the Commercial Banks
) 2
01
6 -
20
07
(
Liabilities (SDG Thousands)
End of Period
Federal
Government
Deposits
State & Local Gov.
, Institutions and
Private Sector
Deposits
Central Bank
of Sudan
Commercial Banks
and Others
Foreign
Correspondents
Capital and
Reserves
Other
Accounts
Total
December-2
007
166,1
93
13,7
76,2
82
389,6
17
236,7
58
591,1
73
4,6
06,9
05
6,4
30,4
97
26,1
97,4
25
December-2
008
765,8
23
15,7
42,6
35
456,0
22
611,7
83
614,3
42
5,2
48,4
86
7,2
10,7
72
30,6
49,8
63
December-2
009
671,3
14
20,1
76,7
25
1,6
57,3
14
824,2
84
1,0
52,5
75
6,6
77,9
89
5,6
06,6
87
36,6
66,8
88
December-2010
927,1
43
24,9
47,2
22
891,0
01
895,3
82
1,2
51,8
13
7,4
77,9
13
6,7
17,2
62
43,1
07,7
36
December-2011
88,1
09
27,6
87,5
07
721,0
16
1,0
59,4
01
776,0
31
9,0
35,9
71
7,1
36,0
48
46,5
04,0
84
December-2012
157,0
55
39,3
87,2
83
1,2
13,0
69
802,9
31
1,7
93,4
68
10,8
30,6
70
12,8
65,0
88
67,0
49,5
62
December-2013
126,0
31
44,0
07,0
37
1,5
44,4
95
1,6
39,2
72
1,9
96,4
26
13,1
49,1
16
15,0
17,3
82
77,4
79,7
59
December-2014
66,7
11
53,4
02,6
58
2,8
50,8
07
1,8
18,3
65
1,9
96,9
86
14,7
39,3
86
17,4
42,1
36
92,3
17,0
49
December-2015
78,8
52
63,3
40,7
01
4,3
25,7
86
1,6
92,0
13
1,9
37,4
50
16,2
54,4
25
21,3
08,3
43
108,9
37,5
70
20
16
January
79,5
28
65,9
34,2
65
4,1
15,2
77
1,5
91,0
12
2,0
17,8
24
18,8
21,6
44
18,1
37,9
30
110,6
97,4
80
February
72,3
63
67,4
22,2
63
4,0
26,8
80
1,7
74,9
34
1,6
44,1
09
18,6
85,1
87
19,5
65,9
41
113,1
91,6
77
March
78,2
54
69,4
73,8
98
4,0
14,4
86
1,9
05,3
41
2,0
24,9
07
18,5
08,1
42
19,4
98,2
58
115,5
03,2
86
April
67,4
66
71,0
24,3
47
3,7
63,6
86
1,9
20,3
06
2,0
20,5
18
18,2
76,0
31
20,7
50,7
26
117,8
23,0
79
May
72,0
59
71,3
42,4
00
4,1
43,1
90
1,7
55,7
56
2,0
27,5
93
18,2
71,0
16
23,8
06,1
85
121,4
18,2
00
June
75,8
74
71,7
72,8
81
4,1
90,7
67
1,8
16,1
54
2,0
35,6
31
18,1
87,3
40
25,1
80,4
53
123,2
59,1
00
July
83,1
70
73,3
31,3
13
3,8
64,5
69
1,5
18,9
73
2,0
64,5
82
18,1
96,4
74
26,0
29,3
92
125,0
88,4
73
August
116,4
26
74,2
40,5
05
3,9
69,8
38
1,8
24,9
55
2,0
55,2
32
18,1
39,3
55
26,0
87,6
19
126,4
33,9
30
September
85,1
91
75,0
35,7
40
3,8
25,0
68
1,7
83,1
43
2,0
16,0
08
18,2
71,4
18
27,0
49,2
93
128,0
65,8
61
October
94,8
85
77,2
17,4
58
3,3
80,9
50
1,7
19,3
21
2,1
80,1
76
18,3
28,3
90
28,2
35,0
03
131,1
56,1
82
November
94,8
82
78,4
32,9
92
3,7
71,5
91
1,7
02,5
49
2,0
80,4
40
18,2
39,3
22
29,3
27,8
81
133,6
49,6
57
December
104,5
98
79,3
54,9
31
2,7
11,9
10
1,9
09,4
20
2,1
67,6
16
18,4
23,7
45
28,0
41,3
25
132,7
13,5
44
Source: Central Bank of Sudan.

|56thANNUALREPORT2016
202
Appendix (7 -A) : Position of Commercial Banks Advances in Local Currency (200
7– 2016) (SDG Thousands)
End of Period
Agriculture Industry
Exports
Imports
Local Trade Transport & Storage Constructions Mining & Energy
Others
Total
December-
2007
1,051,988
1,110,805
272,335
1,672,288
2,233,730
917,434
531,961
69,774
3,389,886
11,250,201
December-
2008
1,341,507
1,177,267
273,847
1,547,883
2,340,623
970,259
828,299
51,990
4,050,134
12,581,809
December-
2009
1,941,564
1,207,210
365,860
1,649,226
2,672,242
1,070,821
1,235,584
51,447
4,790,723
14,984,677
December-
2010
2,614,947
1,583,100
464,254
1,100,047
2,820,078
930,223
1,588,123
40,347
6,064,010
17,205,129
December-
2011
2,663,902
2,066,471
666,217
1,346,902
3,128,664
1,196,323
2,000,477
31,125
7,101,964
20,202,045
December-
2012
3,673,477
3,123,959
850,880
792,717
3,285,559
1,998,820
2,721,599
85,111
8,282,889
24,815,011
December-
2013
5,229,370
5,195,515
1,186,519
987,800
3,180,619
3,136,690
3,565,315
188,623
9,996,827
32,667,278
December-
2014
6,698,212
5,839,140 1,488,275*
802,564
3,630,552
3,201,635
6,678,284
361,340
11,305,696
38,517,423
December-
2015
8,401,164
6,890,855
1,383,122
1,032,686
5,799,644
3,329,773
9,091,760
308,051
13,782,503
50,019,557
2016
January
9,007,924
7,974,813
1,439,399
994,560
5,816,490
3,572,823
9,046,449
357,374
12,556,078
50,765,912
February
8,993,812
8,269,478
1,522,972
930,169
6,190,152
3,475,341
8,811,238
332,450
13,241,365
51,766,977
March
8,812,600
8,613,611
1,622,366
944,740
6,662,654
3,577,377
8,817,591
351,923
13,921,106
53,323,967
April
8,683,990
8,493,845
1,662,967
943,606
6,895,974
3,745,366
8,716,703
468,270
14,046,856
53,657,577
May
8,776,502
8,827,439
1,674,703
1,129,993
7,039,085
3,780,114
9,430,285
383,444
14,197,474
55,239,040
June
9,283,666
8,893,339
1,654,058
1,268,707
7,276,171
3,788,431
9,856,065
560,188
14,669,457
57,250,082
July
9,474,849
9,062,624
1,494,977
1,295,395
7,495,905
3,697,607
9,463,808
557,775
15,246,513
57,789,454
August
9,791,634
8,094,445
1,484,067
1,333,475
7,734,570
4,374,357
10,050,976
527,090
15,311,938
58,702,551
September
10,220,396
8,019,256
1,444,843
1,735,067
8,107,893
4,382,082
9,789,720
542,845
15,789,129
60,031,231
October
10,735,680
7,831,298
1,329,809
1,702,716
8,035,829
4,461,661
9,644,135
568,058
15,460,640
59,769,826
November
11,439,773
7,837,493
1,342,884
1,976,948
8,243,953
4,514,345
9,742,961
558,109
15,946,147
61,602,612
December
11,830,288
8,059,067
1,538,986
2,417,254
8,698,763
4,439,470
10,193,986
591,689
16,427,991
64,197,494
Source: Central Bank of Sudan
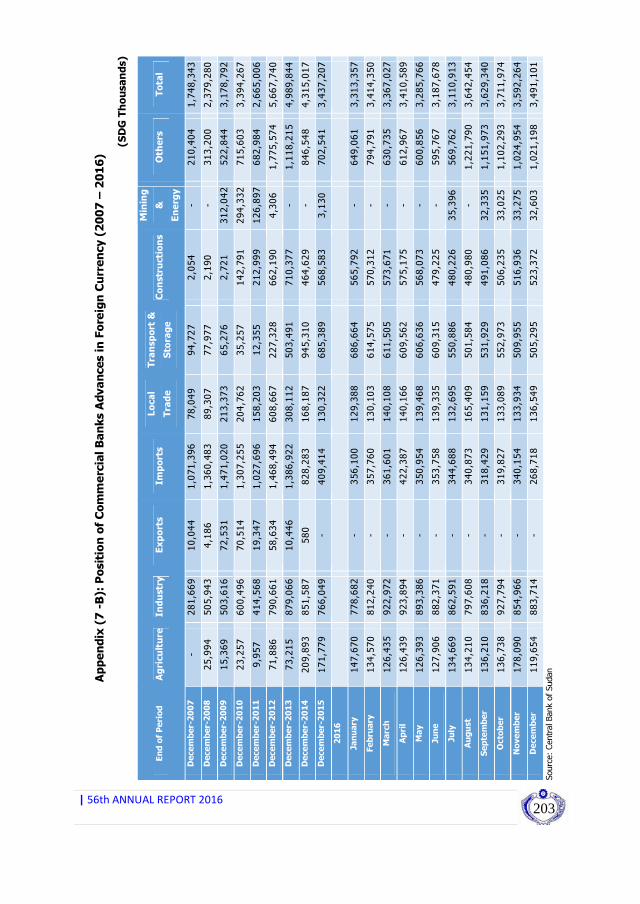
|56thANNUALREPORT2016
203
Appendix (7 -B): Position of Commercial Banks Advances in Foreign Currency (200
7 – 2016)
(SDG Thousands)
End of Period
Agriculture
Industry
Exports
Imports
Local
Trade
Transport &
Storage
Constructions
Mining
&
Energy
Others
Total
December-2007
- 281,6
69
10,0
44
1,0
71,3
96
78,0
49
94,7
27
2,0
54
- 210,4
04
1,7
48,3
43
December-2008
25,9
94
505,9
43
4,1
86
1,3
60,4
83
89,3
07
77,9
77
2,1
90
- 313,2
00
2,3
79,2
80
December-2009
15,3
69
503,6
16
72,5
31
1,4
71,0
20
213,3
73
65,2
76
2,7
21
312,0
42
522,8
44
3,1
78,7
92
December-2010
23,2
57
600,4
96
70,5
14
1,3
07,2
55
204,7
62
35,2
57
142,7
91
294,3
32
715,6
03
3,3
94,2
67
December-2011
9,9
57
414,5
68
19,3
47
1,0
27,6
96
158,2
03
12,3
55
212,9
99
126,8
97
682,9
84
2,6
65,0
06
December-2012
71,8
86
790,6
61
58,6
34
1,4
68,4
94
608,6
67
227,3
28
662,1
90
4,3
06
1,7
75,5
74
5,6
67,7
40
December-2013
73,2
15
879,0
66
10,4
46
1,3
86,9
22
308,1
12
503,4
91
710,3
77
- 1,1
18,2
15
4,9
89,8
44
December-2014
209,8
93
851,5
87
580
828,2
83
168,1
87
945,3
10
464,6
29
- 846,5
48
4,3
15,0
17
December-2015
171,7
79
766,0
49
- 409,4
14
130,3
22
685,3
89
568,5
83
3,1
30
702,5
41
3,4
37,2
07
2016
January
147,6
70
778,6
82
-
356,1
00
129,3
88
686,6
64
565,7
92
-
649,0
61
3,3
13,3
57
February
134,5
70
812,2
40
-
357,7
60
130,1
03
614,5
75
570,3
12
-
794,7
91
3,4
14,3
50
March
126,4
35
922,9
72
-
361,6
01
140,1
08
611,5
05
573,6
71
-
630,7
35
3,3
67,0
27
April
126,4
39
923,8
94
-
422,3
87
140,1
66
609,5
62
575,1
75
-
612,9
67
3,4
10,5
89
May
126,3
93
893,3
86
-
350,9
54
139,4
68
606,6
36
568,0
73
-
600,8
56
3,2
85,7
66
June
127,9
06
882,3
71
-
353,7
58
139,3
35
609,3
15
479,2
25
-
595,7
67
3,1
87,6
78
July
134,6
69
862,5
91
-
344,6
88
132,6
95
550,8
86
480,2
26
35,3
96
569,7
62
3,1
10,9
13
August
134,2
10
797,6
08
-
340,8
73
165,4
09
501,5
84
480,9
80
-
1,2
21,7
90
3,6
42,4
54
September
136,2
10
836,2
18
-
318,4
29
131,1
59
531,9
29
491,0
86
32,3
35
1,1
51,9
73
3,6
29,3
40
October
136,7
38
927,7
94
-
319,8
27
133,0
89
552,9
73
506,2
35
33,0
25
1,1
02,2
93
3,7
11,9
74
November
178,0
90
854,9
66
-
340,1
54
133,9
34
509,9
55
516,9
36
33,2
75
1,0
24,9
54
3,5
92,2
64
December
119,6
54
883,7
14
-
268,7
18
136,5
49
505,2
95
523,3
72
32,6
03
1,0
21,1
98
3,4
91,1
01
Source: Central Bank of Sudan
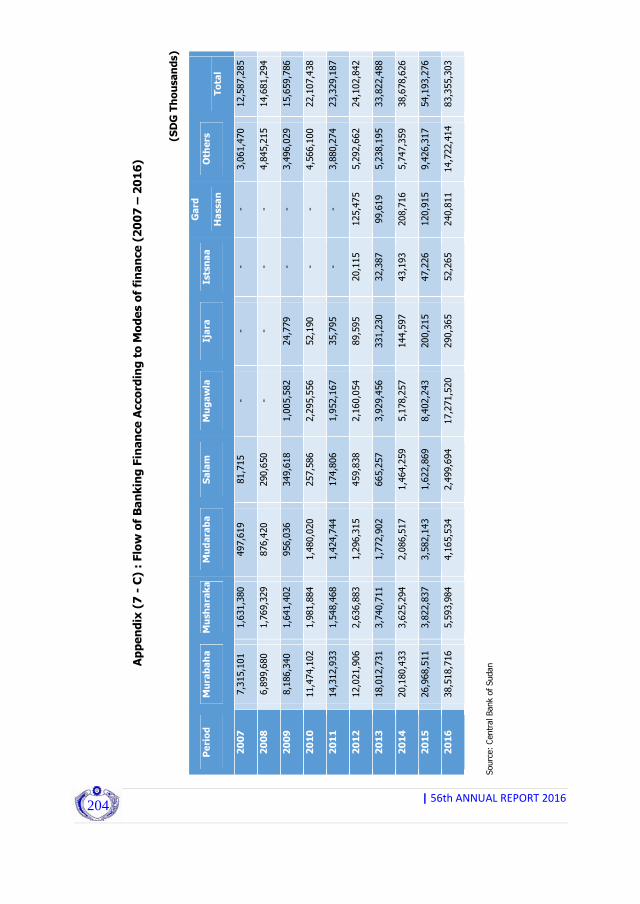
|56thANNUALREPORT2016
204
Appendix (7 - C) : Flow of Banking Finance According to Modes of finance (2007 – 2016)
(SDG Thousands)
Period
Murabaha
Musharaka
Mudaraba
Salam
Mugawla
Ijara
Istsnaa
Gard
Hassan
Others
Total
2007
7,3
15,1
01
1,6
31,3
80
497,6
19
81,7
15
-
-
-
-
3,0
61,4
70
12,5
87,2
85
2008
6,8
99,6
80
1,7
69,3
29
876,4
20
290,6
50
-
-
-
-
4,8
45,2
15
14,6
81,2
94
2009
8,1
86,3
40
1,6
41,4
02
956,0
36
349,6
18
1,0
05,5
82
24,7
79
-
-
3,4
96,0
29
15,6
59,7
86
2010
11,4
74,1
02
1,9
81,8
84
1,4
80,0
20
257,5
86
2,2
95,5
56
52,1
90
-
-
4,5
66,1
00
22,1
07,4
38
2011
14,3
12,9
33
1,5
48,4
68
1,4
24,7
44
174,8
06
1,9
52,1
67
35,7
95
-
-
3,8
80,2
74
23,3
29,1
87
2012
12,0
21,9
06
2,6
36,8
83
1,2
96,3
15
459,8
38
2,1
60,0
54
89,5
95
20,1
15
125,4
75
5,2
92,6
62
24,1
02,8
42
2013
18,0
12,7
31
3,7
40,7
11
1,7
72,9
02
665,2
57
3,9
29,4
56
331,2
30
32,3
87
99,6
19
5,2
38,1
95
33,8
22,4
88
2014
20,1
80,4
33
3,6
25,2
94
2,0
86,5
17
1,4
64,2
59
5,1
78,2
57
144,5
97
43,1
93
208,7
16
5,7
47,3
59
38,6
78,6
26
2015
26,9
68,5
11
3,8
22,8
37
3,5
82,1
43
1,6
22,8
69
8,4
02,2
43
200,2
15
47,2
26
120,9
15
9,4
26,3
17
54,1
93,2
76
2016
38,5
18,7
16
5,5
93,9
84
4,1
65,5
34
2,4
99,6
94
17,2
71,5
20
290,3
65
52,2
65
240,8
11
14,7
22,4
14
83,3
55,3
03
Source: Central Bank of Sudan
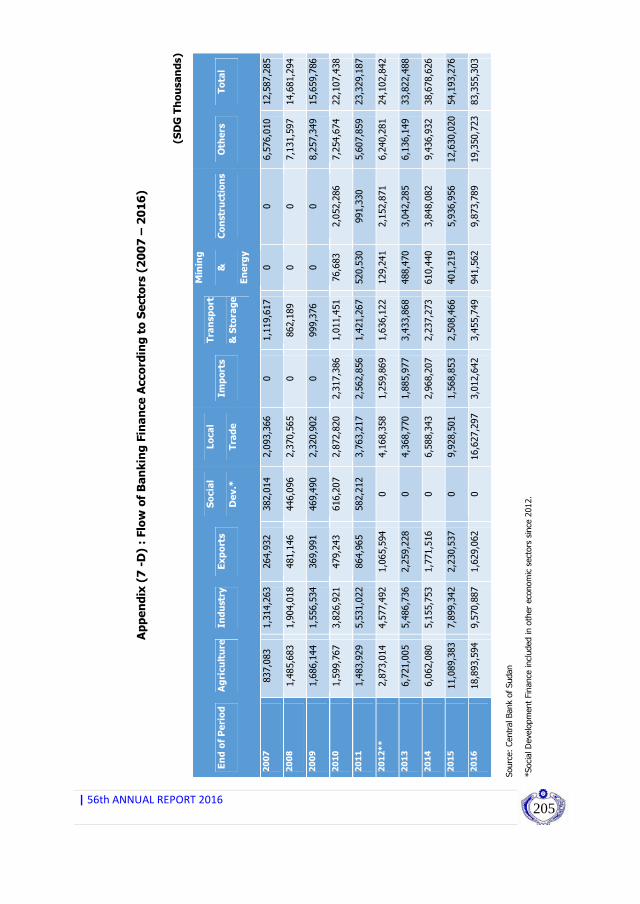
|56thANNUALREPORT2016
205
Appendix (7 -D) : Flow of Banking Finance According to Sectors (2007 – 2016)
(SDG Thousands)
End of Period
Agriculture
Industry
Exports
Social
Dev.*
Local
Trade
Imports
Transport
& Storage
Mining
&
Energy
Constructions
Others
Total
2007
837,0
83
1,3
14,2
63
264,9
32
382,0
14
2,0
93,3
66
0
1,1
19,6
17
0
0
6,5
76,0
10
12,5
87,2
85
2008
1,4
85,6
83
1,9
04,0
18
481,1
46
446,0
96
2,3
70,5
65
0
862,1
89
0
0
7,1
31,5
97
14,6
81,2
94
2009
1,6
86,1
44
1,5
56,5
34
369,9
91
469,4
90
2,3
20,9
02
0
999,3
76
0
0
8,2
57,3
49
15,6
59,7
86
2010
1,5
99,7
67
3,8
26,9
21
479,2
43
616,2
07
2,8
72,8
20
2,3
17,3
86
1,0
11,4
51
76,6
83
2,0
52,2
86
7,2
54,6
74
22,1
07,4
38
2011
1,4
83,9
29
5,5
31,0
22
864,9
65
582,2
12
3,7
63,2
17
2,5
62,8
56
1,4
21,2
67
520,5
30
991,3
30
5,6
07,8
59
23,3
29,1
87
2012**
2,8
73,0
14
4,5
77,4
92
1,0
65,5
94
0
4,1
68,3
58
1,2
59,8
69
1,6
36,1
22
129,2
41
2,1
52,8
71
6,2
40,2
81
24,1
02,8
42
2013
6,7
21,0
05
5,4
86,7
36
2,2
59,2
28
0
4,3
68,7
70
1,8
85,9
77
3,4
33,8
68
488,4
70
3,0
42,2
85
6,1
36,1
49
33,8
22,4
88
2014
6,0
62,0
80
5,1
55,7
53
1,7
71,5
16
0
6,5
88,3
43
2,9
68,2
07
2,2
37,2
73
610,4
40
3,8
48,0
82
9,4
36,9
32
38,6
78,6
26
2015
11,0
89,3
83
7,8
99,3
42
2,2
30,5
37
0
9,9
28,5
01
1,5
68,8
53
2,5
08,4
66
401,2
19
5,9
36,9
56
12,6
30,0
20
54,1
93,2
76
2016
18,8
93,5
94
9,5
70,8
87
1,6
29,0
62
0
16,6
27,2
97
3,0
12,6
42
3,4
55,7
49
941,5
62
9,8
73,7
89
19,3
50,7
23
83,3
55,3
03
Source: Central Bank of Sudan
*Social Development Finance included in other economic sectors since 2012.

|56thANNUALREPORT2016
206
Appendix (8)
Spread of Banks Branches During 2015 – 2016
Commercial Banks
B a n k s
Central Bank
of
Sudan
Specialized
Banks
National
Banks
Joint Venture
Banks
Foreign
Banks
Total*
States
Dec
2015
Dec
2016
Dec
2015
Dec
2016
Dec
2015
Dec
2016
Dec
2015
Dec
2016
Dec
2015
Dec
2016
Dec
2015
Dec
2016
Khartoum State
1
1
33
36
9
9
233
254
12
13
287
312
Central States ( Sinar,
Gazira, Blue Nile and
White Nile )
4
4
50
54
9
9
62
74
0
0
121
137
Eastern States (Gadarif,
Kassala and Red Sea)
3
3
22
23
3
3
57
59
0
0
82
85
Northern States (Northern
and River Nile )
2
2
33
34
3
3
34
35
0
0
70
72
Kordofan States (North,
Southern and W
estern
Kordofan)
2
2
21
26
8
8
36
36
0
0
65
70
Darfur States (Northern,
Southern ,Western, Center
and Eastern )
5
5
23
25
3
3
28
28
0
0
54
56
Total
17
17
182
198
35
35
450
486
12
13
679
732
Source: Central Bank of Sudan
* Total are not Include the Central Bank of Sudan Branches.

|56thANNUALREPORT2016
207
Appendix (9-A)
Real GDP based on the Economic Activities
During (2006-2016) Using Base Year 1982/1981
(Million pounds)
Sector
2007*
*
2008*
*
2009*
*
2010*
*
2011*
*
2012*
*
2013*
*
2014*
*
2015*
*
*2
01
6
Agriculture, Forests,
Animal
7.5
0
7.0
2
6.7
9
7.5
9
8.0
5
8.7
7
8.5
4
9.3
6
9.8
8
10.4
2
Mining and quarrying
2.4
0
2.5
7
2.6
2
2.5
6
1.6
7
0.5
3
0.8
4
0.7
9
0.7
1
0.6
1
Processing and
Handcraft
2.6
0
2.6
3
3.1
4
3.4
5
4.2
6
4.2
2
4.2
6
4.2
4
4.4
1
4.6
4
Electricity, Water, and
Gas
0.6
0
0.5
6
0.6
0.6
4
0.6
7
0.7
2
0.7
7
0.8
2
0.9
1
0.9
6
Building and
Construction
0.7
0
0.7
4
0.7
8
0.8
0.5
9
0.4
7
0.6
4
0.5
6
0.5
9
0.6
2
Trade, Hotels and
Restaurants
1.9
0
2.0
5
2.1
3
2.2
4
2.5
9
2.4
9
2.6
3
2.7
4
2.8
6
2.9
8
Finance, Insurance,
Banking, and others
2.9
0
2.80
3.
00
3.1
5
3.3
2
3.5
3
3.7
2
3.8
2
4.0
1
4.2
3
Transport and
Communications
2.3
0
1.8
9
2.5
1
2.6
5
2.6
8
2.8
2
3.2
6
3.9
4
4.1
4.2
9
Government Services
3.5
0
2.80
2.8
9
2.9
5
3.1
2
3.4
5
4.1
8
4.4
6
4.6
4.8
7
Other Services***
NA
0.3
7
0.4
3
0.4
5
0.0
9
0.6
8
0.7
2
0.9
1
0.9
4
0.9
9
GDP at constant
prices
22.4
0
23.42
24.87
26.48
27.04
27.68
29.56
31.64
33.01
34.62
GDP Deflator
4,755.70
5,786.20
5,604.60
6,066.70
6,736.40
8,040.00
10,288.10
14,159.20
17,659.40
20,032.20
GDP at Current Prices
106,527.00
135,511.70
139,386.50
160,647.00
182,151.30
222,547.90
304,116.80
447,998.20
582,937.40 693,514.00
Growth Rate
10.3
4.6
6.2
6.5
2.1
2.4
6.8
7.
0
4.3
4.9
Sourc
e:
Centr
al Bure
au o
f Sta
tist
ics
*Pre
limin
ary
Data
Adju
sted D
ata**

|56thANNUALREPORT2016
208
Appendix (9-B)
GDP based on the Economic Activities at Current Prices
During (2006-2016)
(Million pounds)
Sector
20
07**
20
08**
20
09**
20
10**
20
11**
20
12**
20
13**
20
14**
20
15**
*2016
Agriculture, Forests,
Animal
3
2,9
85.5
0
4
9,0
32.0
0
4
4,9
71.0
0
5
4,4
65.0
0
5
8,2
21.0
0
7
6,2
62.0
0
9
2,9
90.0
0
143,7
75.0
0
183,1
50.0
0
218,8
79.0
0
Mining and quarrying
1
0,3
33.8
0
2
3,1
44.0
0
1
5,7
77.0
0
1
4,9
43.0
0
1
6,6
80.0
0
1
1,1
71.0
0
2
7,5
58.0
0
3
2,8
52.0
0
2
4,1
88.0
0
2
9,8
72.0
0
Processing and
Handcraft
8
,781.9
0
9
,862.0
0
1
1,7
69.0
0
1
2,9
75.0
0
1
6,5
60.0
0
2
0,3
36.0
0
2
3,8
45.0
0
2
9,5
59.0
0
6
0,0
91.0
0
7
2,8
31.0
0
Electricity, Water, and
Gas
1,981.40
508.0
0
794.0
0
893.0
0
1
,005.0
0
1
,164.0
0
1
,275.0
0
1
,388.0
0
5
,503.0
0
6
,507.0
0
Building and
Construction
4,650.70
4
,711.0
0
6
,087.0
0
7
,340.0
0
8
,259.0
0
7
,109.0
0
1
0,8
81.0
0
1
5,9
70.0
0
2
8,0
80.0
0
3
3,4
92.0
0
Trade, Hotels and
Restaurants
16,727.80
1
8,3
76.0
0
2
0,6
13.0
0
2
3,3
81.0
0
2
4,8
38.0
0
3
5,1
72.0
0
4
9,2
83.0
0
7
3,5
51.0
0
9
9,1
66.0
0
117,2
61.0
0
Finance, Insurance,
Banking, and others
7,808.90
1
0,2
51.0
0
1
2,5
28.0
0
1
5,6
33.0
0
2
1,3
70.0
0
2
8,5
68.0
0
4
1,7
06.0
0
5
7,0
93.0
0
4
4,4
53.0
0
5
2,5
70.0
0
Transport and
Communications
13,781.20
1
0,1
57.0
0
1
4,2
52.0
0
1
6,9
04.0
0
1
8,7
43.0
0
2
3,2
04.0
0
2
9,6
89.0
0
6
0,0
74.0
0
8
4,4
54.0
0
9
8,7
37.0
0
Government Services
5,943.70
8
,313.0
0
9
,370.0
0
1
0,1
57.0
0
1
1,2
27.0
0
1
2,4
10.0
0
1
6,1
36.0
0
2
3,3
78.0
0
3
6,8
57.0
0
4
3,3
48.0
0
Other Services***
1
,534.7
0
937.0
0
1
,611.0
0
2
,132.0
0
3
,280.0
0
4
,636.0
0
7
,120.0
0
4
,876.0
0
1
0,6
96.0
0
1
1,9
85.0
0
Imports Tariff
1,997.40
221.0
0
1
,614.0
0
1
,824.0
0
1
,968.0
0
2
,516.0
0
3
,633.0
0
5
,483.6
0
6
,299.0
0
8
,030.0
0
GDP at Current Prices
106,527.00
135,512.00 139,387.00 160,647.00 182,151.00 222,548.00 304,117.00 447,998.00 582,937.00 693,514.00
Sourc
e:
Centr
al Bure
au o
f Sta
tistics
*Pre
limin
ary
Data
Adju
sted D
ata**

|56thANNUALREPORT2016
209
Ap
pen
dix
(1
0)
Cu
l tiv
ate
d a
nd
Ha
rveste
d A
rea
fo
r sea
so
ns (
20
13
/2
01
4 -
20
15
/2
01
6)
( p
ro
du
cti
on
: T
ho
usa
nd
Me
tric
To
ns –
P
ro
du
cti
vit
y:
Kil
og
ra
m /
Fe
dd
an
s –
Are
a:
Th
ou
sa
nd
s F
ed
da
ns)
Season 2014/2013
Season 2015/2014
Season 2016/2015
Season
Crop
Cultivated
Harvested
Production
Productivity
Cultivated
Harvested
Production
Productivity
Cultivated
Harvested
Production
Productivity
Dura
19,738
NA
2,249
217
24,808
NA
6,208
306
19,832
NA
2,744
222
Sorghum
6,590
NA
359
100
9,826
NA
1,084
158
7,120
NA
486
120
Wheat
291
NA
190
692
564
NA
473
884
548
NA
779
1,400
Ground
nuts
4.817
NA
963
323
6,417
NA
1,871
360
5,336
NA
1,042
299
Sunflower
251
NA
56
371
180
NA
51
336
261
NA
70
318
Sesame
2,848
NA
205
107
7,764
NA
721
114
5,757
NA
329
95
Cotton
193
NA
162
0.8
176
NA
176
1.0
222
NA
205
1.01
Sourc
e:
Min
istr
y o
f Agricu
lture
and F
ore
stry
- Agricu
ltura
l Sta
tist
ics
Est
imation

|56thANNUALREPORT2016
210
Appendix (11)
Sugar Production for the period
(
Th
ou
sa
nd
Me
tric
To
ns)
Year
El Ginaid
New Halfa
Sennar
Hager
Assalaya
Kenana
White Nile
Total
20
06
/2
00
5
81.1
84.8
80.6
81.4
400.2
- 728.1
20
07
/2
00
6
87.2
83.1
92.0
89.5
405.0
- 756.8
20
08
/2
00
7
84.8
81.1
85.5
90.8
402.3
- 744.5
20
09
/2
00
8
87.6
84.2
87.1
97.5
382.1
- 738.5
20
10
/2
00
9
88.2
57.3
76.6
75.5
344.4
- 642
20
11
/2
01
0
91.8
74.7
70.8
93.7
355.8
- 686.8
201
1 / 201
2
92.4
66.0
76.7
89.6
349.8
5.642
680.1
201
2 / 201
3
76.7
56.2
76.0
89.6
471.1
73.0
84
2.6
201
3 / 201
4
73.1
59.5
73.1
65.4
349.8
74.4
69
5.3
20
15
/
20
14
67.6
64.3
58
324.8
64.5
67.6
64
2
20
16
/2
01
5
55
54.6
52.7
299.5
78
55
60
5.6
Source: Sudanese Sugar Company, Kenana Sugar Company and W
hite Nile Sugar Company

|56thANNUALREPORT2016
211
Ap
pen
dix
(1
2)
Mo
des o
f T
ran
sp
ort
Du
rin
g t
he P
eri
od
(2
01
1-2
01
6)
Sourc
e: Tra
nsp
ort U
nio
n, River Tra
nsp
ort u
nio
n, Sudan R
ailw
ay C
orp
ora
tion, M
inistry o
f Tra
nsp
ort, Roads
and B
ridges,
Khartoum
Inte
rnational Airport
Com
pany.
*In
cludes
air tra
nsp
ort thro
ugh S
udanese
airports
thro
ugh S
udanese
Airways
and o
ther airlin
es
Item
20
11
2
01
2
20
13
2
01
4
20
15
2
01
6
Air Transportation
* :
Cargo on International and Domestic Passenger
Aircrafts(Thousand /Tons)
32
31
38
29
33
30
Passengers on International and Domestic Travel
(Thousand Passengers)
2,580
2,712
2,6
29
2,2
99
2,717
2,927
Sudanese Navy Lines:
Goods transported (thousand tons)
158
736
323
75
1,820
N
A
Transported Passengers(thousand tons)
N
A
NA
21
67
25
N
A
Sudan Railway Corporation:
Goods transported (thousand tons)
994
1,056
1,102
857
718
618
Transported Passengers(thousand tons)
N
A
NA
13
188
179
210
River Transport corporation
:
Goods transported (thousand tons)
98
1
2
14
25
N
A
Transported Passengers(thousand tons)
34
1.5
0
33
12
N
A
Road Transport
:
Goods transported (thousand tons)
9,303
26,3
13
8,683
8,783
13,684
14,086
Transported Passengers(thousand tons)
18,000
37,200
47,400
30,000
19,174
25,703

|56thANNUALREPORT2016
212
Appendix (13)
Manufacturing production during the period (2011-2016)
Item
Unit
2
01
1
20
12
2
01
3
20
14
2
01
5
20
16
Sugar
Thousand Tons
687
680
842.6
695.3
642
605.6
Ethanol
Million Liters
39
33
67
70
36
24
Flour
Thousand Tons
1,410
1,450
1,694
1,957
2,000
2,126
Soft W
ater
Million Liters
698
720
882
794
455
434
Biscuits
Thousand Tons
44
66
69
81
NA
NA
Sweets and Tahnia
Thousand Tons
92
95
106
106
NA
NA
Jams
Thousand Tons
15
16
16
18
NA
14
Tomato Paste
Thousand Tons
21
12
NA
NA
NA
NA
Vegetable Oil
Thousand Tons
110
159
210
130
148
256
Leather
Million Units
18
NA
NA
NA
NA
NA
Paints
Thousand Tons
120
110
51
75
100
NA
Refrigerators
Thousand Units
120
150
161
180
119
141
Air Coolers
Thousand Units
17
18
17
18
280
189
اCement
Million Tons
3
2.9
2.9
3.4
3.7
4.0
Liquid Batteries
Thousand Units
10
NA
NA
NA
32
NA
Cars and Vehicles
Thousand Units
NA
2,573
NA
NA
NA
NA
Ceramic
Million Square M
eters
11
9
4
9.5
11.5
18
Powder Soap
Thousand Tons
76
78
84
NA
NA
NA
Reinforcing Steel
Thousand Tons
400
450
443
443
624
NA
School Books
Million Books
23
25
35
35
30
NA
School Books
Million Dozens
14
15
22
22
15
NA

|56thANNUALREPORT2016
213
Continued Appendix (13)
Item
Unit
2
01
1
20
12
2
01
3
20
14
2
01
5
20
16
Tractors
unit
NA
NA
227
122
229
NA
Agricultural
Equipmentt
unit
NA
NA
653
417
681
NA
Buses
unit
NA
NA
42
150
-
NA
Buses
unit
0
0
0
43
26
NA
Pick ups
unit
345
104
74
72
NA
Salon Cars
unit
2,195
2,145
2,435
1,521
1,647
NA
Station W
agon
unit
0
26
0
2
99
NA
Trucks
unit
249
162
129
52
61
NA
Motor Bikes
unit
NA
NA
NA
150
922
NA
Counterfeit /
Commercial Box /
Tipper
unit
NA
NA
174
148
NA
NA
Source: ministry of industry, General Department of inform
ation – Giad industrial area & Saria industrial Compound.
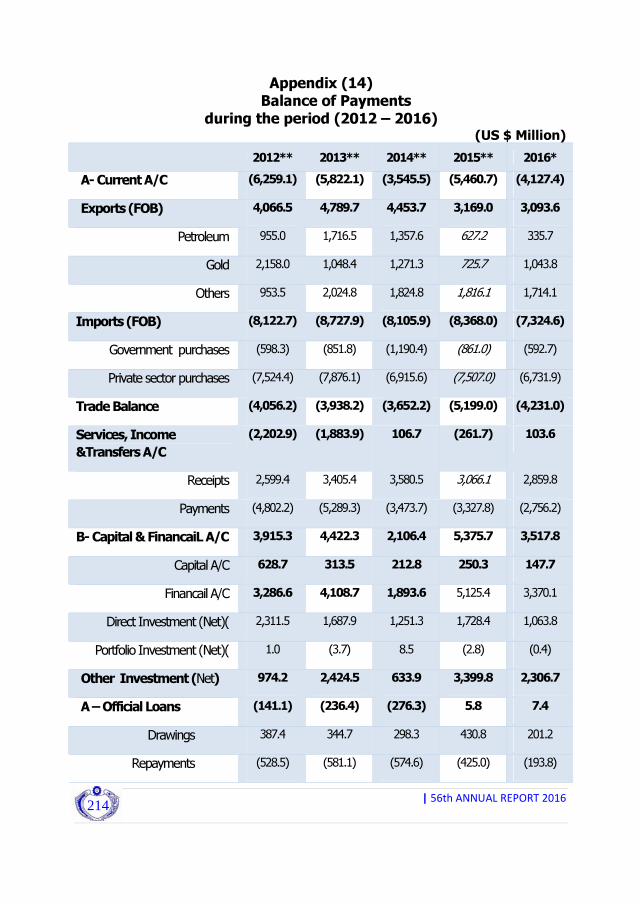
|56thANNUALREPORT2016
214
Appendix (14) Balance of Payments
during the period (2012 – 2016) (US $ Million)
2016* 2015** 2014** 2013** 2012**
(4,127.4) (5,460.7) (3,545.5) (5,822.1) (6,259.1) A- Current A/C
3,093.6 3,169.0 4,453.7 4,789.7 4,066.5 Exports (FOB)
335.7 627.2 1,357.6 1,716.5 955.0 Petroleum
1,043.8 725.7 1,271.3 1,048.4 2,158.0 Gold
1,714.1 1,816.1 1,824.8 2,024.8 953.5 Others
(7,324.6) (8,368.0) (8,105.9) (8,727.9) (8,122.7) Imports (FOB)
(592.7) (861.0) (1,190.4) (851.8) (598.3) Government purchases
(6,731.9) (7,507.0) (6,915.6) (7,876.1) (7,524.4) Private sector purchases
(4,231.0) (5,199.0) (3,652.2) (3,938.2) (4,056.2) Trade Balance
103.6 (261.7) 106.7 (1,883.9) (2,202.9) Services, Income
&Transfers A/C
2,859.8 3,066.1 3,580.5 3,405.4 2,599.4 Receipts
(2,756.2) (3,327.8) (3,473.7) (5,289.3) (4,802.2) Payments
3,517.8 5,375.7 2,106.4 4,422.3 3,915.3 B- Capital & FinancaiL A/C
147.7 250.3 212.8 313.5 628.7 Capital A/C
3,370.1 5,125.4 1,893.6 4,108.7 3,286.6 Financail A/C
1,063.8 1,728.4 1,251.3 1,687.9 2,311.5 Direct Investment (Net)(
(0.4) (2.8) 8.5 (3.7) 1.0 Portfolio Investment (Net)(
2,306.7 3,399.8 633.9 2,424.5 974.2 Other Investment (Net)
7.4 5.8 (276.3) (236.4) (141.1) A – Official Loans
201.2 430.8 298.3 344.7 387.4 Drawings
(193.8) (425.0) (574.6) (581.1) (528.5) Repayments
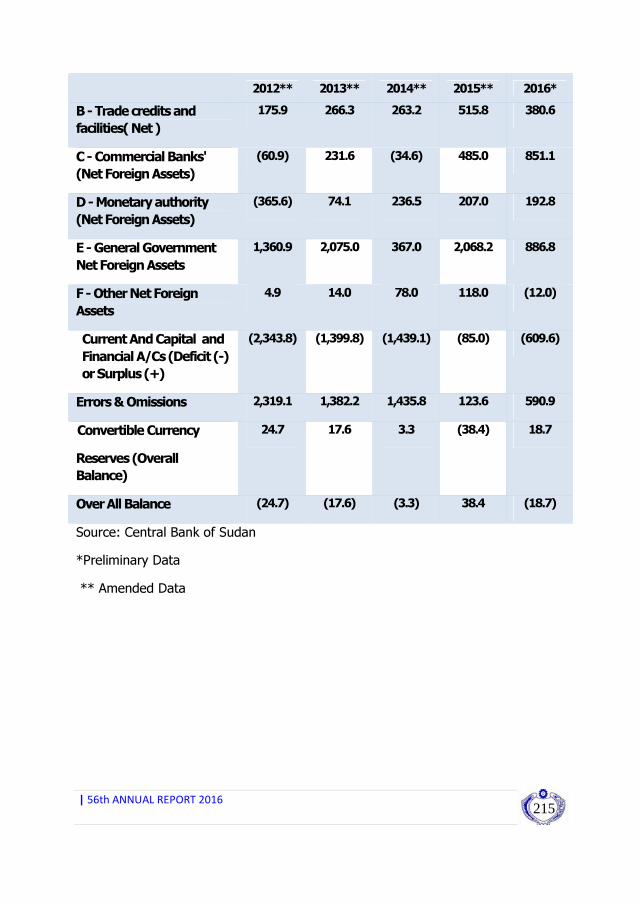
|56thANNUALREPORT2016
215
2016* 2015** 2014** 2013** 2012**
380.6 515.8 263.2 266.3 175.9 B - Trade credits and
facilities( Net )
851.1 485.0 (34.6) 231.6 (60.9) C - Commercial Banks'
(Net Foreign Assets)
192.8 207.0 236.5 74.1 (365.6) D - Monetary authority
(Net Foreign Assets)
886.8 2,068.2 367.0 2,075.0 1,360.9 E - General Government
Net Foreign Assets
(12.0) 118.0 78.0 14.0 4.9 F - Other Net Foreign
Assets
(609.6) (85.0) (1,439.1) (1,399.8) (2,343.8) Current And Capital and
Financial A/Cs (Deficit (-)
or Surplus (+)
590.9 123.6 1,435.8 1,382.2 2,319.1 Errors & Omissions
18.7 (38.4) 3.3 17.6 24.7 Convertible Currency
Reserves (Overall
Balance)
(18.7) 38.4 (3.3) (17.6) (24.7) Over All Balance
Source: Central Bank of Sudan
*Preliminary Data
** Amended Data
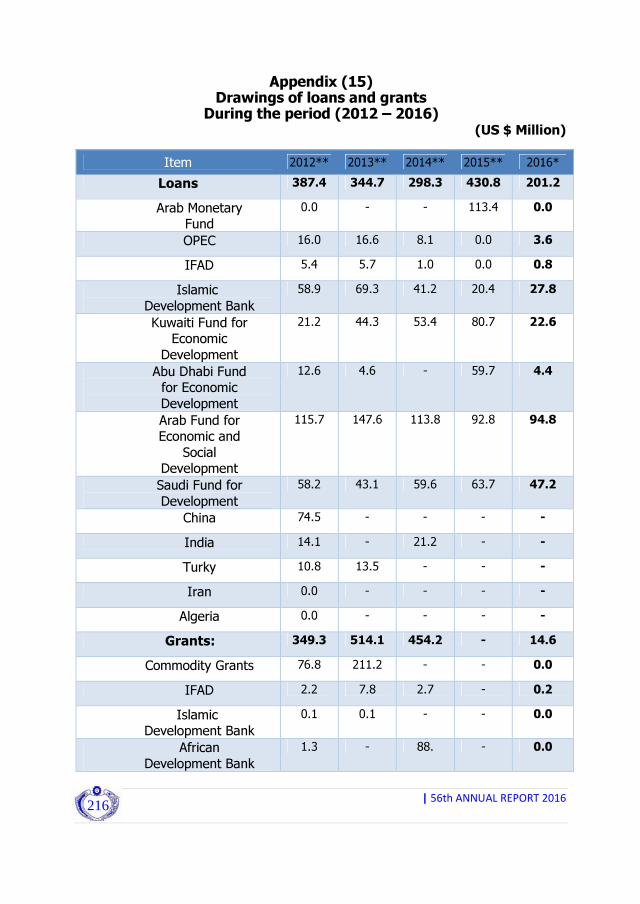
|56thANNUALREPORT2016
216
Appendix (15) Drawings of loans and grants
During the period (2012 – 2016) (US $ Million)
2016* 2015** 2014** 2013** 2012** Item
201.2 430.8 298.3 344.7 387.4 Loans
0.0 113.4 - - 0.0 Arab Monetary
Fund 3.6 0.0 8.1 16.6 16.0 OPEC
0.8 0.0 1.0 5.7 5.4 IFAD
27.8 20.4 41.2 69.3 58.9 Islamic
Development Bank 22.6 80.7 53.4 44.3 21.2 Kuwaiti Fund for
Economic
Development 4.4 59.7 - 4.6 12.6 Abu Dhabi Fund
for Economic
Development 94.8 92.8 113.8 147.6 115.7 Arab Fund for
Economic and
Social
Development 47.2 63.7 59.6 43.1 58.2 Saudi Fund for
Development - - - - 74.5 China
- - 21.2 - 14.1 India
- - - 13.5 10.8 Turky
- - - - 0.0 Iran
- - - - 0.0 Algeria
14.6 - 454.2 514.1 349.3 Grants:
0.0 - - 211.2 76.8 Commodity Grants
0.2 - 2.7 7.8 2.2 IFAD
0.0 - - 0.1 0.1 Islamic
Development Bank 0.0 - 8 .8 - 1.3 African
Development Bank
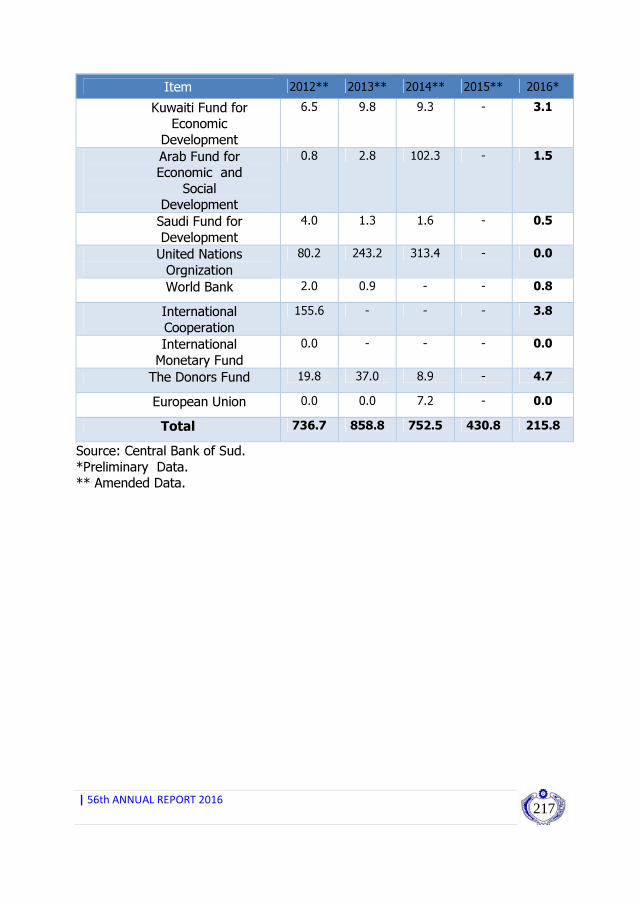
|56thANNUALREPORT2016
217
2016* 2015** 2014** 2013** 2012** Item
3.1 - 9.3 9.8 6.5 Kuwaiti Fund for
Economic
Development 1.5 - 102.3 2.8 0.8 Arab Fund for
Economic and
Social
Development 0.5 - 1.6 1.3 4.0 Saudi Fund for
Development 0.0 - 313.4 243.2 80.2 United Nations
Orgnization 0.8 - - 0.9 2.0 World Bank
3.8 - - - 155.6 International
Cooperation 0.0 - - - 0.0 International
Monetary Fund 4.7 - 8.9 37.0 19.8 The Donors Fund
0.0 - 7.2 0.0 0.0 European Union
215.8 430.8 752.5 858.8 736.7 Total
Source: Central Bank of Sud.
*Preliminary Data.
** Amended Data.

|56thANNUALREPORT2016
218
Appendix (16 – A)
Sudan’s Foreign Trade
Exports by Commodity during the period 2012 - 2016
(Valu
e in
US
$ M
illi
on
)
20
12
2
01
3
20
14
2
01
5
20
16
C
om
mod
itie
s
Un
it
Qu
an
tity
V
alu
e
Qu
an
tity
V
alu
e
Qu
an
tity
V
alu
e
Qu
an
tity
V
alu
e
Qu
an
tity
V
alu
e
Petr
ole
um
an
d
Min
era
ls
3,1
42,9
50
2,8
25,2
44
2,6
65,4
41
1,3
80,0
28
1,4
07,3
20
Cru
de O
il
Barrels
6,7
69,8
57
698,8
42
15,8
36,5
01,6
14,0
78
12,8
21,8
11,1
94,3
012,1
15,6
4573,9
06
6,8
98,3
96
271,0
62
Ben
zen
e
M.T
192,1
97
226,5
48
106,9
47
100,5
88
172,1
45
156,7
68
79,5
71
50,9
95
146,6
01
64,6
51
Kero
sen
e
" "
- -
- -
- -
4,4
16
2,0
70
- -
Lig
ht
Gas
" "
- -
- -
- -
- -
- -
F/O
& H
CG
O
" "
- -
- -
- -
- -
- -
Fu
rnace
" "
32,5
98
26,4
48
- -
43
102
- -
- -
Mix
ed
bu
tag
as
" "
38,3
58
3,1
50
1,1
19
1,8
79
165
295
100
110
- -
Die
sel
" "
- -
- -
- -
- -
- -
Oth
ers
Petr
ole
um
Pro
du
cts
Value
- -
- -
- 6,1
16
- 101
- -
Gold
K.G.
46,1
33
2,1
57,9
99
24,8
13
1,0
48,4
27
30,4
45
1,2
71,3
219,3
89
725,6
97
26,9
73
1,0
43,8
38
Cop
per
Waste
&S
cra
p
M.T
7,6
16
16,3
74
5,4
01
11,8
98
4,4
33
11,4
66
3,9
73
10,8
66
4,2
96
10,7
01
Lead
Waste
&
Scra
p
" "
1,4
58
1,7
50
1,5
54
2,8
33
3,1
11
3,6
32
6,2
36
6,8
71
5,1
75
6,4
35
Ch
rom
ium
"
" 2,6
00
3,3
80
17,3
33
3,5
33
42,8
70
11,3
46
13,8
00
2,9
82
- 156
Alu
min
um
scra
p
" "
- -
2,4
61
3,1
88
2,7
48
3,5
72
2,0
86
2,6
83
3,8
23
5,0
98
Iro
n W
aste
&
Scra
p
" "
5,6
39
8,4
59
42,5
95
23,4
98
2,8
06
596
1,4
55
1,1
35
- 176

|56thANNUALREPORT2016
219
continued : A
ppendix
(16 –
A)
20
12
2
01
3
20
14
2
01
5
20
16
Com
mod
itie
s
Un
it
Qu
an
tity
V
alu
e
Qu
an
tity
V
alu
e
Qu
an
tity
V
alu
e
Qu
an
tity
V
alu
e
Qu
an
tity
V
alu
e
Oth
er
Value
- -
- 15,3
22
- 5,9
24
- 2,6
12
- 5,2
03
Ag
ricu
ltu
ral
Pro
du
cts
35
1,4
90
90
0,6
71
75
5,2
20
75
1,3
88
75
1,3
06
Sesam
e
M.T
208,9
16
223,5
40
239,4
58
472,3
63
299,7
07
466,3
38
307,3
63
453,4
78
467,6
29
379,3
47
Gu
m A
rab
ic
" "
36,3
51
67,1
02
60,3
42
134,7
73
59,7
33
96,9
76
90,9
20
111,6
87
61,7
82
98,2
93
Cott
on
Bales
13,383
11,7
69
260,5
36
102,7
36
99,3
74
34,0
28
29,6
44
39,3
65
67,9
58
80,0
01
Melo
n S
eed
s
M.T
33,8
00
8,4
50
9,6
42
3,4
70
41,3
86
16,5
48
56,3
02
30,6
50
35,9
26
20,6
70
Du
ra (
Sorg
hu
m)
" "
55,8
80
13,9
70
243,4
43
77,9
16
19,0
71
6,0
36
107,3
41
28,1
69
108,1
91
28,1
80
Tre
foil
"
"
- -
109,7
48
32,5
03
248,0
18
66,2
48
137,5
47
30,3
18
146,2
59
36,0
37
Hib
iscu
s F
low
er
" "
15,6
56
14,0
90
13,8
73
17,2
80
13,6
79
18,4
85
14,2
53
18,7
40
15,5
84
16,4
91
Veg
eta
ble
s
" "
16,9
21
4,0
61
10,5
22
2,4
13
127,2
83
30,8
09
79,2
19
19,6
90
121,5
17
50,1
20
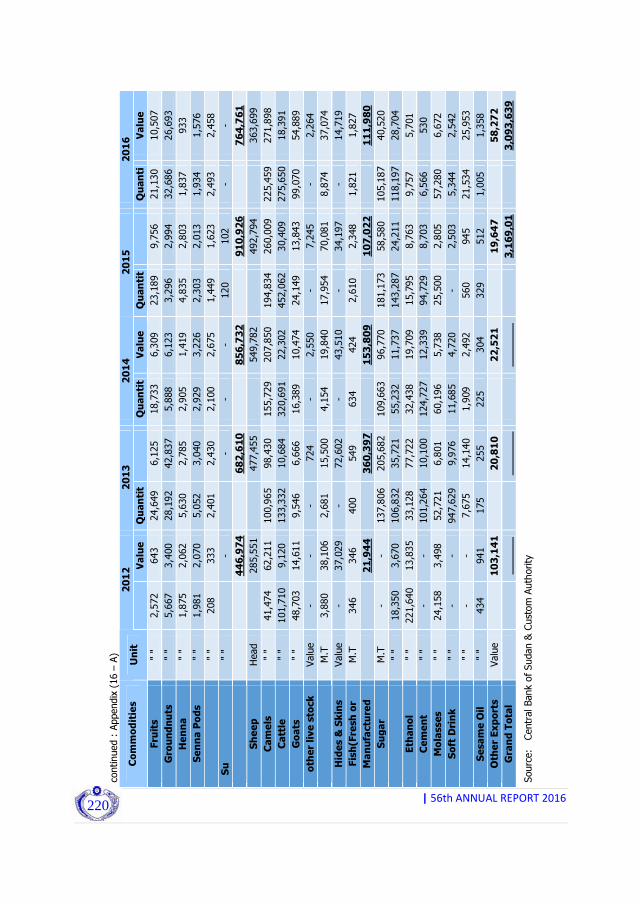
|56thANNUALREPORT2016
220
y
y
y
31
20
4
6
43
99
2
3
1
continued : A
ppendix
(16 –
A)
20
12
2
01
3
20
14
2
01
5
20
16
C
om
mod
itie
s
Un
it
Qu
an
tit
Valu
e
Qu
an
tit
Valu
e
Qu
an
tit
Valu
e
Qu
an
tit
Valu
e
Qu
an
tiV
alu
e
Fru
its
" "
2,5
72
643
24,6
49
6,1
25
18,7
33
6,3
09
23,1
89
9,7
56
21,1
30
10,5
07
Gro
un
dn
uts
"
" 5,6
67
3,4
00
28,1
92
42,8
37
5,8
88
6,1
23
3,2
96
2,9
94
32,6
86
26,6
93
Hen
na
" "
1,8
75
2,0
62
5,6
30
2,7
85
2,9
05
1,4
19
4,8
35
2,8
03
1,8
37
933
Sen
na P
od
s
" "
1,9
81
2,0
70
5,0
52
3,0
40
2,9
29
3,2
26
2,3
03
2,0
13
1,9
34
1,5
76
Lu
bb
an
"
" 208
333
2,4
01
2,4
30
2,1
00
2,6
75
1,4
49
1,6
23
2,4
93
2,4
58
Su
nfl
ow
er
Seeds
" "
-
-
- -
120
102
- -
Liv
e S
tock
44
6,9
74
68
2,6
10
85
6,7
32
91
0,9
26
76
4,7
61
Sh
eep
Head
2,5
38,2
285,5
51
3,8
99,3
477,4
55
4,0
62,0
1549,7
82
5,4
76,3
5492,7
94
3,9
67,1
363,6
99
Cam
els
"
" 41,4
74
62,2
11
100,9
65
98,4
30
155,7
29
207,8
50
194,8
34
260,0
09
225,4
59
271,8
98
Catt
le
" "
101,7
10
9,1
20
133,3
32
10,6
84
320,6
91
22,3
02
452,0
62
30,4
09
275,6
50
18,3
91
Goats
"
" 48,7
03
14,6
11
9,5
46
6,6
66
16,3
89
10,4
74
24,1
49
13,8
43
99,0
70
54,8
89
oth
er
live s
tock
Value
- -
- 724
- 2,5
50
- 7,2
45
- 2,2
64
Meat
M.T
3,8
80
38,1
06
2,6
81
15,5
00
4,1
54
19,8
40
17,9
54
70,0
81
8,8
74
37,0
74
Hid
es &
Skin
s
Value
- 37,0
29
- 72,6
02
- 43,5
10
- 34,1
97
- 14,7
19
Fis
h(F
resh
or
M.T
346
346
400
549
634
424
2,6
10
2,3
48
1,8
21
1,8
27
Man
ufa
ctu
red
2
1,9
44
36
0,3
97
15
3,8
09
10
7,0
22
11
1,9
80
Su
gar
M.T
- -
137,8
06
205,6
82
109,6
63
96,7
70
181,1
73
58,5
80
105,1
87
40,5
20
Cake &
Meal
" "
18,3
50
3,6
70
106,8
32
35,7
21
55,2
32
11,7
37
143,2
87
24,2
11
118,1
97
28,7
04
Eth
an
ol
" "
221,6
40
13,8
35
33,1
28
77,7
22
32,4
38
19,7
09
15,7
95
8,7
63
9,7
57
5,7
01
Cem
en
t "
" -
- 101,2
64
10,1
00
124,7
27
12,3
39
94,7
29
8,7
03
6,5
66
530
Mola
sses
" "
24,1
58
3,4
98
52,7
21
6,8
01
60,1
96
5,7
38
25,5
00
2,8
05
57,2
80
6,6
72
Soft
Dri
nk
" "
- -
947,6
29
9,9
76
11,6
85
4,7
20
- 2,5
03
5,3
44
2,5
42
Cru
de G
rou
nd
nu
ts
" "
- -
7,6
75
14,1
40
1,9
09
2,4
92
560
945
21,5
34
25,9
53
Sesam
e O
il
" "
434
941
175
255
225
304
329
512
1,0
05
1,3
58
Oth
er
Exp
ort
s
Value
1
03
,14
1
2
0,8
10
22
,52
1
1
9,6
47
58
,27
2
Gra
nd
Tota
l
4
,06
6,4
4
,78
9,7
3
4,4
53
,72
3
,16
9,0
1
3,0
93
,63
9
Source: Central Bank of Sudan & Custom Authority
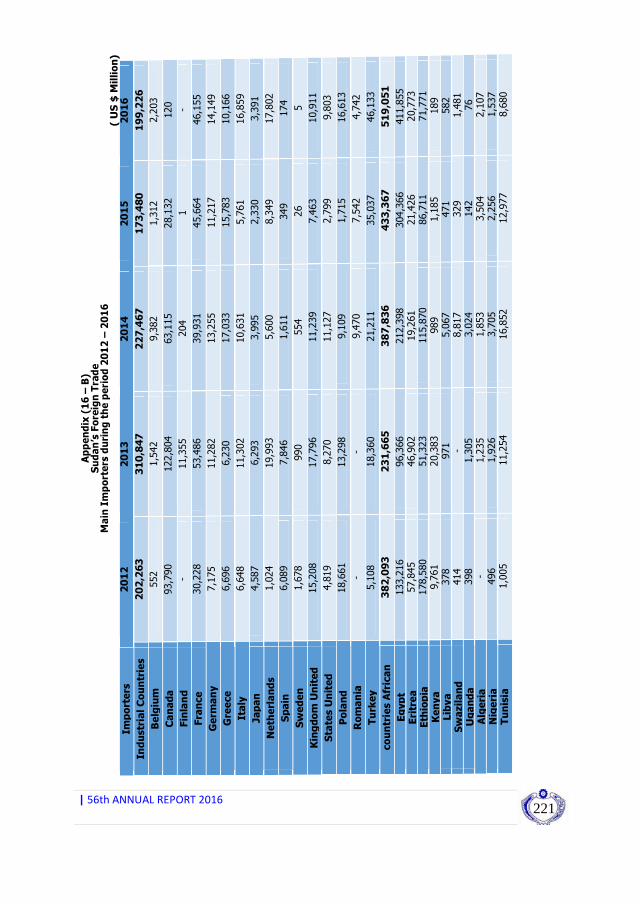
|56thANNUALREPORT2016
221
Appendix (16 – B)
Sudan’s Foreign Trade
Main Importers during the period 2012 – 2016
( US $ Million
) Im
porters
2012
2013
2014
2015
2016
Industrial Countries
202,263
310,847
227,467
173,480
199,226
Belgium
552
1,5
42
9,3
82
1,3
12
2,2
03
Canada
93,7
90
122,8
04
63,1
15
28,1
32
120
Finland
-
11,3
55
204
1
-
France
30,2
28
53,4
86
39,9
31
45,6
64
46,1
55
Germ
any
7,1
75
11,2
82
13,2
55
11,2
17
14,1
49
Greece
6,6
96
6,2
30
17,0
33
15,7
83
10,1
66
Italy
6,6
48
11,3
02
10,6
31
5,7
61
16,8
59
Japan
4,5
87
6,2
93
3,9
95
2,3
30
3,3
91
Netherlands
1,0
24
19,9
93
5,6
00
8,3
49
17,8
02
Spain
6,0
89
7,8
46
1,6
11
349
174
Sweden
1,6
78
990
554
26
5
United
Kingdom
15,2
08
17,7
96
11,2
39
7,4
63
10,9
11
United
States
4,8
19
8,2
70
11,1
27
2,7
99
9,8
03
Poland
18,6
61
13,2
98
9,1
09
1,7
15
16,6
13
Romania
-
- 9,4
70
7,5
42
4,7
42
Turkey
5,1
08
18,3
60
21,2
11
35,0
37
46,1
33
African
countries
382,093
231,665
387,836
433,367
519,051
Egypt
133,2
16
96,3
66
212,3
98
304,3
66
411,8
55
Eritrea
57,8
45
46,9
02
19,2
61
21,4
26
20,7
73
Ethiopia
178,5
80
51,3
23
115,8
70
86,7
11
71,7
71
Kenya
9,7
61
20,3
83
989
1,1
85
189
Libya
378
971
5,0
67
471
582
Swaziland
414
- 8,8
17
329
1,4
81
Uganda
398
1,3
05
3,0
24
142
76
Algeria
-
1,2
35
1,8
53
3,5
04
2,1
07
Nigeria
496
1,9
26
3,7
05
2,2
56
1,5
37
Tunisia
1,0
05
11,2
54
16,8
52
12,9
77
8,6
80
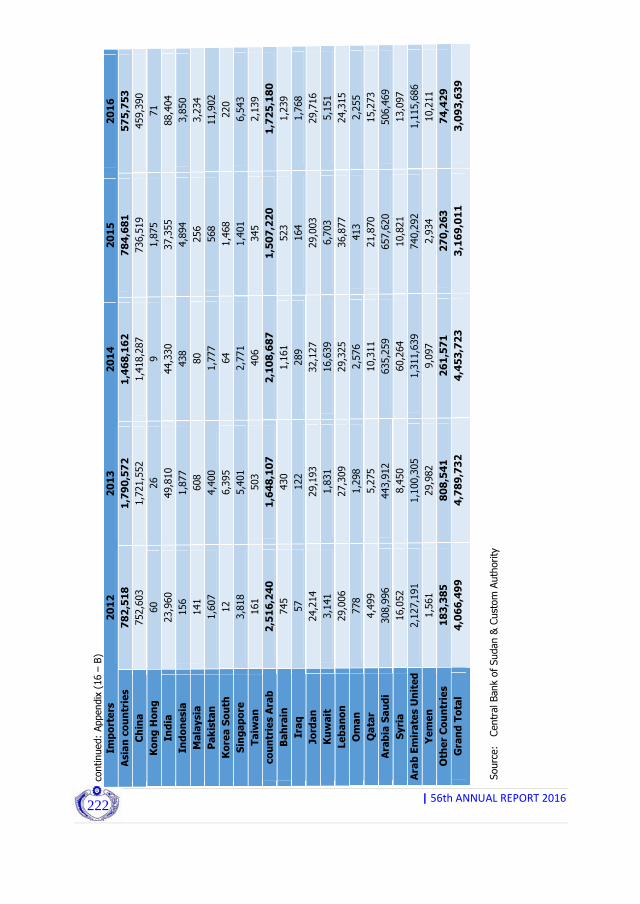
|56thANNUALREPORT2016
222
continued:
Appendix
(16 –
B)
Importers
2012
2013
2014
2015
2016
Asian countries
782,518
1,790,572
1,468,162
784,681
575,753
China
752,6
03
1,7
21,5
52
1,4
18,2
87
736,5
19
459,3
90
Hong
Kong
60
26
9
1,8
75
71
India
23,9
60
49,8
10
44,3
30
37,3
55
88,4
04
Indonesia
156
1,8
77
438
4,8
94
3,8
50
Malaysia
141
608
80
256
3,2
34
Pakistan
1,6
07
4,4
00
1,7
77
568
11,9
02
South
Korea
12
6,3
95
64
1,4
68
220
Singapore
3,8
18
5,4
01
2,7
71
1,4
01
6,5
43
Taiwan
161
503
406
345
2,1
39
Arab
countries
2,516,240
1,648,107
2,108,687
1,507,220
1,725,180
Bahrain
745
430
1,1
61
523
1,2
39
Iraq
57
122
289
164
1,7
68
Jordan
24,2
14
29,1
93
32,1
27
29,0
03
29,7
16
Kuwait
3,1
41
1,8
31
16,639
6,7
03
5,1
51
Lebanon
29,0
06
27,3
09
29,3
25
36,8
77
24,3
15
Oman
778
1,2
98
2,5
76
413
2,2
55
Qatar
4,4
99
5,2
75
10,3
11
21,8
70
15,2
73
Saudi
Arabia
308,9
96
443,9
12
635,2
59
657,6
20
506,4
69
Syria
16,0
52
8,4
50
60,2
64
10,8
21
13,0
97
United
Arab Emirates
2,1
27,1
91
1,1
00,3
05
1,3
11,6
39
740,2
92
1,1
15,6
86
Yemen
1,5
61
29,9
82
9,0
97
2,9
34
10,2
11
Other Countries
183,385
808,541
261,571
270,263
74,429
Grand Total
4,066,499
4,789,732
4,453,723
3,169,011
3,093,639
Source: Central Bank of Sudan & Custom Authority
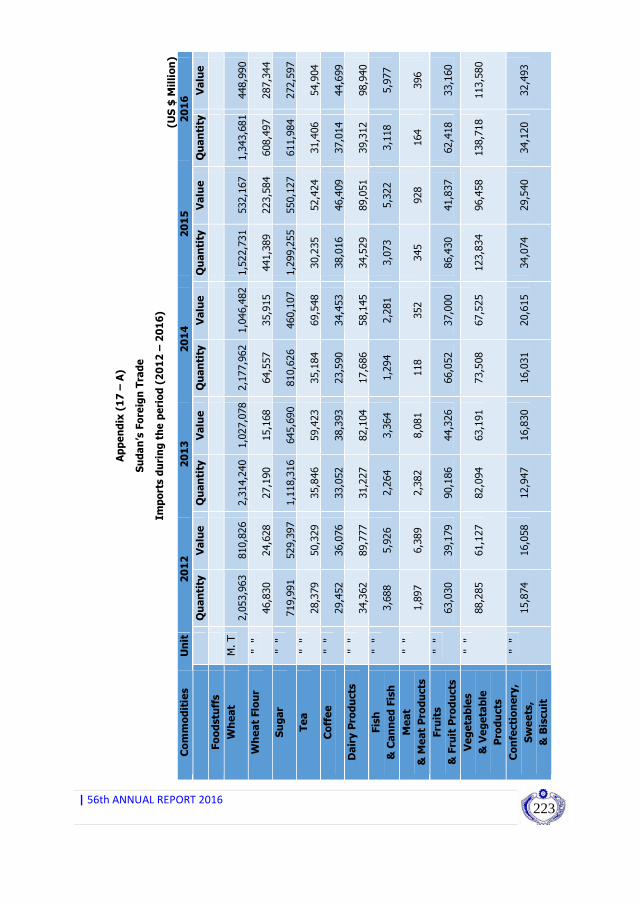
|56thANNUALREPORT2016
223
Ap
pe
nd
ix (
17
– A
)
Su
da
n’s
Fo
reig
n T
rad
e
Im
po
rts d
uri
ng
th
e p
eri
od
(2
01
2 –
20
16
)
(US $ Million)
Commodities
Unit
2012
2013
2014
2015
2016
Quantity
Value Quantity
Value Quantity
Value Quantity
Value Quantity
Value
Foodstuffs
Wheat
M. T
2,0
53,9
63
810,8
26
2,3
14,2
40
1,0
27,0
78
2,1
77,9
62
1,0
46,4
82
1,5
22,7
31
532,1
67
1,3
43,6
81
448,9
90
Wheat Flour
'' ''
46,8
30
24,6
28
27,1
90
15,1
68
64,5
57
35,9
15
441,3
89
223,5
84
608,4
97
287,3
44
Sugar
'' ''
719,9
91
529,3
97
1,1
18,3
16
645,6
90
810,6
26
460,1
07
1,2
99,2
55
550,1
27
611,9
84
272,5
97
Tea
'' ''
28,3
79
50,3
29
35,8
46
59,4
23
35,1
84
69,5
48
30,2
35
52,4
24
31,4
06
54,9
04
Coffee
'' ''
29,4
52
36,0
76
33,0
52
38,3
93
23,5
90
34,4
53
38,0
16
46,4
09
37,0
14
44,6
99
Dairy Products
'' ''
34,3
62
89,7
77
31,2
27
82,1
04
17,6
86
58,1
45
34,5
29
89,0
51
39,3
12
98,9
40
Fish
& Canned Fish
'' ''
3,6
88
5,9
26
2,2
64
3,3
64
1,2
94
2,2
81
3,0
73
5,3
22
3,1
18
5,9
77
Meat
& Meat Products
'' ''
1,8
97
6,3
89
2,3
82
8,0
81
118
352
345
928
164
396
Fruits
& Fruit Products
'' ''
63,0
30
39,1
79
90,1
86
44,3
26
66,0
52
37,0
00
86,4
30
41,8
37
62,4
18
33,1
60
Vegetables
& Vegetable
Products
'' ''
88,2
85
61,1
27
82,0
94
63,1
91
73,5
08
67,5
25
123,8
34
96,4
58
138,7
18
113,5
80
Confectionery,
Sweets,
& Biscuit
'' ''
15,8
74
16,0
58
12,9
47
16,8
30
16,0
31
20,6
15
34,0
74
29,5
40
34,1
20
32,4
93
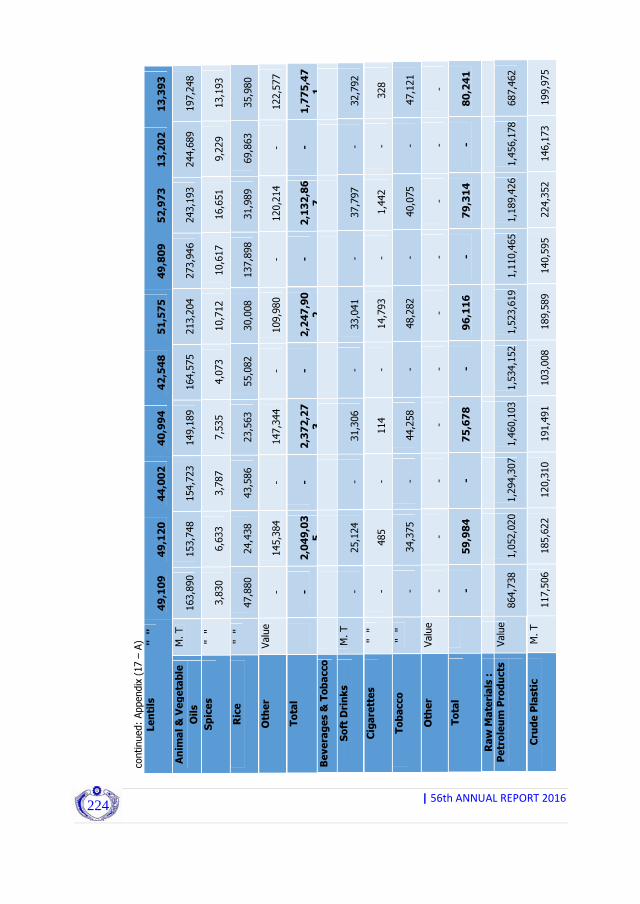
|56thANNUALREPORT2016
224
continued:
Appendix
(17 –
A)
Lentils
'' ''
49,109
49,120
44,002
40,994
42,548
51,575
49,809
52,973
13,202
13,393
Animal & Vegetable
Oils
M. T
163,890
153,748
154,723
149,189
164,575
213,204
273,946
243,193
244,689
197,248
Spices
'' ''
3,830
6,633
3,787
7,535
4,073
10,712
10,617
16,651
9,229
13,193
Rice
'' ''
47,880
24,438
43,586
23,563
55,082
30,008
137,898
31,989
69,863
35,980
Other
Value
-
145,384
-
147,344
-
109,980
-
120,214
-
122,577
Total
-
2,049,03
5
-
2,372,27
3
-
2,247,90
2
-
2,132,86
7
-
1,775,47
1
Beverages & Tobacco
Soft Drinks
M. T
-
25,124
-
31,306
-
33,041
-
37,797
-
32,792
Cigarettes
'' ''
-
485
-
114
-
14,793
-
1,442
-
328
Tobacco
'' ''
-
34,375
-
44,258
-
48,282
-
40,075
-
47,121
Other
Value
-
-
-
-
-
-
-
-
-
-
Total
-
59,984
-
75,678
-
96,116
-
79,314
-
80,241
Raw Materials :
Petroleum Products
Value
864,738
1,052,020
1,294,307
1,460,103
1,534,152
1,523,619
1,110,465
1,189,426
1,456,178
687,462
Crude Plastic
M. T
117,506
185,622
120,310
191,491
103,008
189,589
140,595
224,352
146,173
199,975

|56thANNUALREPORT2016
225
continued:
Appendix
(17 –
A)
Crude Rubber
'' ''
338
967
669
1,375
798
2,999
2,731
1,136
2,318
901
Tallow
'' ''
12,936
16,061
14,856
18,134
13,935
19,821
16,519
22,485
15,743
21,021
Seeds for Sowing
'' ''
1,698
13,214
722
8,812
1,418
12,245
746
9,366
924
8,540
Packing Paper
'' ''
8
1
113
859
0.05
4
-
-
-
-
Other
Value
-
35,335
-
20,011
-
8,157
-
131
-
224
Total
-
1,303,220
-
1,700,785
-
1,756,434
-
1,446,896
-
918,123
Chemicals :
Medicines, Medical &
Pharmaceutical l
Value
-
349,004
-
411,604
-
411,375
-
460,979
-
385,356
Chemical Products
'' -
122,607
-
133,723
-
110,000
-
122,128
-
122,787
Fertilizers
M. T
159,617
107,470
253,692
135,883
214,617
153,839
199,270
87,034
299,458
98,572
Tanning & Dying Materials
'' ''
32,892
62,512
32,357
59,140
33,682
80,062
127,630
74,190
42,530
85,456
Perfumes & Cosm
etics
'' ''
33,777
81,554
44,012
96,900
34,626
91,493
40,617
104,245
55,585
107,172
Explosives
'' ''
37,382
11,203
6,363
17,994
5,113
18,328
5,615
21,174
11,108
12,576
Other
Value
-
62,178
-
56,474
-
58,019
-
59,216
-
57,143
Total
-
796,528
-
911,718
-
923,116
-
928,966
-
869,062

|56thANNUALREPORT2016
226
continued:
Appendix
(17 –
A)
Manufactured Goods
Medical &
Pharm
aceutical l
Equipments
-
147,232
-
87,501
-
81,877
-
89,223
-
85,254
Leather Products
M. T
6,068
8,970
7,275
10,248
5,594
9,716
7,827
12,273
7,923
11,876
Manufactured Rubber
'' ''
7,498
21,250
6,763
23,026
4,296
18,712
6,761
20,746
6,787
20,523
Manufactured Plastics
'' ''
97,317
177,678
95,017
225,849
60,815
171,829
137,142
205,735
79,849
176,489
Manufactured Wood &
Cork
'' ''
169,171
51,211
119,951
57,069
103,401
53,567
152,817
61,951
142,820
68,804
Glass & Glassware
M. T
78,545
40,007
82,843
40,353
81,071
51,915
94,055
71,174
170,193
73,172
Iron & Steel
'' ''
788,136
739,869
726,744
710,715
554,877
639,837
997,776
803,269
937,584
696,899
Manufactured Metals
'' ''
47,121
120,917
54,300
129,140
42,211
107,974
57,962
127,743
70,955
120,901
Footwear
Value
-
67,257
-
89,961
-
79,307
-
91,453
-
76,660
Jute & Sacks
No.
229,676
171,691
58,754
88,636
36,128
95,209
73,172
106,822
49,260
79,375
Books, Magazines, and
Newspapers
M. T
3,410
69,818
2,434
19,365
2,021
11,815
2,785
11,709
4,900
31,181
Cement & Asbestos
Pipes
'' ''
28,146
7,960
43,840
11,514
41,901
13,245
309,558
11,805
84,323
17,187
Scientific Equipments
Value
-
105,410
-
107,341
-
85,042
-
83,903
-
73,508
Paper Products
M. T
143,690
152,934
125,821
140,611
99,155
117,177
139,761
147,889
127,182
123,420

|56thANNUALREPORT2016
227
continued:
Appendix
(17 –
A)
Ceramic Products
'' ''
110,536
49,628
127,115
52,891
97,320
45,775
117,085
61,141
117,275
56,913
Toys & Sport Goods
Value
-
10,644
-
8,099
-
6,372
-
6,877
-
7,109
Other
'' -
14,487
-
40,229
-
23,600
-
27,604
-
30,360
Total
-
1,956,963
-
1,842,548
-
1,612,969
-
1,941,317
-
1,749,631
Machinery &
Equipments
:
Non-Electrical
Appliances
M. T
125,931
582,317
121,598
612,428
86,265
493,773
104,967
460,842
102,823
418,997
Electrical Appliances
'' ''
-
317,395
-
242,449
-
264,648
-
297,987
-
345,862
Refrigerators
No.
7,329
27,553
9,885
37,365
7,253
28,833
8,059
28,908
9,577
34,115
Air Conditioners
'' 3,405
19,357
3,623
24,580
3,098
21,644
4,911
29,134
5,464
29,864
Machinery Spare Parts
Value
-
357,698
-
303,905
-
321,482
-
301,964
-
320,353
T.V., Radios , Recorders,
Tapes, etc.
Value
-
81,251
-
97,981
-
78,384
-
75,879
-
82,436
Dry Batteries
No.
2,991
2,277
3,387
3,658
3,149
4,060
3,606
7,387
1,771
4,338
Accumulators
'' 11,164
29,644
12,479
33,745
8,154
29,581
11,250
33,063
12,516
38,032
Tractors
'' 13,723
75,850
27,487
172,047
11,699
128,234
23,134
185,726
16,430
153,212
Ovens
'' 1,026
2,569
1,027
2,024
596
1,710
952
2,503
1,265
3,339
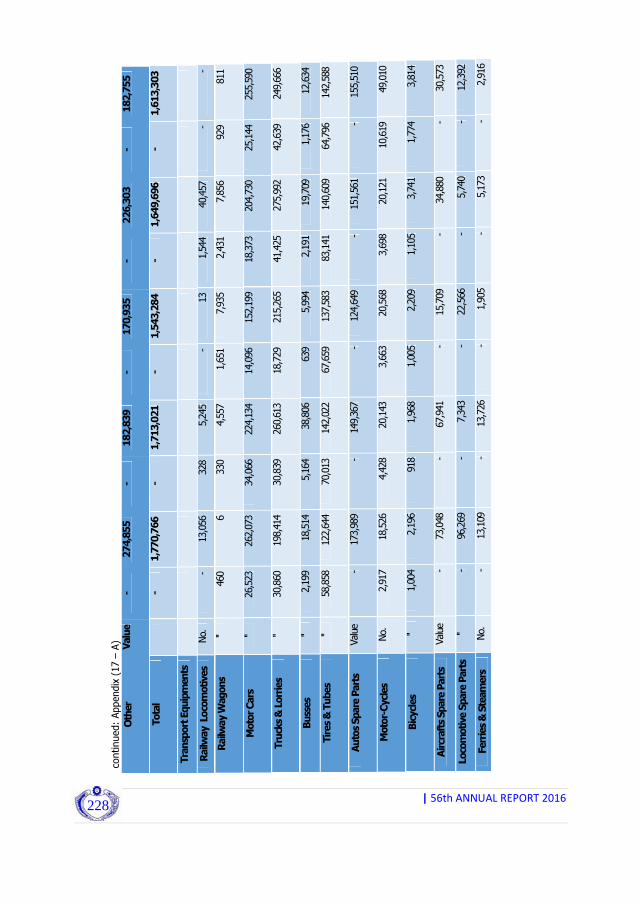
|56thANNUALREPORT2016
228
continued:
Appendix
(17 –
A)
Other
Value
-
274,855
-
182,839
-
170,935
-
226,303
-
182,755
Total
-
1,770,766
-
1,713,021
-
1,543,284
-
1,649,696
-
1,613,303
Transport Equipments
Railway Locomotives
No.
-
13,056
328
5,245
-
13
1,544
40,457
-
-
Railway Wagons
'' 460
6
330
4,557
1,651
7,935
2,431
7,856
929
811
Motor Cars
'' 26,523
262,073
34,066
224,134
14,096
152,199
18,373
204,730
25,144
255,590
Trucks & Lorries
'' 30,860
198,414
30,839
260,613
18,729
215,265
41,425
275,992
42,639
249,666
Busses
'' 2,199
18,514
5,164
38,806
639
5,994
2,191
19,709
1,176
12,634
Tires & Tubes
'' 58,858
122,644
70,013
142,022
67,659
137,583
83,141
140,609
64,796
142,588
Autos Spare Parts
Value
-
173,989
-
149,367
-
124,649
-
151,561
-
155,510
Motor-Cycles
No.
2,917
18,526
4,428
20,143
3,663
20,568
3,698
20,121
10,619
49,010
Bicycles
'' 1,004
2,196
918
1,968
1,005
2,209
1,105
3,741
1,774
3,814
Aircrafts Spare Parts
Value
-
73,048
-
67,941
-
15,709
-
34,880
-
30,573
Locomotive Spare Parts
'' -
96,269
-
7,343
-
22,566
-
5,740
-
12,392
Ferries & Steamers
No.
-
13,109
-
13,726
-
1,905
-
5,173
-
2,916
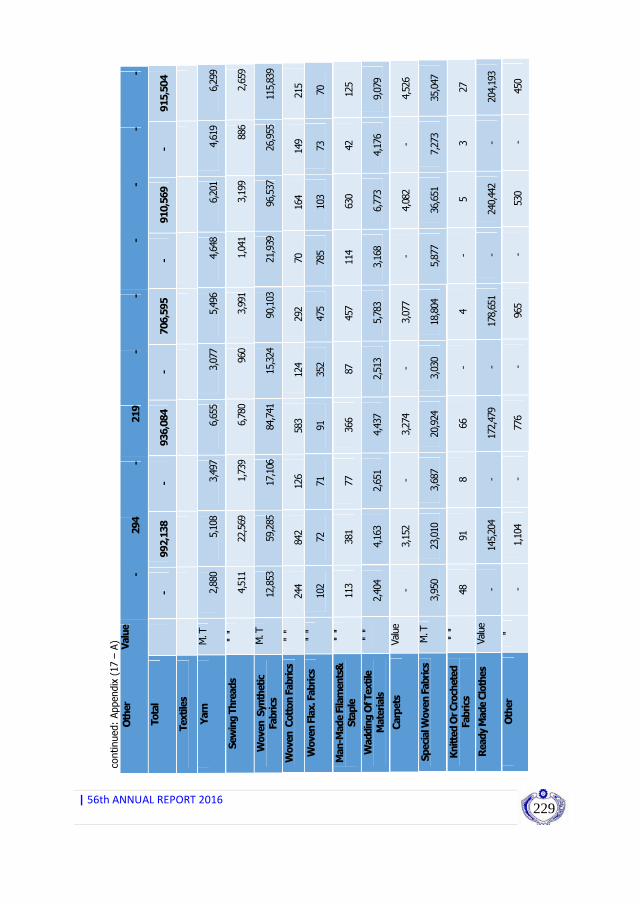
|56thANNUALREPORT2016
229
continued:
Appendix
(17 –
A)
Other
Value
-
294
-
219
-
-
-
-
-
-
Total
-
992,138
-
936,084
-
706,595
-
910,569
-
915,504
Textiles
Yarn
M. T
2,880
5,108
3,497
6,655
3,077
5,496
4,648
6,201
4,619
6,299
Sewing Threads
'' ''
4,511
22,569
1,739
6,780
960
3,991
1,041
3,199
886
2,659
Woven Synthetic
Fabrics
M. T
12,853
59,285
17,106
84,741
15,324
90,103
21,939
96,537
26,955
115,839
Woven Cotton Fabrics
'' ''
244
842
126
583
124
292
70
164
149
215
Woven Flax. Fabrics
'' ''
102
72
71
91
352
475
785
103
73
70
Man-Made Filaments&
Staple
'' ''
113
381
77
366
87
457
114
630
42
125
Wadding Of Textile
Materials
'' ''
2,404
4,163
2,651
4,437
2,513
5,783
3,168
6,773
4,176
9,079
Carpets
Value
-
3,152
-
3,274
-
3,077
-
4,082
-
4,526
Special W
oven Fabrics
M. T
3,950
23,010
3,687
20,924
3,030
18,804
5,877
36,651
7,273
35,047
Knitted Or Crocheted
Fabrics
'' ''
48
91
8
66
-
4
-
5
3
27
Ready Made Clothes
Value
-
145,204
-
172,479
-
178,651
-
240,442
-
204,193
Other
'' -
1,104
-
776
-
965
-
530
-
450

|56thANNUALREPORT2016
230
continued:
Appendix
(17 –
A)
Total
-
264,981
-
301,172
-
308,098
-
395,317
-
378,529
Other
Value
-
36,703
-
64,789
-
16,786
-
24,173
-
23,531
Grand Total
-
9
,23
0,3
18
-
9
,91
8,0
68
-
9
,21
1,3
00
-
9
,50
9,1
15
-
8
,32
3,3
95
Source: Custom Authority

|56thANNUALREPORT2016
231
Appendix (17 – B )
Sudan’s Foreign Trade
Main exporters during the period (2012 – 2016)
(US $ Million)
Suppliers
2012
2013
2014
2015
2016
INDUSTRIAL COUNTRIES
2,658,945
2,511,020
2,274,441
2,190,930
2,178,270
AUSTRIA
7,669
5,150
10,554
6,462
4,322
AUSTRALIA
347,661
402,840
300,730
88,862
33,708
BELGIUM
38,981
30,820
21,490
24,922
25,305
CANADA
126,061
156,980
274,667
137,528
78,666
SWITZERLAND
29,004
30,950
24,077
27,855
38,265
DENMARK
6,748
7,020
11,032
7,990
11,916
GERMANY
250,403
287,450
249,236
208,898
219,279
SPAIN
34,203
28,310
22,095
28,572
28,950
FINLAND
14,416
11,470
4,535
6,881
2,823

|56thANNUALREPORT2016
232
continued:
Appendix
( 1
7 –
B )
FRANCE
78,442
63,270
72,157
71,343
63,176
UNITED
KINGDOM
243,687
185,580
135,368
107,817
86,024
GREECE
4,628
7,160
9,328
5,515
3,226
IRELAND
9,283
13,500
5,782
7,762
4,129
ITALY
167,851
170,080
146,112
159,836
141,789
JAPAN
331,270
340,820
212,536
301,754
283,149
NETHERLANDS
92,909
97,190
97,354
71,615
78,483
NORWAY
2,087
4,110
1,470
2,745
4,291
PORTUGAL
10,922
5,580
9,032
5,114
6,268
NEW ZEALAND
59,498
45,820
32,780
52,118
54,556
SWEDEN
113,930
79,740
60,102
86,578
56,967
UNITED
STATES
99,800
94,390
49,743
28,653
23,054
BULGARIA
7,961
860
1,215
659
1,084
CYPRUS
10,099
8,690
11,606
55,156
5,349
HUNGARY
3,571
1,060
2,612
658
15,044

|56thANNUALREPORT2016
233
continued:
Appendix
( 1
7 –
B )
POLAND
14,375
6,130
22,980
47,980
9,672
Russia
-
-
-
37,162
317,010
TURKEY
331,914
306,950
283,585
410,410
502,842
UKRAINE
203,606
118,570
197,848
198,156
74,820
Malta
15,548
470
4,361
175
327
African countries
871,613
978,545
725,352
869,419
873,060
DJIBUTI
676
-
82
-
11
ETHIOPIA
10,942
29,900
31,201
43,767
40,759
KENYA
57,115
84,114
77,952
55,093
62,593
UGANDA
38,025
40,781
35,901
45,604
41,677
ZIM
BABWE
6,954
28,679
35,288
29,654
36,189
EGYPT
639,157
742,566
491,921
569,351
591,332

|56thANNUALREPORT2016
234
continued:
Appendix
(17 –
B )
ZAMBIA
3,209
4,485
1,420
7,221
4,338
BURUNDI
114
432
3,999
2,054
1,123
Libya
88
400
156
1,228
968
MALAWI
9,462
-
2,887
542
386
SWAZILAND
15,042
11,159
12,939
19,337
25,291
NIGERIA
1,122
454
832
5,117
9,301
MOROCCO
50,314
6,339
7,274
4,439
21,204
TUNISIA
1,372
1,315
3,737
12,384
5,421
ALGERIA
19,170
27,921
10,521
83
37
Other African countries
18,851
-
9,242
73,545
32,430
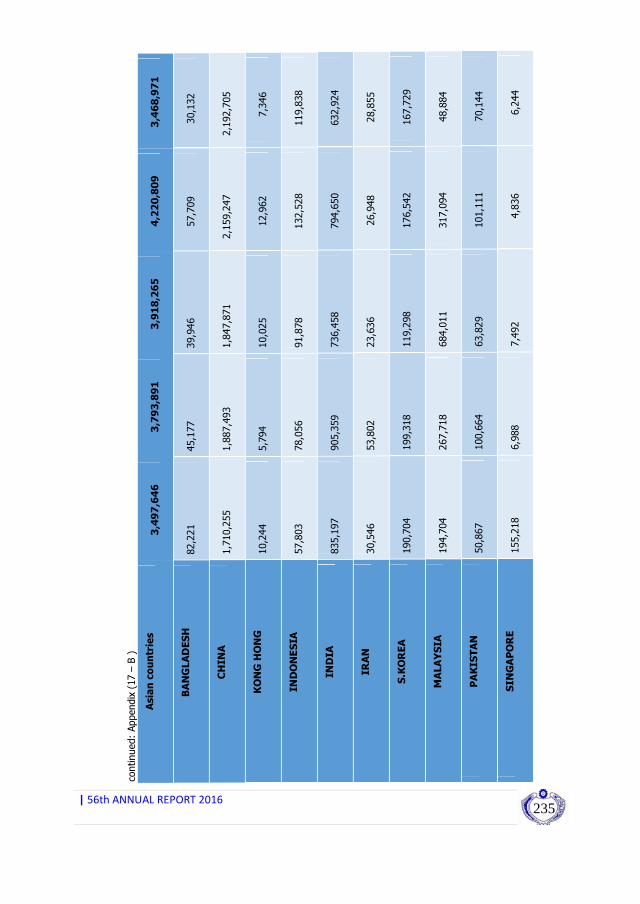
|56thANNUALREPORT2016
235
continued:
Appendix
(17 –
B )
Asian countries
3,497,646
3,793,891
3,918,265
4,220,809
3,468,971
BANGLADESH
82,221
45,177
39,946
57,709
30,132
CHINA
1,710,255
1,887,493
1,847,871
2,159,247
2,192,705
HONG
KONG
10,244
5,794
10,025
12,962
7,346
INDONESIA
57,803
78,056
91,878
132,528
119,838
INDIA
835,197
905,359
736,458
794,650
632,924
IRAN
30,546
53,802
23,636
26,948
28,855
S.KOREA
190,704
199,318
119,298
176,542
167,729
MALAYSIA
194,704
267,718
684,011
317,094
48,884
PAKISTAN
50,867
100,664
63,829
101,111
70,144
SINGAPORE
155,218
6,988
7,492
4,836
6,244

|56thANNUALREPORT2016
236
continued:
Appendix
(17 –
B )
THAILAND
107,513
197,616
247,869
353,825
103,648
TAIW
AN
24,850
22,384
29,939
61,009
43,426
SRI
LANKA
8,268
1,676
1,146
2,158
3,249
VIET
NAM
39,256
21,846
14,867
20,190
13,847
Arab countries
1,550,138
1,876,896
1,635,091
1,471,048
1,517,905
ARAB
EMIRRATES
494,076
681,808
941,468
835,967
868,888
BAHRAIN
51,318
12,553
2,667
2,859
3,501
JORDAN
91,284
97,762
98,083
126,088
75,726
KUWAIT
25,115
96,359
14,392
17,805
10,322
LEBANON
16,116
21,284
13,228
12,867
16,145
OMAN
10,035
14,323
30,265
15,349
10,484

|56thANNUALREPORT2016
237
continued:
Appendix
( 1
7 –
B )
QATAR
52,715
69,253
73,844
18,649
3,311
SAUDI
ARABIA
751,722
706,424
415,290
436,679
523,432
SYRIA
29,251
12,354
4,224
4,579
5,815
YEMEN
28,506
164,776
41,630
206
281
Other Countries
651,976
757,716
658,151
756,909
285,189
Grand Total
9,230,318
9,918,068
9,211,300
9,509,115
8,323,395
Sourc
e:
Cust
om
Auth
ority
|56thANNUALREPORT2016
238
Sudan Currency Printing Press