Embed Size (px)
Citation preview
HON HAI PRECISION INDUSTRY CO., LTD.
Annual Report
2012
Annual Report Website
Market Observation Post System: http://mops.twse.com.tw
Company Website: http://www.foxconn.com.tw
Printing Date: April 30, 2013
Stock Code
2317

THIS IS A TRANSLATION OF THE 2012 ANNUAL REPORT (THE “ANNUAL
REPORT”) OF HON HAI PRECISION INDUSTRY CO., LTD. (THE “COMPANY”).
THIS TRANSLATION IS INTENDED FOR REFERENCE ONLY AND NOTHING ELSE,
THE COMPANY HEREBY DISCLAIMS ANY AND ALL LIABILITIES WHATSOEVER
FOR THE TRANSLATION. THE CHINESE TEXT OF THE ANNUAL REPORT SHALL
GOVERN ANY AND ALL MATTERS RELATED TO THE INTERPRETATION OF THE
SUBJECT MATTER STATED HEREIN.
I. Spokesperson: Deputy Spokesperson:
Name: Simon Hsing Name: Jack Hsiao
Title: Spokesperson Title: Director of Public Relations Office
Tel: (02)2268-3466#3629 Tel: (02)2268-3466#3628
E-mail: [email protected]
II. Contact information of the head office, branch offices and factories
Head office
Add: No. 66, Zhongshan Road, Tucheng Industrial Zone, Tucheng District, New Taipei City
Tel: (02)2268-3466
Hsinchu Science Park Branch Office
Add: 5F-1, No. 5, Hsin-an Road, Hsinchu Science and Industrial Park, East Area, Hsinchu
City
Tel: (03)578-4975
Neihu Branch Office
Add: 1F-11F, No. 32, Jihu Road, Neihu District, Taipei City
Tel: (02)2799-6111
California (US) Branch Office
Add: 288 S. Mayo Ave City of Industry, CA 91789 U.S.A.
Tel: 1-714-680-2066
Huyue Factory
Add: No. 2, Zihyou Street, Tucheng Industrial Zone, Tucheng District, New Taipei City
Tel: (02)2268-3466
Minsheng Factory
Add: No. 4-1, Minsheng Road, Tucheng Industrial Zone, Tucheng District, New Taipei City.
Tel: (02)2267-6511
Dingpu No. 1 Factory
Add: No. 53, Section 4, Zhongyang Road, Tucheng District, New Taipei City
Tel: (02)2268-3466
Dingpu No. 2 Factory
Add: 2F, No. 53, Section 4, Zhongyang Road, Tucheng District, New Taipei City
Tel: (02)2268-3466
Dingpu No. 5 Factory
Add: 4F, No. 53, Section 4, Zhongyang Road, Tucheng District, New Taipei City
Tel: (02)2268-3466
III. Share Transfer Agency
Name: Grand Fortune Securities Co., Ltd.
Address: 3F, No. 51, Section 1, Minsheng East Road, Taipei City
Tel: (02)2562-1658
Website: http://www.gfortune.com.tw
IV. Contact information of the Certified Public Accountants for the Latest Financial
Repot
Name: Hsu, Yong-jian, Xue, Ming-ling
CPA Firm: Pricewaterhouse Coopers (PwC) Taiwan
Address: 27F, No. 333, Section 1, Keelong Road, Taipei City
Tel: (02)2729-6666
Website: http://www.pwc.tw
V. Overseas trade places for listed negotiable securities
London Stock Exchange: http://www.londonstockexchange.com
Singapore Stock Exchange: http://www.sgx.com/wps/portal/marketplace/mp-ch/home
VI. Company Website: http://www.foxconn.com
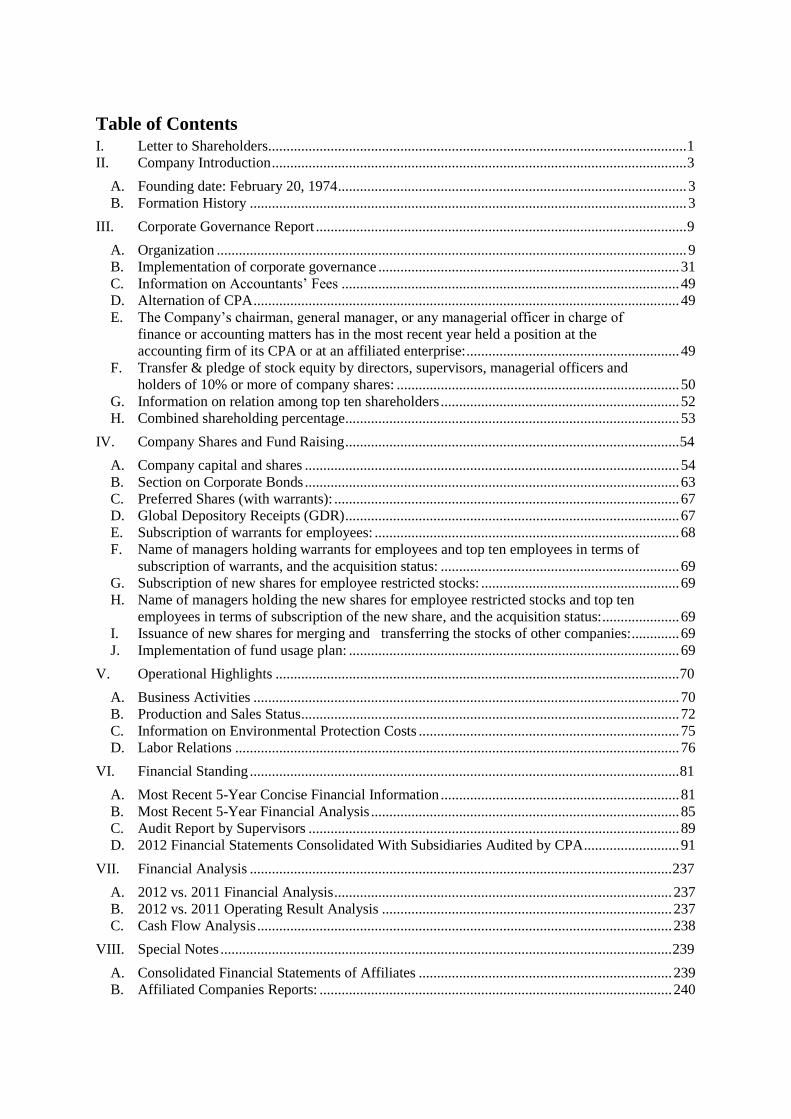
Table of Contents I. Letter to Shareholders .................................................................................................................. 1
II. Company Introduction ................................................................................................................. 3
A. Founding date: February 20, 1974 ............................................................................................... 3
B. Formation History ....................................................................................................................... 3
III. Corporate Governance Report ..................................................................................................... 9
A. Organization ................................................................................................................................ 9
B. Implementation of corporate governance .................................................................................. 31
C. Information on Accountants’ Fees ............................................................................................ 49
D. Alternation of CPA .................................................................................................................... 49
E. The Company’s chairman, general manager, or any managerial officer in charge of
finance or accounting matters has in the most recent year held a position at the
accounting firm of its CPA or at an affiliated enterprise: .......................................................... 49
F. Transfer & pledge of stock equity by directors, supervisors, managerial officers and
holders of 10% or more of company shares: ............................................................................. 50
G. Information on relation among top ten shareholders ................................................................. 52
H. Combined shareholding percentage ........................................................................................... 53
IV. Company Shares and Fund Raising ........................................................................................... 54
A. Company capital and shares ...................................................................................................... 54
B. Section on Corporate Bonds ...................................................................................................... 63
C. Preferred Shares (with warrants): .............................................................................................. 67
D. Global Depository Receipts (GDR) ........................................................................................... 67
E. Subscription of warrants for employees: ................................................................................... 68
F. Name of managers holding warrants for employees and top ten employees in terms of
subscription of warrants, and the acquisition status: ................................................................. 69
G. Subscription of new shares for employee restricted stocks: ...................................................... 69
H. Name of managers holding the new shares for employee restricted stocks and top ten
employees in terms of subscription of the new share, and the acquisition status: ..................... 69
I. Issuance of new shares for merging and transferring the stocks of other companies: ............. 69
J. Implementation of fund usage plan: .......................................................................................... 69
V. Operational Highlights .............................................................................................................. 70
A. Business Activities .................................................................................................................... 70
B. Production and Sales Status ....................................................................................................... 72
C. Information on Environmental Protection Costs ....................................................................... 75
D. Labor Relations ......................................................................................................................... 76
VI. Financial Standing ..................................................................................................................... 81
A. Most Recent 5-Year Concise Financial Information ................................................................. 81
B. Most Recent 5-Year Financial Analysis .................................................................................... 85
C. Audit Report by Supervisors ..................................................................................................... 89
D. 2012 Financial Statements Consolidated With Subsidiaries Audited by CPA .......................... 91
VII. Financial Analysis ................................................................................................................... 237
A. 2012 vs. 2011 Financial Analysis ............................................................................................ 237
B. 2012 vs. 2011 Operating Result Analysis ............................................................................... 237
C. Cash Flow Analysis ................................................................................................................. 238
VIII. Special Notes ........................................................................................................................... 239
A. Consolidated Financial Statements of Affiliates ..................................................................... 239
B. Affiliated Companies Reports: ................................................................................................ 240
1
I. Letter to Shareholders
Although the political and economic environments are so turbulent, the industrial aspects also
have been through tremendous changes, our Company has gained better performance since
last year, the consolidated revenue and profit once both hit record highs! On behalf of the
Board of Directors of the Company, I want to thank all my colleagues for their hard working
and dedicated contributions. Once again, I sincerely thank our strategic partners and
customers for their continued trust and also thank all the shareholders of the Company for
their long-term support.
The international economic environment of 2012 was again precarious. From the very
beginning of 2012, although the United States government extended the low interest rate
policy to stimulate the economy, the debt problems of Greece, Italy and Spain expanded and
once again triggered a debt crisis in Europe, which restrained the global economic recovery.
The presidential elections of many countries were in the second half of 2012, the uncertainty
of which created a more unpredictable situation around the world. Especially, the U.S. fiscal
cliff problem has lowered global consumer confidence significantly, and bogged down
economic development. Fortunately, after the U.S. Federal Reserve Board initiated the third
and fourth quantitative easing monetary policy, the tension of the global economy has been
eased.
Despite operating in such a difficult business environment, under the concerted efforts of all
my colleagues our Company not only achieved excellent performance results but also earned
our remarkable reputation around the world: According to the U.S. Fortune “Global 500”
ranking report, our Company has moved up to the next level, from 60th in 2011 to once again
advance to 43rd last year. In addition, our Company has already obtained 2,013 U.S. patents
in 2012, ranking 8th in the whole world. We have proved Hon Hai’s strong competitive
strength once again.
Looking forward to 2013, the steady growth of the U.S. economy may gradually lead the
global economic recovery, but while the U.S. deficit reduction programs take effect
automatically, whether the debt ceiling can be increased and other issues will affect consumer
confidence. Meanwhile, the most important is that the U.S. policy of quantitative easing may
exit in the second half of this year, it will be a big challenge weather the economy is capable
of sustained recovery at that time. In addition, high unemployment rates and low growth rates
persist in the European market, new developing countries face different issues such as
inflation, unemployment, growth slows etc., coupled with the rapid changes in the ecological
structure of the technology industries, 2013 is still full of uncertainty. In view of this, in
addition to continuous investment in research and development of different areas of science
and technology, our Company is committed to “efficiency, automation, unmanned
productions and globalization” to enable our Company to continue to take the leading
position in the “eight-screens-one-network-one-cloud” business territory. The Group
describes 2013 as a key year, and looks forward to extend the business from core
manufacturing and technology to “technology services” which the development goal is to go
through from the first mile to last mile. We are confident that even though the overall
business recovery cycle is still highly uncertain, we will be able to break through all the
difficulties and challenges to bring you all more value!

2
Once again, on behalf of all shareholders of the Company, I sincerely thank all the employees
and their families. I also encourage the Company’s management team continue to work hard
to maintain the excellent operating results. Thank you so much for all your support.
3
II. Company Introduction
A. Founding date: February 20, 1974
Listing date: June 18, 1991
B. Formation History
In 1994
1. Increased capital to NT$1,303,000,000.
2. Reinvested Vate Technology Co., Ltd.
3. Reinvested LUNG HWA Electronics.
4. Many new products like AN and AT were developed.
In 1995
1. Increased capital to NT$2,279,000,000.
2. Reinvested Unimicron Technology Corporation.
3. Reinvested United Microelectronics Corporation.
4. Many new products like L/P MCA, SGC and RF were developed.
5. Huyue Factory carried out its third phase for expansion.
In 1996
1. Increased capital to NT$3,580,000,000.
2. Reinvested Hongyang Venture Capital Investment Co., Ltd.
3. Reinvested Guifeng Co., Ltd.
In 1997
1. Increased capital to NT$5,118,000,000.
2. Set up the heat transfer product business office and environmental-friendly
electro-plating technique development department.
3. Established the Material Testing Center.
In 1998
4
1. Increased capital to NT$7,346,000,000.
2. Established the High-Speed Electrical Test Lab, the EMI/RFI Lab and Heat
Transfer Lab.
3. Listed into The Information Technology 100 (IT 100) by the Business Week
of America for the first time.
In 1999
1. Increased capital to NT$11,000,000,000.
2. Capital was first raised from the international finance market via GDR
issuance with 10% premium for issuing, creating a new high in overseas
capital raising by domestic enterprises.
3. Selected as the Best Management Company in Taiwan by Asian Money.
In 2000
1. Increased capital to NT$14,529,000,000.
2. Issued US$345 million of overseas unsecured and transferable corporate
bonds.
3. Invested Foxconn Optical Technology Inc. through its subsidiary – FOTI
Holdings Corporation.
In 2001
1. Increased capital to NT$17,687,800,000.
2. Evaluation of Taiwan Ratings as long-term issuer: grade AA- and its prospect:
stability.
3. Evaluation of Standard & Poor’s (S & P): grade BBB and its prospect:
stability.
4. Became the first largest private manufacturing enterprise in Taiwan.
5. It is the earliest manufacturer of quantity production around the world for Intel
Pentium 4 CPU Stocket478.
6. Issued NT$5 billion of domestic unsecured ordinary corporate bonds.
In 2002
1. Increased capital to NT$20,648,970,000.
2. According to survey of Taiwan Ratings, it was the first largest manufacturing
enterprise in Taiwan.
5
3. Won the first prize of the Best Corporate Strategy by Asiamoney.com.
4. Became the first largest exporter in Greater China.
In 2003
1. Increased capital to NT$25,109,744,000.
2. Issued US$450 million of overseas unsecured and transferable corporate
bonds.
3. According to evaluation of IR Magazine, it was awarded the Best Investor
Relation in Taiwan.
4. Acquired Motorola Chihuahua Factory in Mexico.
In 2004
1. Increased capital to NT$32,310,231,030.
2. Acquired Eimo Oyji of Finland.
3. Merged Taiwan Ambit Microsystems (Stock) Company.
4. Became the first largest 3C OEM globally.
In 2005
1. Increased capital to NT$40,383,230,780.
2. Invested Antai Power (Stock) Company through its subsidiary – Hongyang
Venture Capital Investment (Stock) Company.
3. Invested Chi Mei Communication Systems Inc. through its subsidiary –
Transworld Holdings Limited.
4. Issued NT$11,500,000,000 of domestic unsecured ordinary corporate bonds.
5. Its overseas subsidiary – Foxconn International Holdings Ltd. was listed in
Hong Kong.
6. Selected as the first largest enterprise in Taiwan firstly by Common Wealth.
7. Ranked among the Top 15 of the World’s Most Admired Companies in
Electronics by Fortune.
8. Became a member of Electronic Industry Code of Conduct (EICC), dedicated
to promoting corporate social and environmental responsibilities (hereinafter
referred to as SER).
6
In 2006
1. Increased capital to NT$51,681,387,530.
2. Merged Taiwan Premier Image Technology Corp.
3. Issued NT$18,000,000,000 of domestic unsecured and transferable corporate
bonds.
4. Selected as the Happiest Taiwan Enterprise according to the questionnaire
survey of 104 Job Bank.
5. Selected as the Most Desirable Company of office staff of Taiwan according
to the survey of Cheers.
6. Nominated as the Best Investor Relation Company in Taiwan by IR Magazine.
7. Nominated as the Best Corporate Governance of the Year in Taiwan by IR
Magazine.
In 2007
1. Increased capital to NT$62,907,665,030.
2. Awarded as the Most Admired Enterprise in Taiwan by Common Wealth.
3. Nominated as the Best Investor Relation Company in Taiwan by IR Magazine.
4. Awarded the Progress Prize for the best investor relation company in Taiwan
by IR Magazine.
5. Awarded the title of the World’s Top 10 Chinese Enterprises of the Year by
Asiaweek.
6. Ranked 154th
among Fortune Global 500 Enterprises.
In 2008
1. Increased capital to NT$74,146,234,780.
2. Issued NT$5,180,000,000 of domestic unsecured ordinary corporate bonds.
3. Awarded as the Most Admired Enterprise in Taiwan by Common Wealth.
4. Ranked 132nd
among Fortune Global 500 Enterprises.
In 2009
1. Increased capital to NT$85,789,318,550.
2. Issued NT$6,820,000,000 of domestic unsecured ordinary corporate bonds.
3. Ranked 109th
among Fortune Global 500 Enterprises.
7
4. Ranked first among Taiwan enterprises for four consecutive years by Taiwan
Ratings.
5. Awarded as the Best Management Enterprise in Taiwan by Finance Asia.
6. Recognized as one of Asia’s Fabulous 50 of Asia by Forbes.
In 2010
1. Increased capital to NT$96,612,482,030.
2. Issued US$1,000,000,000 of overseas transferable corporate bonds.
3. Issued NT$6,000,000,000 of domestic unsecured ordinary corporate bonds.
4. Ranked 176th
among the Forbes Global 2000.
5. Ranked first among Taiwan Top 1000 Enterprises for five consecutive years
according to the evaluation of Common Wealth.
6. Ranked first among Taiwan enterprises for five consecutive years by Taiwan
Ratings.
7. Ranked 194th
among the Global 500 Enterprises by (Britain) Financial Times.
8. Ranked 112th
among Fortune Global 500.
9. Awarded as the Most Admired Companies in Taiwan by Common Wealth.
In 2011
1. Increased capital to NT$106,890,066,630.
2. Issued NT$18,000,000,000 of domestic unsecured ordinary corporate bonds.
3. Ranked 189th
among Forbes Global 2000.
4. Ranked first among Top 1000 Taiwan Enterprises for six consecutive years by
Common Wealth.
5. Ranked first among Taiwan enterprises for six consecutive years according to
the evaluation of Taiwan Ratings.
6. Ranked 60th
among Fortune Global 500 by Fortune.
7. Awarded the Most Admired Enterprise in Taiwan by Common Wealth.
In 2012
1. Increased capital to NT$108,358,665,270.
2. Issued NT$16,300,000,000 of domestic unsecured ordinary corporate bonds.

8
3. Ranked first among the Top 1000 Taiwan Enterprises for seven consecutive
years according to the evaluation of Common Wealth Magazine.
4. Ranked first among Taiwan enterprises according to the evaluation of Taiwan
Ratings for seven consecutive years.
5. Ranked 43rd
among Fortune Global 500.
6. Ranked 156th
among Forbes Global 2000.
9
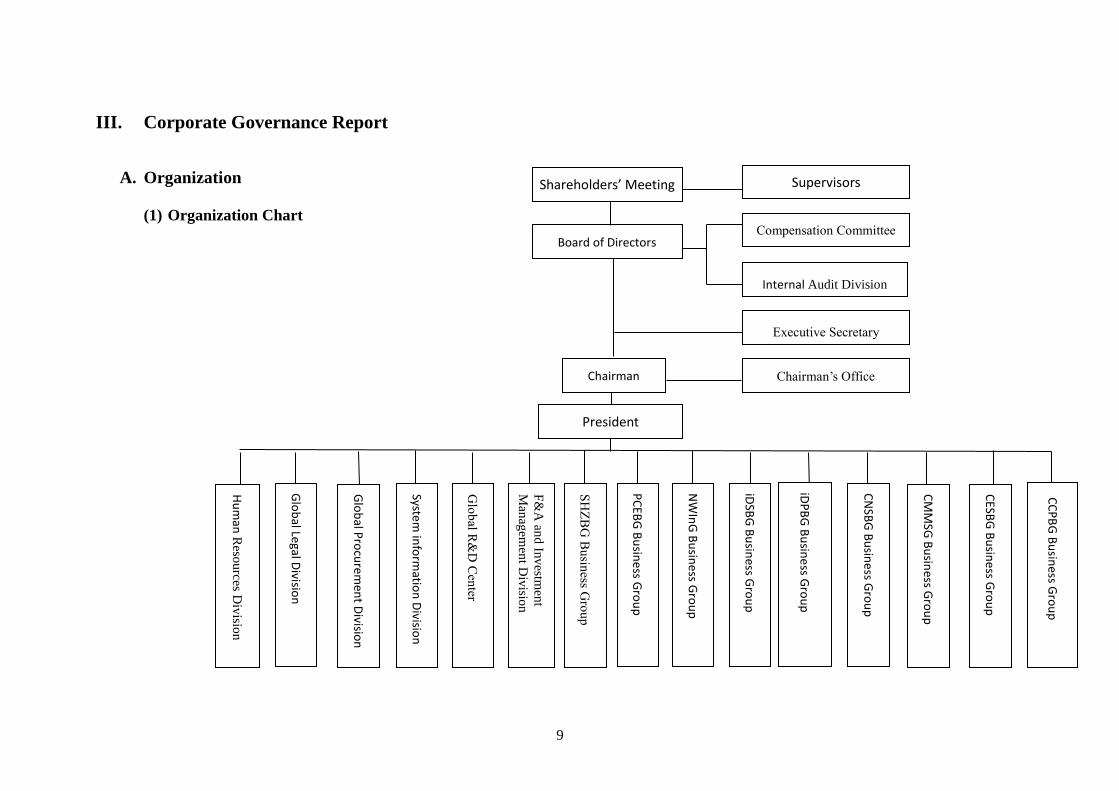
III. Corporate Governance Report
A. Organization
(1) Organization Chart
Chairman Chairman’s Office
Board of Directors
President
Hu
man
Reso
urces D
ivisio
n
CESB
G B
usin
ess G
rou
p
iDSB
G B
usin
ess Gro
up
iDP
BG
Bu
sine
ss Gro
up
CN
SBG
Bu
sine
ss Gro
up
CM
MSG
Bu
siness G
rou
p
NW
InG
Bu
sine
ss Gro
up
SH
ZB
G B
usin
ess Gro
up
Glo
bal R
&D
Cen
ter
F&
A an
d In
vestm
ent
Man
agem
ent D
ivisio
n
System
info
rmatio
n D
ivision
Glo
bal P
rocu
rem
ent D
ivision
Glo
bal Legal D
ivision
PC
EBG
Bu
sine
ss Gro
up
Executive Secretary
Internal Audit Division
CC
PB
G B
usin
ess Gro
up
Shareholders’ Meeting
Compensation Committee
Supervisors
10
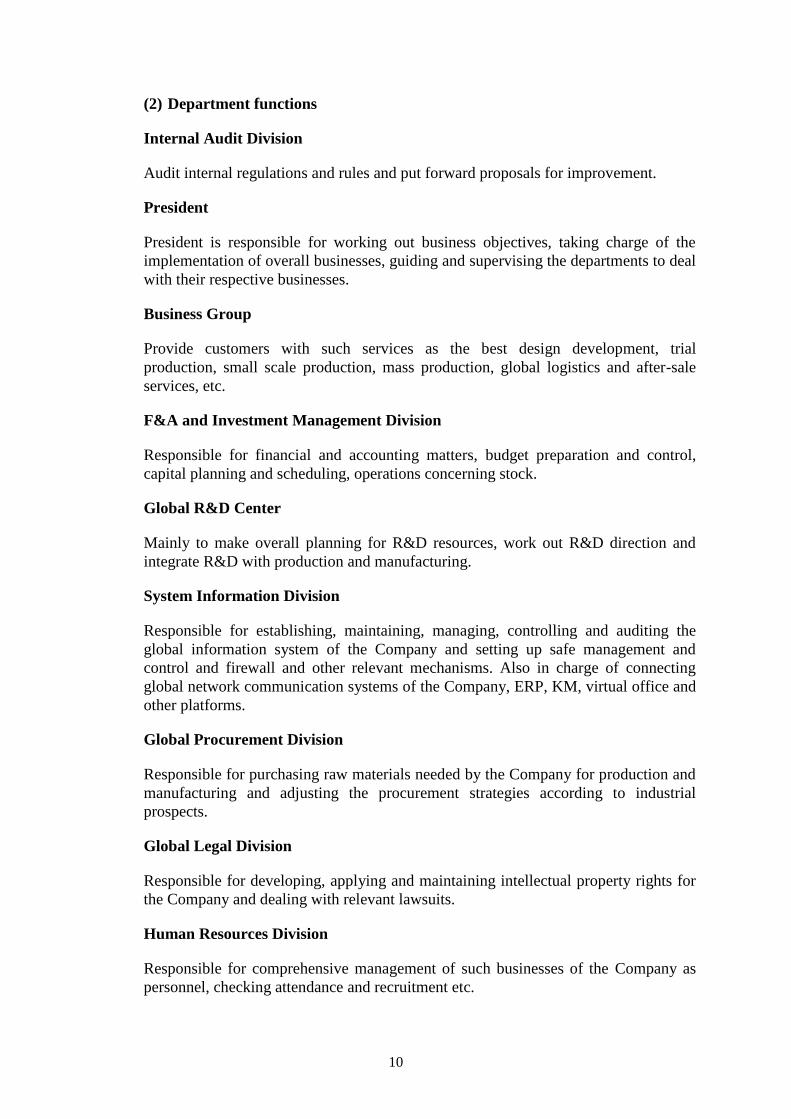
(2) Department functions
Internal Audit Division
Audit internal regulations and rules and put forward proposals for improvement.
President
President is responsible for working out business objectives, taking charge of the
implementation of overall businesses, guiding and supervising the departments to deal
with their respective businesses.
Business Group
Provide customers with such services as the best design development, trial
production, small scale production, mass production, global logistics and after-sale
services, etc.
F&A and Investment Management Division
Responsible for financial and accounting matters, budget preparation and control,
capital planning and scheduling, operations concerning stock.
Global R&D Center
Mainly to make overall planning for R&D resources, work out R&D direction and
integrate R&D with production and manufacturing.
System Information Division
Responsible for establishing, maintaining, managing, controlling and auditing the
global information system of the Company and setting up safe management and
control and firewall and other relevant mechanisms. Also in charge of connecting
global network communication systems of the Company, ERP, KM, virtual office and
other platforms.
Global Procurement Division
Responsible for purchasing raw materials needed by the Company for production and
manufacturing and adjusting the procurement strategies according to industrial
prospects.
Global Legal Division
Responsible for developing, applying and maintaining intellectual property rights for
the Company and dealing with relevant lawsuits.
Human Resources Division
Responsible for comprehensive management of such businesses of the Company as
personnel, checking attendance and recruitment etc.
11
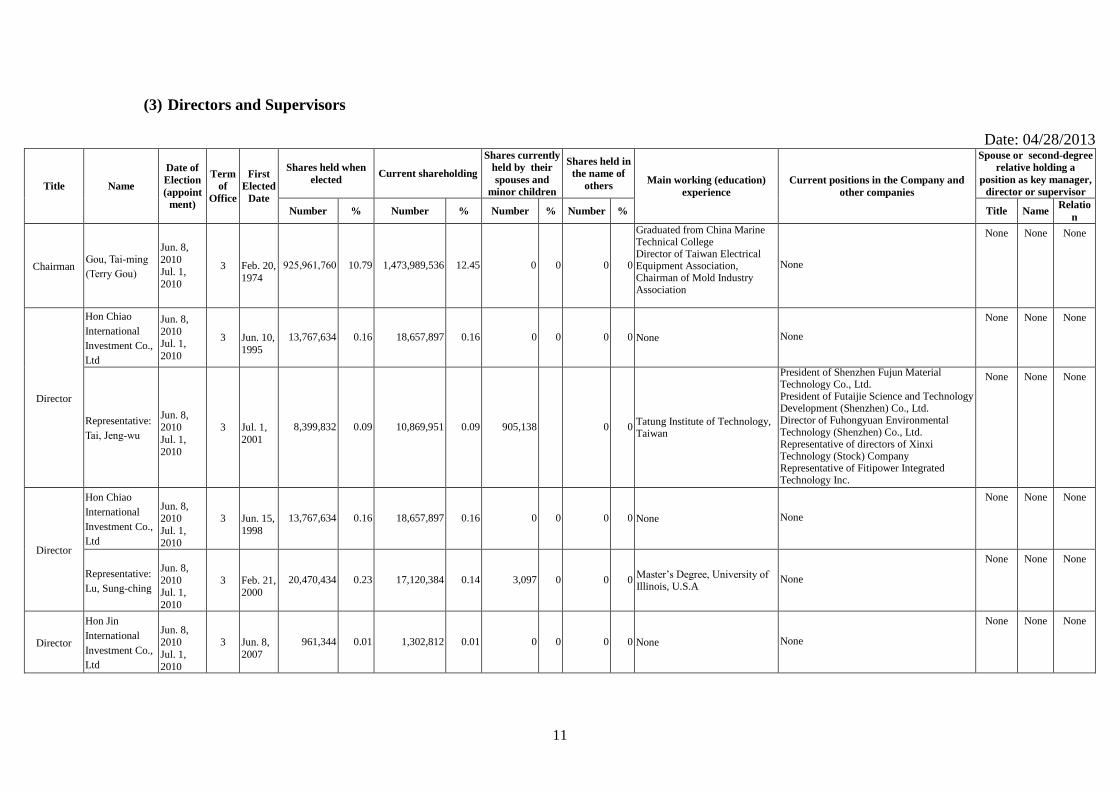
(3) Directors and Supervisors
Date: 04/28/2013
Title Name
Date of
Election
(appoint
ment)
Term
of
Office
First
Elected
Date
Shares held when
elected Current shareholding
Shares currently
held by their
spouses and
minor children
Shares held in
the name of
others Main working (education)
experience
Current positions in the Company and
other companies
Spouse or second-degree
relative holding a
position as key manager,
director or supervisor
Number % Number % Number % Number % Title Name Relatio
n
Chairman Gou, Tai-ming
(Terry Gou)
Jun. 8,
2010 Jul. 1,
2010
3
Feb. 20,
1974
925,961,760 10.79 1,473,989,536 12.45 0 0 0 0
Graduated from China Marine Technical College Director of Taiwan Electrical Equipment Association, Chairman of Mold Industry Association
None
None None None
Director
Hon Chiao
International
Investment Co.,
Ltd
Jun. 8,
2010 Jul. 1,
2010
3
Jun. 10,
1995
13,767,634 0.16 18,657,897 0.16 0 0 0 0 None None
None None None
Representative:
Tai, Jeng-wu
Jun. 8, 2010
Jul. 1,
2010
3 Jul. 1,
2001
8,399,832 0.09 10,869,951 0.09 905,138 0 0 Tatung Institute of Technology, Taiwan
President of Shenzhen Fujun Material Technology Co., Ltd. President of Futaijie Science and Technology Development (Shenzhen) Co., Ltd. Director of Fuhongyuan Environmental Technology (Shenzhen) Co., Ltd. Representative of directors of Xinxi Technology (Stock) Company Representative of Fitipower Integrated Technology Inc.
None None None
Director
Hon Chiao
International
Investment Co.,
Ltd
Jun. 8, 2010
Jul. 1,
2010
3 Jun. 15,
1998
13,767,634 0.16 18,657,897 0.16 0 0 0 0 None None
None None None
Representative:
Lu, Sung-ching
Jun. 8,
2010 Jul. 1,
2010
3
Feb. 21, 2000
20,470,434 0.23 17,120,384 0.14 3,097 0 0 0 Master’s Degree, University of Illinois, U.S.A
None
None None None
Director
Hon Jin
International
Investment Co.,
Ltd
Jun. 8,
2010
Jul. 1,
2010
3
Jun. 8,
2007
961,344 0.01 1,302,812 0.01 0 0 0 0 None None
None None None
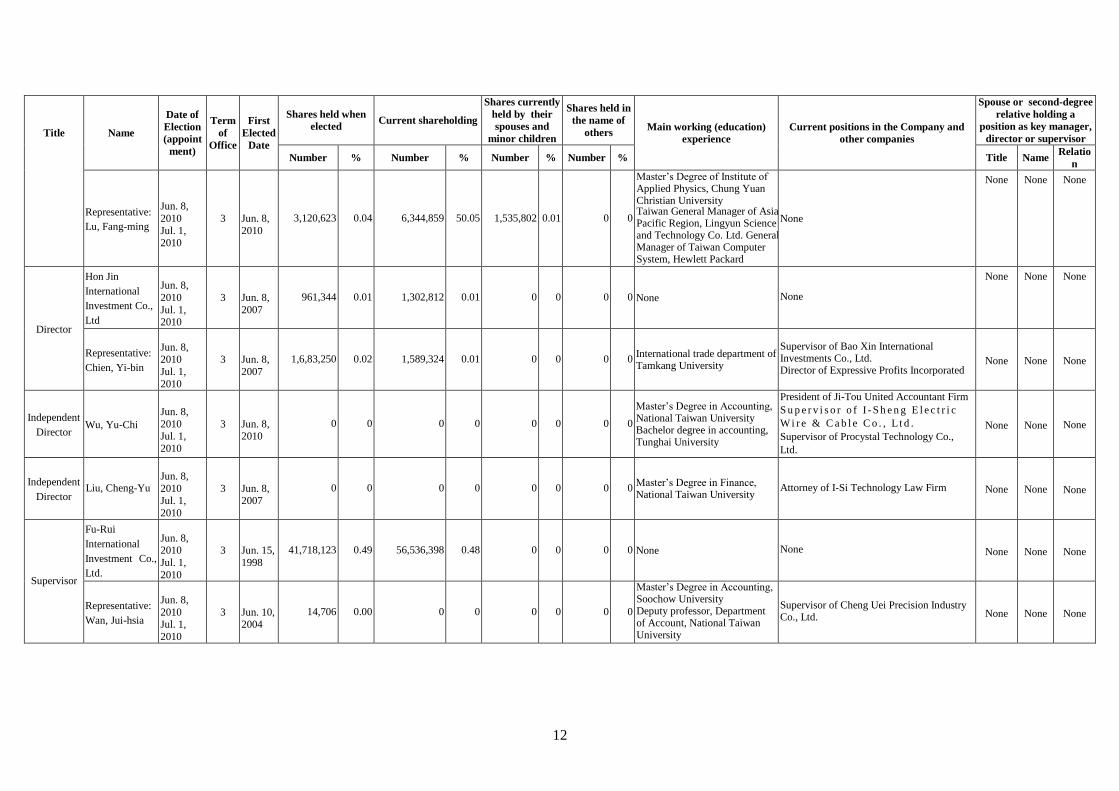
12
Title Name
Date of
Election
(appoint
ment)
Term
of
Office
First
Elected
Date
Shares held when
elected Current shareholding
Shares currently
held by their
spouses and
minor children
Shares held in
the name of
others Main working (education)
experience
Current positions in the Company and
other companies
Spouse or second-degree
relative holding a
position as key manager,
director or supervisor
Number % Number % Number % Number % Title Name Relatio
n
Representative:
Lu, Fang-ming
Jun. 8,
2010
Jul. 1, 2010
3
Jun. 8,
2010
3,120,623 0.04 6,344,859 50.05 1,535,802 0.01 0 0
Master’s Degree of Institute of Applied Physics, Chung Yuan Christian University Taiwan General Manager of Asia-Pacific Region, Lingyun Science and Technology Co. Ltd. General Manager of Taiwan Computer System, Hewlett Packard
None
None None None
Director
Hon Jin
International
Investment Co.,
Ltd
Jun. 8,
2010
Jul. 1, 2010
3
Jun. 8,
2007
961,344 0.01 1,302,812 0.01 0 0 0 0 None None
None None None
Representative:
Chien, Yi-bin
Jun. 8,
2010
Jul. 1,
2010
3
Jun. 8,
2007
1,6,83,250 0.02 1,589,324 0.01 0 0 0 0 International trade department of Tamkang University
Supervisor of Bao Xin International Investments Co., Ltd. Director of Expressive Profits Incorporated
None None None
Independent
Director Wu, Yu-Chi
Jun. 8,
2010 Jul. 1,
2010
3
Jun. 8, 2010
0 0 0 0 0 0 0 0
Master’s Degree in Accounting, National Taiwan University Bachelor degree in accounting, Tunghai University
President of Ji-Tou United Accountant Firm
S u p e r v i s o r o f I - S h e n g E l e c t r i c
W i r e & C a b l e C o . , L t d .
Supervisor of Procystal Technology Co.,
Ltd.
None None None
Independent
Director Liu, Cheng-Yu
Jun. 8,
2010
Jul. 1,
2010
3
Jun. 8,
2007
0 0 0 0 0 0 0 0 Master’s Degree in Finance, National Taiwan University
Attorney of I-Si Technology Law Firm None None None
Supervisor
Fu-Rui
International
Investment Co.,
Ltd.
Jun. 8, 2010
Jul. 1,
2010
3 Jun. 15,
1998
41,718,123 0.49 56,536,398 0.48 0 0 0 0 None None None None None
Representative:
Wan, Jui-hsia
Jun. 8,
2010 Jul. 1,
2010
3
Jun. 10, 2004
14,706 0.00 0 0 0 0 0 0
Master’s Degree in Accounting, Soochow University Deputy professor, Department of Account, National Taiwan University
Supervisor of Cheng Uei Precision Industry Co., Ltd. None None None
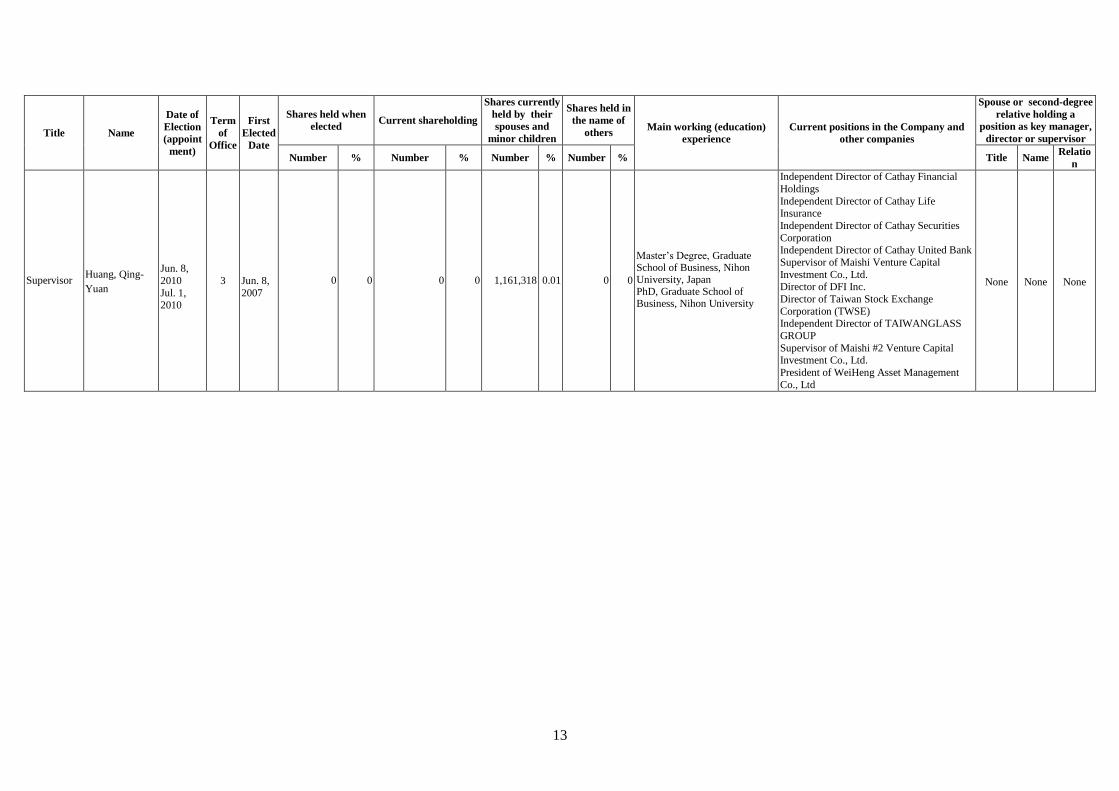
13
Title Name
Date of
Election
(appoint
ment)
Term
of
Office
First
Elected
Date
Shares held when
elected Current shareholding
Shares currently
held by their
spouses and
minor children
Shares held in
the name of
others Main working (education)
experience
Current positions in the Company and
other companies
Spouse or second-degree
relative holding a
position as key manager,
director or supervisor
Number % Number % Number % Number % Title Name Relatio
n
Supervisor Huang, Qing-
Yuan
Jun. 8,
2010
Jul. 1, 2010
3
Jun. 8,
2007
0 0 0 0 1,161,318 0.01 0 0
Master’s Degree, Graduate School of Business, Nihon University, Japan PhD, Graduate School of Business, Nihon University
Independent Director of Cathay Financial
Holdings
Independent Director of Cathay Life
Insurance
Independent Director of Cathay Securities
Corporation Independent Director of Cathay United Bank
Supervisor of Maishi Venture Capital
Investment Co., Ltd. Director of DFI Inc.
Director of Taiwan Stock Exchange
Corporation (TWSE) Independent Director of TAIWANGLASS
GROUP
Supervisor of Maishi #2 Venture Capital
Investment Co., Ltd.
President of WeiHeng Asset Management
Co., Ltd
None None None
14
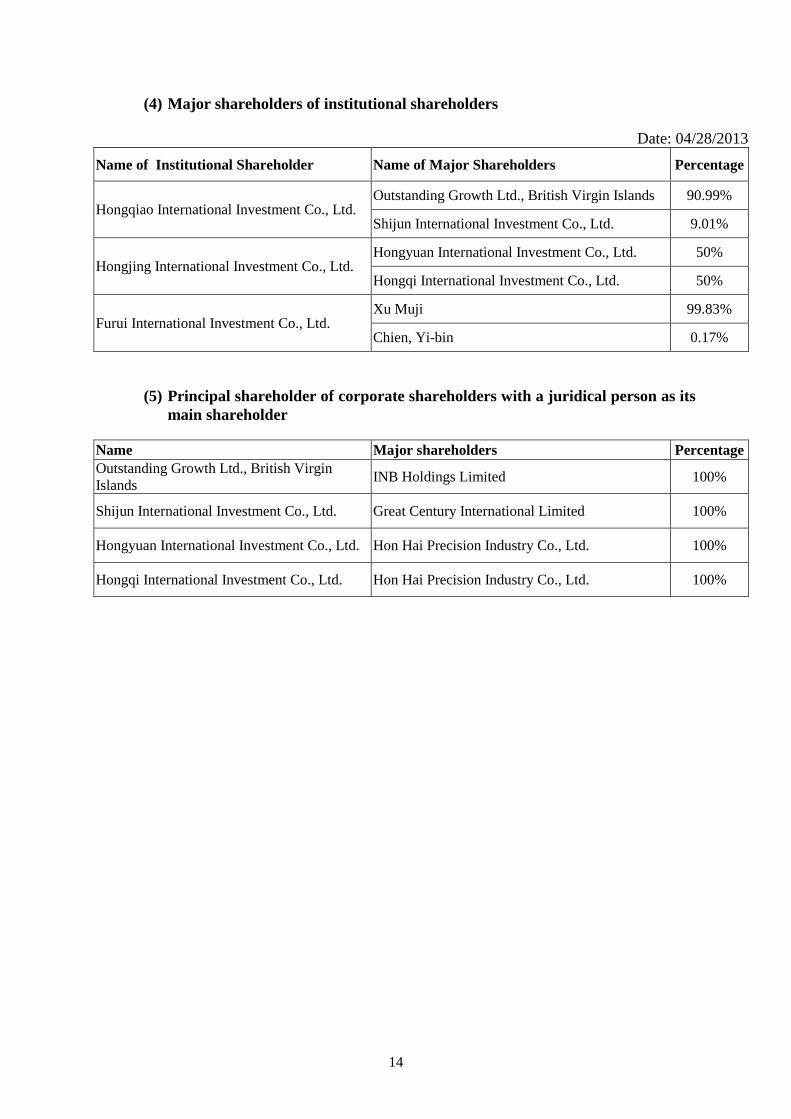
(4) Major shareholders of institutional shareholders
Date: 04/28/2013
Name of Institutional Shareholder Name of Major Shareholders Percentage
Hongqiao International Investment Co., Ltd. Outstanding Growth Ltd., British Virgin Islands 90.99%
Shijun International Investment Co., Ltd. 9.01%
Hongjing International Investment Co., Ltd. Hongyuan International Investment Co., Ltd. 50%
Hongqi International Investment Co., Ltd. 50%
Furui International Investment Co., Ltd. Xu Muji 99.83%
Chien, Yi-bin 0.17%
(5) Principal shareholder of corporate shareholders with a juridical person as its
main shareholder
Name Major shareholders Percentage
Outstanding Growth Ltd., British Virgin
Islands INB Holdings Limited 100%
Shijun International Investment Co., Ltd. Great Century International Limited 100%
Hongyuan International Investment Co., Ltd. Hon Hai Precision Industry Co., Ltd. 100%
Hongqi International Investment Co., Ltd. Hon Hai Precision Industry Co., Ltd. 100%
15
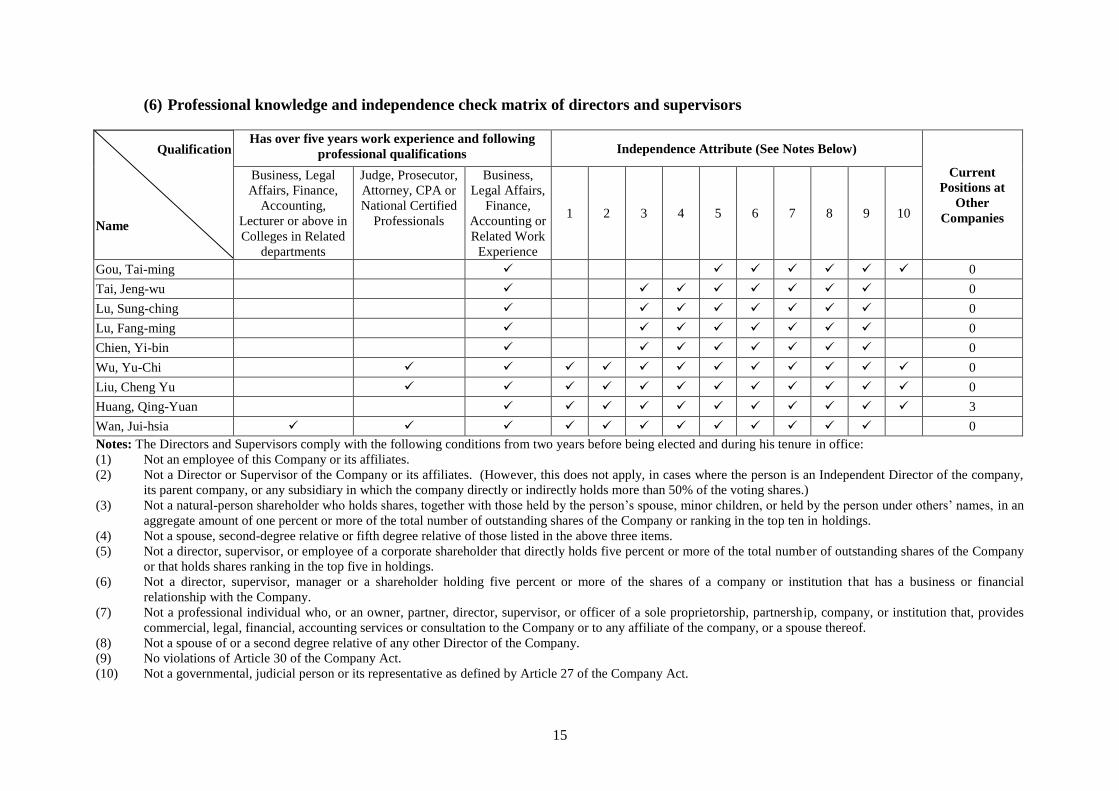
(6) Professional knowledge and independence check matrix of directors and supervisors
Qualification
Name
Has over five years work experience and following
professional qualifications Independence Attribute (See Notes Below)
Current
Positions at
Other
Companies
Business, Legal
Affairs, Finance,
Accounting,
Lecturer or above in
Colleges in Related
departments
Judge, Prosecutor,
Attorney, CPA or
National Certified
Professionals
Business,
Legal Affairs,
Finance,
Accounting or
Related Work
Experience
1 2 3 4 5 6 7 8 9 10
Gou, Tai-ming 0
Tai, Jeng-wu 0
Lu, Sung-ching 0
Lu, Fang-ming 0
Chien, Yi-bin 0
Wu, Yu-Chi 0
Liu, Cheng Yu 0
Huang, Qing-Yuan 3
Wan, Jui-hsia 0
Notes: The Directors and Supervisors comply with the following conditions from two years before being elected and during his tenure in office:
(1) Not an employee of this Company or its affiliates.
(2) Not a Director or Supervisor of the Company or its affiliates. (However, this does not apply, in cases where the person is an Independent Director of the company,
its parent company, or any subsidiary in which the company directly or indirectly holds more than 50% of the voting shares.)
(3) Not a natural-person shareholder who holds shares, together with those held by the person’s spouse, minor children, or held by the person under others’ names, in an
aggregate amount of one percent or more of the total number of outstanding shares of the Company or ranking in the top ten in holdings.
(4) Not a spouse, second-degree relative or fifth degree relative of those listed in the above three items.
(5) Not a director, supervisor, or employee of a corporate shareholder that directly holds five percent or more of the total number of outstanding shares of the Company
or that holds shares ranking in the top five in holdings.
(6) Not a director, supervisor, manager or a shareholder holding five percent or more of the shares of a company or institution that has a business or financial
relationship with the Company.
(7) Not a professional individual who, or an owner, partner, director, supervisor, or officer of a sole proprietorship, partnership, company, or institution that, provides
commercial, legal, financial, accounting services or consultation to the Company or to any affiliate of the company, or a spouse thereof.
(8) Not a spouse of or a second degree relative of any other Director of the Company.
(9) No violations of Article 30 of the Company Act.
(10) Not a governmental, judicial person or its representative as defined by Article 27 of the Company Act.
16
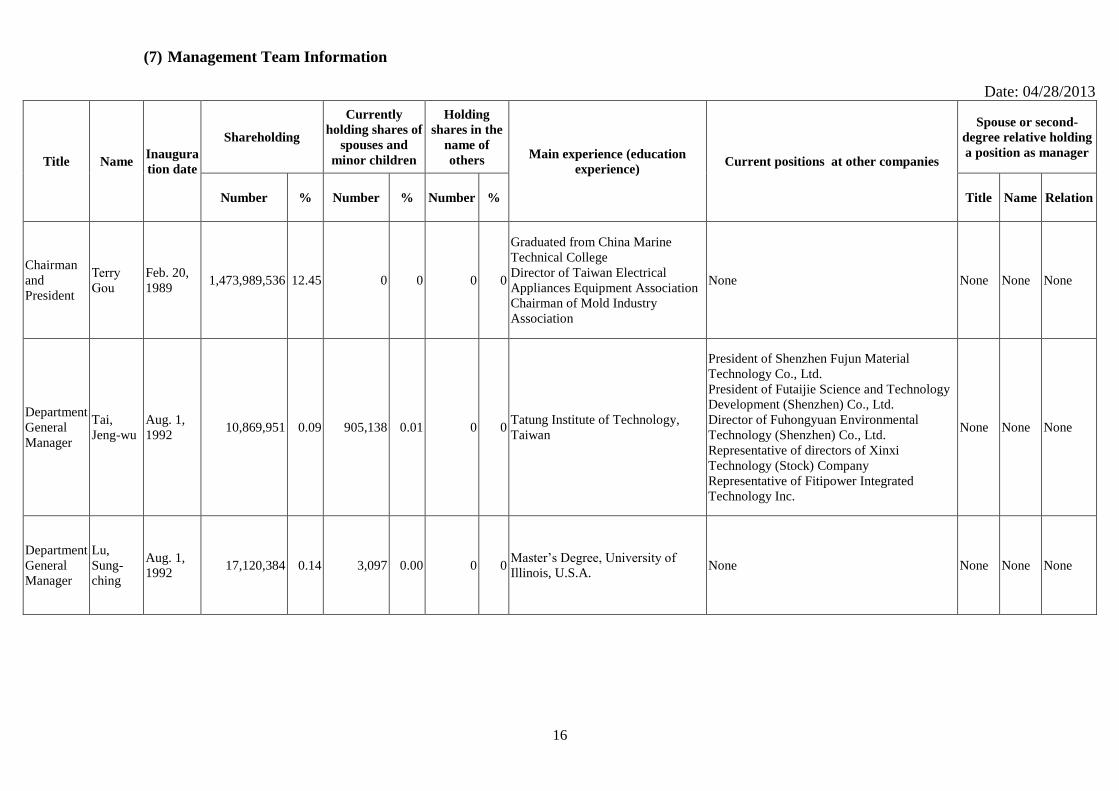
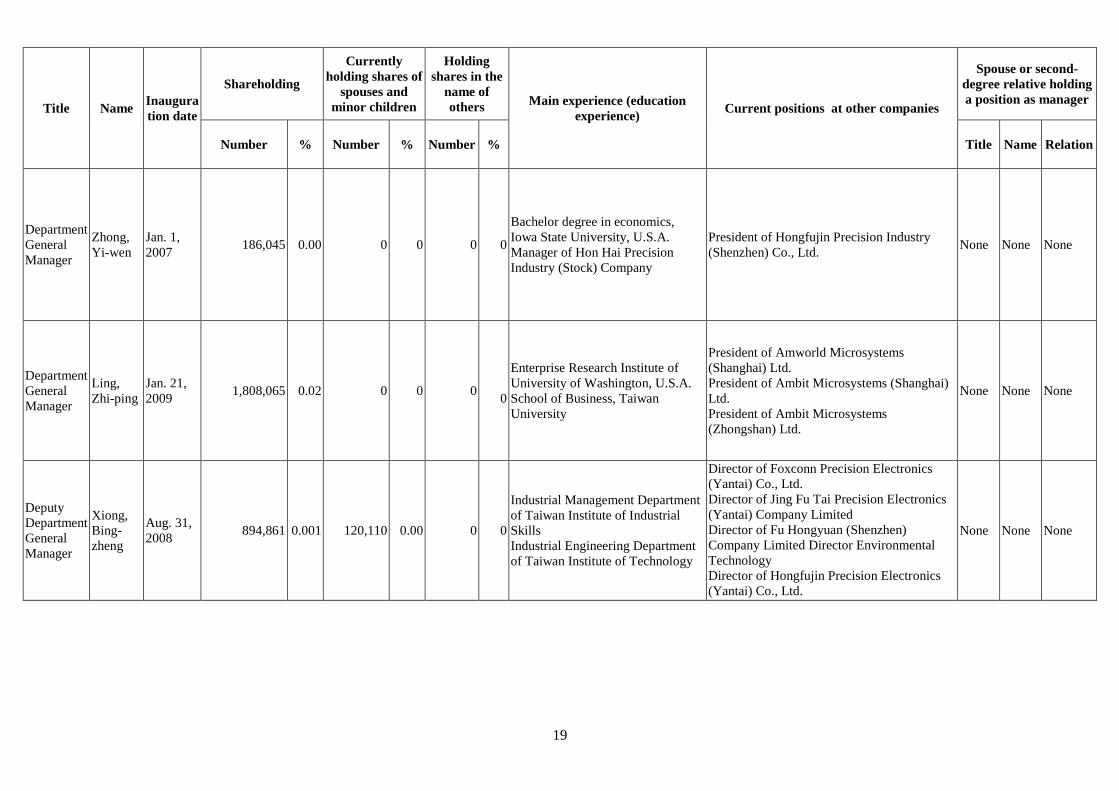
(7) Management Team Information
Date: 04/28/2013
Title Name Inaugura
tion date
Shareholding
Currently
holding shares of
spouses and
minor children
Holding
shares in the
name of
others Main experience (education
experience) Current positions at other companies
Spouse or second-
degree relative holding
a position as manager
Number % Number % Number % Title Name Relation
Chairman
and
President
Terry
Gou
Feb. 20,
1989 1,473,989,536 12.45 0 0 0 0
Graduated from China Marine
Technical College
Director of Taiwan Electrical
Appliances Equipment Association
Chairman of Mold Industry
Association
None None None None
Department
General
Manager
Tai,
Jeng-wu
Aug. 1,
1992 10,869,951 0.09 905,138 0.01 0 0
Tatung Institute of Technology,
Taiwan
President of Shenzhen Fujun Material
Technology Co., Ltd.
President of Futaijie Science and Technology
Development (Shenzhen) Co., Ltd.
Director of Fuhongyuan Environmental
Technology (Shenzhen) Co., Ltd.
Representative of directors of Xinxi
Technology (Stock) Company
Representative of Fitipower Integrated
Technology Inc.
None None None
Department
General
Manager
Lu,
Sung-
ching
Aug. 1,
1992 17,120,384 0.14 3,097 0.00 0 0
Master’s Degree, University of
Illinois, U.S.A. None None None None
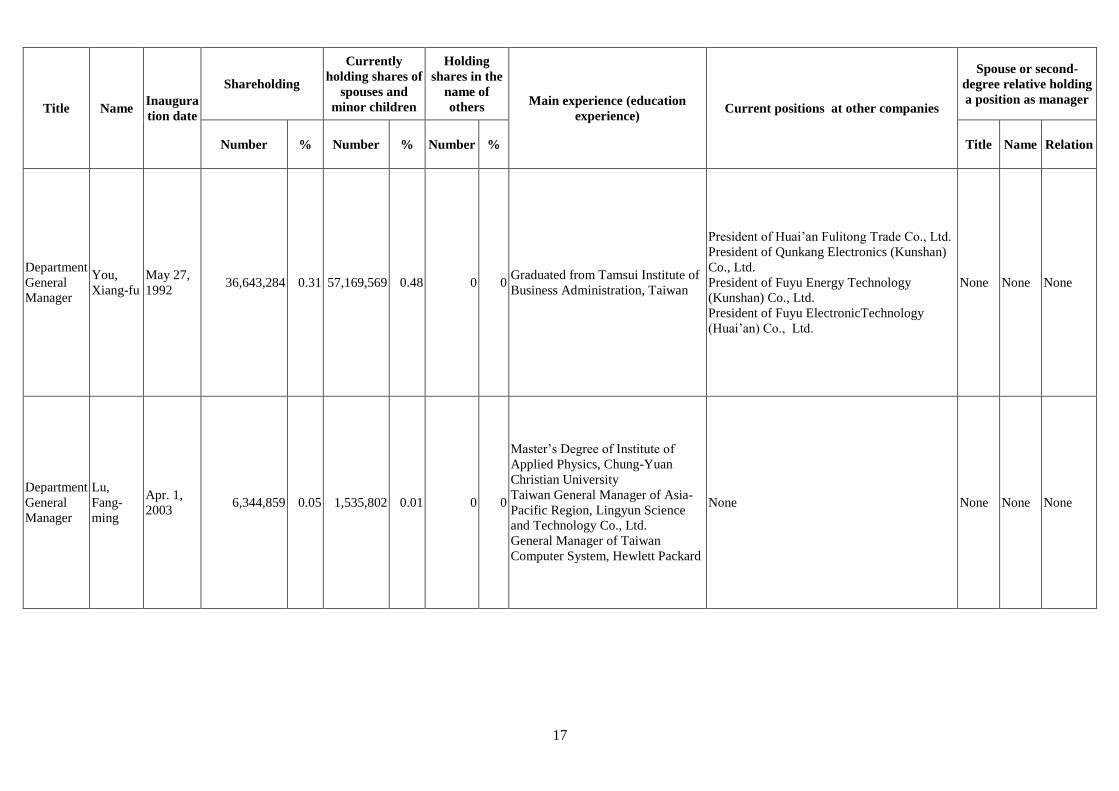
17
Title Name Inaugura
tion date
Shareholding
Currently
holding shares of
spouses and
minor children
Holding
shares in the
name of
others Main experience (education
experience) Current positions at other companies
Spouse or second-
degree relative holding
a position as manager
Number % Number % Number % Title Name Relation
Department
General
Manager
You,
Xiang-fu
May 27,
1992 36,643,284 0.31 57,169,569 0.48 0 0
Graduated from Tamsui Institute of
Business Administration, Taiwan
President of Huai’an Fulitong Trade Co., Ltd.
President of Qunkang Electronics (Kunshan)
Co., Ltd.
President of Fuyu Energy Technology
(Kunshan) Co., Ltd.
President of Fuyu ElectronicTechnology
(Huai’an) Co., Ltd.
None None None
Department
General
Manager
Lu,
Fang-
ming
Apr. 1,
2003 6,344,859 0.05 1,535,802 0.01 0 0
Master’s Degree of Institute of
Applied Physics, Chung-Yuan
Christian University
Taiwan General Manager of Asia-
Pacific Region, Lingyun Science
and Technology Co., Ltd.
General Manager of Taiwan
Computer System, Hewlett Packard
None None None None
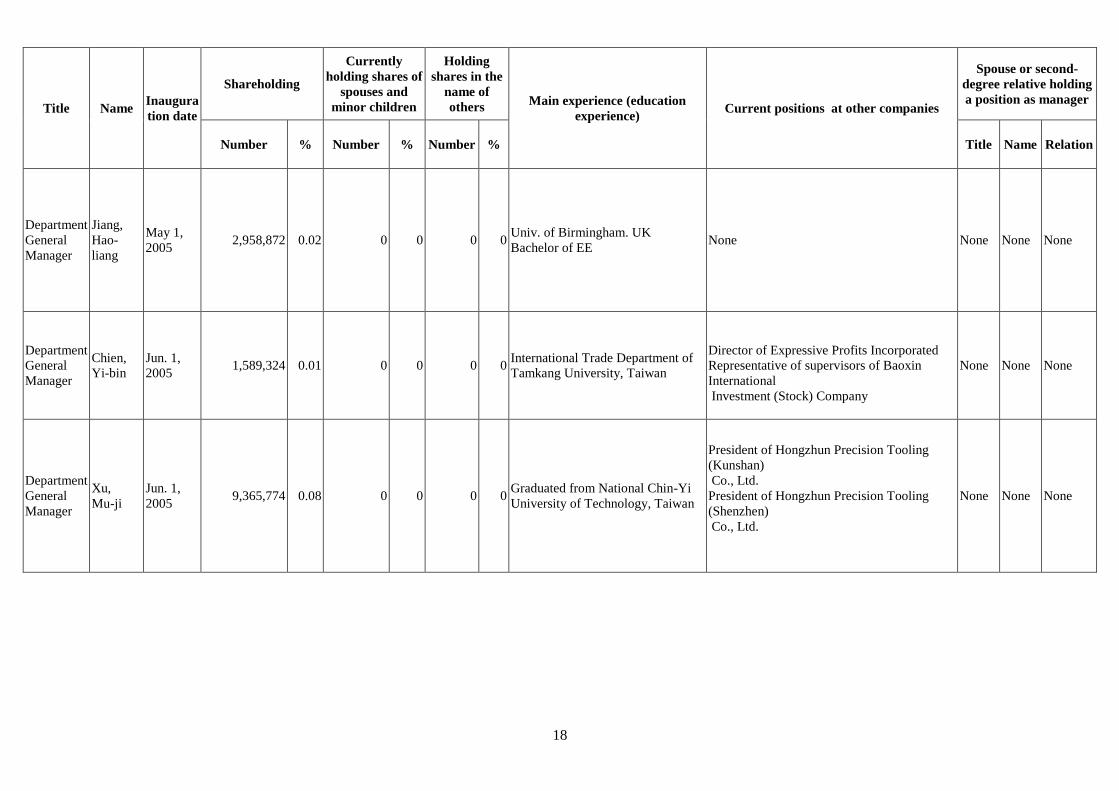
18
Title Name Inaugura
tion date
Shareholding
Currently
holding shares of
spouses and
minor children
Holding
shares in the
name of
others Main experience (education
experience) Current positions at other companies
Spouse or second-
degree relative holding
a position as manager
Number % Number % Number % Title Name Relation
Department
General
Manager
Jiang,
Hao-
liang
May 1,
2005 2,958,872 0.02 0 0 0 0
Univ. of Birmingham. UK
Bachelor of EE None None None None
Department
General
Manager
Chien,
Yi-bin
Jun. 1,
2005 1,589,324 0.01 0 0 0 0
International Trade Department of
Tamkang University, Taiwan
Director of Expressive Profits Incorporated
Representative of supervisors of Baoxin
International
Investment (Stock) Company
None None None
Department
General
Manager
Xu,
Mu-ji
Jun. 1,
2005 9,365,774 0.08 0 0 0 0
Graduated from National Chin-Yi
University of Technology, Taiwan
President of Hongzhun Precision Tooling
(Kunshan)
Co., Ltd.
President of Hongzhun Precision Tooling
(Shenzhen)
Co., Ltd.
None None None
19
Title Name Inaugura
tion date
Shareholding
Currently
holding shares of
spouses and
minor children
Holding
shares in the
name of
others Main experience (education
experience) Current positions at other companies
Spouse or second-
degree relative holding
a position as manager
Number % Number % Number % Title Name Relation
Department
General
Manager
Zhong,
Yi-wen
Jan. 1,
2007 186,045 0.00 0 0 0 0
Bachelor degree in economics,
Iowa State University, U.S.A.
Manager of Hon Hai Precision
Industry (Stock) Company
President of Hongfujin Precision Industry
(Shenzhen) Co., Ltd. None None None
Department
General
Manager
Ling,
Zhi-ping
Jan. 21,
2009 1,808,065 0.02 0 0 0
0
Enterprise Research Institute of
University of Washington, U.S.A.
School of Business, Taiwan
University
President of Amworld Microsystems
(Shanghai) Ltd.
President of Ambit Microsystems (Shanghai)
Ltd.
President of Ambit Microsystems
(Zhongshan) Ltd.
None None None
Deputy
Department
General
Manager
Xiong,
Bing-
zheng
Aug. 31,
2008 894,861 0.001 120,110 0.00 0 0
Industrial Management Department
of Taiwan Institute of Industrial
Skills
Industrial Engineering Department
of Taiwan Institute of Technology
Director of Foxconn Precision Electronics
(Yantai) Co., Ltd.
Director of Jing Fu Tai Precision Electronics
(Yantai) Company Limited
Director of Fu Hongyuan (Shenzhen)
Company Limited Director Environmental
Technology
Director of Hongfujin Precision Electronics
(Yantai) Co., Ltd.
Director of Yantai Fuhuada Precision
Electronics Co., Ltd.
Director of Competition Optical Technology
Ltd.
Director of Competition Team Ireland Ltd.
Director of Competition Team Technology
Pte. Ltd.
Director of Dominant Elite Holding Ltd.
Director of Foxconn Baja California S.A. de
C.V.
Director of Famous Rise International Ltd.
Director of Universal Field International Ltd.
Representative of directors of Pan-
None None None
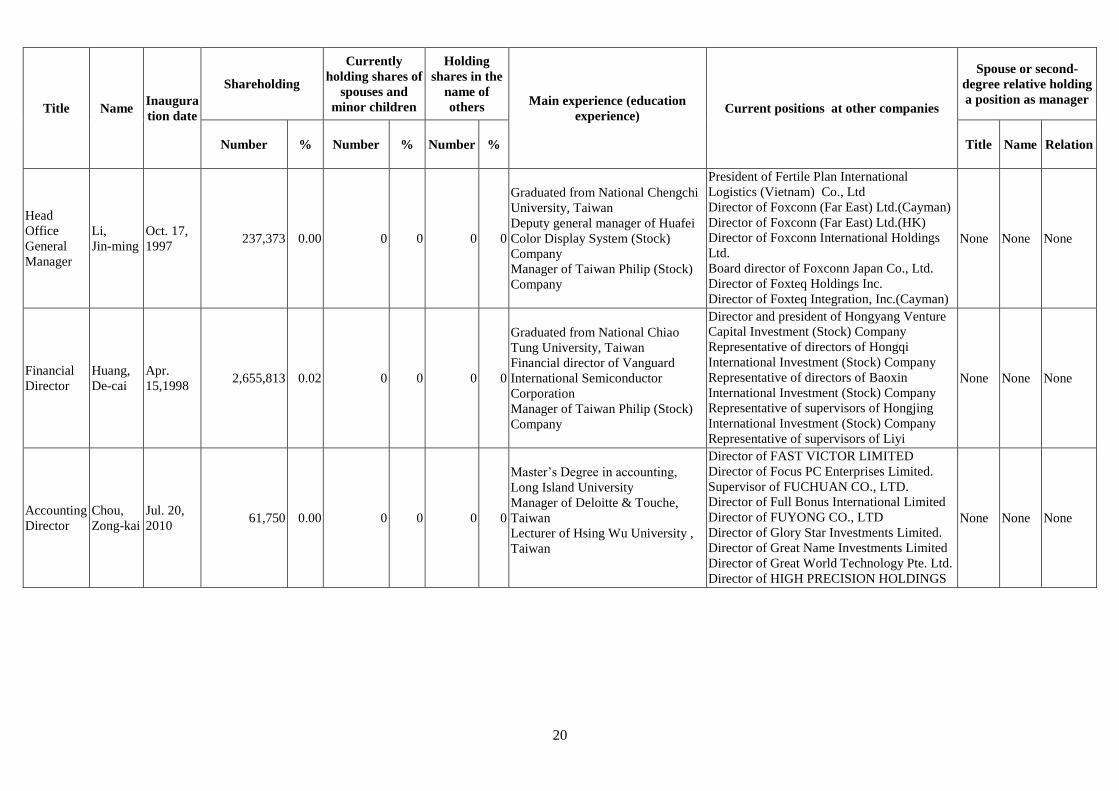
20
Title Name Inaugura
tion date
Shareholding
Currently
holding shares of
spouses and
minor children
Holding
shares in the
name of
others Main experience (education
experience) Current positions at other companies
Spouse or second-
degree relative holding
a position as manager
Number % Number % Number % Title Name Relation
Head
Office
General
Manager
Li,
Jin-ming
Oct. 17,
1997 237,373 0.00 0 0 0 0
Graduated from National Chengchi
University, Taiwan
Deputy general manager of Huafei
Color Display System (Stock)
Company
Manager of Taiwan Philip (Stock)
Company
President of Fertile Plan International
Logistics (Vietnam) Co., Ltd
Director of Foxconn (Far East) Ltd.(Cayman)
Director of Foxconn (Far East) Ltd.(HK)
Director of Foxconn International Holdings
Ltd.
Board director of Foxconn Japan Co., Ltd.
Director of Foxteq Holdings Inc.
Director of Foxteq Integration, Inc.(Cayman)
Director of Foxteq Investments Ltd.
Director of FUCHUAN CO., Ltd.
Director of FUHONG Precision Component
(Bac Giang) LTD.
Director of FUNING Precision Component
Co., LTD.
Director of KCT Engineering Co., Ltd.
Directors of Liyi International Investment
(Stock) Company
Directors of Hongyuan International
Investment (Stock) Company
Director of Hongjing International Investment
(Stock) Company
Directors of Hongqi International Investment
(Stock) Company
Supervisors of Hongyang Venture Capital
Investment (Stock) Company
Director of Hongfujin Precision Industry
(Shenzhen) Co., Ltd.
President of Shenzhen Futaitong International
Logistics Co., Ltd.
None None None
Financial
Director
Huang,
De-cai
Apr.
15,1998 2,655,813 0.02 0 0 0 0
Graduated from National Chiao
Tung University, Taiwan
Financial director of Vanguard
International Semiconductor
Corporation
Manager of Taiwan Philip (Stock)
Company
Director and president of Hongyang Venture
Capital Investment (Stock) Company
Representative of directors of Hongqi
International Investment (Stock) Company
Representative of directors of Baoxin
International Investment (Stock) Company
Representative of supervisors of Hongjing
International Investment (Stock) Company
Representative of supervisors of Liyi
International Investment (Stock) Company
Representative of supervisors of Hongyuan
International investment (Stock) Company
Supervisor of Pan-International Industrial
Corporation
Representative of Supervisors of CyberTAN
Technology, Inc.
Director of Shenzhen Fuxuntong Trading Co.,
Ltd.
None None None
Accounting
Director
Chou,
Zong-kai
Jul. 20,
2010 61,750 0.00 0 0 0 0
Master’s Degree in accounting,
Long Island University
Manager of Deloitte & Touche,
Taiwan
Lecturer of Hsing Wu University ,
Taiwan
Director of FAST VICTOR LIMITED
Director of Focus PC Enterprises Limited.
Supervisor of FUCHUAN CO., LTD.
Director of Full Bonus International Limited
Director of FUYONG CO., LTD
Director of Glory Star Investments Limited.
Director of Great Name Investments Limited
Director of Great World Technology Pte. Ltd.
Director of HIGH PRECISION HOLDINGS
LIMITED
Supervisor of KCT Engineering Co., Ltd.
Director of Keep Profit Investment Limited
Director of Mega Star Investments Limited
Director METRO VICTORY LIMITED
Director of Operate Technology Limited
Director of Precision Technology Investments
Pte. Ltd. Director of Tongrand Limited
None None None
21
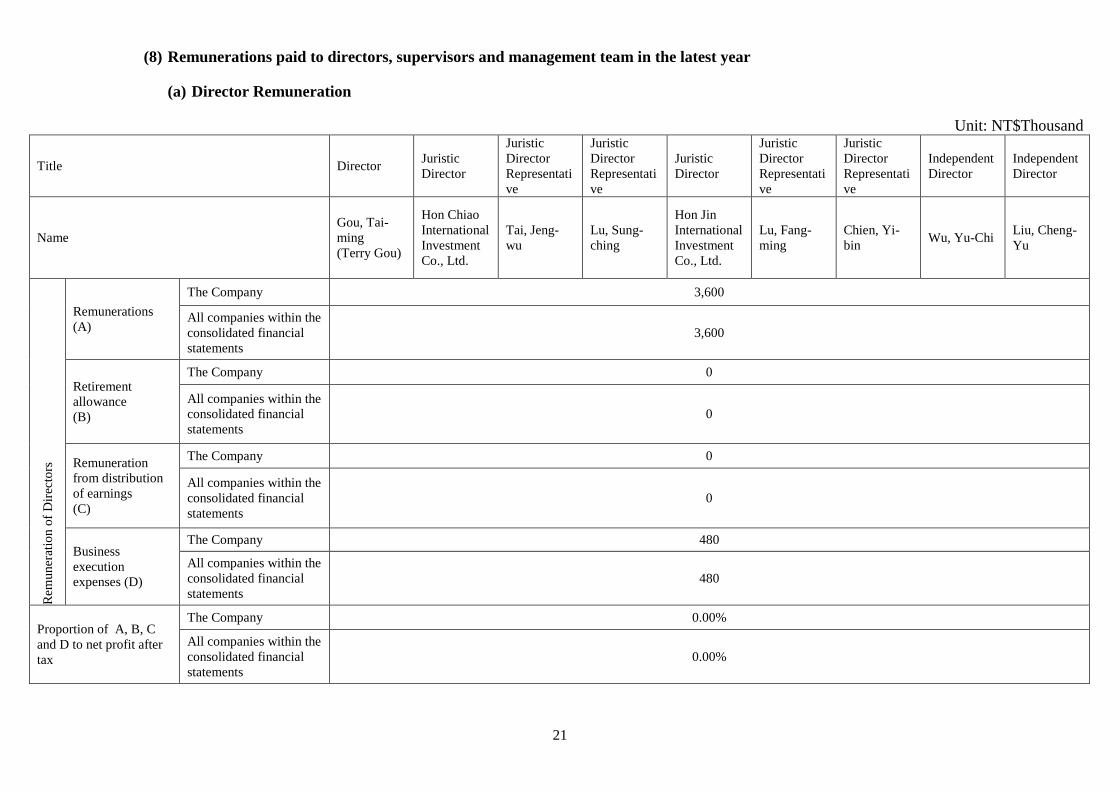
(8) Remunerations paid to directors, supervisors and management team in the latest year
(a) Director Remuneration
Unit: NT$Thousand
Title Director Juristic
Director
Juristic
Director
Representati
ve
Juristic
Director
Representati
ve
Juristic
Director
Juristic
Director
Representati
ve
Juristic
Director
Representati
ve
Independent
Director
Independent
Director
Name
Gou, Tai-
ming
(Terry Gou)
Hon Chiao
International
Investment
Co., Ltd.
Tai, Jeng-
wu
Lu, Sung-
ching
Hon Jin
International
Investment
Co., Ltd.
Lu, Fang-
ming
Chien, Yi-
bin Wu, Yu-Chi
Liu, Cheng-
Yu
Rem
un
erat
ion
of
Dir
ecto
rs
Remunerations
(A)
The Company 3,600
All companies within the
consolidated financial
statements
3,600
Retirement
allowance
(B)
The Company 0
All companies within the
consolidated financial
statements
0
Remuneration
from distribution
of earnings
(C)
The Company 0
All companies within the
consolidated financial
statements
0
Business
execution
expenses (D)
The Company 480
All companies within the
consolidated financial
statements
480
Proportion of A, B, C
and D to net profit after
tax
The Company 0.00%
All companies within the
consolidated financial
statements
0.00%
22
R
elev
ant
rem
un
erat
ion
of
par
t-ti
me
per
son
nel
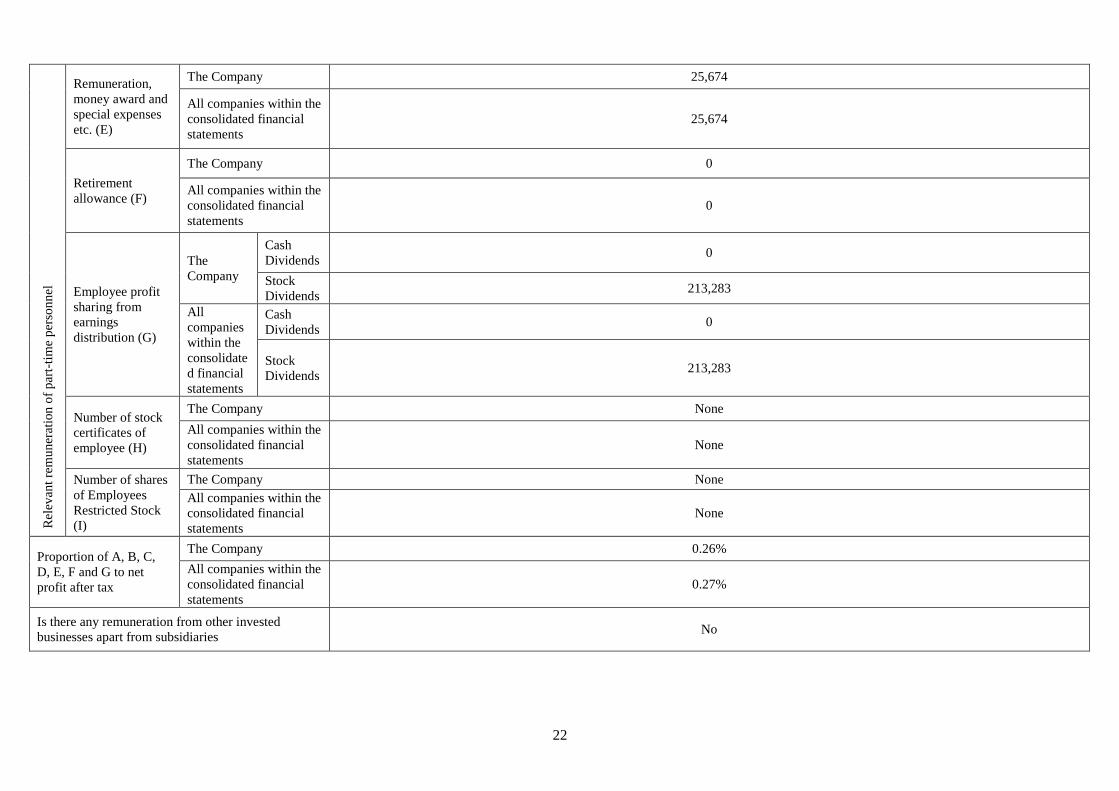
Remuneration,
money award and
special expenses
etc. (E)
The Company 25,674
All companies within the
consolidated financial
statements
25,674
Retirement
allowance (F)
The Company 0
All companies within the
consolidated financial
statements
0
Employee profit
sharing from
earnings
distribution (G)
The
Company
Cash
Dividends 0
Stock
Dividends 213,283
All
companies
within the
consolidate
d financial
statements
Cash
Dividends 0
Stock
Dividends 213,283
Number of stock
certificates of
employee (H)
The Company None
All companies within the
consolidated financial
statements
None
Number of shares
of Employees
Restricted Stock
(I)
The Company None
All companies within the
consolidated financial
statements
None
Proportion of A, B, C,
D, E, F and G to net
profit after tax
The Company 0.26%
All companies within the
consolidated financial
statements
0.27%
Is there any remuneration from other invested
businesses apart from subsidiaries No
23
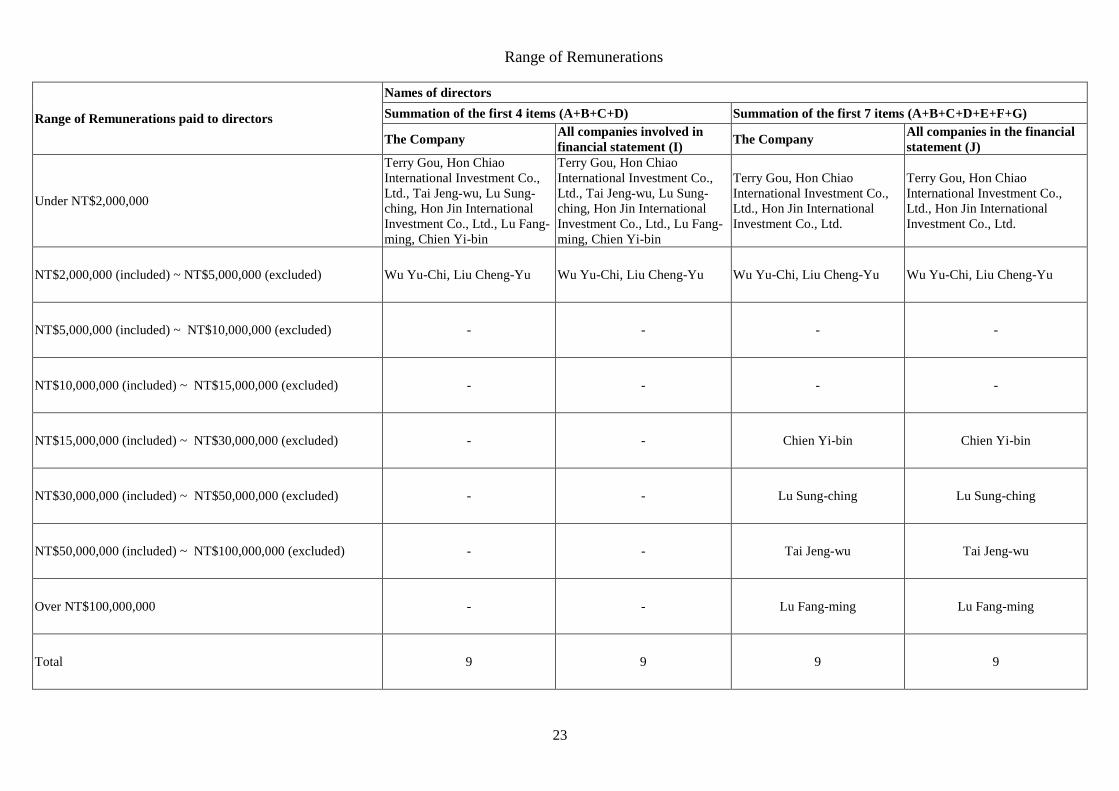
Range of Remunerations
Range of Remunerations paid to directors
Names of directors
Summation of the first 4 items (A+B+C+D) Summation of the first 7 items (A+B+C+D+E+F+G)
The Company All companies involved in
financial statement (I) The Company
All companies in the financial
statement (J)
Under NT$2,000,000
Terry Gou, Hon Chiao
International Investment Co.,
Ltd., Tai Jeng-wu, Lu Sung-
ching, Hon Jin International
Investment Co., Ltd., Lu Fang-
ming, Chien Yi-bin
Terry Gou, Hon Chiao
International Investment Co.,
Ltd., Tai Jeng-wu, Lu Sung-
ching, Hon Jin International
Investment Co., Ltd., Lu Fang-
ming, Chien Yi-bin
Terry Gou, Hon Chiao
International Investment Co.,
Ltd., Hon Jin International
Investment Co., Ltd.
Terry Gou, Hon Chiao
International Investment Co.,
Ltd., Hon Jin International
Investment Co., Ltd.
NT$2,000,000 (included) ~ NT$5,000,000 (excluded) Wu Yu-Chi, Liu Cheng-Yu Wu Yu-Chi, Liu Cheng-Yu Wu Yu-Chi, Liu Cheng-Yu Wu Yu-Chi, Liu Cheng-Yu
NT$5,000,000 (included) ~ NT$10,000,000 (excluded) - - - -
NT$10,000,000 (included) ~ NT$15,000,000 (excluded) - - - -
NT$15,000,000 (included) ~ NT$30,000,000 (excluded) - - Chien Yi-bin Chien Yi-bin
NT$30,000,000 (included) ~ NT$50,000,000 (excluded) - - Lu Sung-ching Lu Sung-ching
NT$50,000,000 (included) ~ NT$100,000,000 (excluded) - - Tai Jeng-wu Tai Jeng-wu
Over NT$100,000,000 - - Lu Fang-ming Lu Fang-ming
Total 9 9 9 9
24
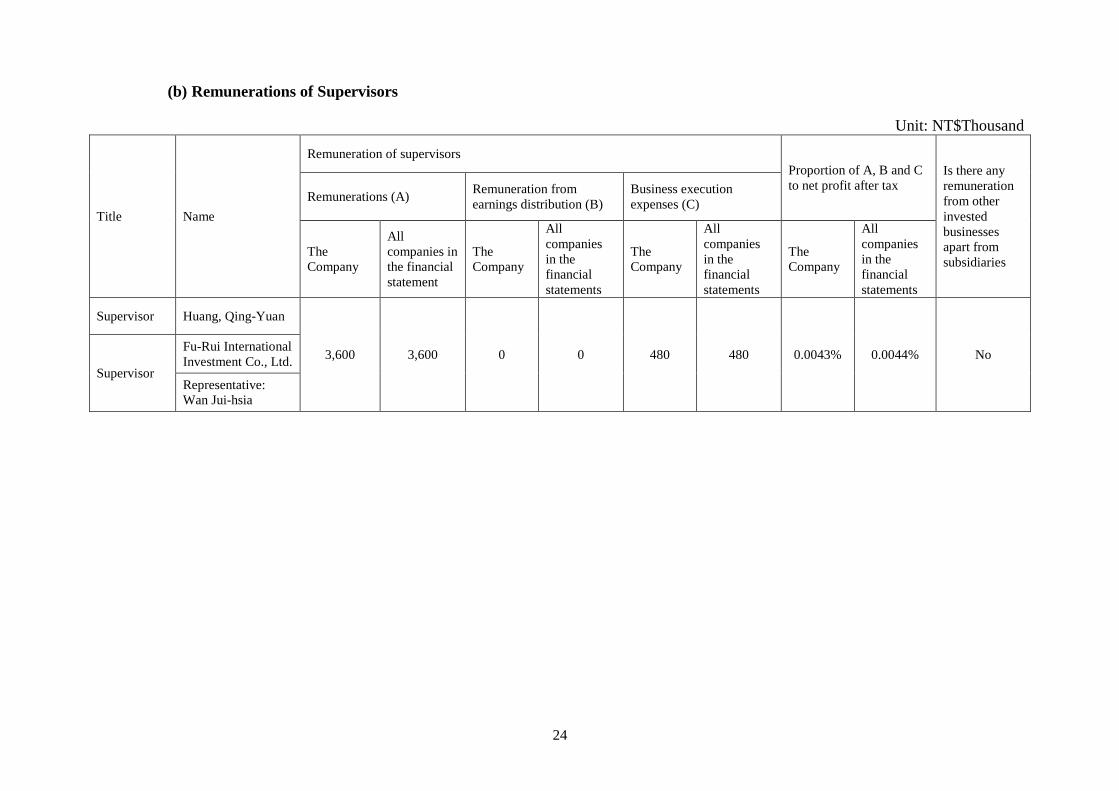
(b) Remunerations of Supervisors
Unit: NT$Thousand
Title Name
Remuneration of supervisors
Proportion of A, B and C
to net profit after tax Is there any
remuneration
from other
invested
businesses
apart from
subsidiaries
Remunerations (A) Remuneration from
earnings distribution (B)
Business execution
expenses (C)
The
Company
All
companies in
the financial
statement
The
Company
All
companies
in the
financial
statements
The
Company
All
companies
in the
financial
statements
The
Company
All
companies
in the
financial
statements
Supervisor Huang, Qing-Yuan
3,600 3,600 0 0 480 480 0.0043% 0.0044% No
Supervisor
Fu-Rui International
Investment Co., Ltd.
Representative:
Wan Jui-hsia
25
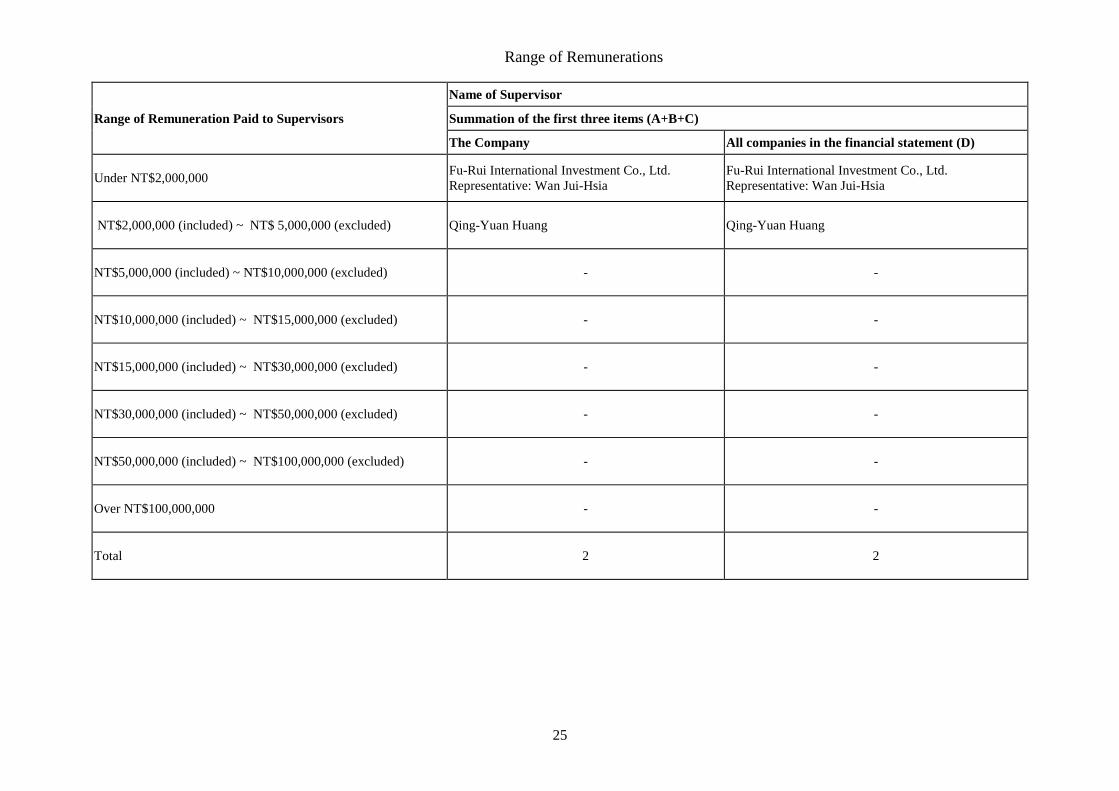
Range of Remunerations
Range of Remuneration Paid to Supervisors
Name of Supervisor
Summation of the first three items (A+B+C)
The Company All companies in the financial statement (D)
Under NT$2,000,000 Fu-Rui International Investment Co., Ltd.
Representative: Wan Jui-Hsia
Fu-Rui International Investment Co., Ltd.
Representative: Wan Jui-Hsia
NT$2,000,000 (included) ~ NT$ 5,000,000 (excluded) Qing-Yuan Huang Qing-Yuan Huang
NT$5,000,000 (included) ~ NT$10,000,000 (excluded) - -
NT$10,000,000 (included) ~ NT$15,000,000 (excluded) - -
NT$15,000,000 (included) ~ NT$30,000,000 (excluded) - -
NT$30,000,000 (included) ~ NT$50,000,000 (excluded) - -
NT$50,000,000 (included) ~ NT$100,000,000 (excluded) - -
Over NT$100,000,000 - -
Total 2 2
26
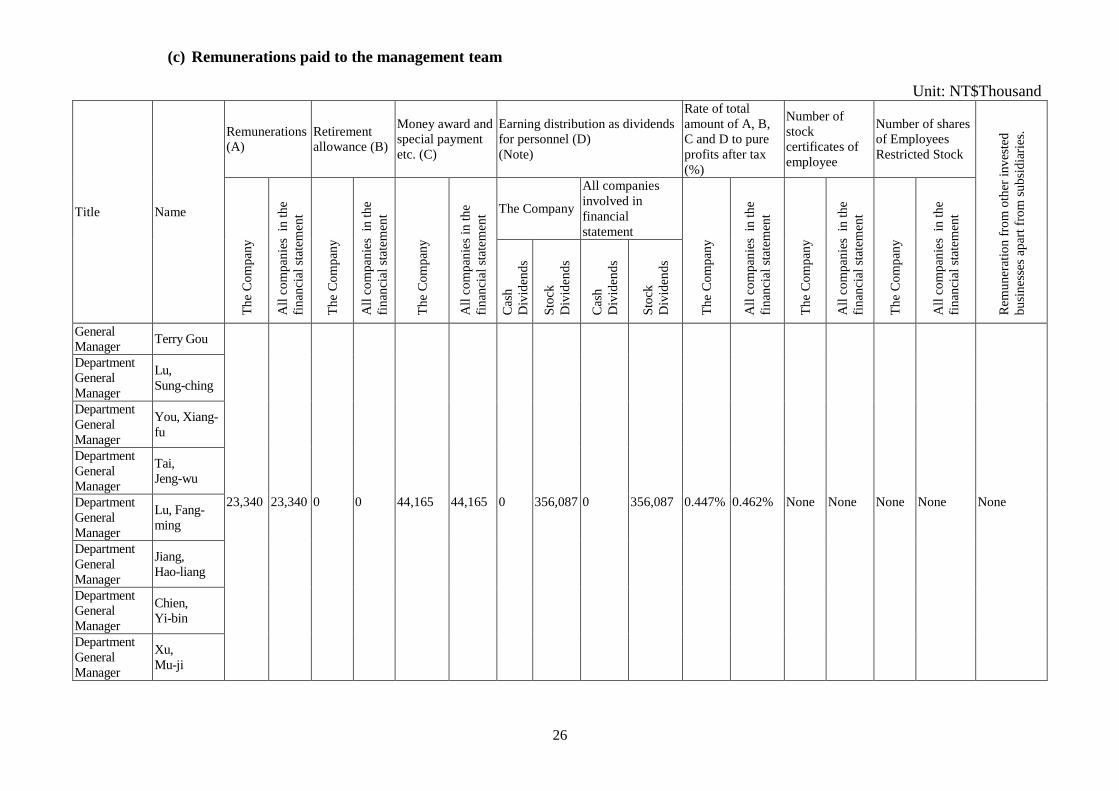
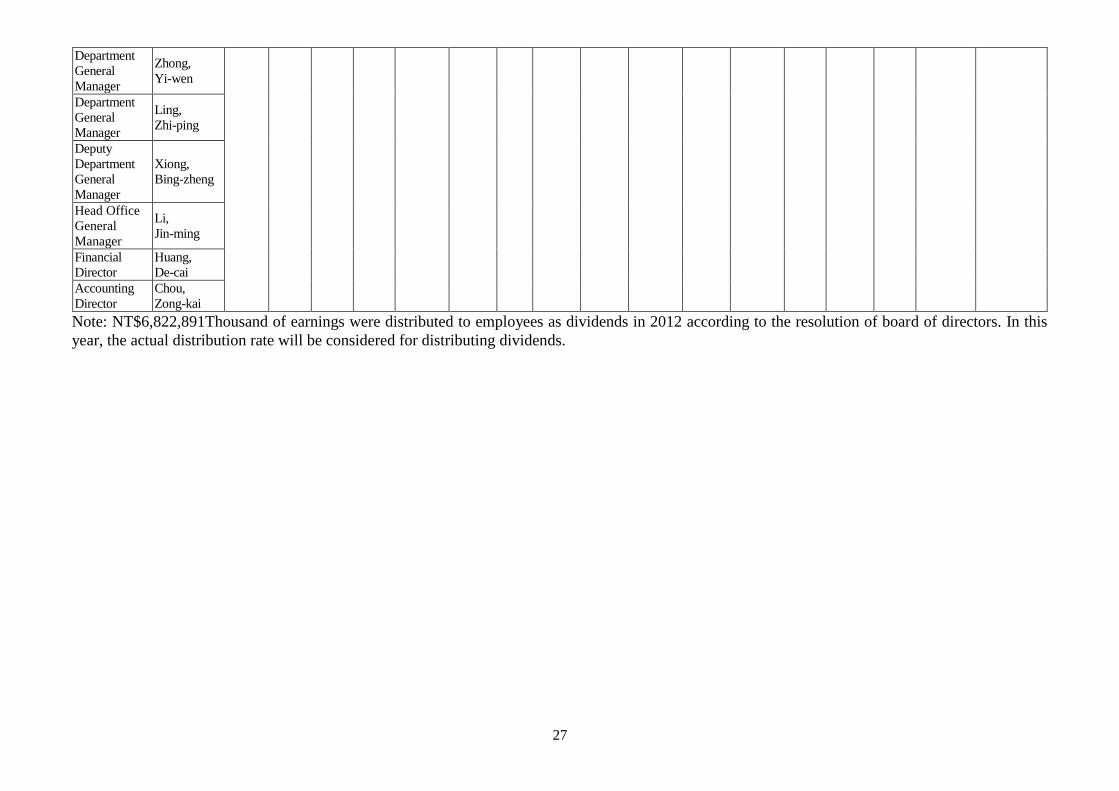
(c) Remunerations paid to the management team
Unit: NT$Thousand
Title Name
Remunerations
(A)
Retirement
allowance (B)
Money award and
special payment
etc. (C)
Earning distribution as dividends
for personnel (D)
(Note)
Rate of total
amount of A, B,
C and D to pure
profits after tax
(%)
Number of
stock
certificates of
employee
Number of shares
of Employees
Restricted Stock
Rem
un
erat
ion
fro
m o
ther
inv
este
d
bu
sin
esse
s ap
art
fro
m s
ub
sid
iari
es.
Th
e C
om
pan
y
All
co
mp
anie
s i
n t
he
fin
anci
al s
tate
men
t
Th
e C
om
pan
y
All
co
mp
anie
s i
n t
he
fin
anci
al s
tate
men
t
Th
e C
om
pan
y
All
co
mp
anie
s in
th
e
fin
anci
al s
tate
men
t The Company
All companies
involved in
financial
statement
Th
e C
om
pan
y
All
co
mp
anie
s i
n t
he
fin
anci
al s
tate
men
t
Th
e C
om
pan
y
All
co
mp
anie
s i
n t
he
fin
anci
al s
tate
men
t
Th
e C
om
pan
y
All
co
mp
anie
s i
n t
he
fin
anci
al s
tate
men
t
Cas
h
Div
iden
ds
Sto
ck
Div
iden
ds
Cas
h
Div
iden
ds
Sto
ck
Div
iden
ds
General
Manager Terry Gou
23,340 23,340 0 0 44,165 44,165 0 356,087 0 356,087 0.447% 0.462% None None None None None
Department
General
Manager
Lu,
Sung-ching
Department
General
Manager
You, Xiang-
fu
Department
General
Manager
Tai,
Jeng-wu
Department
General
Manager
Lu, Fang-
ming
Department
General
Manager
Jiang,
Hao-liang
Department
General
Manager
Chien,
Yi-bin
Department
General
Manager
Xu,
Mu-ji
27
Department
General
Manager
Zhong,
Yi-wen
Department
General
Manager
Ling,
Zhi-ping
Deputy
Department
General
Manager
Xiong,
Bing-zheng
Head Office
General
Manager
Li,
Jin-ming
Financial
Director
Huang,
De-cai
Accounting
Director
Chou,
Zong-kai
Note: NT$6,822,891Thousand of earnings were distributed to employees as dividends in 2012 according to the resolution of board of directors. In this
year, the actual distribution rate will be considered for distributing dividends.
28
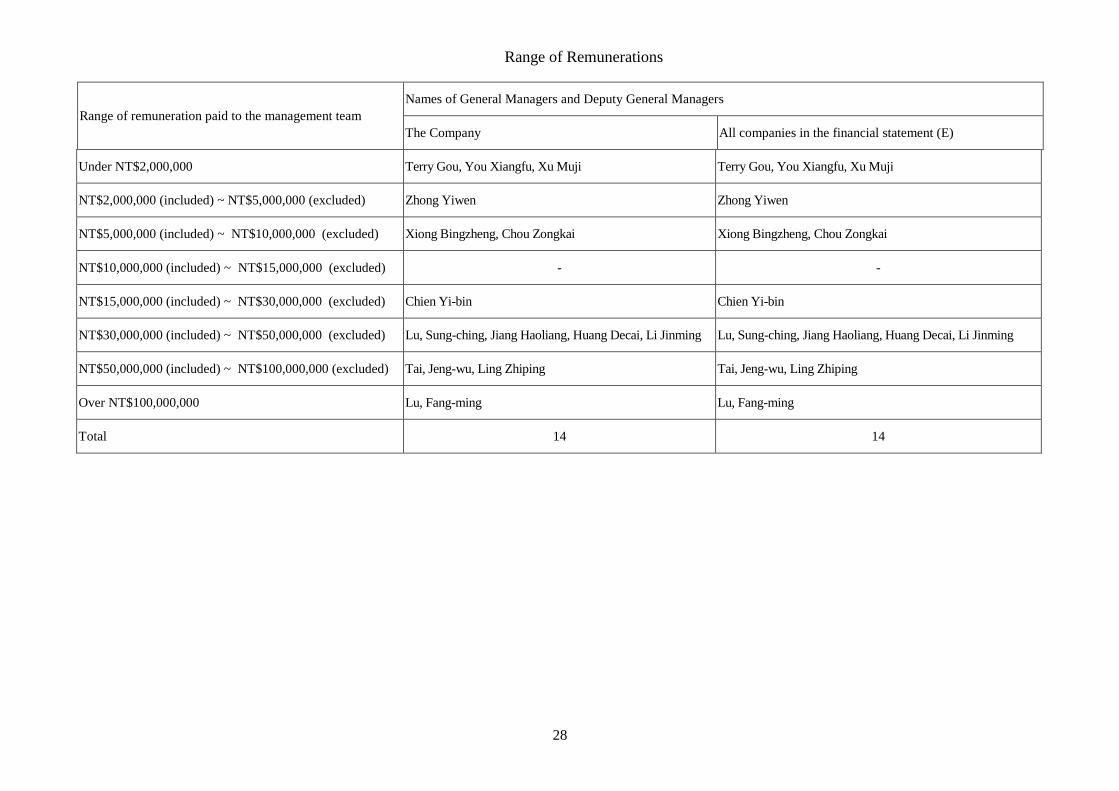
Range of Remunerations
Range of remuneration paid to the management team
Names of General Managers and Deputy General Managers
The Company All companies in the financial statement (E)
Under NT$2,000,000 Terry Gou, You Xiangfu, Xu Muji Terry Gou, You Xiangfu, Xu Muji
NT$2,000,000 (included) ~ NT$5,000,000 (excluded) Zhong Yiwen Zhong Yiwen
NT$5,000,000 (included) ~ NT$10,000,000 (excluded) Xiong Bingzheng, Chou Zongkai Xiong Bingzheng, Chou Zongkai
NT$10,000,000 (included) ~ NT$15,000,000 (excluded) - -
NT$15,000,000 (included) ~ NT$30,000,000 (excluded) Chien Yi-bin Chien Yi-bin
NT$30,000,000 (included) ~ NT$50,000,000 (excluded) Lu, Sung-ching, Jiang Haoliang, Huang Decai, Li Jinming Lu, Sung-ching, Jiang Haoliang, Huang Decai, Li Jinming
NT$50,000,000 (included) ~ NT$100,000,000 (excluded) Tai, Jeng-wu, Ling Zhiping Tai, Jeng-wu, Ling Zhiping
Over NT$100,000,000 Lu, Fang-ming Lu, Fang-ming
Total 14 14
29
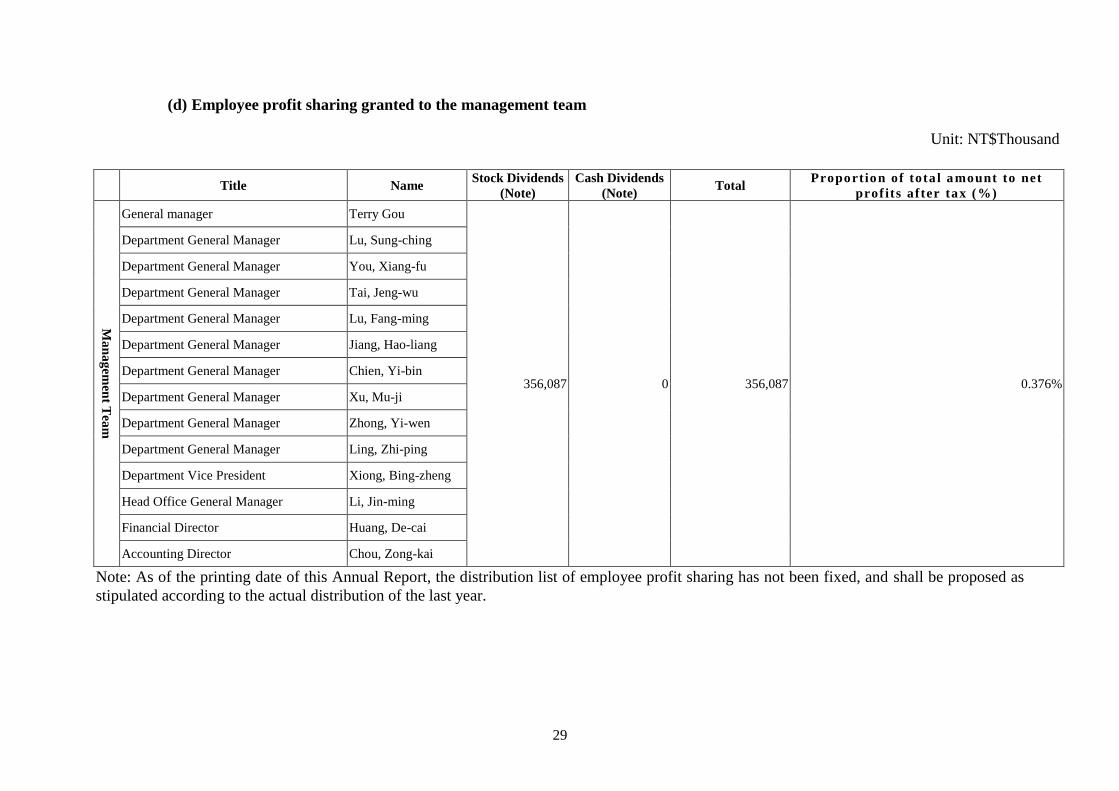
(d) Employee profit sharing granted to the management team
Unit: NT$Thousand
Note: As of the printing date of this Annual Report, the distribution list of employee profit sharing has not been fixed, and shall be proposed as
stipulated according to the actual distribution of the last year.
Title Name
Stock Dividends
(Note)
Cash Dividends
(Note) Total
Proportion of tota l a mount to net
prof its after tax (%)
Ma
na
gem
ent T
eam
General manager Terry Gou
356,087 0 356,087 0.376%
Department General Manager Lu, Sung-ching
Department General Manager You, Xiang-fu
Department General Manager Tai, Jeng-wu
Department General Manager Lu, Fang-ming
Department General Manager Jiang, Hao-liang
Department General Manager Chien, Yi-bin
Department General Manager Xu, Mu-ji
Department General Manager Zhong, Yi-wen
Department General Manager Ling, Zhi-ping
Department Vice President Xiong, Bing-zheng
Head Office General Manager Li, Jin-ming
Financial Director Huang, De-cai
Accounting Director Chou, Zong-kai
30
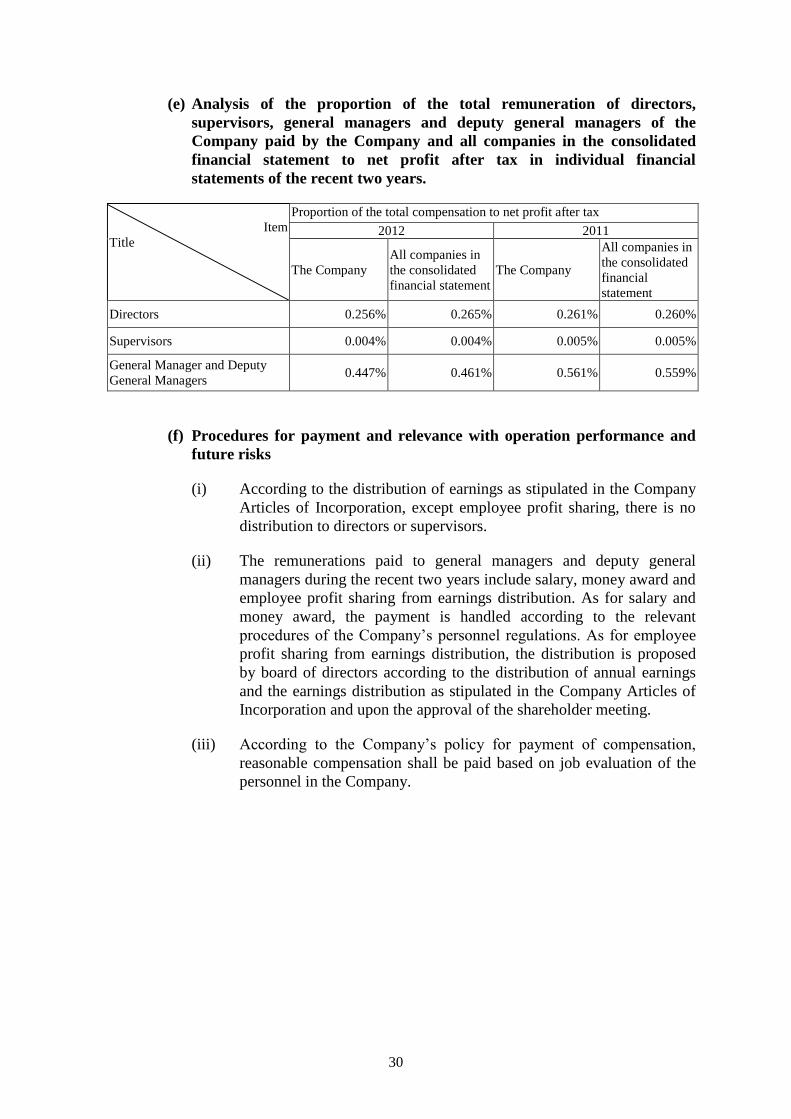
(e) Analysis of the proportion of the total remuneration of directors,
supervisors, general managers and deputy general managers of the
Company paid by the Company and all companies in the consolidated
financial statement to net profit after tax in individual financial
statements of the recent two years.
Item
Title
Proportion of the total compensation to net profit after tax
2012 2011
The Company
All companies in
the consolidated
financial statement
The Company
All companies in
the consolidated
financial
statement
Directors 0.256% 0.265% 0.261% 0.260%
Supervisors 0.004% 0.004% 0.005% 0.005%
General Manager and Deputy
General Managers 0.447% 0.461% 0.561% 0.559%
(f) Procedures for payment and relevance with operation performance and
future risks
(i) According to the distribution of earnings as stipulated in the Company
Articles of Incorporation, except employee profit sharing, there is no
distribution to directors or supervisors.
(ii) The remunerations paid to general managers and deputy general
managers during the recent two years include salary, money award and
employee profit sharing from earnings distribution. As for salary and
money award, the payment is handled according to the relevant
procedures of the Company’s personnel regulations. As for employee
profit sharing from earnings distribution, the distribution is proposed
by board of directors according to the distribution of annual earnings
and the earnings distribution as stipulated in the Company Articles of
Incorporation and upon the approval of the shareholder meeting.
(iii) According to the Company’s policy for payment of compensation,
reasonable compensation shall be paid based on job evaluation of the
personnel in the Company.
31
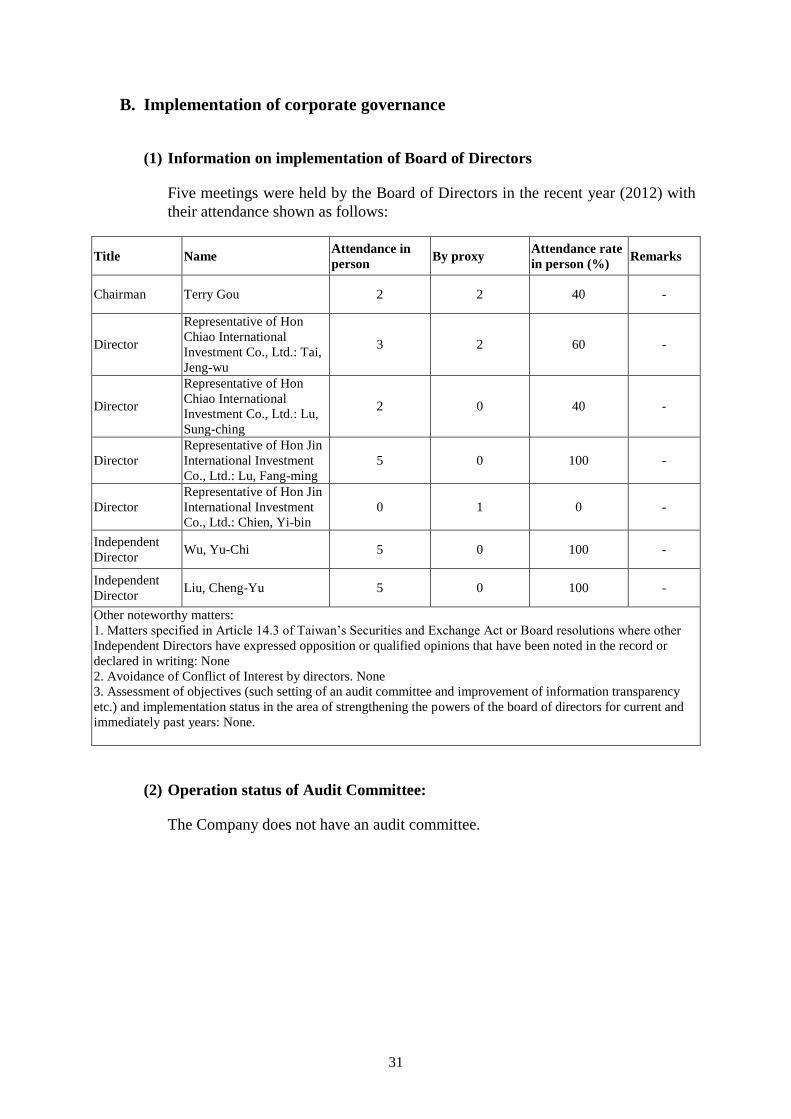
B. Implementation of corporate governance
(1) Information on implementation of Board of Directors
Five meetings were held by the Board of Directors in the recent year (2012) with
their attendance shown as follows:
Title Name Attendance in
person By proxy
Attendance rate
in person (%) Remarks
Chairman Terry Gou 2 2 40 -
Director
Representative of Hon
Chiao International
Investment Co., Ltd.: Tai,
Jeng-wu
3 2 60 -
Director
Representative of Hon
Chiao International
Investment Co., Ltd.: Lu,
Sung-ching
2 0 40 -
Director
Representative of Hon Jin
International Investment
Co., Ltd.: Lu, Fang-ming
5 0 100 -
Director
Representative of Hon Jin
International Investment
Co., Ltd.: Chien, Yi-bin
0 1 0 -
Independent
Director Wu, Yu-Chi 5 0 100 -
Independent
Director Liu, Cheng-Yu 5 0 100 -
Other noteworthy matters:
1. Matters specified in Article 14.3 of Taiwan’s Securities and Exchange Act or Board resolutions where other
Independent Directors have expressed opposition or qualified opinions that have been noted in the record or
declared in writing: None
2. Avoidance of Conflict of Interest by directors. None
3. Assessment of objectives (such setting of an audit committee and improvement of information transparency
etc.) and implementation status in the area of strengthening the powers of the board of directors for current and
immediately past years: None.
(2) Operation status of Audit Committee:
The Company does not have an audit committee.
32
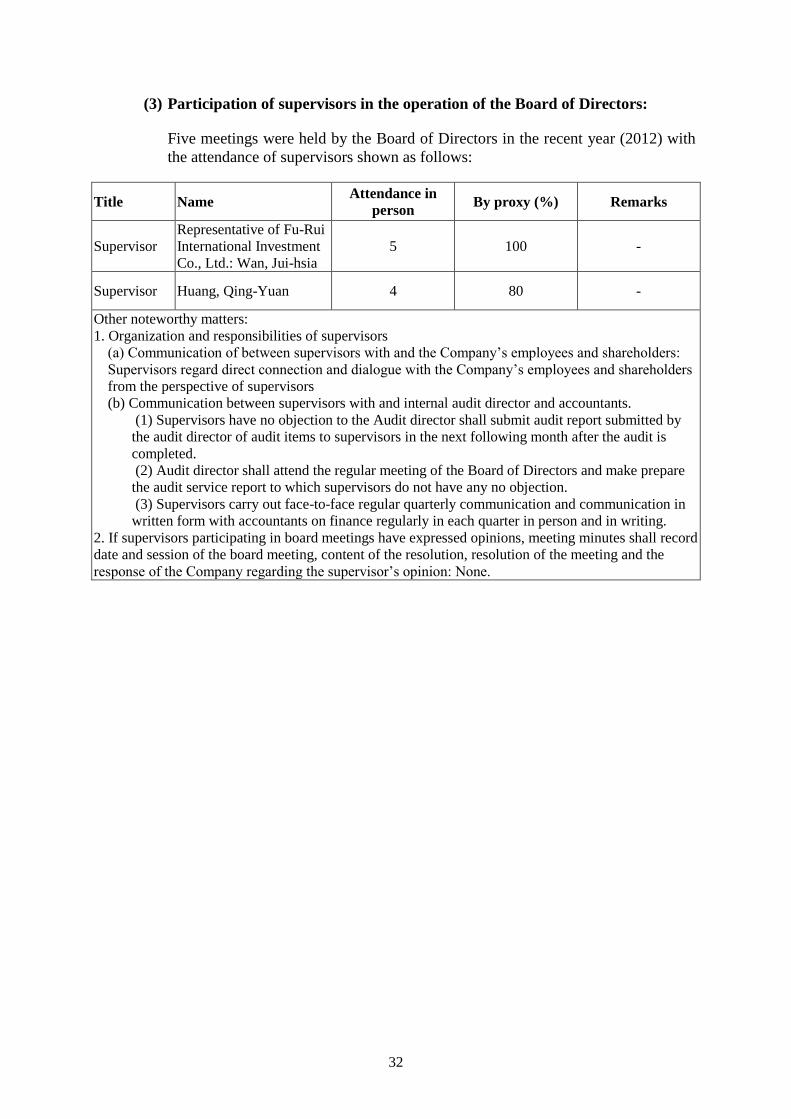
(3) Participation of supervisors in the operation of the Board of Directors:
Five meetings were held by the Board of Directors in the recent year (2012) with
the attendance of supervisors shown as follows:
Title Name Attendance in
person By proxy (%) Remarks
Supervisor
Representative of Fu-Rui
International Investment
Co., Ltd.: Wan, Jui-hsia
5 100 -
Supervisor Huang, Qing-Yuan 4 80 -
Other noteworthy matters:
1. Organization and responsibilities of supervisors
(a) Communication of between supervisors with and the Company’s employees and shareholders:
Supervisors regard direct connection and dialogue with the Company’s employees and shareholders
from the perspective of supervisors
(b) Communication between supervisors with and internal audit director and accountants.
(1) Supervisors have no objection to the Audit director shall submit audit report submitted by
the audit director of audit items to supervisors in the next following month after the audit is
completed.
(2) Audit director shall attend the regular meeting of the Board of Directors and make prepare
the audit service report to which supervisors do not have any no objection.
(3) Supervisors carry out face-to-face regular quarterly communication and communication in
written form with accountants on finance regularly in each quarter in person and in writing.
2. If supervisors participating in board meetings have expressed opinions, meeting minutes shall record
date and session of the board meeting, content of the resolution, resolution of the meeting and the
response of the Company regarding the supervisor’s opinion: None.
33
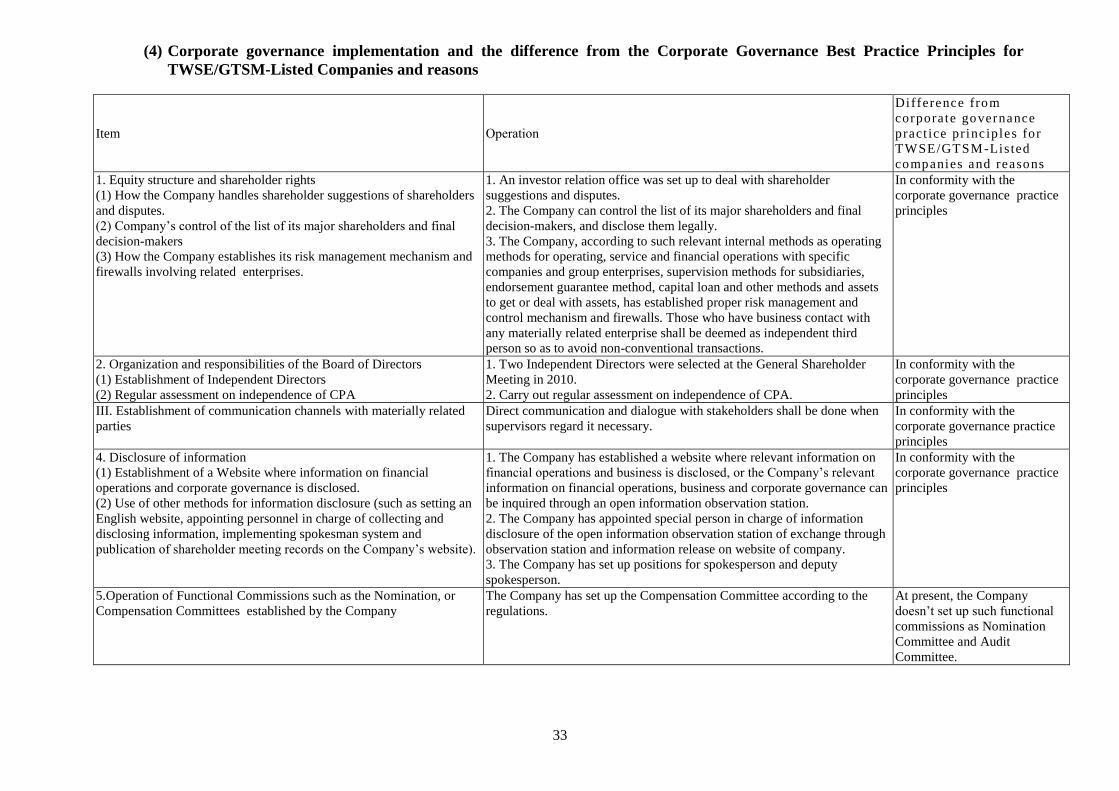
(4) Corporate governance implementation and the difference from the Corporate Governance Best Practice Principles for
TWSE/GTSM-Listed Companies and reasons
Item Operation
Difference from
corporate governance
pract ice pr inc iples for
TWSE/GTSM-Lis ted
companies and reasons
1. Equity structure and shareholder rights
(1) How the Company handles shareholder suggestions of shareholders
and disputes.
(2) Company’s control of the list of its major shareholders and final
decision-makers
(3) How the Company establishes its risk management mechanism and
firewalls involving related enterprises.
1. An investor relation office was set up to deal with shareholder
suggestions and disputes.
2. The Company can control the list of its major shareholders and final
decision-makers, and disclose them legally.
3. The Company, according to such relevant internal methods as operating
methods for operating, service and financial operations with specific
companies and group enterprises, supervision methods for subsidiaries,
endorsement guarantee method, capital loan and other methods and assets
to get or deal with assets, has established proper risk management and
control mechanism and firewalls. Those who have business contact with
any materially related enterprise shall be deemed as independent third
person so as to avoid non-conventional transactions.
In conformity with the
corporate governance practice
principles
2. Organization and responsibilities of the Board of Directors
(1) Establishment of Independent Directors
(2) Regular assessment on independence of CPA
1. Two Independent Directors were selected at the General Shareholder
Meeting in 2010.
2. Carry out regular assessment on independence of CPA.
In conformity with the
corporate governance practice
principles
III. Establishment of communication channels with materially related
parties
Direct communication and dialogue with stakeholders shall be done when
supervisors regard it necessary.
In conformity with the
corporate governance practice
principles
4. Disclosure of information
(1) Establishment of a Website where information on financial
operations and corporate governance is disclosed.
(2) Use of other methods for information disclosure (such as setting an
English website, appointing personnel in charge of collecting and
disclosing information, implementing spokesman system and
publication of shareholder meeting records on the Company’s website).
1. The Company has established a website where relevant information on
financial operations and business is disclosed, or the Company’s relevant
information on financial operations, business and corporate governance can
be inquired through an open information observation station.
2. The Company has appointed special person in charge of information
disclosure of the open information observation station of exchange through
observation station and information release on website of company.
3. The Company has set up positions for spokesperson and deputy
spokesperson.
In conformity with the
corporate governance practice
principles
5.Operation of Functional Commissions such as the Nomination, or
Compensation Committees established by the Company
The Company has set up the Compensation Committee according to the
regulations.
At present, the Company
doesn’t set up such functional
commissions as Nomination
Committee and Audit
Committee.
34
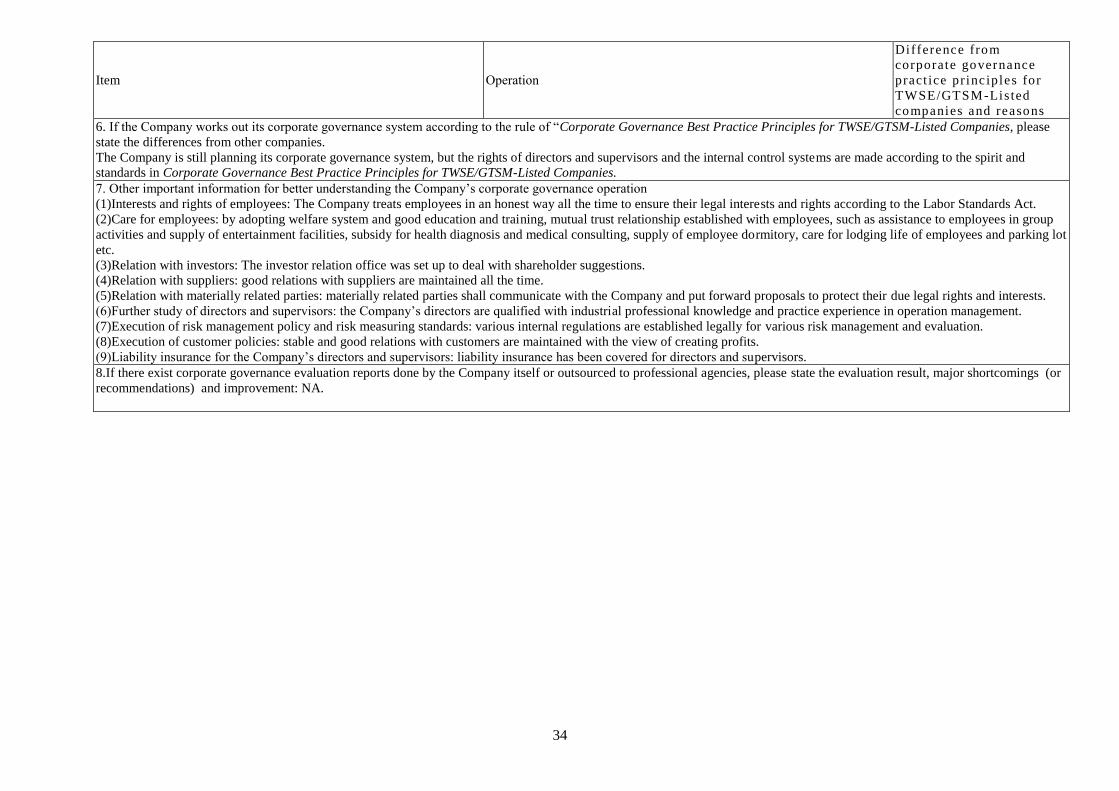
Item Operation
Difference from
corporate governance
pract ice pr inc iples for
TWSE/GTSM-Lis ted
companies and reasons
6. If the Company works out its corporate governance system according to the rule of “Corporate Governance Best Practice Principles for TWSE/GTSM-Listed Companies, please
state the differences from other companies.
The Company is still planning its corporate governance system, but the rights of directors and supervisors and the internal control systems are made according to the spirit and
standards in Corporate Governance Best Practice Principles for TWSE/GTSM-Listed Companies.
7. Other important information for better understanding the Company’s corporate governance operation
(1)Interests and rights of employees: The Company treats employees in an honest way all the time to ensure their legal interests and rights according to the Labor Standards Act.
(2)Care for employees: by adopting welfare system and good education and training, mutual trust relationship established with employees, such as assistance to employees in group
activities and supply of entertainment facilities, subsidy for health diagnosis and medical consulting, supply of employee dormitory, care for lodging life of employees and parking lot
etc.
(3)Relation with investors: The investor relation office was set up to deal with shareholder suggestions.
(4)Relation with suppliers: good relations with suppliers are maintained all the time.
(5)Relation with materially related parties: materially related parties shall communicate with the Company and put forward proposals to protect their due legal rights and interests.
(6)Further study of directors and supervisors: the Company’s directors are qualified with industrial professional knowledge and practice experience in operation management.
(7)Execution of risk management policy and risk measuring standards: various internal regulations are established legally for various risk management and evaluation.
(8)Execution of customer policies: stable and good relations with customers are maintained with the view of creating profits.
(9)Liability insurance for the Company’s directors and supervisors: liability insurance has been covered for directors and supervisors.
8.If there exist corporate governance evaluation reports done by the Company itself or outsourced to professional agencies, please state the evaluation result, major shortcomings (or
recommendations) and improvement: NA.
35
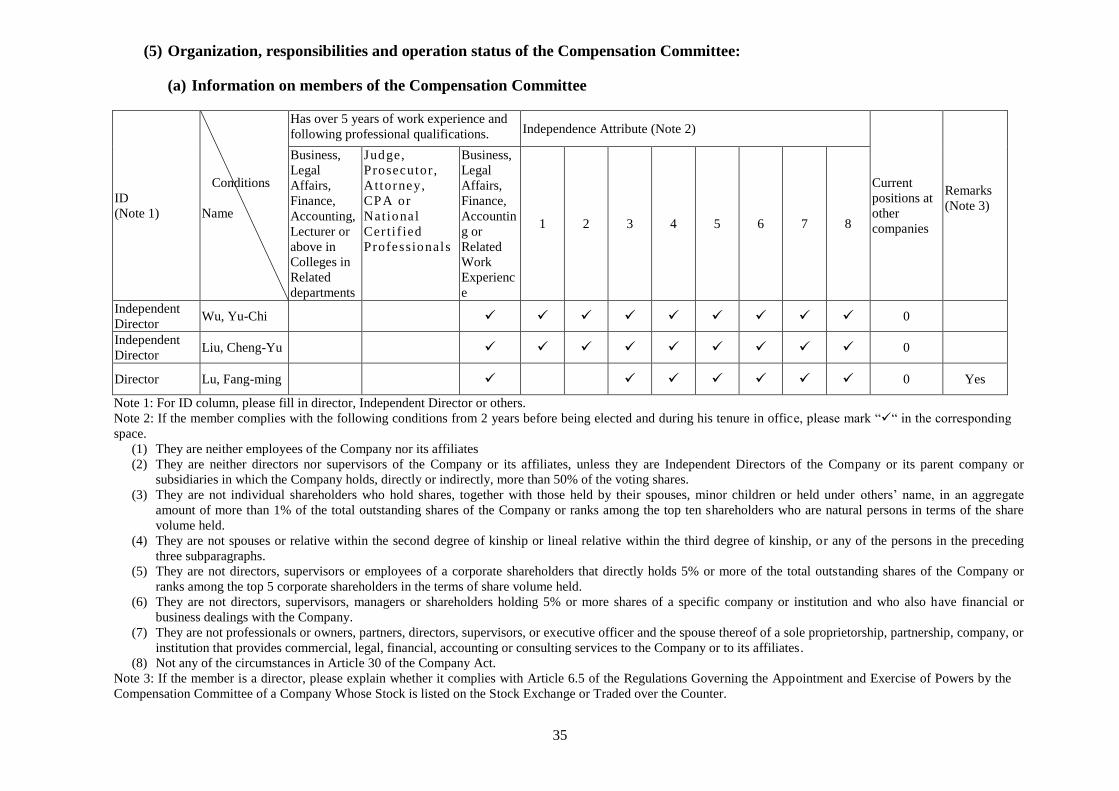
(5) Organization, responsibilities and operation status of the Compensation Committee:
(a) Information on members of the Compensation Committee
ID
(Note 1)
Conditions
Name
Has over 5 years of work experience and
following professional qualifications. Independence Attribute (Note 2)
Current
positions at
other
companies
Remarks
(Note 3)
Business,
Legal
Affairs,
Finance,
Accounting,
Lecturer or
above in
Colleges in
Related
departments
Judge,
Prosecutor ,
Attorney,
CPA or
Nat ional
Cer t i f ied
Professionals
Business,
Legal
Affairs,
Finance,
Accountin
g or
Related
Work
Experienc
e
1 2 3 4 5 6 7 8
Independent
Director Wu, Yu-Chi
0
Independent
Director Liu, Cheng-Yu
0
Director Lu, Fang-ming
0 Yes
Note 1: For ID column, please fill in director, Independent Director or others.
Note 2: If the member complies with the following conditions from 2 years before being elected and during his tenure in office, please mark ““ in the corresponding
space.
(1) They are neither employees of the Company nor its affiliates
(2) They are neither directors nor supervisors of the Company or its affiliates, unless they are Independent Directors of the Company or its parent company or
subsidiaries in which the Company holds, directly or indirectly, more than 50% of the voting shares.
(3) They are not individual shareholders who hold shares, together with those held by their spouses, minor children or held under others’ name, in an aggregate
amount of more than 1% of the total outstanding shares of the Company or ranks among the top ten shareholders who are natural persons in terms of the share
volume held.
(4) They are not spouses or relative within the second degree of kinship or lineal relative within the third degree of kinship, or any of the persons in the preceding
three subparagraphs.
(5) They are not directors, supervisors or employees of a corporate shareholders that directly holds 5% or more of the total outstanding shares of the Company or
ranks among the top 5 corporate shareholders in the terms of share volume held.
(6) They are not directors, supervisors, managers or shareholders holding 5% or more shares of a specific company or institution and who also have financial or
business dealings with the Company.
(7) They are not professionals or owners, partners, directors, supervisors, or executive officer and the spouse thereof of a sole proprietorship, partnership, company, or
institution that provides commercial, legal, financial, accounting or consulting services to the Company or to its affiliates.
(8) Not any of the circumstances in Article 30 of the Company Act.
Note 3: If the member is a director, please explain whether it complies with Article 6.5 of the Regulations Governing the Appointment and Exercise of Powers by the
Compensation Committee of a Company Whose Stock is listed on the Stock Exchange or Traded over the Counter.
36
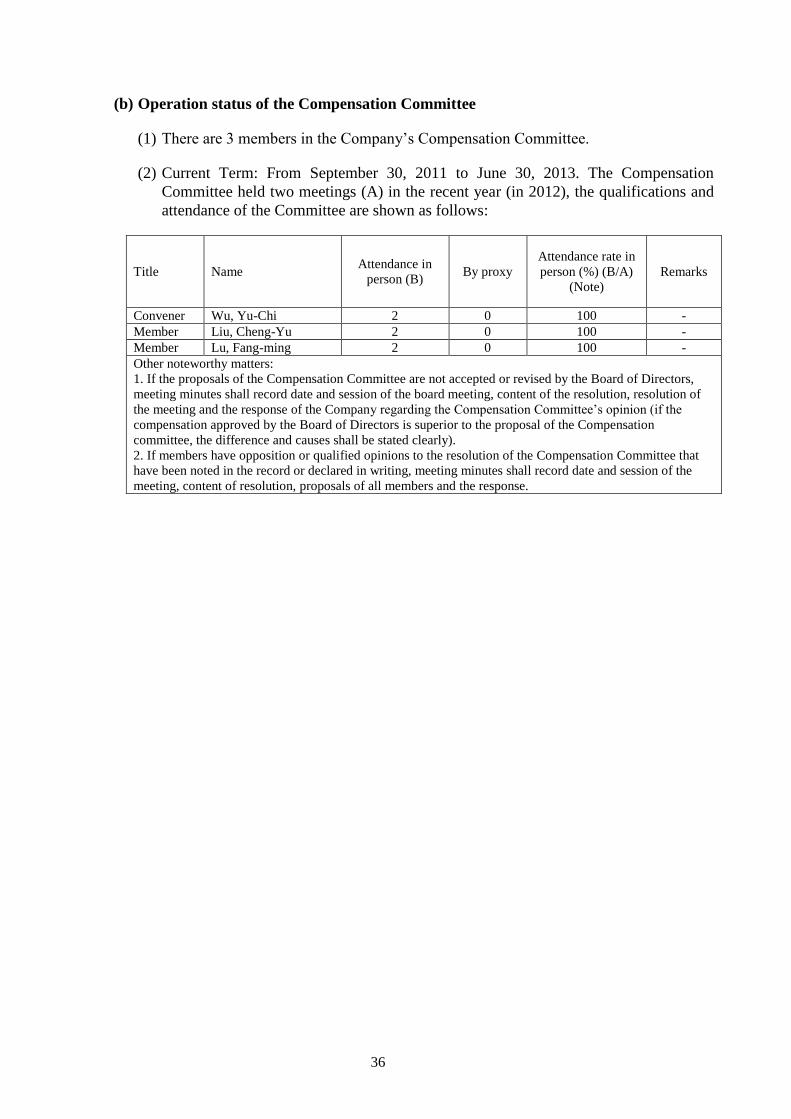
(b) Operation status of the Compensation Committee
(1) There are 3 members in the Company’s Compensation Committee.
(2) Current Term: From September 30, 2011 to June 30, 2013. The Compensation
Committee held two meetings (A) in the recent year (in 2012), the qualifications and
attendance of the Committee are shown as follows:
Title Name Attendance in
person (B) By proxy
Attendance rate in
person (%) (B/A)
(Note)
Remarks
Convener Wu, Yu-Chi 2 0 100 -
Member Liu, Cheng-Yu 2 0 100 -
Member Lu, Fang-ming 2 0 100 -
Other noteworthy matters:
1. If the proposals of the Compensation Committee are not accepted or revised by the Board of Directors,
meeting minutes shall record date and session of the board meeting, content of the resolution, resolution of
the meeting and the response of the Company regarding the Compensation Committee’s opinion (if the
compensation approved by the Board of Directors is superior to the proposal of the Compensation
committee, the difference and causes shall be stated clearly).
2. If members have opposition or qualified opinions to the resolution of the Compensation Committee that
have been noted in the record or declared in writing, meeting minutes shall record date and session of the
meeting, content of resolution, proposals of all members and the response.
37
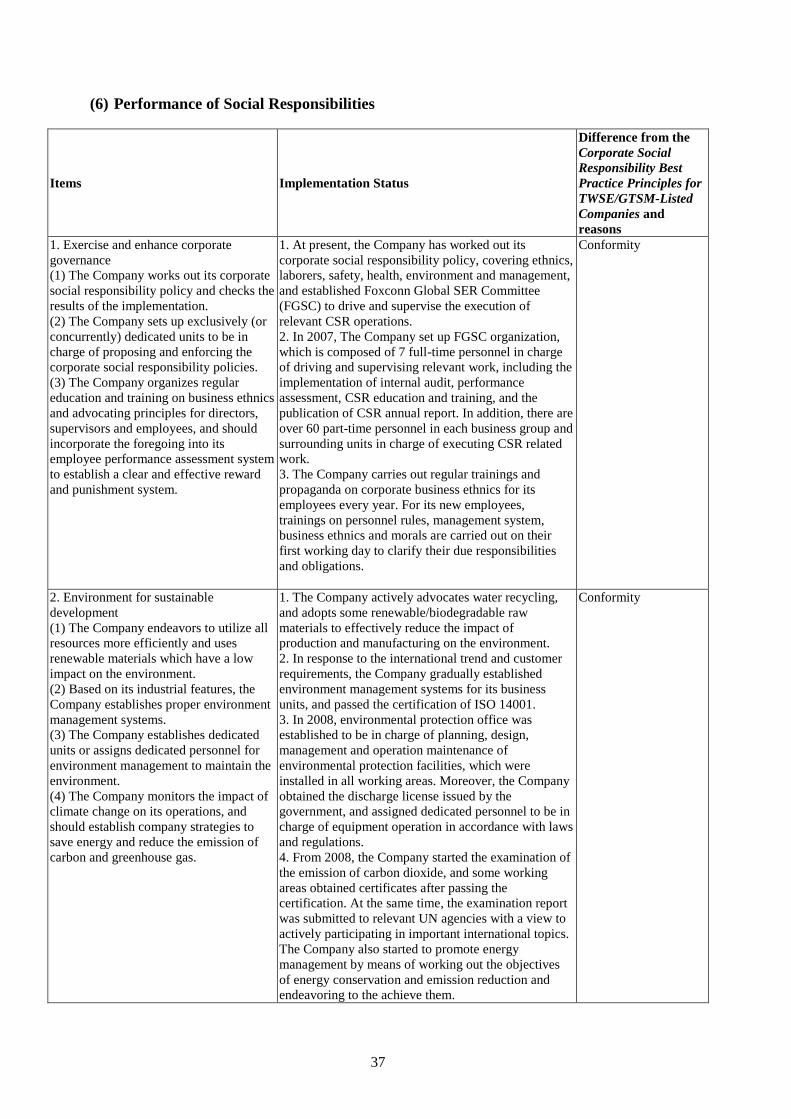
(6) Performance of Social Responsibilities
Items Implementation Status
Difference from the
Corporate Social
Responsibility Best
Practice Principles for
TWSE/GTSM-Listed
Companies and
reasons
1. Exercise and enhance corporate
governance
(1) The Company works out its corporate
social responsibility policy and checks the
results of the implementation.
(2) The Company sets up exclusively (or
concurrently) dedicated units to be in
charge of proposing and enforcing the
corporate social responsibility policies.
(3) The Company organizes regular
education and training on business ethnics
and advocating principles for directors,
supervisors and employees, and should
incorporate the foregoing into its
employee performance assessment system
to establish a clear and effective reward
and punishment system.
1. At present, the Company has worked out its
corporate social responsibility policy, covering ethnics,
laborers, safety, health, environment and management,
and established Foxconn Global SER Committee
(FGSC) to drive and supervise the execution of
relevant CSR operations.
2. In 2007, The Company set up FGSC organization,
which is composed of 7 full-time personnel in charge
of driving and supervising relevant work, including the
implementation of internal audit, performance
assessment, CSR education and training, and the
publication of CSR annual report. In addition, there are
over 60 part-time personnel in each business group and
surrounding units in charge of executing CSR related
work.
3. The Company carries out regular trainings and
propaganda on corporate business ethnics for its
employees every year. For its new employees,
trainings on personnel rules, management system,
business ethnics and morals are carried out on their
first working day to clarify their due responsibilities
and obligations.
Conformity
2. Environment for sustainable
development
(1) The Company endeavors to utilize all
resources more efficiently and uses
renewable materials which have a low
impact on the environment.
(2) Based on its industrial features, the
Company establishes proper environment
management systems.
(3) The Company establishes dedicated
units or assigns dedicated personnel for
environment management to maintain the
environment.
(4) The Company monitors the impact of
climate change on its operations, and
should establish company strategies to
save energy and reduce the emission of
carbon and greenhouse gas.
1. The Company actively advocates water recycling,
and adopts some renewable/biodegradable raw
materials to effectively reduce the impact of
production and manufacturing on the environment.
2. In response to the international trend and customer
requirements, the Company gradually established
environment management systems for its business
units, and passed the certification of ISO 14001.
3. In 2008, environmental protection office was
established to be in charge of planning, design,
management and operation maintenance of
environmental protection facilities, which were
installed in all working areas. Moreover, the Company
obtained the discharge license issued by the
government, and assigned dedicated personnel to be in
charge of equipment operation in accordance with laws
and regulations.
4. From 2008, the Company started the examination of
the emission of carbon dioxide, and some working
areas obtained certificates after passing the
certification. At the same time, the examination report
was submitted to relevant UN agencies with a view to
actively participating in important international topics.
The Company also started to promote energy
management by means of working out the objectives
of energy conservation and emission reduction and
endeavoring to the achieve them.
Conformity
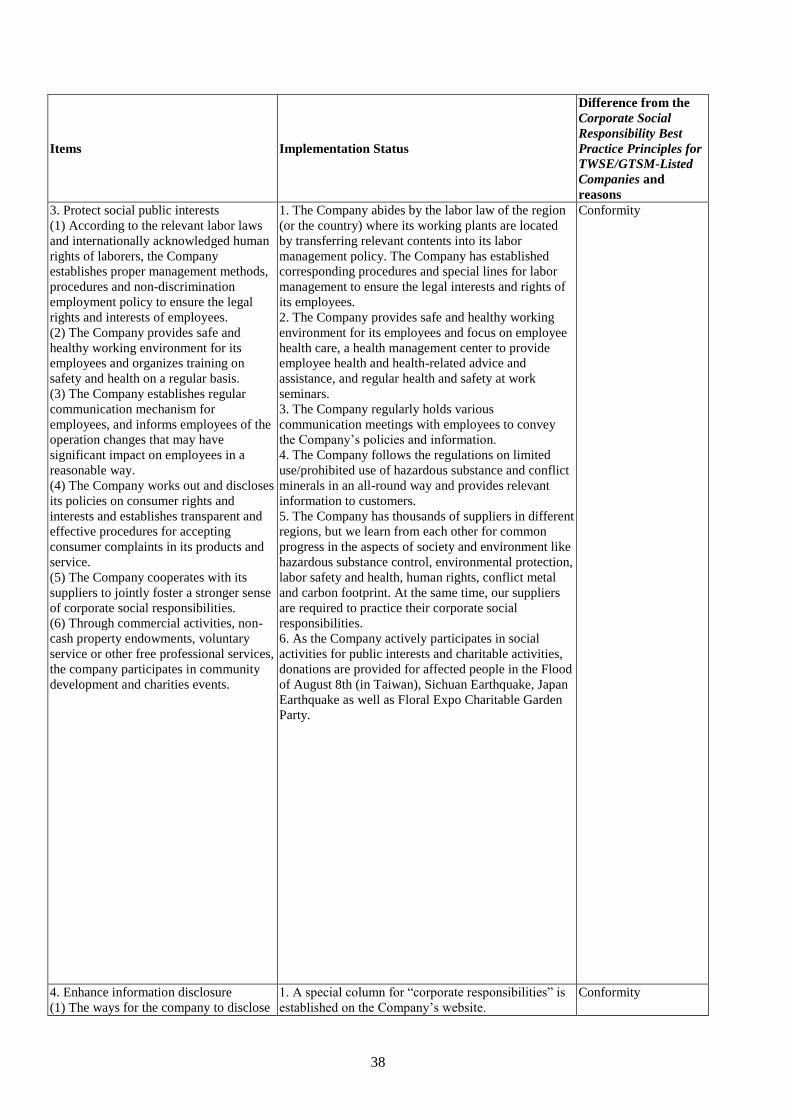
38
Items Implementation Status
Difference from the
Corporate Social
Responsibility Best
Practice Principles for
TWSE/GTSM-Listed
Companies and
reasons
3. Protect social public interests
(1) According to the relevant labor laws
and internationally acknowledged human
rights of laborers, the Company
establishes proper management methods,
procedures and non-discrimination
employment policy to ensure the legal
rights and interests of employees.
(2) The Company provides safe and
healthy working environment for its
employees and organizes training on
safety and health on a regular basis.
(3) The Company establishes regular
communication mechanism for
employees, and informs employees of the
operation changes that may have
significant impact on employees in a
reasonable way.
(4) The Company works out and discloses
its policies on consumer rights and
interests and establishes transparent and
effective procedures for accepting
consumer complaints in its products and
service.
(5) The Company cooperates with its
suppliers to jointly foster a stronger sense
of corporate social responsibilities.
(6) Through commercial activities, non-
cash property endowments, voluntary
service or other free professional services,
the company participates in community
development and charities events.
1. The Company abides by the labor law of the region
(or the country) where its working plants are located
by transferring relevant contents into its labor
management policy. The Company has established
corresponding procedures and special lines for labor
management to ensure the legal interests and rights of
its employees.
2. The Company provides safe and healthy working
environment for its employees and focus on employee
health care, a health management center to provide
employee health and health-related advice and
assistance, and regular health and safety at work
seminars.
3. The Company regularly holds various
communication meetings with employees to convey
the Company’s policies and information.
4. The Company follows the regulations on limited
use/prohibited use of hazardous substance and conflict
minerals in an all-round way and provides relevant
information to customers.
5. The Company has thousands of suppliers in different
regions, but we learn from each other for common
progress in the aspects of society and environment like
hazardous substance control, environmental protection,
labor safety and health, human rights, conflict metal
and carbon footprint. At the same time, our suppliers
are required to practice their corporate social
responsibilities.
6. As the Company actively participates in social
activities for public interests and charitable activities,
donations are provided for affected people in the Flood
of August 8th (in Taiwan), Sichuan Earthquake, Japan
Earthquake as well as Floral Expo Charitable Garden
Party.
Conformity
4. Enhance information disclosure
(1) The ways for the company to disclose
1. A special column for “corporate responsibilities” is
established on the Company’s website.
Conformity
39
Items Implementation Status
Difference from the
Corporate Social
Responsibility Best
Practice Principles for
TWSE/GTSM-Listed
Companies and
reasons
relevant critical and reliable information
on corporate social responsibilities.
(2) The Company compiles with the
report on corporate social responsibilities
to disclose the performance of corporate
social responsibilities.
2. As a EICC member, the Company is dedicated to
promoting social and environmental responsibilities
(hereinafter referred to as SER), and worked out
“Foxconn Global Codes of Conducts: Social and
Environmental Responsibilities”.
5. If the Company makes its own corporate social responsibilities according to the rule of Corporate Social Responsibility
Best Practice Principles for TWSE/GTSM-Listed Companies, please state the differences.
The Company carries out regular trainings and propaganda on corporate business ethnics for its employees every year. For
its new employees, trainings on personnel rules, management system, business ethnics and morals are carried out on their
first working day to clarify their due rights and obligations. However, the Company hasn’t prepared its own Corporate
Social Responsibility Best Practice Principles for TWSE/GTSM-Listed Companies, which will be worked out in the future
according to the specific regulations.
6. Other important information for better understanding of corporate social responsibilities (such as systems and measures
that the company has adopted with respect to environmental protection, community participation, social contributions,
social services, social and public interest, legal rights and interests of consumers, human rights, safety, health and other
corporate social responsibilities, and the status of implementation.):
(1) New processing systems are introduced to enhance the capacity to recover wastes and sewage, and installed and put
into operation in some workshop areas.
(2) Donated NT $ 825,000 to Law Foundation, NTU.
(3) Donated NT$980,000 to Qingling Foundation, NTU for NTU 3D IC packaging and versatile & Flexible organic
display device.
(4) Contributed NT$300,000 to Hakka Cultural and Economic Exchanges Association ‘Summit Forum’.
(5) Donated NT $ 200,000 to China Poly Industries Promote Common Standard Foundation.
(6) Donated NT $ 5,465,301 to National Tsing Hua University scholarships.
(7) Donated NT$9,432,500 to Graduate School Scholarship, National Kaohsiung Applied Sciences University.
(8) Contributed NT$500,000 to National Science Museum for Edison Learning Activity Funds.
(9) The Company has hosted lots of charity party to support disadvantaged people and social charitable organizations.
(10) Based on respect employees, the Company emphasizes employment of no children and no compulsory overtime work,
and cadres are required to pay no discrimination or harass employees. Above measures are announced formally.
(11) The Company established a safety and health department to regularly examine plant facilities and provide education
and training on industrial safety and health and relevant performance assessment.
(12) The Company set up a supplier management office for auditing the corporate social responsibilities and training of its
suppliers every year.
7. Clear statement shall be made if the products or corporate social responsibility report of the Company pass the
inspection of relevant certification agencies:
The Company hasn’t submitted its annual report on corporate social responsibilities to any certification organization for
inspection, but plans to submit it to a third-party certification institution for inspection in the near future.
40
(7) Status of Implementation of Integrity Management
Implementation of Integrity Operation
Items Implementation
Difference from the Integrity
Operation Practice Principles for
TWSE/GTSM-Listed Companies
and reasons
1. Adopt integrity operation policy and
scheme
(1) The company clarifies the integrity
operation policy in its regulations and
external documents and the commitment of
board of directors and managers to active
implementation.
(2) The company works out scheme,
operation procedures and guidelines of
conducts for employee education and
training to prevent dishonest behaviors
(3) When working out a scheme to prevent
dishonest behaviors, the company adopts
measures to prevent bribery and illegal
political contributions in business activities
with high risks of dishonest behaviors.
The Company sticks to the corporate
culture with integrity operation as the
core and works out codes of conduct
(CoC) for stakeholders to perform
relevant social and environmental
responsibilities, including Letter of
Commitment of Manufacturers signed
with suppliers, clearly stating that
suppliers should ensure transparent and
fair commercial trading activities. In
addition, the Company has made
commitment to customers and
shareholders in its CoC.
The Company carries out education and
training for all employees on CoC every
year regularly. For its new employees,
trainings on personnel regulations,
management system, business ethnics
and morals are provided to clearly state
their due rights and obligations.
The Company, strictly sticking to
business ethnics from its top level to
down level, establishes integrity
corporate culture and creates an
operation environment for sustainable
development based on transparent,
incorruptible and responsible operation
concepts.
Conformity
2. Put integrity operation into practice
(1) The company should keep its
commercial activities away from people
with records of dishonest behaviors, and
articles on honest behaviors shall be
explicitly stated in commercial contracts.
(2) The company sets up company sets up
exclusively (or concurrently) dedicated
units to be in charge of corporate integrity
operation and supervision of the board of
directors.
(3) The company works out policies to
prevent interest conflicts and provide
proper statement channels.
(4) The company shall establish effective
accounting system, internal control system
and auditing of internal auditors to put
integrity operation into practice.
The Company adheres to integrity
culture and operation, commits to
abiding by requirements of international
and domestic laws and regulations on
anti-corruption and anti-bribery, takes
zero-tolerance policy for any behavior or
activity against the regulations, and
strictly prohibits any corruption, bribery,
embezzlement and other illegal earning
activities. All employees shall receive
anti-corruption trainings for at least 2
hours every year. In addition, the
Company asks its downstream suppliers,
manufacturers and customers to strictly
implement high-standard anti-corruption
policies as the premise for cooperation.
After approved by the chairman of the
Global SER Committee and the general
managers of the business group, the
codes of conducts on corporate social
and environmental responsibilities have
become the basic principles and
standards of the Company to deal with
Conformity
41
Items Implementation
Difference from the Integrity
Operation Practice Principles for
TWSE/GTSM-Listed Companies
and reasons
relationship with all stakeholders
(employees, customers, shareholders,
suppliers, public community, investors
and non-governmental organizations).
The whole management team of the
Company must strictly abide by the
principles of conducts and the stated
spirit and guiding principle. Under the
supervision of board of directors,
directors of each business group must
ensure their commercial operations in
conformity with the regulations of CoC.
The Company demands all new
employees to sign the Agreement on
Integrity, Incorruption and
Confidentiality of Intellectual Property
Rights and asks other employees to
abide by it. At the same time, the
Company also requires that its suppliers
or other cooperators should sign the
Letter of Commitment of Manufacturers
to ensure transparent and fair
commercial trading activities. The
Company holds annual supplier
meetings and carries out irregular SER
audit, conveying its requirements for
suppliers.
The Company establishes accounting
and internal control systems to put
integrity operation into practice. After
its internal auditors work out and review
the annual audit program according to
the risk evaluation results, the Company
will compile them into audit report and
submit it to the board of directors.
3. The company establishes reporting
channels and punishments for violation
against the regulations of integrity
operation as well as the appeal system.
The Company establishes various
reporting channels so that employees
and relevant people can report the
improper business behaviors through the
system. Anyone who violates the
regulations on integrity operation will be
punished according to the Company’s
regulations on reward and punishment.
In case of any illegal affairs, legal
actions will be taken as well.
Conformity
4. Enhance information disclosure
(1) The company establishes a website to
disclose relevant information on integrity
operation.
(2) Other information disclosure methods
of the company (such as setting up an
English website, appointing a dedicated
person in charge of collecting and
disclosing company information through
the website etc.).
On the Company’s official website both
in Chinese and English
(http://www.foxconn.com), there are
relevant information on integrity
operation such as annual report on
corporate social and environmental
responsibilities and CoC.
Conformity
42
Items Implementation
Difference from the Integrity
Operation Practice Principles for
TWSE/GTSM-Listed Companies
and reasons
5. If the company makes its own integrity operation according to the Integrity Operation Best Practice Principles for
TWSE/GTSM-Listed Companies, please state the differences.
The Company has its own regulations on integrity and incorruption, which shall be respected by all employees, managers
and board of directors.
6. Other important information for better understanding of the integrity operation (such as the company’s determination on
advocating the integrity operation and policy among manufacturers who have business dealings with the company, inviting
them to participate in relevant trainings and review and revise the regulations on integrity operation).
Please refer to the Company’s official website: http://www.foxconn.com/CSR_REPORT.html (Annual Report on
Corporate Social and Environmental Responsibilities).
(8) Other Company-established corporate governance rules and regulations:
N/A
(9) Other Important Corporate Governance Information:
None
43
(10) Status of Implementation of Internal Control System
(a) Statement of internal control system
Hon Hai Precision Industry Co., Ltd.
Statement of Internal Controls
Date: 03/25/2013
According to the examination on internal control system done by the Company itself in 2012, we
hereby states as follows:
(1) The Company’s board of directors and management team understand their responsibilities of
developing, implementing and maintaining the Company’s internal control system, and such a
system has been established. The purpose of establishing the internal control system is to
reasonably assure the following objectives: (a) The effectiveness and efficiency of business
operation (including earnings ,operation performance and the safeguard of company assets); (b)
The reliability of the financial and related reports; and (c) The compliance of the relevant
laws/regulations and company policies;
(2) Due to the innate limitation in designing a faultless internal control system, this system can
only assure the reasonableness of the above three objectives have been fairly achieved. In
addition, the effectiveness of internal control system could alter over time due to the change of
business environment or situation. Since the Company’s internal control system has included
self-examination capability, the Company will make immediate corrections when errors are
detected.
(3) The evaluation of effectiveness of the internal control system design and implementation is
made in accordance with the “Guidelines for the Establishment of Internal Control Systems by
Public Companies” (the Guidelines). The Guidelines are made to examine the following five
factors during the management and control process: (1) control environment, (2) risk assessment
and response, (3) control activities, (4) information and communication, and (5) supervision.
Each factor also includes several items. Details of each factor can be found in the Guidelines.
(4) The Company has examined the effectiveness of each respected area in the internal control
system based on the Guidelines.
(5) The examination result indicated that the Company’s internal control system (including
subsidiary governance) dated December 31, 2012has effectively assured that the following
objectives have been reasonably achieved during the assessing period: (a) The degree that
effectiveness and efficiency of business operation; (b) The reliability of the financial and related
reports; (c) The compliance of the relevant laws/regulations and company policies
(6) This Statement is a significant part of the Company’s annual report and prospectus available
to the general public. If it contains false information or omits any material content, the Company
is in violation of Article 20, Article 32, Article 171 and Article 174 set forth in the Taiwan’s
Security and Exchange Act.
44
(7) The Company hereby declares that this statement had been approved by the Board of
Directors on 03/25/2013. Among the 6 attending Directors, no one raised any objection to the
contents of this statement.
Hon Hai Precision Industry Co., Ltd.
Chairman: Gou, Tai-ming [signature and seal]
President: Gou, Tai-ming [signature and seal]
45
(b) The Company is required by the Security and Futures Commission to hire an
accountant to audit the Company’s internal control system and disclose the audit
report made by accountants:
None
(11) Lawful punishment inflicted on the Company, and/or disciplinary action taken by
the Company against its employees for violating internal regulations in the latest year
and up to the printing date of this Annual Report); important errors committed; and
correction and improvement procedures:
None
(12) Important resolutions made by the Shareholders’ Meeting and Board of Directors
by the end of 2012 and the printing date of the annual report
(a) The resolutions approved by the entire attending shareholders at the General
Meeting of Shareholders on June 18, 2012 and its implementation
(1) Resolutions:
The Company convened the General Meeting of Shareholders on June 18, 2012, and
passed (a) 2011 business operation report and 2011 audited financial statements; (b)
distribution of 2011 profits; (c) issuance of new common shares for capital increase by
retained earnings; (d) Amendment to “Procedures for Acquisition or Disposal of Assets”;
(e) Amendment to “Regulations Governing the Election of Directors and Supervisors”; (f)
Amendment to “Shareholders' Meeting Rules”; (g) amended the Articles of Incorporation.
(2) Implementation:
A. Profit distribution and issuance of new shares for capital increase by retained
earnings: the new shares for capital increase by retained earnings was listed and
traded on October 2, 2012; and the cash dividend was distributed on September 12,
2012.
B. For the issuance of new common shares for cash by capital increase and proposed
issuance of Global Depositary Receipts (“GDRs”): There is no such condition.
(b) Important resolutions of the Board of Directors from 2012 to April 30, 2013
(1) March 27, 2012
The Company obtained 6.584% shareholding rights of Japanese Sharp Corporation
(hereinafter referred to as Sharp); recognized the financial statement and consolidated
financial statement in 2011; promised to handle the cash capital increase for Chi Mei
Optoelectronics Corp. and issue the common shares for cash by capital increase and
proposed issuance of Global Depositary Receipts (“GDRs”); modified the Procedures of
the Acquisition or Disposal of Assets, election method of Directors and Supervisors and
Articles of Incorporation; convened the general meeting of shareholders in 2012 and
formulated the shareholder proposals; In order to raise medium- and long-term funds, the
Company issued the domestic unsecured common corporate bonds, indirectly invested the
46
GDS Software (Shenzhen)Co., Ltd., increased funds to Hongyang Precision Industry
(Shenzhen) Co., Ltd. and Fujin Precision Industry (Jincheng) Co., Ltd.; indirectly
invested Hongfujin Precision Electronics (Yantai) Co., Ltd.. The Company’s investment
in mainland China, Fuyang Electronic Technology (Changshu) Co., Ltd. merged with
Fulin Electronic Technology (Changshu) Co., Ltd. The Company indirectly invested
Yecheng Photo-electricity (Shenzhen) Co., Ltd., Yecheng Science & Technology
(Chengdu) Co., Ltd. and Xincheng Science & Technology (Chengdu) Co., Ltd. In
addition, it amended the internal control system, passed the proposal for machines and
facilities, and changed the spokesman.
(2) April 28, 2012
The Company drafted the distribution of 2011 profit; proposed the issuance of new shares
for capital increase by retained earnings; amended the articles of incorporation and
meeting norm of the shareholders’ meeting; approved the internal control statement of
2011; issued new shares for employee restricted stocks and employee stock options below
market price; applied the short-term credit line (within 1 year) to financial institution;
signed the contract; provided endorsement guarantee to its overseas subsidiary Foxconn
(Far East) Ltd. for applying the short-term credit line; provided guarantee to its subsidiary
in mainland China, Hongfujin Precision Electronics (Chengdu) Co., Ltd. for borrowing
joint loan; guarantee to its subsidiary, Foxconn (Far East) Ltd. for issuing Japanese Yen
bonds; guarantee to its overseas subsidiary, Best Leap Enterprises Ltd. for borrowing
joint loan; guarantee to subsidiary Competition Team Technologies Ltd. for issuing dollar
bonds. In addition, it indirectly invested Futaihua Precision Electronics (Jiyuan) Co., Ltd.
and Futaijing Precision Electronics (Yantai) Co., Ltd., increased funds for Hongqisheng
Precision Electronics (Qinhuangdao) Co., Ltd. and Fuding Electronic Science &
Technology (Jiashan) Co., Ltd.
(3) July 13, 2012
Set capital increase by retained earnings and proposed IPO allotment, ex-dividend
reference date for 2011 Fiscal Year. Set cash dividend payment date and ex-dividend date
for 2012 Fiscal Year; provided endorsement guarantee to its overseas subsidiary,
Competition Team Technology Limited (hereinafter referred to as CTT) for applying loan
from bank; guarantee to its overseas subsidiary, Competition Team Ireland Limited
(hereinafter referred to as CTIL) for applying the short-term turnover amount from bank;
guarantee to its overseas subsidiary, Hongfujin Precision Electronics (Chengdu) Co., Ltd.
for applying medium and long term loan from bank; figured out the overall financial plan
for the group; established the issuing platform of Medium Term Note (hereinafter referred
to as MTN); issued the bonds priced in foreign currencies with Foxconn (Far East)
Limited (Cayman) and/or Competition Team Technologies Limited (Bahamas) as issuer
and the Company itself guarantor; provided guarantee to its subsidiary, Foxconn (Far
East) Limited (Cayman) (hereinafter referred to as issuer) for issuing dollar (or equivalent
foreign currencies) bonds under MTN program. In addition, it applied the credit line to
financial institutions for the needs of operation turnover, risk management of interest and
exchange rate; signed the contract to indirectly increase funds to Fuxiang Precision
Industry (Kunshan) Co., Ltd., Fuyu Electronic Science & Technology (Huai’an) Co.,
Ltd., Foxconn Electronic Industry Development (Kunshan) Co., Ltd. invested and
established Funeng New Energy Science & Technology Service (Nanyang) Co., Ltd.,
Zhongzhun Precision Industry (Luoyang) Co., Ltd. It also obtained the equity of Innocom
47
Technology (Chongqing) Co., Ltd.; ratify the machines and facilities disposal case; ratify
the granted case of the year-end bonus and performance bonus to managers in 2011;
worked out methods to evaluate performance and calculate rewards for directors,
supervisors and managers.
(4) August 31, 2012
The Company recognized the financial statement and consolidated financial statement of
the first half year of 2012; Ratify the equipment obtain cases of the Company.
(5) October 30, 2012
The Company issued domestic unsecured common corporate bonds to raise medium- and
long-term funds; issued short-term non-guarantee commercial paper to meet the needs of
operation turnover; applied the credit line to financial institutions for the needs of
operation turnover, risk management of interest and exchange rate. The Company signed
the credit contract in which the highest capital limit doesn’t exceed ten billion Japanese
Yen. The Company also increased funds for Sanchuang Digital Co., Ltd., indirectly
invested and established Hongfujin Precision Electronics (Hengyang) Co., Ltd.,
Hongfuyuan (Shenzhen) Environmental Technology Co., Ltd., Oudiyuan (Shenzhen)
Environmental Technology Co., Ltd, Futaihua Precision Electronics (Chengdu) Co., Ltd.,
Jiaxing Ruixia Commerce Co., Ltd., Futaihua Precision Electronics (Jiyuan) Co., Ltd.,
Xincheng Technology (Chengdu) Co., Ltd., Xincheng Photo-electricity (Shenzhen) Co.,
Ltd.; Ratify the machinery equipment obtain cases of the Company; The Company has
formulated the annual audit plan for 2013.
(6) March 25, 2013
Ratify 2012 financial statements of the Company and consolidated financial
statements, propose to conduct a cash capital increase by means of the issuance of
common shares to participate in Global Depositary Receipts (“GDRs”) offerings, propose
to issue new shares for employee Restricted Stock Awards, Loan Procedures, Procedures
for Endorsements & Guarantees, and Articles of Incorporation amendment cases, election
of Directors and Supervisors, to approve the lifting of director of non-competition
restrictions, to set date and subjects for 2013 general shareholders’ meeting of the
Company, to approve Director and Supervisor candidate list , Regulations Governing the
Election of Directors and Supervisors amendment, in response to Act amended, to change
the terms of the Company’s participation in the issue of GDR Depositary Agreement in
1999 which concerning how to vote in the Company’s shareholders’ meeting for the GDR
holders, to endorse overseas subsidiaries, Competition Team Ireland Limited, for
applying short-term bank liquidity, obtain FuNuin New Energy Technology Services
(Nanyang) Co., Ltd. equity case, propose to dispose of the Company’s subsidiaries
reinvested MediaMarket (China) International Retail Holding Limited Case, to approve
2012 Annual Statement of Internal Control of the Company, ratify obtained equipment
case, the annual bonus appropriation case to employees and managers.
(13) Directors or supervisors have expressed opposition or qualified opinions that have
been noted in the record or declared in writing in connection with the important

48
resolutions passed by the Board of Directors in the latest year and up to the printing
date of this Annual Report:
None
(14) During the latest year and up to the printing date this Annual Report), the
Company’s chairman, general manager, accounting director, financial director, internal
auditors, R&D supervisor had been:
None
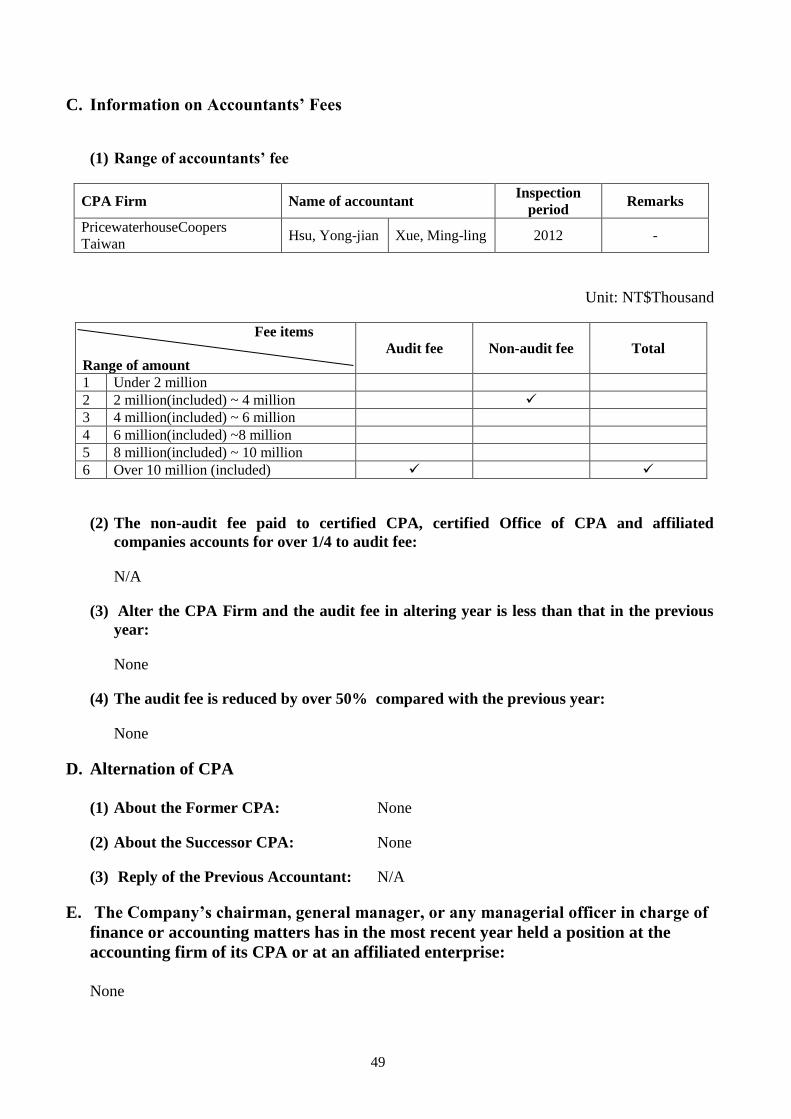
49
C. Information on Accountants’ Fees
(1) Range of accountants’ fee
CPA Firm Name of accountant Inspection
period Remarks
PricewaterhouseCoopers
Taiwan Hsu, Yong-jian Xue, Ming-ling 2012 -
Unit: NT$Thousand
Fee items
Range of amount
Audit fee Non-audit fee Total
1 Under 2 million
2 2 million(included) ~ 4 million
3 4 million(included) ~ 6 million
4 6 million(included) ~8 million
5 8 million(included) ~ 10 million
6 Over 10 million (included)
(2) The non-audit fee paid to certified CPA, certified Office of CPA and affiliated
companies accounts for over 1/4 to audit fee:
N/A
(3) Alter the CPA Firm and the audit fee in altering year is less than that in the previous
year:
None
(4) The audit fee is reduced by over 50% compared with the previous year:
None
D. Alternation of CPA
(1) About the Former CPA: None
(2) About the Successor CPA: None
(3) Reply of the Previous Accountant: N/A
E. The Company’s chairman, general manager, or any managerial officer in charge of
finance or accounting matters has in the most recent year held a position at the
accounting firm of its CPA or at an affiliated enterprise:
None
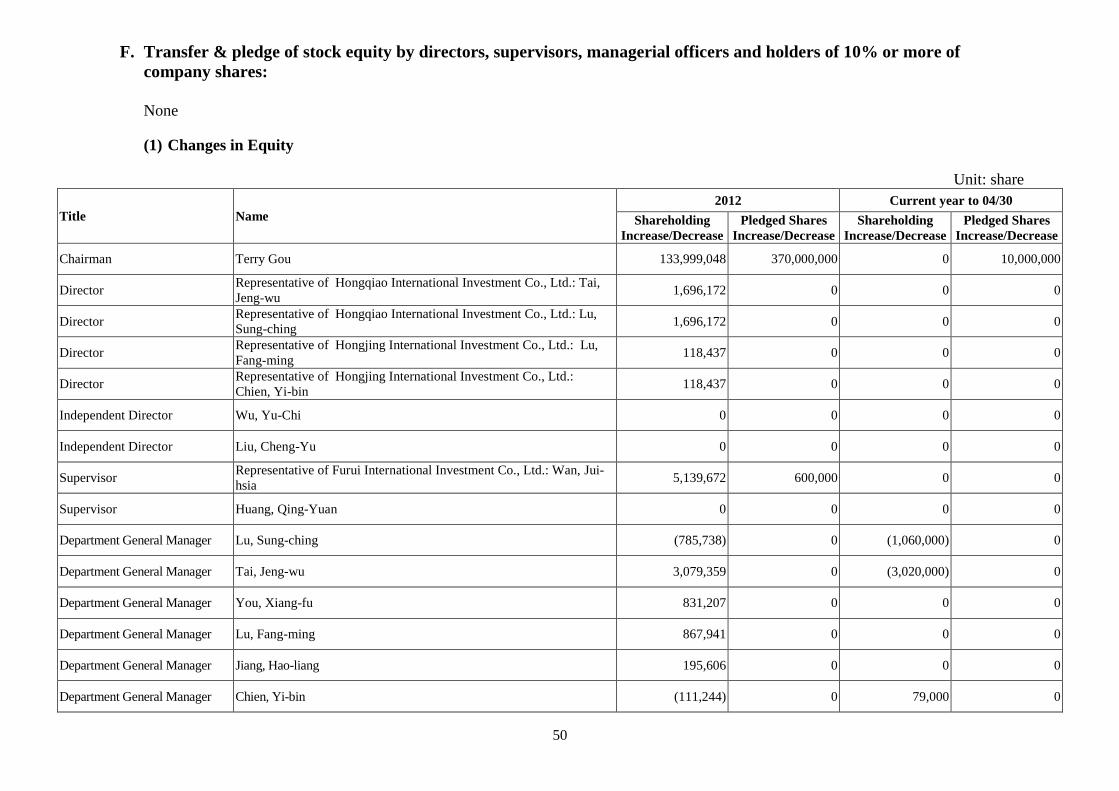
50
F. Transfer & pledge of stock equity by directors, supervisors, managerial officers and holders of 10% or more of
company shares:
None
(1) Changes in Equity
Unit: share
Title Name
2012 Current year to 04/30
Shareholding
Increase/Decrease
Pledged Shares
Increase/Decrease
Shareholding
Increase/Decrease
Pledged Shares
Increase/Decrease
Chairman Terry Gou 133,999,048 370,000,000 0 10,000,000
Director Representative of Hongqiao International Investment Co., Ltd.: Tai,
Jeng-wu 1,696,172 0 0 0
Director Representative of Hongqiao International Investment Co., Ltd.: Lu,
Sung-ching 1,696,172 0 0 0
Director Representative of Hongjing International Investment Co., Ltd.: Lu,
Fang-ming 118,437 0 0 0
Director Representative of Hongjing International Investment Co., Ltd.:
Chien, Yi-bin 118,437 0 0 0
Independent Director Wu, Yu-Chi 0 0 0 0
Independent Director Liu, Cheng-Yu 0 0 0 0
Supervisor Representative of Furui International Investment Co., Ltd.: Wan, Jui-
hsia 5,139,672 600,000 0 0
Supervisor Huang, Qing-Yuan 0 0 0 0
Department General Manager Lu, Sung-ching (785,738) 0 (1,060,000) 0
Department General Manager Tai, Jeng-wu 3,079,359 0 (3,020,000) 0
Department General Manager You, Xiang-fu 831,207 0 0 0
Department General Manager Lu, Fang-ming 867,941 0 0 0
Department General Manager Jiang, Hao-liang 195,606 0 0 0
Department General Manager Chien, Yi-bin (111,244) 0 79,000 0
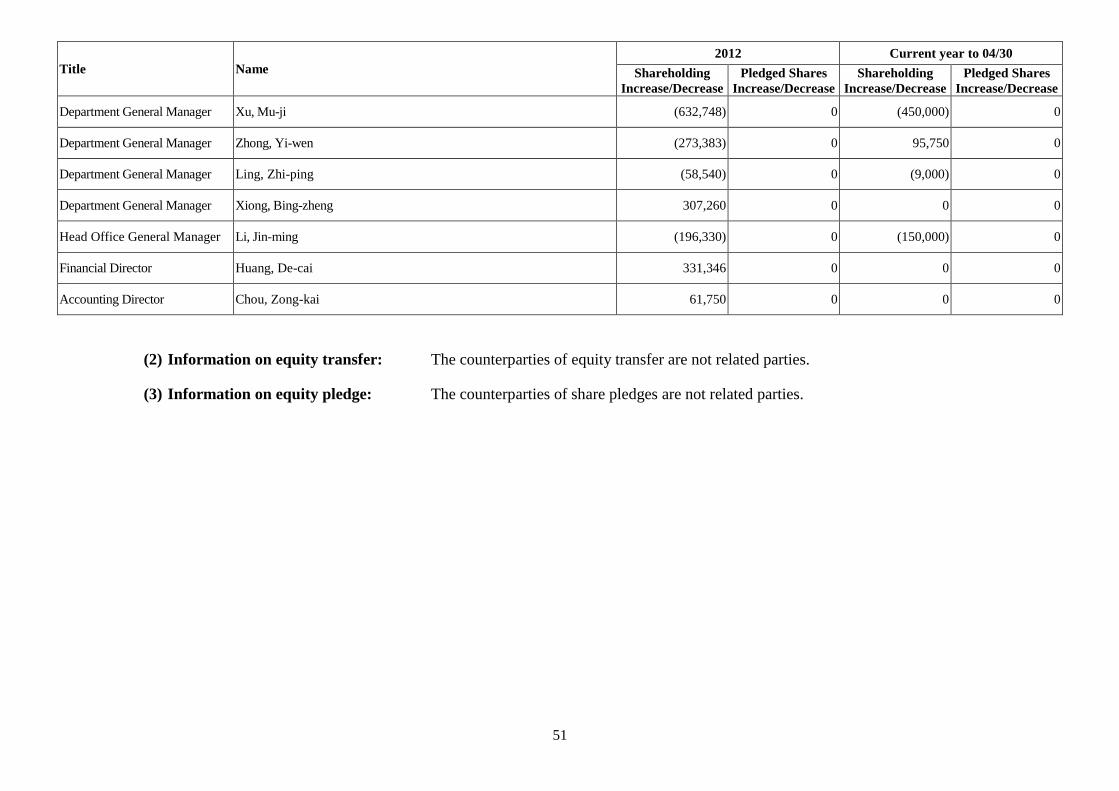
51
Title Name
2012 Current year to 04/30
Shareholding
Increase/Decrease
Pledged Shares
Increase/Decrease
Shareholding
Increase/Decrease
Pledged Shares
Increase/Decrease
Department General Manager Xu, Mu-ji (632,748) 0 (450,000) 0
Department General Manager Zhong, Yi-wen (273,383) 0 95,750 0
Department General Manager Ling, Zhi-ping (58,540) 0 (9,000) 0
Department General Manager Xiong, Bing-zheng 307,260 0 0 0
Head Office General Manager Li, Jin-ming (196,330) 0 (150,000) 0
Financial Director Huang, De-cai 331,346 0 0 0
Accounting Director Chou, Zong-kai 61,750 0 0 0
(2) Information on equity transfer: The counterparties of equity transfer are not related parties.
(3) Information on equity pledge: The counterparties of share pledges are not related parties.
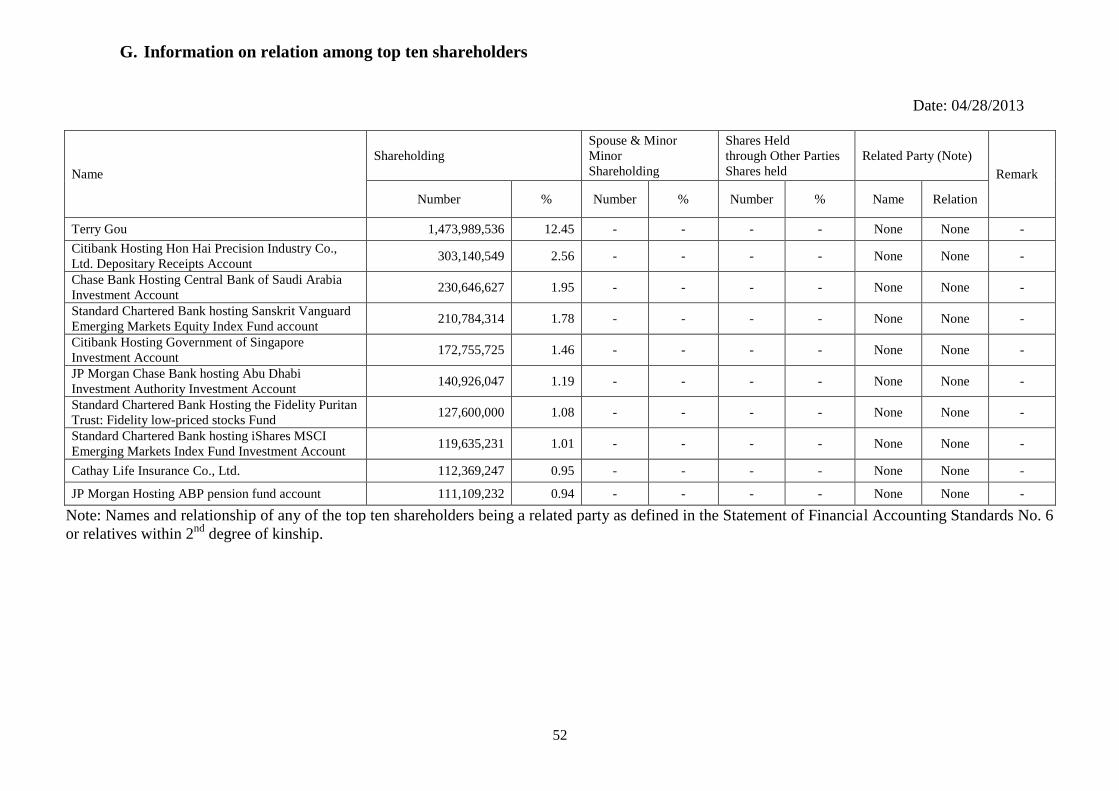
52
G. Information on relation among top ten shareholders
Date: 04/28/2013
Name
Shareholding
Spouse & Minor
Minor
Shareholding
Shares Held
through Other Parties
Shares held
Related Party (Note)
Remark
Number % Number % Number % Name Relation
Terry Gou 1,473,989,536 12.45 - - - - None None -
Citibank Hosting Hon Hai Precision Industry Co.,
Ltd. Depositary Receipts Account 303,140,549 2.56 - - - - None None -
Chase Bank Hosting Central Bank of Saudi Arabia
Investment Account 230,646,627 1.95 - - - - None None -
Standard Chartered Bank hosting Sanskrit Vanguard
Emerging Markets Equity Index Fund account 210,784,314 1.78 - - - - None None -
Citibank Hosting Government of Singapore
Investment Account 172,755,725 1.46 - - - - None None -
JP Morgan Chase Bank hosting Abu Dhabi
Investment Authority Investment Account 140,926,047 1.19 - - - - None None -
Standard Chartered Bank Hosting the Fidelity Puritan
Trust: Fidelity low-priced stocks Fund 127,600,000 1.08 - - - - None None -
Standard Chartered Bank hosting iShares MSCI
Emerging Markets Index Fund Investment Account 119,635,231 1.01 - - - - None None -
Cathay Life Insurance Co., Ltd. 112,369,247 0.95 - - - - None None -
JP Morgan Hosting ABP pension fund account 111,109,232 0.94 - - - - None None -
Note: Names and relationship of any of the top ten shareholders being a related party as defined in the Statement of Financial Accounting Standards No. 6
or relatives within 2nd
degree of kinship.
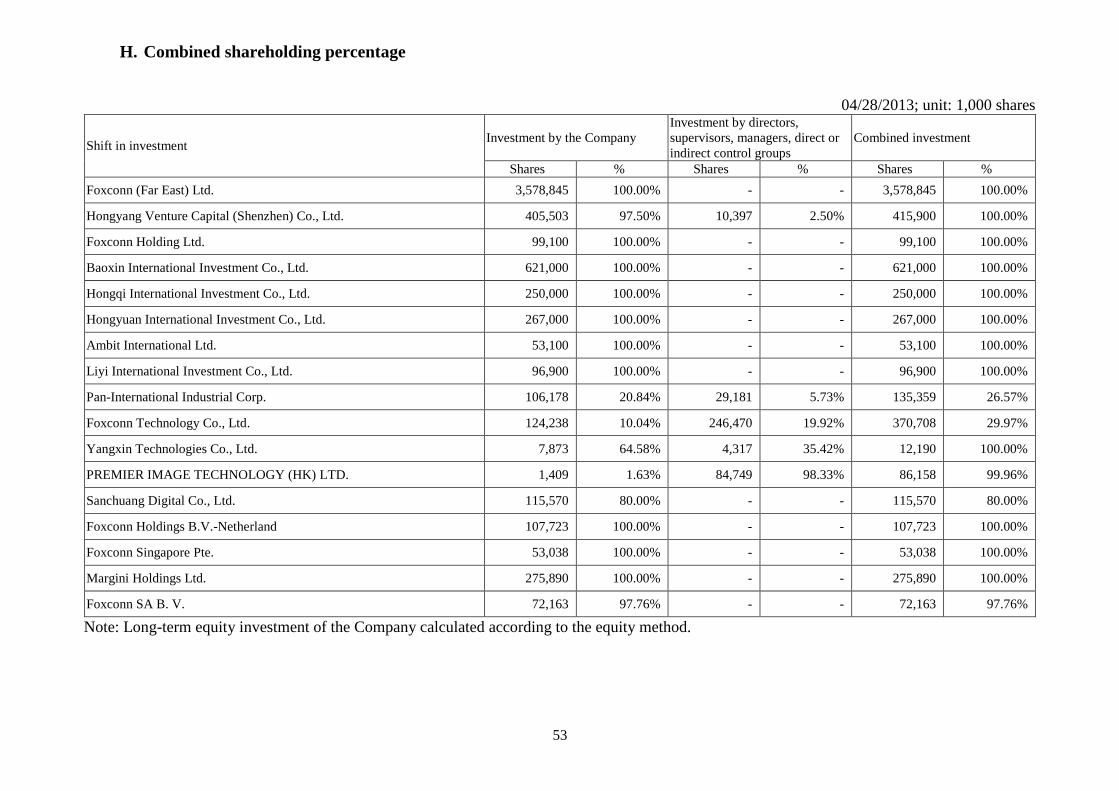
53
H. Combined shareholding percentage
04/28/2013; unit: 1,000 shares
Shift in investment Investment by the Company
Investment by directors,
supervisors, managers, direct or
indirect control groups
Combined investment
Shares % Shares % Shares %
Foxconn (Far East) Ltd. 3,578,845 100.00% - - 3,578,845 100.00%
Hongyang Venture Capital (Shenzhen) Co., Ltd. 405,503 97.50% 10,397 2.50% 415,900 100.00%
Foxconn Holding Ltd. 99,100 100.00% - - 99,100 100.00%
Baoxin International Investment Co., Ltd. 621,000 100.00% - - 621,000 100.00%
Hongqi International Investment Co., Ltd. 250,000 100.00% - - 250,000 100.00%
Hongyuan International Investment Co., Ltd. 267,000 100.00% - - 267,000 100.00%
Ambit International Ltd. 53,100 100.00% - - 53,100 100.00%
Liyi International Investment Co., Ltd. 96,900 100.00% - - 96,900 100.00%
Pan-International Industrial Corp. 106,178 20.84% 29,181 5.73% 135,359 26.57%
Foxconn Technology Co., Ltd. 124,238 10.04% 246,470 19.92% 370,708 29.97%
Yangxin Technologies Co., Ltd. 7,873 64.58% 4,317 35.42% 12,190 100.00%
PREMIER IMAGE TECHNOLOGY (HK) LTD. 1,409 1.63% 84,749 98.33% 86,158 99.96%
Sanchuang Digital Co., Ltd. 115,570 80.00% - - 115,570 80.00%
Foxconn Holdings B.V.-Netherland 107,723 100.00% - - 107,723 100.00%
Foxconn Singapore Pte. 53,038 100.00% - - 53,038 100.00%
Margini Holdings Ltd. 275,890 100.00% - - 275,890 100.00%
Foxconn SA B. V. 72,163 97.76% - - 72,163 97.76%
Note: Long-term equity investment of the Company calculated according to the equity method.
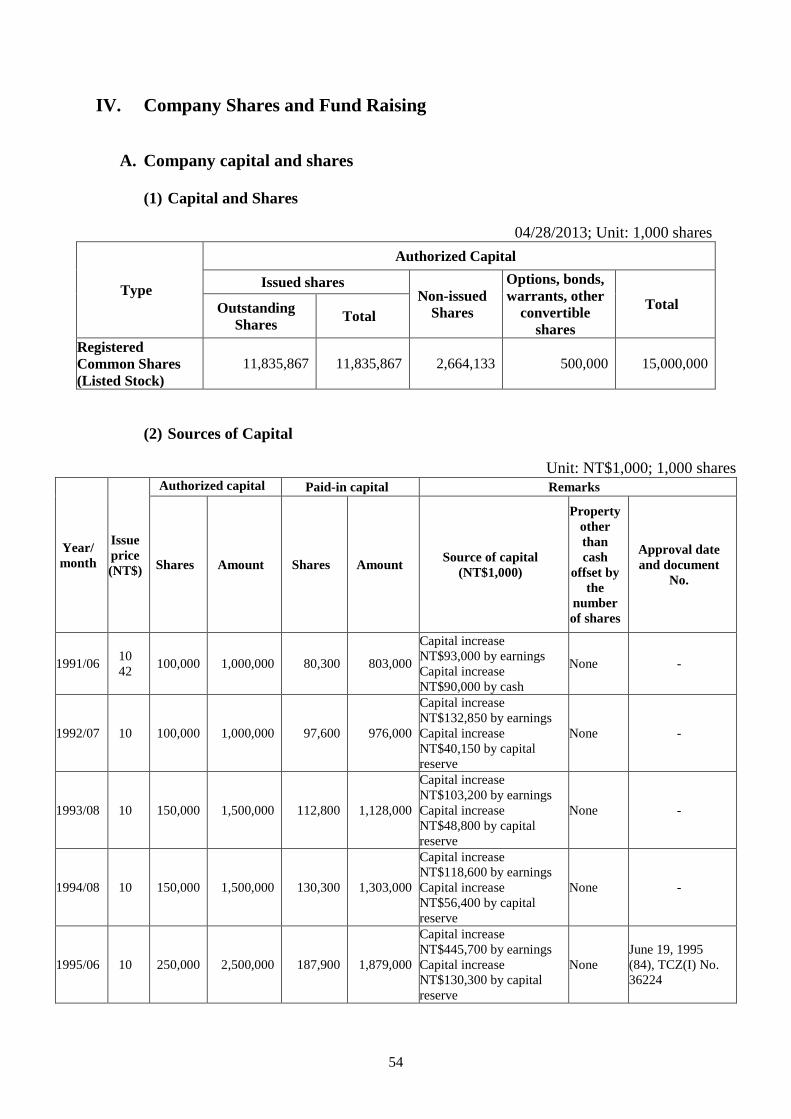
54
IV. Company Shares and Fund Raising
A. Company capital and shares
(1) Capital and Shares
04/28/2013; Unit: 1,000 shares
Type
Authorized Capital
Issued shares Non-issued
Shares
Options, bonds,
warrants, other
convertible
shares
Total Outstanding
Shares Total
Registered
Common Shares
(Listed Stock)
11,835,867 11,835,867 2,664,133 500,000 15,000,000
(2) Sources of Capital
Unit: NT$1,000; 1,000 shares
Year/
month
Issue
price
(NT$)
Authorized capital
stock Paid-in capital Remarks
Shares Amount Shares Amount Source of capital
(NT$1,000)
Property
other
than
cash
offset by
the
number
of shares
Approval date
and document
No.
1991/06 10
42 100,000 1,000,000 80,300 803,000
Capital increase
NT$93,000 by earnings
Capital increase
NT$90,000 by cash
None -
1992/07 10 100,000 1,000,000 97,600 976,000
Capital increase
NT$132,850 by earnings
Capital increase
NT$40,150 by capital
reserve
None -
1993/08 10 150,000 1,500,000 112,800 1,128,000
Capital increase
NT$103,200 by earnings
Capital increase
NT$48,800 by capital
reserve
None -
1994/08 10 150,000 1,500,000 130,300 1,303,000
Capital increase
NT$118,600 by earnings
Capital increase
NT$56,400 by capital
reserve
None -
1995/06 10 250,000 2,500,000 187,900 1,879,000
Capital increase
NT$445,700 by earnings
Capital increase
NT$130,300 by capital
reserve
None
June 19, 1995
(84), TCZ(I) No.
36224
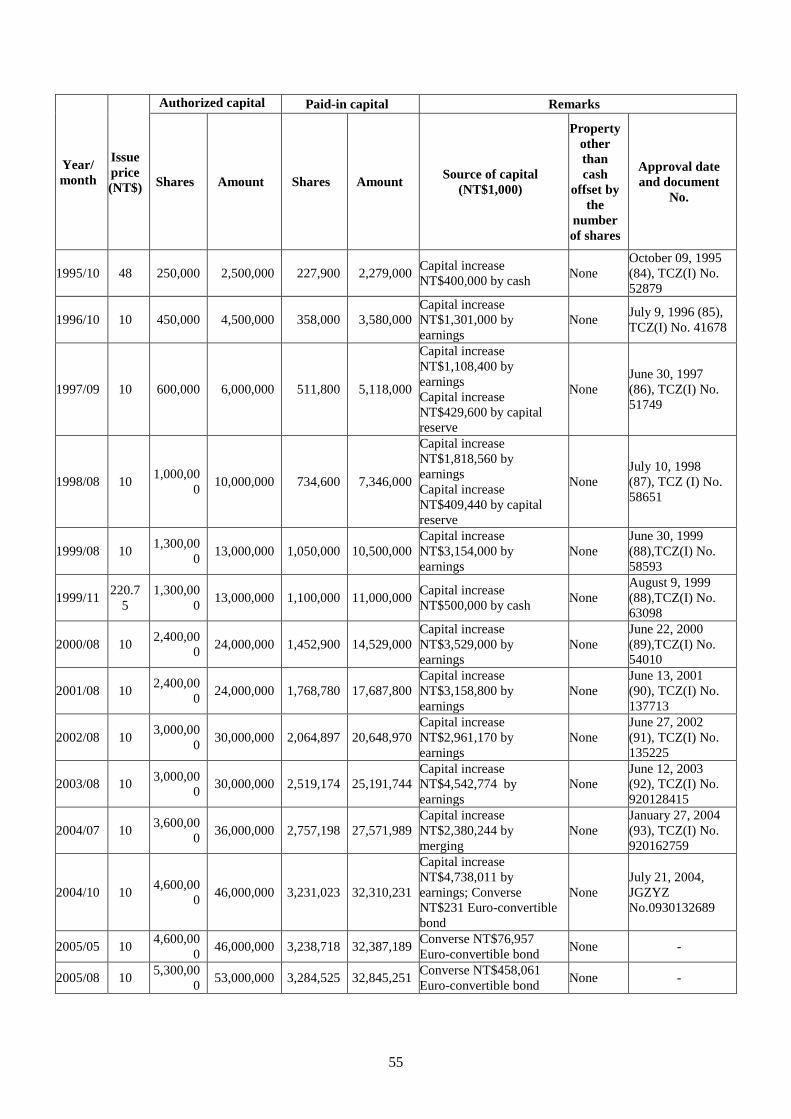
55
Year/
month
Issue
price
(NT$)
Authorized capital
stock Paid-in capital Remarks
Shares Amount Shares Amount Source of capital
(NT$1,000)
Property
other
than
cash
offset by
the
number
of shares
Approval date
and document
No.
1995/10 48 250,000 2,500,000 227,900 2,279,000 Capital increase
NT$400,000 by cash None
October 09, 1995
(84), TCZ(I) No.
52879
1996/10 10 450,000 4,500,000 358,000 3,580,000
Capital increase
NT$1,301,000 by
earnings
None July 9, 1996 (85),
TCZ(I) No. 41678
1997/09 10 600,000 6,000,000 511,800 5,118,000
Capital increase
NT$1,108,400 by
earnings
Capital increase
NT$429,600 by capital
reserve
None
June 30, 1997
(86), TCZ(I) No.
51749
1998/08 10 1,000,00
0 10,000,000 734,600 7,346,000
Capital increase
NT$1,818,560 by
earnings
Capital increase
NT$409,440 by capital
reserve
None
July 10, 1998
(87), TCZ (I) No.
58651
1999/08 10 1,300,00
0 13,000,000 1,050,000 10,500,000
Capital increase
NT$3,154,000 by
earnings
None
June 30, 1999
(88),TCZ(I) No.
58593
1999/11 220.7
5
1,300,00
0 13,000,000 1,100,000 11,000,000
Capital increase
NT$500,000 by cash None
August 9, 1999
(88),TCZ(I) No.
63098
2000/08 10 2,400,00
0 24,000,000 1,452,900 14,529,000
Capital increase
NT$3,529,000 by
earnings
None
June 22, 2000
(89),TCZ(I) No.
54010
2001/08 10 2,400,00
0 24,000,000 1,768,780 17,687,800
Capital increase
NT$3,158,800 by
earnings
None
June 13, 2001
(90), TCZ(I) No.
137713
2002/08 10 3,000,00
0 30,000,000 2,064,897 20,648,970
Capital increase
NT$2,961,170 by
earnings
None
June 27, 2002
(91), TCZ(I) No.
135225
2003/08 10 3,000,00
0 30,000,000 2,519,174 25,191,744
Capital increase
NT$4,542,774 by
earnings
None
June 12, 2003
(92), TCZ(I) No.
920128415
2004/07 10 3,600,00
0 36,000,000 2,757,198 27,571,989
Capital increase
NT$2,380,244 by
merging
None
January 27, 2004
(93), TCZ(I) No.
920162759
2004/10 10 4,600,00
0 46,000,000 3,231,023 32,310,231
Capital increase
NT$4,738,011 by
earnings; Converse
NT$231 Euro-convertible
bond
None
July 21, 2004,
JGZYZ
No.0930132689
2005/05 10 4,600,00
0 46,000,000 3,238,718 32,387,189
Converse NT$76,957
Euro-convertible bond None -
2005/08 10 5,300,00
0 53,000,000 3,284,525 32,845,251
Converse NT$458,061
Euro-convertible bond None -
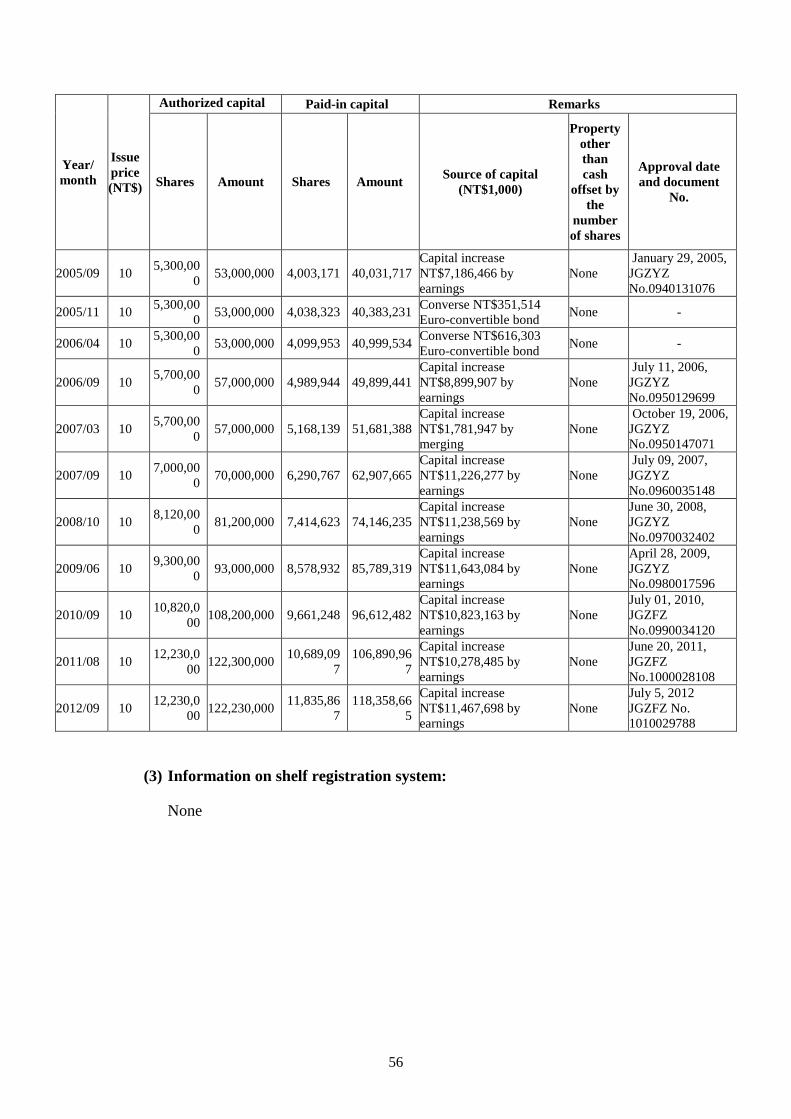
56
Year/
month
Issue
price
(NT$)
Authorized capital
stock Paid-in capital Remarks
Shares Amount Shares Amount Source of capital
(NT$1,000)
Property
other
than
cash
offset by
the
number
of shares
Approval date
and document
No.
2005/09 10 5,300,00
0 53,000,000 4,003,171 40,031,717
Capital increase
NT$7,186,466 by
earnings
None
January 29, 2005,
JGZYZ
No.0940131076
2005/11 10 5,300,00
0 53,000,000 4,038,323 40,383,231
Converse NT$351,514
Euro-convertible bond None -
2006/04 10 5,300,00
0 53,000,000 4,099,953 40,999,534
Converse NT$616,303
Euro-convertible bond None -
2006/09 10 5,700,00
0 57,000,000 4,989,944 49,899,441
Capital increase
NT$8,899,907 by
earnings
None
July 11, 2006,
JGZYZ
No.0950129699
2007/03 10 5,700,00
0 57,000,000 5,168,139 51,681,388
Capital increase
NT$1,781,947 by
merging
None
October 19, 2006,
JGZYZ
No.0950147071
2007/09 10 7,000,00
0 70,000,000 6,290,767 62,907,665
Capital increase
NT$11,226,277 by
earnings
None
July 09, 2007,
JGZYZ
No.0960035148
2008/10 10 8,120,00
0 81,200,000 7,414,623 74,146,235
Capital increase
NT$11,238,569 by
earnings
None
June 30, 2008,
JGZYZ
No.0970032402
2009/06 10 9,300,00
0 93,000,000 8,578,932 85,789,319
Capital increase
NT$11,643,084 by
earnings
None
April 28, 2009,
JGZYZ
No.0980017596
2010/09 10 10,820,0
00 108,200,000 9,661,248 96,612,482
Capital increase
NT$10,823,163 by
earnings
None
July 01, 2010,
JGZFZ
No.0990034120
2011/08 10 12,230,0
00 122,300,000
10,689,09
7
106,890,96
7
Capital increase
NT$10,278,485 by
earnings
None
June 20, 2011,
JGZFZ
No.1000028108
2012/09 10 12,230,0
00 122,230,000
11,835,86
7
118,358,66
5
Capital increase
NT$11,467,698 by
earnings
None
July 5, 2012
JGZFZ No.
1010029788
(3) Information on shelf registration system:
None
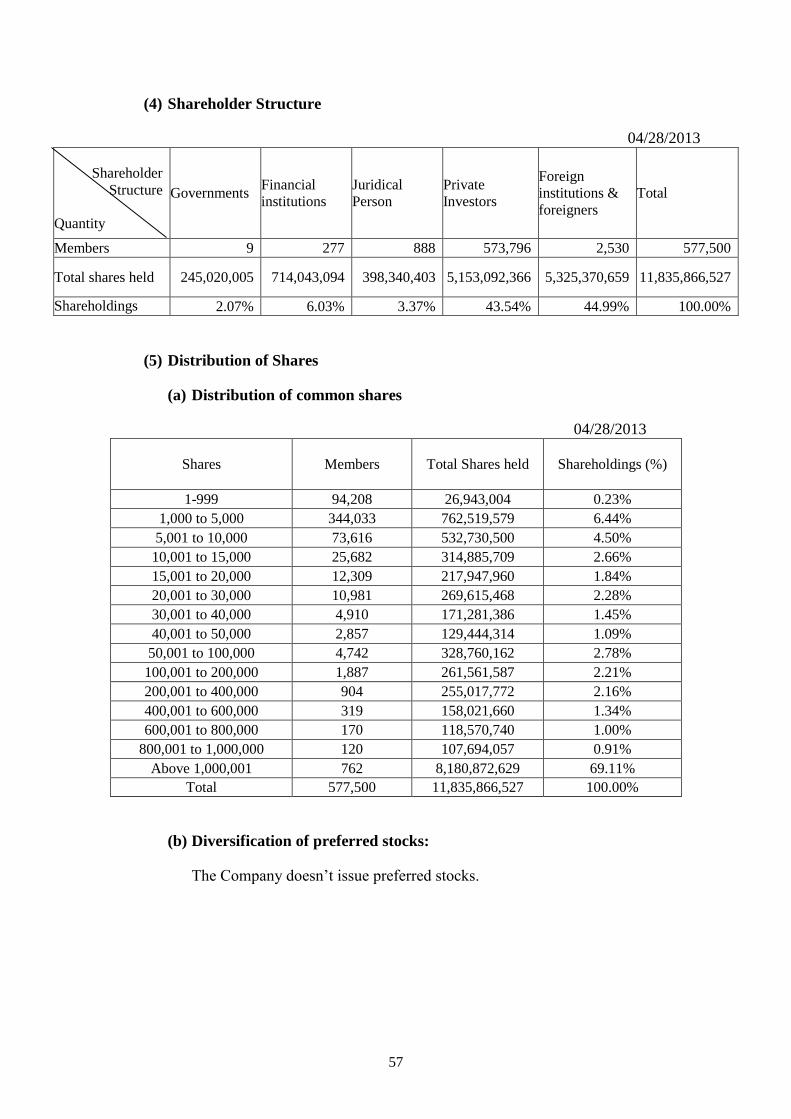
57
(4) Shareholder Structure
04/28/2013
Shareholder
Structure
Quantity
Governments Financial
institutions
Juridical
Person
Private
Investors
Foreign
institutions &
foreigners
Total
Members 9 277 888 573,796 2,530 577,500
Total shares held 245,020,005 714,043,094 398,340,403 5,153,092,366 5,325,370,659 11,835,866,527
Shareholdings
(%) 2.07% 6.03% 3.37% 43.54% 44.99% 100.00%
(5) Distribution of Shares
(a) Distribution of common shares
04/28/2013
Shares Members Total Shares held Shareholdings (%)
1-999 94,208 26,943,004 0.23%
1,000 to 5,000 344,033 762,519,579 6.44%
5,001 to 10,000 73,616 532,730,500 4.50%
10,001 to 15,000 25,682 314,885,709 2.66%
15,001 to 20,000 12,309 217,947,960 1.84%
20,001 to 30,000 10,981 269,615,468 2.28%
30,001 to 40,000 4,910 171,281,386 1.45%
40,001 to 50,000 2,857 129,444,314 1.09%
50,001 to 100,000 4,742 328,760,162 2.78%
100,001 to 200,000 1,887 261,561,587 2.21%
200,001 to 400,000 904 255,017,772 2.16%
400,001 to 600,000 319 158,021,660 1.34%
600,001 to 800,000 170 118,570,740 1.00%
800,001 to 1,000,000 120 107,694,057 0.91%
Above 1,000,001 762 8,180,872,629 69.11%
Total 577,500 11,835,866,527 100.00%
(b) Diversification of preferred stocks:
The Company doesn’t issue preferred stocks.
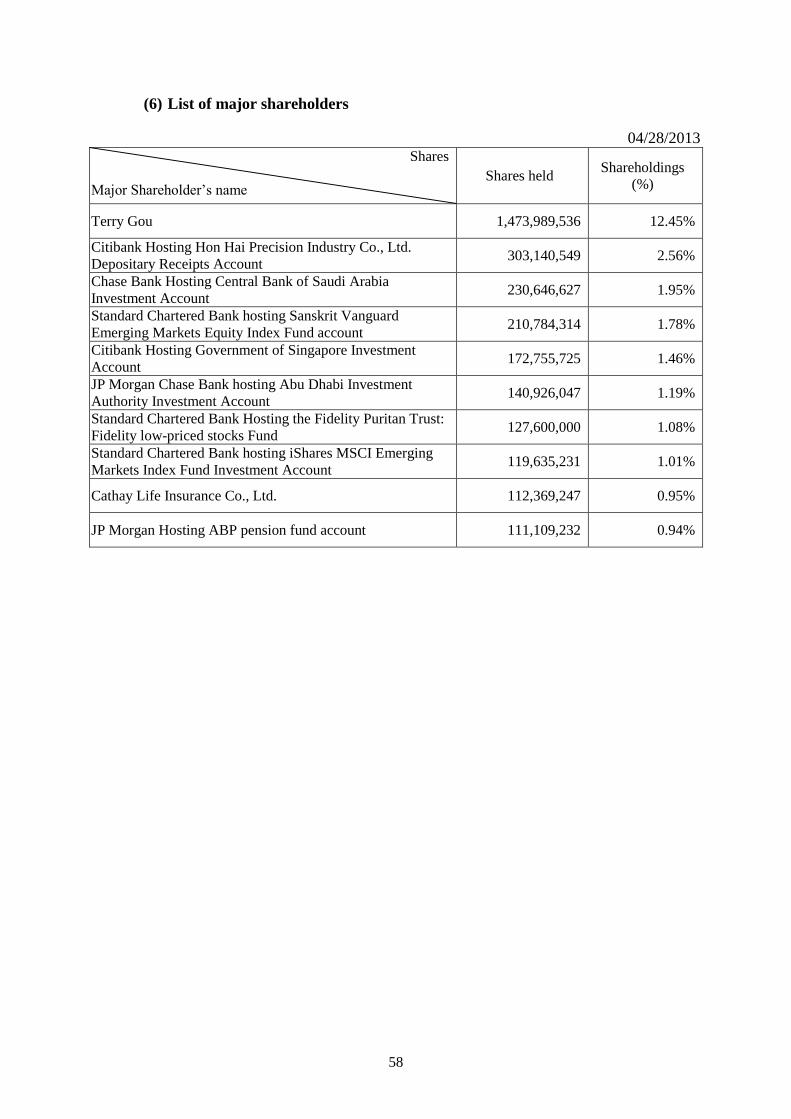
58
(6) List of major shareholders
04/28/2013 Shares
Major Shareholder’s name Shares held
Shareholdings
(%)
Terry Gou 1,473,989,536 12.45%
Citibank Hosting Hon Hai Precision Industry Co., Ltd.
Depositary Receipts Account 303,140,549 2.56%
Chase Bank Hosting Central Bank of Saudi Arabia
Investment Account 230,646,627 1.95%
Standard Chartered Bank hosting Sanskrit Vanguard
Emerging Markets Equity Index Fund account 210,784,314 1.78%
Citibank Hosting Government of Singapore Investment
Account 172,755,725 1.46%
JP Morgan Chase Bank hosting Abu Dhabi Investment
Authority Investment Account 140,926,047 1.19%
Standard Chartered Bank Hosting the Fidelity Puritan Trust:
Fidelity low-priced stocks Fund 127,600,000 1.08%
Standard Chartered Bank hosting iShares MSCI Emerging
Markets Index Fund Investment Account 119,635,231 1.01%
Cathay Life Insurance Co., Ltd. 112,369,247 0.95%
JP Morgan Hosting ABP pension fund account 111,109,232 0.94%
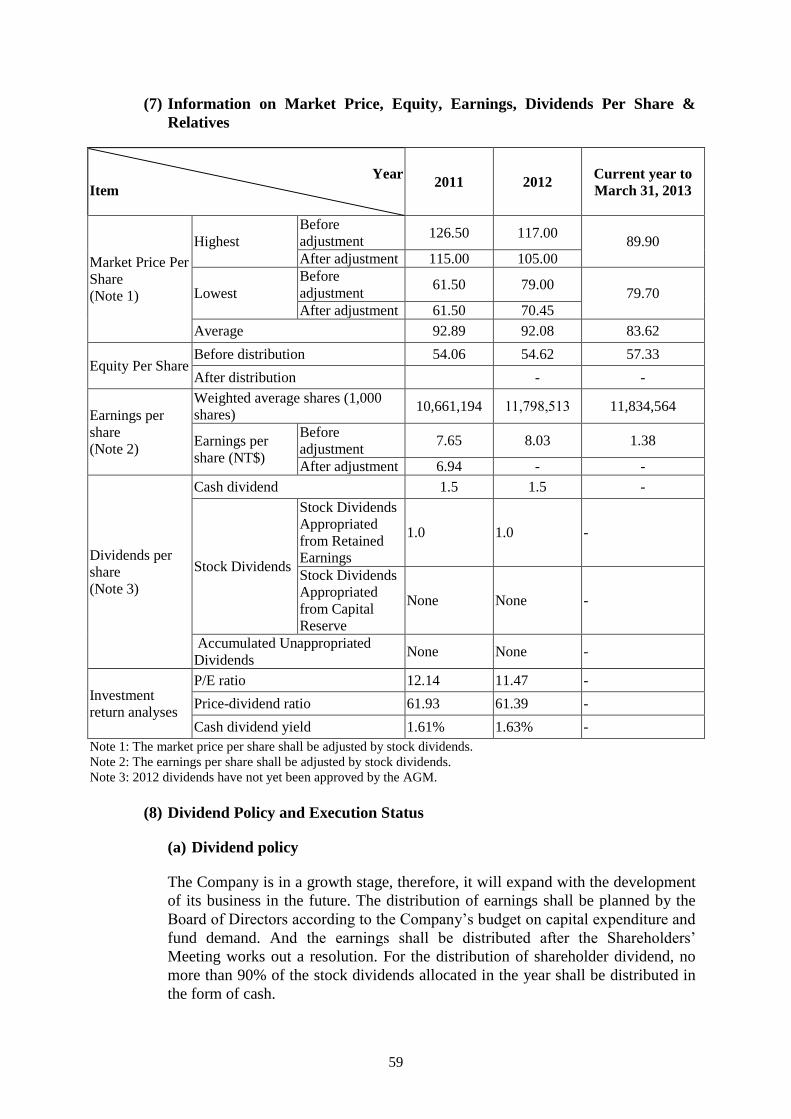
59
(7) Information on Market Price, Equity, Earnings, Dividends Per Share &
Relatives
Year
Item 2011 2012
Current year to
March 31, 2013
Market Price Per
Share
(Note 1)
Highest
Before
adjustment 126.50 117.00
89.90
After adjustment 115.00 105.00
Lowest
Before
adjustment 61.50 79.00
79.70
After adjustment 61.50 70.45
Average 92.89 92.08 83.62
Equity Per Share Before distribution 54.06 54.62 57.33
After distribution - -
Earnings per
share
(Note 2)
Weighted average shares (1,000
shares) 10,661,194 11,798,513 11,834,564
Earnings per
share (NT$)
Before
adjustment 7.65 8.03 1.38
After adjustment 6.94 - -
Dividends per
share
(Note 3)
Cash dividend 1.5 1.5 -
Stock Dividends
Stock Dividends
Appropriated
from Retained
Earnings
1.0 1.0 -
Stock Dividends
Appropriated
from Capital
Reserve
None None -
Accumulated Unappropriated
Dividends None None -
Investment
return analyses
P/E ratio 12.14 11.47 -
Price-dividend ratio 61.93 61.39 -
Cash dividend yield 1.61% 1.63% -
Note 1: The market price per share shall be adjusted by stock dividends.
Note 2: The earnings per share shall be adjusted by stock dividends.
Note 3: 2012 dividends have not yet been approved by the AGM.
(8) Dividend Policy and Execution Status
(a) Dividend policy
The Company is in a growth stage, therefore, it will expand with the development
of its business in the future. The distribution of earnings shall be planned by the
Board of Directors according to the Company’s budget on capital expenditure and
fund demand. And the earnings shall be distributed after the Shareholders’
Meeting works out a resolution. For the distribution of shareholder dividend, no
more than 90% of the stock dividends allocated in the year shall be distributed in
the form of cash.
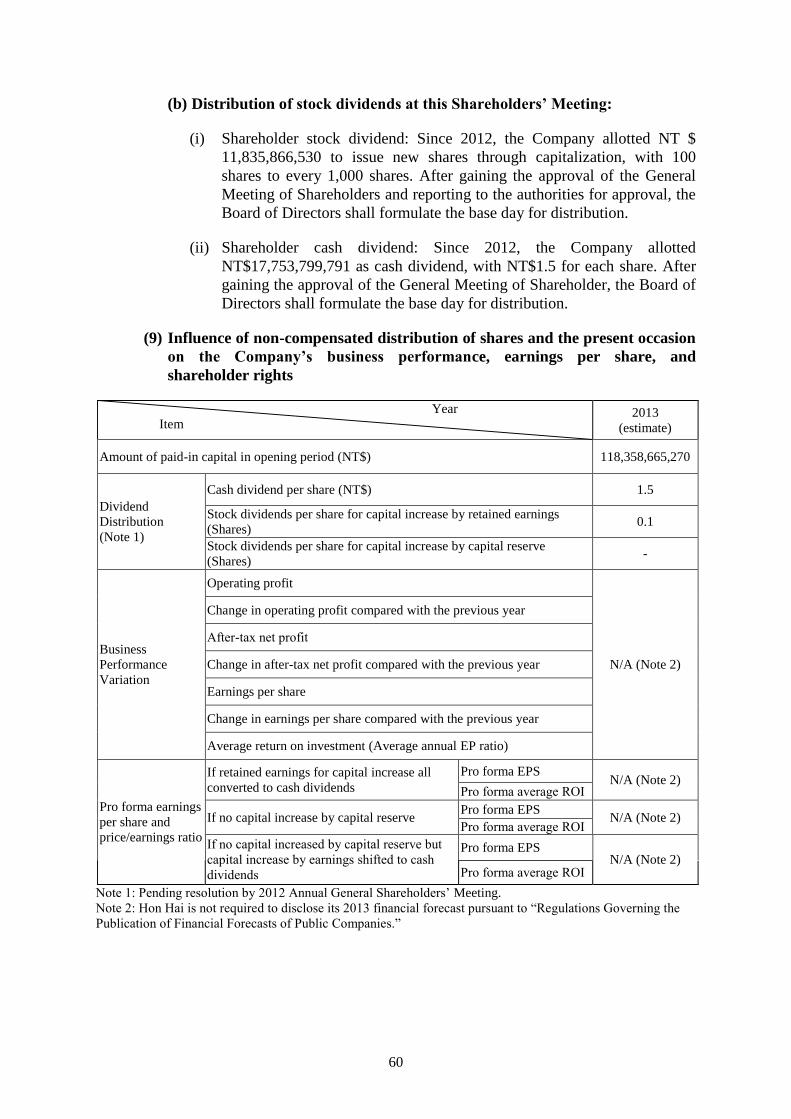
60
(b) Distribution of stock dividends at this Shareholders’ Meeting:
(i) Shareholder stock dividend: Since 2012, the Company allotted NT $
11,835,866,530 to issue new shares through capitalization, with 100
shares to every 1,000 shares. After gaining the approval of the General
Meeting of Shareholders and reporting to the authorities for approval, the
Board of Directors shall formulate the base day for distribution.
(ii) Shareholder cash dividend: Since 2012, the Company allotted
NT$17,753,799,791 as cash dividend, with NT$1.5 for each share. After
gaining the approval of the General Meeting of Shareholder, the Board of
Directors shall formulate the base day for distribution.
(9) Influence of non-compensated distribution of shares and the present occasion
on the Company’s business performance, earnings per share, and
shareholder rights
Year
Item 2013
(estimate)
Amount of paid-in capital in opening period (NT$) 118,358,665,270
Dividend
Distribution
(Note 1)
Cash dividend per share (NT$) 1.5
Stock dividends per share for capital increase by retained earnings
(Shares) 0.1
Stock dividends per share for capital increase by capital reserve
(Shares) -
Business
Performance
Variation
Operating profit
N/A (Note 2)
Change in operating profit compared with the previous year
After-tax net profit
Change in after-tax net profit compared with the previous year
Earnings per share
Change in earnings per share compared with the previous year
Average return on investment (Average annual EP ratio)
Pro forma earnings
per share and
price/earnings ratio
If retained earnings for capital increase all
converted to cash dividends
Pro forma EPS N/A (Note 2)
Pro forma average ROI
If no capital increase by capital reserve Pro forma EPS
N/A (Note 2) Pro forma average ROI
If no capital increased by capital reserve but
capital increase by earnings shifted to cash
dividends
Pro forma EPS N/A (Note 2)
Pro forma average ROI
Note 1: Pending resolution by 2012 Annual General Shareholders’ Meeting.
Note 2: Hon Hai is not required to disclose its 2013 financial forecast pursuant to “Regulations Governing the
Publication of Financial Forecasts of Public Companies.”
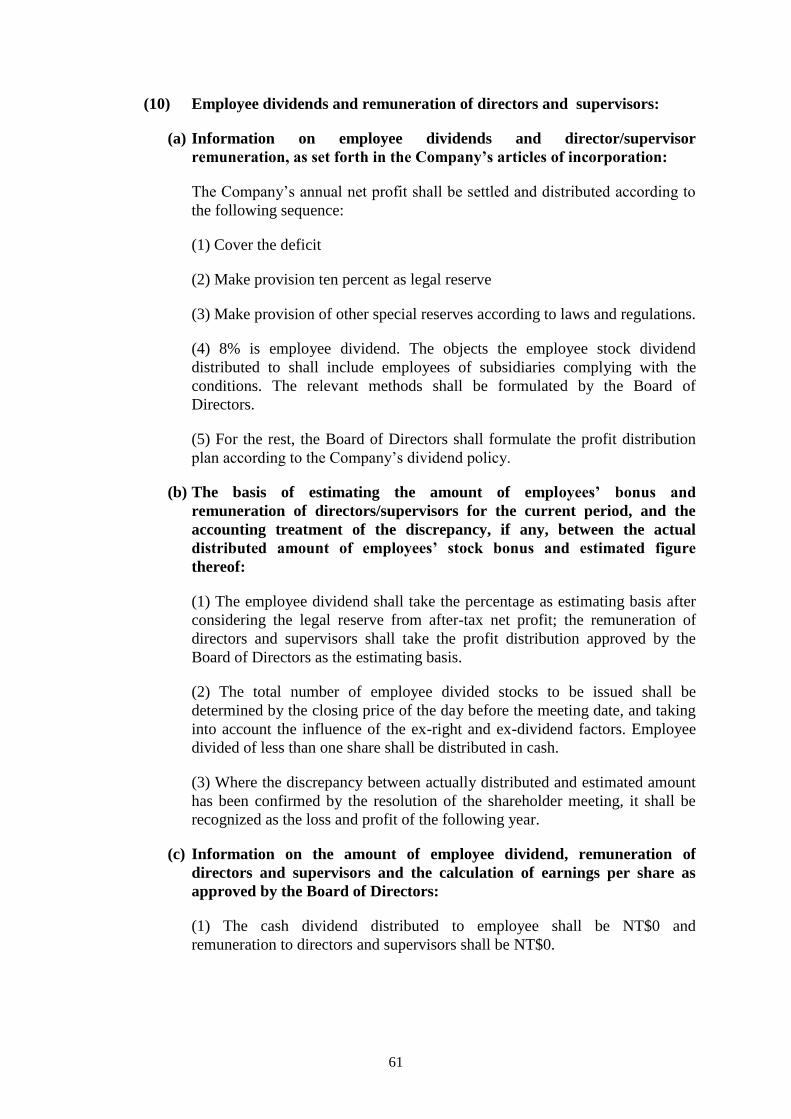
61
(10) Employee dividends and remuneration of directors and supervisors:
(a) Information on employee dividends and director/supervisor
remuneration, as set forth in the Company’s articles of incorporation:
The Company’s annual net profit shall be settled and distributed according to
the following sequence:
(1) Cover the deficit
(2) Make provision ten percent as legal reserve
(3) Make provision of other special reserves according to laws and regulations.
(4) 8% is employee dividend. The objects the employee stock dividend
distributed to shall include employees of subsidiaries complying with the
conditions. The relevant methods shall be formulated by the Board of
Directors.
(5) For the rest, the Board of Directors shall formulate the profit distribution
plan according to the Company’s dividend policy.
(b) The basis of estimating the amount of employees’ bonus and
remuneration of directors/supervisors for the current period, and the
accounting treatment of the discrepancy, if any, between the actual
distributed amount of employees’ stock bonus and estimated figure
thereof:
(1) The employee dividend shall take the percentage as estimating basis after
considering the legal reserve from after-tax net profit; the remuneration of
directors and supervisors shall take the profit distribution approved by the
Board of Directors as the estimating basis.
(2) The total number of employee divided stocks to be issued shall be
determined by the closing price of the day before the meeting date, and taking
into account the influence of the ex-right and ex-dividend factors. Employee
divided of less than one share shall be distributed in cash.
(3) Where the discrepancy between actually distributed and estimated amount
has been confirmed by the resolution of the shareholder meeting, it shall be
recognized as the loss and profit of the following year.
(c) Information on the amount of employee dividend, remuneration of
directors and supervisors and the calculation of earnings per share as
approved by the Board of Directors:
(1) The cash dividend distributed to employee shall be NT$0 and
remuneration to directors and supervisors shall be NT$0.
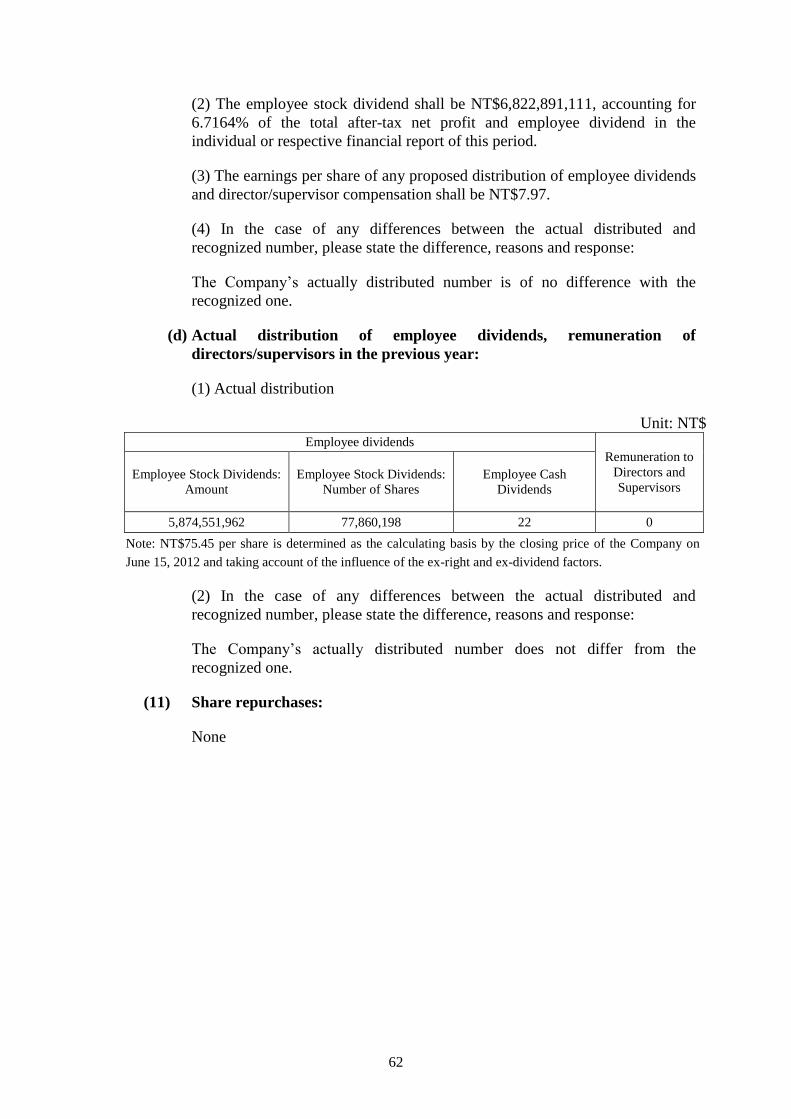
62
(2) The employee stock dividend shall be NT$6,822,891,111, accounting for
6.7164% of the total after-tax net profit and employee dividend in the
individual or respective financial report of this period.
(3) The earnings per share of any proposed distribution of employee dividends
and director/supervisor compensation shall be NT$7.97.
(4) In the case of any differences between the actual distributed and
recognized number, please state the difference, reasons and response:
The Company’s actually distributed number is of no difference with the
recognized one.
(d) Actual distribution of employee dividends, remuneration of
directors/supervisors in the previous year:
(1) Actual distribution
Unit: NT$ Employee dividends
Remuneration to
Directors and
Supervisors Employee Stock Dividends:
Amount
Employee Stock Dividends:
Number of Shares
Employee Cash
Dividends
5,874,551,962 77,860,198 22 0
Note: NT$75.45 per share is determined as the calculating basis by the closing price of the Company on
June 15, 2012 and taking account of the influence of the ex-right and ex-dividend factors.
(2) In the case of any differences between the actual distributed and
recognized number, please state the difference, reasons and response:
The Company’s actually distributed number does not differ from the
recognized one.
(11) Share repurchases:
None
63
B. Section on Corporate Bonds
(1) Corporate Bonds
Unit: NT$
Corporate Bond Type
2005 Unsecured
Corporate Bonds,
Phase I
Bonds A-E
2009 Unsecured
Corporate Bonds,
Phase I
2010 Unsecured
Corporate Bonds,
Phase I
2011 Unsecured
Corporate Bonds,
Phase I
Issuing (handling) date September 22, 2005 -
September 28, 2005 October 6, 2009 December 27, 2010 March 8, 2011
Denomination 1,000,000 1,000,000 1,000,000 1,000,000
Issuing and transaction
location Market (listed) Market (listed) Market (listed) Market (listed)
Issue price Issue by denomination Issue by denomination Issue by denomination Issue by denomination
Total amount 2,500,000,000 6,820,000,000 6,000,000,000 6,000,000,000
Interest rate 2.37% 1.72% 1.43% 1.47%
Deadline
10-year period
Due date: September
22, 2015 - September
28, 2015
5-year period
Due date: October 6,
2014
5-year period
Due date: December
27, 2015
5-year period
Due date: March 8,
2016
Guarantee Agency None None None None
Consignee Bank SinoPac
Company Limited
Bank SinoPac
Company Limited
Bank SinoPac
Company Limited
Bank SinoPac
Company Limited
Underwriting institution None None None None
Certified lawyer None None None None
CPA None None None None
Repayment method Repayment in lump
sum upon maturity
Respectively repay
50% in the fourth and
fifth years from the
expiration of issue date
Respectively repay
50% in the fourth and
fifth years from the
expiration of issue date
Respectively repay
50% in the fourth and
fifth years from the
expiration of issue
date
Outstanding principal 5,500,000,000 6,820,000,000 6,000,000,000 6,000,000,000
Terms of redemption or
advance repayment None None None None
Restrictive clause None None None None
Name of credit rating
agency
Rating date
Rating of corporate bonds
Rating agency:
China Credit Rating
Co., Ltd.
Rating date: August
23, 2005
Rating result: twAA
Rating agency:
China Credit Rating
Co., Ltd. Rating
date: December 26,
2008
Rating result: twAA+
Rating agency:
China Credit Rating
Co., Ltd. Rating
date: December 3,
2010
Rating result: twAA+
Rating agency:
China Credit Rating
Co., Ltd. Rating
date: December 21,
2010
Rating result: twAA+
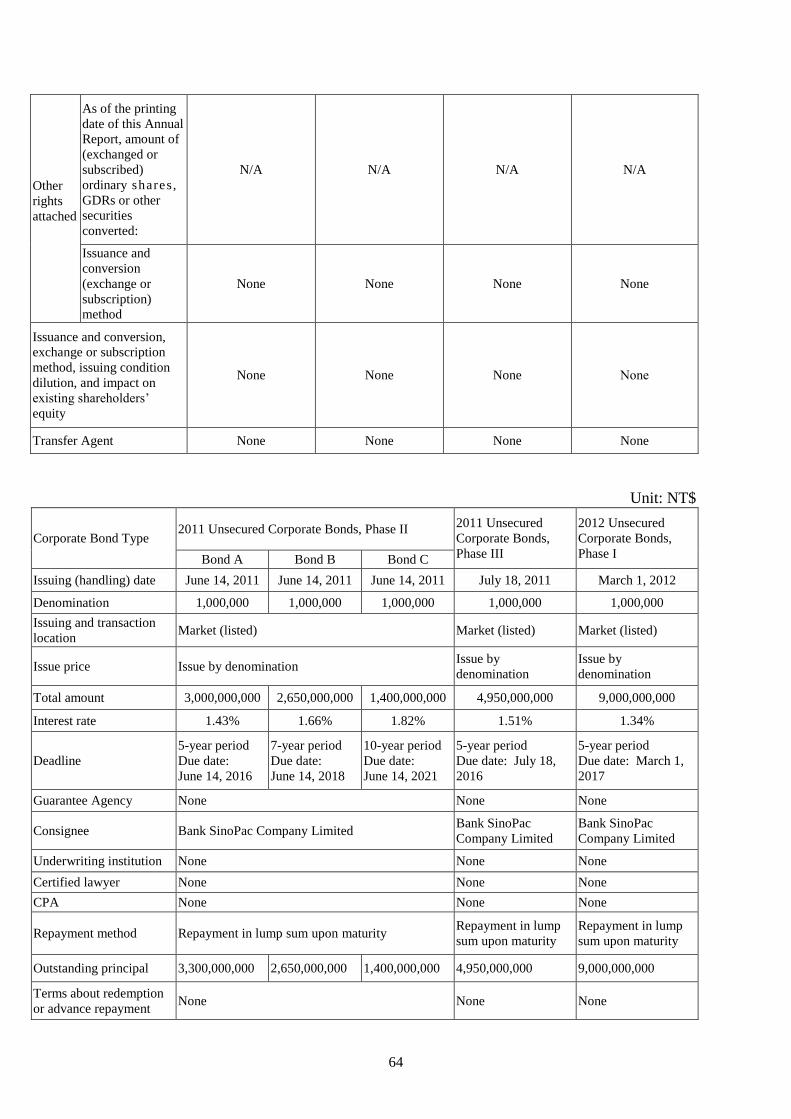
64
Unit: NT$
Other
rights
attached
As of the printing
date of this Annual
Report, amount of
(exchanged or
subscribed)
ordinary shares,
GDRs or other
securities
converted:
N/A N/A N/A N/A
Issuance and
conversion
(exchange or
subscription)
method
None None None None
Issuance and conversion,
exchange or subscription
method, issuing condition
dilution, and impact on
existing shareholders’
equity
None None None None
Transfer Agent None None None None
Corporate Bond Type 2011 Unsecured Corporate Bonds, Phase II
2011 Unsecured
Corporate Bonds,
Phase III
2012 Unsecured
Corporate Bonds,
Phase I Bond A Bond B Bond C
Issuing (handling) date June 14, 2011 June 14, 2011 June 14, 2011 July 18, 2011 March 1, 2012
Denomination 1,000,000 1,000,000 1,000,000 1,000,000 1,000,000
Issuing and transaction
location Market (listed) Market (listed) Market (listed)
Issue price Issue by denomination Issue by
denomination
Issue by
denomination
Total amount 3,000,000,000 2,650,000,000 1,400,000,000 4,950,000,000 9,000,000,000
Interest rate 1.43% 1.66% 1.82% 1.51% 1.34%
Deadline
5-year period
Due date:
June 14, 2016
7-year period
Due date:
June 14, 2018
10-year period
Due date:
June 14, 2021
5-year period
Due date: July 18,
2016
5-year period
Due date: March 1,
2017
Guarantee Agency None None None
Consignee Bank SinoPac Company Limited Bank SinoPac
Company Limited
Bank SinoPac
Company Limited
Underwriting institution None None None
Certified lawyer None None None
CPA None None None
Repayment method Repayment in lump sum upon maturity Repayment in lump
sum upon maturity
Repayment in lump
sum upon maturity
Outstanding principal 3,300,000,000 2,650,000,000 1,400,000,000 4,950,000,000 9,000,000,000
Terms about redemption
or advance repayment None None None
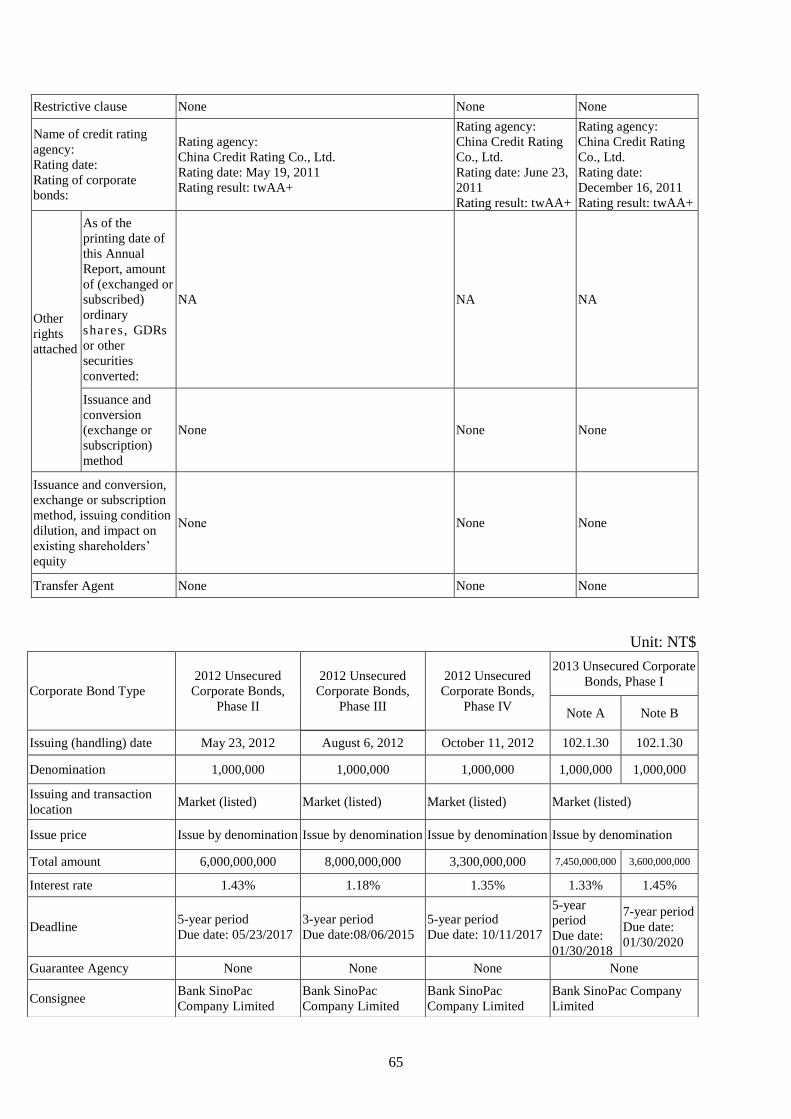
65
Unit: NT$
Restrictive clause None None None
Name of credit rating
agency:
Rating date:
Rating of corporate
bonds:
Rating agency:
China Credit Rating Co., Ltd.
Rating date: May 19, 2011
Rating result: twAA+
Rating agency:
China Credit Rating
Co., Ltd.
Rating date: June 23,
2011
Rating result: twAA+
Rating agency:
China Credit Rating
Co., Ltd.
Rating date:
December 16, 2011
Rating result: twAA+
Other
rights
attached
As of the
printing date of
this Annual
Report, amount
of (exchanged or
subscribed)
ordinary
shares, GDRs
or other
securities
converted:
NA NA NA
Issuance and
conversion
(exchange or
subscription)
method
None None None
Issuance and conversion,
exchange or subscription
method, issuing condition
dilution, and impact on
existing shareholders’
equity
None None None
Transfer Agent None None None
Corporate Bond Type
2012 Unsecured
Corporate Bonds,
Phase II
2012 Unsecured
Corporate Bonds,
Phase III
2012 Unsecured
Corporate Bonds,
Phase IV
2013 Unsecured Corporate
Bonds, Phase I
Note A Note B
Issuing (handling) date May 23, 2012 August 6, 2012 October 11, 2012 102.1.30 102.1.30
Denomination 1,000,000 1,000,000 1,000,000 1,000,000 1,000,000
Issuing and transaction
location Market (listed) Market (listed) Market (listed) Market (listed)
Issue price Issue by denomination Issue by denomination Issue by denomination Issue by denomination
Total amount 6,000,000,000 8,000,000,000 3,300,000,000 7,450,000,000 3,600,000,000
Interest rate 1.43% 1.18% 1.35% 1.33% 1.45%
Deadline 5-year period
Due date: 05/23/2017
3-year period
Due date:08/06/2015
5-year period
Due date: 10/11/2017
5-year
period
Due date:
01/30/2018
7-year period
Due date:
01/30/2020
Guarantee Agency None None None None
Consignee Bank SinoPac
Company Limited
Bank SinoPac
Company Limited
Bank SinoPac
Company Limited
Bank SinoPac Company
Limited
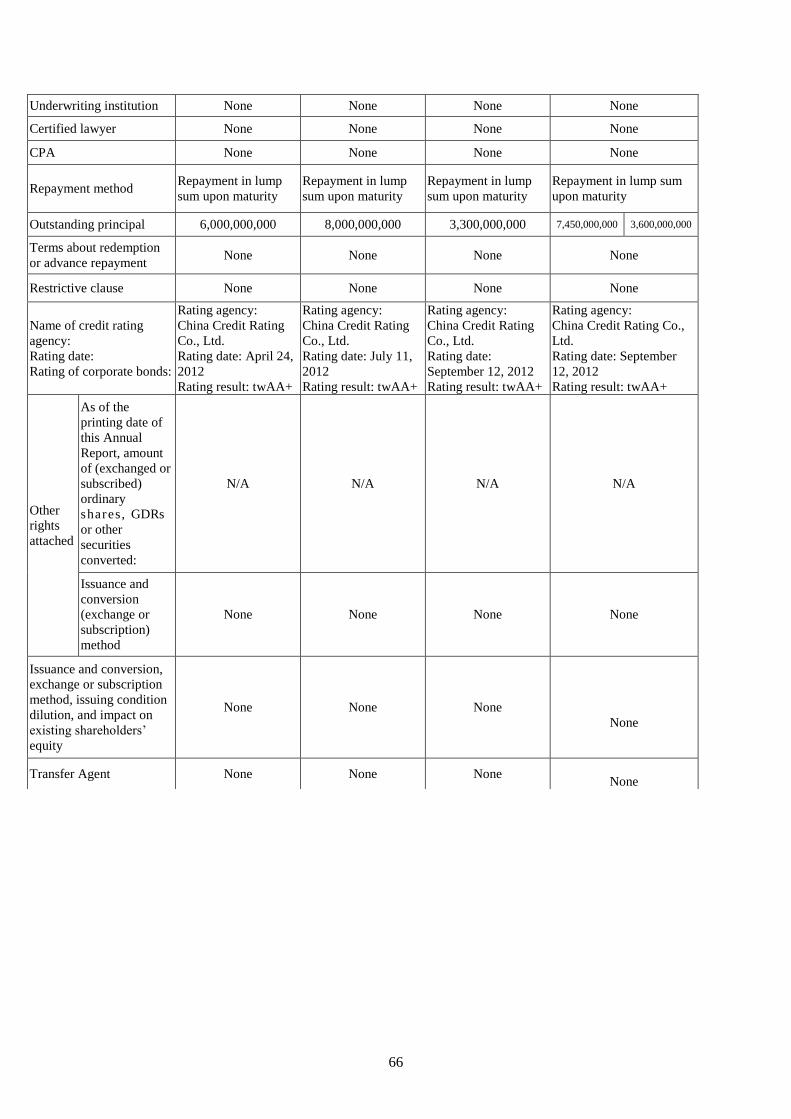
66
Underwriting institution None None None None
Certified lawyer None None None None
CPA None None None None
Repayment method Repayment in lump
sum upon maturity
Repayment in lump
sum upon maturity
Repayment in lump
sum upon maturity
Repayment in lump sum
upon maturity
Outstanding principal 6,000,000,000 8,000,000,000 3,300,000,000 7,450,000,000 3,600,000,000
Terms about redemption
or advance repayment None None None None
Restrictive clause None None None None
Name of credit rating
agency:
Rating date:
Rating of corporate bonds:
Rating agency:
China Credit Rating
Co., Ltd.
Rating date: April 24,
2012
Rating result: twAA+
Rating agency:
China Credit Rating
Co., Ltd.
Rating date: July 11,
2012
Rating result: twAA+
Rating agency:
China Credit Rating
Co., Ltd.
Rating date:
September 12, 2012
Rating result: twAA+
Rating agency:
China Credit Rating Co.,
Ltd.
Rating date: September
12, 2012
Rating result: twAA+
Other
rights
attached
As of the
printing date of
this Annual
Report, amount
of (exchanged or
subscribed)
ordinary
shares, GDRs
or other
securities
converted:
N/A N/A N/A N/A
Issuance and
conversion
(exchange or
subscription)
method
None None None None
Issuance and conversion,
exchange or subscription
method, issuing condition
dilution, and impact on
existing shareholders’
equity
None None None
None
Transfer Agent None None None
None
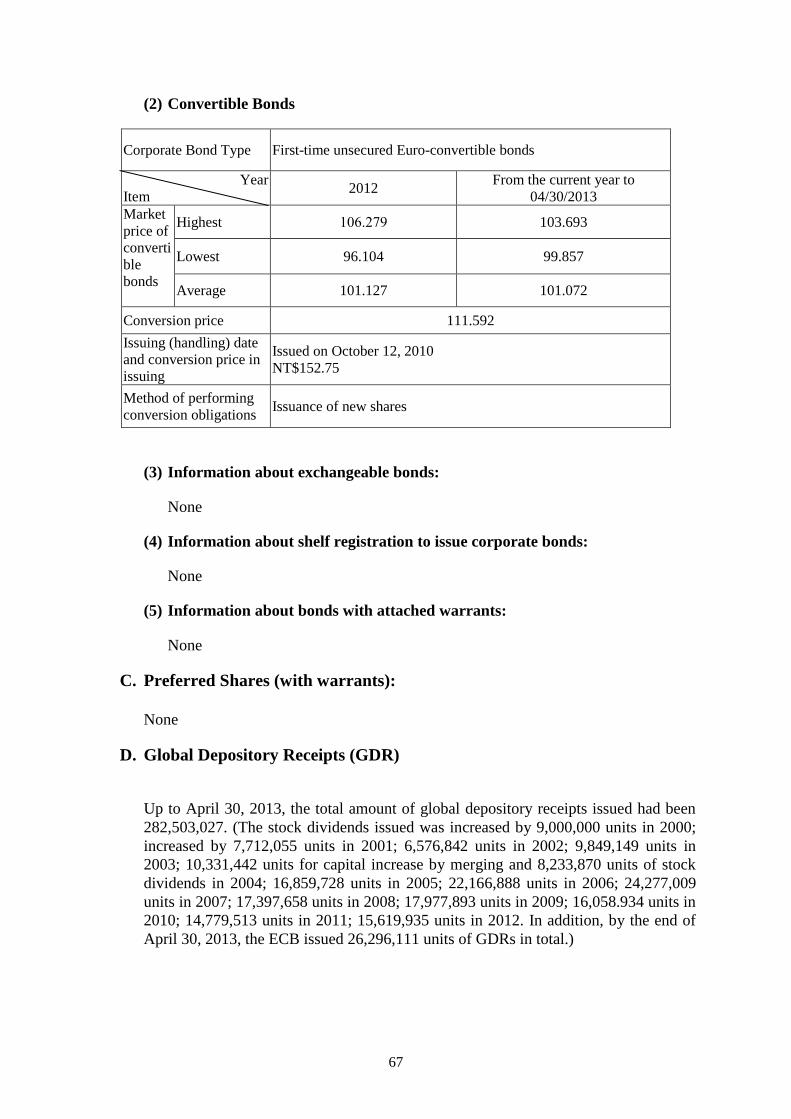
67
(2) Convertible Bonds
Corporate Bond Type First-time unsecured Euro-convertible bonds
Year
Item 2012
From the current year to
04/30/2013
Market
price of
converti
ble
bonds
Highest 106.279 103.693
Lowest 96.104 99.857
Average 101.127 101.072
Conversion price 111.592
Issuing (handling) date
and conversion price in
issuing
Issued on October 12, 2010
NT$152.75
Method of performing
conversion obligations Issuance of new shares
(3) Information about exchangeable bonds:
None
(4) Information about shelf registration to issue corporate bonds:
None
(5) Information about bonds with attached warrants:
None
C. Preferred Shares (with warrants):
None
D. Global Depository Receipts (GDR)
Up to April 30, 2013, the total amount of global depository receipts issued had been
282,503,027. (The stock dividends issued was increased by 9,000,000 units in 2000;
increased by 7,712,055 units in 2001; 6,576,842 units in 2002; 9,849,149 units in
2003; 10,331,442 units for capital increase by merging and 8,233,870 units of stock
dividends in 2004; 16,859,728 units in 2005; 22,166,888 units in 2006; 24,277,009
units in 2007; 17,397,658 units in 2008; 17,977,893 units in 2009; 16,058.934 units in
2010; 14,779,513 units in 2011; 15,619,935 units in 2012. In addition, by the end of
April 30, 2013, the ECB issued 26,296,111 units of GDRs in total.)
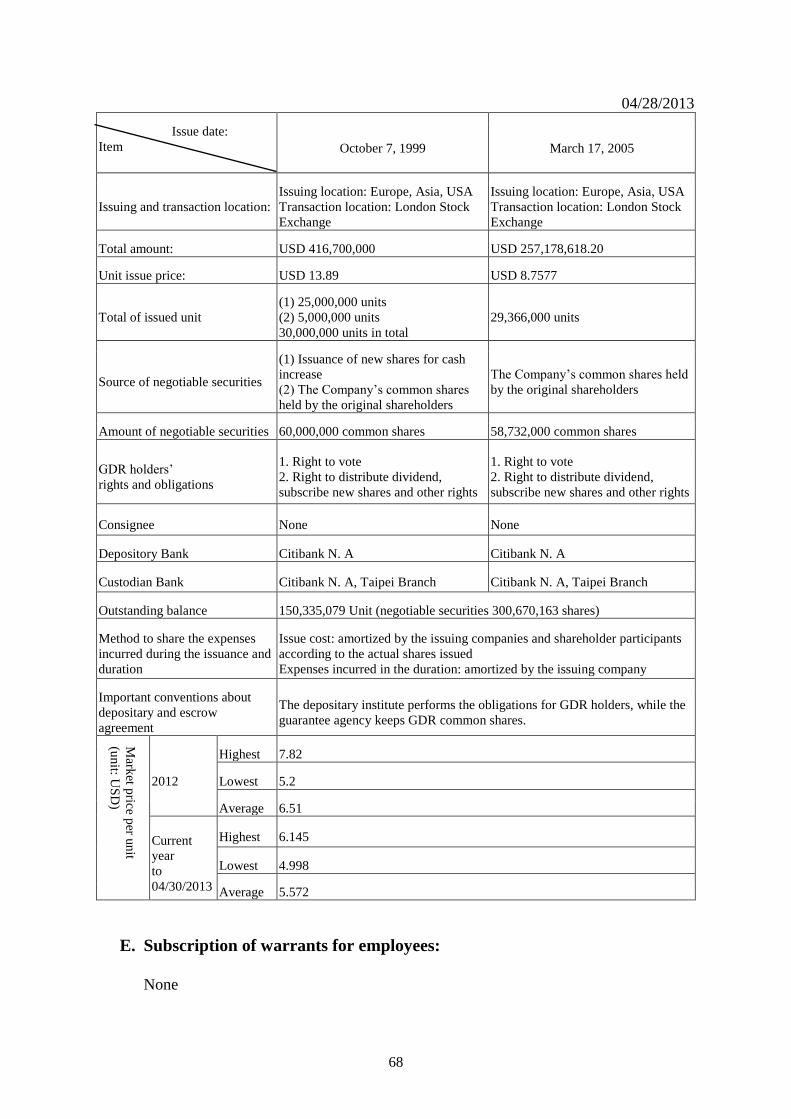
68
04/28/2013
Issue date:
Item October 7, 1999 March 17, 2005
Issuing and transaction location:
Issuing location: Europe, Asia, USA
Transaction location: London Stock
Exchange
Issuing location: Europe, Asia, USA
Transaction location: London Stock
Exchange
Total amount: USD 416,700,000 USD 257,178,618.20
Unit issue price: USD 13.89 USD 8.7577
Total of issued unit
(1) 25,000,000 units
(2) 5,000,000 units
30,000,000 units in total
29,366,000 units
Source of negotiable securities
(1) Issuance of new shares for cash
increase
(2) The Company’s common shares
held by the original shareholders
The Company’s common shares held
by the original shareholders
Amount of negotiable securities 60,000,000 common shares 58,732,000 common shares
GDR holders’
rights and obligations
1. Right to vote
2. Right to distribute dividend,
subscribe new shares and other rights
1. Right to vote
2. Right to distribute dividend,
subscribe new shares and other rights
Consignee None None
Depository Bank Citibank N. A Citibank N. A
Custodian Bank Citibank N. A, Taipei Branch Citibank N. A, Taipei Branch
Outstanding balance 150,335,079 Unit (negotiable securities 300,670,163 shares)
Method to share the expenses
incurred during the issuance and
duration
Issue cost: amortized by the issuing companies and shareholder participants
according to the actual shares issued
Expenses incurred in the duration: amortized by the issuing company
Important conventions about
depositary and escrow
agreement
The depositary institute performs the obligations for GDR holders, while the
guarantee agency keeps GDR common shares.
Mark
et price p
er un
it
(un
it: US
D)
2012
Highest 7.82
Lowest 5.2
Average 6.51
Current
year
to
04/30/2013
Highest 6.145
Lowest 4.998
Average 5.572
E. Subscription of warrants for employees:
None
69
F. Name of managers holding warrants for employees and top ten employees
in terms of subscription of warrants, and the acquisition status:
None
G. Subscription of new shares for employee restricted stocks:
None
H. Name of managers holding the new shares for employee restricted stocks
and top ten employees in terms of subscription of the new share, and the
acquisition status:
None
I. Issuance of new shares for merging and transferring the stocks of other
companies:
None
(1) During the latest year and up to the printing date of this Annual Report,
if the Company has merged or transferred the stocks of other companies
for issuing new shares:
(a) The assessment prepared by the managing underwriter concerning the
issuance of new shares by merging or transferring the stocks of other
companies within the past quarter:
None
(b) The implementation status of the past quarter. If the progress or
benefit of such implementation is not as good as expected, its impact on
shareholders’ equity and an improvement plan shall be state specifically:
N/A
(2) The merger or issuance of new shares approved by the Board of Directors
during the latest year and up to the printing date of this Annual Report:
None
J. Implementation of fund usage plan:
The Company doesn’t issue any uncompleted plan or completed one with unrealized
benefit within the latest three years.
70
V. Operational Highlights
A. Business Activities
(1) Business scope
(a) Major content of business activities
IT, communications, automation devices, photo-electricity, precise machinery,
auto, production, sales and service related with connectors, casings, radiators,
assembled parts of consuming electronics as well as assembly of network cables.
The products manufactured by the Company include:
(1) I/O product line: IN-PUT, OUT-PUT connectors.
(2) IC line packaging and product line of expansion memory: connector for IC
line and memory IC expansion bracket.
(3) Product line of system connector: electrical coupler of host and branch system.
(4) Product lines of network connection and output & input device: terminal,
scanner, keyboard, monitor, mouse, network integrated connecting cables.
(5) Photo-electricity connecting product line: optical connectors and connecting
wire network used in digital network.
(6) Compound connectors with electronic processing functions: filtering
connectors, static-free connectors and high frequency connectors.
(7) EISA graphics card connectors under new industrial standard: expansion slot
connectors with open framework.
(8) Casings, radiators, spare parts processed by precision metal, engineering
plastic module, precise machinery components used in IT products, Bare System
and consuming electronic products.
(9) Assembly and processing of memory card
(10) Broadband communications, wireless mobile communications and end-to-end
communication products
(11) Ethernet switch and wireless network products
(b) Operational proportion
100% of the products are 3C electronics (Computer, Communication, Consumer
Electronics). The output and sales volume of recent two years can be found in the
Production and Sales Table.
(2) Technology and R&D
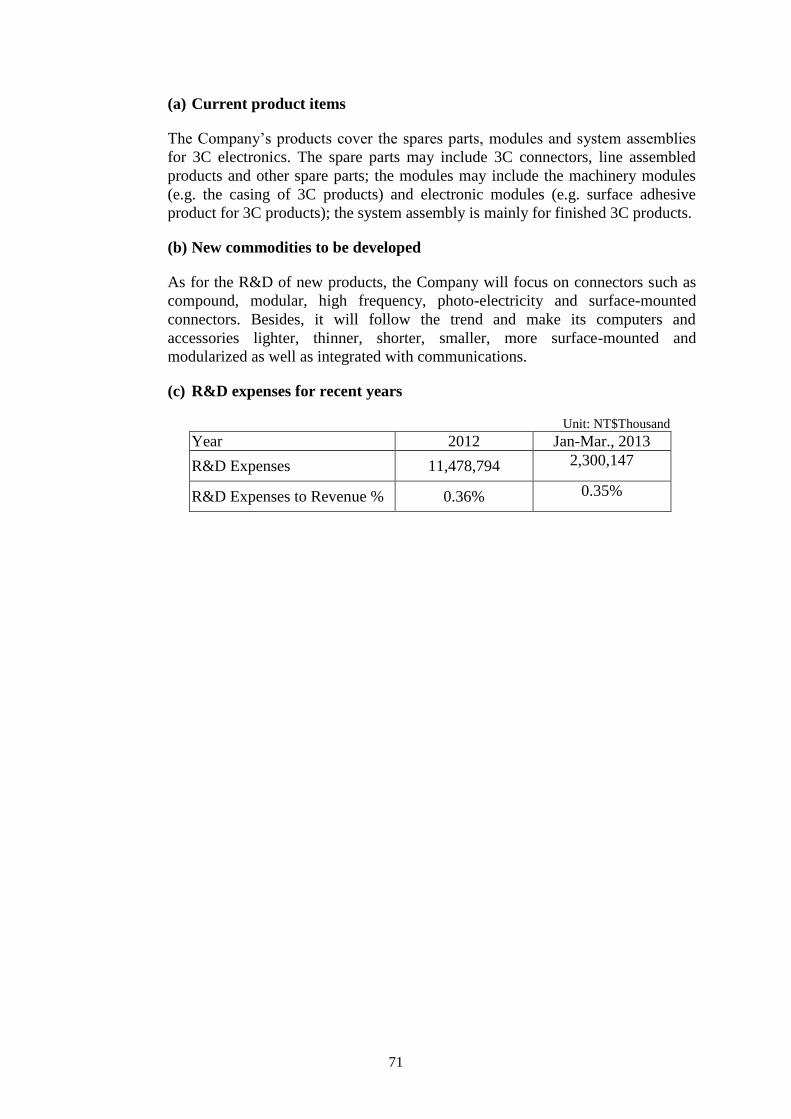
71
(a) Current product items
The Company’s products cover the spares parts, modules and system assemblies
for 3C electronics. The spare parts may include 3C connectors, line assembled
products and other spare parts; the modules may include the machinery modules
(e.g. the casing of 3C products) and electronic modules (e.g. surface adhesive
product for 3C products); the system assembly is mainly for finished 3C products.
(b) New commodities to be developed
As for the R&D of new products, the Company will focus on connectors such as
compound, modular, high frequency, photo-electricity and surface-mounted
connectors. Besides, it will follow the trend and make its computers and
accessories lighter, thinner, shorter, smaller, more surface-mounted and
modularized as well as integrated with communications.
(c) R&D expenses for recent years
Unit: NT$Thousand
Year 2012 Jan-Mar., 2013
R&D Expenses 11,478,794 2,300,147
R&D Expenses to Revenue % 0.36% 0.35%
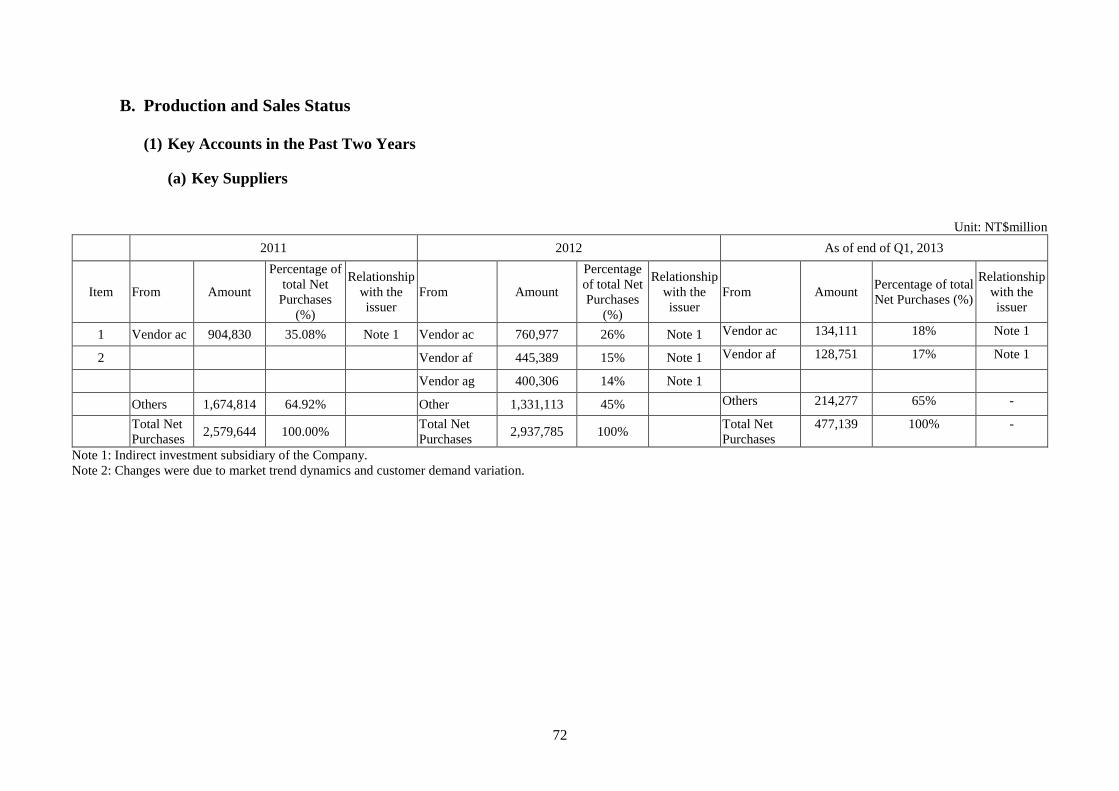
72
B. Production and Sales Status
(1) Key Accounts in the Past Two Years
(a) Key Suppliers
Unit: NT$million
2011 2012 As of end of Q1, 2013
Item From Amount
Percentage of
total Net
Purchases
(%)
Relationship
with the
issuer
From Amount
Percentage
of total Net
Purchases
(%)
Relationship
with the
issuer
From Amount Percentage of total
Net Purchases (%)
Relationship
with the
issuer
1 Vendor ac 904,830 35.08% Note 1 Vendor ac 760,977 26% Note 1 Vendor ac 134,111 18% Note 1
2 Vendor af 445,389 15% Note 1 Vendor af 128,751 17% Note 1
Vendor ag 400,306 14% Note 1
Others 1,674,814 64.92% Other 1,331,113 45% Others 214,277 65% -
Total Net
Purchases 2,579,644 100.00%
Total Net
Purchases 2,937,785 100%
Total Net
Purchases
477,139 100% -
Note 1: Indirect investment subsidiary of the Company.
Note 2: Changes were due to market trend dynamics and customer demand variation.
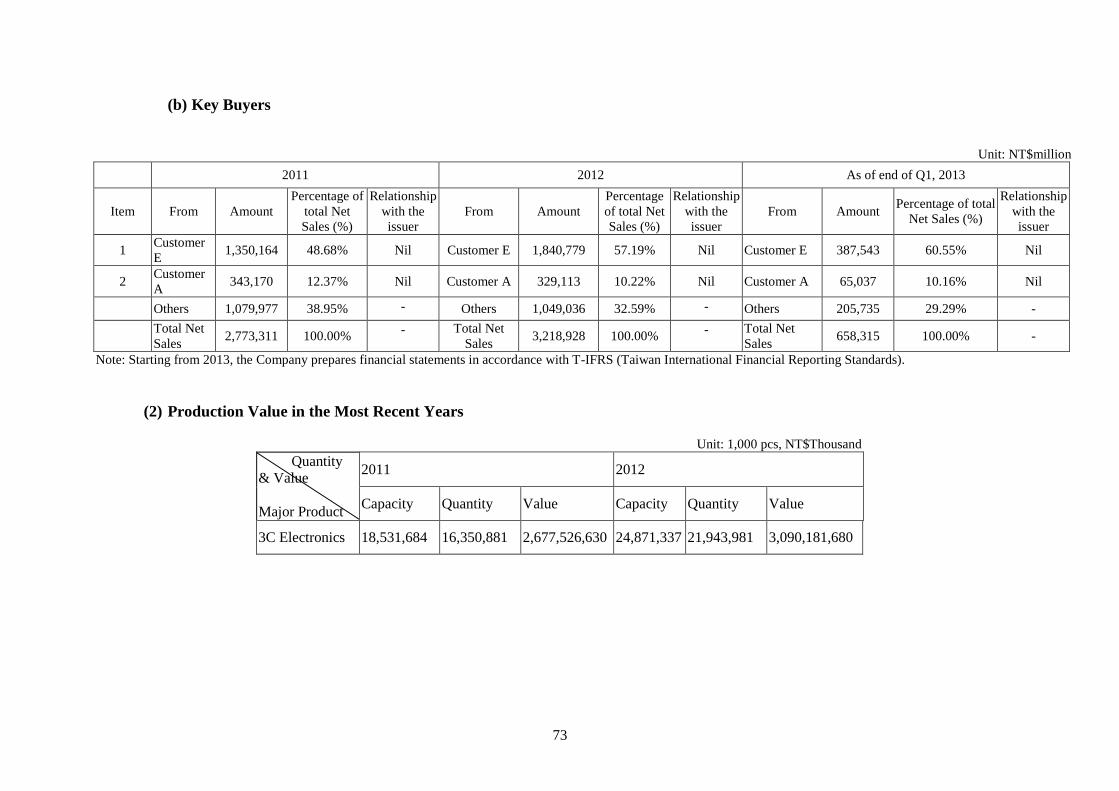
73
(b) Key Buyers
Unit: NT$million
2011 2012 As of end of Q1, 2013
Item From Amount
Percentage of
total Net
Sales (%)
Relationship
with the
issuer
From Amount
Percentage
of total Net
Sales (%)
Relationship
with the
issuer
From Amount Percentage of total
Net Sales (%)
Relationship
with the
issuer
1 Customer
E 1,350,164 48.68% Nil Customer E 1,840,779 57.19% Nil Customer E 387,543 60.55% Nil
2 Customer
A 343,170 12.37% Nil Customer A 329,113 10.22% Nil Customer A 65,037 10.16% Nil
Others 1,079,977 38.95% - Others 1,049,036 32.59% - Others 205,735 29.29% -
Total Net
Sales 2,773,311 100.00% - Total Net
Sales 3,218,928 100.00% - Total Net
Sales 658,315 100.00% -
Note: Starting from 2013, the Company prepares financial statements in accordance with T-IFRS (Taiwan International Financial Reporting Standards).
(2) Production Value in the Most Recent Years
Unit: 1,000 pcs, NT$Thousand
Quantity
& Value
Major Product
2011 2012
Capacity Quantity Value Capacity Quantity Value
3C Electronics 18,531,684 16,350,881 2,677,526,630 24,871,337 21,943,981 3,090,181,680
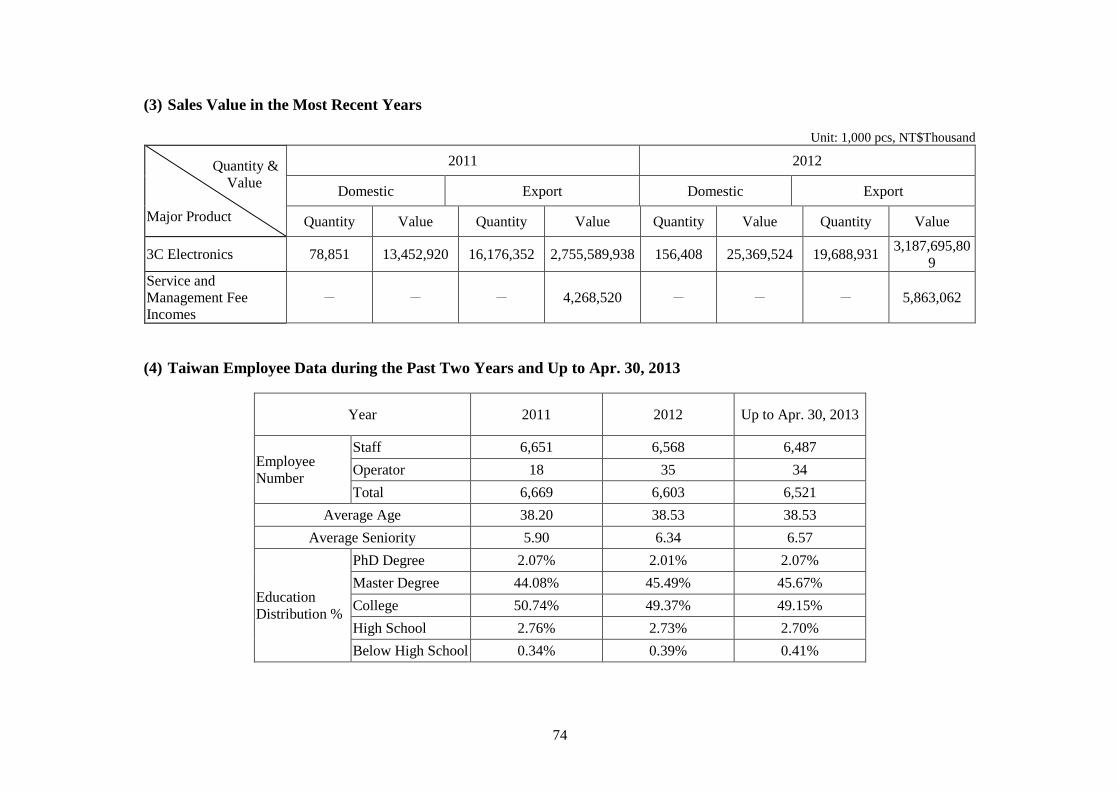
74
(3) Sales Value in the Most Recent Years
Unit: 1,000 pcs, NT$Thousand
Quantity &
Value
Major Product
2011 2012
Domestic Export Domestic Export
Quantity Value Quantity Value Quantity Value Quantity Value
3C Electronics 78,851 13,452,920 16,176,352 2,755,589,938 156,408 25,369,524 19,688,931 3,187,695,80
9
Service and
Management Fee
Incomes
- - - 4,268,520 - - - 5,863,062
(4) Taiwan Employee Data during the Past Two Years and Up to Apr. 30, 2013
Year 2011 2012 Up to Apr. 30, 2013
Employee
Number
Staff 6,651 6,568 6,487
Operator 18 35 34
Total 6,669 6,603 6,521
Average Age 38.20 38.53 38.53
Average Seniority 5.90 6.34 6.57
Education
Distribution %
PhD Degree 2.07% 2.01% 2.07%
Master Degree 44.08% 45.49% 45.67%
College 50.74% 49.37% 49.15%
High School 2.76% 2.73% 2.70%
Below High School 0.34% 0.39% 0.41%
75
C. Information on Environmental Protection Costs
(1) The loss caused by environmental pollution during the latest year and up to
the printing date of this Annual Report:
None
(2)
(a) The main workshops and production facilities of the Company are located in
Tucheng Industrial Park or Hsinchu Science Park. The Company takes
environmental protection as its priority, and carries out immediate correction
once discovering any problem. Besides, it also makes inspection on the
existing preventive facilities. Apart from creating a good working and living
environment for its employees and the neighborhood, it strictly complies with
the discharge standard. For the pollution and wastes generated in the
production process, the Company takes the following steps to protect the
environment:
(1) Prevention of water pollution: set up wastewater treatment plants and
water quality analysis laboratory in Tucheng factory. Chemical method is
applied in wastewater treatment, in which pollutants are rid from wastewater
and discharged through discharge outlets The lab has various instruments to
measure temperature, PH value, chemical oxygen demand and suspended solid
and analyze heavy metal, so that daily inspection on discharging water can be
made and water discharge can be well controlled. The Company’s factories in
Huyue, Minsheng and Hsinchu all received a letter on permit to connect
wastewater (or sewage) to the sewer system, under the reference of TFZ No.
1015060021, 0955060439 and YLZ No.0960021733 respectively.
(2) Prevention of stationary pollution source: waste gas is collected by
extraction pipes, and released to the air after the pollutants are removed
through the wet scrubber. Every year, the Company authorizes other
companies to detect the viscosity of pollutants in exhaust gas and report the
result to the component department of environmental protection. The
Company obtained the Operating Permit of Stationary Pollution Source in
1998 and extended it in June 2008. The permit No. is: BXCZD No. F0447-02.
(3) Cleaning of wastes: Works are done in accordance with the Waste
Cleaning Plan, and the disposal of waste is reported online in a legal way, and
wastes are legally cleaned and recycled.
(4) Management on toxic chemicals: Toxic chemicals are stored separately
and strictly controlled. Moreover, documents on use and inspection are
obtained legally, and periodically reported to the component department of
environmental protection.
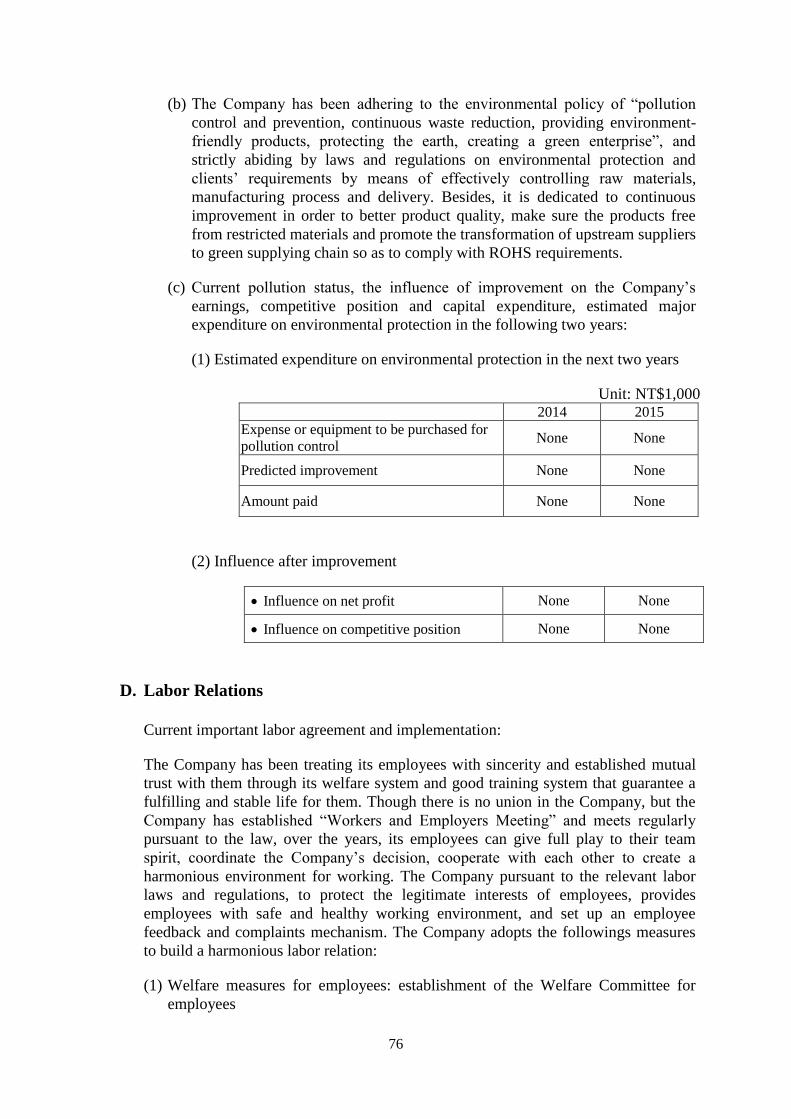
76
(b) The Company has been adhering to the environmental policy of “pollution
control and prevention, continuous waste reduction, providing environment-
friendly products, protecting the earth, creating a green enterprise”, and
strictly abiding by laws and regulations on environmental protection and
clients’ requirements by means of effectively controlling raw materials,
manufacturing process and delivery. Besides, it is dedicated to continuous
improvement in order to better product quality, make sure the products free
from restricted materials and promote the transformation of upstream suppliers
to green supplying chain so as to comply with ROHS requirements.
(c) Current pollution status, the influence of improvement on the Company’s
earnings, competitive position and capital expenditure, estimated major
expenditure on environmental protection in the following two years:
(1) Estimated expenditure on environmental protection in the next two years
Unit: NT$1,000 2014 2015
Expense or equipment to be purchased for
pollution control None None
Predicted improvement None None
Amount paid None None
(2) Influence after improvement
Influence on net profit None None
Influence on competitive position None None
D. Labor Relations
Current important labor agreement and implementation:
The Company has been treating its employees with sincerity and established mutual
trust with them through its welfare system and good training system that guarantee a
fulfilling and stable life for them. Though there is no union in the Company, but the
Company has established “Workers and Employers Meeting” and meets regularly
pursuant to the law, over the years, its employees can give full play to their team
spirit, coordinate the Company’s decision, cooperate with each other to create a
harmonious environment for working. The Company pursuant to the relevant labor
laws and regulations, to protect the legitimate interests of employees, provides
employees with safe and healthy working environment, and set up an employee
feedback and complaints mechanism. The Company adopts the followings measures
to build a harmonious labor relation:
(1) Welfare measures for employees: establishment of the Welfare Committee for
employees
77
Founded in April 1985, the Welfare Committee is composed of 13 members,
including 4 appointed by the employer and 9 by employees. The committee
members are re-elected every three years, and there are dedicated members
appointed to deal with the routine administrative works of the Committee. At
present, the welfares proposed by the Welfare Committee are as follows:
(a) Food allowance;
(b) Birthday gift (cash or other present);
(c) Lucky draw during get-togethers;
(d) Assistance to employees in club activities and entertainment (build fitness
rooms and hand out books);
(e) Consultancy on health and medical care;
(f) Compassionate visit for funerals;
(g) Care for the life of employees living inside and outside the Company;
(h) Cash gift for wedding and childbirth;
(i) Training allowance;
(j) Group insurance.
(2) Career Development and Training for Employees
Training is one of the basic welfares enjoyed by the Company’s employees. The
Company encourages its employees to “study in the work and apply what they
have learned in the work”, and takes training as a means to improve employee
quality and their work skills, promote the group performance, facilitate the
realization of its operation target of “long term, stability, development, science
and technology, internationality”. The Company formulated the Method on
Employee Trainings. Based on this, the Company provided 573,818 hours of
trainings in 2012 with the training fees reaching up to NT$33,358,842. The main
content of training includes:
(a) Orientation training for new employees
New employees are guided to familiarize the corporate culture, organization
development, reformation history and working environment.
(b) Technology and Development Committee
With the horizontal integration of the Technology and Development
Committee, employees can join different committees according to their job
characteristics and professional fields. The Technology and Development
Committee has introduced the latest knowledge and technology in various
fields to promote technical exchange among employees and set out a complete
training structure for professional technicians.
78
(c) Development of management talents
The Company has worked out its own training program to develop
management talents at different management level according to their
management needs. The training modes are diversified and colorful.
(d) School of advanced manufacturing and productivity
With the launch of the IE School and the industrial transformation of the
company group, the Company takes advantage of the training management
system and on-line study platform to make the training programs process-
oriented, simplified, standardized, systematized, information-based and
networked.
(e) Lectures on general knowledge
Mainly include the courses covering IE popularity, safety and health, quality
awareness.
(f) Lectures given by celebrities
The Company invites the famous and successful people in various fields to
give lectures in the Company.
(g) Library
The Company has a professional library where there are abundant journals and
books as well as well-equipped reading rooms and audiovisual apparatus.
(3) Code of conduct or ethics
In order to help employees have a better understanding of ethics, rights,
obligations and the code of conduct, the Company hereby works out the relevant
measures and regulations to provide basis for all employees. The relevant
measures are briefed as follows:
(a) Rules on decision-making right and right decentralization: to improve work
efficiency, strengthen the management on right decentralization and
effectively standardize the rights of employees at different levels.
(b) Organizational structure and duties of each departments: definitely regulate
the organizational functions of each unit and the duties of each post.
(c) The Employee Handbook is prepared to help employees understand the
relevant measures and regulations.
(1) Tutoring programs for new employees: to eliminate the new employees’
insecurity towards the new environment and soon familiarize the
working environment and colleagues after reporting for duty, and help
them to get their mind and body ready for work and reduce the turnover
rate within a short period.
79
(2) Code of business ethics: to improve all employees’ behavioral quality,
business ethics and expertise and try to maximize the Company’s benefit
within the legal scope. Every employee has the responsibility to prevent
the Company’s interests from being lost or impaired and is obliged to
maintain the Company’s reputation so as to guarantee its permanent
growth and development.
(3) Employee attendance: strengthen the attendance system to establish a
good working discipline for employees.
(4) Reward and punishment system: Rewards or punishment are given to
employees whose behavior or conduct has brought benefit or loss for the
Company in operation.
(5) Leave-related measures for employees: to provide basis for employees to
take and ask for a leave.
(6) Performance assessment method for employees: employees’ working
achievements and performance are assessed annually as the basis for
salary adjustment, promotion, issuance of bonus and arrangement for
training courses.
(d) Dormitory regulations: to standardize the conducts, rights and obligations of
the employees living in the dormitory.
(4) Working environment and protective measures for employees’ personal safety
(a) The Company continued to maintain the occupational safety and health
management system, passed the certification of SGS Company and obtained
the OHSAS18001 and CNS15506 certificates in 2012.
(b) The Company has formulated the safety and health policy and promised to
achieve the goal of zero injury, zero occupational disease and zero accident so
as to create a best working environment for all employees.
(c) The Company was awarded “Annual Labor Safety and Health institutions ─
Excellent Work Award” of the Labor Department and “Outstanding
institutions Award” & “Professionalism and safety & health personnel
Outstanding Award” of the New Taipei City in July 2012.
(d) Employees’ personal safety
The Company has, according to the Implementation Rules for Public
Institutions on Records of Labor-hour without Occupational Injury , taken part
in the competition of non-occupational injury record during labor-hour and hit
the record of four million and eight hundred thousand labor-hours without
occupational injury.
(e) Environmental health
80
Based on the annual safety and health management plan, the Company
checked the physical and chemical hazardous factors of each department,
worked out the working environment inspection plan inclusive of sampling
strategies. The plan was approved as qualified by Taipei District Public
Prosecutors Office (Taiwan), and the inspection result also complied with the
standard, and was announced in the Safety and Hygiene Committee and
publicized on the Company’s website and relevant bulletin boards.
(f) Education trainings:
The Company provided safety and health trainings to 936 new employees,
1605 regular staff and 93 employees at director level according to its annual
training plan.
(5) Retirement System:
The Company has formulated the retirement and pension plans for employees
according to the Labor Standards Act and the Labor Pension Act. Since January
1987, the Company legally established the Supervisory Committee of Workers’
Retirement Fund, which is re-elected every three years and in charge of checking
the amount, deposit and withdrawal as well as payment of retirement fund so as to
ensure employees’ rights.
(6) Other important agreements: None.
(7) Loss suffered from labor disputes in the latest year and up to the printing date of
this Annual Report:
The Company has no major dispute on labor relation or labor agreement in the
latest year and up to the printing date of this Annual Report.
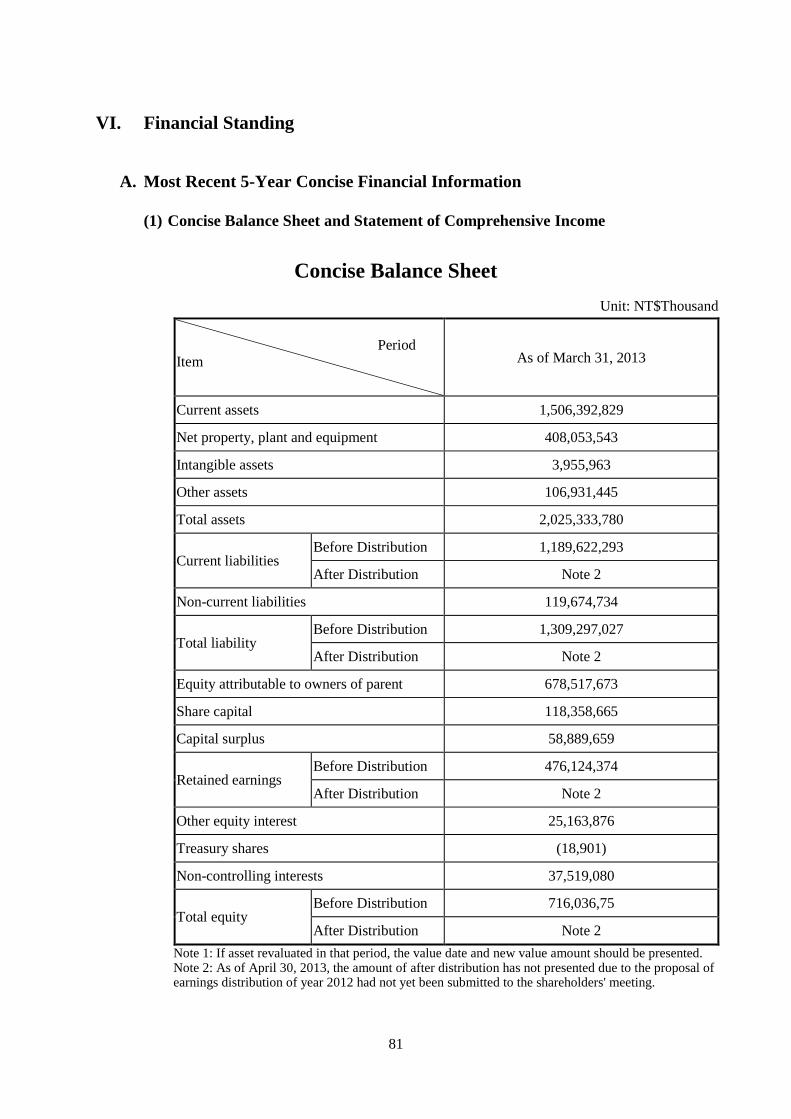
81
VI. Financial Standing
A. Most Recent 5-Year Concise Financial Information
(1) Concise Balance Sheet and Statement of Comprehensive Income
Concise Balance Sheet
Unit: NT$Thousand
Period
Item As of March 31, 2013
Current assets 1,506,392,829
Net property, plant and equipment 408,053,543
Intangible assets 3,955,963
Other assets 106,931,445
Total assets 2,025,333,780
Current liabilities Before Distribution 1,189,622,293
After Distribution Note 2
Non-current liabilities 119,674,734
Total liability Before Distribution 1,309,297,027
After Distribution Note 2
Equity attributable to owners of parent 678,517,673
Share capital 118,358,665
Capital surplus 58,889,659
Retained earnings Before Distribution 476,124,374
After Distribution Note 2
Other equity interest 25,163,876
Treasury shares (18,901)
Non-controlling interests 37,519,080
Total equity Before Distribution 716,036,75
After Distribution Note 2
Note 1: If asset revaluated in that period, the value date and new value amount should be presented. Note 2: As of April 30, 2013, the amount of after distribution has not presented due to the proposal of earnings distribution of year 2012 had not yet been submitted to the shareholders' meeting.
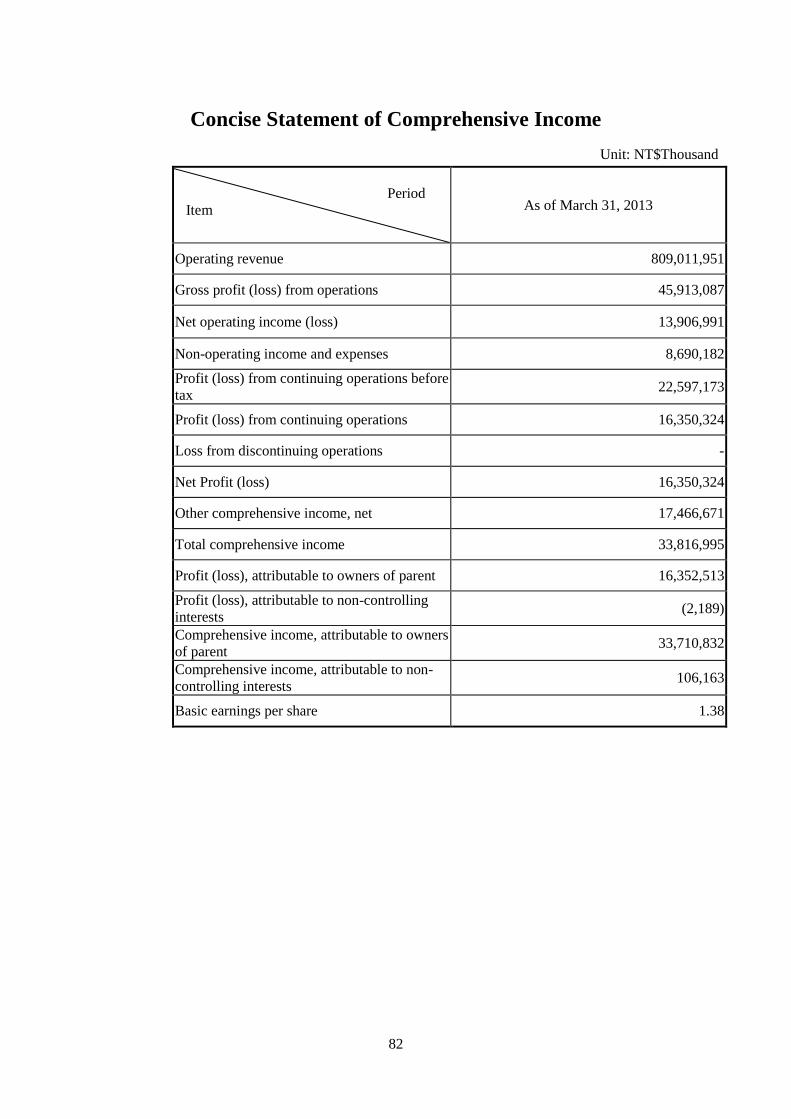
82
Concise Statement of Comprehensive Income
Unit: NT$Thousand
Period
Item As of March 31, 2013
Operating revenue 809,011,951
Gross profit (loss) from operations 45,913,087
Net operating income (loss) 13,906,991
Non-operating income and expenses 8,690,182
Profit (loss) from continuing operations before
tax 22,597,173
Profit (loss) from continuing operations 16,350,324
Loss from discontinuing operations -
Net Profit (loss) 16,350,324
Other comprehensive income, net 17,466,671
Total comprehensive income 33,816,995
Profit (loss), attributable to owners of parent 16,352,513
Profit (loss), attributable to non-controlling
interests (2,189)
Comprehensive income, attributable to owners
of parent 33,710,832
Comprehensive income, attributable to non-
controlling interests 106,163
Basic earnings per share 1.38
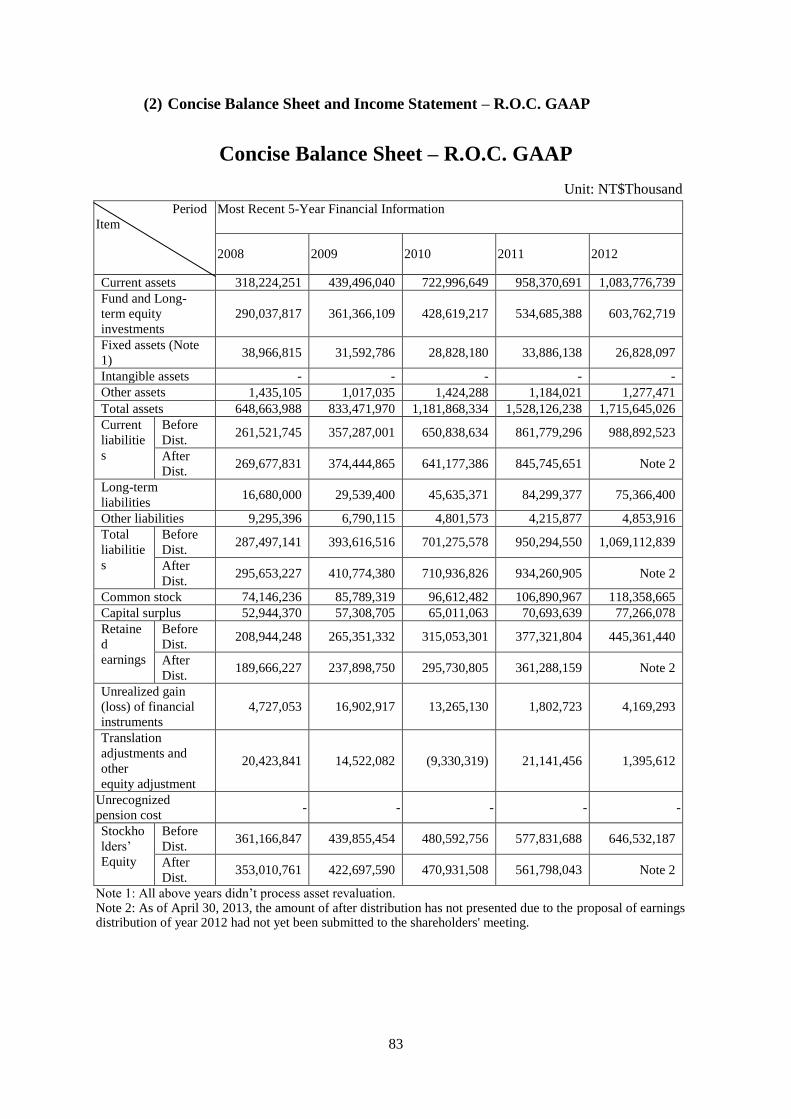
83
(2) Concise Balance Sheet and Income Statement – R.O.C. GAAP
Concise Balance Sheet – R.O.C. GAAP
Unit: NT$Thousand
Period
Item
Most Recent 5-Year Financial Information
2008 2009 2010 2011 2012
Current assets 318,224,251 439,496,040 722,996,649 958,370,691 1,083,776,739
Fund and Long-
term equity
investments
290,037,817 361,366,109 428,619,217 534,685,388 603,762,719
Fixed assets (Note
1) 38,966,815 31,592,786 28,828,180 33,886,138 26,828,097
Intangible assets - - - - -
Other assets 1,435,105 1,017,035 1,424,288 1,184,021 1,277,471
Total assets 648,663,988 833,471,970 1,181,868,334 1,528,126,238 1,715,645,026
Current
liabilitie
s
Before
Dist. 261,521,745 357,287,001 650,838,634 861,779,296 988,892,523
After
Dist. 269,677,831 374,444,865 641,177,386 845,745,651 Note 2
Long-term
liabilities 16,680,000 29,539,400 45,635,371 84,299,377 75,366,400
Other liabilities 9,295,396 6,790,115 4,801,573 4,215,877 4,853,916
Total
liabilitie
s
Before
Dist. 287,497,141 393,616,516 701,275,578 950,294,550 1,069,112,839
After
Dist. 295,653,227 410,774,380 710,936,826 934,260,905 Note 2
Common stock 74,146,236 85,789,319 96,612,482 106,890,967 118,358,665
Capital surplus 52,944,370 57,308,705 65,011,063 70,693,639 77,266,078
Retaine
d
earnings
Before
Dist. 208,944,248 265,351,332 315,053,301 377,321,804 445,361,440
After
Dist. 189,666,227 237,898,750 295,730,805 361,288,159 Note 2
Unrealized gain
(loss) of financial
instruments
4,727,053 16,902,917 13,265,130 1,802,723 4,169,293
Translation
adjustments and
other
equity adjustment
20,423,841 14,522,082 (9,330,319) 21,141,456 1,395,612
Unrecognized
pension cost - - - - -
Stockho
lders’
Equity
Before
Dist. 361,166,847 439,855,454 480,592,756 577,831,688 646,532,187
After
Dist. 353,010,761 422,697,590 470,931,508 561,798,043 Note 2
Note 1: All above years didn’t process asset revaluation. Note 2: As of April 30, 2013, the amount of after distribution has not presented due to the proposal of earnings distribution of year 2012 had not yet been submitted to the shareholders' meeting.
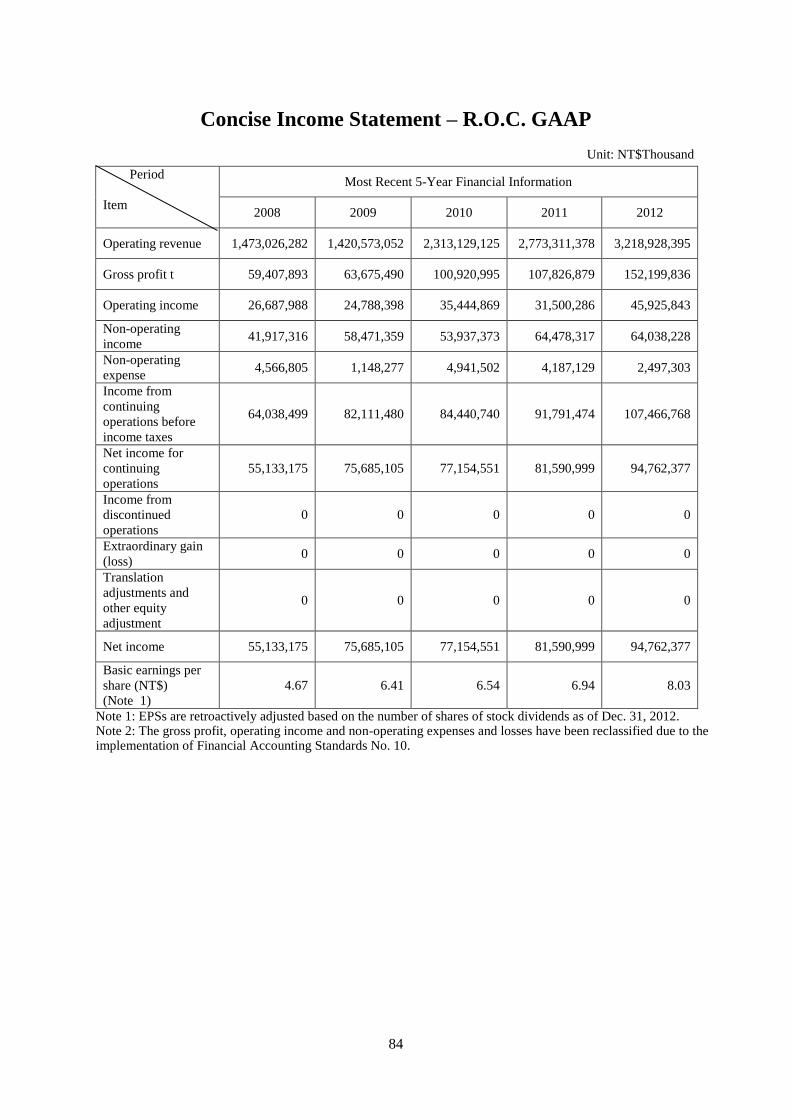
84
Concise Income Statement – R.O.C. GAAP
Unit: NT$Thousand
Period
Item
Most Recent 5-Year Financial Information
2008 2009 2010 2011 2012
Operating revenue 1,473,026,282 1,420,573,052 2,313,129,125 2,773,311,378 3,218,928,395
Gross profit t 59,407,893 63,675,490 100,920,995 107,826,879 152,199,836
Operating income 26,687,988 24,788,398 35,444,869 31,500,286 45,925,843
Non-operating
income 41,917,316 58,471,359 53,937,373 64,478,317 64,038,228
Non-operating
expense 4,566,805 1,148,277 4,941,502 4,187,129 2,497,303
Income from
continuing
operations before
income taxes
64,038,499 82,111,480 84,440,740 91,791,474 107,466,768
Net income for
continuing
operations
55,133,175 75,685,105 77,154,551 81,590,999 94,762,377
Income from
discontinued
operations
0 0 0 0 0
Extraordinary gain
(loss) 0 0 0 0 0
Translation
adjustments and
other equity
adjustment
0 0 0 0 0
Net income 55,133,175 75,685,105 77,154,551 81,590,999 94,762,377
Basic earnings per
share (NT$)
(Note 1)
4.67 6.41 6.54 6.94 8.03
Note 1: EPSs are retroactively adjusted based on the number of shares of stock dividends as of Dec. 31, 2012. Note 2: The gross profit, operating income and non-operating expenses and losses have been reclassified due to the implementation of Financial Accounting Standards No. 10.
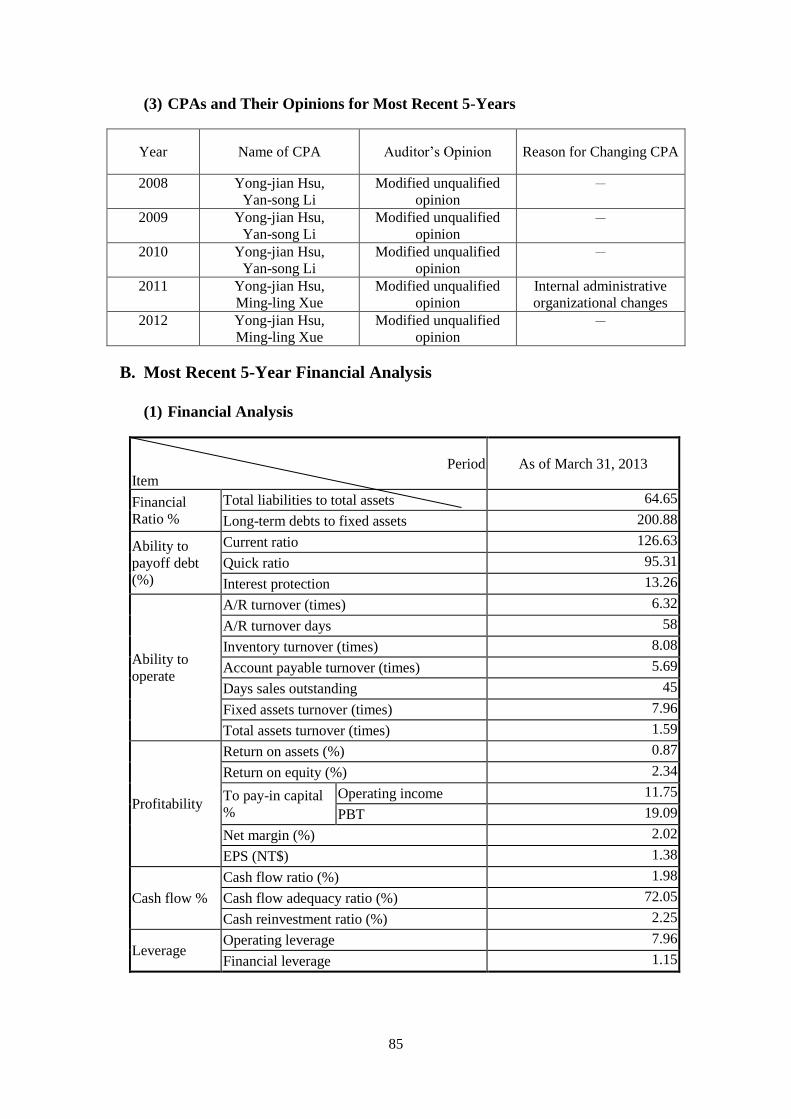
85
(3) CPAs and Their Opinions for Most Recent 5-Years
Year Name of CPA Auditor’s Opinion Reason for Changing CPA
2008 Yong-jian Hsu,
Yan-song Li
Modified unqualified
opinion -
2009 Yong-jian Hsu,
Yan-song Li
Modified unqualified
opinion -
2010 Yong-jian Hsu,
Yan-song Li
Modified unqualified
opinion -
2011 Yong-jian Hsu,
Ming-ling Xue
Modified unqualified
opinion
Internal administrative
organizational changes
2012 Yong-jian Hsu,
Ming-ling Xue
Modified unqualified
opinion -
B. Most Recent 5-Year Financial Analysis
(1) Financial Analysis
Period
Item
As of March 31, 2013
Financial
Ratio %
Total liabilities to total assets 64.65
Long-term debts to fixed assets 200.88
Ability to
payoff debt
(%)
Current ratio 126.63
Quick ratio 95.31
Interest protection 13.26
Ability to
operate
A/R turnover (times) 6.32
A/R turnover days 58
Inventory turnover (times) 8.08
Account payable turnover (times) 5.69
Days sales outstanding 45
Fixed assets turnover (times) 7.96
Total assets turnover (times) 1.59
Profitability
Return on assets (%) 0.87
Return on equity (%) 2.34
To pay-in capital
%
Operating income 11.75
PBT 19.09
Net margin (%) 2.02
EPS (NT$) 1.38
Cash flow %
Cash flow ratio (%) 1.98
Cash flow adequacy ratio (%) 72.05
Cash reinvestment ratio (%) 2.25
Leverage Operating leverage 7.96
Financial leverage 1.15
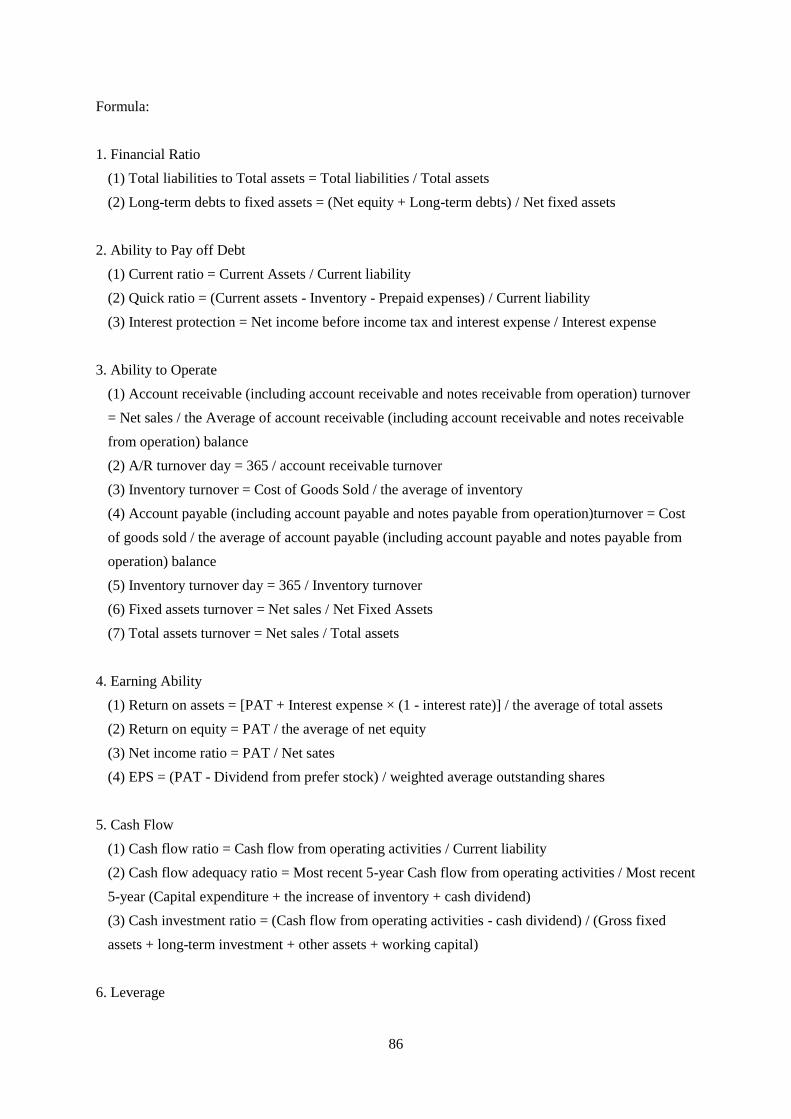
86
Formula:
1. Financial Ratio
(1) Total liabilities to Total assets = Total liabilities / Total assets
(2) Long-term debts to fixed assets = (Net equity + Long-term debts) / Net fixed assets
2. Ability to Pay off Debt
(1) Current ratio = Current Assets / Current liability
(2) Quick ratio = (Current assets - Inventory - Prepaid expenses) / Current liability
(3) Interest protection = Net income before income tax and interest expense / Interest expense
3. Ability to Operate
(1) Account receivable (including account receivable and notes receivable from operation) turnover
= Net sales / the Average of account receivable (including account receivable and notes receivable
from operation) balance
(2) A/R turnover day = 365 / account receivable turnover
(3) Inventory turnover = Cost of Goods Sold / the average of inventory
(4) Account payable (including account payable and notes payable from operation)turnover = Cost
of goods sold / the average of account payable (including account payable and notes payable from
operation) balance
(5) Inventory turnover day = 365 / Inventory turnover
(6) Fixed assets turnover = Net sales / Net Fixed Assets
(7) Total assets turnover = Net sales / Total assets
4. Earning Ability
(1) Return on assets = [PAT + Interest expense × (1 - interest rate)] / the average of total assets
(2) Return on equity = PAT / the average of net equity
(3) Net income ratio = PAT / Net sates
(4) EPS = (PAT - Dividend from prefer stock) / weighted average outstanding shares
5. Cash Flow
(1) Cash flow ratio = Cash flow from operating activities / Current liability
(2) Cash flow adequacy ratio = Most recent 5-year Cash flow from operating activities / Most recent
5-year (Capital expenditure + the increase of inventory + cash dividend)
(3) Cash investment ratio = (Cash flow from operating activities - cash dividend) / (Gross fixed
assets + long-term investment + other assets + working capital)
6. Leverage
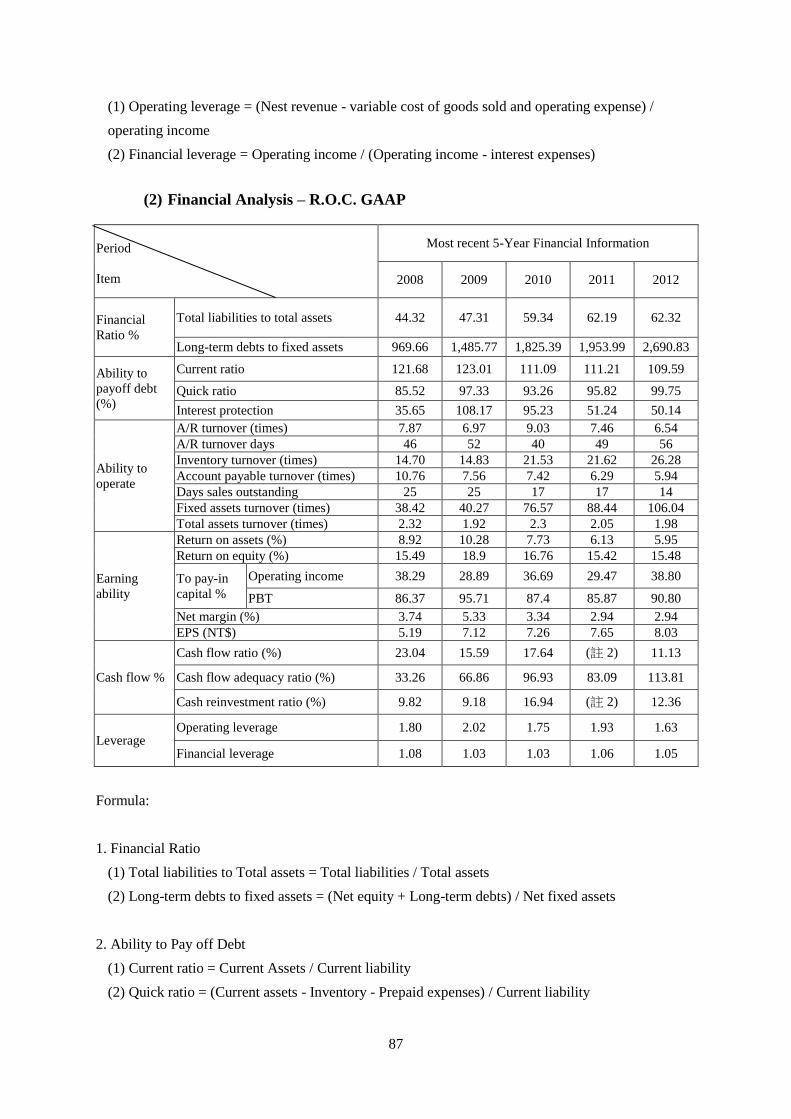
87
(1) Operating leverage = (Nest revenue - variable cost of goods sold and operating expense) /
operating income
(2) Financial leverage = Operating income / (Operating income - interest expenses)
(2) Financial Analysis – R.O.C. GAAP
Period
Item
Most recent 5-Year Financial Information
2008 2009 2010 2011 2012
Financial
Ratio %
Total liabilities to total assets 44.32 47.31 59.34 62.19 62.32
Long-term debts to fixed assets 969.66 1,485.77 1,825.39 1,953.99 2,690.83
Ability to
payoff debt
(%)
Current ratio 121.68 123.01 111.09 111.21 109.59
Quick ratio 85.52 97.33 93.26 95.82 99.75
Interest protection 35.65 108.17 95.23 51.24 50.14
Ability to
operate
A/R turnover (times) 7.87 6.97 9.03 7.46 6.54
A/R turnover days 46 52 40 49 56
Inventory turnover (times) 14.70 14.83 21.53 21.62 26.28
Account payable turnover (times) 10.76 7.56 7.42 6.29 5.94
Days sales outstanding 25 25 17 17 14
Fixed assets turnover (times) 38.42 40.27 76.57 88.44 106.04
Total assets turnover (times) 2.32 1.92 2.3 2.05 1.98
Earning
ability
Return on assets (%) 8.92 10.28 7.73 6.13 5.95
Return on equity (%) 15.49 18.9 16.76 15.42 15.48
To pay-in
capital %
Operating income 38.29 28.89 36.69 29.47 38.80
PBT 86.37 95.71 87.4 85.87 90.80
Net margin (%) 3.74 5.33 3.34 2.94 2.94
EPS (NT$) 5.19 7.12 7.26 7.65 8.03
Cash flow %
Cash flow ratio (%) 23.04 15.59 17.64 (註 2) 11.13
Cash flow adequacy ratio (%) 33.26 66.86 96.93 83.09 113.81
Cash reinvestment ratio (%) 9.82 9.18 16.94 (註 2) 12.36
Leverage Operating leverage 1.80 2.02 1.75 1.93 1.63
Financial leverage 1.08 1.03 1.03 1.06 1.05
Formula:
1. Financial Ratio
(1) Total liabilities to Total assets = Total liabilities / Total assets
(2) Long-term debts to fixed assets = (Net equity + Long-term debts) / Net fixed assets
2. Ability to Pay off Debt
(1) Current ratio = Current Assets / Current liability
(2) Quick ratio = (Current assets - Inventory - Prepaid expenses) / Current liability
88
(3) Interest protection = Net income before income tax and interest expense / Interest expense
3. Ability to Operate
(1) Account receivable (including account receivable and notes receivable from operation) turnover
= Net sales / the Average of account receivable (including account receivable and notes receivable
from operation) balance
(2) A/R turnover day = 365 / account receivable turnover
(3) Inventory turnover = Cost of Goods Sold / the average of inventory
(4) Account payable (including account payable and notes payable from operation)turnover = Cost
of goods sold / the average of account payable (including account payable and notes payable from
operation) balance
(5) Inventory turnover day = 365 / Inventory turnover
(6) Fixed assets turnover = Net sales / Net Fixed Assets
(7) Total assets turnover = Net sales / Total assets
4. Earning Ability
(1) Return on assets = [PAT + Interest expense × (1 - interest rate)] / the average of total assets
(2) Return on equity = PAT / the average of net equity
(3) Net income ratio = PAT / Net sates
(4) EPS = (PAT - Dividend from prefer stock) / weighted average outstanding shares
5. Cash Flow
(1) Cash flow ratio = Cash flow from operating activities / Current liability
(2) Cash flow adequacy ratio = Most recent 5-year Cash flow from operating activities / Most recent
5-year (Capital expenditure + the increase of inventory + cash dividend)
(3) Cash investment ratio = (Cash flow from operating activities - cash dividend) / (Gross fixed
assets + long-term investment + other assets + working capital)
6. Leverage
(1) Operating leverage = (Nest revenue - variable cost of goods sold and operating expense) /
operating income
(2) Financial leverage = Operating income / (Operating income - interest expenses)
89
C. Audit Report by Supervisors
The Board reports the financial statement, business report, and earnings distribution proposal
of 2012, and financial statement have been audited by PricewaterhouseCoopers Taiwan. The
financial statements, business report and earnings distribution proposal have been audited by
us as Supervisors of the Company. We deem no inappropriateness on these documents.
Pursuant to Article 219 of the Company Act, we hereby present the audited report. Please
review.
Submitted to:
2013 Regular Shareholders’ Meeting of the Company
Hon Hai Precision Industry Co., Ltd.
Supervisor: Huang, Qing-yuan
On the Date of May 16, 2013
90
Audit Report by Supervisors
The Board reports the financial statement, business report, and earnings distribution proposal
of 2012, and financial statement have been audited by PricewaterhouseCoopers Taiwan. The
financial statements, business report and earnings distribution proposal have been audited by
us as Supervisors of the Company. We deem no inappropriateness on these documents.
Pursuant to Article 219 of the Company Act, we hereby present the audited report. Please
review.
Submitted to:
2013 Regular Shareholders’ Meeting of the Company
Hon Hai Precision Industry Co., Ltd.
Supervisor: Fu-Rui International Investment Co., Ltd.
Representative: Wan, Jui-hsia
On the Date of May 16, 2013
91
D. 2012 Financial Statements Consolidated With Subsidiaries Audited by
CPA
HON HAI PRECISION INDUSTRY CO., LTD.
AND SUBSIDIARIES
CONSOLIDATED FINANCIAL STATEMENTS AND
REPORT OF INDEPENDENT ACCOUNTANTS
DECEMBER 31, 2011 AND 2012
For the convenience of readers and for information purpose only, the auditors’ report and the accompanying
financial statements have been translated into English from the original Chinese version prepared and used in
the Republic of China. In the event of any discrepancy between the English version and the original Chinese
version or any differences in the interpretation of the two versions, the Chinese-language auditors’ report and
financial statements shall prevail.
92
REPORT OF INDEPENDENT ACCOUNTANTS TRANSLATED FROM CHINESE
To the Board of Directors and Stockholders:
Hon Hai Precision Industry Co., Ltd.
We have audited the accompanying consolidated balance sheets of Hon Hai Precision
Industry Co., Ltd. and its subsidiaries as of December 31, 2011 and 2012, and the
related consolidated statements of income, of changes in stockholders’ equity and of
cash flows for the years then ended, expressed in thousands of New Taiwan dollars.
These financial statements are the responsibility of the Company’s management. Our
responsibility is to express an opinion on these financial statements based on our audits.
We did not audit the financial statements of certain consolidated subsidiaries which
statements reflect total assets of $245,803,235,000 and $147,874,948,000, constituting
14.21% and 7.23% of the consolidated total assets as of December 31, 2011 and 2012,
respectively, and total revenues of $405,044,774,000 and $154,940,895,000, constituting
11.73% and 3.97% of the consolidated total operating revenues for the years then ended,
respectively. Those statements were audited by other auditors, whose reports thereon
have been furnished to us, and our opinion expressed herein, insofar as it relates to the
amounts included for these subsidiaries, is based solely on the reports of the other
auditors.
We conducted our audits in accordance with the “Rules Governing the Examination of
Financial Statements by Certified Public Accountants” and generally accepted auditing
standards in the Republic of China. Those standards require that we plan and perform
the audit to obtain reasonable assurance about whether the financial statements are free
of material misstatement. An audit includes examining, on a test basis, evidence
supporting the amounts and disclosures in the financial statements. An audit also
includes assessing the accounting principles used and significant estimates made by
management, as well as evaluating the overall financial statement presentation. We
believe that our audits and the reports of other auditors provide a reasonable basis for
our opinion.
In our opinion, based on our audits and the reports of other auditors, the consolidated
financial statements referred to above present fairly, in all material respects, the
financial position of Hon Hai Precision Industry Co., Ltd. and its subsidiaries as of
December 31, 2011 and 2012, and the results of their operations and their cash flows
for the years then ended in conformity with the “Rules Governing the Preparation of
Financial Statements by Securities Issuers” and generally accepted accounting
principles in the Republic of China.
93
Hon Hai Precision Industry Co., Ltd. adopts International Financial Reporting
Standards, International Accounting Standards, and relevant interpretations and
interpretative bulletins (IFRSs) that are ratified by the Former Financial Supervisory
Commission, Executive Yuan, R.O.C. (FSC) in the preparation of its financial
statements effective January 1, 2013. Information relating to the adoption of IFRSs is
disclosed in Note 13 under the requirements of Jin-Guan-Zheng-Shen-Zi Order No.
0990004943 of FSC, dated February 2, 2010. The IFRSs may be subject to changes
during the time of transition; therefore, the actual impact of IFRSs adoption on Hon Hai
Precision Industry Co., Ltd. may also change
PricewaterhouseCoopers, Taiwan
March 28, 2013
‐‐‐‐‐‐‐‐‐‐‐‐‐‐‐‐‐‐‐‐‐‐‐‐‐‐‐‐‐‐‐‐‐‐‐‐‐‐‐‐‐‐‐‐‐‐‐
The accompanying consolidated financial statements are not intended to present the financial
position and results of operations and cash flows in accordance with accounting principles
generally accepted in countries and jurisdictions other than the Republic of China. The
standards, procedures and practices in the Republic of China governing the audit of such
financial statements may differ from those generally accepted in countries and jurisdictions
other than the Republic of China. Accordingly, the accompanying consolidated financial
statements and report of independent accountants are not intended for use by those who are not
informed about the accounting principles or auditing standards generally accepted in the
Republic of China, and their applications in practice. As the financial statements are the responsibility of the management, PricewaterhouseCoopers cannot accept any liability for the use of, or reliance on, the English translation or for any errors or misunderstandings that may derive from the translation.
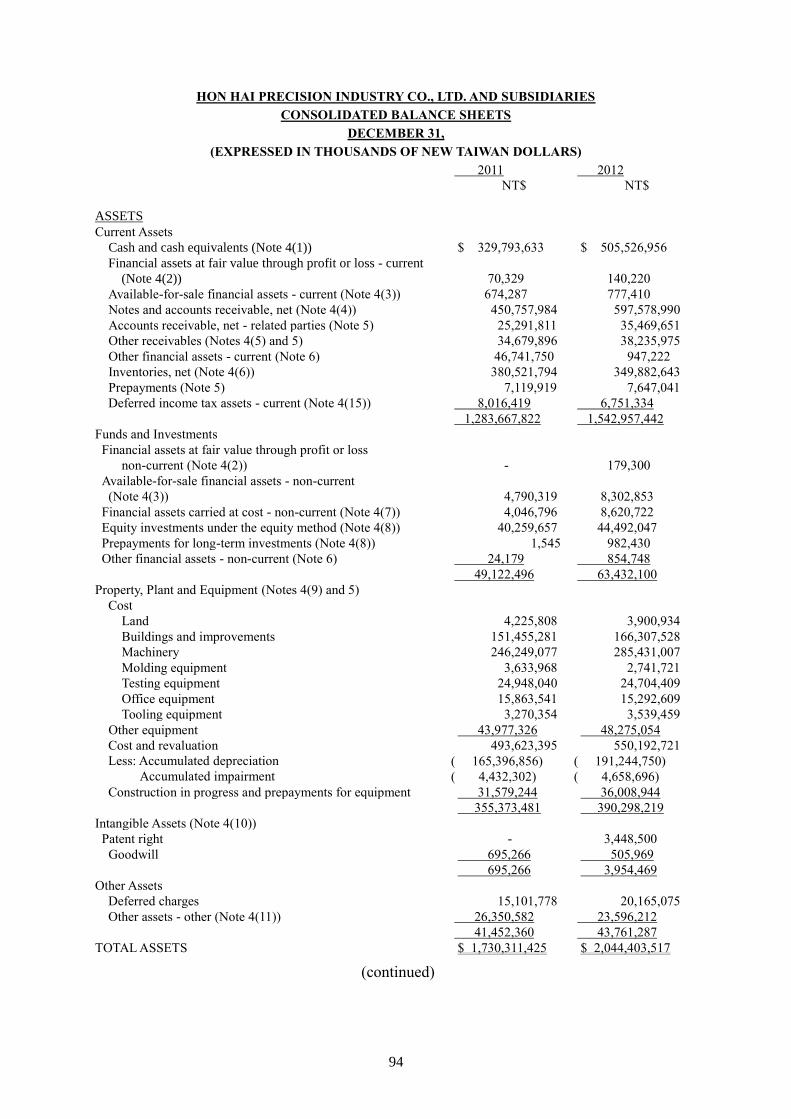
94
HON HAI PRECISION INDUSTRY CO., LTD. AND SUBSIDIARIES
CONSOLIDATED BALANCE SHEETS
DECEMBER 31,
(EXPRESSED IN THOUSANDS OF NEW TAIWAN DOLLARS)
2011 2012
NT$ NT$
ASSETS
Current Assets
Cash and cash equivalents (Note 4(1)) $ 329,793,633 $ 505,526,956
Financial assets at fair value through profit or loss - current
(Note 4(2)) 70,329 140,220
Available-for-sale financial assets - current (Note 4(3)) 674,287 777,410
Notes and accounts receivable, net (Note 4(4)) 450,757,984 597,578,990
Accounts receivable, net - related parties (Note 5) 25,291,811 35,469,651
Other receivables (Notes 4(5) and 5) 34,679,896 38,235,975
Other financial assets - current (Note 6) 46,741,750 947,222
Inventories, net (Note 4(6)) 380,521,794 349,882,643
Prepayments (Note 5) 7,119,919 7,647,041
Deferred income tax assets - current (Note 4(15)) 8,016,419 6,751,334
1,283,667,822 1,542,957,442
Funds and Investments
Financial assets at fair value through profit or loss
non-current (Note 4(2)) - 179,300
Available-for-sale financial assets - non-current
(Note 4(3)) 4,790,319 8,302,853
Financial assets carried at cost - non-current (Note 4(7)) 4,046,796 8,620,722
Equity investments under the equity method (Note 4(8)) 40,259,657 44,492,047
Prepayments for long-term investments (Note 4(8)) 1,545 982,430
Other financial assets - non-current (Note 6) 24,179 854,748
49,122,496 63,432,100
Property, Plant and Equipment (Notes 4(9) and 5)
Cost
Land 4,225,808 3,900,934
Buildings and improvements 151,455,281 166,307,528
Machinery 246,249,077 285,431,007
Molding equipment 3,633,968 2,741,721
Testing equipment 24,948,040 24,704,409
Office equipment 15,863,541 15,292,609
Tooling equipment 3,270,354 3,539,459
Other equipment 43,977,326 48,275,054
Cost and revaluation 493,623,395 550,192,721
Less: Accumulated depreciation ( 165,396,856) ( 191,244,750)
Accumulated impairment ( 4,432,302) ( 4,658,696)
Construction in progress and prepayments for equipment 31,579,244 36,008,944
355,373,481 390,298,219
Intangible Assets (Note 4(10))
Patent right - 3,448,500
Goodwill 695,266 505,969
695,266 3,954,469
Other Assets
Deferred charges 15,101,778 20,165,075
Other assets - other (Note 4(11)) 26,350,582 23,596,212
41,452,360 43,761,287
TOTAL ASSETS $ 1,730,311,425 $ 2,044,403,517
(continued)
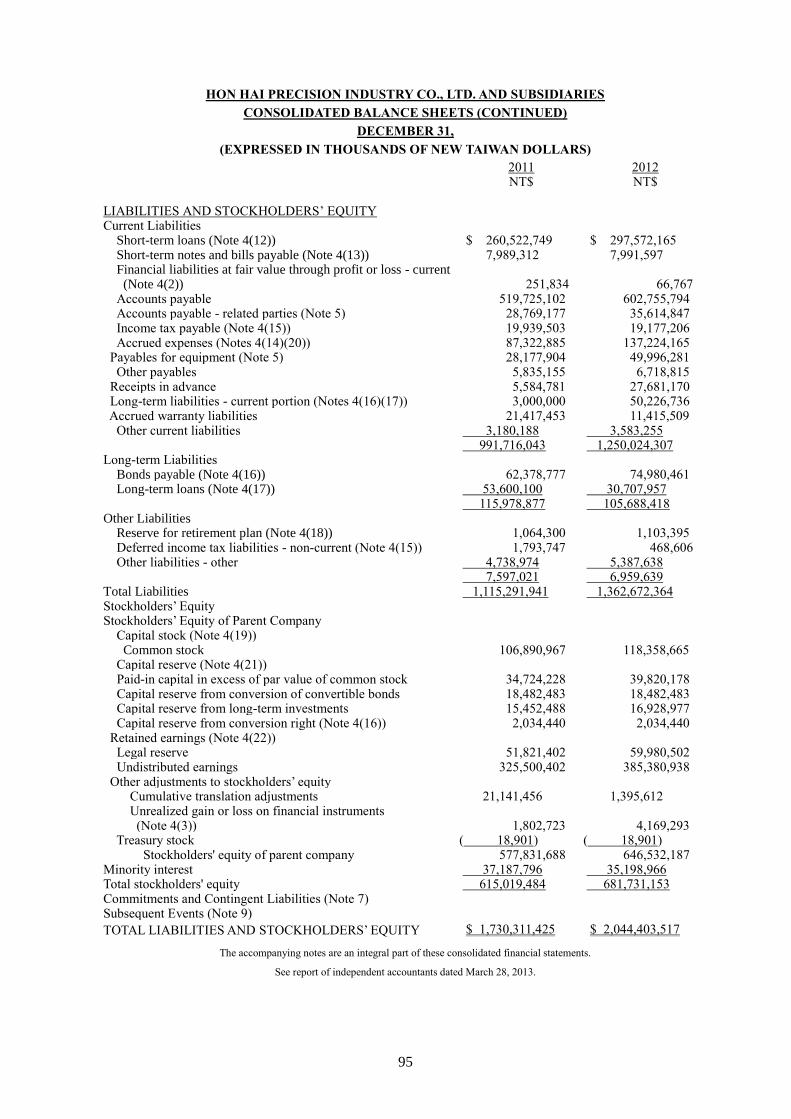
95
HON HAI PRECISION INDUSTRY CO., LTD. AND SUBSIDIARIES
CONSOLIDATED BALANCE SHEETS (CONTINUED)
DECEMBER 31,
(EXPRESSED IN THOUSANDS OF NEW TAIWAN DOLLARS)
2011 2012 NT$ NT$ LIABILITIES AND STOCKHOLDERS’ EQUITY Current Liabilities Short-term loans (Note 4(12)) $ 260,522,749 $ 297,572,165
Short-term notes and bills payable (Note 4(13)) 7,989,312 7,991,597 Financial liabilities at fair value through profit or loss - current
(Note 4(2)) 251,834 66,767 Accounts payable 519,725,102 602,755,794 Accounts payable - related parties (Note 5) 28,769,177 35,614,847 Income tax payable (Note 4(15)) 19,939,503 19,177,206 Accrued expenses (Notes 4(14)(20)) 87,322,885 137,224,165 Payables for equipment (Note 5) 28,177,904 49,996,281 Other payables 5,835,155 6,718,815 Receipts in advance 5,584,781 27,681,170 Long-term liabilities - current portion (Notes 4(16)(17)) 3,000,000 50,226,736 Accrued warranty liabilities 21,417,453 11,415,509 Other current liabilities 3,180,188 3,583,255
991,716,043 1,250,024,307 Long-term Liabilities Bonds payable (Note 4(16)) 62,378,777 74,980,461 Long-term loans (Note 4(17)) 53,600,100 30,707,957 115,978,877 105,688,418 Other Liabilities Reserve for retirement plan (Note 4(18)) 1,064,300 1,103,395 Deferred income tax liabilities - non-current (Note 4(15)) 1,793,747 468,606 Other liabilities - other 4,738,974 5,387,638
7,597,021 6,959,639 Total Liabilities 1,115,291,941 1,362,672,364 Stockholders’ Equity Stockholders’ Equity of Parent Company Capital stock (Note 4(19))
Common stock 106,890,967 118,358,665 Capital reserve (Note 4(21)) Paid-in capital in excess of par value of common stock 34,724,228 39,820,178 Capital reserve from conversion of convertible bonds 18,482,483 18,482,483 Capital reserve from long-term investments 15,452,488 16,928,977 Capital reserve from conversion right (Note 4(16)) 2,034,440 2,034,440 Retained earnings (Note 4(22)) Legal reserve 51,821,402 59,980,502 Undistributed earnings 325,500,402 385,380,938 Other adjustments to stockholders’ equity
Cumulative translation adjustments 21,141,456 1,395,612 Unrealized gain or loss on financial instruments (Note 4(3)) 1,802,723 4,169,293
Treasury stock ( 18,901) ( 18,901) Stockholders' equity of parent company 577,831,688 646,532,187
Minority interest 37,187,796 35,198,966 Total stockholders' equity 615,019,484 681,731,153 Commitments and Contingent Liabilities (Note 7) Subsequent Events (Note 9)
TOTAL LIABILITIES AND STOCKHOLDERS’ EQUITY $ 1,730,311,425 $ 2,044,403,517
The accompanying notes are an integral part of these consolidated financial statements.
See report of independent accountants dated March 28, 2013.
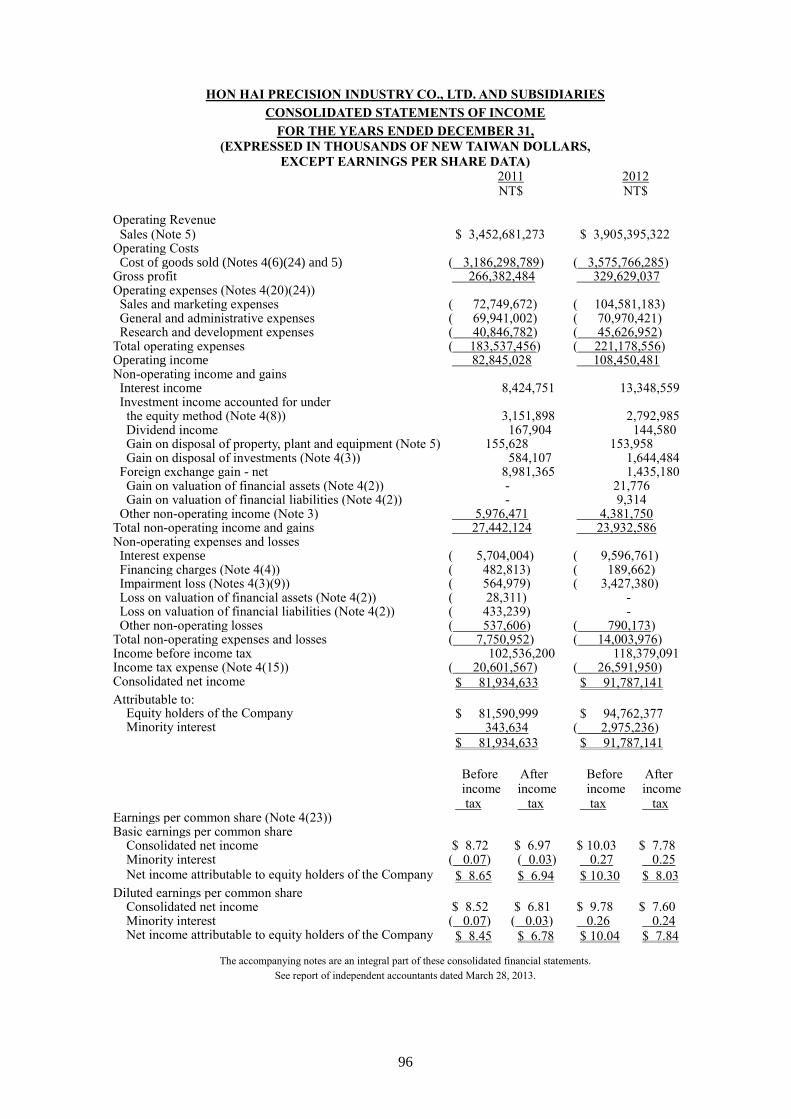
96
HON HAI PRECISION INDUSTRY CO., LTD. AND SUBSIDIARIES
CONSOLIDATED STATEMENTS OF INCOME
FOR THE YEARS ENDED DECEMBER 31,
(EXPRESSED IN THOUSANDS OF NEW TAIWAN DOLLARS,
EXCEPT EARNINGS PER SHARE DATA) 2011 2012 NT$ NT$ Operating Revenue Sales (Note 5) $ 3,452,681,273 $ 3,905,395,322 Operating Costs Cost of goods sold (Notes 4(6)(24) and 5) ( 3,186,298,789) ( 3,575,766,285) Gross profit 266,382,484 329,629,037 Operating expenses (Notes 4(20)(24)) Sales and marketing expenses ( 72,749,672) ( 104,581,183) General and administrative expenses ( 69,941,002) ( 70,970,421) Research and development expenses ( 40,846,782) ( 45,626,952) Total operating expenses ( 183,537,456) ( 221,178,556) Operating income 82,845,028 108,450,481 Non-operating income and gains Interest income 8,424,751 13,348,559 Investment income accounted for under the equity method (Note 4(8)) 3,151,898 2,792,985
Dividend income 167,904 144,580 Gain on disposal of property, plant and equipment (Note 5) 155,628 153,958 Gain on disposal of investments (Note 4(3)) 584,107 1,644,484
Foreign exchange gain - net 8,981,365 1,435,180 Gain on valuation of financial assets (Note 4(2)) - 21,776 Gain on valuation of financial liabilities (Note 4(2)) - 9,314
Other non-operating income (Note 3) 5,976,471 4,381,750 Total non-operating income and gains 27,442,124 23,932,586 Non-operating expenses and losses Interest expense ( 5,704,004) ( 9,596,761) Financing charges (Note 4(4)) ( 482,813) ( 189,662) Impairment loss (Notes 4(3)(9)) ( 564,979) ( 3,427,380) Loss on valuation of financial assets (Note 4(2)) ( 28,311) - Loss on valuation of financial liabilities (Note 4(2)) ( 433,239) - Other non-operating losses ( 537,606) ( 790,173) Total non-operating expenses and losses ( 7,750,952) ( 14,003,976) Income before income tax 102,536,200 118,379,091 Income tax expense (Note 4(15)) ( 20,601,567) ( 26,591,950) Consolidated net income $ 81,934,633 $ 91,787,141
Attributable to: Equity holders of the Company $ 81,590,999 $ 94,762,377 Minority interest 343,634 ( 2,975,236) $ 81,934,633 $ 91,787,141
Before
income tax
After income
tax
Before income
tax
After income
tax Earnings per common share (Note 4(23)) Basic earnings per common share
Consolidated net income $ 8.72 $ 6.97 $ 10.03 $ 7.78 Minority interest ( 0.07) ( 0.03) 0.27 0.25 Net income attributable to equity holders of the Company $ 8.65 $ 6.94 $ 10.30 $ 8.03
Diluted earnings per common share Consolidated net income $ 8.52 $ 6.81 $ 9.78 $ 7.60 Minority interest ( 0.07) ( 0.03) 0.26 0.24 Net income attributable to equity holders of the Company $ 8.45 $ 6.78 $ 10.04 $ 7.84
The accompanying notes are an integral part of these consolidated financial statements.
See report of independent accountants dated March 28, 2013.
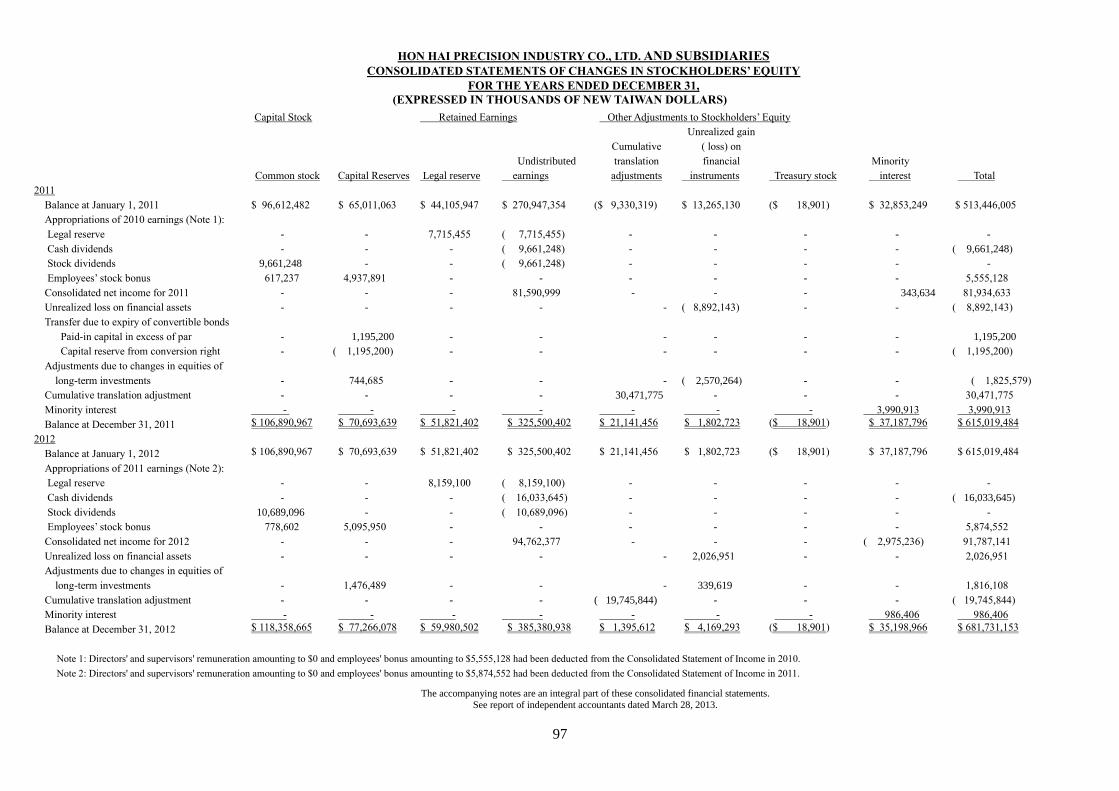
97
HON HAI PRECISION INDUSTRY CO., LTD. AND SUBSIDIARIES
CONSOLIDATED STATEMENTS OF CHANGES IN STOCKHOLDERS’ EQUITY
FOR THE YEARS ENDED DECEMBER 31,
(EXPRESSED IN THOUSANDS OF NEW TAIWAN DOLLARS)
Capital Stock Retained Earnings Other Adjustments to Stockholders’ Equity
Common stock Capital Reserves Legal reserve
Undistributed
earnings
Cumulative
translation
adjustments
Unrealized gain
( loss) on
financial
instruments Treasury stock
Minority
interest Total
2011
Balance at January 1, 2011 $ 96,612,482 $ 65,011,063 $ 44,105,947 $ 270,947,354 ($ 9,330,319) $ 13,265,130 ($ 18,901) $ 32,853,249 $ 513,446,005
Appropriations of 2010 earnings (Note 1):
Legal reserve - - 7,715,455 ( 7,715,455) - - - - -
Cash dividends - - - ( 9,661,248) - - - - ( 9,661,248)
Stock dividends 9,661,248 - - ( 9,661,248) - - - - -
Employees’ stock bonus 617,237 4,937,891 - - - - - - 5,555,128
Consolidated net income for 2011 - - - 81,590,999 - - - 343,634 81,934,633
Unrealized loss on financial assets - - - - - ( 8,892,143) - - ( 8,892,143)
Transfer due to expiry of convertible bonds
Paid-in capital in excess of par - 1,195,200 - - - - - - 1,195,200
Capital reserve from conversion right - ( 1,195,200) - - - - - - ( 1,195,200)
Adjustments due to changes in equities of
long-term investments - 744,685 - - - ( 2,570,264) - - ( 1,825,579)
Cumulative translation adjustment - - - - 30,471,775 - - - 30,471,775
Minority interest - - - - - - - 3,990,913 3,990,913
Balance at December 31, 2011 $ 106,890,967 $ 70,693,639 $ 51,821,402 $ 325,500,402 $ 21,141,456 $ 1,802,723 ($ 18,901) $ 37,187,796 $ 615,019,484
2012
Balance at January 1, 2012 $ 106,890,967 $ 70,693,639 $ 51,821,402 $ 325,500,402 $ 21,141,456 $ 1,802,723 ($ 18,901) $ 37,187,796 $ 615,019,484
Appropriations of 2011 earnings (Note 2):
Legal reserve - - 8,159,100 ( 8,159,100) - - - - -
Cash dividends - - - ( 16,033,645) - - - - ( 16,033,645)
Stock dividends 10,689,096 - - ( 10,689,096) - - - - -
Employees’ stock bonus 778,602 5,095,950 - - - - - - 5,874,552
Consolidated net income for 2012 - - - 94,762,377 - - - ( 2,975,236) 91,787,141
Unrealized loss on financial assets - - - - - 2,026,951 - - 2,026,951
Adjustments due to changes in equities of
long-term investments - 1,476,489 - - - 339,619 - -
1,816,108
Cumulative translation adjustment - - - - ( 19,745,844) - - - ( 19,745,844)
Minority interest - - - - - - - 986,406 986,406
Balance at December 31, 2012 $ 118,358,665 $ 77,266,078 $ 59,980,502 $ 385,380,938 $ 1,395,612 $ 4,169,293 ($ 18,901) $ 35,198,966 $ 681,731,153
Note 1: Directors' and supervisors' remuneration amounting to $0 and employees' bonus amounting to $5,555,128 had been deducted from the Consolidated Statement of Income in 2010.
Note 2: Directors' and supervisors' remuneration amounting to $0 and employees' bonus amounting to $5,874,552 had been deducted from the Consolidated Statement of Income in 2011.
The accompanying notes are an integral part of these consolidated financial statements.
See report of independent accountants dated March 28, 2013.
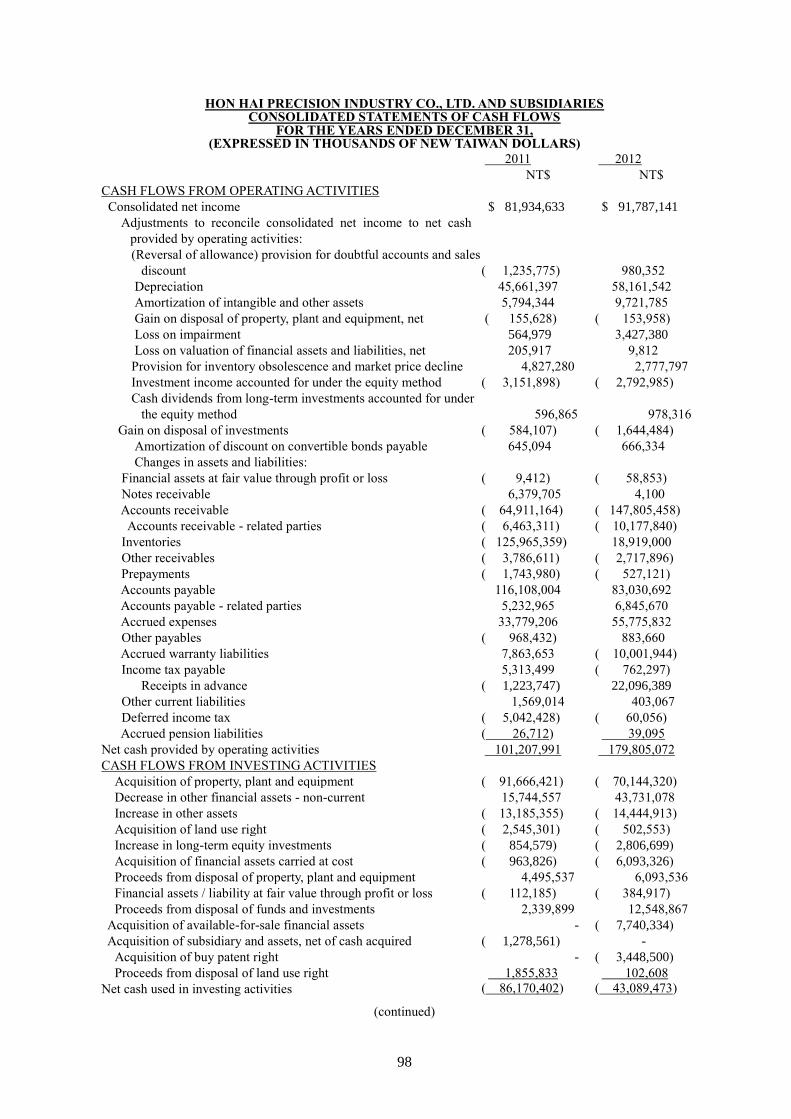
98
HON HAI PRECISION INDUSTRY CO., LTD. AND SUBSIDIARIES CONSOLIDATED STATEMENTS OF CASH FLOWS
FOR THE YEARS ENDED DECEMBER 31, (EXPRESSED IN THOUSANDS OF NEW TAIWAN DOLLARS)
2011 2012
NT$ NT$
CASH FLOWS FROM OPERATING ACTIVITIES
Consolidated net income $ 81,934,633 $ 91,787,141
Adjustments to reconcile consolidated net income to net cash
provided by operating activities:
(Reversal of allowance) provision for doubtful accounts and sales
discount ( 1,235,775) 980,352
Depreciation 45,661,397 58,161,542
Amortization of intangible and other assets 5,794,344 9,721,785
Gain on disposal of property, plant and equipment, net ( 155,628) ( 153,958)
Loss on impairment 564,979 3,427,380
Loss on valuation of financial assets and liabilities, net 205,917 9,812
Provision for inventory obsolescence and market price decline 4,827,280 2,777,797
Investment income accounted for under the equity method ( 3,151,898) ( 2,792,985)
Cash dividends from long-term investments accounted for under
the equity method 596,865 978,316
Gain on disposal of investments ( 584,107) ( 1,644,484)
Amortization of discount on convertible bonds payable 645,094 666,334
Changes in assets and liabilities:
Financial assets at fair value through profit or loss ( 9,412) ( 58,853)
Notes receivable 6,379,705 4,100
Accounts receivable ( 64,911,164) ( 147,805,458)
Accounts receivable - related parties ( 6,463,311) ( 10,177,840)
Inventories ( 125,965,359) 18,919,000
Other receivables ( 3,786,611) ( 2,717,896)
Prepayments ( 1,743,980) ( 527,121)
Accounts payable 116,108,004 83,030,692
Accounts payable - related parties 5,232,965 6,845,670
Accrued expenses 33,779,206 55,775,832
Other payables ( 968,432) 883,660
Accrued warranty liabilities 7,863,653 ( 10,001,944)
Income tax payable 5,313,499 ( 762,297)
Receipts in advance ( 1,223,747) 22,096,389
Other current liabilities 1,569,014 403,067
Deferred income tax ( 5,042,428) ( 60,056)
Accrued pension liabilities ( 26,712) 39,095
Net cash provided by operating activities 101,207,991 179,805,072
CASH FLOWS FROM INVESTING ACTIVITIES
Acquisition of property, plant and equipment ( 91,666,421) ( 70,144,320)
Decrease in other financial assets - non-current 15,744,557 43,731,078
Increase in other assets ( 13,185,355) ( 14,444,913)
Acquisition of land use right ( 2,545,301) ( 502,553)
Increase in long-term equity investments ( 854,579) ( 2,806,699)
Acquisition of financial assets carried at cost ( 963,826) ( 6,093,326)
Proceeds from disposal of property, plant and equipment 4,495,537 6,093,536
Financial assets / liability at fair value through profit or loss ( 112,185) ( 384,917)
Proceeds from disposal of funds and investments 2,339,899 12,548,867
Acquisition of available-for-sale financial assets - ( 7,740,334)
Acquisition of subsidiary and assets, net of cash acquired ( 1,278,561) -
Acquisition of buy patent right - ( 3,448,500)
Proceeds from disposal of land use right 1,855,833 102,608
Net cash used in investing activities ( 86,170,402) ( 43,089,473)
(continued)
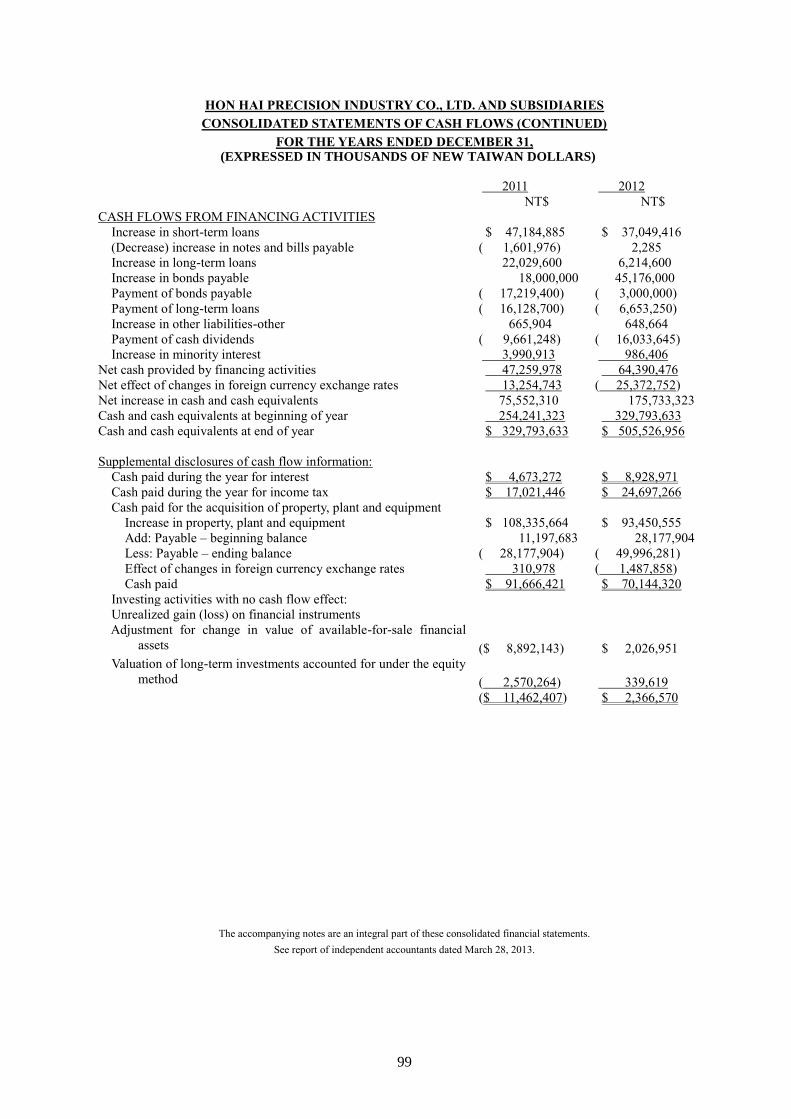
99
HON HAI PRECISION INDUSTRY CO., LTD. AND SUBSIDIARIES
CONSOLIDATED STATEMENTS OF CASH FLOWS (CONTINUED)
FOR THE YEARS ENDED DECEMBER 31, (EXPRESSED IN THOUSANDS OF NEW TAIWAN DOLLARS)
2011 2012
NT$ NT$
CASH FLOWS FROM FINANCING ACTIVITIES
Increase in short-term loans $ 47,184,885 $ 37,049,416
(Decrease) increase in notes and bills payable ( 1,601,976) 2,285
Increase in long-term loans 22,029,600 6,214,600
Increase in bonds payable 18,000,000 45,176,000
Payment of bonds payable ( 17,219,400) ( 3,000,000)
Payment of long-term loans ( 16,128,700) ( 6,653,250)
Increase in other liabilities-other 665,904 648,664
Payment of cash dividends ( 9,661,248) ( 16,033,645)
Increase in minority interest 3,990,913 986,406
Net cash provided by financing activities 47,259,978 64,390,476
Net effect of changes in foreign currency exchange rates 13,254,743 ( 25,372,752)
Net increase in cash and cash equivalents 75,552,310 175,733,323
Cash and cash equivalents at beginning of year 254,241,323 329,793,633
Cash and cash equivalents at end of year $ 329,793,633 $ 505,526,956
Supplemental disclosures of cash flow information:
Cash paid during the year for interest $ 4,673,272 $ 8,928,971
Cash paid during the year for income tax $ 17,021,446 $ 24,697,266
Cash paid for the acquisition of property, plant and equipment
Increase in property, plant and equipment $ 108,335,664 $ 93,450,555
Add: Payable – beginning balance 11,197,683 28,177,904
Less: Payable – ending balance ( 28,177,904) ( 49,996,281)
Effect of changes in foreign currency exchange rates 310,978 ( 1,487,858)
Cash paid $ 91,666,421 $ 70,144,320
Investing activities with no cash flow effect:
Unrealized gain (loss) on financial instruments
Adjustment for change in value of available-for-sale financial
assets ($ 8,892,143) $ 2,026,951
Valuation of long-term investments accounted for under the equity
method ( 2,570,264) 339,619
($ 11,462,407) $ 2,366,570
The accompanying notes are an integral part of these consolidated financial statements.
See report of independent accountants dated March 28, 2013.
100
HON HAI PRECISION INDUSTRY CO., LTD. AND SUBSIDIARIES
NOTES TO CONSOLIDATED FINANCIAL STATEMENTS
DECEMBER 31, 2011 AND 2012
(EXPRESSED IN THOUSANDS OF NEW TAIWAN DOLLARS, EXCEPT AS OTHERWISE INDICATED)
1. HISTORY AND ORGANIZATION
Hon Hai Precision Industry Co., Ltd. (the Company) was established on February 20, 1974. The Company
began to be listed on the Taiwan Stock Exchange in June 1991. The Company merged with Premier Image
Technology Corporation (Premier Corp.) on December 1, 2006. The main activities of the Company are
the manufacture, processing and sales of connectors, cable, enclosures, wired/wireless communication
products, optical products, power supply modules, and assemblies for use in the IT, communications,
automotive equipment, precision molding, automobile, and consumer electronics industries. As of
December 31, 2012, the Company’s issued and outstanding capital was $118,358,665; the Company and
its subsidiaries had approximately 1,290,000 employees.
2. SUMMARY OF SIGNIFICANT ACCOUNTING POLICIES
The accompanying consolidated financial statements of the Company and its subsidiaries (collectively
referred herein as the Group) are prepared in accordance with the “Rules Governing the Preparation of
Financial Statements by Securities Issuers” and accounting principles generally accepted in the Republic
of China. The Group’s significant accounting policies are summarized below:
1) Basis for preparation of consolidated financial statements
A. All majority-owned subsidiaries and controlled entities are included in the consolidated financial
statements. Effective January 1, 2008, the Company prepares consolidated financial statements on a
quarterly basis. The income (loss) of the subsidiaries is included in (excluded from) the consolidated
statement of income effective on the date the Company gains (losses) control over the subsidiaries.
Significant intercompany transactions and assets and liabilities arising from intercompany
transactions are eliminated.
B. Subsidiaries included in the consolidated financial statements and their changes in 2012:
Ownership
percentage (%)
Investor Subsidiaries Main operating activities 2011.12.31 2012.12.31 Note
Hon Hai Foxconn (Far Investment holdings in companies 100% 100% (3)
Precision East) Limited in Mainland China, Hong Kong,
Industry and subsidiaries Europe and America primarily
Co., Ltd. in engaged in manufacturing,
sale, research and development
of computer cases, connectors
and computer components.
101
Ownership
percentage (%)
Investor Subsidiaries Main operating activities 2011.12.31 2012.12.31 Note
Hon Hai Foxconn Holding Investment holdings in Asia- 100% 100%
Precision Ltd. and Pacific and America
Industry subsidiaries hi-tech companies
Co., Ltd.
〃 Hyield Venture Venture capital investments in 97.50% 97.50%
Capital Co., Ltd. companies primarily engaged in
and subsidiaries manufacturing of automobile
wires/electronic devices and
electronic components, and
services of planning, advisory
and business management.
〃 Bao Shin Domestic investments in 100% 100%
International companies primarily engaged in
Investment development and sale of
Co., Ltd. and computer systems, manufacturing
subsidiaries and sale of machinery and
equipment.
〃 Hon Yuan Domestic investments in 100% 100%
International companies primarily engaged in
Investment manufacturing and sale of
Co., Ltd. and machinery and equipment.
subsidiaries
〃 Hon Chi Domestic investments in 100% 100%
International companies primarily engaged in
Investment software and electronic
Co., Ltd. and Information application services,
subsidiaries and manufacturing and sale of
machinery and equipment.
〃 Lin Yih Investment holdings in R.O.C. 100% 100%
International companies
Investment
Co., Ltd.
102
Ownership
percentage (%)
Investor Subsidiaries Main operating activities 2011.12.31 2012.12.31 Note
Hon Hai Hon Hai/ Logistics services in America 100% 100%
Precision Foxconn
Industry Logistics
Co., Ltd. California LLC.
〃 Hon Hai/ Logistics services in America 100% 100%
Foxconn
Logistics
Texas LLC.
〃 Ambit Investment holdings in companies 100% 100%
International in Mainland China primarily
Ltd. and engaged in manufacturing and
subsidiaries sale of power supply modules,
application modules and network
cables assemblies.
〃 Foxconn Asia-pacific sales company 100% 100%
Singapore
(Pte) Ltd. and
subsidiaries
〃 Foxconn Patent applications in America. 100% 100%
International Inc.
〃 Altus Technology Manufacture and design of 100% 100%
Inc. cellular phone and camera
lens and packaging of sensors
〃 Premier Image Manufacture and sale of camera 99.96% 99.96%
Technology
-Hong Kong
Limited and
subsidiaries
〃 Foxconn SA B.V. Investment holdings of Russian 97.76% 97.76%
and subsidiaries domestic sales companies
〃 Margini Holdings Investment holdings in Vietnam 100% 100%
Limited and export processing and
subsidiaries construction services companies
and Brazil domestic sales
companies.
103
Ownership
percentage (%)
Investor Subsidiaries Main operating activities 2011.12.31 2012.12.31 Note
Hon Hai Foxconn Holdings Investment holdings in companies 100% 100%
Precision B.V.- Netherland in Europe.
Industry and subsidiaries
Co., Ltd.
〃 Syntrend Retail of office machinery and 80% 80%
Creative Park equipment and electronic
Co., Ltd. appliances, and information/
software services.
(1) The financial statements of consolidated subsidiaries as of and for the years ended December 31,
2011 and 2012 were audited by independent accountants.
(2) For the relevant information on indirectly owned subsidiaries of the Company, please refer to Note
11.
(3) Changes in the consolidated subsidiaries
a. In October, 2011, a subsidiary of the Company acquired 100% of Scientific-Atlanta Holdings
B.V. and Scientific-Atlanta de Mexico, S. de R.L. de C.V., which were consolidated effective the
acquisition date.
b. From July, 2011 to March, 2012, a subsidiary of the Company disposed 70% of Shenzhen
Futaihong Bright Real Estate Co., which was excluded from consolidation effective in March,
2012, the date on which the Company lost control over the subsidiary.
c. In the first half of 2012, a subsidiary of the Company acquired 95.18% and 68% ownership in
Interface Optoelectronics (Shenzhen) Co., Ltd. and Interface Technology (Chengdu) Co., Ltd.,
respectively, which were consolidated effective the acquisition date. However, the subsidiary
made adjustments to its investments in the two investees subsequently in the fourth quarter of
2012 for business consideration, which resulted to a loss of control over them. Thus, the two
investees were excluded from consolidation effective the date on which the subsidiary lost
control over them.
d. In the first half of 2012, a subsidiary of the Company acquired 50.48% ownership in Synergy
Technology (Chengdu) Co., Ltd., which was consolidated effective the acquisition date.
e. In December, 2012, a subsidiary of the Company acquired 100% ownership in Excel Victory Ltd.
and its subsidiaries, which were consolidated effective the acquisition date.
C. Majority-owned subsidiaries that were not included in the consolidated financial statements: None.
D. Adjustments for subsidiaries with different balance sheet dates: None.
E. Special operating risks of the foreign subsidiaries: No significant special operating risks that would
affect the financial statements.
F. Significant restriction on remittance of funds from the foreign subsidiaries to the Company: None.
G. The Company’s common stock owned by its subsidiary:
104
As of December 31, 2011 and 2012, Hon Jin International Investment Co., Ltd. owned 1,184,375
and 1,302,812 shares, respectively, of the Company’s common stock at a cost of $18,901.
H. Information on new issuance of convertible bonds and common stock by subsidiaries: The issuance
of convertible bonds and new common stock by subsidiaries had no significant effect on
stockholders’ equity of the parent company.
2) Translation of financial statements of foreign subsidiaries into New Taiwan Dollars
Assets and liabilities of foreign subsidiaries are translated into New Taiwan dollars using the exchange
rates at the balance sheet date. Equity accounts are translated at historical rates except for beginning
retained earnings, which is carried forward from prior year’s balance. Dividends are translated at the
rates prevailing at the date of declaration. Profit and loss accounts are translated at weighted-average
rates of the year. The resulting translation differences are included in “cumulative translation
adjustments” under stockholders’ equity.
3) Criteria for classifying assets and liabilities as current or non-current items
A. Assets that meet one of the following criteria are classified as current assets; otherwise they are
classified as non-current assets:
1) Assets arising from operating activities that are expected to be realized or consumed, or are
intended to be sold within the normal operating cycle;
2) Assets held mainly for trading purposes;
3) Assets that are expected to be realized within twelve months from the balance sheet date; and
4) Cash and cash equivalents, excluding restricted cash and cash equivalents and those that are to
be exchanged or used to pay off liabilities more than twelve months after the balance sheet date.
B. Liabilities that meet one of the following criteria are classified as current liabilities; otherwise they
are classified as non-current liabilities:
1) Liabilities arising from operating activities that are expected to be paid off within the normal
operating cycle;
2) Liabilities arising mainly from trading activities;
3) Liabilities that are to be paid off within twelve months from the balance sheet date; and
4) Liabilities for which the repayment date cannot be extended unconditionally to more than twelve
months after the balance sheet date.
4) Use of estimates
The preparation of financial statements in conformity with R.O.C. generally accepted accounting
principles requires management to make estimates and assumptions that affect the reported amounts of
assets and liabilities and disclosure of contingent assets and liabilities as at the date of the financial
statements and the amounts of revenues and expenses reported during the period. Actual results could
differ from those assumptions and estimates.
5) Foreign currency transactions
A. Transactions denominated in foreign currencies are translated into functional currency at the spot
exchange rates prevailing at the transaction dates. Exchange gains or losses due to the difference
between the exchange rate on the transaction date and the exchange rate on the date of actual receipt
and payment are recognized in current year’s profit or loss.
105
B. Monetary assets and liabilities denominated in foreign currencies are translated at the spot exchange
rates prevailing at the balance sheet date. Exchange gains or losses are recognized in profit or loss.
However, exchange gains or losses on overseas inter-company accounts that are, in nature, deemed
long term is accounted for as a reduction in stockholders’ equity.
C. Non-monetary items that are measured at fair value are translated using the exchange rates prevailing
at the balance sheet date. When a gain or loss on a non-monetary item is recognized directly in
equity, any exchange component of that gain or loss shall be recognized directly in equity.
Conversely, when a gain or loss on a non-monetary item is recognized in profit or loss, any exchange
component of that gain or loss shall be recognized in profit or loss. However, non-monetary items
that are measured on a historical cost basis are translated using the exchange rate at the date of the
transaction.
6) Cash equivalents
Cash equivalents refer to short-term, highly liquid investments that meet both the following criteria:
a) Readily convertible to known amount of cash; and
b) Subject to an insignificant risk of changes in value resulting from fluctuations in interest rate.
The statement of cash flows is compiled under the cash and cash equivalents basis.
7) Financial assets and financial liabilities at fair value through profit or loss
A. Equity investments are recognized using trade date accounting. Debt instruments are recognized and
derecognized using settlement date accounting. All are recognized initially at fair value. A fixed
price commitment between trade date and settlement date meets the definition of a derivative except
for a contract whose terms require delivery of the asset within the time frame established generally
by regulation or convention in the marketplace concerned is recognized using trade date accounting
or settlement date accounting.
B. Financial assets or liabilities at fair value through profit or loss are subsequently re-measured and
stated at fair value, and the gain or loss is recognized in profit or loss. The fair value of listed stocks,
OTC stocks, closed-end mutual funds and deposit receipts is based on latest quoted fair prices of the
accounting period. The fair value of open-end and balanced mutual funds is based on the net asset
value at the balance sheet date.
C. For derivatives that do not qualify for hedge accounting, if the derivative is an option, then the
transaction is recognized at fair value on the trade date, and if the derivative is not an option, then
the transaction is recognized at zero fair value on the trade date.
D. The derivative features (such as call options and put options) embedded in bonds payable issued by
the Company are described in Note 2 (20).
8) Available-for-sale financial assets
A. Equity investments are recognized using trade date accounting. Bond investments are recognized and
derecognized using settlement date accounting and are recognized initially at fair value plus
transaction costs that are directly attributable to the acquisition of the financial asset.
B. Available-for-sale financial assets are measured and stated at fair value, and the gain or loss is
recognized in equity. The cumulative fair value changes are reclassified to profit and loss upon
106
derecognition of the financial assets. The fair value of listed stocks, OTC stocks, closed-end mutual
funds and deposit receipts is based on latest quoted fair prices of the accounting period. The fair
value of open-end and balanced mutual funds is based on the net asset value at the balance sheet
date.
C. If there is any objective evidence that the financial asset is impaired; the cumulative loss that had
been recognized directly in equity shall be transferred from equity to profit or loss. Impairment
losses recognized previously in profit or loss for an investment in an equity instrument shall not be
reversed through profit or loss, and if, subsequently, the fair value of a debt instrument increases and
the increase can be objectively related to an event occurring after the impairment loss was
recognized in profit or loss, the impairment loss shall be reversed, with the amount of the reversal
recognized in profit or loss.
9) Financial assets carried at cost
A. Investment in unquoted equity instruments is recognized using trade date accounting and is
recognized initially at its fair value plus transaction costs that are directly attributable to the
acquisition of the financial asset.
B. If there is any objective evidence that the financial asset is impaired; the impairment loss is
recognized in profit or loss. Such impairment loss cannot be reversed.
10) Settlement date accounting
If an entity recognizes financial assets using settlement date accounting, any change in the fair value
of the asset to be received during the period between the trade date and the settlement date / balance
sheet date is not recognized for assets carried at cost or amortized cost. For financial asset or financial
liability classified as at fair value through profit or loss, the change in fair value is recognized in profit
or loss. For available-for-sale financial assets, the change in fair value is recognized directly in equity.
11) Notes and accounts receivable, other receivables
A. Notes and accounts receivable are claims generated from the sale of goods or services. Other
receivables are those receivables arising from transactions other than the sale of goods or services.
Notes receivable, accounts receivable and other receivables are recognized initially at fair value and
are subsequently measured at amortized cost using the effective interest method.
B. The Group assesses whether objective evidence of impairment exists individually or collectively for
financial assets that are not individually significant. If there is objective evidence that an
impairment loss has been incurred, the amount of the loss is recognized and measured as the
difference between the asset’s carrying amount and the present value of estimated future cash flows
discounted at the financial asset’s original effective interest rate. If the amount of the impairment
loss decreases and the decrease can be related objectively to an event occurring after the impairment
was recognized, the previously recognized impairment loss shall be reversed. The reversal shall not
result in a carrying amount of the financial asset that exceeds what the amortized cost would have
been had the impairment not been recognized at the date the impairment is reversed. The amount of
the reversal shall be recognized in profit or loss.
12) Inventories
The perpetual inventory system is adopted for inventory recognition. Inventories are stated at cost. The
107
cost is determined using the weighted-average method. At the end of period, inventories are evaluated
at the lower of cost or net realizable value, and the individual item approach is used in the comparison
of cost and net realizable value. The calculation of net realizable value is based on the estimated
selling price in the normal course of business, net of estimated costs of completion and estimated
selling expenses. As the value of raw materials declines and the cost of finished goods is over the net
realizable value, the net realizable value of raw materials is determined based on current replacement
cost.
13) Long-term equity investments accounted for under the equity method
A. Long-term equity investments in which the Group holds more than 20% of the investee company’s
voting shares or has the ability to exercise significant influence on the investee’s operational
decisions are accounted for under the equity method. The excess of the initial investment cost over
the acquired net asset value of the investee attributable to goodwill is no longer amortized from
2006. Retrospective adjustment of the amount of goodwill amortized in previous years is not
required. Goodwill is subject to tests of impairment on an annual basis. The excess of acquired net
asset value of investee over the initial investment cost is allocated proportionately and applied as a
reduction to the book values of identifiable non-current assets, and any remaining amount of such
excess after this allocation is credited to extraordinary gains.
B. Long-term investment in which the Group holds more than 50% of the investee company’s voting
shares or has the ability to control the investee’s operational decisions are accounted for under the
equity method and included in the consolidated financial statements on a quarterly basis.
C. Exchange differences arising from translation of the financial statements of overseas investee
companies accounted for under the equity method are recorded as “cumulative translation
adjustments” in proportion to the Company’s ownership under stockholders' equity.
14) Property, plant and equipment
A. Property, plant and equipment are stated at cost. Costs incurred to bring the assets to the condition
and location necessary for their intended uses are capitalized. Significant servicing or betterments
capable of generating future economic benefits are capitalized and depreciated accordingly.
Maintenance and repairs are expensed as incurred.
B. Depreciation is provided under the straight-line method based on the assets’ estimated economic
service lives. The useful lives of property, plant and equipment are 3 to 9 years, except for
buildings, the useful life of which is 6 to 51 years.
15) Goodwill and other intangible assets
A. The excess of the initial acquisition cost over the fair value of the acquired identifiable tangible and
intangible assets is attributable to goodwill.
B. Royalties paid on the acquisition of technical patent authorization are stated at cost and amortized
on a straight-line basis over its estimated economic life.
16) Deferred charges and other assets
A. The costs of telephone network installation charges, computer software, molding and tools
equipment are recorded as deferred charges and amortized over their estimated economic lives on a
108
straight-line basis.
B. Land use rights are stated at cost and amortized over the lease period using the straight-line
method.
17) Impairment of non-financial assets
The Group recognizes impairment loss when there is indication that the recoverable amount of an
asset is less than its carrying amount. The recoverable amount is the higher of the fair value less costs
to sell and value in use. The fair value less costs to sell is the amount obtainable from the sale of the
asset in an arm’s length transaction after deducting any direct incremental disposal costs. The value in
use is the present value of estimated future cash flows to be derived from continuing use of the asset
and from its disposal at the end of its useful life. When the impairment no longer exists, the
impairment loss recognized in prior years shall be reversed. The recoverable amount of goodwill shall
be evaluated periodically. Impairment loss will be recognized whenever the recoverable amount of the
goodwill is less than its carrying amount. Impairment loss of goodwill recognized in prior years is not
reversed in the following years.
18) Warranty obligation
Warranty obligation is recognized based on the estimated warranty cost per unit and the number of
units sold during the period.
19) Pension plan
Under the defined benefit pension plan, net periodic pension costs are recognized in accordance with
the actuarial calculations. Net periodic pension costs include service cost, interest cost, and expected
return on plan assets, and amortization of unrecognized net transition obligation and actuarial gains or
losses. Unrecognized net transition obligation is amortized on a straight-line basis over 15 years.
Under the defined contribution pension plan, net periodic pension costs are recognized as incurred.
20) Bonds payable
For bonds issued with embedded conversion, put, or call option feature after January 1, 2006, the
issuer shall classify the issuance price based on the substance of the contractual arrangement on initial
recognition, and recognize the elements separately as a financial asset, financial liability, or an equity
instrument.
These bonds are accounted for as follows:
A. The difference between the issue price and face value of convertible corporate bonds is accounted
for as premium or discount which is required to be amortized over the period from the date of
issuance to maturity date using the interest method and is recorded as “interest expense”.
B. The value of any derivative features (such as a call option and put option) embedded in the
compound financial instrument is recognized as “financial assets or financial liabilities at fair value
through profit or loss”. These derivative features are subsequently re-measured and stated at fair
value on each balance sheet date, and the gain or loss is recognized in “gain or loss on valuation of
financial assets or financial liabilities”. At the maturity of the redemption period, if the fair value
of common stock exceeds the redemption price, the fair value of the put option is recognized as
“capital reserve”; however, if the fair value of common stock is lower than the redemption price,
the fair value of the put option is recognized as “gain or loss”.
109
C. A conversion right embedded in the bonds issued by the Company, which is convertible to an
equity instrument, is recognized in “capital reserve from conversion right”. When a bondholder
exercises his/her conversion rights, the liability component of the bonds (including corporate bonds
and embedded derivatives) shall be revalued at fair value on the conversion date, and the resulting
difference shall be recognized as “gain or loss” in the current period. The book value of the
common stock issued due to the conversion shall be based on the adjusted book value of the above-
mentioned liability component plus the book value of the stock conversion option.
D. Costs incurred on issuance of convertible bonds are proportionately charged to the liabilities and
equities of the underlying instruments based on initial recognition amount.
E. In the event that the bondholders may exercise put options within the following year, the
underlying bonds payable shall be reclassified to current liabilities. The bonds payable whose put
options are unexercised during the exercisable period shall be reclassified to non-current liabilities.
21) Income tax
A. Income tax expense is provided based on accounting income after adjusting for permanent
differences. The provision for income tax includes deferred income tax for the expected future tax
consequences of events that have been included in different periods for financial or tax reporting
purposes. Deferred income tax assets and liabilities are determined using enacted tax rates in effect
for the year(s) in which the differences are expected to reverse. Valuation allowance on deferred
income tax assets is recognized to the extent that it is more likely than not that the income tax
benefits will not be realized. Over or under provision of income tax from the previous years is
recorded as adjustment to the current year’s income tax expense. In accordance with the ROC
Income Tax Law, the company’s undistributed income is subject to an additional 10% corporate
income tax. The tax is charged to income tax expense after the appropriation of earnings is
approved by the stockholders in the following year.
B. Income tax credits are provided for in accordance with R.O.C. SFAS No. 12, "Accounting for
Income Tax Credits". Income tax credits arising from acquisitions of equipment or technology,
expenditures for research and development, training and development of employees and
investments in qualified stocks are charged to deferred income tax assets and credited to income
tax expense in the period the related expenditures are incurred.
C. Effective January 1, 2006, the Company adopted the Income Basic Tax Act (the “Act”). Under the
Act, the income tax payable shall be the higher of the basic tax and the regular income tax in
accordance with the Income Tax Law and other relevant laws.
D. As a result of the amendment of the Income Tax Law, the Company recalculated its deferred tax
assets and liabilities and recorded the resulting difference in the current year’s income tax benefit
or expense.
22) Government grants
In accordance with R.O.C. SFAS No. 29, “Government Grants”, government grants related to assets
are recognized as deferred income; for depreciable assets, it is recognized as income over the useful
life period of the asset in proportion to which depreciation expense on those assets is recognized. For
non-depreciable assets that require the fulfillment of certain obligations, it would then be recognized
110
as income over the periods that bear the cost of meeting the obligations. If the government grant
relates to receiving financial consideration, it is recognized as income when earned, or as deferred
income (shown as “other liabilities”) and recognized in periods over which the grant will be earned.
23) Treasury stock
A. When shares are bought back by the Company, the treasury stock is accounted for as a deduction of the
equity.
B. Any excess of the proceeds over the cost of the treasury stock reissued is recognized as an increase
in additional paid-in capital from the treasury stock transaction and if the proceeds are less than the
cost, the deficit is charged to the additional paid-in capital account. Should the paid-in capital in
excess of par value of common stock balance be insufficient to absorb the deficit, the balance is
charged to retained earnings.
C. Treasury stock cost is determined using the weighted-average cost method.
D. The Company's common stock owned by its subsidiaries is treated as treasury stock.
24) Share-based payment - employee compensation plan
Based on the employee stock options and the share-based payment agreements, the Company shall
measure the services received during the vesting period by reference to the fair value of the equity
instruments granted and account for those amounts as payroll expenses during that period.
25) Employees’ bonuses and directors’ and supervisors’ remuneration
Effective January 1, 2008, pursuant to EITF 96-052 of the Accounting Research and Development
Foundation, R.O.C., dated March 16, 2007, “Accounting for Employees’ Bonuses and Directors’ and
Supervisors’ Remuneration”, the costs of employees’ bonuses and directors’ and supervisors’
remuneration are accounted for as expenses and liabilities, provided that such recognition is required
under legal or constructive obligation and the amounts can be estimated reasonably. However, if the
accrued amounts for employees’ bonuses and directors’ and supervisors’ remuneration are significantly
different from the actual distributed amounts resolved by the stockholders at their annual stockholders’
meeting subsequently, the differences shall be recognized as gain or loss in the following year. In
addition, according to EITF 97-127 of the Accounting Research and Development Foundation, R.O.C.,
dated March 31, 2008, “Criteria for Listed Companies in Calculating the Number of Shares of
Employees’ Stock Bonus”, the Company calculates the number of shares of employees’ stock bonus
based on the closing price of the Company's common stock at the previous day of the stockholders’
meeting held in the year following the financial reporting year, after taking into account the effects of
ex-rights and ex-dividends.
26) Earnings per share
Basic earnings per share is calculated by dividing net income by the weighted-average number of
shares outstanding during the period. Diluted earnings per share is calculated by taking into account
the potentially dilutive securities which are assumed to have been converted to common stock at the
beginning of the period. Anti-dilutive potential common shares are ignored in calculating dilutive
earnings per share.
27) Revenues and expenses
Revenues are recognized when the earning process is substantially completed and are realized or
111
realizable. Related costs are recognized to match the timing of revenue recognition. Expenses,
including research and development costs, are recognized as incurred.
28) Operating segments
Operating segments are reported in a manner consistent with the internal reporting provided to the
chief operating decision-maker. The chief operating decision-maker is responsible for allocating
resources and assessing performance of the operating segments.
In accordance with R.O.C. SFAS No. 41, “Operating Segments”, segment information is disclosed in
the consolidated financial statements rather than in the separate financial statements of the Company.
3. CHANGES IN ACCOUNTING PRINCIPLES
1) Notes and accounts receivable, other receivables
Effective January 1, 2011, the Group adopted the amendments of R.O.C. SFAS No. 34, “Financial
Instruments: Recognition and Measurement”. The Group recognizes impairment loss on notes
receivable, accounts receivable and other receivables when there is an objective evidence of
impairment. As a result of the adoption of the amended SFAS No. 34, the Group’s consolidated net
income increased by $982,020 and consolidated earnings per share increased by $0.09 (in dollars) for
the year ended December 31, 2011.
2) Operating segments
Effective January 1, 2011, the Group adopted the newly issued R.O.C. SFAS No. 41, “Operating
Segments” to replace the original R.O.C. SFAS No. 20, “Segment Reporting”. This change in
accounting principle had no significant effect on net income and earnings per share for the year ended
December 31, 2011.
4. DETAILS OF SIGNIFICANT ACCOUNTS
(1) Cash and cash equivalents
December 31,
2011 2012
Cash on hand $ 4,201,508 $ 6,157,872
Checking accounts 4,011,744 4,618,703
Savings deposits 105,922,445 132,081,859
Time deposits 206,682,107 353,871,385
320,817,804 496,729,819
Cash equivalents 8,975,829 8,797,137
$ 329,793,633 $ 505,526,956
Cash equivalents include the Sweep Fund.
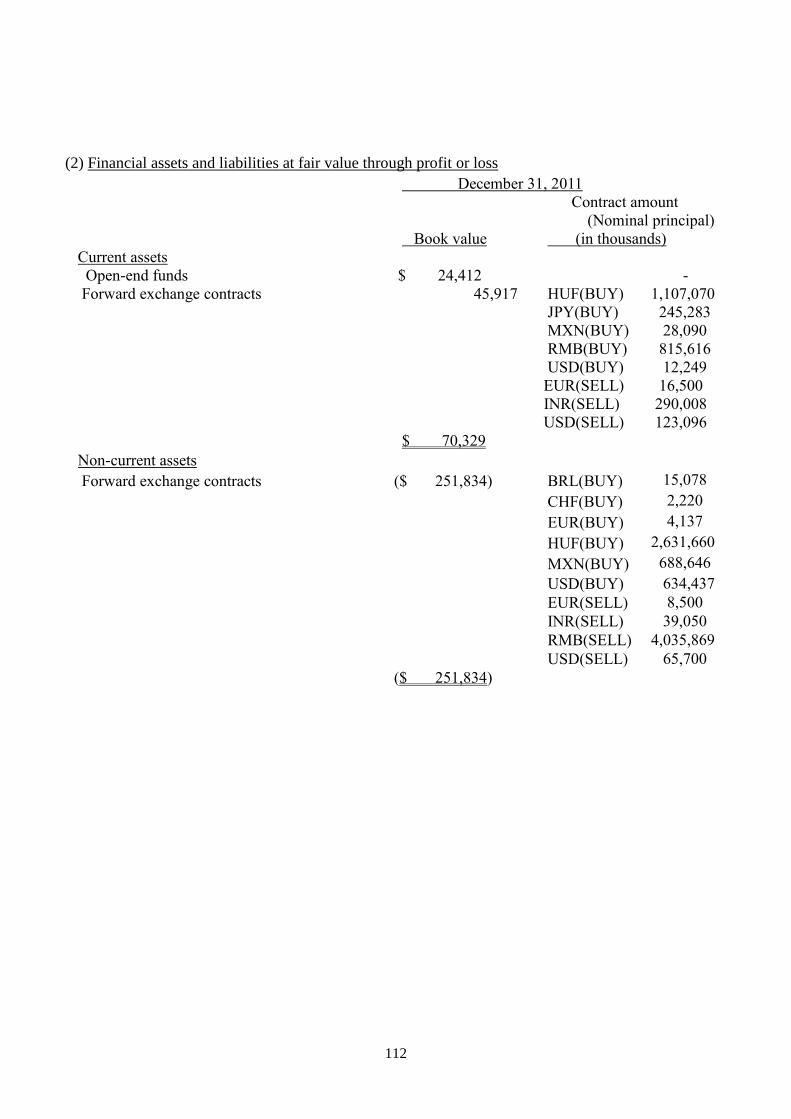
112
(2) Financial assets and liabilities at fair value through profit or loss
December 31, 2011
Book value
Contract amount
(Nominal principal)
(in thousands)
Current assets
Open-end funds $ 24,412 -
Forward exchange contracts 45,917 HUF(BUY) 1,107,070
JPY(BUY) 245,283
MXN(BUY) 28,090
RMB(BUY) 815,616
USD(BUY) 12,249
EUR(SELL) 16,500
INR(SELL) 290,008
USD(SELL) 123,096
$ 70,329
Non-current assets
Forward exchange contracts ($ 251,834) BRL(BUY) 15,078
CHF(BUY) 2,220
EUR(BUY) 4,137
HUF(BUY) 2,631,660
MXN(BUY) 688,646
USD(BUY) 634,437
EUR(SELL) 8,500
INR(SELL) 39,050
RMB(SELL) 4,035,869
USD(SELL) 65,700
($ 251,834)
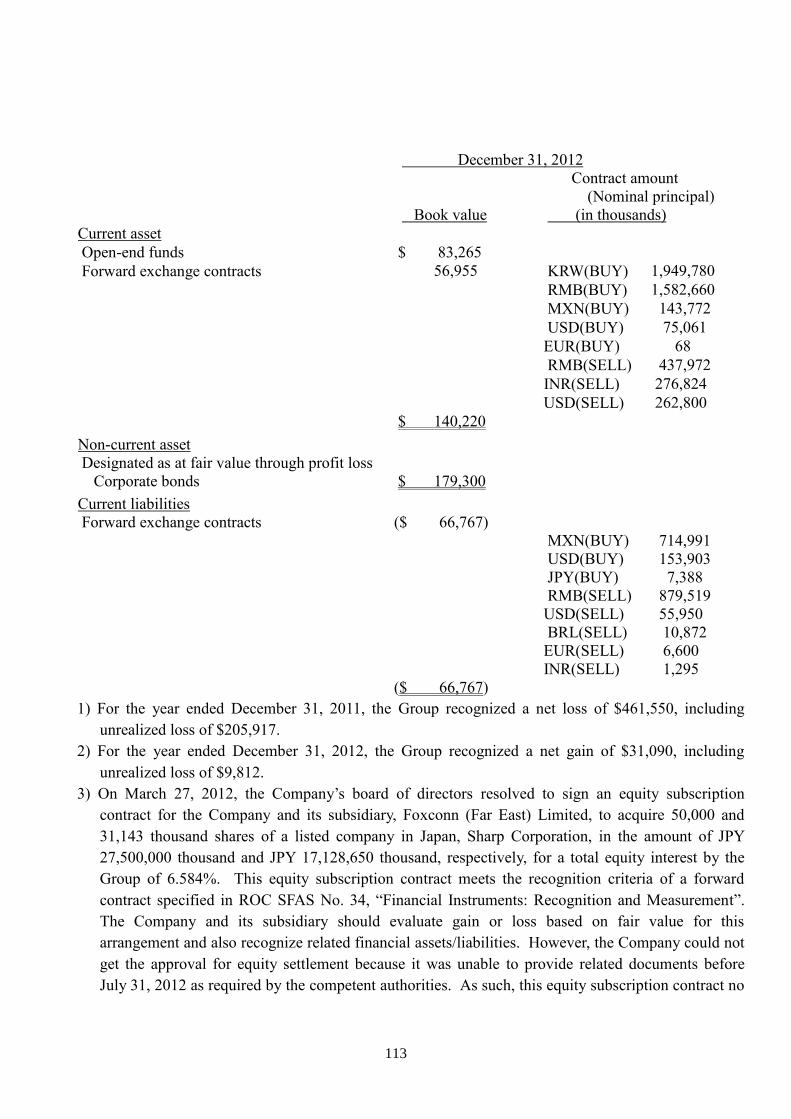
113
December 31, 2012
Book value
Contract amount
(Nominal principal)
(in thousands)
Current asset
Open-end funds $ 83,265
Forward exchange contracts 56,955 KRW(BUY) 1,949,780
RMB(BUY) 1,582,660
MXN(BUY) 143,772
USD(BUY) 75,061
EUR(BUY) 68
RMB(SELL) 437,972
INR(SELL) 276,824
USD(SELL) 262,800
$ 140,220
Non-current asset
Designated as at fair value through profit loss
Corporate bonds $ 179,300
Current liabilities
Forward exchange contracts ($ 66,767)
MXN(BUY) 714,991
USD(BUY) 153,903
JPY(BUY) 7,388
RMB(SELL) 879,519
USD(SELL) 55,950
BRL(SELL) 10,872
EUR(SELL) 6,600
INR(SELL) 1,295
($ 66,767)
1) For the year ended December 31, 2011, the Group recognized a net loss of $461,550, including
unrealized loss of $205,917.
2) For the year ended December 31, 2012, the Group recognized a net gain of $31,090, including
unrealized loss of $9,812.
3) On March 27, 2012, the Company’s board of directors resolved to sign an equity subscription
contract for the Company and its subsidiary, Foxconn (Far East) Limited, to acquire 50,000 and
31,143 thousand shares of a listed company in Japan, Sharp Corporation, in the amount of JPY
27,500,000 thousand and JPY 17,128,650 thousand, respectively, for a total equity interest by the
Group of 6.584%. This equity subscription contract meets the recognition criteria of a forward
contract specified in ROC SFAS No. 34, “Financial Instruments: Recognition and Measurement”.
The Company and its subsidiary should evaluate gain or loss based on fair value for this
arrangement and also recognize related financial assets/liabilities. However, the Company could not
get the approval for equity settlement because it was unable to provide related documents before
July 31, 2012 as required by the competent authorities. As such, this equity subscription contract no
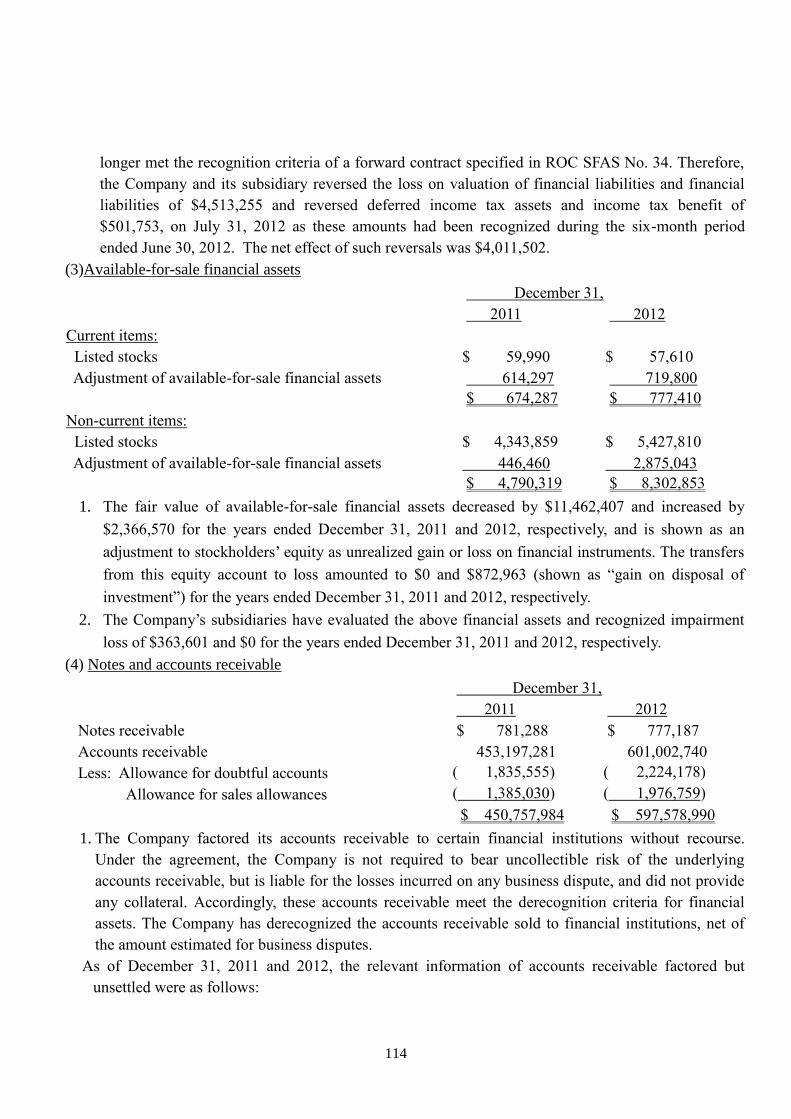
114
longer met the recognition criteria of a forward contract specified in ROC SFAS No. 34. Therefore,
the Company and its subsidiary reversed the loss on valuation of financial liabilities and financial
liabilities of $4,513,255 and reversed deferred income tax assets and income tax benefit of
$501,753, on July 31, 2012 as these amounts had been recognized during the six-month period
ended June 30, 2012. The net effect of such reversals was $4,011,502.
(3)Available-for-sale financial assets
December 31,
2011 2012
Current items:
Listed stocks $ 59,990 $ 57,610
Adjustment of available-for-sale financial assets 614,297 719,800
$ 674,287 $ 777,410
Non-current items:
Listed stocks $ 4,343,859 $ 5,427,810
Adjustment of available-for-sale financial assets 446,460 2,875,043
$ 4,790,319 $ 8,302,853
1. The fair value of available-for-sale financial assets decreased by $11,462,407 and increased by
$2,366,570 for the years ended December 31, 2011 and 2012, respectively, and is shown as an
adjustment to stockholders’ equity as unrealized gain or loss on financial instruments. The transfers
from this equity account to loss amounted to $0 and $872,963 (shown as “gain on disposal of
investment”) for the years ended December 31, 2011 and 2012, respectively.
2. The Company’s subsidiaries have evaluated the above financial assets and recognized impairment
loss of $363,601 and $0 for the years ended December 31, 2011 and 2012, respectively.
(4) Notes and accounts receivable
December 31,
2011 2012
Notes receivable $ 781,288 $ 777,187
Accounts receivable 453,197,281 601,002,740
Less: Allowance for doubtful accounts ( 1,835,555) ( 2,224,178)
Allowance for sales allowances ( 1,385,030) ( 1,976,759)
$ 450,757,984 $ 597,578,990
1. The Company factored its accounts receivable to certain financial institutions without recourse.
Under the agreement, the Company is not required to bear uncollectible risk of the underlying
accounts receivable, but is liable for the losses incurred on any business dispute, and did not provide
any collateral. Accordingly, these accounts receivable meet the derecognition criteria for financial
assets. The Company has derecognized the accounts receivable sold to financial institutions, net of
the amount estimated for business disputes.
As of December 31, 2011 and 2012, the relevant information of accounts receivable factored but
unsettled were as follows:
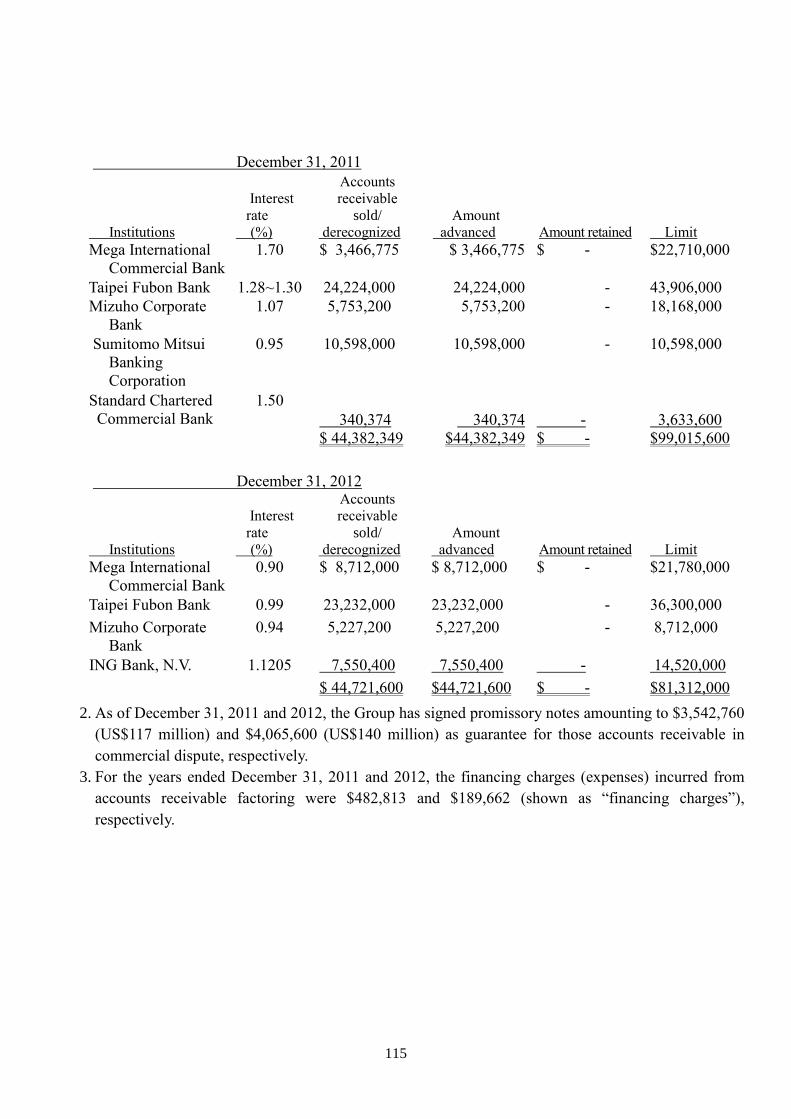
115
December 31, 2011
Institutions
Interest
rate
(%)
Accounts
receivable
sold/
derecognized Amount
advanced Amount retained Limit Mega International
Commercial Bank
1.70 $ 3,466,775 $ 3,466,775 $ - $22,710,000
Taipei Fubon Bank 1.28~1.30 24,224,000 24,224,000 - 43,906,000
Mizuho Corporate
Bank
1.07 5,753,200 5,753,200 - 18,168,000
Sumitomo Mitsui
Banking
Corporation
0.95 10,598,000 10,598,000 - 10,598,000
Standard Chartered
Commercial Bank
1.50
340,374 340,374 - 3,633,600
$ 44,382,349 $44,382,349 $ - $99,015,600
December 31, 2012
Institutions
Interest
rate
(%)
Accounts
receivable
sold/
derecognized Amount
advanced Amount retained Limit Mega International
Commercial Bank
0.90 $ 8,712,000 $ 8,712,000 $ - $21,780,000
Taipei Fubon Bank 0.99 23,232,000 23,232,000 - 36,300,000
Mizuho Corporate
Bank
0.94 5,227,200 5,227,200 - 8,712,000
ING Bank, N.V. 1.1205 7,550,400 7,550,400 - 14,520,000
$ 44,721,600 $44,721,600 $ - $81,312,000
2. As of December 31, 2011 and 2012, the Group has signed promissory notes amounting to $3,542,760
(US$117 million) and $4,065,600 (US$140 million) as guarantee for those accounts receivable in
commercial dispute, respectively.
3. For the years ended December 31, 2011 and 2012, the financing charges (expenses) incurred from
accounts receivable factoring were $482,813 and $189,662 (shown as “financing charges”),
respectively.
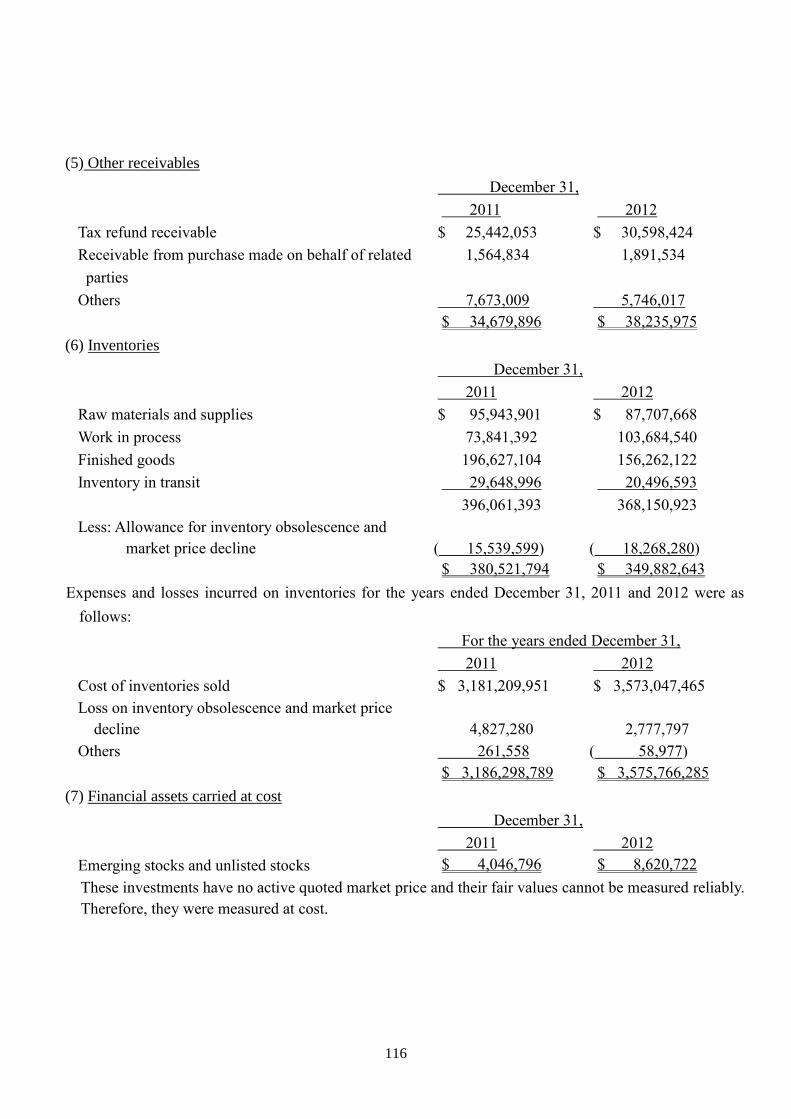
116
(5) Other receivables
December 31,
2011 2012
Tax refund receivable $ 25,442,053 $ 30,598,424
Receivable from purchase made on behalf of related 1,564,834 1,891,534
parties
Others 7,673,009 5,746,017
$ 34,679,896 $ 38,235,975
(6) Inventories
December 31,
2011 2012
Raw materials and supplies $ 95,943,901 $ 87,707,668
Work in process 73,841,392 103,684,540
Finished goods 196,627,104 156,262,122
Inventory in transit 29,648,996 20,496,593
396,061,393 368,150,923
Less: Allowance for inventory obsolescence and
market price decline ( 15,539,599) ( 18,268,280)
$ 380,521,794 $ 349,882,643
Expenses and losses incurred on inventories for the years ended December 31, 2011 and 2012 were as
follows:
For the years ended December 31,
2011 2012
Cost of inventories sold $ 3,181,209,951 $ 3,573,047,465
Loss on inventory obsolescence and market price
decline 4,827,280 2,777,797
Others 261,558 ( 58,977)
$ 3,186,298,789 $ 3,575,766,285
(7) Financial assets carried at cost
December 31,
2011 2012
Emerging stocks and unlisted stocks $ 4,046,796 $ 8,620,722
These investments have no active quoted market price and their fair values cannot be measured reliably.
Therefore, they were measured at cost.
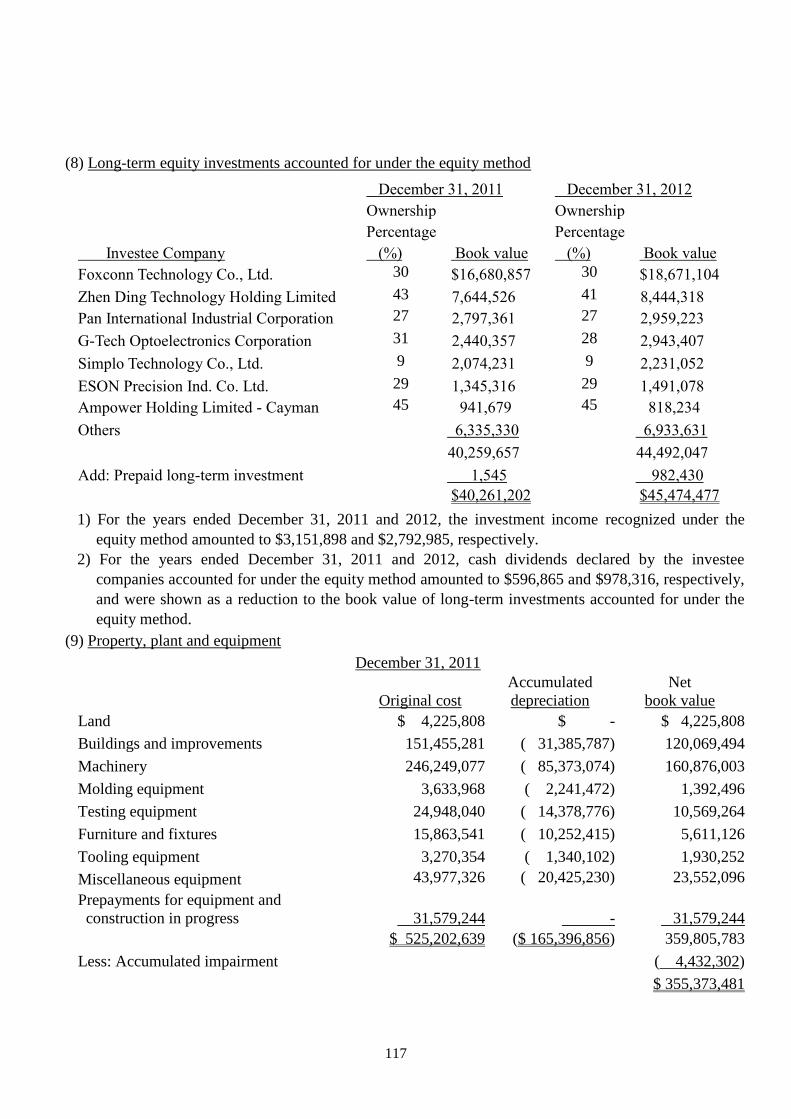
117
(8) Long-term equity investments accounted for under the equity method
December 31, 2011 December 31, 2012
Investee Company
Ownership
Percentage
(%) Book value
Ownership
Percentage
(%) Book value
Foxconn Technology Co., Ltd. 30 $16,680,857 30 $18,671,104
Zhen Ding Technology Holding Limited 43 7,644,526 41 8,444,318
Pan International Industrial Corporation 27 2,797,361 27 2,959,223
G-Tech Optoelectronics Corporation 31 2,440,357 28 2,943,407
Simplo Technology Co., Ltd. 9 2,074,231 9 2,231,052
ESON Precision Ind. Co. Ltd. 29 1,345,316 29 1,491,078
Ampower Holding Limited - Cayman 45 941,679 45 818,234
Others 6,335,330 6,933,631
40,259,657 44,492,047
Add: Prepaid long-term investment 1,545 982,430
$40,261,202 $45,474,477
1) For the years ended December 31, 2011 and 2012, the investment income recognized under the
equity method amounted to $3,151,898 and $2,792,985, respectively.
2) For the years ended December 31, 2011 and 2012, cash dividends declared by the investee
companies accounted for under the equity method amounted to $596,865 and $978,316, respectively,
and were shown as a reduction to the book value of long-term investments accounted for under the
equity method.
(9) Property, plant and equipment
December 31, 2011
Original cost
Accumulated
depreciation
Net
book value
Land $ 4,225,808 $ - $ 4,225,808
Buildings and improvements 151,455,281 ( 31,385,787) 120,069,494
Machinery 246,249,077 ( 85,373,074) 160,876,003
Molding equipment 3,633,968 ( 2,241,472) 1,392,496
Testing equipment 24,948,040 ( 14,378,776) 10,569,264
Furniture and fixtures 15,863,541 ( 10,252,415) 5,611,126
Tooling equipment 3,270,354 ( 1,340,102) 1,930,252
Miscellaneous equipment 43,977,326 ( 20,425,230) 23,552,096
Prepayments for equipment and
construction in progress 31,579,244 - 31,579,244
$ 525,202,639 ($ 165,396,856) 359,805,783
Less: Accumulated impairment ( 4,432,302)
$ 355,373,481
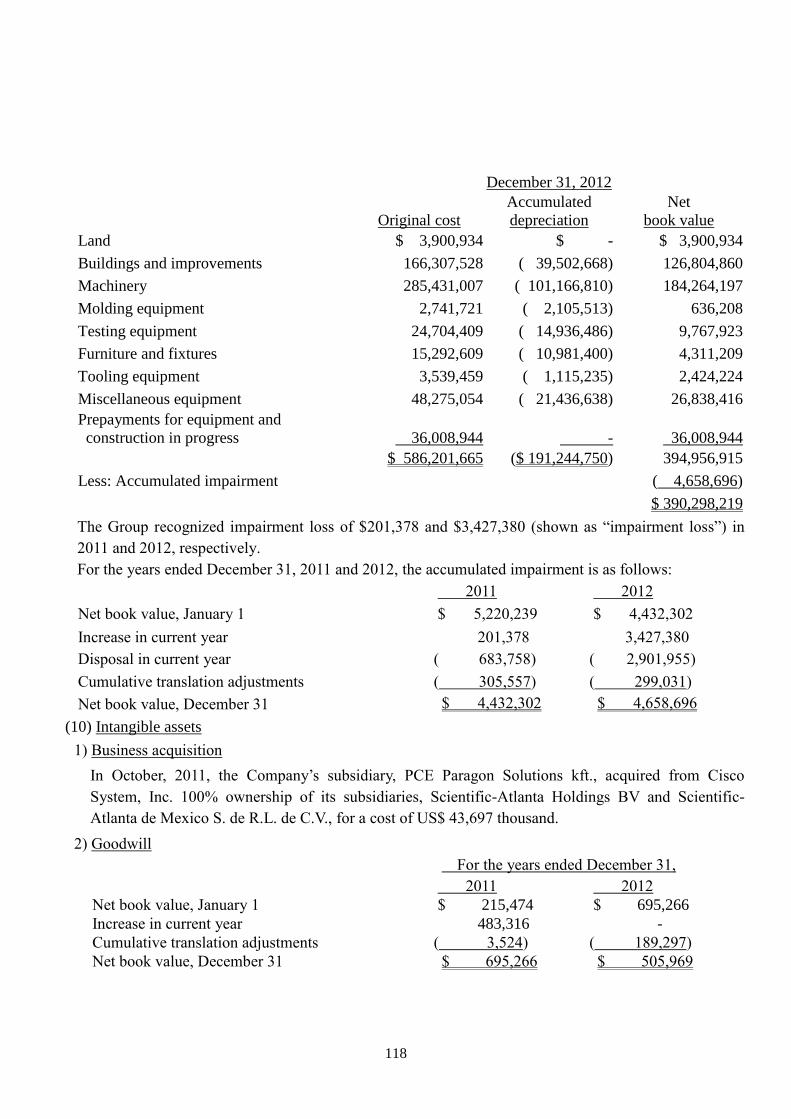
118
December 31, 2012
Original cost
Accumulated
depreciation
Net
book value
Land $ 3,900,934 $ - $ 3,900,934
Buildings and improvements 166,307,528 ( 39,502,668) 126,804,860
Machinery 285,431,007 ( 101,166,810) 184,264,197
Molding equipment 2,741,721 ( 2,105,513) 636,208
Testing equipment 24,704,409 ( 14,936,486) 9,767,923
Furniture and fixtures 15,292,609 ( 10,981,400) 4,311,209
Tooling equipment 3,539,459 ( 1,115,235) 2,424,224
Miscellaneous equipment 48,275,054 ( 21,436,638) 26,838,416
Prepayments for equipment and
construction in progress 36,008,944 - 36,008,944
$ 586,201,665 ($ 191,244,750) 394,956,915
Less: Accumulated impairment ( 4,658,696)
$ 390,298,219
The Group recognized impairment loss of $201,378 and $3,427,380 (shown as “impairment loss”) in
2011 and 2012, respectively.
For the years ended December 31, 2011 and 2012, the accumulated impairment is as follows:
2011 2012
Net book value, January 1 $ 5,220,239 $ 4,432,302
Increase in current year 201,378 3,427,380
Disposal in current year ( 683,758) ( 2,901,955)
Cumulative translation adjustments ( 305,557) ( 299,031)
Net book value, December 31 $ 4,432,302 $ 4,658,696
(10) Intangible assets
1) Business acquisition
In October, 2011, the Company’s subsidiary, PCE Paragon Solutions kft., acquired from Cisco
System, Inc. 100% ownership of its subsidiaries, Scientific-Atlanta Holdings BV and Scientific-
Atlanta de Mexico S. de R.L. de C.V., for a cost of US$ 43,697 thousand.
2) Goodwill
For the years ended December 31,
2011 2012
Net book value, January 1 $ 215,474 $ 695,266
Increase in current year 483,316 -
Cumulative translation adjustments ( 3,524) ( 189,297)
Net book value, December 31 $ 695,266 $ 505,969
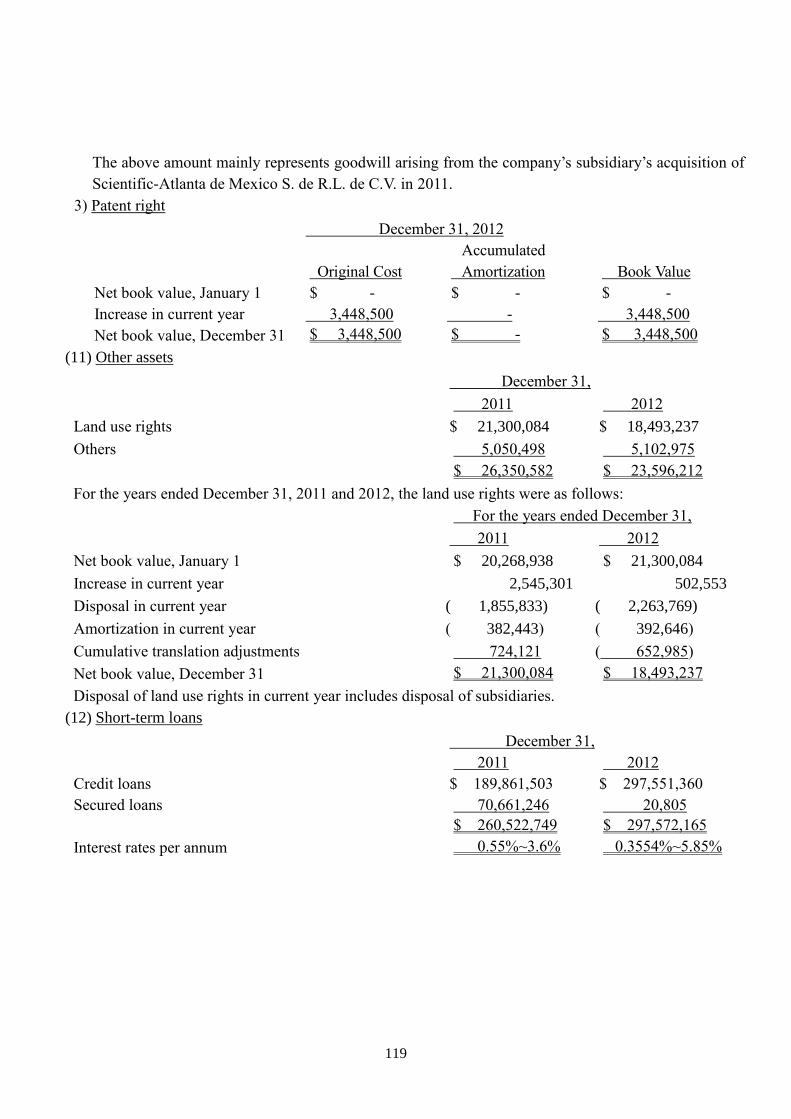
119
The above amount mainly represents goodwill arising from the company’s subsidiary’s acquisition of
Scientific-Atlanta de Mexico S. de R.L. de C.V. in 2011.
3) Patent right
December 31, 2012
Original Cost
Accumulated
Amortization
Book Value
Net book value, January 1 $ - $ - $ -
Increase in current year 3,448,500 - 3,448,500
Net book value, December 31 $ 3,448,500 $ - $ 3,448,500
(11) Other assets
December 31,
2011 2012
Land use rights $ 21,300,084 $ 18,493,237
Others 5,050,498 5,102,975
$ 26,350,582 $ 23,596,212
For the years ended December 31, 2011 and 2012, the land use rights were as follows:
For the years ended December 31,
2011 2012
Net book value, January 1 $ 20,268,938 $ 21,300,084
Increase in current year 2,545,301 502,553
Disposal in current year ( 1,855,833) ( 2,263,769)
Amortization in current year ( 382,443) ( 392,646)
Cumulative translation adjustments 724,121 ( 652,985)
Net book value, December 31 $ 21,300,084 $ 18,493,237
Disposal of land use rights in current year includes disposal of subsidiaries.
(12) Short-term loans
December 31,
2011 2012
Credit loans $ 189,861,503 $ 297,551,360
Secured loans 70,661,246 20,805
$ 260,522,749 $ 297,572,165
Interest rates per annum 0.55%~3.6% 0.3554%~5.85%
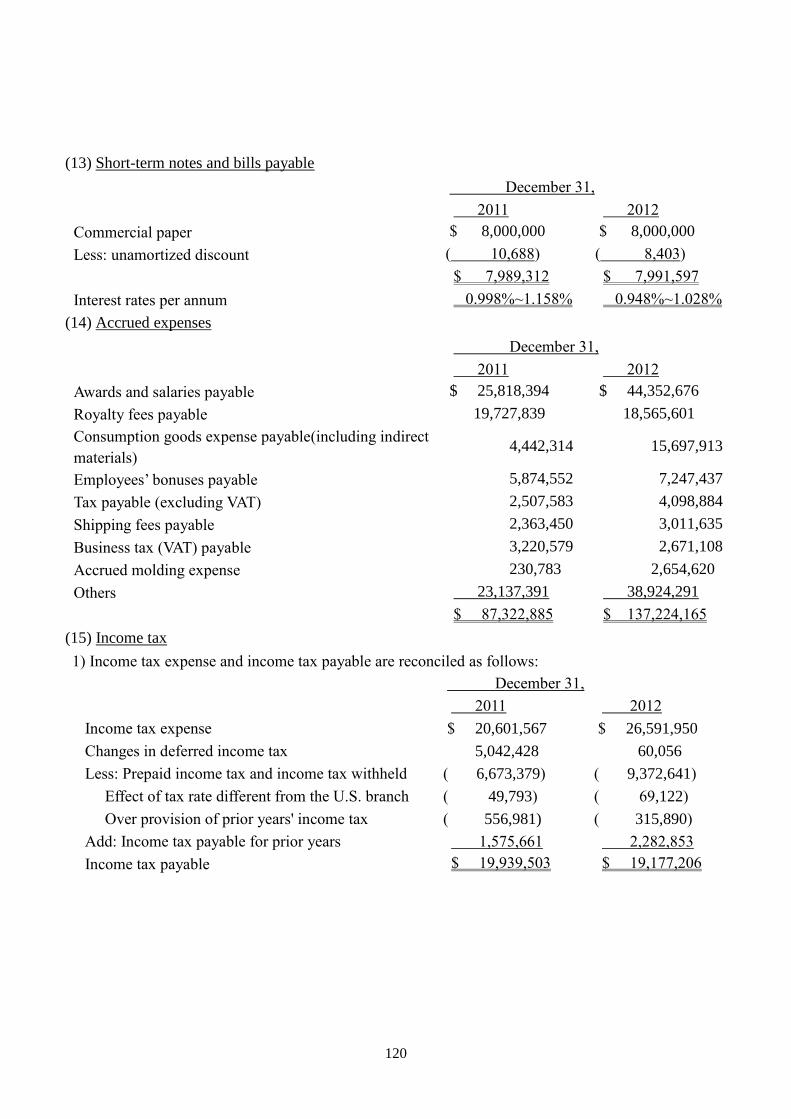
120
(13) Short-term notes and bills payable
December 31,
2011 2012
Commercial paper $ 8,000,000 $ 8,000,000
Less: unamortized discount ( 10,688) ( 8,403)
$ 7,989,312 $ 7,991,597
Interest rates per annum 0.998%~1.158% 0.948%~1.028%
(14) Accrued expenses
December 31,
2011 2012
Awards and salaries payable $ 25,818,394 $ 44,352,676
Royalty fees payable 19,727,839 18,565,601
Consumption goods expense payable(including indirect
materials) 4,442,314 15,697,913
Employees’ bonuses payable 5,874,552 7,247,437
Tax payable (excluding VAT) 2,507,583 4,098,884
Shipping fees payable 2,363,450 3,011,635
Business tax (VAT) payable 3,220,579 2,671,108
Accrued molding expense 230,783 2,654,620
Others 23,137,391 38,924,291
$ 87,322,885 $ 137,224,165
(15) Income tax
1) Income tax expense and income tax payable are reconciled as follows:
December 31,
2011 2012
Income tax expense $ 20,601,567 $ 26,591,950
Changes in deferred income tax 5,042,428 60,056
Less: Prepaid income tax and income tax withheld ( 6,673,379) ( 9,372,641)
Effect of tax rate different from the U.S. branch ( 49,793) ( 69,122)
Over provision of prior years' income tax ( 556,981) ( 315,890)
Add: Income tax payable for prior years 1,575,661 2,282,853
Income tax payable $ 19,939,503 $ 19,177,206
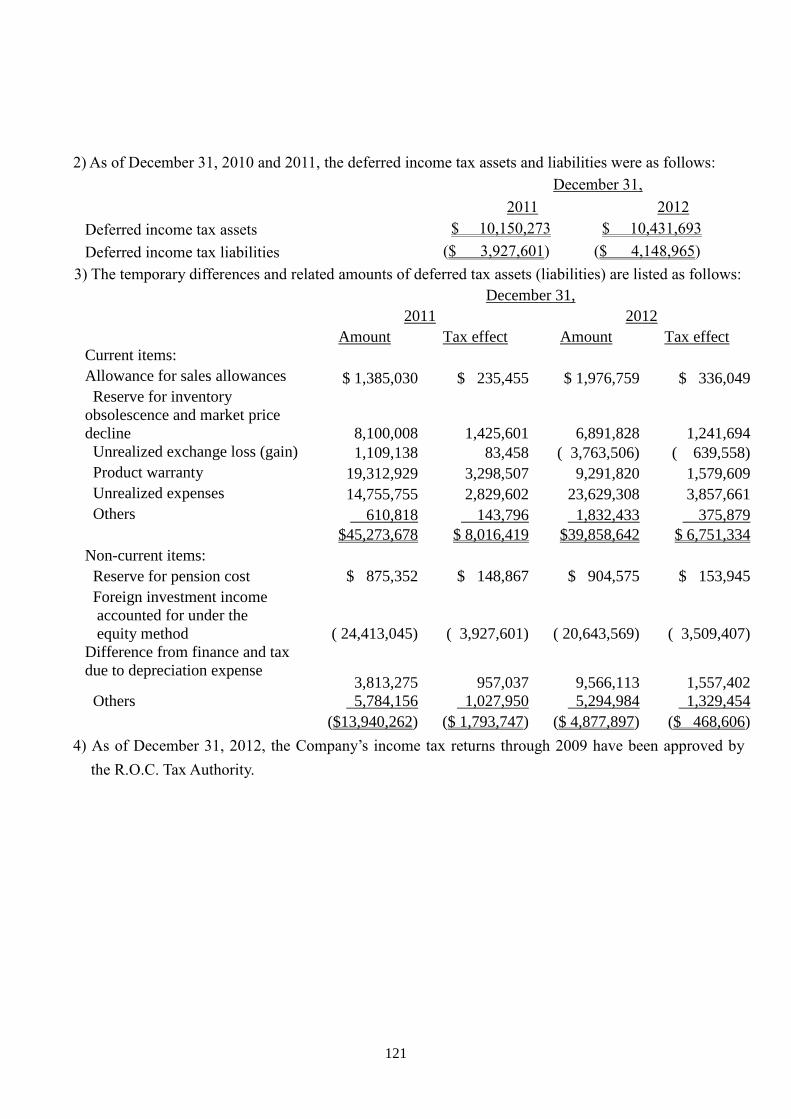
121
2) As of December 31, 2010 and 2011, the deferred income tax assets and liabilities were as follows:
December 31,
2011 2012
Deferred income tax assets $ 10,150,273 $ 10,431,693
Deferred income tax liabilities ($ 3,927,601) ($ 4,148,965)
3) The temporary differences and related amounts of deferred tax assets (liabilities) are listed as follows:
December 31,
2011 2012
Amount Tax effect Amount Tax effect
Current items:
Allowance for sales allowances $ 1,385,030 $ 235,455 $ 1,976,759 $ 336,049
Reserve for inventory
obsolescence and market price
decline 8,100,008 1,425,601 6,891,828 1,241,694
Unrealized exchange loss (gain) 1,109,138 83,458 ( 3,763,506) ( 639,558)
Product warranty 19,312,929 3,298,507 9,291,820 1,579,609
Unrealized expenses 14,755,755 2,829,602 23,629,308 3,857,661
Others 610,818 143,796 1,832,433 375,879
$45,273,678 $ 8,016,419 $39,858,642 $ 6,751,334
Non-current items:
Reserve for pension cost $ 875,352 $ 148,867 $ 904,575 $ 153,945
Foreign investment income
accounted for under the
equity method ( 24,413,045) ( 3,927,601) ( 20,643,569) ( 3,509,407)
Difference from finance and tax
due to depreciation expense 3,813,275 957,037 9,566,113 1,557,402
Others 5,784,156 1,027,950 5,294,984 1,329,454
($13,940,262) ($ 1,793,747) ($ 4,877,897) ($ 468,606)
4) As of December 31, 2012, the Company’s income tax returns through 2009 have been approved by
the R.O.C. Tax Authority.
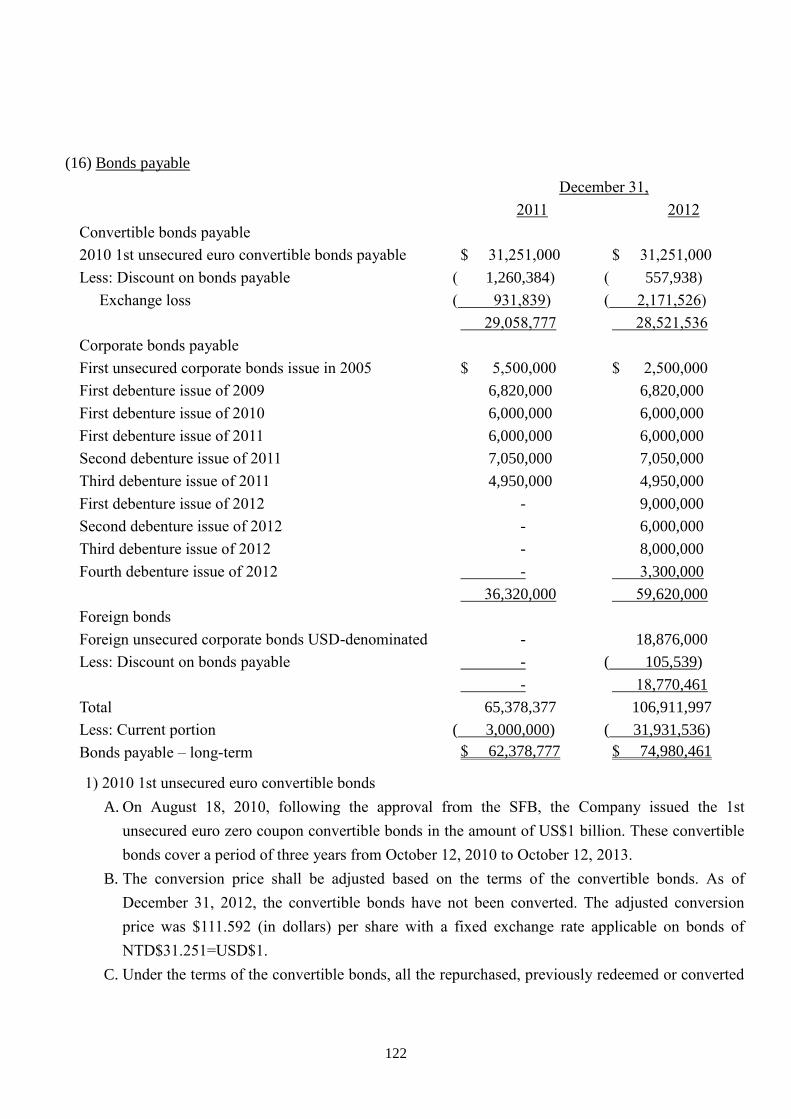
122
(16) Bonds payable
December 31,
2011 2012
Convertible bonds payable
2010 1st unsecured euro convertible bonds payable $ 31,251,000 $ 31,251,000
Less: Discount on bonds payable ( 1,260,384) ( 557,938)
Exchange loss ( 931,839) ( 2,171,526)
29,058,777 28,521,536
Corporate bonds payable
First unsecured corporate bonds issue in 2005 $ 5,500,000 $ 2,500,000
First debenture issue of 2009 6,820,000 6,820,000
First debenture issue of 2010 6,000,000 6,000,000
First debenture issue of 2011 6,000,000 6,000,000
Second debenture issue of 2011 7,050,000 7,050,000
Third debenture issue of 2011 4,950,000 4,950,000
First debenture issue of 2012 - 9,000,000
Second debenture issue of 2012 - 6,000,000
Third debenture issue of 2012 - 8,000,000
Fourth debenture issue of 2012 - 3,300,000
36,320,000 59,620,000
Foreign bonds
Foreign unsecured corporate bonds USD-denominated - 18,876,000
Less: Discount on bonds payable - ( 105,539)
- 18,770,461
Total 65,378,377 106,911,997
Less: Current portion ( 3,000,000) ( 31,931,536)
Bonds payable – long-term $ 62,378,777 $ 74,980,461
1) 2010 1st unsecured euro convertible bonds
A. On August 18, 2010, following the approval from the SFB, the Company issued the 1st
unsecured euro zero coupon convertible bonds in the amount of US$1 billion. These convertible
bonds cover a period of three years from October 12, 2010 to October 12, 2013.
B. The conversion price shall be adjusted based on the terms of the convertible bonds. As of
December 31, 2012, the convertible bonds have not been converted. The adjusted conversion
price was $111.592 (in dollars) per share with a fixed exchange rate applicable on bonds of
NTD$31.251=USD$1.
C. Under the terms of the convertible bonds, all the repurchased, previously redeemed or converted
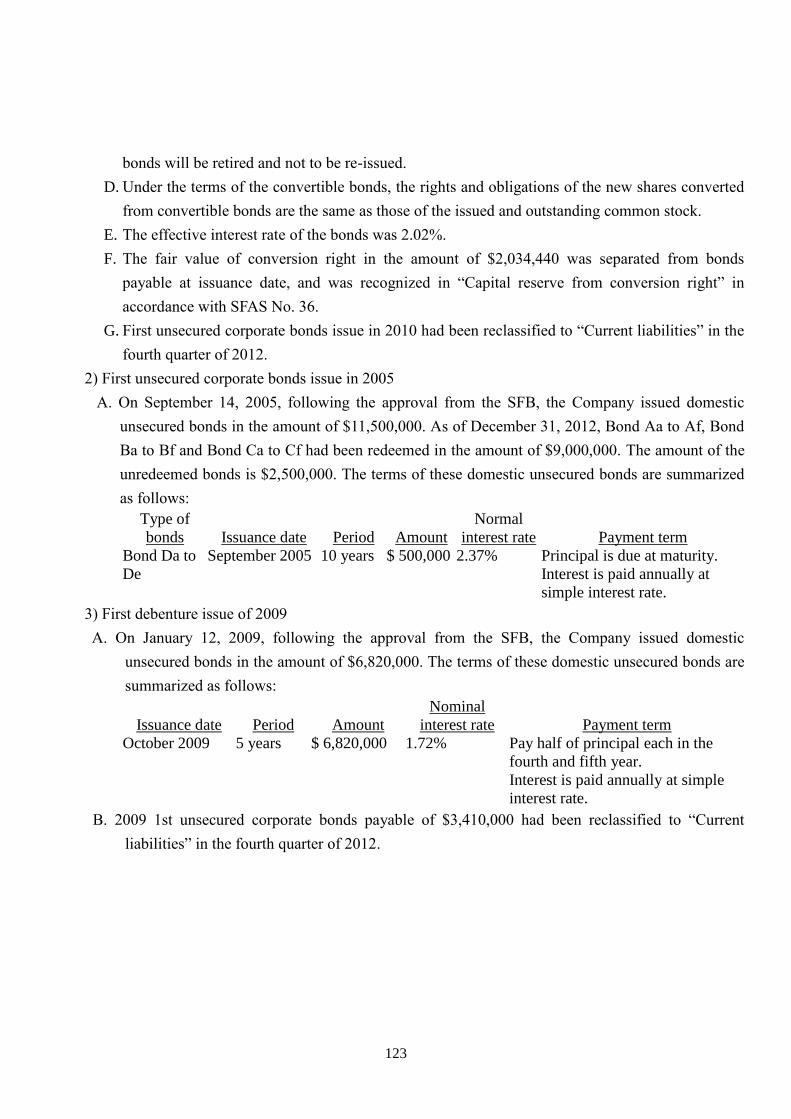
123
bonds will be retired and not to be re-issued.
D. Under the terms of the convertible bonds, the rights and obligations of the new shares converted
from convertible bonds are the same as those of the issued and outstanding common stock.
E. The effective interest rate of the bonds was 2.02%.
F. The fair value of conversion right in the amount of $2,034,440 was separated from bonds
payable at issuance date, and was recognized in “Capital reserve from conversion right” in
accordance with SFAS No. 36.
G. First unsecured corporate bonds issue in 2010 had been reclassified to “Current liabilities” in the
fourth quarter of 2012.
2) First unsecured corporate bonds issue in 2005
A. On September 14, 2005, following the approval from the SFB, the Company issued domestic
unsecured bonds in the amount of $11,500,000. As of December 31, 2012, Bond Aa to Af, Bond
Ba to Bf and Bond Ca to Cf had been redeemed in the amount of $9,000,000. The amount of the
unredeemed bonds is $2,500,000. The terms of these domestic unsecured bonds are summarized
as follows:
Type of
bonds Issuance date Period Amount
Normal
interest rate Payment term
Bond Da to
De
September 2005 10 years $ 500,000 2.37% Principal is due at maturity.
Interest is paid annually at
simple interest rate.
3) First debenture issue of 2009
A. On January 12, 2009, following the approval from the SFB, the Company issued domestic
unsecured bonds in the amount of $6,820,000. The terms of these domestic unsecured bonds are
summarized as follows:
Issuance date Period Amount
Nominal
interest rate Payment term
October 2009 5 years $ 6,820,000 1.72% Pay half of principal each in the
fourth and fifth year.
Interest is paid annually at simple
interest rate.
B. 2009 1st unsecured corporate bonds payable of $3,410,000 had been reclassified to “Current
liabilities” in the fourth quarter of 2012.
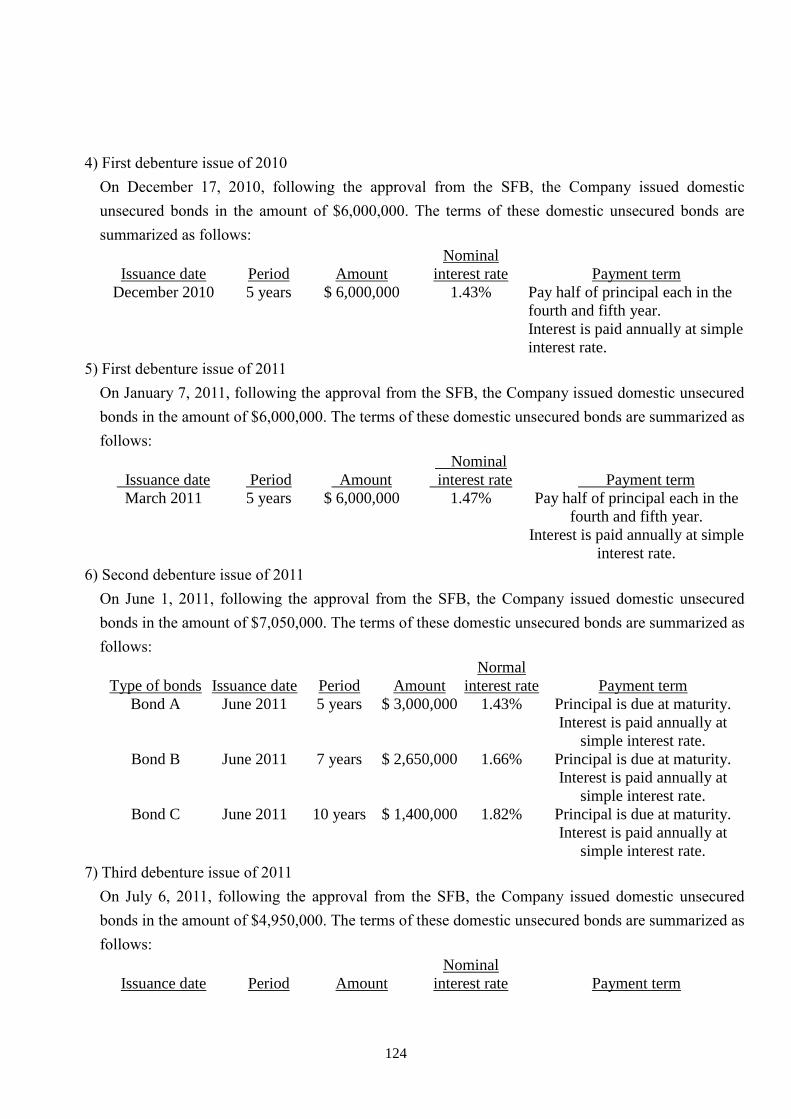
124
4) First debenture issue of 2010
On December 17, 2010, following the approval from the SFB, the Company issued domestic
unsecured bonds in the amount of $6,000,000. The terms of these domestic unsecured bonds are
summarized as follows:
Issuance date Period Amount
Nominal
interest rate Payment term
December 2010 5 years $ 6,000,000 1.43% Pay half of principal each in the
fourth and fifth year.
Interest is paid annually at simple
interest rate.
5) First debenture issue of 2011
On January 7, 2011, following the approval from the SFB, the Company issued domestic unsecured
bonds in the amount of $6,000,000. The terms of these domestic unsecured bonds are summarized as
follows:
Issuance date Period Amount
Nominal
interest rate Payment term
March 2011 5 years $ 6,000,000 1.47% Pay half of principal each in the
fourth and fifth year.
Interest is paid annually at simple
interest rate.
6) Second debenture issue of 2011
On June 1, 2011, following the approval from the SFB, the Company issued domestic unsecured
bonds in the amount of $7,050,000. The terms of these domestic unsecured bonds are summarized as
follows:
Type of bonds Issuance date Period Amount
Normal
interest rate Payment term
Bond A June 2011 5 years $ 3,000,000 1.43% Principal is due at maturity.
Interest is paid annually at
simple interest rate.
Bond B June 2011 7 years $ 2,650,000 1.66% Principal is due at maturity.
Interest is paid annually at
simple interest rate.
Bond C June 2011 10 years $ 1,400,000 1.82% Principal is due at maturity.
Interest is paid annually at
simple interest rate.
7) Third debenture issue of 2011
On July 6, 2011, following the approval from the SFB, the Company issued domestic unsecured
bonds in the amount of $4,950,000. The terms of these domestic unsecured bonds are summarized as
follows:
Issuance date Period Amount
Nominal
interest rate Payment term
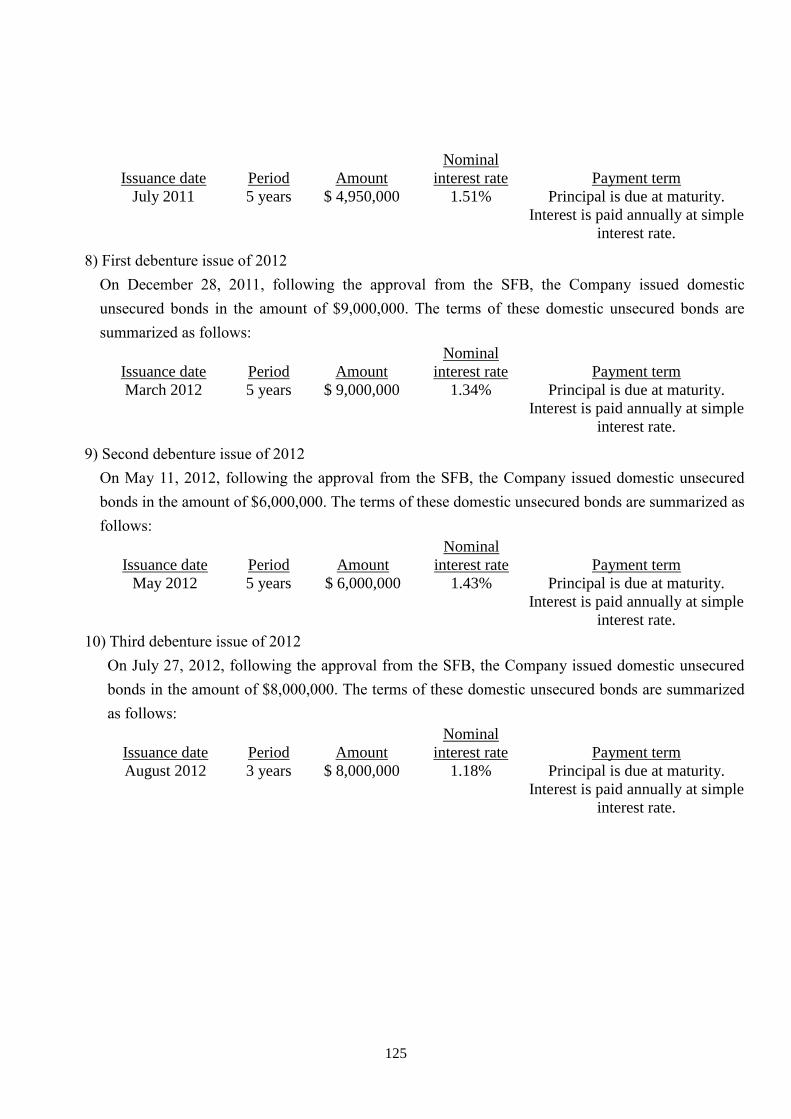
125
Issuance date Period Amount
Nominal
interest rate Payment term
July 2011 5 years $ 4,950,000 1.51% Principal is due at maturity.
Interest is paid annually at simple
interest rate.
8) First debenture issue of 2012
On December 28, 2011, following the approval from the SFB, the Company issued domestic
unsecured bonds in the amount of $9,000,000. The terms of these domestic unsecured bonds are
summarized as follows:
Issuance date Period Amount
Nominal
interest rate Payment term
March 2012 5 years $ 9,000,000 1.34% Principal is due at maturity.
Interest is paid annually at simple
interest rate.
9) Second debenture issue of 2012
On May 11, 2012, following the approval from the SFB, the Company issued domestic unsecured
bonds in the amount of $6,000,000. The terms of these domestic unsecured bonds are summarized as
follows:
Issuance date Period Amount
Nominal
interest rate Payment term
May 2012 5 years $ 6,000,000 1.43% Principal is due at maturity.
Interest is paid annually at simple
interest rate.
10) Third debenture issue of 2012
On July 27, 2012, following the approval from the SFB, the Company issued domestic unsecured
bonds in the amount of $8,000,000. The terms of these domestic unsecured bonds are summarized
as follows:
Issuance date Period Amount
Nominal
interest rate Payment term
August 2012 3 years $ 8,000,000 1.18% Principal is due at maturity.
Interest is paid annually at simple
interest rate.
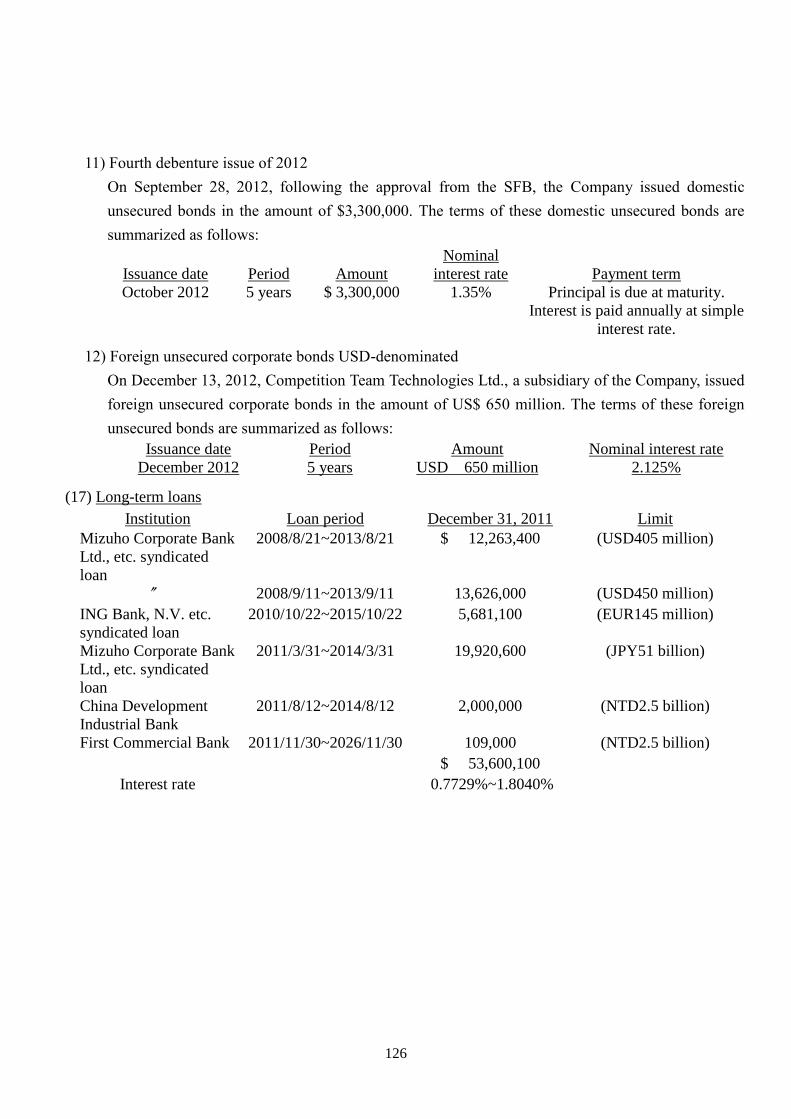
126
11) Fourth debenture issue of 2012
On September 28, 2012, following the approval from the SFB, the Company issued domestic
unsecured bonds in the amount of $3,300,000. The terms of these domestic unsecured bonds are
summarized as follows:
Issuance date Period Amount
Nominal
interest rate Payment term
October 2012 5 years $ 3,300,000 1.35% Principal is due at maturity.
Interest is paid annually at simple
interest rate.
12) Foreign unsecured corporate bonds USD-denominated
On December 13, 2012, Competition Team Technologies Ltd., a subsidiary of the Company, issued
foreign unsecured corporate bonds in the amount of US$ 650 million. The terms of these foreign
unsecured bonds are summarized as follows:
Issuance date Period Amount Nominal interest rate
December 2012 5 years USD 650 million 2.125%
(17) Long-term loans
Institution Loan period December 31, 2011 Limit
Mizuho Corporate Bank
Ltd., etc. syndicated
loan
2008/8/21~2013/8/21 $ 12,263,400 (USD405 million)
〞 2008/9/11~2013/9/11 13,626,000 (USD450 million)
ING Bank, N.V. etc.
syndicated loan
2010/10/22~2015/10/22 5,681,100 (EUR145 million)
Mizuho Corporate Bank
Ltd., etc. syndicated
loan
2011/3/31~2014/3/31 19,920,600 (JPY51 billion)
China Development
Industrial Bank
2011/8/12~2014/8/12 2,000,000 (NTD2.5 billion)
First Commercial Bank 2011/11/30~2026/11/30 109,000 (NTD2.5 billion)
$ 53,600,100
Interest rate 0.7729%~1.8040%
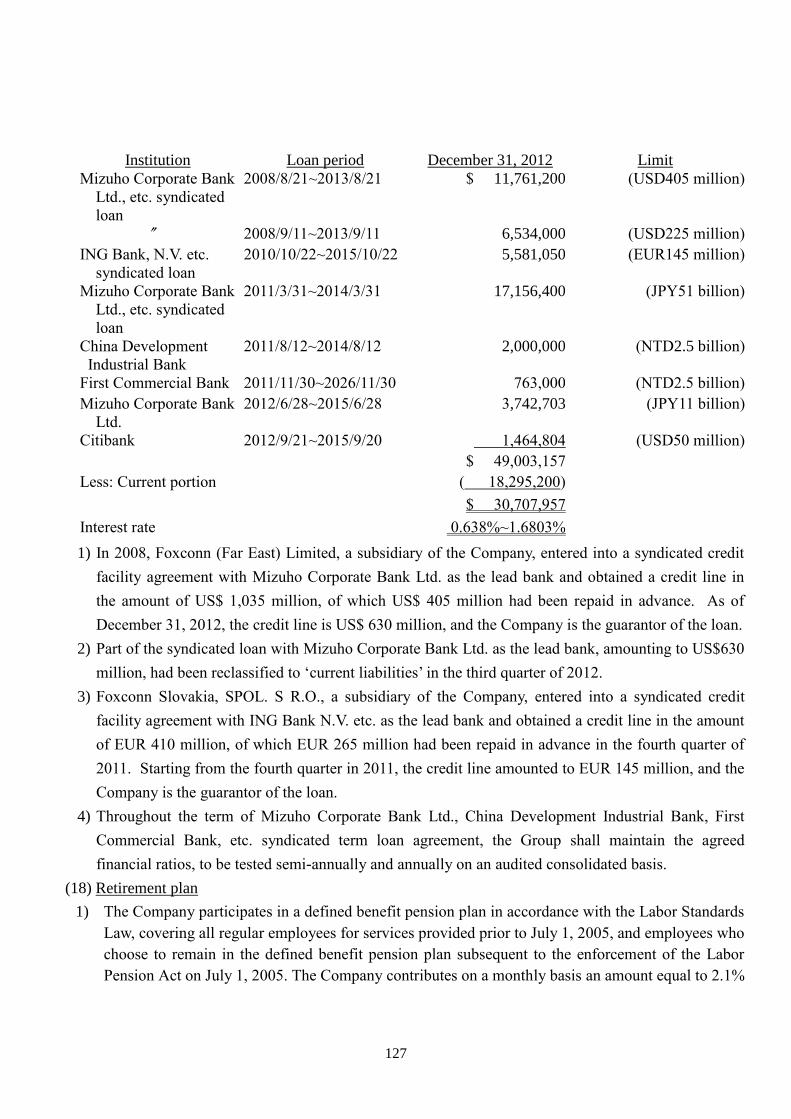
127
Institution Loan period December 31, 2012 Limit
Mizuho Corporate Bank
Ltd., etc. syndicated
loan
2008/8/21~2013/8/21 $ 11,761,200 (USD405 million)
〞 2008/9/11~2013/9/11 6,534,000 (USD225 million)
ING Bank, N.V. etc.
syndicated loan
2010/10/22~2015/10/22 5,581,050 (EUR145 million)
Mizuho Corporate Bank
Ltd., etc. syndicated
loan
2011/3/31~2014/3/31 17,156,400 (JPY51 billion)
China Development
Industrial Bank
2011/8/12~2014/8/12 2,000,000 (NTD2.5 billion)
First Commercial Bank 2011/11/30~2026/11/30 763,000 (NTD2.5 billion)
Mizuho Corporate Bank
Ltd.
2012/6/28~2015/6/28 3,742,703 (JPY11 billion)
Citibank 2012/9/21~2015/9/20 1,464,804 (USD50 million)
$ 49,003,157
Less: Current portion ( 18,295,200)
$ 30,707,957
Interest rate 0.638%~1.6803%
1) In 2008, Foxconn (Far East) Limited, a subsidiary of the Company, entered into a syndicated credit
facility agreement with Mizuho Corporate Bank Ltd. as the lead bank and obtained a credit line in
the amount of US$ 1,035 million, of which US$ 405 million had been repaid in advance. As of
December 31, 2012, the credit line is US$ 630 million, and the Company is the guarantor of the loan.
2) Part of the syndicated loan with Mizuho Corporate Bank Ltd. as the lead bank, amounting to US$630
million, had been reclassified to ‘current liabilities’ in the third quarter of 2012.
3) Foxconn Slovakia, SPOL. S R.O., a subsidiary of the Company, entered into a syndicated credit
facility agreement with ING Bank N.V. etc. as the lead bank and obtained a credit line in the amount
of EUR 410 million, of which EUR 265 million had been repaid in advance in the fourth quarter of
2011. Starting from the fourth quarter in 2011, the credit line amounted to EUR 145 million, and the
Company is the guarantor of the loan.
4) Throughout the term of Mizuho Corporate Bank Ltd., China Development Industrial Bank, First
Commercial Bank, etc. syndicated term loan agreement, the Group shall maintain the agreed
financial ratios, to be tested semi-annually and annually on an audited consolidated basis.
(18) Retirement plan
1) The Company participates in a defined benefit pension plan in accordance with the Labor Standards
Law, covering all regular employees for services provided prior to July 1, 2005, and employees who
choose to remain in the defined benefit pension plan subsequent to the enforcement of the Labor
Pension Act on July 1, 2005. The Company contributes on a monthly basis an amount equal to 2.1%
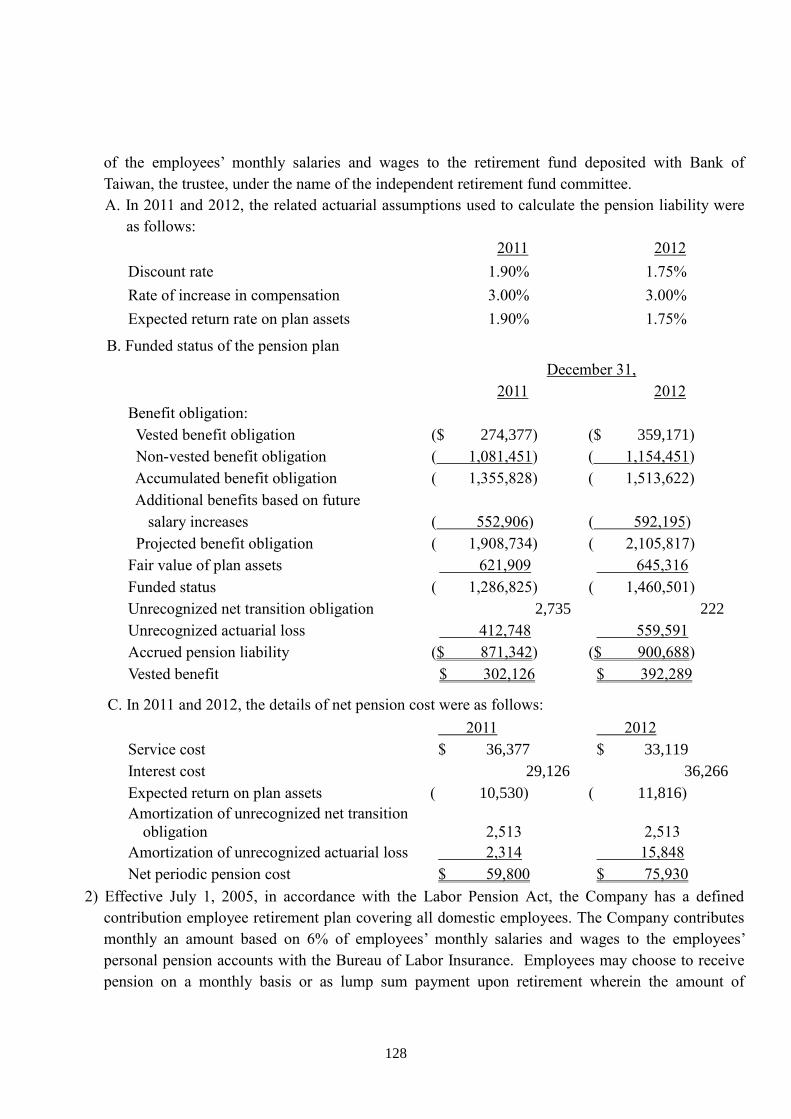
128
of the employees’ monthly salaries and wages to the retirement fund deposited with Bank of
Taiwan, the trustee, under the name of the independent retirement fund committee.
A. In 2011 and 2012, the related actuarial assumptions used to calculate the pension liability were
as follows:
2011 2012
Discount rate 1.90% 1.75%
Rate of increase in compensation 3.00% 3.00%
Expected return rate on plan assets 1.90% 1.75%
B. Funded status of the pension plan
December 31,
2011 2012
Benefit obligation:
Vested benefit obligation ($ 274,377) ($ 359,171)
Non-vested benefit obligation ( 1,081,451) ( 1,154,451)
Accumulated benefit obligation ( 1,355,828) ( 1,513,622)
Additional benefits based on future
salary increases ( 552,906) ( 592,195)
Projected benefit obligation ( 1,908,734) ( 2,105,817)
Fair value of plan assets 621,909 645,316
Funded status ( 1,286,825) ( 1,460,501)
Unrecognized net transition obligation 2,735 222
Unrecognized actuarial loss 412,748 559,591
Accrued pension liability ($ 871,342) ($ 900,688)
Vested benefit $ 302,126 $ 392,289
C. In 2011 and 2012, the details of net pension cost were as follows:
2011 2012
Service cost $ 36,377 $ 33,119
Interest cost 29,126 36,266
Expected return on plan assets ( 10,530) ( 11,816)
Amortization of unrecognized net transition
obligation 2,513 2,513
Amortization of unrecognized actuarial loss 2,314 15,848
Net periodic pension cost $ 59,800 $ 75,930
2) Effective July 1, 2005, in accordance with the Labor Pension Act, the Company has a defined
contribution employee retirement plan covering all domestic employees. The Company contributes
monthly an amount based on 6% of employees’ monthly salaries and wages to the employees’
personal pension accounts with the Bureau of Labor Insurance. Employees may choose to receive
pension on a monthly basis or as lump sum payment upon retirement wherein the amount of
129
benefits is the account balance plus accumulated investment gains. The pension expenses under
this plan amounted to $301,182 and $305,101 for the years ended December 31, 2011 and 2012,
respectively.
3) The subsidiaries in mainland China have defined contribution pension plans and contribute an
amount monthly based on 8%~9% of employees’ monthly salaries and wages to an independent
fund administered by a government agency. The plan is administered by the government of
mainland China and the subsidiaries do not have further pension liabilities.
4) As of December 31, 2011 and 2012, the subsidiaries which participated in defined contribution
pension plans recognized reserve according to the respective local laws for retirement plan in the
amount of $192,958 and $202,707, respectively. Pension expenses in the amount of $7,959,174 and
$15,269,556 were recognized for the years ended December 31, 2011 and 2012, respectively.
(19) Capital stock
1) As of December 31, 2012, the Company’s authorized shares were 12,230,000 thousand shares
(including 200 million shares reserved for employee stock options or convertible bonds) and the
issued and outstanding common stock were 11,835,867 thousand shares with a par value of $10 (in
dollars) per share.
2) On June 18, 2012, the Company’s shareholders adopted a resolution to increase the authorized
shares to 15 billion shares and approved employees’ stock bonus amounting to $5,874,552 for 2011.
The employee stock bonus of 77,860 thousand shares was determined based on the closing price of
$75.45 (in dollars) on June 15, 2012, the previous day of the 2012 shareholders’ meeting after
taking into account the effects of ex-rights and ex-dividends. In addition, the Company’s
shareholders adopted a resolution to issue stock dividends at par value amounting to $10,689,097.
3) Pursuant to the resolution adopted at the stockholders' meeting held on June 1, 1999, and after
obtaining approval from the SFC, the Company issued 25 million units of global depository receipts
(GDRs) in Europe, Asia and the USA, comprising 50 million shares of common stock (Deposited
Shares). The issuance amounted to USD347,250 thousand, and the main terms and conditions of the
GDRs are as follows:
A. Voting
Holders of GDRs have no right to directly exercise voting rights or attend the Company’s
stockholders' meeting, except when a motion is on the election of directors or supervisors.
A holder or holders together holding at least 51% of the GDRs outstanding at the relevant record
date of the stockholders' meeting can instruct the Depositary to vote in the same direction in
respect of one or more resolutions to be proposed at the meeting.
B. Sale and withdrawal of GDRs
Under the current R.O.C. law, shares represented by the GDRs may be withdrawn by holders of
GDRs commencing three months after the initial issue of GDRs. A holder of a GDR may,
provided that the Company has delivered to the custodian physical share certificates in respect
of the Deposited Shares, request the Depositary to sell or cause to be sold on behalf of such
holder the shares represented by such GDRs.
130
C. Dividends
GDR holders are entitled to receive dividends to the same extent as the holders of common
stock subject to the terms of the Deposit Agreement and applicable laws of the R.O.C.
D. As of December 31, 2012, 157,010,000 units of GDRs were outstanding, which represents
314,019 thousand shares of common stock.
(20) Share-based payment - employee compensation plan
As of December 31, 2011 and 2012, the share-based payment transactions of Foxconn International
Holdings Limited, a subsidiary of the Company (listed on the Stock Exchange of Hong Kong), are set
forth below:
Type of arrangement Grant date
Quantity
granted
Contract
period
Vesting conditions/
Restricted terms
Employee stock options September 12, 2007 2,400,000 1 ~ 6 years Note (1)
〞 July 8, 2011 256,159,719 1 ~ 3 years 〞
Share appreciation rights January 1, 2006 7,343,564 1 ~ 3 years -
Other share-based
payment plans
December 29, 2006 5,748,145 - Note (2)
〞 July 24, 2007 502,090 - Note (3)
〞 December 28, 2007 20,459,322 - Note (4)
〞 October 29, 2009 26,161,489 - -
〞 April 27, 2010 9,435,264 - -
〞 November 19, 2010 25,616,428 - -
〞 December 29, 2010 35,573,029 - -
〞 April 29, 2011 3,302,725 - -
〞 July 8, 2011 5,138,266 - -
〞 October 18, 2011 21,948,624 - -
〞 December 29, 2011 62,423,773 - Note (5)
〞 December 28, 2012 135,564,990 - Note (6)
Note 1: Vested upon completion of certain years’ service.
Note 2: Of the shares granted, 2,737,718 shares cannot be sold within 1 to 3 years from the grant
date.
Note 3: Of the shares granted, 407,000 shares cannot be sold within 1 to 2 years from the grant date.
Note 4: Of the shares granted, 20,362,078 shares cannot be sold within 1 to 3 years from the grant
date.
Note 5: Of the shares granted, 13,939,379 shares cannot be sold within 1 to 2 years from the grant
date.
Note 6: Of the shares granted, 14,934,766 shares cannot be sold within 1 to 2 years from the grant
date.
131
1) Employee stock options
For the stock options granted with the compensation cost accounted for using the fair value method,
their fair value on the grant date is estimated using the Black-Scholes option-pricing model. The
weighted-average parameters used in the estimation of the fair value are as follows:
Grant date
Stock
price
(HK$)
Exercise
price
(HK$)
Expected
price
volatility
Expected
dividend
yield rate
Risk-free
interest
rate
Fair value per
share (US$)
September 12, 2007(A) 19.46 20.63 36% - 3.92% 0.86
July 8, 2011 3.62 3.62 37% - 0.297%~
0.667%
0.11
For the years ended December 31, 2011 and 2012, the weighted-average exercise price of employee
stock options outstanding were US$0 and US$0.7 (in dollars) per share, respectively, and expenses
incurred on employee stock options transactions were $404,788 (US$13,773 thousand) and
$245,461 (US$8,301 thousand), respectively. Details of the employee stock options are set forth
below:
For the years ended December 31,
Employee Stock Options (In shares) 2011 2012
Options outstanding at beginning of year 227,459,105 253,061,762
Options granted 256,159,719 -
Options exercised - ( 29,548,295)
Options revoked ( 230,105,486) ( 17,138,833)
Options canceled ( 451,576) -
Options outstanding at end of year 253,061,762 206,374,634
Options exercisable at end of year 1,600,000 51,323,616
2) Share appreciation rights
There is no stock appreciation rights outstanding as of December 31, 2011 and 2012.
3) Other share-based payment plans
These share-based payments were granted to employees. For the years ended December 31, 2011
and 2012, expenses incurred on other share-based payments were $1,434,996 (US$48,826
thousand) and $1,946,238 (US$65,818 thousand), respectively.
(21) Capital reserve
1) Pursuant to the R.O.C. Company Law, capital reserve arising from paid-in capital in excess of par
value on issuance of common stocks and donations can be used to cover accumulated deficit or to
issue new stocks or cash to shareholders in proportion to their share ownership, provided that the
Company has no accumulated deficit. Further, the R.O.C. Securities and Exchange Law requires
that the amount of capital reserve to be capitalized mentioned above should not exceed 10% of the
paid-in capital each year. Capital reserve should not be used to cover accumulated deficit unless the
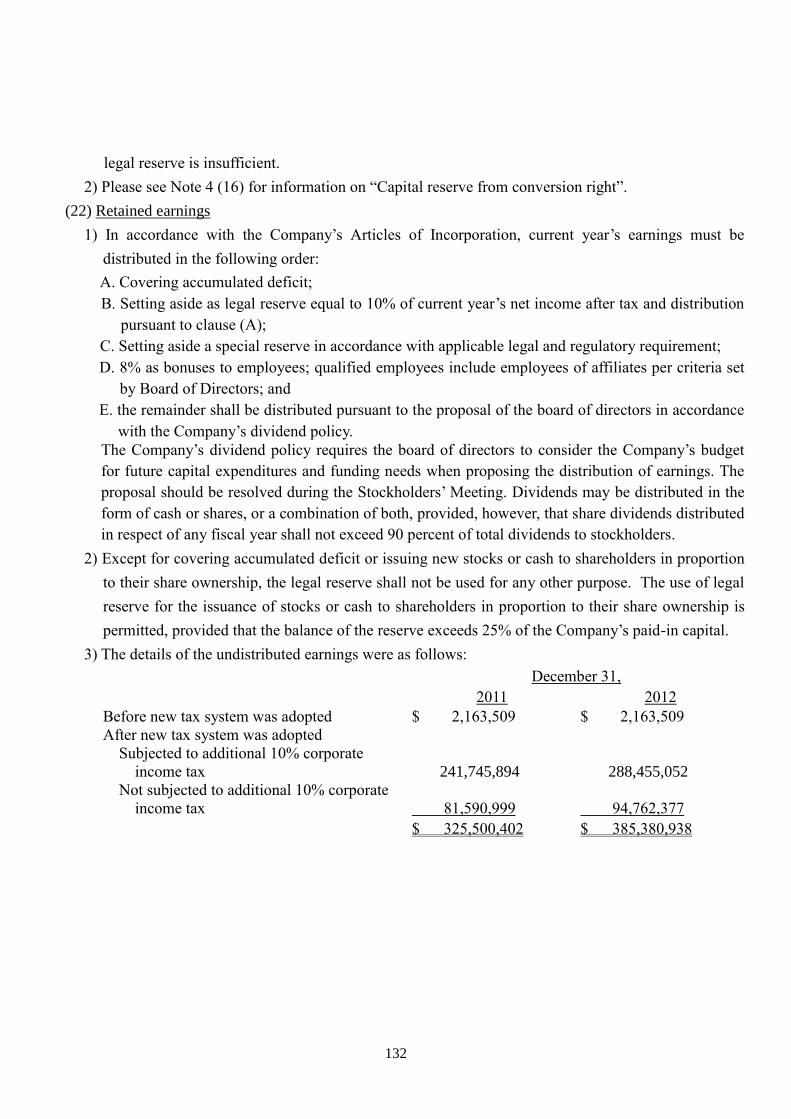
132
legal reserve is insufficient.
2) Please see Note 4 (16) for information on “Capital reserve from conversion right”.
(22) Retained earnings
1) In accordance with the Company’s Articles of Incorporation, current year’s earnings must be
distributed in the following order:
A. Covering accumulated deficit;
B. Setting aside as legal reserve equal to 10% of current year’s net income after tax and distribution
pursuant to clause (A);
C. Setting aside a special reserve in accordance with applicable legal and regulatory requirement;
D. 8% as bonuses to employees; qualified employees include employees of affiliates per criteria set
by Board of Directors; and
E. the remainder shall be distributed pursuant to the proposal of the board of directors in accordance
with the Company’s dividend policy.
The Company’s dividend policy requires the board of directors to consider the Company’s budget
for future capital expenditures and funding needs when proposing the distribution of earnings. The
proposal should be resolved during the Stockholders’ Meeting. Dividends may be distributed in the
form of cash or shares, or a combination of both, provided, however, that share dividends distributed
in respect of any fiscal year shall not exceed 90 percent of total dividends to stockholders.
2) Except for covering accumulated deficit or issuing new stocks or cash to shareholders in proportion
to their share ownership, the legal reserve shall not be used for any other purpose. The use of legal
reserve for the issuance of stocks or cash to shareholders in proportion to their share ownership is
permitted, provided that the balance of the reserve exceeds 25% of the Company’s paid-in capital.
3) The details of the undistributed earnings were as follows:
December 31,
2011 2012
Before new tax system was adopted $ 2,163,509 $ 2,163,509
After new tax system was adopted
Subjected to additional 10% corporate
income tax 241,745,894 288,455,052
Not subjected to additional 10% corporate
income tax 81,590,999 94,762,377
$ 325,500,402 $ 385,380,938
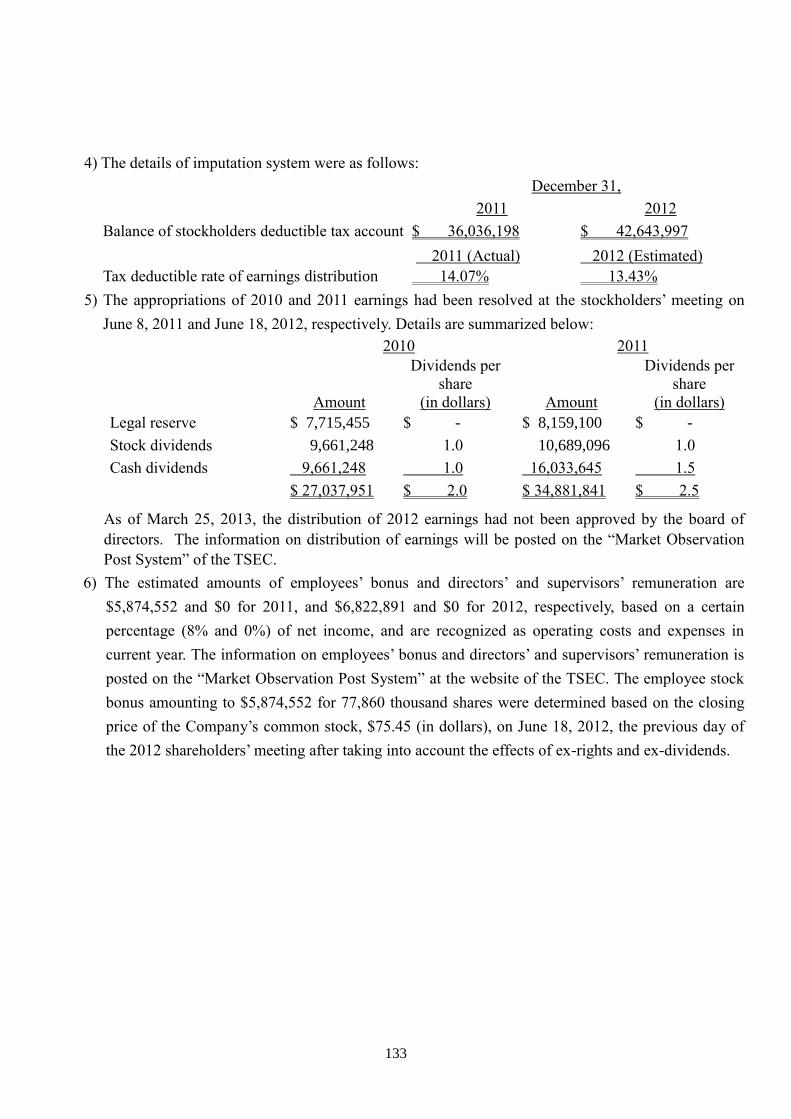
133
4) The details of imputation system were as follows:
December 31,
2011 2012
Balance of stockholders deductible tax account $ 36,036,198 $ 42,643,997
2011 (Actual) 2012 (Estimated)
Tax deductible rate of earnings distribution 14.07% 13.43%
5) The appropriations of 2010 and 2011 earnings had been resolved at the stockholders’ meeting on
June 8, 2011 and June 18, 2012, respectively. Details are summarized below:
2010 2011
Amount
Dividends per
share
(in dollars) Amount
Dividends per
share
(in dollars)
Legal reserve $ 7,715,455 $ - $ 8,159,100 $ -
Stock dividends 9,661,248 1.0 10,689,096 1.0
Cash dividends 9,661,248 1.0 16,033,645 1.5
$ 27,037,951 $ 2.0 $ 34,881,841 $ 2.5
As of March 25, 2013, the distribution of 2012 earnings had not been approved by the board of
directors. The information on distribution of earnings will be posted on the “Market Observation
Post System” of the TSEC.
6) The estimated amounts of employees’ bonus and directors’ and supervisors’ remuneration are
$5,874,552 and $0 for 2011, and $6,822,891 and $0 for 2012, respectively, based on a certain
percentage (8% and 0%) of net income, and are recognized as operating costs and expenses in
current year. The information on employees’ bonus and directors’ and supervisors’ remuneration is
posted on the “Market Observation Post System” at the website of the TSEC. The employee stock
bonus amounting to $5,874,552 for 77,860 thousand shares were determined based on the closing
price of the Company’s common stock, $75.45 (in dollars), on June 18, 2012, the previous day of
the 2012 shareholders’ meeting after taking into account the effects of ex-rights and ex-dividends.
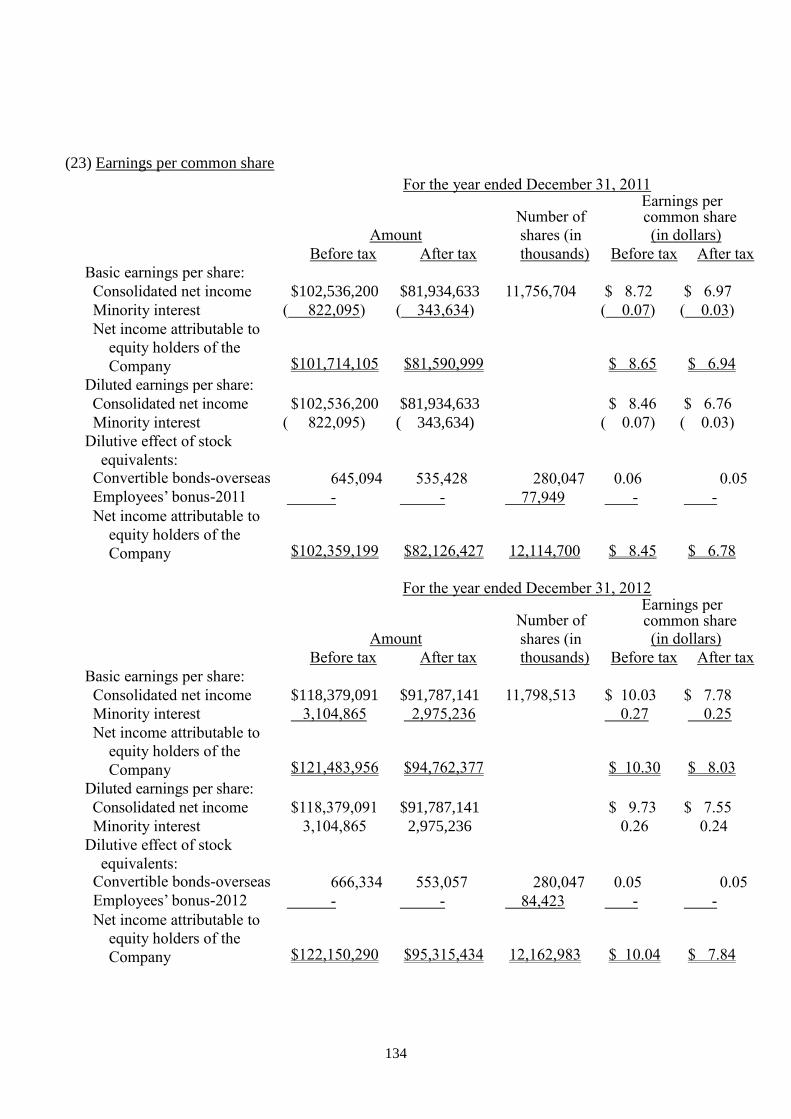
134
(23) Earnings per common share
For the year ended December 31, 2011
Amount
Number of
shares (in
thousands)
Earnings per common share
(in dollars)
Before tax After tax Before tax After tax
Basic earnings per share:
Consolidated net income $102,536,200 $81,934,633 11,756,704 $ 8.72 $ 6.97
Minority interest ( 822,095) ( 343,634) ( 0.07) ( 0.03)
Net income attributable to
equity holders of the
Company $101,714,105 $81,590,999 $ 8.65 $ 6.94
Diluted earnings per share:
Consolidated net income $102,536,200 $81,934,633 $ 8.46 $ 6.76
Minority interest ( 822,095) ( 343,634) ( 0.07) ( 0.03)
Dilutive effect of stock
equivalents: Convertible bonds-overseas 645,094 535,428 280,047 0.06 0.05
Employees’ bonus-2011 - - 77,949 - -
Net income attributable to
equity holders of the
Company $102,359,199 $82,126,427 12,114,700 $ 8.45 $ 6.78
For the year ended December 31, 2012
Amount
Number of
shares (in
thousands)
Earnings per common share
(in dollars)
Before tax After tax Before tax After tax
Basic earnings per share:
Consolidated net income $118,379,091 $91,787,141 11,798,513 $ 10.03 $ 7.78
Minority interest 3,104,865 2,975,236 0.27 0.25
Net income attributable to
equity holders of the
Company $121,483,956 $94,762,377 $ 10.30 $ 8.03
Diluted earnings per share:
Consolidated net income $118,379,091 $91,787,141 $ 9.73 $ 7.55
Minority interest 3,104,865 2,975,236 0.26 0.24
Dilutive effect of stock
equivalents: Convertible bonds-overseas 666,334 553,057 280,047 0.05 0.05
Employees’ bonus-2012 - - 84,423 - -
Net income attributable to
equity holders of the
Company $122,150,290 $95,315,434 12,162,983 $ 10.04 $ 7.84
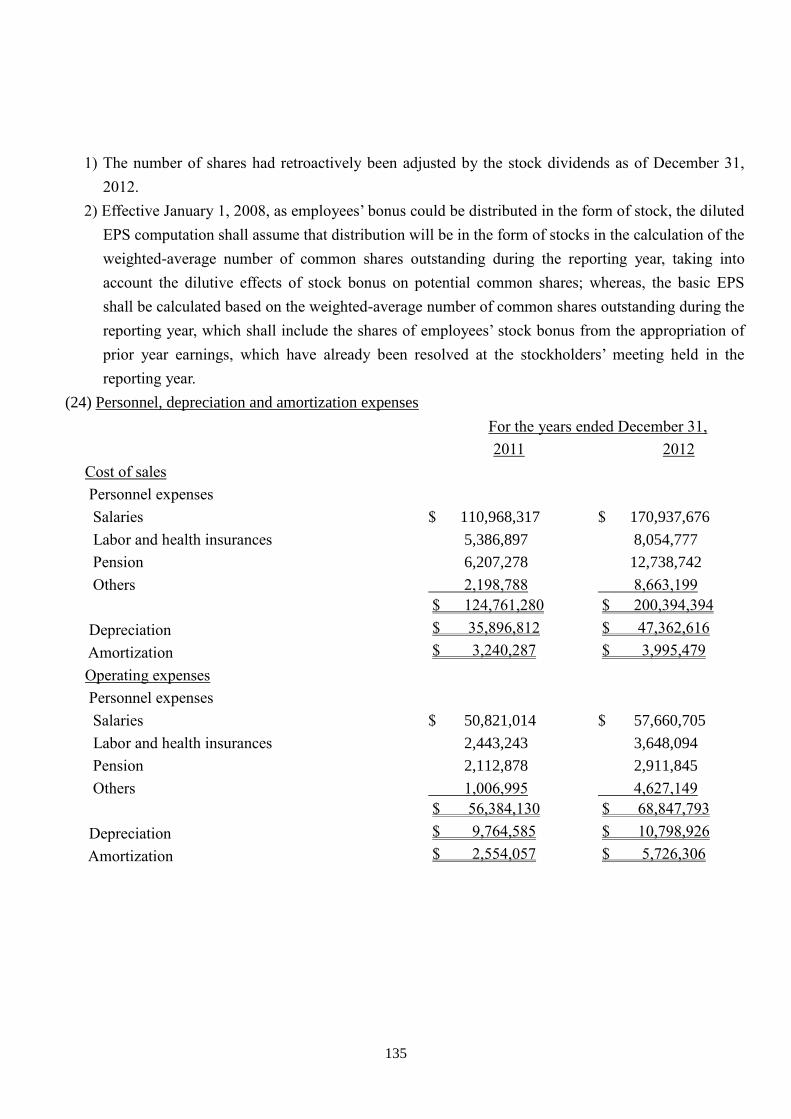
135
1) The number of shares had retroactively been adjusted by the stock dividends as of December 31,
2012.
2) Effective January 1, 2008, as employees’ bonus could be distributed in the form of stock, the diluted
EPS computation shall assume that distribution will be in the form of stocks in the calculation of the
weighted-average number of common shares outstanding during the reporting year, taking into
account the dilutive effects of stock bonus on potential common shares; whereas, the basic EPS
shall be calculated based on the weighted-average number of common shares outstanding during the
reporting year, which shall include the shares of employees’ stock bonus from the appropriation of
prior year earnings, which have already been resolved at the stockholders’ meeting held in the
reporting year.
(24) Personnel, depreciation and amortization expenses
For the years ended December 31,
2011 2012
Cost of sales
Personnel expenses
Salaries $ 110,968,317 $ 170,937,676
Labor and health insurances 5,386,897 8,054,777
Pension 6,207,278 12,738,742
Others 2,198,788 8,663,199
$ 124,761,280 $ 200,394,394
Depreciation $ 35,896,812 $ 47,362,616
Amortization $ 3,240,287 $ 3,995,479
Operating expenses
Personnel expenses
Salaries $ 50,821,014 $ 57,660,705
Labor and health insurances 2,443,243 3,648,094
Pension 2,112,878 2,911,845
Others 1,006,995 4,627,149
$ 56,384,130 $ 68,847,793
Depreciation $ 9,764,585 $ 10,798,926
Amortization $ 2,554,057 $ 5,726,306
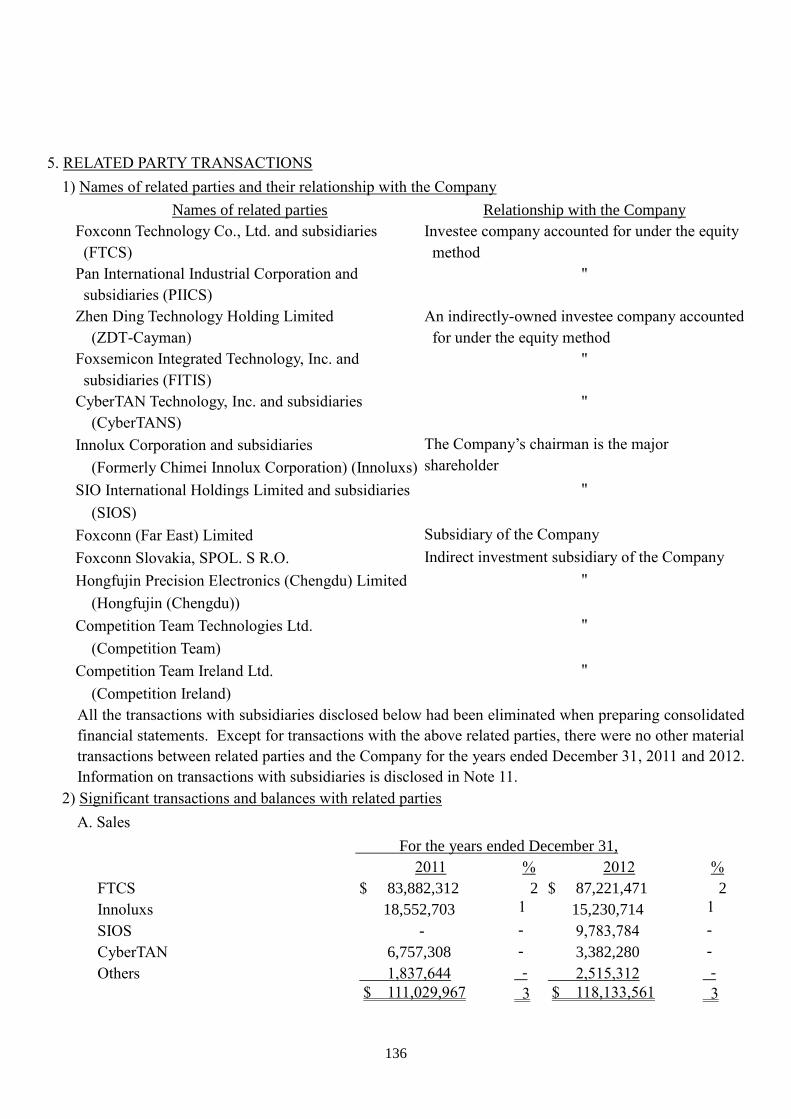
136
5. RELATED PARTY TRANSACTIONS
1) Names of related parties and their relationship with the Company
Names of related parties Relationship with the Company
Foxconn Technology Co., Ltd. and subsidiaries
(FTCS)
Investee company accounted for under the equity
method
Pan International Industrial Corporation and
subsidiaries (PIICS)
"
Zhen Ding Technology Holding Limited
(ZDT-Cayman)
An indirectly-owned investee company accounted
for under the equity method
Foxsemicon Integrated Technology, Inc. and
subsidiaries (FITIS)
"
CyberTAN Technology, Inc. and subsidiaries
(CyberTANS)
"
Innolux Corporation and subsidiaries
(Formerly Chimei Innolux Corporation) (Innoluxs)
The Company’s chairman is the major
shareholder
SIO International Holdings Limited and subsidiaries
(SIOS)
"
Foxconn (Far East) Limited Subsidiary of the Company
Foxconn Slovakia, SPOL. S R.O. Indirect investment subsidiary of the Company
Hongfujin Precision Electronics (Chengdu) Limited
(Hongfujin (Chengdu))
"
Competition Team Technologies Ltd.
(Competition Team)
"
Competition Team Ireland Ltd.
(Competition Ireland)
"
All the transactions with subsidiaries disclosed below had been eliminated when preparing consolidated
financial statements. Except for transactions with the above related parties, there were no other material
transactions between related parties and the Company for the years ended December 31, 2011 and 2012.
Information on transactions with subsidiaries is disclosed in Note 11.
2) Significant transactions and balances with related parties
A. Sales
For the years ended December 31,
2011 % 2012 %
FTCS $ 83,882,312 2 $ 87,221,471 2
Innoluxs 18,552,703 1 15,230,714 1
SIOS - - 9,783,784 -
CyberTAN 6,757,308 - 3,382,280 -
Others 1,837,644 - 2,515,312 -
$ 111,029,967 3 $ 118,133,561 3
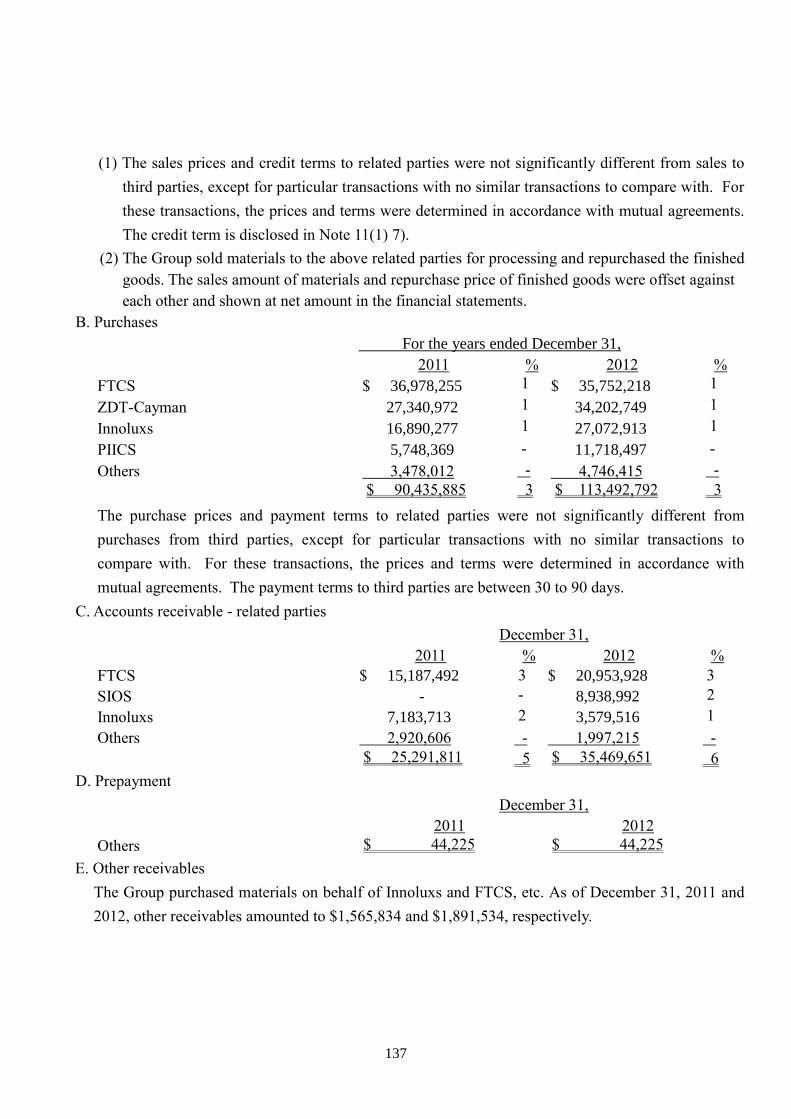
137
(1) The sales prices and credit terms to related parties were not significantly different from sales to
third parties, except for particular transactions with no similar transactions to compare with. For
these transactions, the prices and terms were determined in accordance with mutual agreements.
The credit term is disclosed in Note 11(1) 7).
(2) The Group sold materials to the above related parties for processing and repurchased the finished
goods. The sales amount of materials and repurchase price of finished goods were offset against
each other and shown at net amount in the financial statements.
B. Purchases
For the years ended December 31,
2011 % 2012 %
FTCS $ 36,978,255 1 $ 35,752,218 1
ZDT-Cayman 27,340,972 1 34,202,749 1
Innoluxs 16,890,277 1 27,072,913 1
PIICS 5,748,369 - 11,718,497 -
Others 3,478,012 - 4,746,415 -
$ 90,435,885 3 $ 113,492,792 3
The purchase prices and payment terms to related parties were not significantly different from
purchases from third parties, except for particular transactions with no similar transactions to
compare with. For these transactions, the prices and terms were determined in accordance with
mutual agreements. The payment terms to third parties are between 30 to 90 days.
C. Accounts receivable - related parties
December 31,
2011 % 2012 %
FTCS $ 15,187,492 3 $ 20,953,928 3
SIOS - - 8,938,992 2
Innoluxs 7,183,713 2 3,579,516 1
Others 2,920,606 - 1,997,215 -
$ 25,291,811 5 $ 35,469,651 6
D. Prepayment
December 31,
2011 2012
Others $ 44,225 $ 44,225
E. Other receivables
The Group purchased materials on behalf of Innoluxs and FTCS, etc. As of December 31, 2011 and
2012, other receivables amounted to $1,565,834 and $1,891,534, respectively.
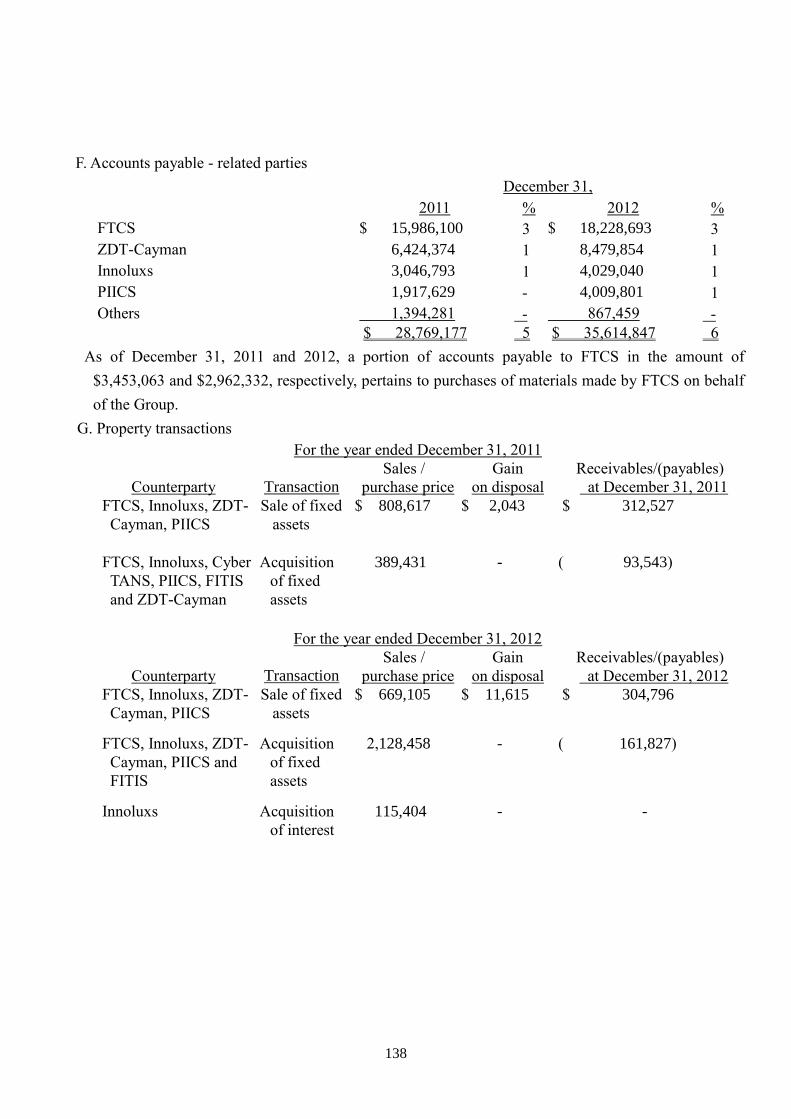
138
F. Accounts payable - related parties
December 31,
2011 % 2012 %
FTCS $ 15,986,100 3 $ 18,228,693 3
ZDT-Cayman 6,424,374 1 8,479,854 1
Innoluxs 3,046,793 1 4,029,040 1
PIICS 1,917,629 - 4,009,801 1
Others 1,394,281 - 867,459 -
$ 28,769,177 5 $ 35,614,847 6
As of December 31, 2011 and 2012, a portion of accounts payable to FTCS in the amount of
$3,453,063 and $2,962,332, respectively, pertains to purchases of materials made by FTCS on behalf
of the Group.
G. Property transactions
For the year ended December 31, 2011
Counterparty Transaction
Sales /
purchase price
Gain
on disposal
Receivables/(payables)
at December 31, 2011
FTCS, Innoluxs, ZDT-
Cayman, PIICS
Sale of fixed
assets
$ 808,617 $ 2,043 $ 312,527
FTCS, Innoluxs, Cyber
TANS, PIICS, FITIS
and ZDT-Cayman
Acquisition
of fixed
assets
389,431 - ( 93,543)
For the year ended December 31, 2012
Counterparty Transaction
Sales /
purchase price
Gain
on disposal
Receivables/(payables)
at December 31, 2012
FTCS, Innoluxs, ZDT-
Cayman, PIICS
Sale of fixed
assets
$ 669,105 $ 11,615 $ 304,796
FTCS, Innoluxs, ZDT-
Cayman, PIICS and
FITIS
Acquisition
of fixed
assets
2,128,458 - ( 161,827)
Innoluxs Acquisition
of interest
115,404 - -
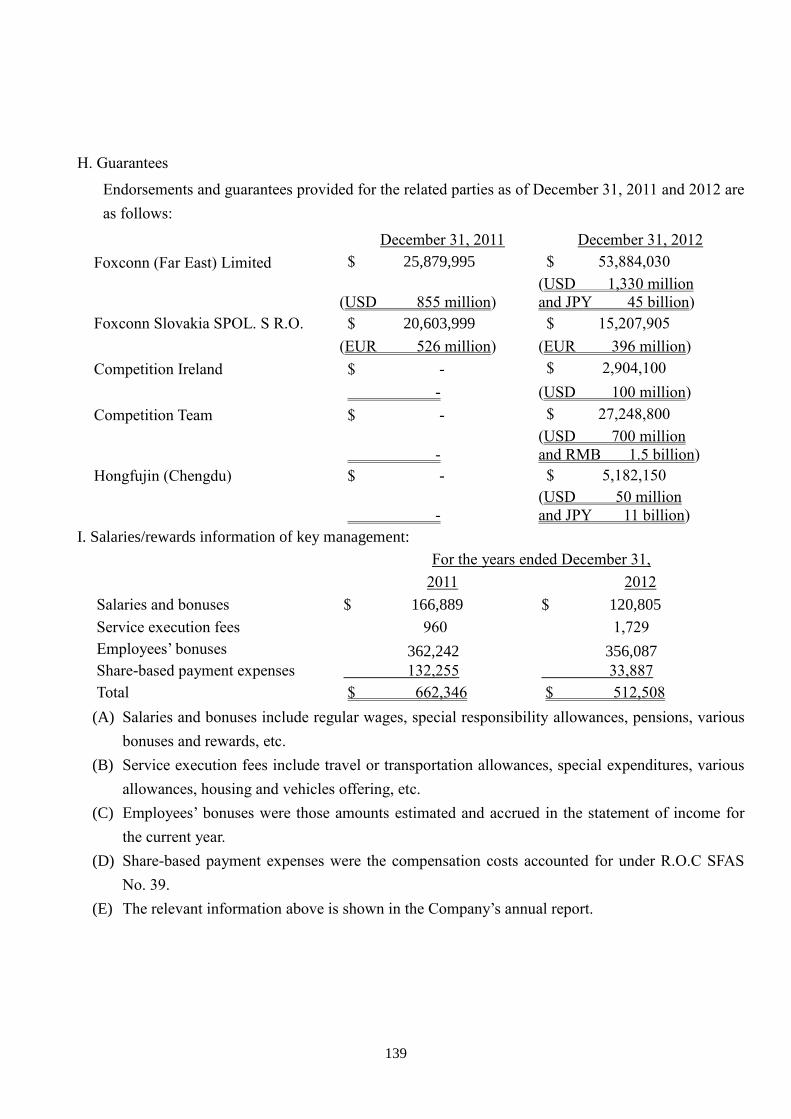
139
H. Guarantees
Endorsements and guarantees provided for the related parties as of December 31, 2011 and 2012 are
as follows:
December 31, 2011 December 31, 2012
Foxconn (Far East) Limited $ 25,879,995 $ 53,884,030
(USD 855 million)
(USD 1,330 million
and JPY 45 billion)
Foxconn Slovakia SPOL. S R.O. $ 20,603,999 $ 15,207,905
(EUR 526 million) (EUR 396 million)
Competition Ireland $ - $ 2,904,100
- (USD 100 million)
Competition Team $ - $ 27,248,800
-
(USD 700 million
and RMB 1.5 billion)
Hongfujin (Chengdu) $ - $ 5,182,150
-
(USD 50 million
and JPY 11 billion)
I. Salaries/rewards information of key management:
For the years ended December 31,
2011 2012
Salaries and bonuses $ 166,889 $ 120,805
Service execution fees 960 1,729
Employees’ bonuses 362,242 356,087
Share-based payment expenses 132,255 33,887
Total $ 662,346 $ 512,508
(A) Salaries and bonuses include regular wages, special responsibility allowances, pensions, various
bonuses and rewards, etc.
(B) Service execution fees include travel or transportation allowances, special expenditures, various
allowances, housing and vehicles offering, etc.
(C) Employees’ bonuses were those amounts estimated and accrued in the statement of income for
the current year.
(D) Share-based payment expenses were the compensation costs accounted for under R.O.C SFAS
No. 39.
(E) The relevant information above is shown in the Company’s annual report.
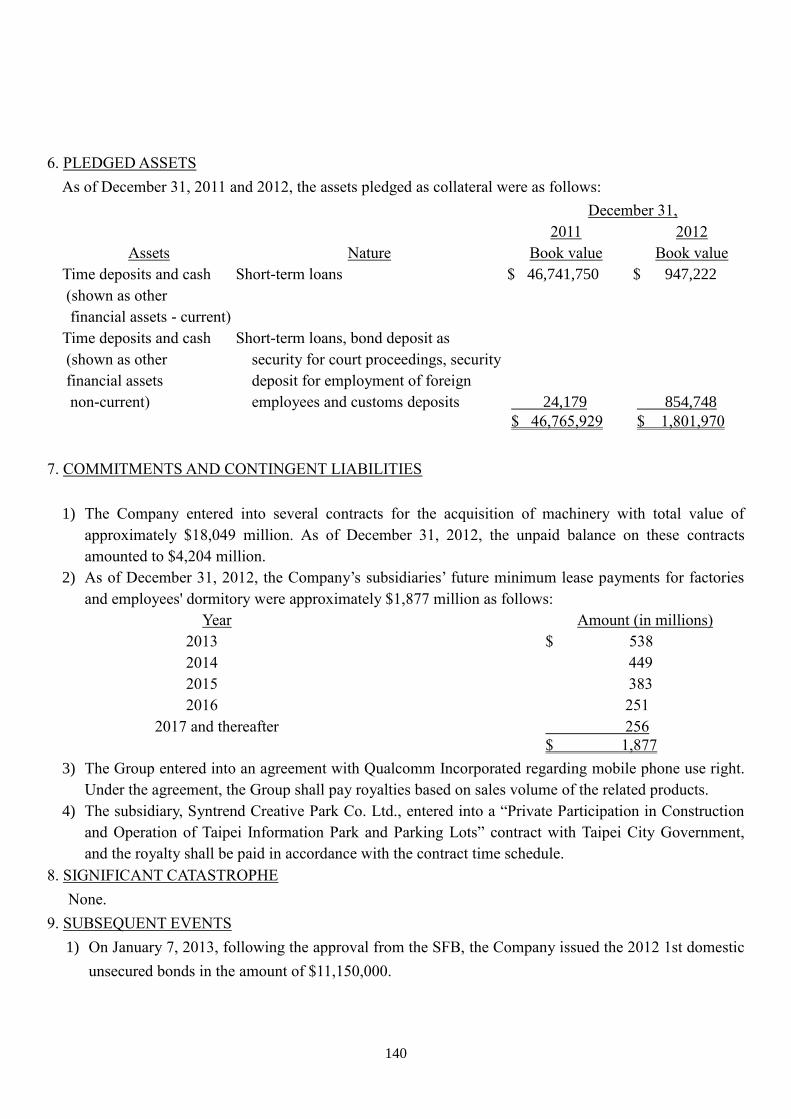
140
6. PLEDGED ASSETS
As of December 31, 2011 and 2012, the assets pledged as collateral were as follows:
December 31,
2011 2012
Assets Nature Book value Book value
Time deposits and cash
(shown as other
financial assets - current)
Short-term loans $ 46,741,750 $ 947,222
Time deposits and cash
(shown as other
financial assets
non-current)
Short-term loans, bond deposit as
security for court proceedings, security
deposit for employment of foreign
employees and customs deposits 24,179 854,748
$ 46,765,929 $ 1,801,970
7. COMMITMENTS AND CONTINGENT LIABILITIES
1) The Company entered into several contracts for the acquisition of machinery with total value of
approximately $18,049 million. As of December 31, 2012, the unpaid balance on these contracts
amounted to $4,204 million.
2) As of December 31, 2012, the Company’s subsidiaries’ future minimum lease payments for factories
and employees' dormitory were approximately $1,877 million as follows:
Year Amount (in millions)
2013 $ 538
2014 449
2015 383
2016 251
2017 and thereafter 256
$ 1,877
3) The Group entered into an agreement with Qualcomm Incorporated regarding mobile phone use right.
Under the agreement, the Group shall pay royalties based on sales volume of the related products.
4) The subsidiary, Syntrend Creative Park Co. Ltd., entered into a “Private Participation in Construction
and Operation of Taipei Information Park and Parking Lots” contract with Taipei City Government,
and the royalty shall be paid in accordance with the contract time schedule.
8. SIGNIFICANT CATASTROPHE
None.
9. SUBSEQUENT EVENTS
1) On January 7, 2013, following the approval from the SFB, the Company issued the 2012 1st domestic
unsecured bonds in the amount of $11,150,000.
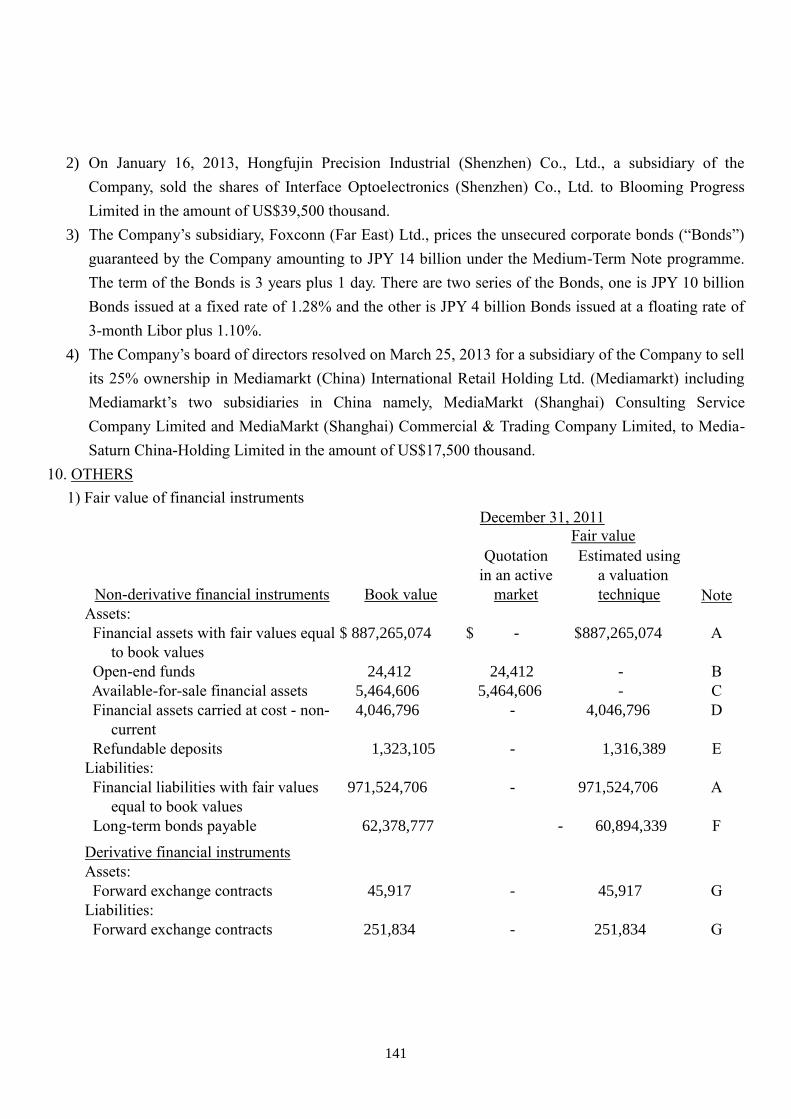
141
2) On January 16, 2013, Hongfujin Precision Industrial (Shenzhen) Co., Ltd., a subsidiary of the
Company, sold the shares of Interface Optoelectronics (Shenzhen) Co., Ltd. to Blooming Progress
Limited in the amount of US$39,500 thousand.
3) The Company’s subsidiary, Foxconn (Far East) Ltd., prices the unsecured corporate bonds (“Bonds”)
guaranteed by the Company amounting to JPY 14 billion under the Medium-Term Note programme.
The term of the Bonds is 3 years plus 1 day. There are two series of the Bonds, one is JPY 10 billion
Bonds issued at a fixed rate of 1.28% and the other is JPY 4 billion Bonds issued at a floating rate of
3-month Libor plus 1.10%.
4) The Company’s board of directors resolved on March 25, 2013 for a subsidiary of the Company to sell
its 25% ownership in Mediamarkt (China) International Retail Holding Ltd. (Mediamarkt) including
Mediamarkt’s two subsidiaries in China namely, MediaMarkt (Shanghai) Consulting Service
Company Limited and MediaMarkt (Shanghai) Commercial & Trading Company Limited, to Media-
Saturn China-Holding Limited in the amount of US$17,500 thousand.
10. OTHERS
1) Fair value of financial instruments
December 31, 2011
Fair value
Non-derivative financial instruments Book value
Quotation
in an active
market
Estimated using
a valuation
technique Note
Assets:
Financial assets with fair values equal
to book values
$ 887,265,074 $ - $887,265,074 A
Open-end funds 24,412 24,412 - B
Available-for-sale financial assets 5,464,606 5,464,606 - C
Financial assets carried at cost - non-
current
4,046,796 - 4,046,796 D
Refundable deposits 1,323,105 - 1,316,389 E
Liabilities:
Financial liabilities with fair values
equal to book values
971,524,706 - 971,524,706 A
Long-term bonds payable 62,378,777 - 60,894,339 F
Derivative financial instruments
Assets:
Forward exchange contracts 45,917 - 45,917 G
Liabilities:
Forward exchange contracts 251,834 - 251,834 G
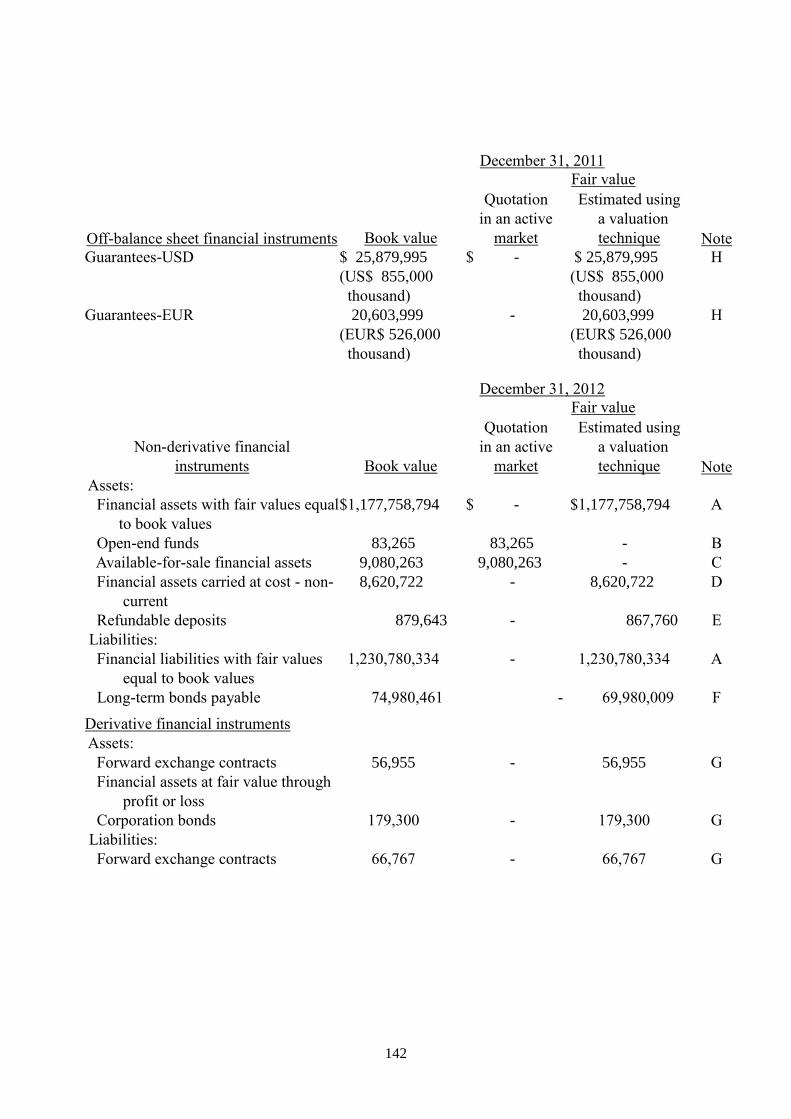
142
December 31, 2011
Fair value
Off-balance sheet financial instruments Book value
Quotation
in an active
market
Estimated using
a valuation
technique Note
Guarantees-USD $ 25,879,995
(US$ 855,000
thousand)
$ - $ 25,879,995
(US$ 855,000
thousand)
H
Guarantees-EUR 20,603,999
(EUR$ 526,000
thousand)
- 20,603,999
(EUR$ 526,000
thousand)
H
December 31, 2012
Fair value
Non-derivative financial
instruments Book value
Quotation
in an active
market
Estimated using
a valuation
technique Note
Assets:
Financial assets with fair values equal
to book values
$1,177,758,794 $ - $1,177,758,794 A
Open-end funds 83,265 83,265 - B
Available-for-sale financial assets 9,080,263 9,080,263 - C
Financial assets carried at cost - non-
current
8,620,722 - 8,620,722 D
Refundable deposits 879,643 - 867,760 E
Liabilities:
Financial liabilities with fair values
equal to book values
1,230,780,334 - 1,230,780,334 A
Long-term bonds payable 74,980,461 - 69,980,009 F
Derivative financial instruments
Assets:
Forward exchange contracts 56,955 - 56,955 G
Financial assets at fair value through
profit or loss
Corporation bonds 179,300 - 179,300 G
Liabilities:
Forward exchange contracts 66,767 - 66,767 G
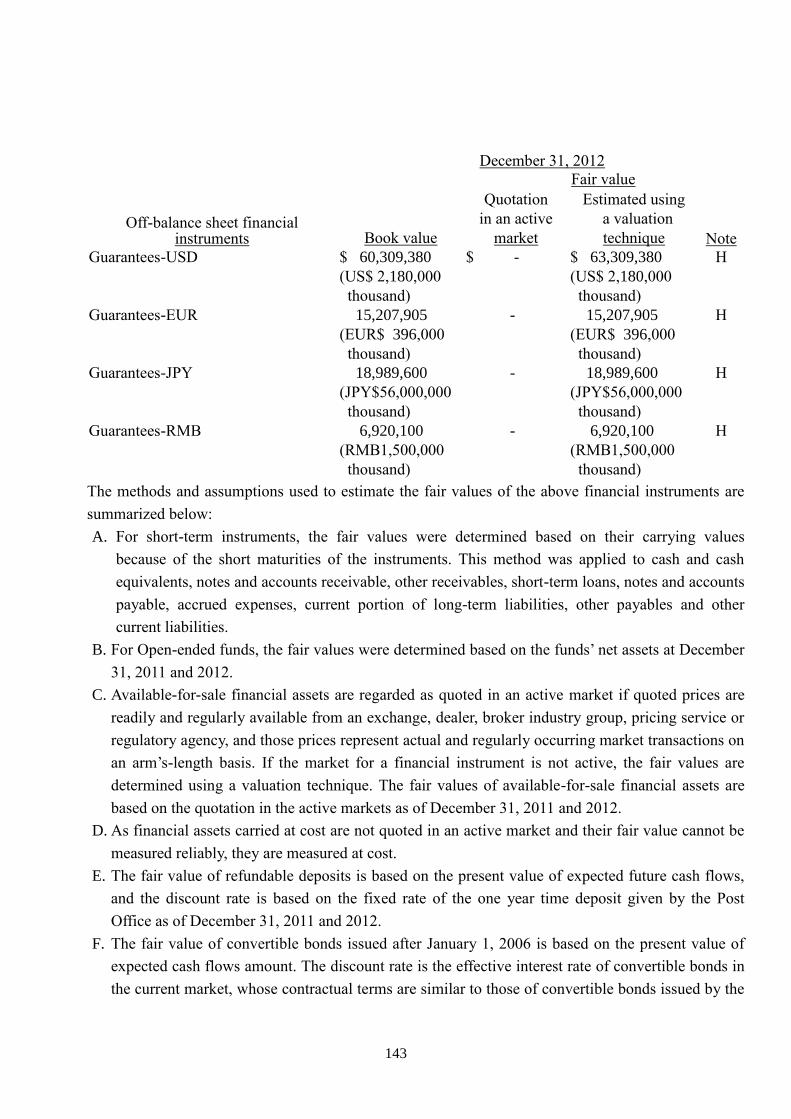
143
December 31, 2012
Fair value
Off-balance sheet financial instruments Book value
Quotation
in an active
market
Estimated using
a valuation
technique Note
Guarantees-USD $ 60,309,380
(US$ 2,180,000
thousand)
$ - $ 63,309,380
(US$ 2,180,000
thousand)
H
Guarantees-EUR 15,207,905
(EUR$ 396,000
thousand)
- 15,207,905
(EUR$ 396,000
thousand)
H
Guarantees-JPY 18,989,600
(JPY$56,000,000
thousand)
- 18,989,600
(JPY$56,000,000
thousand)
H
Guarantees-RMB 6,920,100
(RMB1,500,000
thousand)
- 6,920,100
(RMB1,500,000
thousand)
H
The methods and assumptions used to estimate the fair values of the above financial instruments are
summarized below:
A. For short-term instruments, the fair values were determined based on their carrying values
because of the short maturities of the instruments. This method was applied to cash and cash
equivalents, notes and accounts receivable, other receivables, short-term loans, notes and accounts
payable, accrued expenses, current portion of long-term liabilities, other payables and other
current liabilities.
B. For Open-ended funds, the fair values were determined based on the funds’ net assets at December
31, 2011 and 2012.
C. Available-for-sale financial assets are regarded as quoted in an active market if quoted prices are
readily and regularly available from an exchange, dealer, broker industry group, pricing service or
regulatory agency, and those prices represent actual and regularly occurring market transactions on
an arm’s-length basis. If the market for a financial instrument is not active, the fair values are
determined using a valuation technique. The fair values of available-for-sale financial assets are
based on the quotation in the active markets as of December 31, 2011 and 2012.
D. As financial assets carried at cost are not quoted in an active market and their fair value cannot be
measured reliably, they are measured at cost.
E. The fair value of refundable deposits is based on the present value of expected future cash flows,
and the discount rate is based on the fixed rate of the one year time deposit given by the Post
Office as of December 31, 2011 and 2012.
F. The fair value of convertible bonds issued after January 1, 2006 is based on the present value of
expected cash flows amount. The discount rate is the effective interest rate of convertible bonds in
the current market, whose contractual terms are similar to those of convertible bonds issued by the
144
Company.
G. The fair values of derivative financial instruments which include unrealized gain or loss on
unsettled contracts were determined based on the amounts to be received or paid assuming that the
contracts were settled as of the reporting date.
H. The fair value of guarantees was based on the contract amounts.
2) Financial instruments with off-balance sheet credit risk
Please see Note 5. 2) H.
3) Financial risk control
A. The Group employs a comprehensive risk management and control system to clearly identify,
measure, and control the various kinds of financial risk it faces, including market risk, credit risk,
liquidity risk, and cash flow risk. Except for market risk, which is controlled by outside factors, the
remainder of the foregoing types of risk can be controlled internally or removed from business
processes. Therefore, the goal in managing each of these risks is to reduce them to zero.
As for market risk, the goal is to optimize its overall position through strict suggestion, execution
and audit processes, and proper consideration of a) long-term trends in the external
economic/financial environment, b) internal operating conditions, and c) the actual effects of market
fluctuations.
B. The risk management and control system of the Group is administered within a framework of
stratified responsibility:
(1) The board of directors formulates and approves the procedures; the senior officers designated by
the board make regular and unscheduled assessments of management procedures, organizational
structure, transaction flows, and whether there are any abnormal circumstances;
(2) The legal department reviews and examines transaction agreements;
(3) The finance department makes suggestions with regard to transactions and is responsible for
carrying them out;
(4) The accounting department manages the accounts;
(5) The audit department undertakes audits.
Under this framework, with its strict adherence to proper segregation of duties and adequate internal
control procedures, the Group seeks to minimize the potential adverse effects on the Group’s
financial performance.
4) Material financial risk information
A. Market risk
(1) Foreign exchange risk:
The Group’s major purchase and sale transactions are conducted in USD. The fair value
changes along with the foreign exchange rate fluctuations. However, the amounts and periods
of the Group’s accounts receivable and accounts payable are roughly equivalent, so the market
risk could mostly be offset. When temporary gap rises, the Group would enter into the forward
145
contract to hedge the risk. Accordingly, the Group expects no material risk as a whole.
(2) Futures market risk:
The Group is exposed to price risk because of investments in futures market instruments, which
have fair value in the active market. The Group sets limits to control the transaction volume and
the stop-loss amount of derivatives to reduce its futures market risk. As a result, there is no
significant future market risk.
(3) Interest rate risk:
The long-term bonds issued by the Group all have fixed interest rates, so there is no interest rate
risk.
(4) Stock price risk:
A. Issued by the Company:
The overseas convertible bonds issued by the Company are compound instruments, which
include the conversion rights, call option, and put option. Except that the fair value of the
bonds would be changed due to changes in market interest rate, their fair value is mainly
subject to the changes in the Company’s stock price. The Company could exercise the call
option to mitigate the stock price risk adequately.
B. Held by the Company:
Though price of available-for-sale financial assets and financial assets carried at cost held by
the Company fluctuates with the effects of market, it will not affect operating income but
stockholders’ equity of current year. Accordingly, the Company expects no material risk as a
whole.
(5) Certain transactions of the Group involve non-functional currencies which are exposed to
exchange rate fluctuations. The information on foreign currency denominated monetary assets
and liabilities which are significantly affected by exchange rate fluctuation is as follows:
(Foreign Currency: Functional Currency)
December 31,
2011 2012
Foreign currency
amount
(In thousands)
Exchange
rate
Foreign currency
amount
(In thousands)
Exchange
rate
Financial Assets
Monetary item
USD : NTD $ 16,044,545 30.28 $ 16,638,351 29.04
USD : RMB 4,118,073 6.2933 8,337,943 6.2305
CZK : EUR 4,065,821 0.0390 4,085,757 0.0398
Net effect in consolidated
entities with foreign
currency
USD : NTD 16,132,709 30.28 19,012,423 29.04
EUR : NTD 215,299 39.18 258,270 38.49
146
December 31,
2011 2012
Foreign currency
amount
(In thousands)
Exchange
rate
Foreign currency
amount
(In thousands)
Exchange
rate
Financial Liabilities
Monetary item
USD : RMB $ 11,775,142 6.2933 $ 16,937,054 6.2305
USD : NTD 11,235,440 30.28 12,226,807 29.04
JPY : NTD 74,763,422 0.3906 64,256,794 0.3364
JPY : RMB 23,475,230 0.0812 53,075,694 0.0722
B. Credit risk
(1) Receivables:
With respect to receivables of the Group, most of the debtors are well-known international
companies with very good credit standing and have no history of significant default. Moreover,
the adequacy of the allowance for doubtful accounts is assessed regularly, so there is no
material credit risk.
(2) Financial market:
i. The forward and futures transactions entered into by the Group are done with financial
institutions with very good credit standing. The Group does not expect these financial
institutions to default. Consequently, the likelihood that the credit risk would occur is low.
ii. Convertible bonds payable of the Company were issued in the primary market, so that the
Company is not exposed to credit risk that may arise from counterparties in the secondary
market.
(3) Asset transactions:
The Group has investments in available-for-sale financial assets and financial assets that are
measured at cost. Although the potential for credit risk does exist, there is an active market for
available-for-sale financial assets, and for financial assets measured at cost, the Group
performs impairment testing regularly. Moreover, the Group evaluated the counterparties’
credit standing when it entered into the transaction. Although the potential for credit risk does
exist, the Group does not expect material credit risk accordingly.
C. Liquidity risk
(1) Foreign exchange transactions:
For forward foreign exchange transactions entered into by the Group, the targets of the
transactions are all currencies traded in international foreign exchange markets with high
trading volumes and a large number of traders bidding. Trading is active with high liquidity.
Therefore, no material liquidity risk is expected.
147
(2) Futures transactions:
For futures transactions entered into by the Group, orders are placed on future exchanges in
New York, Chicago or London. The numbers of available future targets and international
market participants are adequate to facilitate easy entry and exit. Therefore, no material
liquidity risk is expected.
(3) Working capital:
The Group has good operating and credit conditions as well as sufficient working capital, so it
expects no significant liquidity risk arising from insufficient capital to meet contract
obligations.
(4) Convertible bonds:
(a)Overseas convertible bonds payable
The Company issued overseas convertible bonds in the amount of US$1 billion on October
12, 2010. The bonds will mature on October 12, 2013. The bondholders have no put options
in the bonds. The Company expects no significant liquidity risk.
D. Cash flow risk from movements of interest rates
(1) Long-term liabilities:
i. For the domestic bonds payable issued by the Company, there should be no cash flow risk
from movements of interest rates due to the fixed interest rate on the bond.
ii. As to the overseas bonds payable issued by the Company, there should be no material cash
flow risk from movements of interest rates due to the zero interest rate on the bond.
iii. Although the Company’s long-term loans bear short-term-floating-interest rate, current
short-term interest rate is much lower than long-term interest rate and is not possible to rise
significantly in the near future; thus, the Company expects no significant cash flow risk
would arise.
(2) Foreign exchange transactions:
The forward foreign currency transactions entered into by the Group are for the purpose of
hedging against short-term gaps of the net positions of foreign currency assets and liabilities. As
such, the amounts of the transactions are immaterial and their duration is short. Moreover,
because of the equivalent foreign currency cash outflows and inflows, the Group expects no
significant funding demand. Therefore, no material cash flow risk is expected from movements
of interest rates.
(3) Financial assets:
As the investments in available-for-sale financial assets, financial assets that are measured at
cost and futures transactions of the Group are not interest-rate type products, there is no cash
flow risk from movements in interest rates.
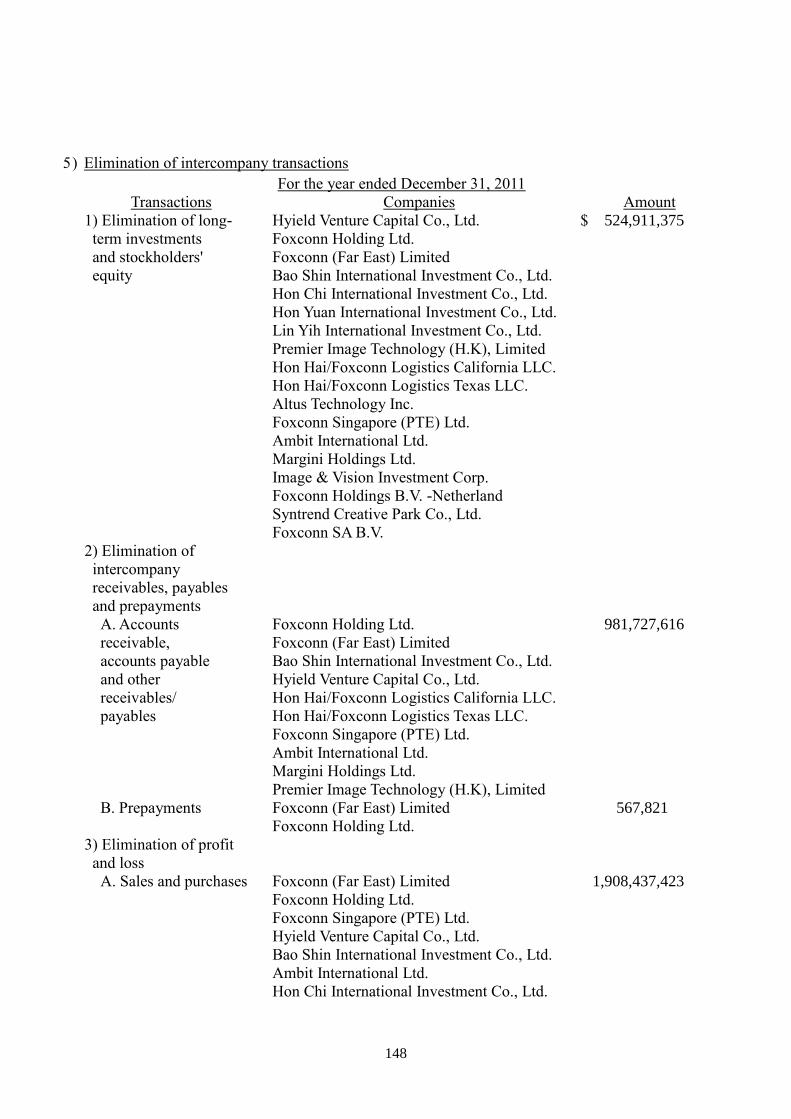
148
5) Elimination of intercompany transactions
For the year ended December 31, 2011
Transactions Companies Amount
1) Elimination of long- Hyield Venture Capital Co., Ltd. $ 524,911,375
term investments Foxconn Holding Ltd.
and stockholders' Foxconn (Far East) Limited
equity Bao Shin International Investment Co., Ltd.
Hon Chi International Investment Co., Ltd.
Hon Yuan International Investment Co., Ltd.
Lin Yih International Investment Co., Ltd.
Premier Image Technology (H.K), Limited
Hon Hai/Foxconn Logistics California LLC.
Hon Hai/Foxconn Logistics Texas LLC.
Altus Technology Inc.
Foxconn Singapore (PTE) Ltd.
Ambit International Ltd.
Margini Holdings Ltd.
Image & Vision Investment Corp.
Foxconn Holdings B.V. -Netherland
Syntrend Creative Park Co., Ltd.
Foxconn SA B.V.
2) Elimination of
intercompany
receivables, payables
and prepayments
A. Accounts Foxconn Holding Ltd. 981,727,616
receivable, Foxconn (Far East) Limited
accounts payable Bao Shin International Investment Co., Ltd.
and other Hyield Venture Capital Co., Ltd.
receivables/ Hon Hai/Foxconn Logistics California LLC.
payables Hon Hai/Foxconn Logistics Texas LLC.
Foxconn Singapore (PTE) Ltd.
Ambit International Ltd.
Margini Holdings Ltd.
Premier Image Technology (H.K), Limited
B. Prepayments Foxconn (Far East) Limited 567,821
Foxconn Holding Ltd.
3) Elimination of profit
and loss
A. Sales and purchases Foxconn (Far East) Limited 1,908,437,423
Foxconn Holding Ltd.
Foxconn Singapore (PTE) Ltd.
Hyield Venture Capital Co., Ltd.
Bao Shin International Investment Co., Ltd.
Ambit International Ltd.
Hon Chi International Investment Co., Ltd.
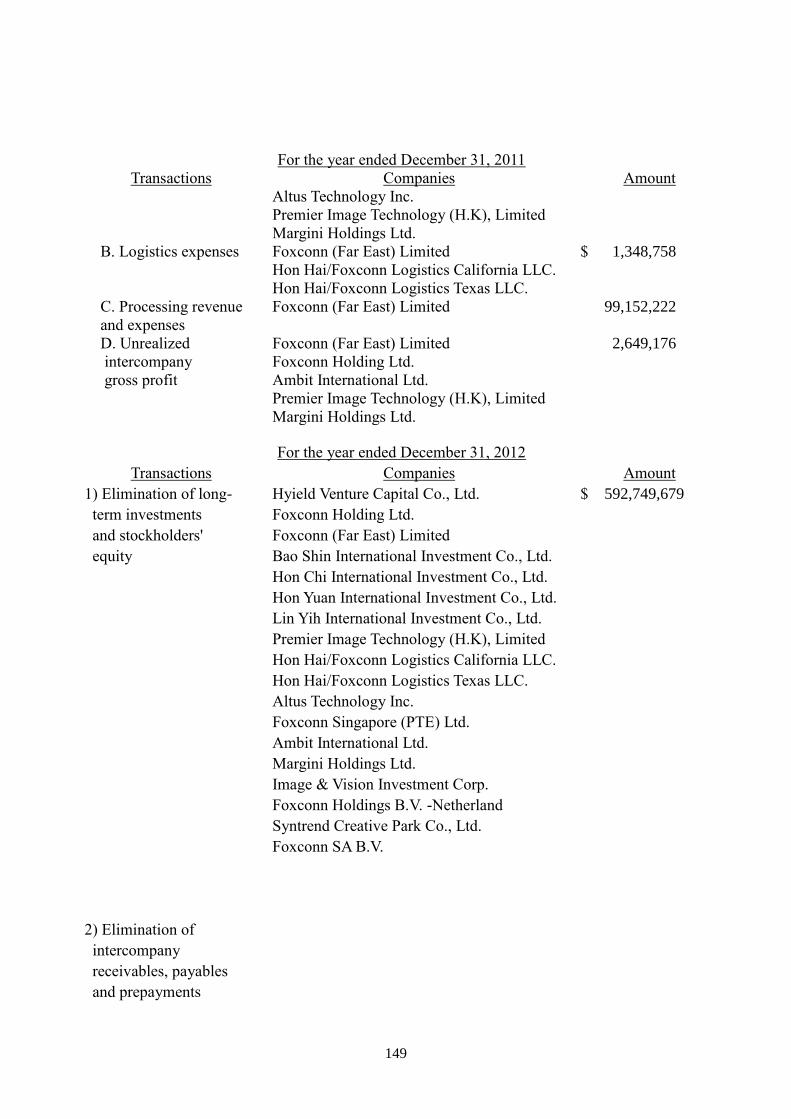
149
For the year ended December 31, 2011
Transactions Companies Amount
Altus Technology Inc.
Premier Image Technology (H.K), Limited
Margini Holdings Ltd.
B. Logistics expenses Foxconn (Far East) Limited $ 1,348,758
Hon Hai/Foxconn Logistics California LLC.
Hon Hai/Foxconn Logistics Texas LLC.
C. Processing revenue Foxconn (Far East) Limited 99,152,222
and expenses
D. Unrealized Foxconn (Far East) Limited 2,649,176
intercompany Foxconn Holding Ltd.
gross profit Ambit International Ltd.
Premier Image Technology (H.K), Limited
Margini Holdings Ltd.
For the year ended December 31, 2012
Transactions Companies Amount
1) Elimination of long- Hyield Venture Capital Co., Ltd. $ 592,749,679
term investments Foxconn Holding Ltd.
and stockholders' Foxconn (Far East) Limited
equity Bao Shin International Investment Co., Ltd.
Hon Chi International Investment Co., Ltd.
Hon Yuan International Investment Co., Ltd.
Lin Yih International Investment Co., Ltd.
Premier Image Technology (H.K), Limited
Hon Hai/Foxconn Logistics California LLC.
Hon Hai/Foxconn Logistics Texas LLC.
Altus Technology Inc.
Foxconn Singapore (PTE) Ltd.
Ambit International Ltd.
Margini Holdings Ltd.
Image & Vision Investment Corp.
Foxconn Holdings B.V. -Netherland
Syntrend Creative Park Co., Ltd.
Foxconn SA B.V.
2) Elimination of
intercompany
receivables, payables
and prepayments
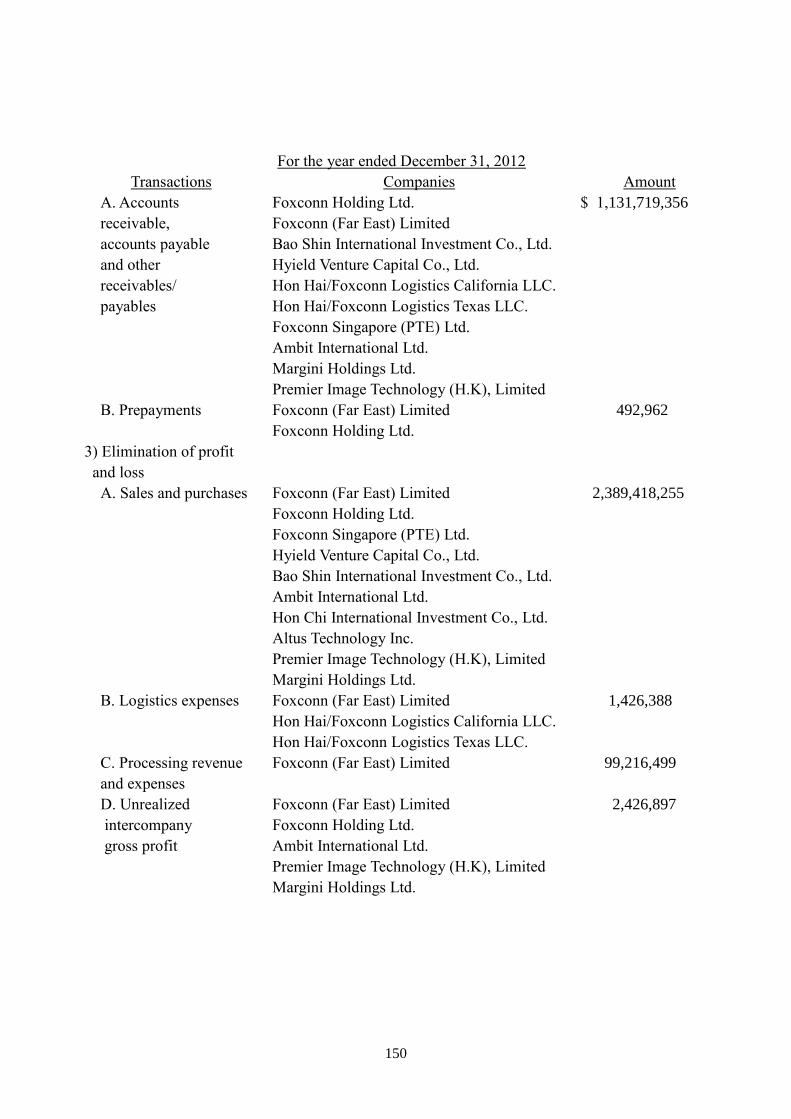
150
For the year ended December 31, 2012
Transactions Companies Amount
A. Accounts Foxconn Holding Ltd. $ 1,131,719,356
receivable, Foxconn (Far East) Limited
accounts payable Bao Shin International Investment Co., Ltd.
and other Hyield Venture Capital Co., Ltd.
receivables/ Hon Hai/Foxconn Logistics California LLC.
payables Hon Hai/Foxconn Logistics Texas LLC.
Foxconn Singapore (PTE) Ltd.
Ambit International Ltd.
Margini Holdings Ltd.
Premier Image Technology (H.K), Limited
B. Prepayments Foxconn (Far East) Limited 492,962
Foxconn Holding Ltd.
3) Elimination of profit
and loss
A. Sales and purchases Foxconn (Far East) Limited 2,389,418,255
Foxconn Holding Ltd.
Foxconn Singapore (PTE) Ltd.
Hyield Venture Capital Co., Ltd.
Bao Shin International Investment Co., Ltd.
Ambit International Ltd.
Hon Chi International Investment Co., Ltd.
Altus Technology Inc.
Premier Image Technology (H.K), Limited
Margini Holdings Ltd.
B. Logistics expenses Foxconn (Far East) Limited 1,426,388
Hon Hai/Foxconn Logistics California LLC.
Hon Hai/Foxconn Logistics Texas LLC.
C. Processing revenue Foxconn (Far East) Limited 99,216,499
and expenses
D. Unrealized Foxconn (Far East) Limited 2,426,897
intercompany Foxconn Holding Ltd.
gross profit Ambit International Ltd.
Premier Image Technology (H.K), Limited
Margini Holdings Ltd.
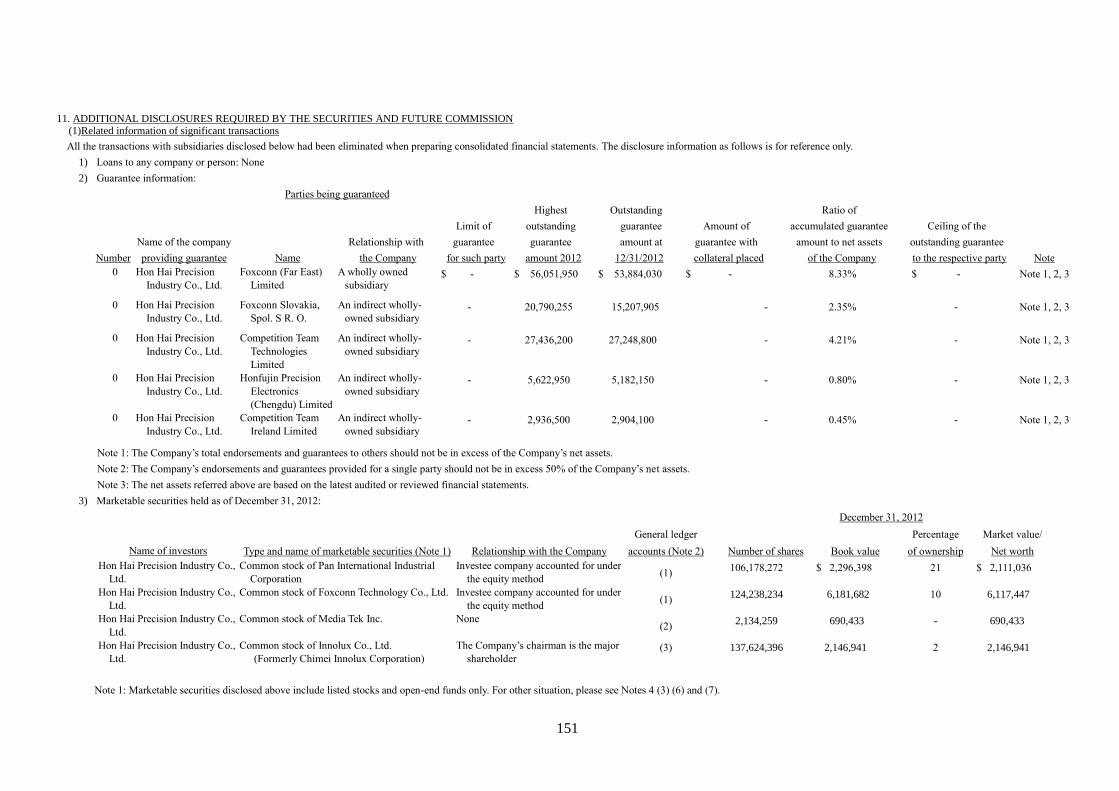
151
11. ADDITIONAL DISCLOSURES REQUIRED BY THE SECURITIES AND FUTURE COMMISSION (1)Related information of significant transactions
All the transactions with subsidiaries disclosed below had been eliminated when preparing consolidated financial statements. The disclosure information as follows is for reference only.
1) Loans to any company or person: None
2) Guarantee information:
Parties being guaranteed
Number
Name of the company
providing guarantee Name
Relationship with
the Company
Limit of
guarantee
for such party
Highest
outstanding
guarantee
amount 2012
Outstanding
guarantee
amount at
12/31/2012
Amount of
guarantee with
collateral placed
Ratio of
accumulated guarantee
amount to net assets
of the Company
Ceiling of the
outstanding guarantee
to the respective party
Note
0 Hon Hai Precision
Industry Co., Ltd.
Foxconn (Far East)
Limited
A wholly owned
subsidiary $ - $ 56,051,950 $ 53,884,030 $ - 8.33% $ - Note 1, 2, 3
0 Hon Hai Precision
Industry Co., Ltd.
Foxconn Slovakia,
Spol. S R. O.
An indirect wholly-
owned subsidiary - 20,790,255 15,207,905 - 2.35% - Note 1, 2, 3
0 Hon Hai Precision
Industry Co., Ltd.
Competition Team
Technologies
Limited
An indirect wholly-
owned subsidiary - 27,436,200 27,248,800 - 4.21% - Note 1, 2, 3
0 Hon Hai Precision
Industry Co., Ltd.
Honfujin Precision
Electronics
(Chengdu) Limited
An indirect wholly-
owned subsidiary - 5,622,950 5,182,150 - 0.80% - Note 1, 2, 3
0 Hon Hai Precision
Industry Co., Ltd.
Competition Team
Ireland Limited
An indirect wholly-
owned subsidiary - 2,936,500 2,904,100 - 0.45% - Note 1, 2, 3
Note 1: The Company’s total endorsements and guarantees to others should not be in excess of the Company’s net assets.
Note 2: The Company’s endorsements and guarantees provided for a single party should not be in excess 50% of the Company’s net assets.
Note 3: The net assets referred above are based on the latest audited or reviewed financial statements.
3) Marketable securities held as of December 31, 2012:
December 31, 2012
General ledger Percentage Market value/
Name of investors Type and name of marketable securities (Note 1) Relationship with the Company accounts (Note 2) Number of shares Book value of ownership Net worth
Hon Hai Precision Industry Co.,
Ltd.
Common stock of Pan International Industrial
Corporation
Investee company accounted for under
the equity method (1)
106,178,272 $ 2,296,398 21 $ 2,111,036
Hon Hai Precision Industry Co.,
Ltd.
Common stock of Foxconn Technology Co., Ltd. Investee company accounted for under
the equity method (1)
124,238,234 6,181,682 10 6,117,447
Hon Hai Precision Industry Co.,
Ltd.
Common stock of Media Tek Inc. None (2)
2,134,259 690,433 - 690,433
Hon Hai Precision Industry Co.,
Ltd.
Common stock of Innolux Co., Ltd.
(Formerly Chimei Innolux Corporation)
The Company’s chairman is the major
shareholder (3) 137,624,396 2,146,941 2 2,146,941
Note 1: Marketable securities disclosed above include listed stocks and open-end funds only. For other situation, please see Notes 4 (3) (6) and (7).
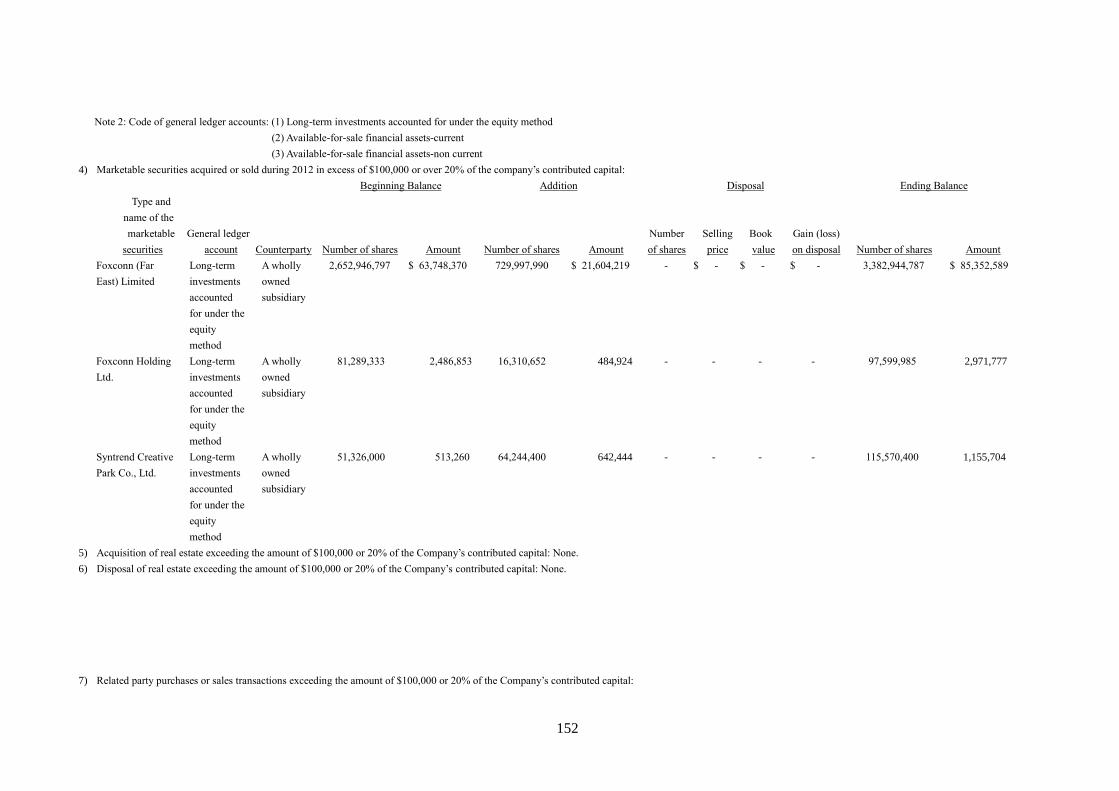
152
Note 2: Code of general ledger accounts: (1) Long-term investments accounted for under the equity method
(2) Available-for-sale financial assets-current
(3) Available-for-sale financial assets-non current
4) Marketable securities acquired or sold during 2012 in excess of $100,000 or over 20% of the company’s contributed capital:
Beginning Balance Addition Disposal Ending Balance
Type and
name of the
marketable
securities
General ledger
account Counterparty Number of shares Amount Number of shares Amount
Number
of shares
Selling
price
Book
value
Gain (loss)
on disposal Number of shares Amount
Foxconn (Far
East) Limited
Long-term
investments
accounted
for under the
equity
method
A wholly
owned
subsidiary
2,652,946,797 $ 63,748,370 729,997,990 $ 21,604,219 - $ - $ - $ - 3,382,944,787 $ 85,352,589
Foxconn Holding
Ltd.
Long-term
investments
accounted
for under the
equity
method
A wholly
owned
subsidiary
81,289,333 2,486,853 16,310,652 484,924 - - - - 97,599,985 2,971,777
Syntrend Creative
Park Co., Ltd.
Long-term
investments
accounted
for under the
equity
method
A wholly
owned
subsidiary
51,326,000 513,260 64,244,400 642,444 - - - - 115,570,400 1,155,704
5) Acquisition of real estate exceeding the amount of $100,000 or 20% of the Company’s contributed capital: None.
6) Disposal of real estate exceeding the amount of $100,000 or 20% of the Company’s contributed capital: None.
7) Related party purchases or sales transactions exceeding the amount of $100,000 or 20% of the Company’s contributed capital:
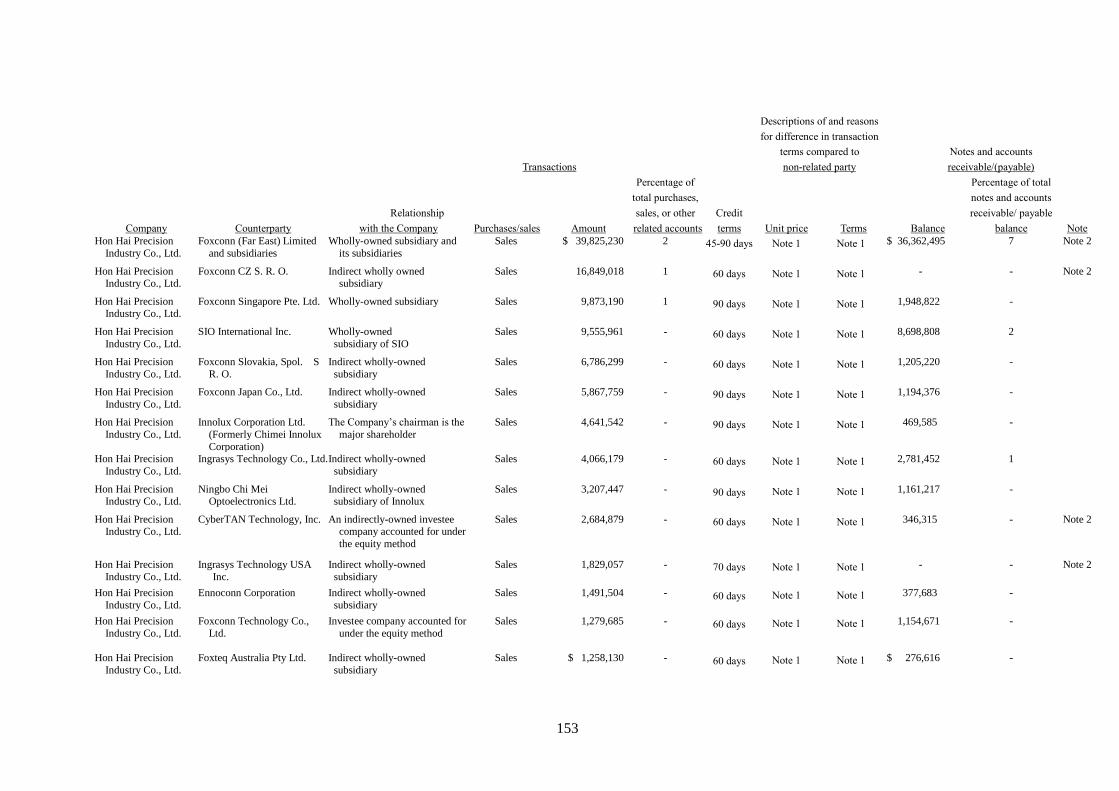
153
Descriptions of and reasons
for difference in transaction
terms compared to Notes and accounts
Transactions non-related party receivable/(payable)
Percentage of Percentage of total
total purchases, notes and accounts
Relationship sales, or other Credit receivable/ payable
Company Counterparty with the Company Purchases/sales Amount related accounts terms Unit price Terms Balance balance Note
Hon Hai Precision
Industry Co., Ltd.
Foxconn (Far East) Limited
and subsidiaries
Wholly-owned subsidiary and
its subsidiaries
Sales $ 39,825,230 2 45-90 days Note 1 Note 1 $ 36,362,495 7 Note 2
Hon Hai Precision Industry Co., Ltd.
Foxconn CZ S. R. O. Indirect wholly owned subsidiary
Sales 16,849,018 1 60 days Note 1 Note 1 - - Note 2
Hon Hai Precision Industry Co., Ltd.
Foxconn Singapore Pte. Ltd. Wholly-owned subsidiary
Sales 9,873,190 1 90 days Note 1 Note 1 1,948,822 -
Hon Hai Precision
Industry Co., Ltd.
SIO International Inc. Wholly-owned
subsidiary of SIO
Sales 9,555,961 - 60 days Note 1 Note 1 8,698,808 2
Hon Hai Precision
Industry Co., Ltd.
Foxconn Slovakia, Spol. S
R. O.
Indirect wholly-owned
subsidiary
Sales 6,786,299 - 60 days Note 1 Note 1 1,205,220 -
Hon Hai Precision
Industry Co., Ltd.
Foxconn Japan Co., Ltd. Indirect wholly-owned
subsidiary
Sales 5,867,759 - 90 days Note 1 Note 1 1,194,376 -
Hon Hai Precision
Industry Co., Ltd.
Innolux Corporation Ltd.
(Formerly Chimei Innolux
Corporation)
The Company’s chairman is the
major shareholder
Sales 4,641,542 - 90 days Note 1 Note 1 469,585 -
Hon Hai Precision
Industry Co., Ltd.
Ingrasys Technology Co., Ltd. Indirect wholly-owned
subsidiary
Sales 4,066,179 - 60 days Note 1 Note 1 2,781,452 1
Hon Hai Precision
Industry Co., Ltd.
Ningbo Chi Mei
Optoelectronics Ltd.
Indirect wholly-owned
subsidiary of Innolux
Sales 3,207,447 - 90 days Note 1 Note 1 1,161,217 -
Hon Hai Precision Industry Co., Ltd.
CyberTAN Technology, Inc. An indirectly-owned investee company accounted for under
the equity method
Sales 2,684,879 - 60 days Note 1 Note 1 346,315 - Note 2
Hon Hai Precision
Industry Co., Ltd.
Ingrasys Technology USA
Inc.
Indirect wholly-owned
subsidiary
Sales 1,829,057 - 70 days Note 1 Note 1 - - Note 2
Hon Hai Precision
Industry Co., Ltd.
Ennoconn Corporation Indirect wholly-owned
subsidiary
Sales 1,491,504 - 60 days Note 1 Note 1 377,683 -
Hon Hai Precision
Industry Co., Ltd.
Foxconn Technology Co.,
Ltd.
Investee company accounted for
under the equity method
Sales 1,279,685 - 60 days Note 1 Note 1 1,154,671 -
Hon Hai Precision
Industry Co., Ltd.
Foxteq Australia Pty Ltd. Indirect wholly-owned
subsidiary
Sales $ 1,258,130 - 60 days Note 1 Note 1 $ 276,616 -
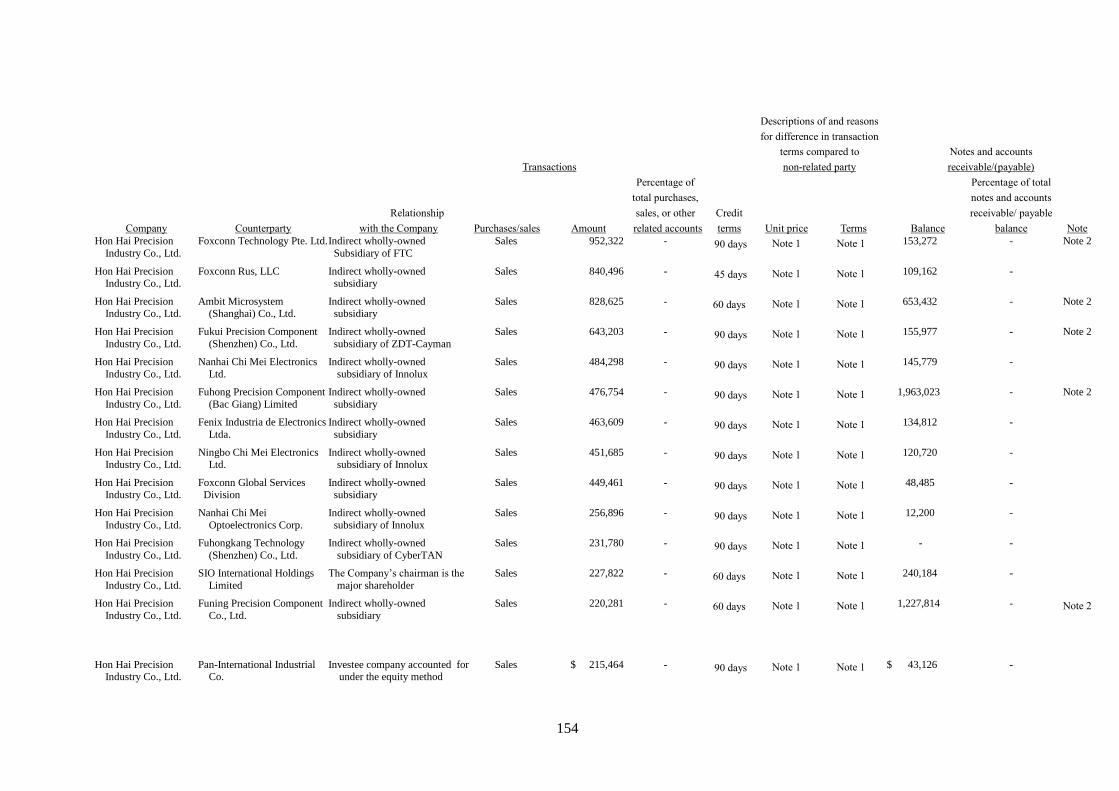
154
Descriptions of and reasons
for difference in transaction
terms compared to Notes and accounts
Transactions non-related party receivable/(payable)
Percentage of Percentage of total
total purchases, notes and accounts
Relationship sales, or other Credit receivable/ payable
Company Counterparty with the Company Purchases/sales Amount related accounts terms Unit price Terms Balance balance Note
Hon Hai Precision
Industry Co., Ltd.
Foxconn Technology Pte. Ltd. Indirect wholly-owned
Subsidiary of FTC
Sales 952,322 - 90 days Note 1 Note 1 153,272 - Note 2
Hon Hai Precision Industry Co., Ltd.
Foxconn Rus, LLC Indirect wholly-owned subsidiary
Sales 840,496 - 45 days Note 1 Note 1 109,162 -
Hon Hai Precision Industry Co., Ltd.
Ambit Microsystem (Shanghai) Co., Ltd.
Indirect wholly-owned subsidiary
Sales 828,625 - 60 days Note 1 Note 1 653,432 - Note 2
Hon Hai Precision
Industry Co., Ltd.
Fukui Precision Component
(Shenzhen) Co., Ltd.
Indirect wholly-owned
subsidiary of ZDT-Cayman
Sales 643,203 - 90 days Note 1 Note 1 155,977 - Note 2
Hon Hai Precision
Industry Co., Ltd.
Nanhai Chi Mei Electronics
Ltd.
Indirect wholly-owned
subsidiary of Innolux
Sales 484,298 - 90 days Note 1 Note 1 145,779 -
Hon Hai Precision
Industry Co., Ltd.
Fuhong Precision Component
(Bac Giang) Limited
Indirect wholly-owned
subsidiary
Sales 476,754 - 90 days Note 1 Note 1 1,963,023 - Note 2
Hon Hai Precision
Industry Co., Ltd.
Fenix Industria de Electronics
Ltda.
Indirect wholly-owned
subsidiary
Sales 463,609 - 90 days Note 1 Note 1 134,812 -
Hon Hai Precision Industry Co., Ltd.
Ningbo Chi Mei Electronics Ltd.
Indirect wholly-owned subsidiary of Innolux
Sales 451,685 - 90 days Note 1 Note 1 120,720 -
Hon Hai Precision
Industry Co., Ltd.
Foxconn Global Services
Division
Indirect wholly-owned
subsidiary
Sales 449,461 - 90 days Note 1 Note 1 48,485 -
Hon Hai Precision
Industry Co., Ltd.
Nanhai Chi Mei
Optoelectronics Corp.
Indirect wholly-owned
subsidiary of Innolux
Sales 256,896 - 90 days Note 1 Note 1 12,200 -
Hon Hai Precision
Industry Co., Ltd.
Fuhongkang Technology
(Shenzhen) Co., Ltd.
Indirect wholly-owned
subsidiary of CyberTAN
Sales 231,780 - 90 days Note 1 Note 1 - -
Hon Hai Precision
Industry Co., Ltd.
SIO International Holdings
Limited
The Company’s chairman is the
major shareholder
Sales 227,822 - 60 days Note 1 Note 1 240,184 -
Hon Hai Precision
Industry Co., Ltd.
Funing Precision Component
Co., Ltd.
Indirect wholly-owned
subsidiary
Sales 220,281 - 60 days Note 1 Note 1 1,227,814 - Note 2
Hon Hai Precision Industry Co., Ltd.
Pan-International Industrial Co.
Investee company accounted for under the equity method
Sales $ 215,464 - 90 days Note 1 Note 1 $ 43,126 -
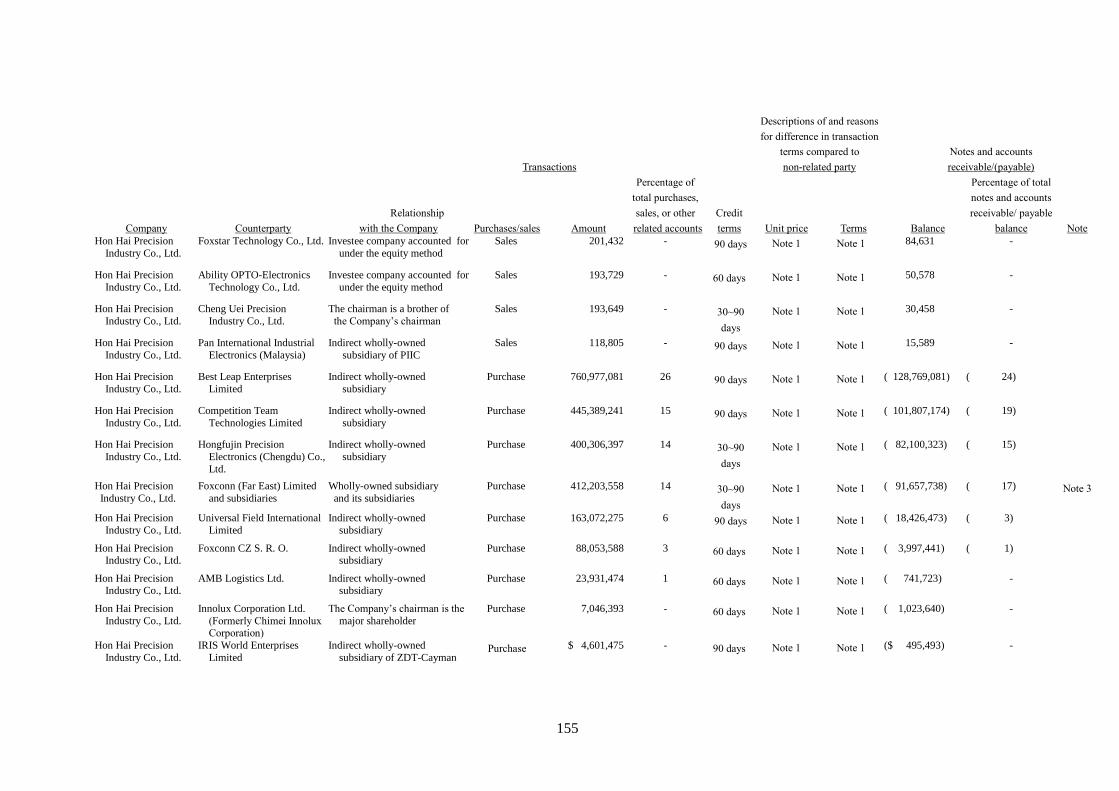
155
Descriptions of and reasons
for difference in transaction
terms compared to Notes and accounts
Transactions non-related party receivable/(payable)
Percentage of Percentage of total
total purchases, notes and accounts
Relationship sales, or other Credit receivable/ payable
Company Counterparty with the Company Purchases/sales Amount related accounts terms Unit price Terms Balance balance Note
Hon Hai Precision
Industry Co., Ltd.
Foxstar Technology Co., Ltd. Investee company accounted for
under the equity method
Sales 201,432 - 90 days Note 1 Note 1 84,631 -
Hon Hai Precision
Industry Co., Ltd.
Ability OPTO-Electronics
Technology Co., Ltd.
Investee company accounted for
under the equity method
Sales 193,729 - 60 days Note 1 Note 1 50,578 -
Hon Hai Precision
Industry Co., Ltd.
Cheng Uei Precision
Industry Co., Ltd.
The chairman is a brother of
the Company’s chairman
Sales 193,649 - 30~90
days
Note 1 Note 1 30,458 -
Hon Hai Precision
Industry Co., Ltd.
Pan International Industrial
Electronics (Malaysia)
Indirect wholly-owned
subsidiary of PIIC
Sales 118,805 - 90 days Note 1 Note 1 15,589 -
Hon Hai Precision
Industry Co., Ltd.
Best Leap Enterprises
Limited
Indirect wholly-owned
subsidiary
Purchase 760,977,081 26 90 days Note 1 Note 1 ( 128,769,081) ( 24)
Hon Hai Precision
Industry Co., Ltd.
Competition Team
Technologies Limited
Indirect wholly-owned
subsidiary
Purchase 445,389,241 15 90 days Note 1 Note 1 ( 101,807,174) ( 19)
Hon Hai Precision
Industry Co., Ltd.
Hongfujin Precision
Electronics (Chengdu) Co.,
Ltd.
Indirect wholly-owned
subsidiary
Purchase 400,306,397 14 30~90
days
Note 1 Note 1 ( 82,100,323) ( 15)
Hon Hai Precision
Industry Co., Ltd.
Foxconn (Far East) Limited
and subsidiaries
Wholly-owned subsidiary
and its subsidiaries
Purchase 412,203,558 14 30~90
days
Note 1 Note 1 ( 91,657,738) ( 17) Note 3
Hon Hai Precision
Industry Co., Ltd.
Universal Field International
Limited
Indirect wholly-owned
subsidiary
Purchase 163,072,275 6 90 days Note 1 Note 1 ( 18,426,473) ( 3)
Hon Hai Precision Industry Co., Ltd.
Foxconn CZ S. R. O. Indirect wholly-owned subsidiary
Purchase 88,053,588 3 60 days Note 1 Note 1 ( 3,997,441) ( 1)
Hon Hai Precision Industry Co., Ltd.
AMB Logistics Ltd. Indirect wholly-owned subsidiary
Purchase 23,931,474 1 60 days Note 1 Note 1 ( 741,723) -
Hon Hai Precision
Industry Co., Ltd.
Innolux Corporation Ltd.
(Formerly Chimei Innolux Corporation)
The Company’s chairman is the
major shareholder
Purchase 7,046,393 - 60 days Note 1 Note 1 ( 1,023,640) -
Hon Hai Precision
Industry Co., Ltd.
IRIS World Enterprises
Limited
Indirect wholly-owned
subsidiary of ZDT-Cayman Purchase $ 4,601,475 - 90 days Note 1 Note 1 ($ 495,493) -
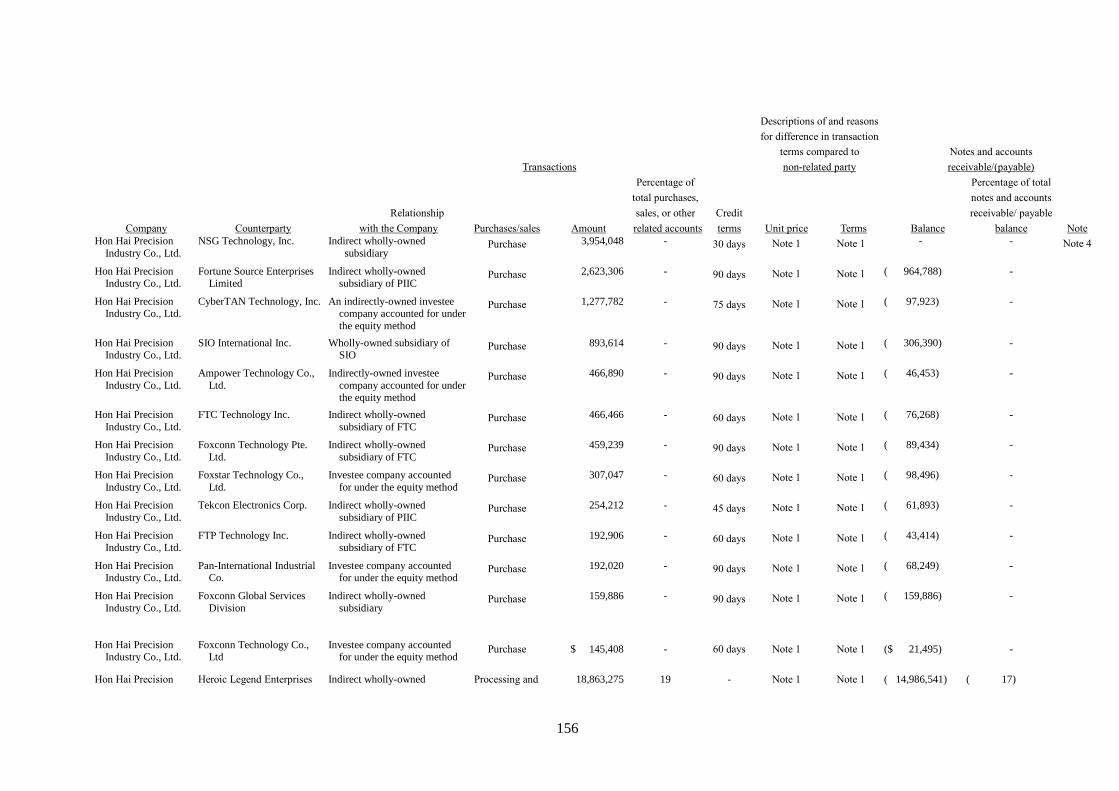
156
Descriptions of and reasons
for difference in transaction
terms compared to Notes and accounts
Transactions non-related party receivable/(payable)
Percentage of Percentage of total
total purchases, notes and accounts
Relationship sales, or other Credit receivable/ payable
Company Counterparty with the Company Purchases/sales Amount related accounts terms Unit price Terms Balance balance Note
Hon Hai Precision
Industry Co., Ltd.
NSG Technology, Inc. Indirect wholly-owned
subsidiary Purchase 3,954,048 - 30 days Note 1 Note 1 - - Note 4
Hon Hai Precision Industry Co., Ltd.
Fortune Source Enterprises Limited
Indirect wholly-owned subsidiary of PIIC
Purchase 2,623,306 - 90 days Note 1 Note 1 ( 964,788) -
Hon Hai Precision Industry Co., Ltd.
CyberTAN Technology, Inc. An indirectly-owned investee company accounted for under
the equity method
Purchase 1,277,782 - 75 days Note 1 Note 1 ( 97,923) -
Hon Hai Precision
Industry Co., Ltd.
SIO International Inc. Wholly-owned subsidiary of
SIO Purchase 893,614 - 90 days Note 1 Note 1 ( 306,390) -
Hon Hai Precision
Industry Co., Ltd.
Ampower Technology Co.,
Ltd.
Indirectly-owned investee
company accounted for under the equity method
Purchase 466,890 - 90 days Note 1 Note 1 ( 46,453) -
Hon Hai Precision
Industry Co., Ltd.
FTC Technology Inc. Indirect wholly-owned
subsidiary of FTC Purchase 466,466 - 60 days Note 1 Note 1 ( 76,268) -
Hon Hai Precision
Industry Co., Ltd.
Foxconn Technology Pte.
Ltd.
Indirect wholly-owned
subsidiary of FTC Purchase 459,239 - 90 days Note 1 Note 1 ( 89,434) -
Hon Hai Precision
Industry Co., Ltd.
Foxstar Technology Co.,
Ltd.
Investee company accounted
for under the equity method Purchase 307,047 - 60 days Note 1 Note 1 ( 98,496) -
Hon Hai Precision
Industry Co., Ltd.
Tekcon Electronics Corp. Indirect wholly-owned
subsidiary of PIIC Purchase 254,212 - 45 days Note 1 Note 1 ( 61,893) -
Hon Hai Precision Industry Co., Ltd.
FTP Technology Inc. Indirect wholly-owned subsidiary of FTC
Purchase 192,906 - 60 days Note 1 Note 1 ( 43,414) -
Hon Hai Precision Industry Co., Ltd.
Pan-International Industrial Co.
Investee company accounted for under the equity method
Purchase 192,020 - 90 days Note 1 Note 1 ( 68,249) -
Hon Hai Precision
Industry Co., Ltd.
Foxconn Global Services
Division
Indirect wholly-owned
subsidiary
Purchase 159,886 - 90 days Note 1 Note 1 ( 159,886) -
Hon Hai Precision Industry Co., Ltd.
Foxconn Technology Co., Ltd
Investee company accounted for under the equity method
Purchase $ 145,408 - 60 days Note 1 Note 1 ($ 21,495) -
Hon Hai Precision Heroic Legend Enterprises Indirect wholly-owned Processing and 18,863,275 19 - Note 1 Note 1 ( 14,986,541) ( 17)
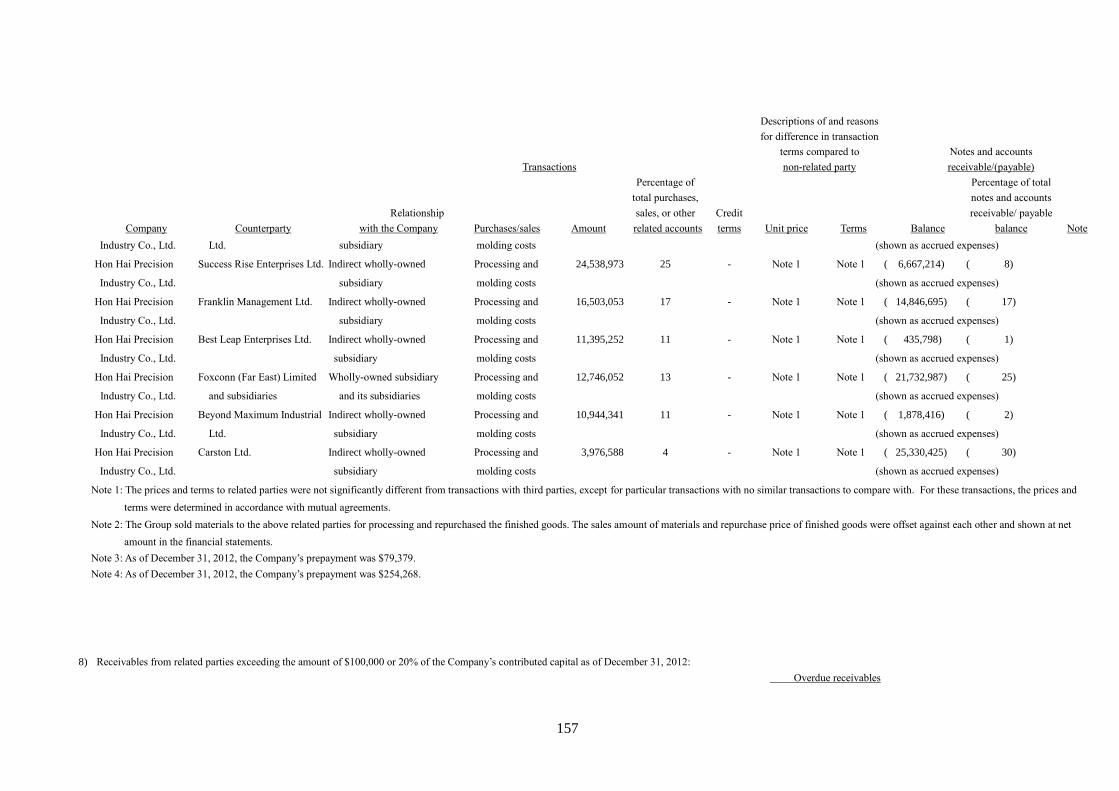
157
Descriptions of and reasons
for difference in transaction
terms compared to Notes and accounts
Transactions non-related party receivable/(payable)
Percentage of Percentage of total
total purchases, notes and accounts
Relationship sales, or other Credit receivable/ payable
Company Counterparty with the Company Purchases/sales Amount related accounts terms Unit price Terms Balance balance Note
Industry Co., Ltd. Ltd. subsidiary molding costs (shown as accrued expenses)
Hon Hai Precision Success Rise Enterprises Ltd. Indirect wholly-owned Processing and 24,538,973 25 - Note 1 Note 1 ( 6,667,214) ( 8)
Industry Co., Ltd. subsidiary molding costs (shown as accrued expenses)
Hon Hai Precision Franklin Management Ltd. Indirect wholly-owned Processing and 16,503,053 17 - Note 1 Note 1 ( 14,846,695) ( 17)
Industry Co., Ltd. subsidiary molding costs (shown as accrued expenses)
Hon Hai Precision Best Leap Enterprises Ltd. Indirect wholly-owned Processing and 11,395,252 11 - Note 1 Note 1 ( 435,798) ( 1)
Industry Co., Ltd. subsidiary molding costs (shown as accrued expenses)
Hon Hai Precision Foxconn (Far East) Limited Wholly-owned subsidiary Processing and 12,746,052 13 - Note 1 Note 1 ( 21,732,987) ( 25)
Industry Co., Ltd. and subsidiaries and its subsidiaries molding costs (shown as accrued expenses)
Hon Hai Precision Beyond Maximum Industrial Indirect wholly-owned Processing and 10,944,341 11 - Note 1 Note 1 ( 1,878,416) ( 2)
Industry Co., Ltd. Ltd. subsidiary molding costs (shown as accrued expenses)
Hon Hai Precision Carston Ltd. Indirect wholly-owned Processing and 3,976,588 4 - Note 1 Note 1 ( 25,330,425) ( 30)
Industry Co., Ltd. subsidiary molding costs (shown as accrued expenses)
Note 1: The prices and terms to related parties were not significantly different from transactions with third parties, except for particular transactions with no similar transactions to compare with. For these transactions, the prices and
terms were determined in accordance with mutual agreements.
Note 2: The Group sold materials to the above related parties for processing and repurchased the finished goods. The sales amount of materials and repurchase price of finished goods were offset against each other and shown at net
amount in the financial statements.
Note 3: As of December 31, 2012, the Company’s prepayment was $79,379.
Note 4: As of December 31, 2012, the Company’s prepayment was $254,268.
8) Receivables from related parties exceeding the amount of $100,000 or 20% of the Company’s contributed capital as of December 31, 2012:
Overdue receivables
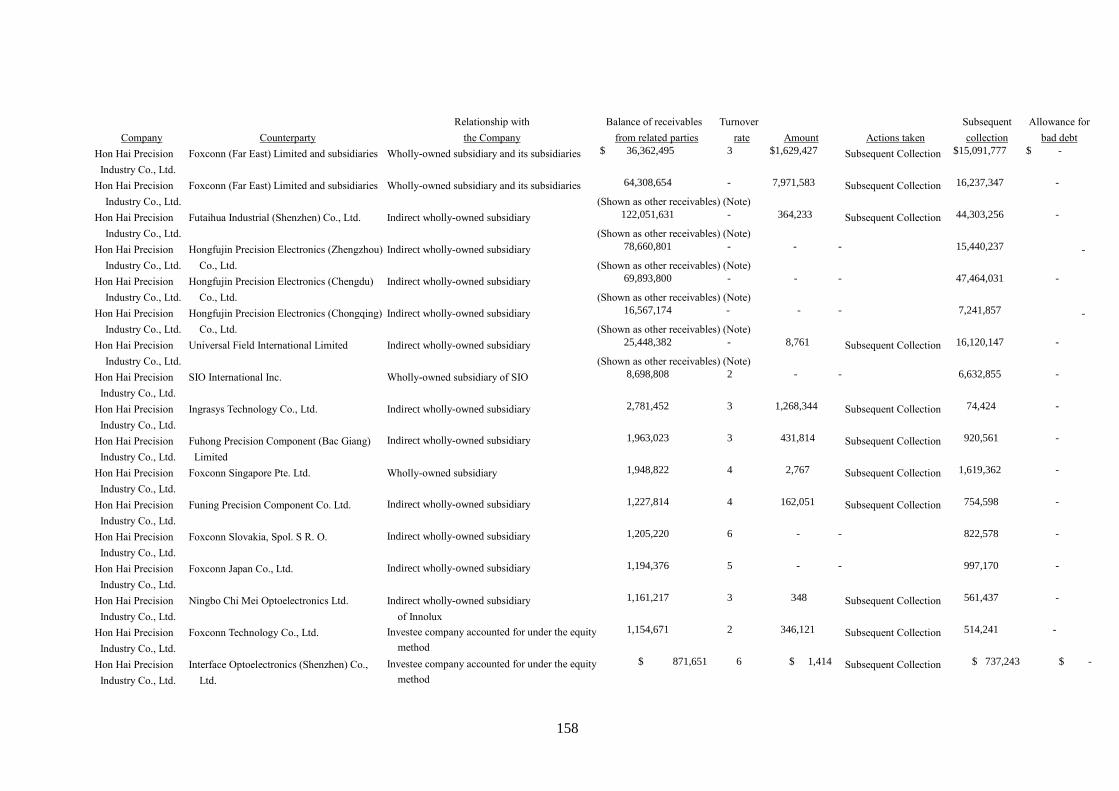
158
Relationship with Balance of receivables Turnover Subsequent Allowance for
Company Counterparty the Company from related parties rate Amount Actions taken collection bad debt
Hon Hai Precision
Industry Co., Ltd.
Foxconn (Far East) Limited and subsidiaries Wholly-owned subsidiary and its subsidiaries $ 36,362,495 3 $1,629,427 Subsequent Collection $15,091,777 $ -
Hon Hai Precision Foxconn (Far East) Limited and subsidiaries Wholly-owned subsidiary and its subsidiaries 64,308,654 - 7,971,583 Subsequent Collection 16,237,347 -
Industry Co., Ltd. (Shown as other receivables) (Note)
Hon Hai Precision Futaihua Industrial (Shenzhen) Co., Ltd. Indirect wholly-owned subsidiary 122,051,631 - 364,233 Subsequent Collection 44,303,256 -
Industry Co., Ltd. (Shown as other receivables) (Note)
Hon Hai Precision Hongfujin Precision Electronics (Zhengzhou) Indirect wholly-owned subsidiary 78,660,801 - - - 15,440,237 -
Industry Co., Ltd. Co., Ltd. (Shown as other receivables) (Note)
Hon Hai Precision Hongfujin Precision Electronics (Chengdu) Indirect wholly-owned subsidiary 69,893,800 - - - 47,464,031 -
Industry Co., Ltd. Co., Ltd. (Shown as other receivables) (Note)
Hon Hai Precision Hongfujin Precision Electronics (Chongqing) Indirect wholly-owned subsidiary 16,567,174 - - - 7,241,857 -
Industry Co., Ltd. Co., Ltd. (Shown as other receivables) (Note)
Hon Hai Precision Universal Field International Limited Indirect wholly-owned subsidiary 25,448,382 - 8,761 Subsequent Collection 16,120,147 -
Industry Co., Ltd. (Shown as other receivables) (Note)
Hon Hai Precision
Industry Co., Ltd.
SIO International Inc. Wholly-owned subsidiary of SIO 8,698,808 2 - - 6,632,855 -
Hon Hai Precision
Industry Co., Ltd.
Ingrasys Technology Co., Ltd. Indirect wholly-owned subsidiary 2,781,452 3 1,268,344 Subsequent Collection 74,424 -
Hon Hai Precision
Industry Co., Ltd.
Fuhong Precision Component (Bac Giang)
Limited
Indirect wholly-owned subsidiary 1,963,023 3 431,814 Subsequent Collection 920,561 -
Hon Hai Precision
Industry Co., Ltd.
Foxconn Singapore Pte. Ltd. Wholly-owned subsidiary 1,948,822 4 2,767 Subsequent Collection 1,619,362 -
Hon Hai Precision
Industry Co., Ltd.
Funing Precision Component Co. Ltd. Indirect wholly-owned subsidiary 1,227,814 4 162,051 Subsequent Collection 754,598 -
Hon Hai Precision
Industry Co., Ltd.
Foxconn Slovakia, Spol. S R. O. Indirect wholly-owned subsidiary 1,205,220 6 - - 822,578 -
Hon Hai Precision
Industry Co., Ltd.
Foxconn Japan Co., Ltd. Indirect wholly-owned subsidiary 1,194,376 5 - - 997,170 -
Hon Hai Precision
Industry Co., Ltd.
Ningbo Chi Mei Optoelectronics Ltd. Indirect wholly-owned subsidiary
of Innolux
1,161,217 3 348 Subsequent Collection 561,437 -
Hon Hai Precision
Industry Co., Ltd.
Foxconn Technology Co., Ltd. Investee company accounted for under the equity
method
1,154,671 2 346,121 Subsequent Collection 514,241 -
Hon Hai Precision
Industry Co., Ltd.
Interface Optoelectronics (Shenzhen) Co.,
Ltd.
Investee company accounted for under the equity
method
$ 871,651 6 $ 1,414 Subsequent Collection $ 737,243 $ -
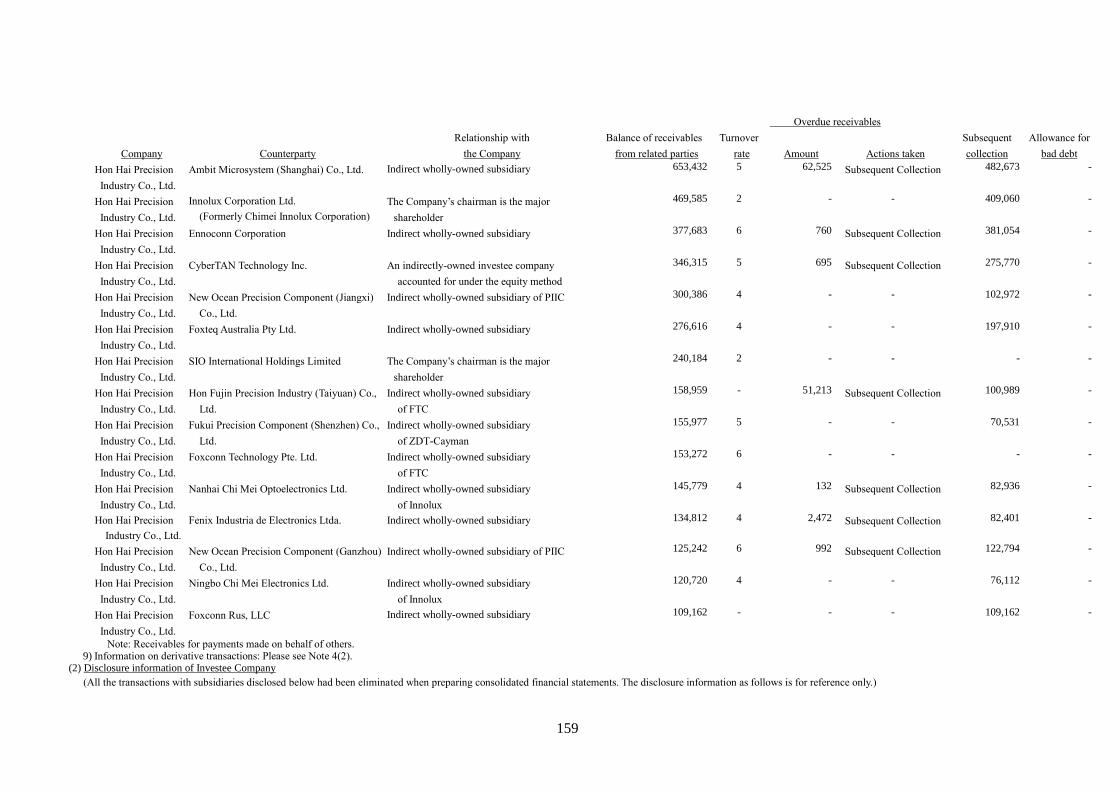
159
Overdue receivables
Relationship with Balance of receivables Turnover Subsequent Allowance for
Company Counterparty the Company from related parties rate Amount Actions taken collection bad debt
Hon Hai Precision
Industry Co., Ltd.
Ambit Microsystem (Shanghai) Co., Ltd. Indirect wholly-owned subsidiary 653,432 5 62,525 Subsequent Collection 482,673 -
Hon Hai Precision
Industry Co., Ltd.
Innolux Corporation Ltd.
(Formerly Chimei Innolux Corporation)
The Company’s chairman is the major
shareholder
469,585 2 - - 409,060 -
Hon Hai Precision
Industry Co., Ltd.
Ennoconn Corporation Indirect wholly-owned subsidiary 377,683 6 760 Subsequent Collection 381,054 -
Hon Hai Precision
Industry Co., Ltd.
CyberTAN Technology Inc. An indirectly-owned investee company
accounted for under the equity method
346,315 5 695 Subsequent Collection 275,770 -
Hon Hai Precision
Industry Co., Ltd.
New Ocean Precision Component (Jiangxi)
Co., Ltd.
Indirect wholly-owned subsidiary of PIIC 300,386 4 - - 102,972 -
Hon Hai Precision
Industry Co., Ltd.
Foxteq Australia Pty Ltd. Indirect wholly-owned subsidiary 276,616 4 - - 197,910 -
Hon Hai Precision
Industry Co., Ltd.
SIO International Holdings Limited The Company’s chairman is the major
shareholder
240,184 2 - - - -
Hon Hai Precision
Industry Co., Ltd.
Hon Fujin Precision Industry (Taiyuan) Co.,
Ltd.
Indirect wholly-owned subsidiary
of FTC
158,959 - 51,213 Subsequent Collection 100,989 -
Hon Hai Precision
Industry Co., Ltd.
Fukui Precision Component (Shenzhen) Co.,
Ltd.
Indirect wholly-owned subsidiary
of ZDT-Cayman
155,977 5 - - 70,531 -
Hon Hai Precision
Industry Co., Ltd.
Foxconn Technology Pte. Ltd. Indirect wholly-owned subsidiary
of FTC
153,272 6 - - - -
Hon Hai Precision
Industry Co., Ltd.
Nanhai Chi Mei Optoelectronics Ltd. Indirect wholly-owned subsidiary
of Innolux
145,779 4 132 Subsequent Collection 82,936 -
Hon Hai Precision
Industry Co., Ltd.
Fenix Industria de Electronics Ltda. Indirect wholly-owned subsidiary 134,812 4 2,472 Subsequent Collection 82,401 -
Hon Hai Precision
Industry Co., Ltd.
New Ocean Precision Component (Ganzhou)
Co., Ltd.
Indirect wholly-owned subsidiary of PIIC 125,242 6 992 Subsequent Collection 122,794 -
Hon Hai Precision
Industry Co., Ltd.
Ningbo Chi Mei Electronics Ltd. Indirect wholly-owned subsidiary
of Innolux
120,720 4 - - 76,112 -
Hon Hai Precision
Industry Co., Ltd.
Foxconn Rus, LLC Indirect wholly-owned subsidiary 109,162 - - - 109,162 -
Note: Receivables for payments made on behalf of others. 9) Information on derivative transactions: Please see Note 4(2).
(2) Disclosure information of Investee Company
(All the transactions with subsidiaries disclosed below had been eliminated when preparing consolidated financial statements. The disclosure information as follows is for reference only.)
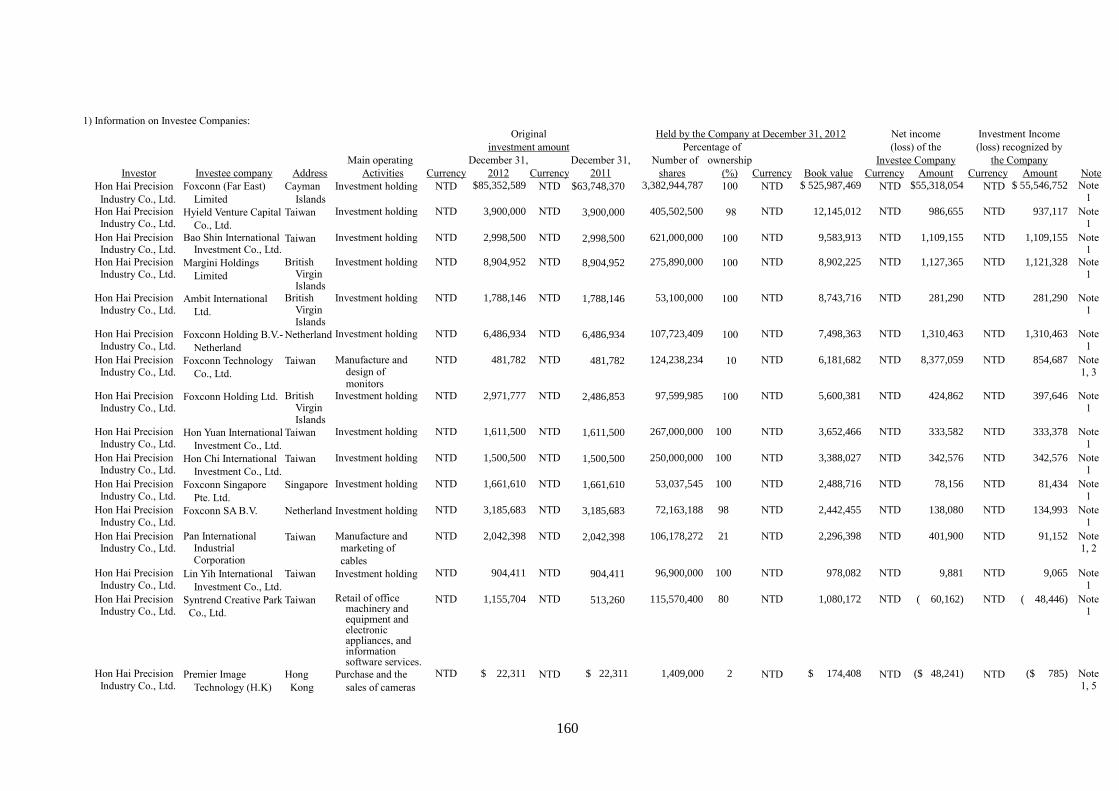
160
1) Information on Investee Companies:
Original Held by the Company at December 31, 2012 Net income Investment Income
investment amount Percentage of (loss) of the (loss) recognized by
Main operating December 31, December 31, Number of ownership Investee Company the Company
Investor Investee company Address Activities Currency 2012 Currency 2011 shares (%) Currency Book value Currency Amount Currency Amount Note
Hon Hai Precision
Industry Co., Ltd.
Foxconn (Far East)
Limited
Cayman
Islands
Investment holding NTD $85,352,589 NTD $63,748,370 3,382,944,787 100 NTD $ 525,987,469 NTD $55,318,054 NTD $ 55,546,752 Note
1 Hon Hai Precision
Industry Co., Ltd. Hyield Venture Capital
Co., Ltd.
Taiwan Investment holding NTD 3,900,000 NTD 3,900,000 405,502,500 98 NTD 12,145,012 NTD 986,655 NTD 937,117 Note
1 Hon Hai Precision Industry Co., Ltd.
Bao Shin International Investment Co., Ltd.
Taiwan Investment holding NTD 2,998,500 NTD 2,998,500 621,000,000 100 NTD 9,583,913 NTD 1,109,155 NTD 1,109,155 Note 1
Hon Hai Precision
Industry Co., Ltd. Margini Holdings
Limited
British Virgin Islands
Investment holding NTD 8,904,952 NTD 8,904,952 275,890,000 100 NTD 8,902,225 NTD 1,127,365 NTD 1,121,328 Note
1
Hon Hai Precision
Industry Co., Ltd. Ambit International
Ltd.
British Virgin Islands
Investment holding NTD 1,788,146 NTD 1,788,146 53,100,000 100 NTD 8,743,716 NTD 281,290 NTD 281,290 Note
1
Hon Hai Precision
Industry Co., Ltd. Foxconn Holding B.V.-
Netherland
Netherland Investment holding NTD 6,486,934 NTD 6,486,934 107,723,409 100 NTD 7,498,363 NTD 1,310,463 NTD 1,310,463 Note
1 Hon Hai Precision
Industry Co., Ltd. Foxconn Technology
Co., Ltd.
Taiwan Manufacture and design of monitors
NTD 481,782 NTD 481,782 124,238,234 10 NTD 6,181,682 NTD 8,377,059 NTD 854,687 Note
1, 3
Hon Hai Precision
Industry Co., Ltd. Foxconn Holding Ltd. British
Virgin Islands
Investment holding NTD 2,971,777 NTD 2,486,853 97,599,985 100 NTD 5,600,381 NTD 424,862 NTD 397,646 Note
1
Hon Hai Precision
Industry Co., Ltd. Hon Yuan International
Investment Co., Ltd.
Taiwan Investment holding NTD 1,611,500 NTD 1,611,500 267,000,000 100 NTD 3,652,466 NTD 333,582 NTD 333,378 Note
1 Hon Hai Precision Industry Co., Ltd.
Hon Chi International
Investment Co., Ltd.
Taiwan Investment holding NTD 1,500,500 NTD 1,500,500 250,000,000 100 NTD 3,388,027 NTD 342,576 NTD 342,576 Note 1
Hon Hai Precision
Industry Co., Ltd. Foxconn Singapore
Pte. Ltd.
Singapore Investment holding NTD 1,661,610 NTD 1,661,610 53,037,545 100 NTD 2,488,716 NTD 78,156 NTD 81,434 Note
1 Hon Hai Precision
Industry Co., Ltd. Foxconn SA B.V.
Netherland Investment holding NTD 3,185,683 NTD 3,185,683 72,163,188 98 NTD 2,442,455 NTD 138,080 NTD 134,993 Note
1 Hon Hai Precision Industry Co., Ltd.
Pan International Industrial Corporation
Taiwan Manufacture and marketing of
cables
NTD 2,042,398 NTD 2,042,398 106,178,272 21 NTD 2,296,398 NTD 401,900 NTD 91,152 Note 1, 2
Hon Hai Precision
Industry Co., Ltd. Lin Yih International
Investment Co., Ltd.
Taiwan Investment holding NTD 904,411 NTD 904,411 96,900,000 100 NTD 978,082 NTD 9,881 NTD 9,065 Note
1 Hon Hai Precision Industry Co., Ltd.
Syntrend Creative Park
Co., Ltd.
Taiwan Retail of office machinery and equipment and electronic appliances, and information software services.
NTD 1,155,704 NTD 513,260 115,570,400 80 NTD 1,080,172 NTD ( 60,162) NTD ( 48,446) Note 1
Hon Hai Precision
Industry Co., Ltd. Premier Image
Technology (H.K)
Hong
Kong
Purchase and the
sales of cameras
NTD $ 22,311 NTD $ 22,311 1,409,000 2 NTD $ 174,408 NTD ($ 48,241) NTD ($ 785) Note
1, 5
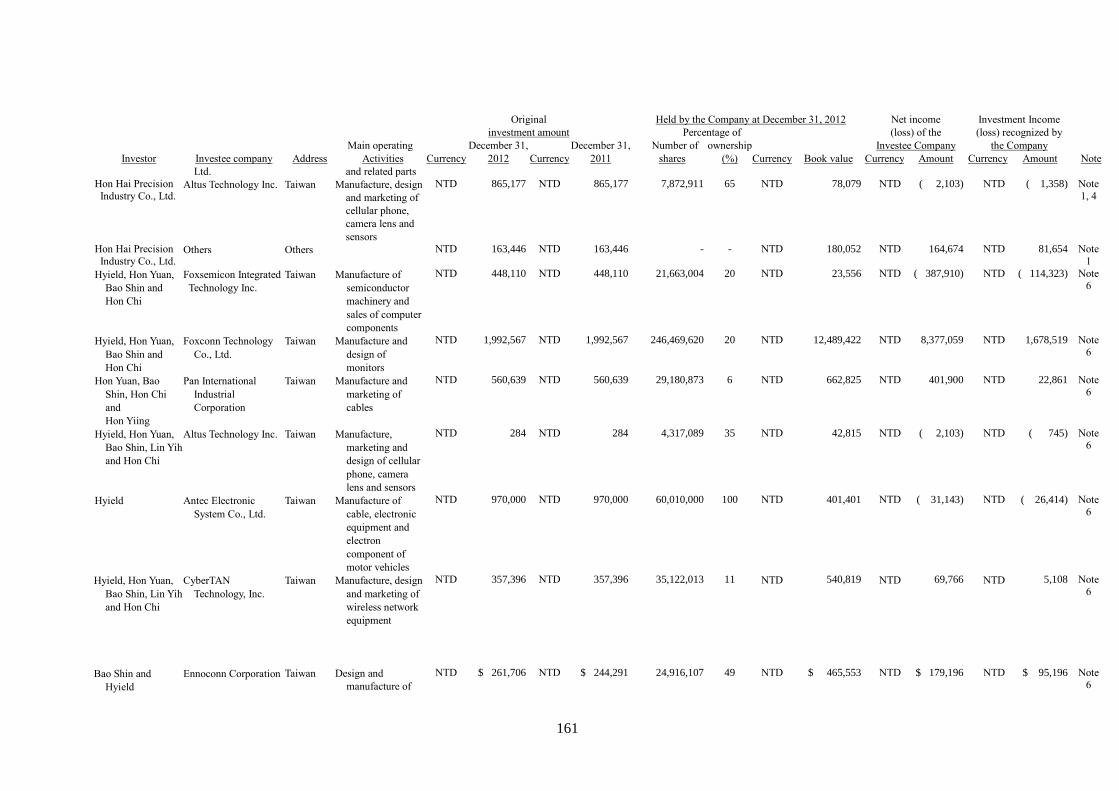
161
Original Held by the Company at December 31, 2012 Net income Investment Income
investment amount Percentage of (loss) of the (loss) recognized by
Main operating December 31, December 31, Number of ownership Investee Company the Company
Investor Investee company Address Activities Currency 2012 Currency 2011 shares (%) Currency Book value Currency Amount Currency Amount Note
Ltd. and related parts
Hon Hai Precision
Industry Co., Ltd. Altus Technology Inc. Taiwan Manufacture, design
and marketing of
cellular phone,
camera lens and
sensors
NTD 865,177 NTD 865,177 7,872,911 65 NTD 78,079 NTD ( 2,103) NTD ( 1,358) Note
1, 4
Hon Hai Precision
Industry Co., Ltd. Others Others NTD 163,446 NTD 163,446 - - NTD 180,052 NTD 164,674 NTD 81,654 Note
1 Hyield, Hon Yuan,
Bao Shin and
Hon Chi
Foxsemicon Integrated
Technology Inc.
Taiwan Manufacture of
semiconductor
machinery and
sales of computer
components
NTD 448,110 NTD 448,110 21,663,004 20 NTD 23,556 NTD ( 387,910) NTD ( 114,323) Note 6
Hyield, Hon Yuan,
Bao Shin and
Hon Chi
Foxconn Technology
Co., Ltd.
Taiwan Manufacture and
design of
monitors
NTD 1,992,567 NTD 1,992,567 246,469,620 20 NTD 12,489,422 NTD 8,377,059 NTD 1,678,519 Note
6
Hon Yuan, Bao
Shin, Hon Chi
and
Hon Yiing
Pan International
Industrial
Corporation
Taiwan Manufacture and
marketing of
cables
NTD 560,639 NTD 560,639 29,180,873 6 NTD 662,825 NTD 401,900 NTD 22,861 Note
6
Hyield, Hon Yuan,
Bao Shin, Lin Yih
and Hon Chi
Altus Technology Inc. Taiwan Manufacture,
marketing and
design of cellular
phone, camera
lens and sensors
NTD 284 NTD 284 4,317,089 35 NTD 42,815 NTD ( 2,103) NTD ( 745) Note 6
Hyield Antec Electronic
System Co., Ltd.
Taiwan Manufacture of
cable, electronic
equipment and
electron
component of
motor vehicles
NTD 970,000 NTD 970,000 60,010,000 100 NTD 401,401 NTD ( 31,143) NTD ( 26,414) Note
6
Hyield, Hon Yuan,
Bao Shin, Lin Yih
and Hon Chi
CyberTAN
Technology, Inc.
Taiwan Manufacture, design
and marketing of
wireless network
equipment
NTD 357,396 NTD 357,396 35,122,013 11 NTD 540,819 NTD 69,766 NTD 5,108 Note
6
Bao Shin and
Hyield
Ennoconn Corporation Taiwan Design and
manufacture of
NTD $ 261,706 NTD $ 244,291 24,916,107 49 NTD $ 465,553 NTD $ 179,196 NTD $ 95,196 Note 6
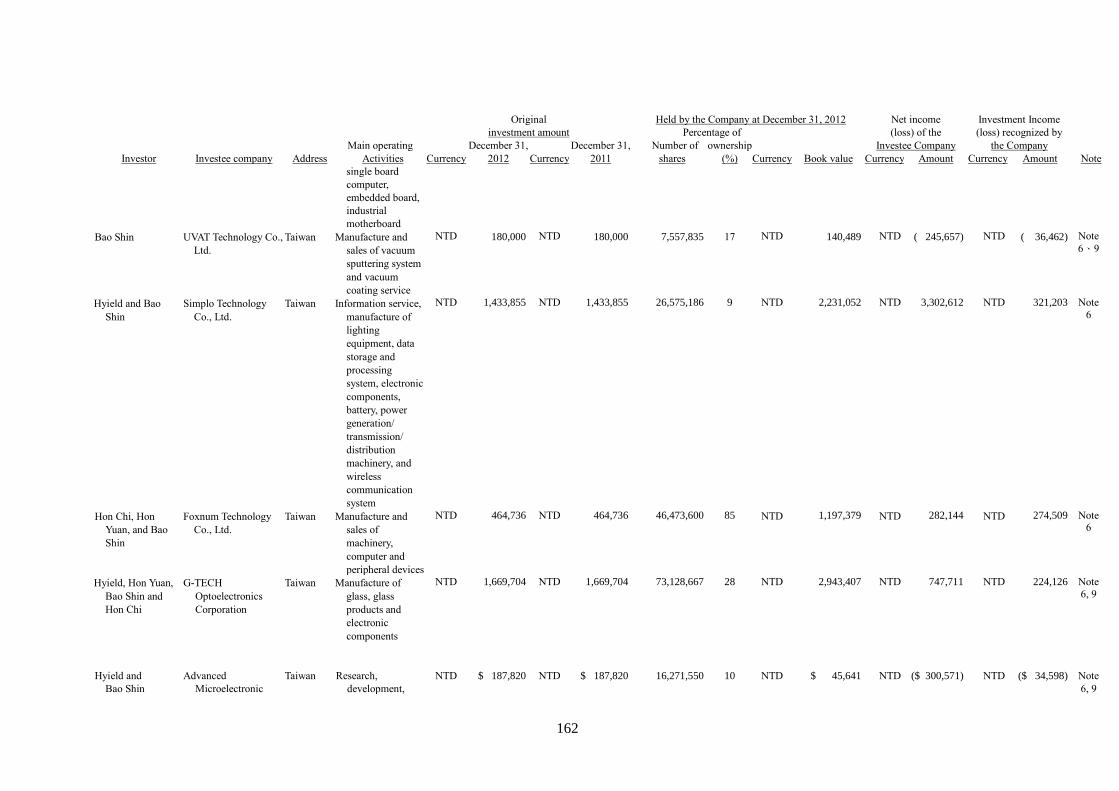
162
Original Held by the Company at December 31, 2012 Net income Investment Income
investment amount Percentage of (loss) of the (loss) recognized by
Main operating December 31, December 31, Number of ownership Investee Company the Company
Investor Investee company Address Activities Currency 2012 Currency 2011 shares (%) Currency Book value Currency Amount Currency Amount Note
single board
computer,
embedded board,
industrial
motherboard
Bao Shin UVAT Technology Co.,
Ltd.
Taiwan Manufacture and
sales of vacuum
sputtering system
and vacuum
coating service
NTD 180,000 NTD 180,000 7,557,835 17 NTD 140,489 NTD ( 245,657) NTD ( 36,462) Note
6、9
Hyield and Bao
Shin
Simplo Technology
Co., Ltd.
Taiwan Information service,
manufacture of
lighting
equipment, data
storage and
processing
system, electronic
components,
battery, power
generation/
transmission/
distribution
machinery, and
wireless
communication
system
NTD 1,433,855 NTD 1,433,855 26,575,186 9 NTD 2,231,052 NTD 3,302,612 NTD 321,203 Note
6
Hon Chi, Hon
Yuan, and Bao
Shin
Foxnum Technology
Co., Ltd.
Taiwan Manufacture and
sales of
machinery,
computer and
peripheral devices
NTD 464,736 NTD 464,736 46,473,600 85 NTD 1,197,379 NTD 282,144 NTD 274,509 Note 6
Hyield, Hon Yuan,
Bao Shin and
Hon Chi
G-TECH
Optoelectronics
Corporation
Taiwan Manufacture of
glass, glass
products and
electronic
components
NTD 1,669,704 NTD 1,669,704 73,128,667 28 NTD 2,943,407 NTD 747,711 NTD 224,126 Note
6, 9
Hyield and
Bao Shin
Advanced
Microelectronic
Taiwan Research,
development,
NTD $ 187,820 NTD $ 187,820 16,271,550 10 NTD $ 45,641 NTD ($ 300,571) NTD ($ 34,598) Note
6, 9
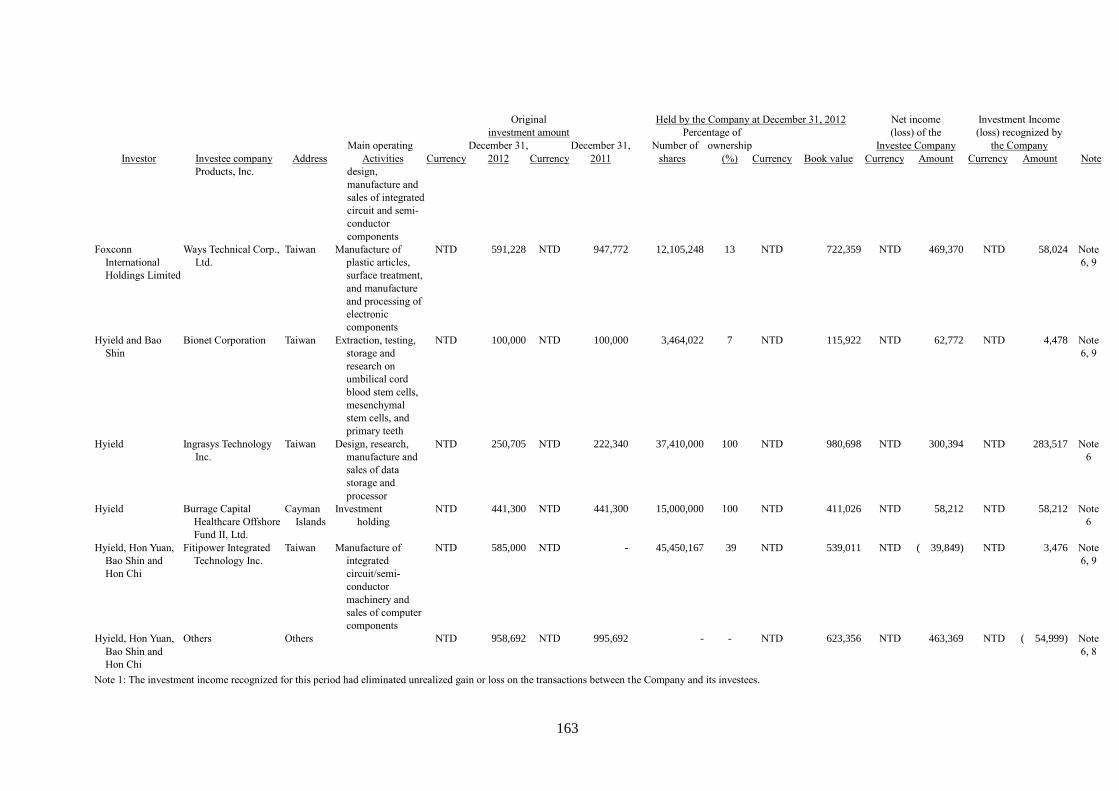
163
Original Held by the Company at December 31, 2012 Net income Investment Income
investment amount Percentage of (loss) of the (loss) recognized by
Main operating December 31, December 31, Number of ownership Investee Company the Company
Investor Investee company Address Activities Currency 2012 Currency 2011 shares (%) Currency Book value Currency Amount Currency Amount Note
Products, Inc. design,
manufacture and
sales of integrated
circuit and semi-
conductor
components
Foxconn
International
Holdings Limited
Ways Technical Corp.,
Ltd.
Taiwan Manufacture of
plastic articles,
surface treatment,
and manufacture
and processing of
electronic
components
NTD 591,228 NTD 947,772 12,105,248 13 NTD 722,359 NTD 469,370 NTD 58,024 Note
6, 9
Hyield and Bao
Shin
Bionet Corporation Taiwan Extraction, testing,
storage and
research on
umbilical cord
blood stem cells,
mesenchymal
stem cells, and
primary teeth
NTD 100,000 NTD 100,000 3,464,022 7 NTD 115,922 NTD 62,772 NTD 4,478 Note
6, 9
Hyield Ingrasys Technology
Inc.
Taiwan Design, research,
manufacture and
sales of data
storage and
processor
NTD 250,705 NTD 222,340 37,410,000 100 NTD 980,698 NTD 300,394 NTD 283,517 Note
6
Hyield Burrage Capital
Healthcare Offshore
Fund II, Ltd.
Cayman
Islands
Investment
holding
NTD 441,300 NTD 441,300 15,000,000 100 NTD 411,026 NTD 58,212 NTD 58,212 Note
6
Hyield, Hon Yuan,
Bao Shin and
Hon Chi
Fitipower Integrated
Technology Inc.
Taiwan Manufacture of
integrated
circuit/semi-
conductor
machinery and
sales of computer
components
NTD 585,000 NTD - 45,450,167 39 NTD 539,011 NTD ( 39,849) NTD 3,476 Note
6, 9
Hyield, Hon Yuan,
Bao Shin and
Hon Chi
Others Others NTD 958,692 NTD 995,692 - - NTD 623,356 NTD 463,369 NTD ( 54,999) Note
6, 8
Note 1: The investment income recognized for this period had eliminated unrealized gain or loss on the transactions between the Company and its investees.
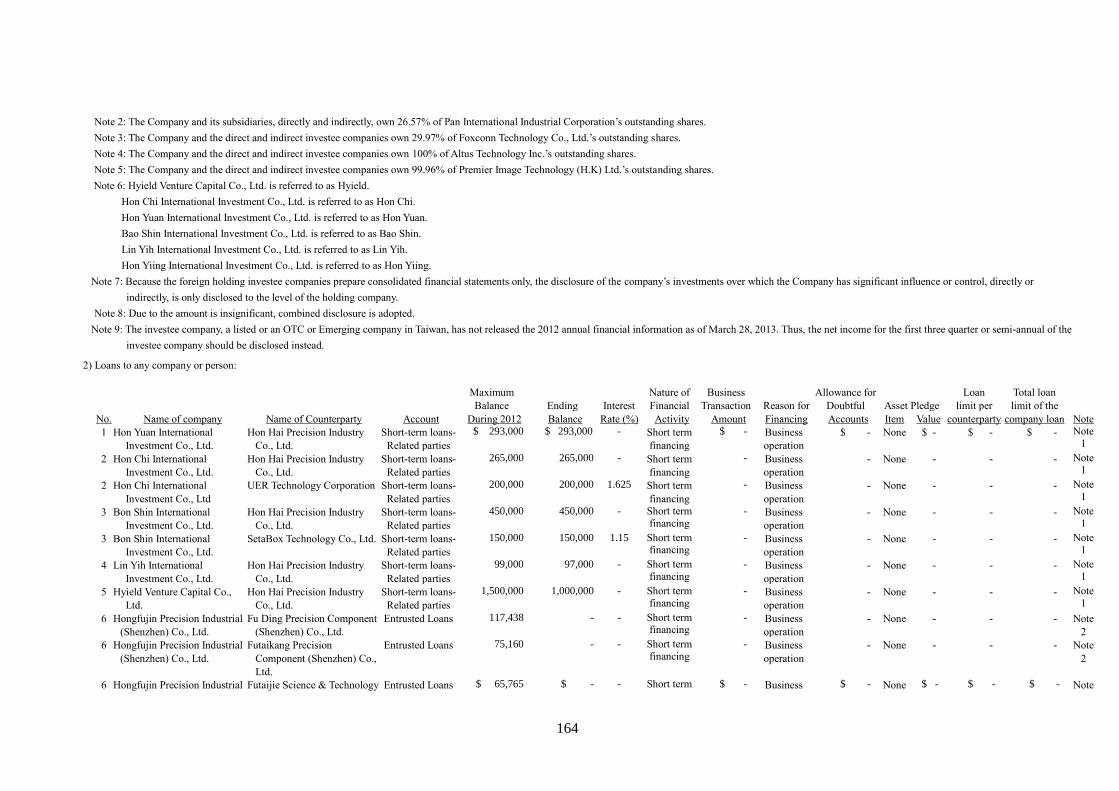
164
Note 2: The Company and its subsidiaries, directly and indirectly, own 26.57% of Pan International Industrial Corporation’s outstanding shares.
Note 3: The Company and the direct and indirect investee companies own 29.97% of Foxconn Technology Co., Ltd.’s outstanding shares.
Note 4: The Company and the direct and indirect investee companies own 100% of Altus Technology Inc.’s outstanding shares.
Note 5: The Company and the direct and indirect investee companies own 99.96% of Premier Image Technology (H.K) Ltd.’s outstanding shares.
Note 6: Hyield Venture Capital Co., Ltd. is referred to as Hyield.
Hon Chi International Investment Co., Ltd. is referred to as Hon Chi.
Hon Yuan International Investment Co., Ltd. is referred to as Hon Yuan.
Bao Shin International Investment Co., Ltd. is referred to as Bao Shin.
Lin Yih International Investment Co., Ltd. is referred to as Lin Yih.
Hon Yiing International Investment Co., Ltd. is referred to as Hon Yiing.
Note 7: Because the foreign holding investee companies prepare consolidated financial statements only, the disclosure of the company’s investments over which the Company has significant influence or control, directly or
indirectly, is only disclosed to the level of the holding company.
Note 8: Due to the amount is insignificant, combined disclosure is adopted.
Note 9: The investee company, a listed or an OTC or Emerging company in Taiwan, has not released the 2012 annual financial information as of March 28, 2013. Thus, the net income for the first three quarter or semi-annual of the
investee company should be disclosed instead.
2) Loans to any company or person:
Maximum Nature of Business Allowance for Loan Total loan
Balance Ending Interest Financial Transaction Reason for Doubtful Asset Pledge limit per limit of the
No. Name of company Name of Counterparty Account During 2012 Balance Rate (%) Activity Amount Financing Accounts Item Value counterparty company loan Note
1 Hon Yuan International
Investment Co., Ltd.
Hon Hai Precision Industry
Co., Ltd.
Short-term loans-
Related parties
$ 293,000 $ 293,000 - Short term
financing $ - Business
operation $ - None $ - $ - $ - Note
1
2 Hon Chi International
Investment Co., Ltd.
Hon Hai Precision Industry
Co., Ltd.
Short-term loans-
Related parties
265,000 265,000 - Short term
financing - Business
operation - None - - - Note
1
2 Hon Chi International
Investment Co., Ltd
UER Technology Corporation Short-term loans-
Related parties
200,000 200,000 1.625 Short term
financing - Business
operation - None - - - Note
1
3 Bon Shin International
Investment Co., Ltd.
Hon Hai Precision Industry
Co., Ltd.
Short-term loans-
Related parties
450,000 450,000 - Short term
financing - Business
operation - None - - - Note
1
3 Bon Shin International
Investment Co., Ltd.
SetaBox Technology Co., Ltd. Short-term loans-
Related parties
150,000 150,000 1.15 Short term financing
- Business
operation - None - - - Note
1
4 Lin Yih International
Investment Co., Ltd.
Hon Hai Precision Industry
Co., Ltd.
Short-term loans-
Related parties
99,000 97,000 - Short term
financing - Business
operation - None - - - Note
1
5 Hyield Venture Capital Co.,
Ltd.
Hon Hai Precision Industry
Co., Ltd.
Short-term loans-
Related parties
1,500,000 1,000,000 - Short term
financing - Business
operation - None - - - Note
1
6 Hongfujin Precision Industrial
(Shenzhen) Co., Ltd.
Fu Ding Precision Component
(Shenzhen) Co., Ltd.
Entrusted Loans 117,438 - - Short term financing
- Business
operation - None - - - Note
2
6 Hongfujin Precision Industrial
(Shenzhen) Co., Ltd.
Futaikang Precision
Component (Shenzhen) Co.,
Ltd.
Entrusted Loans 75,160 - - Short term
financing - Business
operation - None - - - Note
2
6 Hongfujin Precision Industrial Futaijie Science & Technology Entrusted Loans $ 65,765 $ - - Short term $ - Business $ - None $ - $ - $ - Note
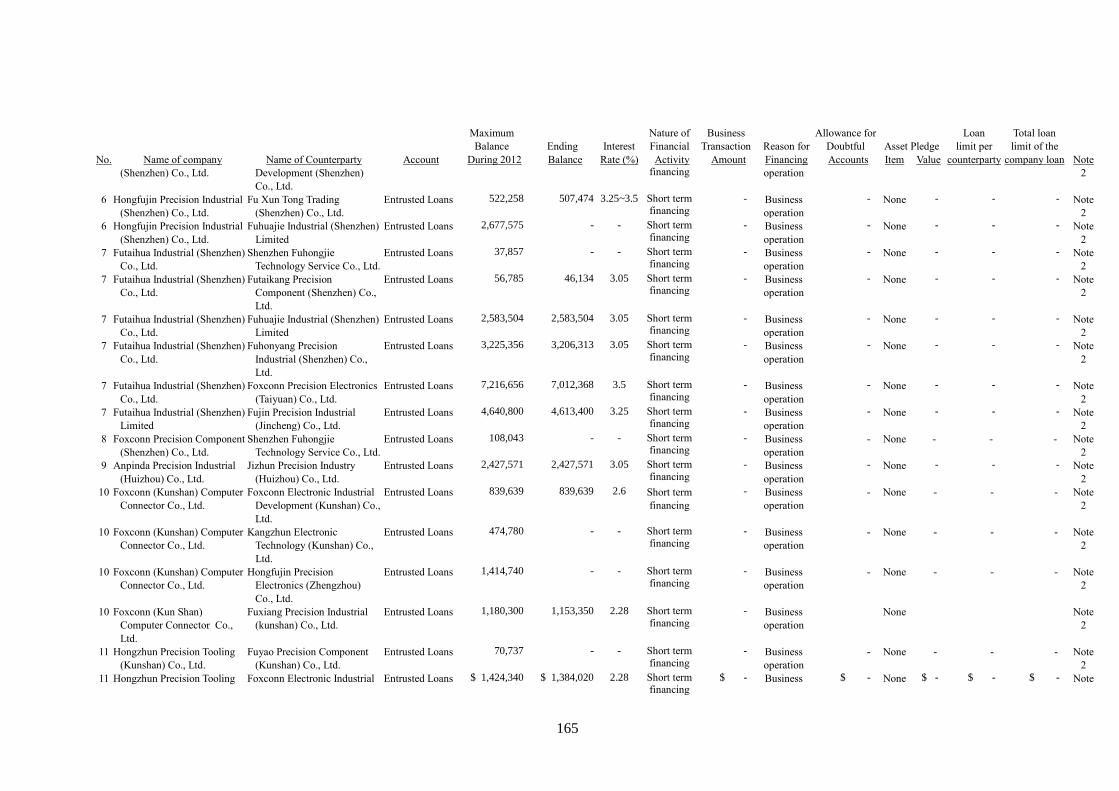
165
Maximum Nature of Business Allowance for Loan Total loan
Balance Ending Interest Financial Transaction Reason for Doubtful Asset Pledge limit per limit of the
No. Name of company Name of Counterparty Account During 2012 Balance Rate (%) Activity Amount Financing Accounts Item Value counterparty company loan Note
(Shenzhen) Co., Ltd. Development (Shenzhen)
Co., Ltd.
financing operation 2
6 Hongfujin Precision Industrial
(Shenzhen) Co., Ltd.
Fu Xun Tong Trading
(Shenzhen) Co., Ltd.
Entrusted Loans 522,258 507,474 3.25~3.5 Short term
financing - Business
operation - None - - - Note
2
6 Hongfujin Precision Industrial
(Shenzhen) Co., Ltd.
Fuhuajie Industrial (Shenzhen)
Limited
Entrusted Loans 2,677,575 - - Short term
financing - Business
operation - None - - - Note
2
7 Futaihua Industrial (Shenzhen)
Co., Ltd.
Shenzhen Fuhongjie
Technology Service Co., Ltd.
Entrusted Loans 37,857 - - Short term
financing - Business
operation - None - - - Note
2
7 Futaihua Industrial (Shenzhen)
Co., Ltd.
Futaikang Precision
Component (Shenzhen) Co.,
Ltd.
Entrusted Loans 56,785 46,134 3.05 Short term financing
- Business
operation - None - - - Note
2
7 Futaihua Industrial (Shenzhen)
Co., Ltd.
Fuhuajie Industrial (Shenzhen)
Limited
Entrusted Loans 2,583,504 2,583,504 3.05 Short term financing
- Business
operation - None - - - Note
2
7 Futaihua Industrial (Shenzhen)
Co., Ltd.
Fuhonyang Precision
Industrial (Shenzhen) Co.,
Ltd.
Entrusted Loans 3,225,356 3,206,313 3.05 Short term
financing - Business
operation - None - - - Note
2
7 Futaihua Industrial (Shenzhen)
Co., Ltd.
Foxconn Precision Electronics
(Taiyuan) Co., Ltd.
Entrusted Loans 7,216,656 7,012,368 3.5 Short term
financing - Business
operation - None - - - Note
2
7 Futaihua Industrial (Shenzhen)
Limited
Fujin Precision Industrial
(Jincheng) Co., Ltd.
Entrusted Loans 4,640,800 4,613,400 3.25 Short term
financing - Business
operation - None - - - Note
2
8 Foxconn Precision Component
(Shenzhen) Co., Ltd.
Shenzhen Fuhongjie
Technology Service Co., Ltd.
Entrusted Loans 108,043 - - Short term financing
- Business
operation - None - - - Note
2
9 Anpinda Precision Industrial
(Huizhou) Co., Ltd.
Jizhun Precision Industry
(Huizhou) Co., Ltd.
Entrusted Loans 2,427,571 2,427,571 3.05 Short term
financing - Business
operation - None - - - Note
2
10 Foxconn (Kunshan) Computer
Connector Co., Ltd.
Foxconn Electronic Industrial
Development (Kunshan) Co.,
Ltd.
Entrusted Loans 839,639 839,639 2.6 Short term
financing - Business
operation - None - - - Note
2
10 Foxconn (Kunshan) Computer
Connector Co., Ltd.
Kangzhun Electronic
Technology (Kunshan) Co.,
Ltd.
Entrusted Loans 474,780 - - Short term
financing - Business
operation - None - - - Note
2
10 Foxconn (Kunshan) Computer
Connector Co., Ltd.
Hongfujin Precision
Electronics (Zhengzhou)
Co., Ltd.
Entrusted Loans 1,414,740 - - Short term
financing - Business
operation - None - - - Note
2
10 Foxconn (Kun Shan)
Computer Connector Co.,
Ltd.
Fuxiang Precision Industrial
(kunshan) Co., Ltd.
Entrusted Loans 1,180,300 1,153,350 2.28 Short term
financing - Business
operation None Note
2
11 Hongzhun Precision Tooling
(Kunshan) Co., Ltd.
Fuyao Precision Component
(Kunshan) Co., Ltd.
Entrusted Loans 70,737 - - Short term
financing - Business
operation - None - - - Note
2
11 Hongzhun Precision Tooling Foxconn Electronic Industrial Entrusted Loans $ 1,424,340 $ 1,384,020 2.28 Short term financing
$ - Business $ - None $ - $ - $ - Note
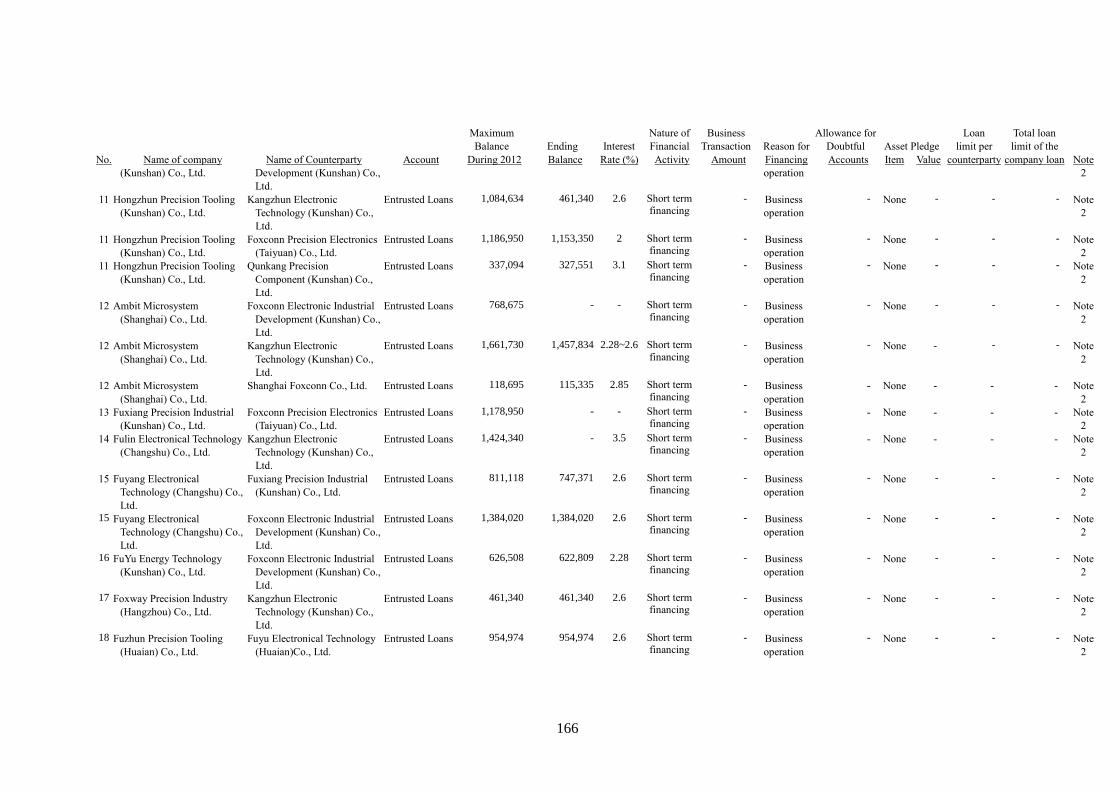
166
Maximum Nature of Business Allowance for Loan Total loan
Balance Ending Interest Financial Transaction Reason for Doubtful Asset Pledge limit per limit of the
No. Name of company Name of Counterparty Account During 2012 Balance Rate (%) Activity Amount Financing Accounts Item Value counterparty company loan Note
(Kunshan) Co., Ltd. Development (Kunshan) Co.,
Ltd.
operation 2
11 Hongzhun Precision Tooling
(Kunshan) Co., Ltd.
Kangzhun Electronic
Technology (Kunshan) Co.,
Ltd.
Entrusted Loans 1,084,634 461,340 2.6 Short term
financing - Business
operation - None - - - Note
2
11 Hongzhun Precision Tooling
(Kunshan) Co., Ltd.
Foxconn Precision Electronics
(Taiyuan) Co., Ltd.
Entrusted Loans 1,186,950 1,153,350 2 Short term financing
- Business
operation - None - - - Note
2
11 Hongzhun Precision Tooling
(Kunshan) Co., Ltd.
Qunkang Precision
Component (Kunshan) Co.,
Ltd.
Entrusted Loans 337,094 327,551 3.1 Short term
financing - Business
operation - None - - - Note
2
12 Ambit Microsystem
(Shanghai) Co., Ltd.
Foxconn Electronic Industrial
Development (Kunshan) Co.,
Ltd.
Entrusted Loans 768,675 - - Short term
financing - Business
operation - None - - - Note
2
12 Ambit Microsystem
(Shanghai) Co., Ltd.
Kangzhun Electronic
Technology (Kunshan) Co.,
Ltd.
Entrusted Loans 1,661,730 1,457,834 2.28~2.6 Short term
financing - Business
operation - None - - - Note
2
12 Ambit Microsystem
(Shanghai) Co., Ltd.
Shanghai Foxconn Co., Ltd. Entrusted Loans 118,695 115,335 2.85 Short term
financing - Business
operation - None - - - Note
2
13 Fuxiang Precision Industrial
(Kunshan) Co., Ltd.
Foxconn Precision Electronics
(Taiyuan) Co., Ltd.
Entrusted Loans 1,178,950 - - Short term
financing - Business
operation - None - - - Note
2
14 Fulin Electronical Technology
(Changshu) Co., Ltd.
Kangzhun Electronic
Technology (Kunshan) Co.,
Ltd.
Entrusted Loans 1,424,340 - 3.5 Short term financing
- Business
operation - None - - - Note
2
15 Fuyang Electronical
Technology (Changshu) Co.,
Ltd.
Fuxiang Precision Industrial
(Kunshan) Co., Ltd.
Entrusted Loans 811,118 747,371 2.6 Short term financing
- Business
operation - None - - - Note
2
15 Fuyang Electronical
Technology (Changshu) Co.,
Ltd.
Foxconn Electronic Industrial
Development (Kunshan) Co.,
Ltd.
Entrusted Loans 1,384,020 1,384,020 2.6 Short term financing
- Business
operation - None - - - Note
2
16 FuYu Energy Technology
(Kunshan) Co., Ltd.
Foxconn Electronic Industrial
Development (Kunshan) Co.,
Ltd.
Entrusted Loans 626,508 622,809 2.28 Short term financing
- Business
operation - None - - - Note
2
17 Foxway Precision Industry
(Hangzhou) Co., Ltd.
Kangzhun Electronic
Technology (Kunshan) Co.,
Ltd.
Entrusted Loans 461,340 461,340 2.6 Short term financing
- Business
operation - None - - - Note
2
18 Fuzhun Precision Tooling
(Huaian) Co., Ltd.
Fuyu Electronical Technology
(Huaian)Co., Ltd.
Entrusted Loans 954,974 954,974 2.6 Short term financing
- Business
operation - None - - - Note
2
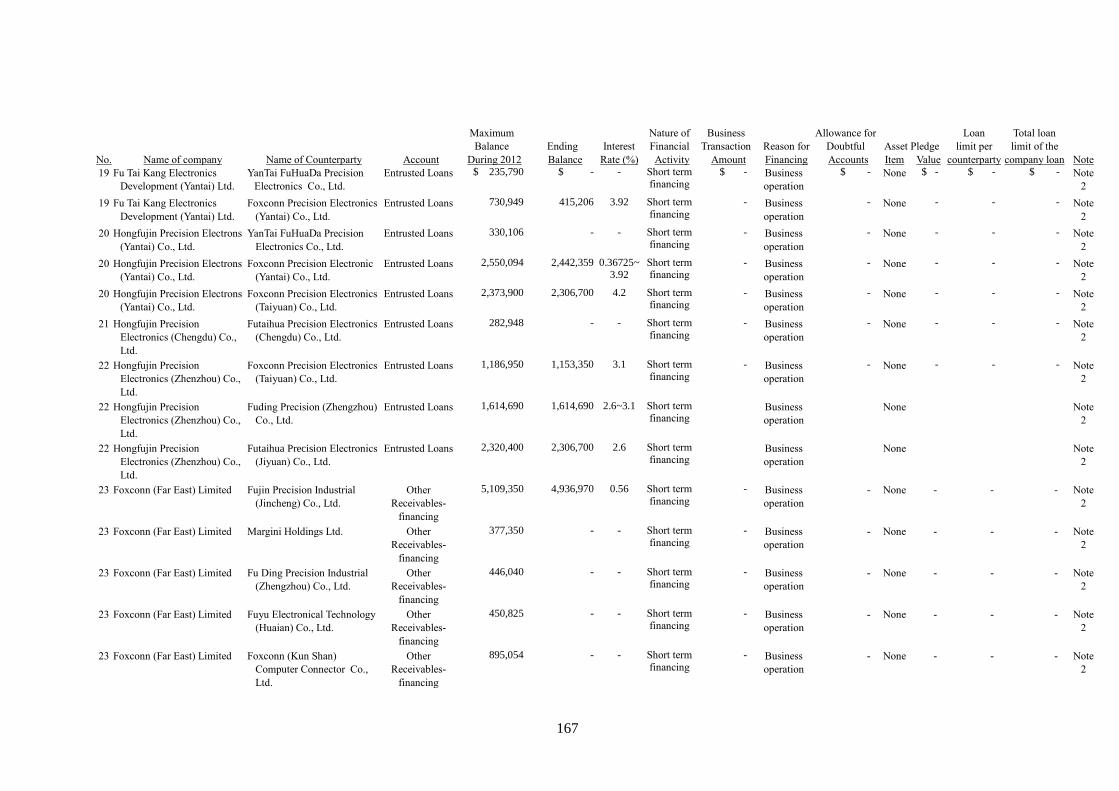
167
Maximum Nature of Business Allowance for Loan Total loan
Balance Ending Interest Financial Transaction Reason for Doubtful Asset Pledge limit per limit of the
No. Name of company Name of Counterparty Account During 2012 Balance Rate (%) Activity Amount Financing Accounts Item Value counterparty company loan Note
19 Fu Tai Kang Electronics
Development (Yantai) Ltd.
YanTai FuHuaDa Precision
Electronics Co., Ltd.
Entrusted Loans $ 235,790 $ - - Short term
financing $ - Business
operation $ - None $ - $ - $ - Note
2
19 Fu Tai Kang Electronics
Development (Yantai) Ltd.
Foxconn Precision Electronics
(Yantai) Co., Ltd.
Entrusted Loans 730,949 415,206 3.92 Short term
financing - Business
operation - None - - - Note
2
20 Hongfujin Precision Electrons
(Yantai) Co., Ltd.
YanTai FuHuaDa Precision
Electronics Co., Ltd.
Entrusted Loans 330,106 - - Short term
financing - Business
operation - None - - - Note
2
20 Hongfujin Precision Electrons
(Yantai) Co., Ltd.
Foxconn Precision Electronic
(Yantai) Co., Ltd.
Entrusted Loans 2,550,094 2,442,359 0.36725~3.92
Short term financing
- Business
operation - None - - - Note
2
20 Hongfujin Precision Electrons
(Yantai) Co., Ltd.
Foxconn Precision Electronics
(Taiyuan) Co., Ltd.
Entrusted Loans 2,373,900 2,306,700 4.2 Short term financing
- Business
operation - None - - - Note
2
21 Hongfujin Precision
Electronics (Chengdu) Co.,
Ltd.
Futaihua Precision Electronics
(Chengdu) Co., Ltd.
Entrusted Loans 282,948 - - Short term
financing - Business
operation - None - - - Note
2
22 Hongfujin Precision
Electronics (Zhenzhou) Co.,
Ltd.
Foxconn Precision Electronics
(Taiyuan) Co., Ltd.
Entrusted Loans 1,186,950 1,153,350 3.1 Short term
financing
- Business
operation
- None - - - Note
2
22 Hongfujin Precision
Electronics (Zhenzhou) Co.,
Ltd.
Fuding Precision (Zhengzhou)
Co., Ltd.
Entrusted Loans 1,614,690 1,614,690 2.6~3.1 Short term
financing
Business
operation
None Note
2
22
Hongfujin Precision
Electronics (Zhenzhou) Co.,
Ltd.
Futaihua Precision Electronics
(Jiyuan) Co., Ltd.
Entrusted Loans 2,320,400 2,306,700 2.6 Short term
financing
Business
operation
None Note
2
23 Foxconn (Far East) Limited Fujin Precision Industrial
(Jincheng) Co., Ltd.
Other
Receivables-
financing
5,109,350 4,936,970 0.56 Short term
financing
- Business
operation
- None - - - Note
2
23 Foxconn (Far East) Limited Margini Holdings Ltd. Other
Receivables-
financing
377,350 - - Short term
financing - Business
operation - None - - - Note
2
23 Foxconn (Far East) Limited Fu Ding Precision Industrial
(Zhengzhou) Co., Ltd.
Other
Receivables-
financing
446,040 - - Short term
financing - Business
operation - None - - - Note
2
23 Foxconn (Far East) Limited Fuyu Electronical Technology
(Huaian) Co., Ltd.
Other
Receivables-
financing
450,825 - - Short term
financing - Business
operation - None - - - Note
2
23 Foxconn (Far East) Limited Foxconn (Kun Shan)
Computer Connector Co.,
Ltd.
Other
Receivables-
financing
895,054 - - Short term
financing - Business
operation - None - - - Note
2
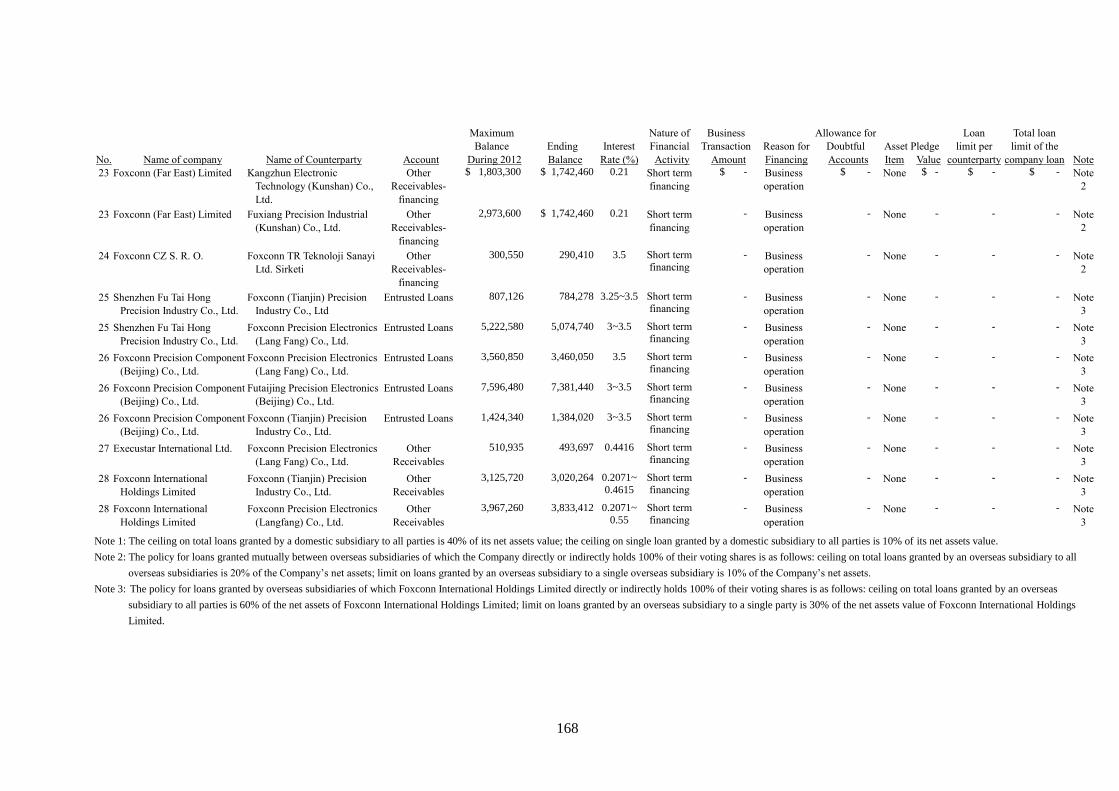
168
Maximum Nature of Business Allowance for Loan Total loan
Balance Ending Interest Financial Transaction Reason for Doubtful Asset Pledge limit per limit of the
No. Name of company Name of Counterparty Account During 2012 Balance Rate (%) Activity Amount Financing Accounts Item Value counterparty company loan Note
23 Foxconn (Far East) Limited Kangzhun Electronic
Technology (Kunshan) Co.,
Ltd.
Other
Receivables-
financing
$ 1,803,300 $ 1,742,460 0.21 Short term
financing
$ - Business
operation
$ - None $ - $ - $ - Note
2
23 Foxconn (Far East) Limited Fuxiang Precision Industrial
(Kunshan) Co., Ltd.
Other
Receivables-
financing
2,973,600 $ 1,742,460 0.21 Short term
financing - Business
operation - None - - - Note
2
24 Foxconn CZ S. R. O. Foxconn TR Teknoloji Sanayi
Ltd. Sirketi
Other
Receivables-
financing
300,550 290,410 3.5 Short term
financing - Business
operation - None - - - Note
2
25 Shenzhen Fu Tai Hong
Precision Industry Co., Ltd.
Foxconn (Tianjin) Precision
Industry Co., Ltd
Entrusted Loans 807,126 784,278 3.25~3.5 Short term
financing - Business
operation - None - - - Note
3
25 Shenzhen Fu Tai Hong
Precision Industry Co., Ltd.
Foxconn Precision Electronics
(Lang Fang) Co., Ltd.
Entrusted Loans 5,222,580 5,074,740 3~3.5 Short term
financing - Business
operation - None - - - Note
3
26 Foxconn Precision Component
(Beijing) Co., Ltd.
Foxconn Precision Electronics
(Lang Fang) Co., Ltd.
Entrusted Loans 3,560,850 3,460,050 3.5 Short term
financing - Business
operation - None - - - Note
3
26 Foxconn Precision Component
(Beijing) Co., Ltd.
Futaijing Precision Electronics
(Beijing) Co., Ltd.
Entrusted Loans 7,596,480 7,381,440 3~3.5 Short term financing
- Business
operation - None - - - Note
3
26 Foxconn Precision Component
(Beijing) Co., Ltd.
Foxconn (Tianjin) Precision
Industry Co., Ltd.
Entrusted Loans 1,424,340 1,384,020 3~3.5 Short term financing
- Business
operation - None - - - Note
3
27 Execustar International Ltd. Foxconn Precision Electronics
(Lang Fang) Co., Ltd.
Other
Receivables
510,935 493,697 0.4416 Short term
financing - Business
operation - None - - - Note
3
28 Foxconn International
Holdings Limited
Foxconn (Tianjin) Precision
Industry Co., Ltd.
Other
Receivables
3,125,720 3,020,264 0.2071~
0.4615
Short term
financing - Business
operation - None - - - Note
3
28 Foxconn International
Holdings Limited
Foxconn Precision Electronics
(Langfang) Co., Ltd.
Other
Receivables
3,967,260 3,833,412 0.2071~
0.55
Short term
financing - Business
operation - None - - - Note
3
Note 1: The ceiling on total loans granted by a domestic subsidiary to all parties is 40% of its net assets value; the ceiling on single loan granted by a domestic subsidiary to all parties is 10% of its net assets value.
Note 2: The policy for loans granted mutually between overseas subsidiaries of which the Company directly or indirectly holds 100% of their voting shares is as follows: ceiling on total loans granted by an overseas subsidiary to all
overseas subsidiaries is 20% of the Company’s net assets; limit on loans granted by an overseas subsidiary to a single overseas subsidiary is 10% of the Company’s net assets.
Note 3: The policy for loans granted by overseas subsidiaries of which Foxconn International Holdings Limited directly or indirectly holds 100% of their voting shares is as follows: ceiling on total loans granted by an overseas
subsidiary to all parties is 60% of the net assets of Foxconn International Holdings Limited; limit on loans granted by an overseas subsidiary to a single party is 30% of the net assets value of Foxconn International Holdings
Limited.
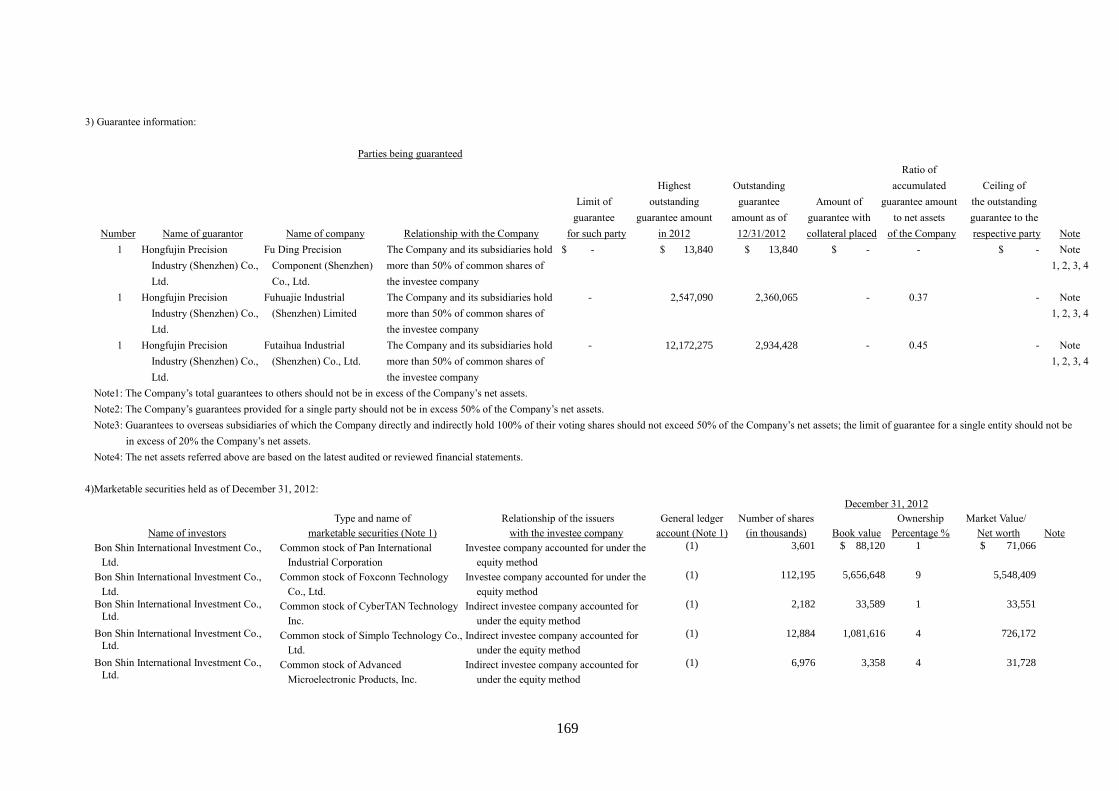
169
3) Guarantee information:
Parties being guaranteed
Number Name of guarantor Name of company Relationship with the Company
Limit of
guarantee
for such party
Highest
outstanding
guarantee amount
in 2012
Outstanding
guarantee
amount as of
12/31/2012
Amount of
guarantee with
collateral placed
Ratio of
accumulated
guarantee amount
to net assets
of the Company
Ceiling of
the outstanding
guarantee to the
respective party
Note
1 Hongfujin Precision
Industry (Shenzhen) Co.,
Ltd.
Fu Ding Precision
Component (Shenzhen)
Co., Ltd.
The Company and its subsidiaries hold
more than 50% of common shares of
the investee company
$ - $ 13,840 $ 13,840 $ - - $ - Note
1, 2, 3, 4
1 Hongfujin Precision
Industry (Shenzhen) Co.,
Ltd.
Fuhuajie Industrial
(Shenzhen) Limited
The Company and its subsidiaries hold
more than 50% of common shares of
the investee company
- 2,547,090 2,360,065 - 0.37 - Note
1, 2, 3, 4
1 Hongfujin Precision
Industry (Shenzhen) Co.,
Ltd.
Futaihua Industrial
(Shenzhen) Co., Ltd.
The Company and its subsidiaries hold
more than 50% of common shares of
the investee company
- 12,172,275 2,934,428 - 0.45 - Note
1, 2, 3, 4
Note1: The Company’s total guarantees to others should not be in excess of the Company’s net assets.
Note2: The Company’s guarantees provided for a single party should not be in excess 50% of the Company’s net assets.
Note3: Guarantees to overseas subsidiaries of which the Company directly and indirectly hold 100% of their voting shares should not exceed 50% of the Company’s net assets; the limit of guarantee for a single entity should not be
in excess of 20% the Company’s net assets.
Note4: The net assets referred above are based on the latest audited or reviewed financial statements.
4)Marketable securities held as of December 31, 2012:
December 31, 2012
Type and name of Relationship of the issuers General ledger Number of shares Ownership Market Value/
Name of investors marketable securities (Note 1) with the investee company account (Note 1) (in thousands) Book value Percentage % Net worth Note
Bon Shin International Investment Co.,
Ltd.
Common stock of Pan International
Industrial Corporation
Investee company accounted for under the
equity method
(1) 3,601 $ 88,120 1 $ 71,066
Bon Shin International Investment Co.,
Ltd.
Common stock of Foxconn Technology
Co., Ltd.
Investee company accounted for under the
equity method
(1) 112,195 5,656,648 9 5,548,409
Bon Shin International Investment Co.,
Ltd. Common stock of CyberTAN Technology
Inc.
Indirect investee company accounted for
under the equity method
(1) 2,182 33,589 1 33,551
Bon Shin International Investment Co.,
Ltd. Common stock of Simplo Technology Co.,
Ltd.
Indirect investee company accounted for
under the equity method
(1) 12,884 1,081,616 4 726,172
Bon Shin International Investment Co.,
Ltd. Common stock of Advanced
Microelectronic Products, Inc.
Indirect investee company accounted for
under the equity method
(1) 6,976 3,358 4 31,728
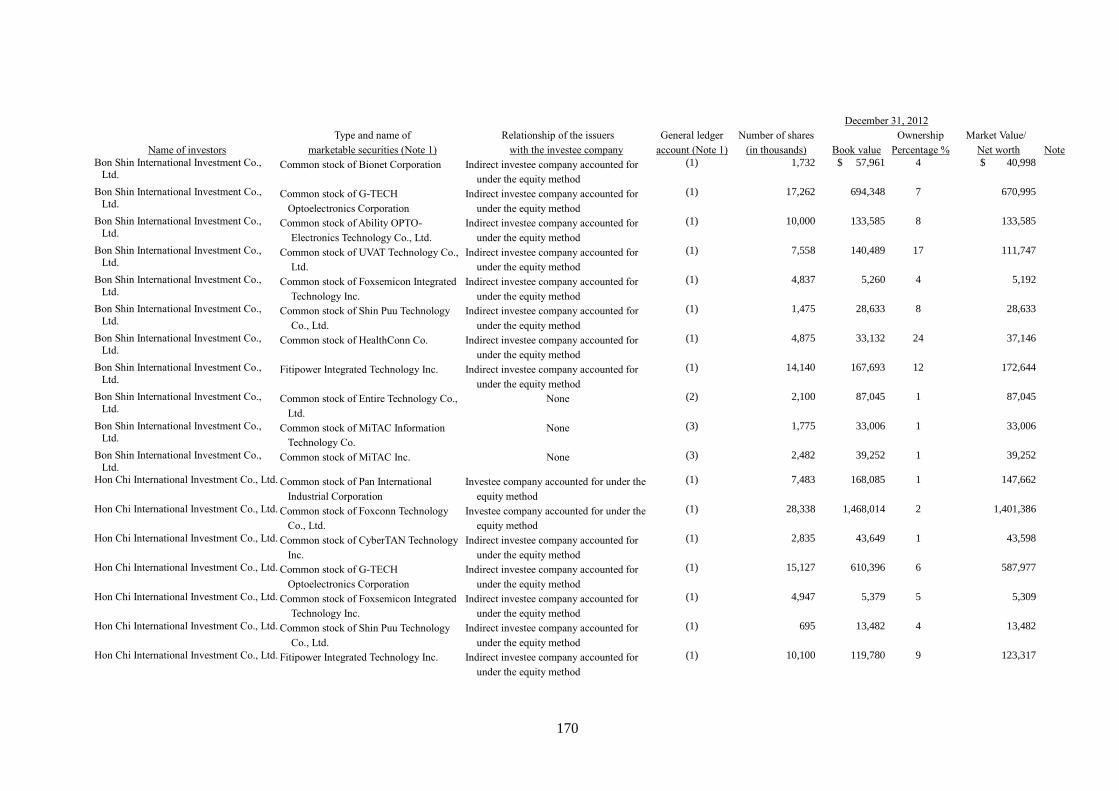
170
December 31, 2012
Type and name of Relationship of the issuers General ledger Number of shares Ownership Market Value/
Name of investors marketable securities (Note 1) with the investee company account (Note 1) (in thousands) Book value Percentage % Net worth Note
Bon Shin International Investment Co., Ltd.
Common stock of Bionet Corporation Indirect investee company accounted for
under the equity method
(1) 1,732 $ 57,961 4 $ 40,998
Bon Shin International Investment Co.,
Ltd. Common stock of G-TECH
Optoelectronics Corporation
Indirect investee company accounted for
under the equity method
(1) 17,262 694,348 7 670,995
Bon Shin International Investment Co.,
Ltd. Common stock of Ability OPTO-
Electronics Technology Co., Ltd.
Indirect investee company accounted for
under the equity method
(1) 10,000 133,585 8 133,585
Bon Shin International Investment Co., Ltd.
Common stock of UVAT Technology Co.,
Ltd.
Indirect investee company accounted for
under the equity method
(1) 7,558 140,489 17 111,747
Bon Shin International Investment Co.,
Ltd. Common stock of Foxsemicon Integrated
Technology Inc.
Indirect investee company accounted for
under the equity method
(1) 4,837 5,260 4 5,192
Bon Shin International Investment Co.,
Ltd. Common stock of Shin Puu Technology
Co., Ltd.
Indirect investee company accounted for
under the equity method
(1) 1,475 28,633 8 28,633
Bon Shin International Investment Co., Ltd.
Common stock of HealthConn Co. Indirect investee company accounted for
under the equity method
(1) 4,875 33,132 24 37,146
Bon Shin International Investment Co.,
Ltd. Fitipower Integrated Technology Inc. Indirect investee company accounted for
under the equity method
(1) 14,140 167,693 12 172,644
Bon Shin International Investment Co.,
Ltd. Common stock of Entire Technology Co.,
Ltd.
None (2) 2,100 87,045 1 87,045
Bon Shin International Investment Co., Ltd.
Common stock of MiTAC Information
Technology Co.
None (3) 1,775 33,006 1 33,006
Bon Shin International Investment Co.,
Ltd. Common stock of MiTAC Inc. None (3) 2,482 39,252 1 39,252
Hon Chi International Investment Co., Ltd. Common stock of Pan International
Industrial Corporation
Investee company accounted for under the
equity method
(1) 7,483 168,085 1 147,662
Hon Chi International Investment Co., Ltd. Common stock of Foxconn Technology
Co., Ltd.
Investee company accounted for under the
equity method
(1) 28,338 1,468,014 2 1,401,386
Hon Chi International Investment Co., Ltd. Common stock of CyberTAN Technology
Inc.
Indirect investee company accounted for
under the equity method
(1) 2,835 43,649 1 43,598
Hon Chi International Investment Co., Ltd. Common stock of G-TECH
Optoelectronics Corporation
Indirect investee company accounted for
under the equity method
(1) 15,127 610,396 6 587,977
Hon Chi International Investment Co., Ltd. Common stock of Foxsemicon Integrated
Technology Inc.
Indirect investee company accounted for
under the equity method
(1) 4,947 5,379 5 5,309
Hon Chi International Investment Co., Ltd. Common stock of Shin Puu Technology
Co., Ltd.
Indirect investee company accounted for
under the equity method
(1) 695 13,482 4 13,482
Hon Chi International Investment Co., Ltd. Fitipower Integrated Technology Inc. Indirect investee company accounted for
under the equity method
(1) 10,100 119,780 9 123,317
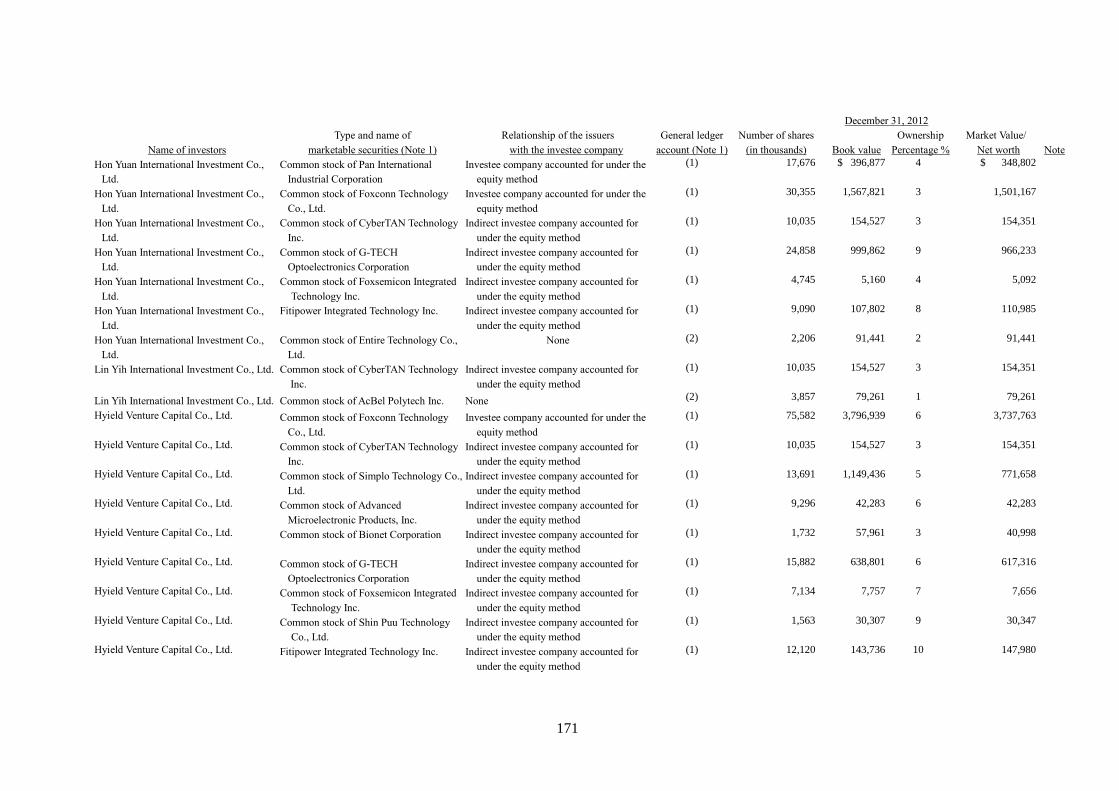
171
December 31, 2012
Type and name of Relationship of the issuers General ledger Number of shares Ownership Market Value/
Name of investors marketable securities (Note 1) with the investee company account (Note 1) (in thousands) Book value Percentage % Net worth Note
Hon Yuan International Investment Co.,
Ltd.
Common stock of Pan International
Industrial Corporation
Investee company accounted for under the
equity method
(1) 17,676 $ 396,877 4 $ 348,802
Hon Yuan International Investment Co.,
Ltd.
Common stock of Foxconn Technology
Co., Ltd.
Investee company accounted for under the
equity method
(1) 30,355 1,567,821 3 1,501,167
Hon Yuan International Investment Co.,
Ltd.
Common stock of CyberTAN Technology
Inc.
Indirect investee company accounted for
under the equity method
(1) 10,035 154,527 3 154,351
Hon Yuan International Investment Co.,
Ltd.
Common stock of G-TECH
Optoelectronics Corporation
Indirect investee company accounted for
under the equity method
(1) 24,858 999,862 9 966,233
Hon Yuan International Investment Co.,
Ltd.
Common stock of Foxsemicon Integrated
Technology Inc.
Indirect investee company accounted for
under the equity method
(1) 4,745 5,160 4 5,092
Hon Yuan International Investment Co.,
Ltd.
Fitipower Integrated Technology Inc. Indirect investee company accounted for
under the equity method
(1) 9,090 107,802 8 110,985
Hon Yuan International Investment Co.,
Ltd.
Common stock of Entire Technology Co.,
Ltd.
None (2) 2,206 91,441 2 91,441
Lin Yih International Investment Co., Ltd. Common stock of CyberTAN Technology
Inc.
Indirect investee company accounted for
under the equity method
(1) 10,035 154,527 3 154,351
Lin Yih International Investment Co., Ltd. Common stock of AcBel Polytech Inc. None (2) 3,857 79,261 1 79,261
Hyield Venture Capital Co., Ltd. Common stock of Foxconn Technology
Co., Ltd.
Investee company accounted for under the
equity method
(1) 75,582 3,796,939 6 3,737,763
Hyield Venture Capital Co., Ltd. Common stock of CyberTAN Technology
Inc.
Indirect investee company accounted for
under the equity method
(1) 10,035 154,527 3 154,351
Hyield Venture Capital Co., Ltd. Common stock of Simplo Technology Co.,
Ltd.
Indirect investee company accounted for
under the equity method
(1) 13,691 1,149,436 5 771,658
Hyield Venture Capital Co., Ltd. Common stock of Advanced
Microelectronic Products, Inc.
Indirect investee company accounted for
under the equity method
(1) 9,296 42,283 6 42,283
Hyield Venture Capital Co., Ltd. Common stock of Bionet Corporation Indirect investee company accounted for
under the equity method
(1) 1,732 57,961 3 40,998
Hyield Venture Capital Co., Ltd. Common stock of G-TECH
Optoelectronics Corporation
Indirect investee company accounted for
under the equity method
(1) 15,882 638,801 6 617,316
Hyield Venture Capital Co., Ltd. Common stock of Foxsemicon Integrated
Technology Inc.
Indirect investee company accounted for
under the equity method
(1) 7,134 7,757 7 7,656
Hyield Venture Capital Co., Ltd. Common stock of Shin Puu Technology
Co., Ltd.
Indirect investee company accounted for
under the equity method
(1) 1,563 30,307 9 30,347
Hyield Venture Capital Co., Ltd. Fitipower Integrated Technology Inc. Indirect investee company accounted for
under the equity method
(1) 12,120 143,736 10 147,980
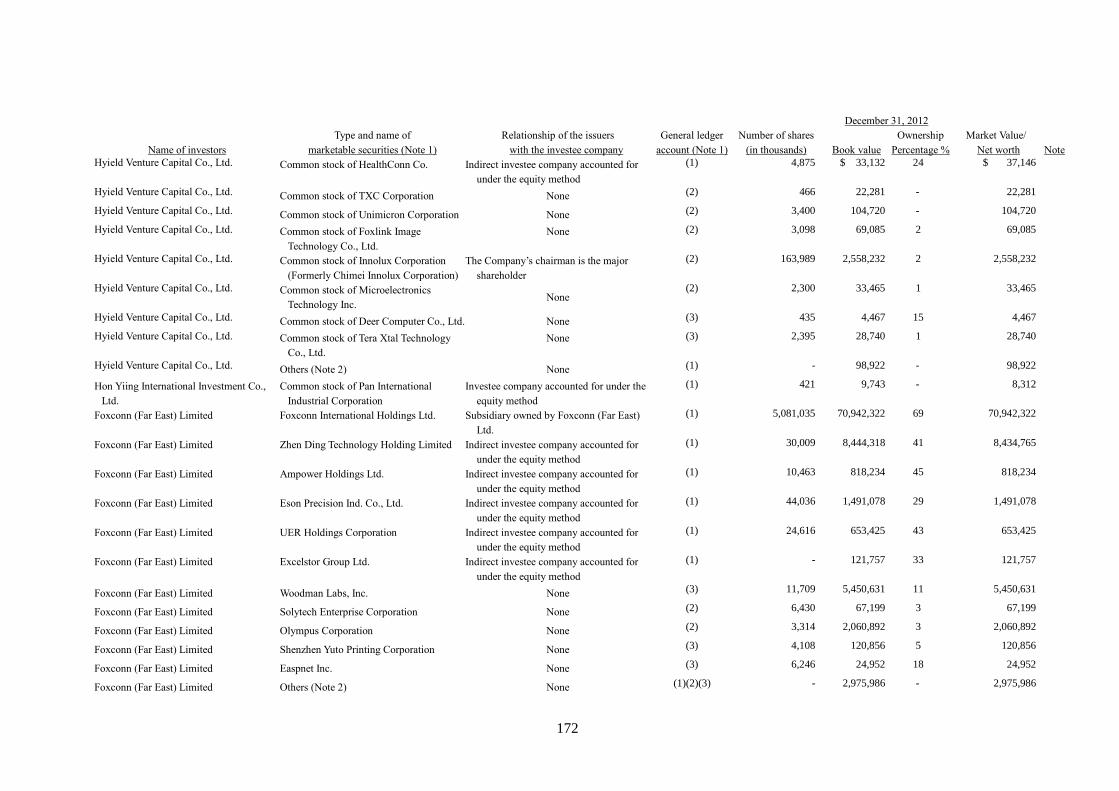
172
December 31, 2012
Type and name of Relationship of the issuers General ledger Number of shares Ownership Market Value/
Name of investors marketable securities (Note 1) with the investee company account (Note 1) (in thousands) Book value Percentage % Net worth Note
Hyield Venture Capital Co., Ltd. Common stock of HealthConn Co. Indirect investee company accounted for
under the equity method
(1) 4,875 $ 33,132 24 $ 37,146
Hyield Venture Capital Co., Ltd. Common stock of TXC Corporation None (2) 466 22,281 - 22,281
Hyield Venture Capital Co., Ltd. Common stock of Unimicron Corporation None (2) 3,400 104,720 - 104,720
Hyield Venture Capital Co., Ltd. Common stock of Foxlink Image
Technology Co., Ltd.
None (2) 3,098 69,085 2 69,085
Hyield Venture Capital Co., Ltd. Common stock of Innolux Corporation
(Formerly Chimei Innolux Corporation)
The Company’s chairman is the major
shareholder
(2) 163,989 2,558,232 2 2,558,232
Hyield Venture Capital Co., Ltd. Common stock of Microelectronics
Technology Inc. None
(2) 2,300 33,465 1 33,465
Hyield Venture Capital Co., Ltd. Common stock of Deer Computer Co., Ltd. None (3) 435 4,467 15 4,467
Hyield Venture Capital Co., Ltd. Common stock of Tera Xtal Technology
Co., Ltd.
None (3) 2,395 28,740 1 28,740
Hyield Venture Capital Co., Ltd. Others (Note 2) None (1) - 98,922 - 98,922
Hon Yiing International Investment Co.,
Ltd.
Common stock of Pan International
Industrial Corporation
Investee company accounted for under the
equity method
(1) 421 9,743 - 8,312
Foxconn (Far East) Limited Foxconn International Holdings Ltd. Subsidiary owned by Foxconn (Far East)
Ltd.
(1) 5,081,035 70,942,322 69 70,942,322
Foxconn (Far East) Limited Zhen Ding Technology Holding Limited Indirect investee company accounted for
under the equity method
(1) 30,009 8,444,318 41 8,434,765
Foxconn (Far East) Limited Ampower Holdings Ltd. Indirect investee company accounted for
under the equity method
(1) 10,463 818,234 45 818,234
Foxconn (Far East) Limited Eson Precision Ind. Co., Ltd. Indirect investee company accounted for
under the equity method
(1) 44,036 1,491,078 29 1,491,078
Foxconn (Far East) Limited UER Holdings Corporation Indirect investee company accounted for
under the equity method
(1) 24,616 653,425 43 653,425
Foxconn (Far East) Limited Excelstor Group Ltd. Indirect investee company accounted for
under the equity method
(1) - 121,757 33 121,757
Foxconn (Far East) Limited Woodman Labs, Inc. None (3) 11,709 5,450,631 11 5,450,631
Foxconn (Far East) Limited Solytech Enterprise Corporation None (2) 6,430 67,199 3 67,199
Foxconn (Far East) Limited Olympus Corporation None (2) 3,314 2,060,892 3 2,060,892
Foxconn (Far East) Limited Shenzhen Yuto Printing Corporation None (3) 4,108 120,856 5 120,856
Foxconn (Far East) Limited Easpnet Inc. None (3) 6,246 24,952 18 24,952
Foxconn (Far East) Limited Others (Note 2) None (1)(2)(3) - 2,975,986 - 2,975,986
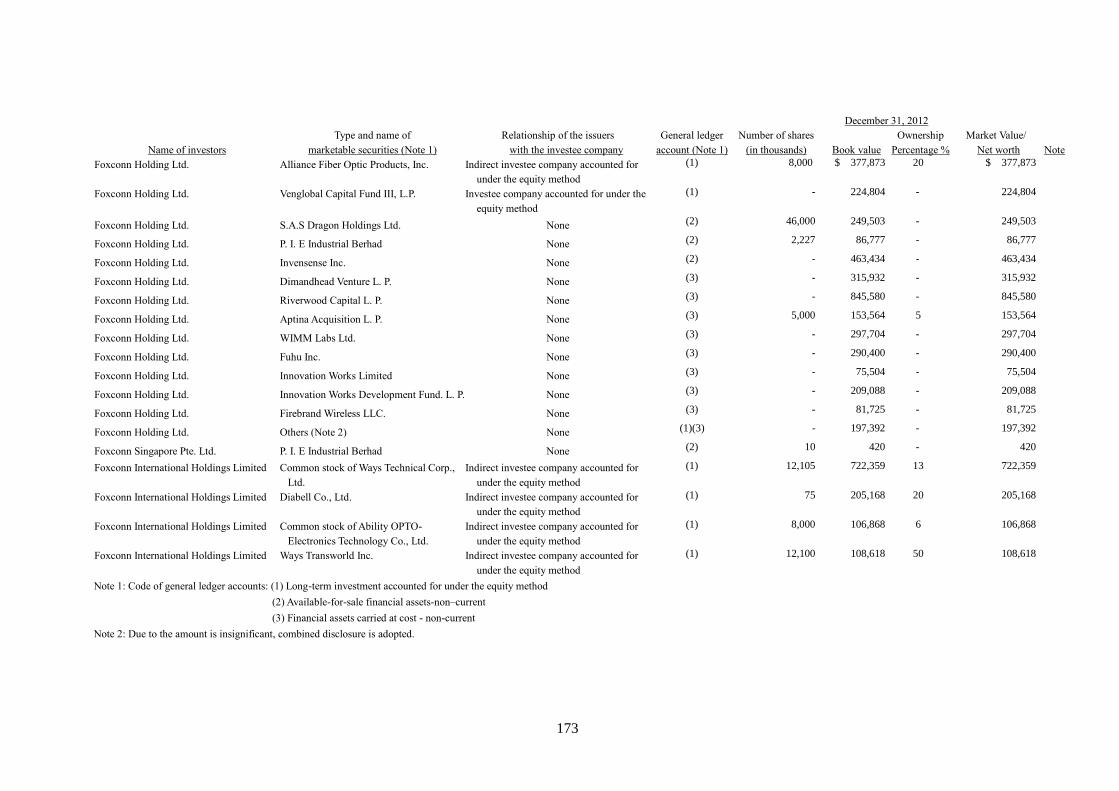
173
December 31, 2012
Type and name of Relationship of the issuers General ledger Number of shares Ownership Market Value/
Name of investors marketable securities (Note 1) with the investee company account (Note 1) (in thousands) Book value Percentage % Net worth Note
Foxconn Holding Ltd. Alliance Fiber Optic Products, Inc. Indirect investee company accounted for
under the equity method
(1) 8,000 $ 377,873 20 $ 377,873
Foxconn Holding Ltd. Venglobal Capital Fund III, L.P. Investee company accounted for under the
equity method
(1) - 224,804 - 224,804
Foxconn Holding Ltd. S.A.S Dragon Holdings Ltd. None (2) 46,000 249,503 - 249,503
Foxconn Holding Ltd. P. I. E Industrial Berhad None (2) 2,227 86,777 - 86,777
Foxconn Holding Ltd. Invensense Inc. None (2) - 463,434 - 463,434
Foxconn Holding Ltd. Dimandhead Venture L. P. None (3) - 315,932 - 315,932
Foxconn Holding Ltd. Riverwood Capital L. P. None (3) - 845,580 - 845,580
Foxconn Holding Ltd. Aptina Acquisition L. P. None (3) 5,000 153,564 5 153,564
Foxconn Holding Ltd. WIMM Labs Ltd. None (3) - 297,704 - 297,704
Foxconn Holding Ltd. Fuhu Inc. None (3) - 290,400 - 290,400
Foxconn Holding Ltd. Innovation Works Limited None (3) - 75,504 - 75,504
Foxconn Holding Ltd. Innovation Works Development Fund. L. P. None (3) - 209,088 - 209,088
Foxconn Holding Ltd. Firebrand Wireless LLC. None (3) - 81,725 - 81,725
Foxconn Holding Ltd. Others (Note 2) None (1)(3) - 197,392 - 197,392
Foxconn Singapore Pte. Ltd. P. I. E Industrial Berhad None (2) 10 420 - 420
Foxconn International Holdings Limited
Common stock of Ways Technical Corp.,
Ltd.
Indirect investee company accounted for
under the equity method
(1) 12,105 722,359 13 722,359
Foxconn International Holdings Limited
Diabell Co., Ltd. Indirect investee company accounted for
under the equity method
(1) 75 205,168 20 205,168
Foxconn International Holdings Limited
Common stock of Ability OPTO-
Electronics Technology Co., Ltd.
Indirect investee company accounted for
under the equity method
(1) 8,000 106,868 6 106,868
Foxconn International Holdings Limited
Ways Transworld Inc. Indirect investee company accounted for
under the equity method
(1) 12,100 108,618 50 108,618
Note 1: Code of general ledger accounts: (1) Long-term investment accounted for under the equity method
(2) Available-for-sale financial assets-non–current
(3) Financial assets carried at cost - non-current
Note 2: Due to the amount is insignificant, combined disclosure is adopted.
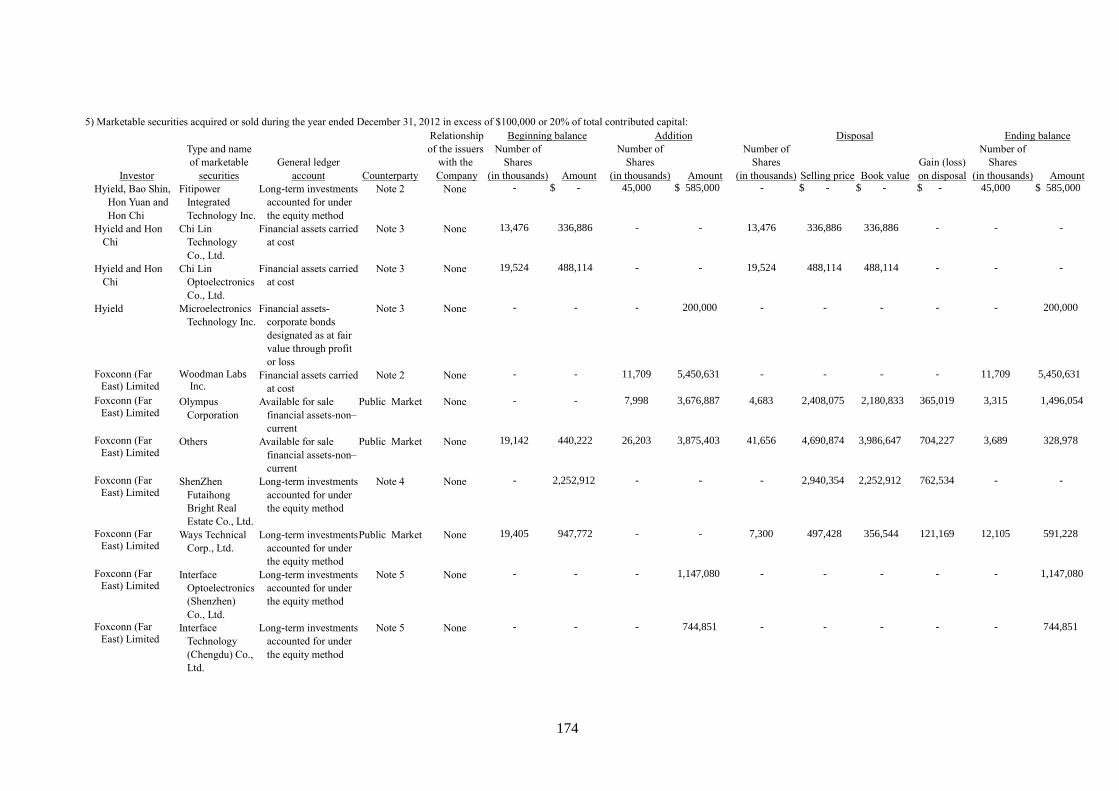
174
5) Marketable securities acquired or sold during the year ended December 31, 2012 in excess of $100,000 or 20% of total contributed capital:
Type and name
of marketable
securities
Relationship
of the issuers
with the
Company
Beginning balance Addition Disposal Ending balance
Investor
General ledger
account Counterparty
Number of
Shares
(in thousands) Amount
Number of
Shares
(in thousands) Amount
Number of
Shares
(in thousands) Selling price Book value
Gain (loss)
on disposal
Number of
Shares
(in thousands) Amount
Hyield, Bao Shin,
Hon Yuan and
Hon Chi
Fitipower
Integrated
Technology Inc.
Long-term investments
accounted for under
the equity method
Note 2 None - $ - 45,000 $ 585,000 - $ - $ - $ - 45,000 $ 585,000
Hyield and Hon
Chi
Chi Lin
Technology
Co., Ltd.
Financial assets carried
at cost
Note 3 None 13,476 336,886 - - 13,476 336,886 336,886 - - -
Hyield and Hon
Chi
Chi Lin
Optoelectronics
Co., Ltd.
Financial assets carried
at cost
Note 3 None 19,524 488,114 - - 19,524 488,114 488,114 - - -
Hyield Microelectronics
Technology Inc.
Financial assets-
corporate bonds
designated as at fair
value through profit
or loss
Note 3 None - - - 200,000 - - - - - 200,000
Foxconn (Far East) Limited
Woodman Labs Inc.
Financial assets carried
at cost
Note 2 None - - 11,709 5,450,631 - - - - 11,709 5,450,631
Foxconn (Far
East) Limited Olympus
Corporation
Available for sale
financial assets-non–
current
Public Market None - - 7,998 3,676,887 4,683 2,408,075 2,180,833 365,019 3,315 1,496,054
Foxconn (Far
East) Limited Others Available for sale
financial assets-non–
current
Public Market None 19,142 440,222 26,203 3,875,403 41,656 4,690,874 3,986,647 704,227 3,689 328,978
Foxconn (Far
East) Limited ShenZhen
Futaihong
Bright Real
Estate Co., Ltd.
Long-term investments
accounted for under
the equity method
Note 4 None - 2,252,912 - - - 2,940,354 2,252,912 762,534 - -
Foxconn (Far East) Limited
Ways Technical
Corp., Ltd.
Long-term investments
accounted for under
the equity method
Public Market None 19,405 947,772 - - 7,300 497,428 356,544 121,169 12,105 591,228
Foxconn (Far East) Limited
Interface
Optoelectronics
(Shenzhen)
Co., Ltd.
Long-term investments
accounted for under
the equity method
Note 5 None - - - 1,147,080 - - - - - 1,147,080
Foxconn (Far
East) Limited Interface
Technology
(Chengdu) Co.,
Ltd.
Long-term investments
accounted for under
the equity method
Note 5 None - - - 744,851 - - - - - 744,851
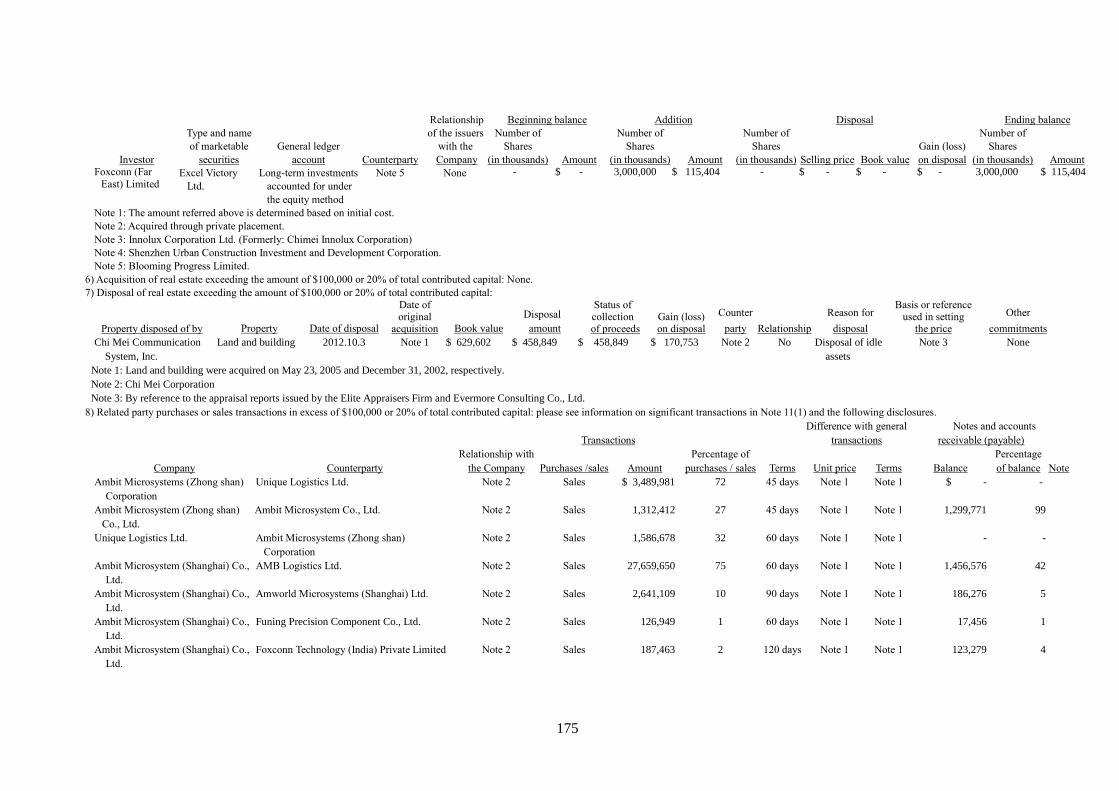
175
Type and name
of marketable
securities
Relationship
of the issuers
with the
Company
Beginning balance Addition Disposal Ending balance
Investor
General ledger
account Counterparty
Number of
Shares
(in thousands) Amount
Number of
Shares
(in thousands) Amount
Number of
Shares
(in thousands) Selling price Book value
Gain (loss)
on disposal
Number of
Shares
(in thousands) Amount Foxconn (Far
East) Limited Excel Victory
Ltd.
Long-term investments
accounted for under
the equity method
Note 5 None - $ - 3,000,000 $ 115,404 - $ - $ - $ - 3,000,000 $ 115,404
Note 1: The amount referred above is determined based on initial cost.
Note 2: Acquired through private placement.
Note 3: Innolux Corporation Ltd. (Formerly: Chimei Innolux Corporation)
Note 4: Shenzhen Urban Construction Investment and Development Corporation.
Note 5: Blooming Progress Limited.
6) Acquisition of real estate exceeding the amount of $100,000 or 20% of total contributed capital: None.
7) Disposal of real estate exceeding the amount of $100,000 or 20% of total contributed capital:
Property disposed of by Property Date of disposal
Date of original
acquisition Book value
Disposal
amount
Status of collection of proceeds
Gain (loss) on disposal
Counter
party Relationship
Reason for
disposal
Basis or reference used in setting
the price
Other
commitments
Chi Mei Communication
System, Inc.
Land and building 2012.10.3 Note 1 $ 629,602 $ 458,849 $ 458,849 $ 170,753 Note 2 No Disposal of idle
assets
Note 3 None
Note 1: Land and building were acquired on May 23, 2005 and December 31, 2002, respectively.
Note 2: Chi Mei Corporation
Note 3: By reference to the appraisal reports issued by the Elite Appraisers Firm and Evermore Consulting Co., Ltd.
8) Related party purchases or sales transactions in excess of $100,000 or 20% of total contributed capital: please see information on significant transactions in Note 11(1) and the following disclosures.
Difference with general Notes and accounts
Transactions transactions receivable (payable)
Relationship with Percentage of Percentage
Company Counterparty the Company Purchases /sales Amount purchases / sales Terms Unit price Terms Balance of balance Note
Ambit Microsystems (Zhong shan)
Corporation
Unique Logistics Ltd. Note 2 Sales $ 3,489,981 72 45 days Note 1 Note 1 $ - -
Ambit Microsystem (Zhong shan)
Co., Ltd.
Ambit Microsystem Co., Ltd. Note 2 Sales 1,312,412 27 45 days Note 1 Note 1 1,299,771 99
Unique Logistics Ltd. Ambit Microsystems (Zhong shan)
Corporation
Note 2 Sales 1,586,678 32 60 days Note 1 Note 1 - -
Ambit Microsystem (Shanghai) Co.,
Ltd.
AMB Logistics Ltd. Note 2 Sales 27,659,650 75 60 days Note 1 Note 1 1,456,576 42
Ambit Microsystem (Shanghai) Co.,
Ltd.
Amworld Microsystems (Shanghai) Ltd. Note 2 Sales 2,641,109 10 90 days Note 1 Note 1 186,276 5
Ambit Microsystem (Shanghai) Co.,
Ltd.
Funing Precision Component Co., Ltd. Note 2 Sales 126,949 1 60 days Note 1 Note 1 17,456 1
Ambit Microsystem (Shanghai) Co.,
Ltd.
Foxconn Technology (India) Private Limited Note 2 Sales 187,463 2 120 days Note 1 Note 1 123,279 4
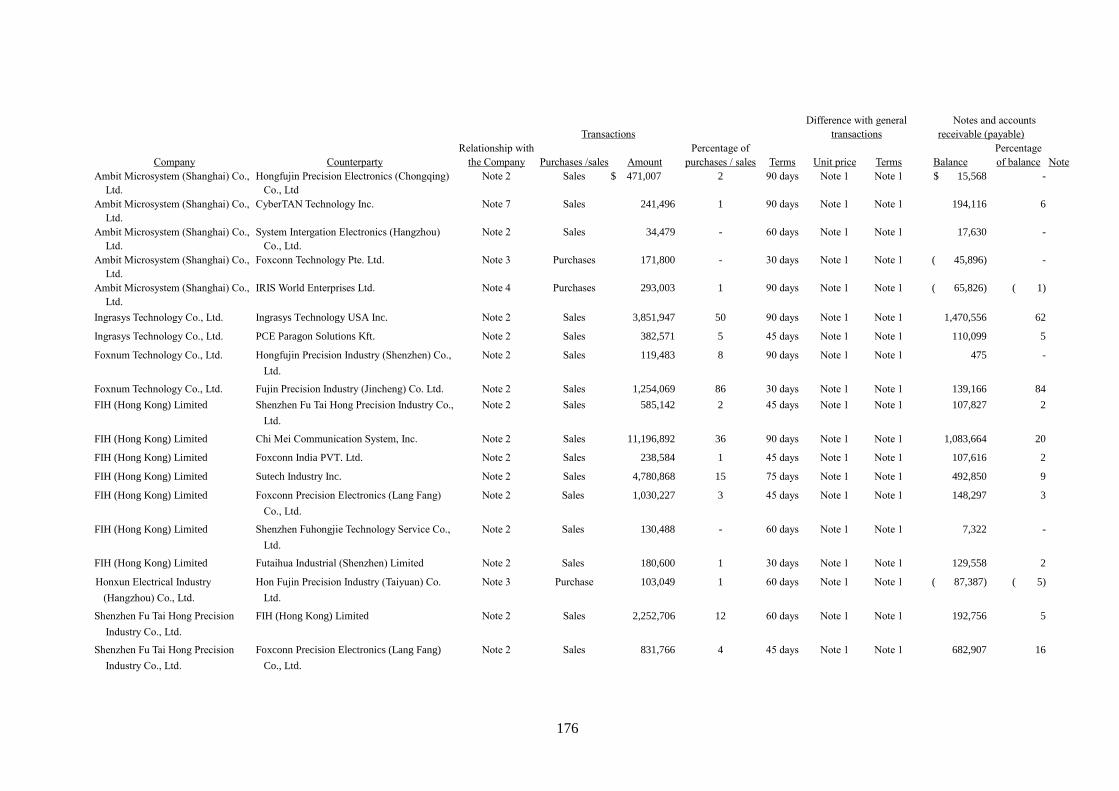
176
Difference with general Notes and accounts
Transactions transactions receivable (payable)
Relationship with Percentage of Percentage
Company Counterparty the Company Purchases /sales Amount purchases / sales Terms Unit price Terms Balance of balance Note
Ambit Microsystem (Shanghai) Co.,
Ltd.
Hongfujin Precision Electronics (Chongqing)
Co., Ltd
Note 2 Sales $ 471,007 2 90 days Note 1 Note 1 $ 15,568 -
Ambit Microsystem (Shanghai) Co.,
Ltd.
CyberTAN Technology Inc. Note 7 Sales 241,496 1 90 days Note 1 Note 1 194,116 6
Ambit Microsystem (Shanghai) Co.,
Ltd.
System Intergation Electronics (Hangzhou)
Co., Ltd.
Note 2 Sales 34,479 - 60 days Note 1 Note 1 17,630 -
Ambit Microsystem (Shanghai) Co.,
Ltd.
Foxconn Technology Pte. Ltd. Note 3 Purchases 171,800 - 30 days Note 1 Note 1 ( 45,896) -
Ambit Microsystem (Shanghai) Co.,
Ltd.
IRIS World Enterprises Ltd. Note 4 Purchases 293,003 1 90 days Note 1 Note 1 ( 65,826) ( 1)
Ingrasys Technology Co., Ltd. Ingrasys Technology USA Inc. Note 2 Sales 3,851,947 50 90 days Note 1 Note 1 1,470,556 62
Ingrasys Technology Co., Ltd. PCE Paragon Solutions Kft. Note 2 Sales 382,571 5 45 days Note 1 Note 1 110,099 5
Foxnum Technology Co., Ltd. Hongfujin Precision Industry (Shenzhen) Co.,
Ltd.
Note 2 Sales 119,483 8 90 days Note 1 Note 1 475 -
Foxnum Technology Co., Ltd. Fujin Precision Industry (Jincheng) Co. Ltd. Note 2 Sales 1,254,069 86 30 days Note 1 Note 1 139,166 84
FIH (Hong Kong) Limited Shenzhen Fu Tai Hong Precision Industry Co.,
Ltd.
Note 2 Sales 585,142 2 45 days Note 1 Note 1 107,827 2
FIH (Hong Kong) Limited Chi Mei Communication System, Inc. Note 2 Sales 11,196,892 36 90 days Note 1 Note 1 1,083,664 20
FIH (Hong Kong) Limited Foxconn India PVT. Ltd. Note 2 Sales 238,584 1 45 days Note 1 Note 1 107,616 2
FIH (Hong Kong) Limited Sutech Industry Inc. Note 2 Sales 4,780,868 15 75 days Note 1 Note 1 492,850 9
FIH (Hong Kong) Limited Foxconn Precision Electronics (Lang Fang)
Co., Ltd.
Note 2 Sales 1,030,227 3 45 days Note 1 Note 1 148,297 3
FIH (Hong Kong) Limited Shenzhen Fuhongjie Technology Service Co.,
Ltd.
Note 2 Sales 130,488 - 60 days Note 1 Note 1 7,322 -
FIH (Hong Kong) Limited Futaihua Industrial (Shenzhen) Limited Note 2 Sales 180,600 1 30 days Note 1 Note 1 129,558 2
Honxun Electrical Industry
(Hangzhou) Co., Ltd.
Hon Fujin Precision Industry (Taiyuan) Co.
Ltd.
Note 3 Purchase 103,049 1 60 days Note 1 Note 1 ( 87,387) ( 5)
Shenzhen Fu Tai Hong Precision
Industry Co., Ltd.
FIH (Hong Kong) Limited Note 2 Sales 2,252,706 12 60 days Note 1 Note 1 192,756 5
Shenzhen Fu Tai Hong Precision
Industry Co., Ltd.
Foxconn Precision Electronics (Lang Fang)
Co., Ltd.
Note 2 Sales 831,766 4 45 days Note 1 Note 1 682,907 16
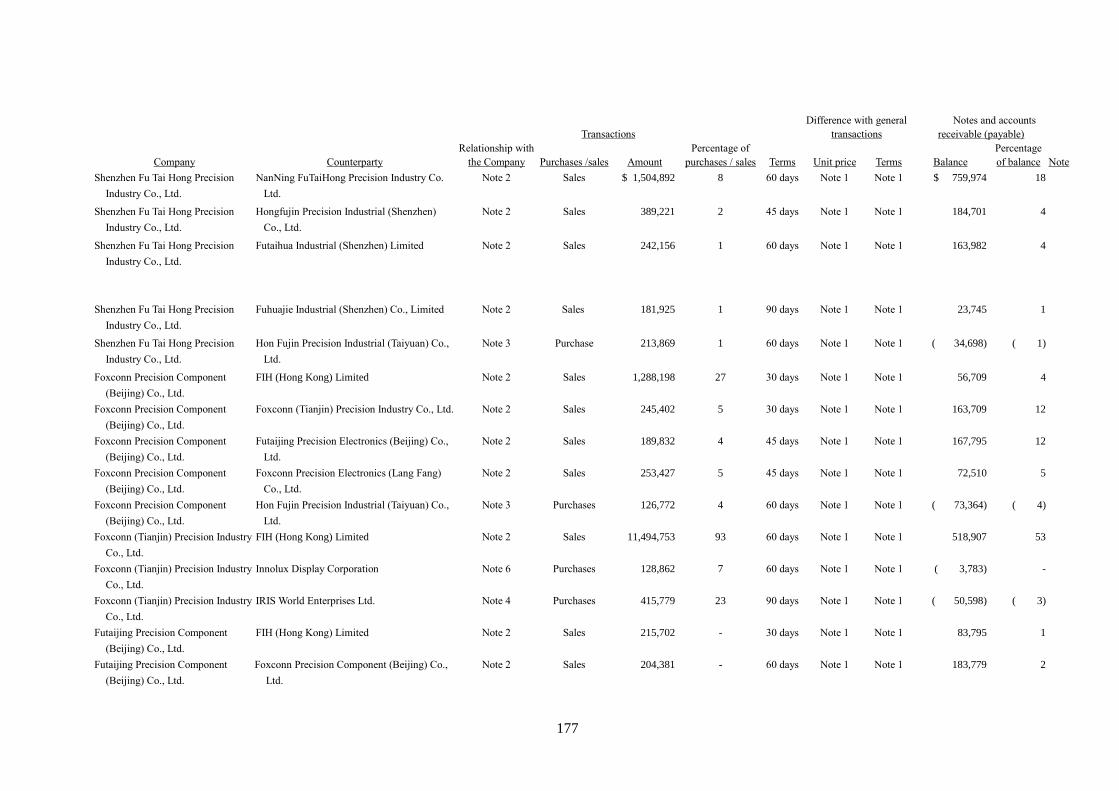
177
Difference with general Notes and accounts
Transactions transactions receivable (payable)
Relationship with Percentage of Percentage
Company Counterparty the Company Purchases /sales Amount purchases / sales Terms Unit price Terms Balance of balance Note
Shenzhen Fu Tai Hong Precision
Industry Co., Ltd.
NanNing FuTaiHong Precision Industry Co.
Ltd.
Note 2 Sales $ 1,504,892 8 60 days Note 1 Note 1 $ 759,974 18
Shenzhen Fu Tai Hong Precision
Industry Co., Ltd.
Hongfujin Precision Industrial (Shenzhen)
Co., Ltd.
Note 2 Sales 389,221 2 45 days Note 1 Note 1 184,701 4
Shenzhen Fu Tai Hong Precision
Industry Co., Ltd.
Futaihua Industrial (Shenzhen) Limited Note 2 Sales 242,156 1 60 days Note 1 Note 1 163,982 4
Shenzhen Fu Tai Hong Precision
Industry Co., Ltd.
Fuhuajie Industrial (Shenzhen) Co., Limited Note 2 Sales 181,925 1 90 days Note 1 Note 1 23,745 1
Shenzhen Fu Tai Hong Precision
Industry Co., Ltd.
Hon Fujin Precision Industrial (Taiyuan) Co.,
Ltd.
Note 3 Purchase 213,869 1 60 days Note 1 Note 1 ( 34,698) ( 1)
Foxconn Precision Component
(Beijing) Co., Ltd.
FIH (Hong Kong) Limited Note 2 Sales 1,288,198 27 30 days Note 1 Note 1 56,709 4
Foxconn Precision Component
(Beijing) Co., Ltd.
Foxconn (Tianjin) Precision Industry Co., Ltd. Note 2 Sales 245,402 5 30 days Note 1 Note 1 163,709 12
Foxconn Precision Component
(Beijing) Co., Ltd.
Futaijing Precision Electronics (Beijing) Co.,
Ltd.
Note 2 Sales 189,832 4 45 days Note 1 Note 1 167,795 12
Foxconn Precision Component
(Beijing) Co., Ltd.
Foxconn Precision Electronics (Lang Fang)
Co., Ltd.
Note 2 Sales 253,427 5 45 days Note 1 Note 1 72,510 5
Foxconn Precision Component
(Beijing) Co., Ltd.
Hon Fujin Precision Industrial (Taiyuan) Co.,
Ltd.
Note 3 Purchases 126,772 4 60 days Note 1 Note 1 ( 73,364) ( 4)
Foxconn (Tianjin) Precision Industry
Co., Ltd.
FIH (Hong Kong) Limited Note 2 Sales 11,494,753 93 60 days Note 1 Note 1 518,907 53
Foxconn (Tianjin) Precision Industry
Co., Ltd.
Innolux Display Corporation Note 6 Purchases 128,862 7 60 days Note 1 Note 1 ( 3,783) -
Foxconn (Tianjin) Precision Industry
Co., Ltd.
IRIS World Enterprises Ltd. Note 4 Purchases 415,779 23 90 days Note 1 Note 1 ( 50,598) ( 3)
Futaijing Precision Component
(Beijing) Co., Ltd.
FIH (Hong Kong) Limited Note 2 Sales 215,702 - 30 days Note 1 Note 1 83,795 1
Futaijing Precision Component
(Beijing) Co., Ltd.
Foxconn Precision Component (Beijing) Co.,
Ltd.
Note 2 Sales 204,381 - 60 days Note 1 Note 1 183,779 2
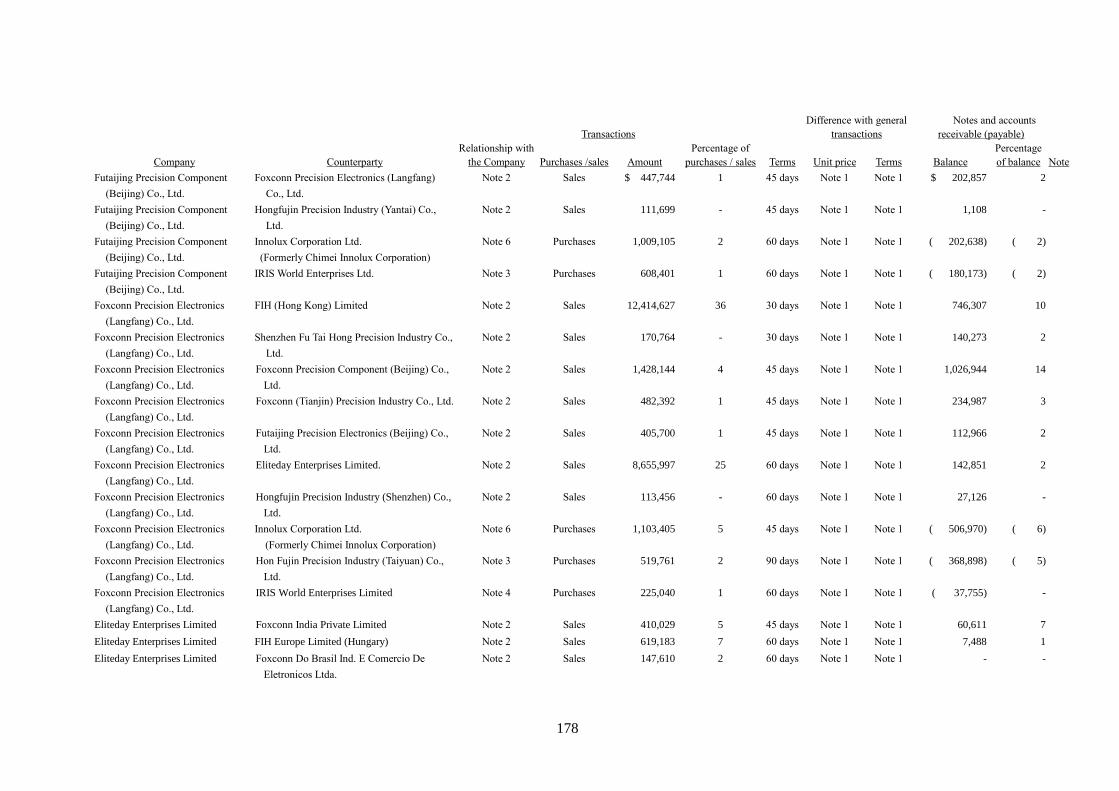
178
Difference with general Notes and accounts
Transactions transactions receivable (payable)
Relationship with Percentage of Percentage
Company Counterparty the Company Purchases /sales Amount purchases / sales Terms Unit price Terms Balance of balance Note
Futaijing Precision Component
(Beijing) Co., Ltd.
Foxconn Precision Electronics (Langfang)
Co., Ltd.
Note 2 Sales $ 447,744 1 45 days Note 1 Note 1 $ 202,857 2
Futaijing Precision Component
(Beijing) Co., Ltd.
Hongfujin Precision Industry (Yantai) Co.,
Ltd.
Note 2 Sales 111,699 - 45 days Note 1 Note 1 1,108 -
Futaijing Precision Component
(Beijing) Co., Ltd.
Innolux Corporation Ltd.
(Formerly Chimei Innolux Corporation)
Note 6 Purchases 1,009,105 2 60 days Note 1 Note 1 ( 202,638) ( 2)
Futaijing Precision Component
(Beijing) Co., Ltd.
IRIS World Enterprises Ltd. Note 3 Purchases 608,401 1 60 days Note 1 Note 1 ( 180,173) ( 2)
Foxconn Precision Electronics
(Langfang) Co., Ltd.
FIH (Hong Kong) Limited Note 2 Sales 12,414,627 36 30 days Note 1 Note 1 746,307 10
Foxconn Precision Electronics
(Langfang) Co., Ltd.
Shenzhen Fu Tai Hong Precision Industry Co.,
Ltd.
Note 2 Sales 170,764 - 30 days Note 1 Note 1 140,273 2
Foxconn Precision Electronics
(Langfang) Co., Ltd.
Foxconn Precision Component (Beijing) Co.,
Ltd.
Note 2 Sales 1,428,144 4 45 days Note 1 Note 1 1,026,944 14
Foxconn Precision Electronics
(Langfang) Co., Ltd.
Foxconn (Tianjin) Precision Industry Co., Ltd. Note 2 Sales 482,392 1 45 days Note 1 Note 1 234,987 3
Foxconn Precision Electronics
(Langfang) Co., Ltd.
Futaijing Precision Electronics (Beijing) Co.,
Ltd.
Note 2 Sales 405,700 1 45 days Note 1 Note 1 112,966 2
Foxconn Precision Electronics
(Langfang) Co., Ltd.
Eliteday Enterprises Limited. Note 2 Sales 8,655,997 25 60 days Note 1 Note 1 142,851 2
Foxconn Precision Electronics
(Langfang) Co., Ltd.
Hongfujin Precision Industry (Shenzhen) Co.,
Ltd.
Note 2 Sales 113,456 - 60 days Note 1 Note 1 27,126 -
Foxconn Precision Electronics
(Langfang) Co., Ltd.
Innolux Corporation Ltd.
(Formerly Chimei Innolux Corporation)
Note 6 Purchases 1,103,405 5 45 days Note 1 Note 1 ( 506,970) ( 6)
Foxconn Precision Electronics
(Langfang) Co., Ltd.
Hon Fujin Precision Industry (Taiyuan) Co.,
Ltd.
Note 3 Purchases 519,761 2 90 days Note 1 Note 1 ( 368,898) ( 5)
Foxconn Precision Electronics
(Langfang) Co., Ltd.
IRIS World Enterprises Limited Note 4 Purchases 225,040 1 60 days Note 1 Note 1 ( 37,755) -
Eliteday Enterprises Limited Foxconn India Private Limited Note 2 Sales 410,029 5 45 days Note 1 Note 1 60,611 7
Eliteday Enterprises Limited FIH Europe Limited (Hungary) Note 2 Sales 619,183 7 60 days Note 1 Note 1 7,488 1
Eliteday Enterprises Limited Foxconn Do Brasil Ind. E Comercio De
Eletronicos Ltda.
Note 2 Sales 147,610 2 60 days Note 1 Note 1 - -
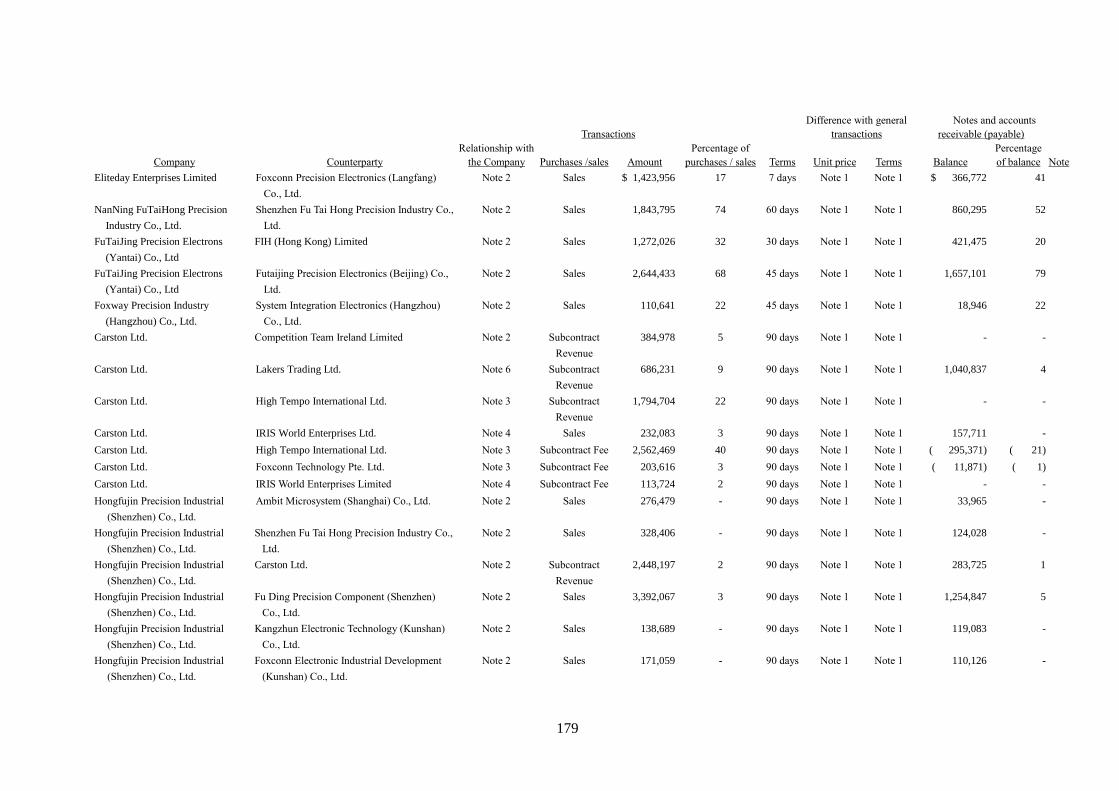
179
Difference with general Notes and accounts
Transactions transactions receivable (payable)
Relationship with Percentage of Percentage
Company Counterparty the Company Purchases /sales Amount purchases / sales Terms Unit price Terms Balance of balance Note
Eliteday Enterprises Limited Foxconn Precision Electronics (Langfang)
Co., Ltd.
Note 2 Sales $ 1,423,956 17 7 days Note 1 Note 1 $ 366,772 41
NanNing FuTaiHong Precision
Industry Co., Ltd.
Shenzhen Fu Tai Hong Precision Industry Co.,
Ltd.
Note 2 Sales 1,843,795 74 60 days Note 1 Note 1 860,295 52
FuTaiJing Precision Electrons
(Yantai) Co., Ltd
FIH (Hong Kong) Limited Note 2 Sales 1,272,026 32 30 days Note 1 Note 1 421,475 20
FuTaiJing Precision Electrons
(Yantai) Co., Ltd
Futaijing Precision Electronics (Beijing) Co.,
Ltd.
Note 2 Sales 2,644,433 68 45 days Note 1 Note 1 1,657,101 79
Foxway Precision Industry
(Hangzhou) Co., Ltd.
System Integration Electronics (Hangzhou)
Co., Ltd.
Note 2 Sales 110,641 22 45 days Note 1 Note 1 18,946 22
Carston Ltd. Competition Team Ireland Limited Note 2 Subcontract
Revenue
384,978 5 90 days Note 1 Note 1 - -
Carston Ltd. Lakers Trading Ltd. Note 6 Subcontract
Revenue
686,231 9 90 days Note 1 Note 1 1,040,837 4
Carston Ltd. High Tempo International Ltd. Note 3 Subcontract
Revenue
1,794,704 22 90 days Note 1 Note 1 - -
Carston Ltd. IRIS World Enterprises Ltd. Note 4 Sales 232,083 3 90 days Note 1 Note 1 157,711 -
Carston Ltd. High Tempo International Ltd. Note 3 Subcontract Fee 2,562,469 40 90 days Note 1 Note 1 ( 295,371) ( 21)
Carston Ltd. Foxconn Technology Pte. Ltd. Note 3 Subcontract Fee 203,616 3 90 days Note 1 Note 1 ( 11,871) ( 1)
Carston Ltd. IRIS World Enterprises Limited Note 4 Subcontract Fee 113,724 2 90 days Note 1 Note 1 - -
Hongfujin Precision Industrial
(Shenzhen) Co., Ltd.
Ambit Microsystem (Shanghai) Co., Ltd. Note 2 Sales 276,479 - 90 days Note 1 Note 1 33,965 -
Hongfujin Precision Industrial
(Shenzhen) Co., Ltd.
Shenzhen Fu Tai Hong Precision Industry Co.,
Ltd.
Note 2 Sales 328,406 - 90 days Note 1 Note 1 124,028 -
Hongfujin Precision Industrial
(Shenzhen) Co., Ltd.
Carston Ltd. Note 2 Subcontract
Revenue
2,448,197 2 90 days Note 1 Note 1 283,725 1
Hongfujin Precision Industrial
(Shenzhen) Co., Ltd.
Fu Ding Precision Component (Shenzhen)
Co., Ltd.
Note 2 Sales 3,392,067 3 90 days Note 1 Note 1 1,254,847 5
Hongfujin Precision Industrial
(Shenzhen) Co., Ltd.
Kangzhun Electronic Technology (Kunshan)
Co., Ltd.
Note 2 Sales 138,689 - 90 days Note 1 Note 1 119,083 -
Hongfujin Precision Industrial
(Shenzhen) Co., Ltd.
Foxconn Electronic Industrial Development
(Kunshan) Co., Ltd.
Note 2 Sales 171,059 - 90 days Note 1 Note 1 110,126 -
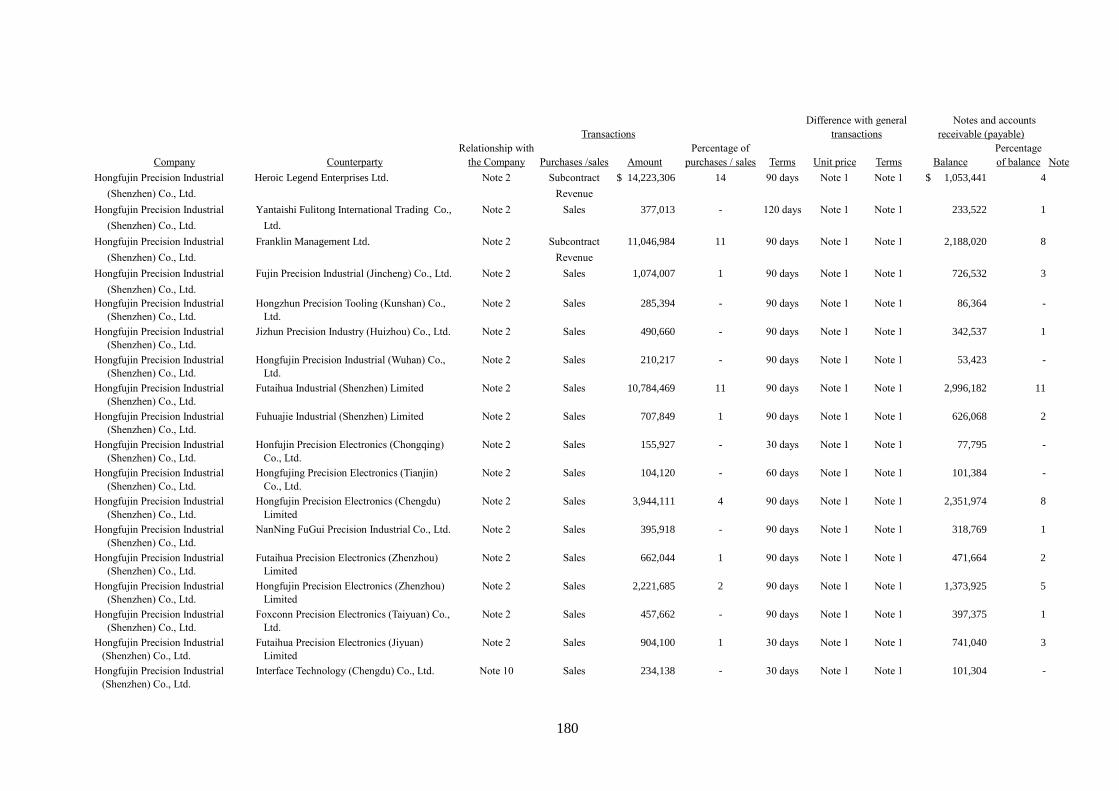
180
Difference with general Notes and accounts
Transactions transactions receivable (payable)
Relationship with Percentage of Percentage
Company Counterparty the Company Purchases /sales Amount purchases / sales Terms Unit price Terms Balance of balance Note
Hongfujin Precision Industrial
(Shenzhen) Co., Ltd.
Heroic Legend Enterprises Ltd. Note 2 Subcontract
Revenue
$ 14,223,306 14 90 days Note 1 Note 1 $ 1,053,441 4
Hongfujin Precision Industrial
(Shenzhen) Co., Ltd.
Yantaishi Fulitong International Trading Co.,
Ltd.
Note 2 Sales 377,013 - 120 days Note 1 Note 1 233,522 1
Hongfujin Precision Industrial
(Shenzhen) Co., Ltd.
Franklin Management Ltd. Note 2 Subcontract
Revenue
11,046,984 11 90 days Note 1 Note 1 2,188,020 8
Hongfujin Precision Industrial
(Shenzhen) Co., Ltd.
Fujin Precision Industrial (Jincheng) Co., Ltd. Note 2 Sales 1,074,007 1 90 days Note 1 Note 1 726,532 3
Hongfujin Precision Industrial
(Shenzhen) Co., Ltd.
Hongzhun Precision Tooling (Kunshan) Co.,
Ltd.
Note 2 Sales 285,394 - 90 days Note 1 Note 1 86,364 -
Hongfujin Precision Industrial
(Shenzhen) Co., Ltd.
Jizhun Precision Industry (Huizhou) Co., Ltd. Note 2 Sales 490,660 - 90 days Note 1 Note 1 342,537 1
Hongfujin Precision Industrial
(Shenzhen) Co., Ltd.
Hongfujin Precision Industrial (Wuhan) Co.,
Ltd.
Note 2 Sales 210,217 - 90 days Note 1 Note 1 53,423 -
Hongfujin Precision Industrial
(Shenzhen) Co., Ltd.
Futaihua Industrial (Shenzhen) Limited Note 2 Sales 10,784,469 11 90 days Note 1 Note 1 2,996,182 11
Hongfujin Precision Industrial
(Shenzhen) Co., Ltd.
Fuhuajie Industrial (Shenzhen) Limited Note 2 Sales 707,849 1 90 days Note 1 Note 1 626,068 2
Hongfujin Precision Industrial
(Shenzhen) Co., Ltd.
Honfujin Precision Electronics (Chongqing)
Co., Ltd.
Note 2 Sales 155,927 - 30 days Note 1 Note 1 77,795 -
Hongfujin Precision Industrial
(Shenzhen) Co., Ltd.
Hongfujing Precision Electronics (Tianjin)
Co., Ltd.
Note 2 Sales 104,120 - 60 days Note 1 Note 1 101,384 -
Hongfujin Precision Industrial
(Shenzhen) Co., Ltd.
Hongfujin Precision Electronics (Chengdu)
Limited
Note 2 Sales 3,944,111 4 90 days Note 1 Note 1 2,351,974 8
Hongfujin Precision Industrial
(Shenzhen) Co., Ltd.
NanNing FuGui Precision Industrial Co., Ltd. Note 2 Sales 395,918 - 90 days Note 1 Note 1 318,769 1
Hongfujin Precision Industrial
(Shenzhen) Co., Ltd.
Futaihua Precision Electronics (Zhenzhou)
Limited
Note 2 Sales 662,044 1 90 days Note 1 Note 1 471,664 2
Hongfujin Precision Industrial
(Shenzhen) Co., Ltd.
Hongfujin Precision Electronics (Zhenzhou)
Limited
Note 2 Sales 2,221,685 2 90 days Note 1 Note 1 1,373,925 5
Hongfujin Precision Industrial
(Shenzhen) Co., Ltd.
Foxconn Precision Electronics (Taiyuan) Co.,
Ltd.
Note 2 Sales 457,662 - 90 days Note 1 Note 1 397,375 1
Hongfujin Precision Industrial
(Shenzhen) Co., Ltd.
Futaihua Precision Electronics (Jiyuan)
Limited
Note 2 Sales 904,100 1 30 days Note 1 Note 1 741,040 3
Hongfujin Precision Industrial
(Shenzhen) Co., Ltd.
Interface Technology (Chengdu) Co., Ltd. Note 10 Sales 234,138 - 30 days Note 1 Note 1 101,304 -
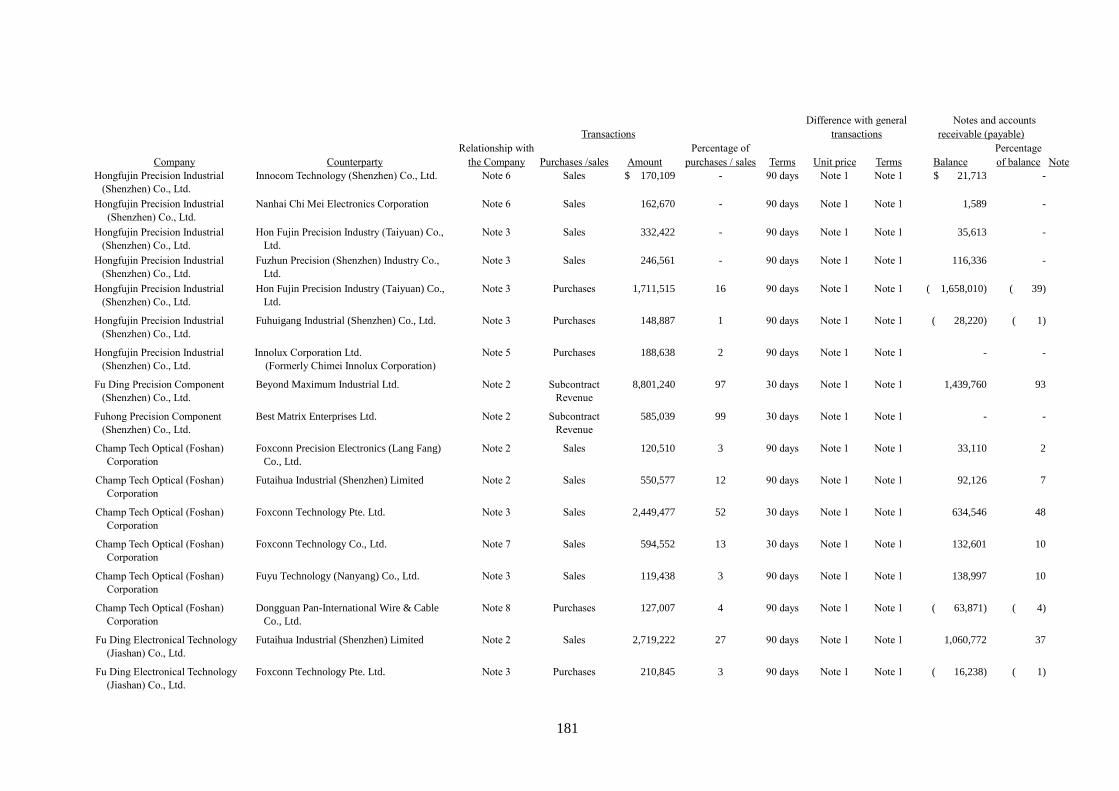
181
Difference with general Notes and accounts
Transactions transactions receivable (payable)
Relationship with Percentage of Percentage
Company Counterparty the Company Purchases /sales Amount purchases / sales Terms Unit price Terms Balance of balance Note
Hongfujin Precision Industrial
(Shenzhen) Co., Ltd.
Innocom Technology (Shenzhen) Co., Ltd. Note 6 Sales $ 170,109 - 90 days Note 1 Note 1 $ 21,713 -
Hongfujin Precision Industrial
(Shenzhen) Co., Ltd.
Nanhai Chi Mei Electronics Corporation Note 6 Sales 162,670 - 90 days Note 1 Note 1 1,589 -
Hongfujin Precision Industrial
(Shenzhen) Co., Ltd.
Hon Fujin Precision Industry (Taiyuan) Co.,
Ltd.
Note 3 Sales 332,422 - 90 days Note 1 Note 1 35,613 -
Hongfujin Precision Industrial
(Shenzhen) Co., Ltd.
Fuzhun Precision (Shenzhen) Industry Co.,
Ltd.
Note 3 Sales 246,561 - 90 days Note 1 Note 1 116,336 -
Hongfujin Precision Industrial
(Shenzhen) Co., Ltd.
Hon Fujin Precision Industry (Taiyuan) Co.,
Ltd.
Note 3 Purchases 1,711,515 16 90 days Note 1 Note 1 ( 1,658,010) ( 39)
Hongfujin Precision Industrial
(Shenzhen) Co., Ltd.
Fuhuigang Industrial (Shenzhen) Co., Ltd. Note 3 Purchases 148,887 1 90 days Note 1 Note 1 ( 28,220) ( 1)
Hongfujin Precision Industrial
(Shenzhen) Co., Ltd.
Innolux Corporation Ltd.
(Formerly Chimei Innolux Corporation)
Note 5 Purchases 188,638 2 90 days Note 1 Note 1 - -
Fu Ding Precision Component
(Shenzhen) Co., Ltd.
Beyond Maximum Industrial Ltd. Note 2 Subcontract
Revenue
8,801,240 97 30 days Note 1 Note 1 1,439,760 93
Fuhong Precision Component
(Shenzhen) Co., Ltd.
Best Matrix Enterprises Ltd. Note 2 Subcontract
Revenue
585,039 99 30 days Note 1 Note 1 - -
Champ Tech Optical (Foshan)
Corporation
Foxconn Precision Electronics (Lang Fang)
Co., Ltd.
Note 2 Sales 120,510 3 90 days Note 1 Note 1 33,110 2
Champ Tech Optical (Foshan)
Corporation
Futaihua Industrial (Shenzhen) Limited Note 2 Sales 550,577 12 90 days Note 1 Note 1 92,126 7
Champ Tech Optical (Foshan)
Corporation
Foxconn Technology Pte. Ltd. Note 3 Sales 2,449,477 52 30 days Note 1 Note 1 634,546 48
Champ Tech Optical (Foshan)
Corporation
Foxconn Technology Co., Ltd. Note 7 Sales 594,552 13 30 days Note 1 Note 1 132,601 10
Champ Tech Optical (Foshan)
Corporation
Fuyu Technology (Nanyang) Co., Ltd. Note 3 Sales 119,438 3 90 days Note 1 Note 1 138,997 10
Champ Tech Optical (Foshan)
Corporation
Dongguan Pan-International Wire & Cable
Co., Ltd.
Note 8 Purchases 127,007 4 90 days Note 1 Note 1 ( 63,871) ( 4)
Fu Ding Electronical Technology
(Jiashan) Co., Ltd.
Futaihua Industrial (Shenzhen) Limited Note 2 Sales 2,719,222 27 90 days Note 1 Note 1 1,060,772 37
Fu Ding Electronical Technology
(Jiashan) Co., Ltd.
Foxconn Technology Pte. Ltd. Note 3 Purchases 210,845 3 90 days Note 1 Note 1 ( 16,238) ( 1)
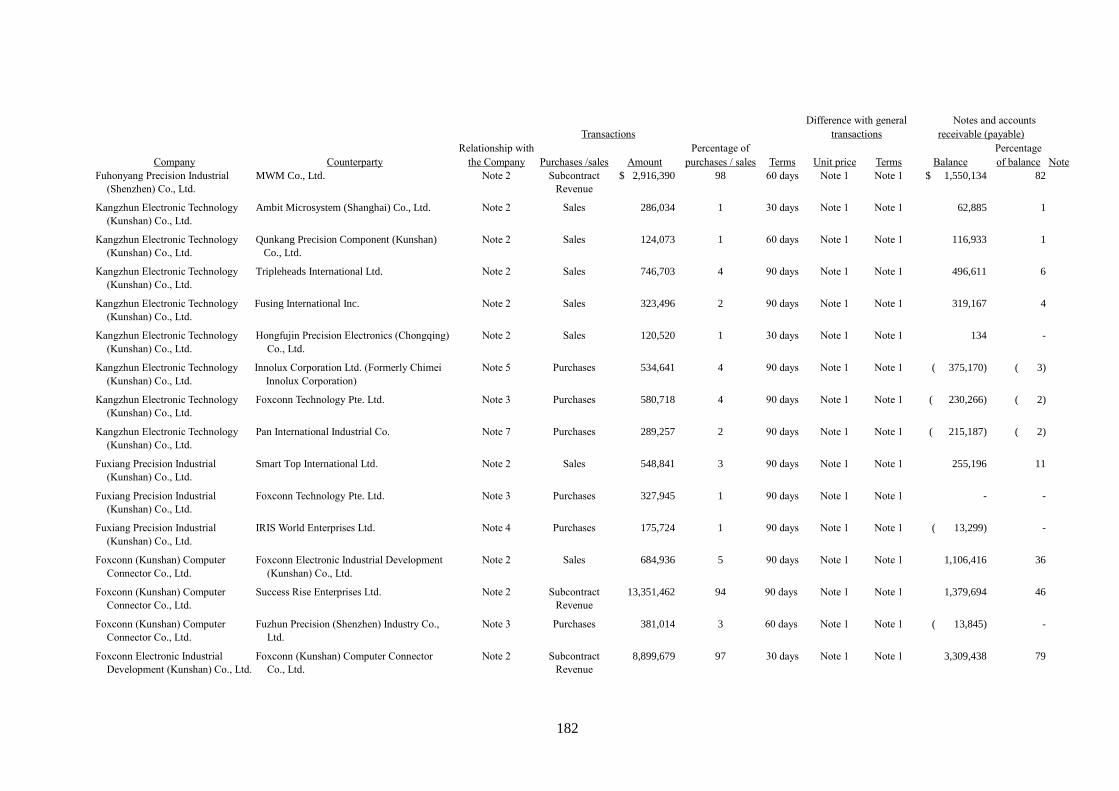
182
Difference with general Notes and accounts
Transactions transactions receivable (payable)
Relationship with Percentage of Percentage
Company Counterparty the Company Purchases /sales Amount purchases / sales Terms Unit price Terms Balance of balance Note
Fuhonyang Precision Industrial
(Shenzhen) Co., Ltd.
MWM Co., Ltd. Note 2 Subcontract
Revenue
$ 2,916,390 98 60 days Note 1 Note 1 $ 1,550,134 82
Kangzhun Electronic Technology
(Kunshan) Co., Ltd.
Ambit Microsystem (Shanghai) Co., Ltd. Note 2 Sales 286,034 1 30 days Note 1 Note 1 62,885 1
Kangzhun Electronic Technology
(Kunshan) Co., Ltd.
Qunkang Precision Component (Kunshan)
Co., Ltd.
Note 2 Sales 124,073 1 60 days Note 1 Note 1 116,933 1
Kangzhun Electronic Technology
(Kunshan) Co., Ltd.
Tripleheads International Ltd. Note 2 Sales 746,703 4 90 days Note 1 Note 1 496,611 6
Kangzhun Electronic Technology
(Kunshan) Co., Ltd.
Fusing International Inc. Note 2 Sales 323,496 2 90 days Note 1 Note 1 319,167 4
Kangzhun Electronic Technology
(Kunshan) Co., Ltd.
Hongfujin Precision Electronics (Chongqing)
Co., Ltd.
Note 2 Sales 120,520 1 30 days Note 1 Note 1 134 -
Kangzhun Electronic Technology
(Kunshan) Co., Ltd.
Innolux Corporation Ltd. (Formerly Chimei
Innolux Corporation)
Note 5 Purchases 534,641 4 90 days Note 1 Note 1 ( 375,170) ( 3)
Kangzhun Electronic Technology
(Kunshan) Co., Ltd.
Foxconn Technology Pte. Ltd. Note 3 Purchases 580,718 4 90 days Note 1 Note 1 ( 230,266) ( 2)
Kangzhun Electronic Technology
(Kunshan) Co., Ltd.
Pan International Industrial Co. Note 7 Purchases 289,257 2 90 days Note 1 Note 1 ( 215,187) ( 2)
Fuxiang Precision Industrial
(Kunshan) Co., Ltd.
Smart Top International Ltd. Note 2 Sales 548,841 3 90 days Note 1 Note 1 255,196 11
Fuxiang Precision Industrial
(Kunshan) Co., Ltd.
Foxconn Technology Pte. Ltd. Note 3 Purchases 327,945 1 90 days Note 1 Note 1 - -
Fuxiang Precision Industrial
(Kunshan) Co., Ltd.
IRIS World Enterprises Ltd. Note 4 Purchases 175,724 1 90 days Note 1 Note 1 ( 13,299) -
Foxconn (Kunshan) Computer
Connector Co., Ltd.
Foxconn Electronic Industrial Development
(Kunshan) Co., Ltd.
Note 2 Sales 684,936 5 90 days Note 1 Note 1 1,106,416 36
Foxconn (Kunshan) Computer
Connector Co., Ltd.
Success Rise Enterprises Ltd. Note 2 Subcontract
Revenue
13,351,462 94 90 days Note 1 Note 1 1,379,694 46
Foxconn (Kunshan) Computer
Connector Co., Ltd.
Fuzhun Precision (Shenzhen) Industry Co.,
Ltd.
Note 3 Purchases 381,014 3 60 days Note 1 Note 1 ( 13,845) -
Foxconn Electronic Industrial
Development (Kunshan) Co., Ltd.
Foxconn (Kunshan) Computer Connector
Co., Ltd.
Note 2 Subcontract
Revenue
8,899,679 97 30 days Note 1 Note 1 3,309,438 79
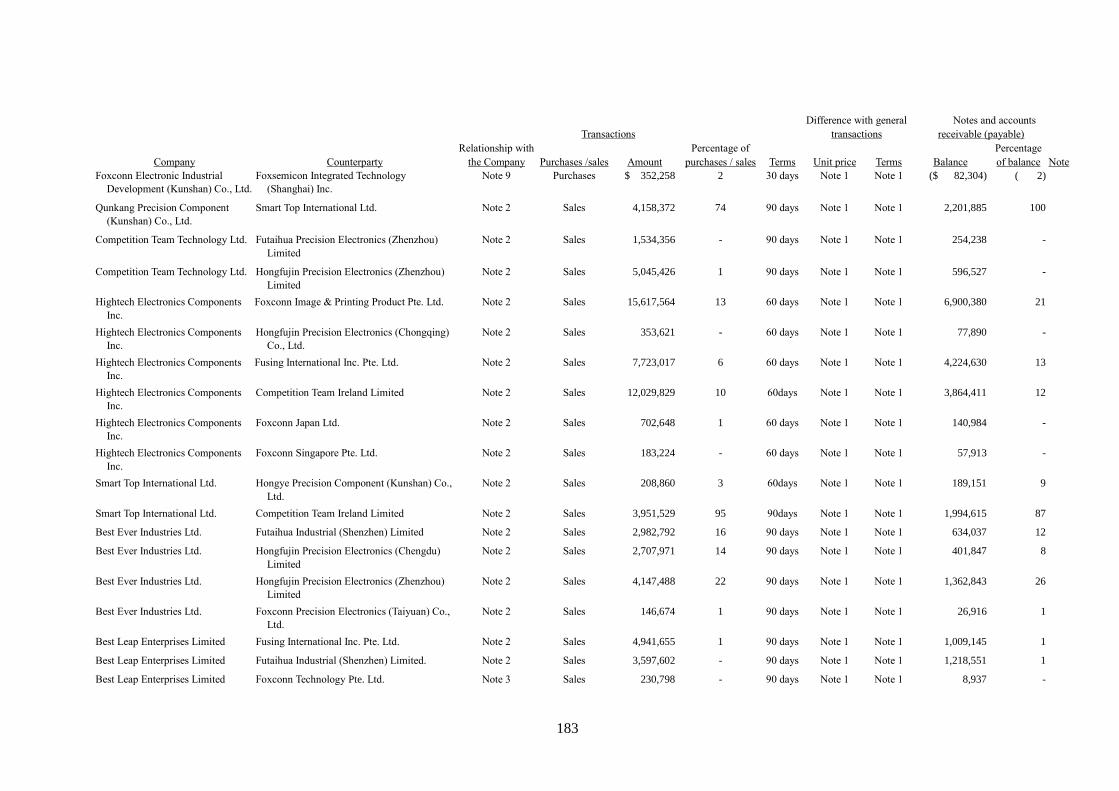
183
Difference with general Notes and accounts
Transactions transactions receivable (payable)
Relationship with Percentage of Percentage
Company Counterparty the Company Purchases /sales Amount purchases / sales Terms Unit price Terms Balance of balance Note
Foxconn Electronic Industrial
Development (Kunshan) Co., Ltd.
Foxsemicon Integrated Technology
(Shanghai) Inc.
Note 9 Purchases $ 352,258 2 30 days Note 1 Note 1 ($ 82,304) ( 2)
Qunkang Precision Component
(Kunshan) Co., Ltd.
Smart Top International Ltd. Note 2 Sales 4,158,372 74 90 days Note 1 Note 1 2,201,885 100
Competition Team Technology Ltd. Futaihua Precision Electronics (Zhenzhou)
Limited
Note 2 Sales 1,534,356 - 90 days Note 1 Note 1 254,238 -
Competition Team Technology Ltd. Hongfujin Precision Electronics (Zhenzhou)
Limited
Note 2 Sales 5,045,426 1 90 days Note 1 Note 1 596,527 -
Hightech Electronics Components
Inc.
Foxconn Image & Printing Product Pte. Ltd. Note 2 Sales 15,617,564 13 60 days Note 1 Note 1 6,900,380 21
Hightech Electronics Components
Inc.
Hongfujin Precision Electronics (Chongqing)
Co., Ltd.
Note 2 Sales 353,621 - 60 days Note 1 Note 1 77,890 -
Hightech Electronics Components
Inc.
Fusing International Inc. Pte. Ltd. Note 2 Sales 7,723,017 6 60 days Note 1 Note 1 4,224,630 13
Hightech Electronics Components
Inc.
Competition Team Ireland Limited Note 2 Sales 12,029,829 10 60days Note 1 Note 1 3,864,411 12
Hightech Electronics Components
Inc.
Foxconn Japan Ltd. Note 2 Sales 702,648 1 60 days Note 1 Note 1 140,984 -
Hightech Electronics Components
Inc.
Foxconn Singapore Pte. Ltd. Note 2 Sales 183,224 - 60 days Note 1 Note 1 57,913 -
Smart Top International Ltd. Hongye Precision Component (Kunshan) Co.,
Ltd.
Note 2 Sales 208,860 3 60days Note 1 Note 1 189,151 9
Smart Top International Ltd. Competition Team Ireland Limited Note 2 Sales 3,951,529 95 90days Note 1 Note 1 1,994,615 87
Best Ever Industries Ltd. Futaihua Industrial (Shenzhen) Limited Note 2 Sales 2,982,792 16 90 days Note 1 Note 1 634,037 12
Best Ever Industries Ltd. Hongfujin Precision Electronics (Chengdu)
Limited
Note 2 Sales 2,707,971 14 90 days Note 1 Note 1 401,847 8
Best Ever Industries Ltd. Hongfujin Precision Electronics (Zhenzhou)
Limited
Note 2 Sales 4,147,488 22 90 days Note 1 Note 1 1,362,843 26
Best Ever Industries Ltd. Foxconn Precision Electronics (Taiyuan) Co.,
Ltd.
Note 2 Sales 146,674 1 90 days Note 1 Note 1 26,916 1
Best Leap Enterprises Limited Fusing International Inc. Pte. Ltd. Note 2 Sales 4,941,655 1 90 days Note 1 Note 1 1,009,145 1
Best Leap Enterprises Limited Futaihua Industrial (Shenzhen) Limited. Note 2 Sales 3,597,602 - 90 days Note 1 Note 1 1,218,551 1
Best Leap Enterprises Limited Foxconn Technology Pte. Ltd. Note 3 Sales 230,798 - 90 days Note 1 Note 1 8,937 -
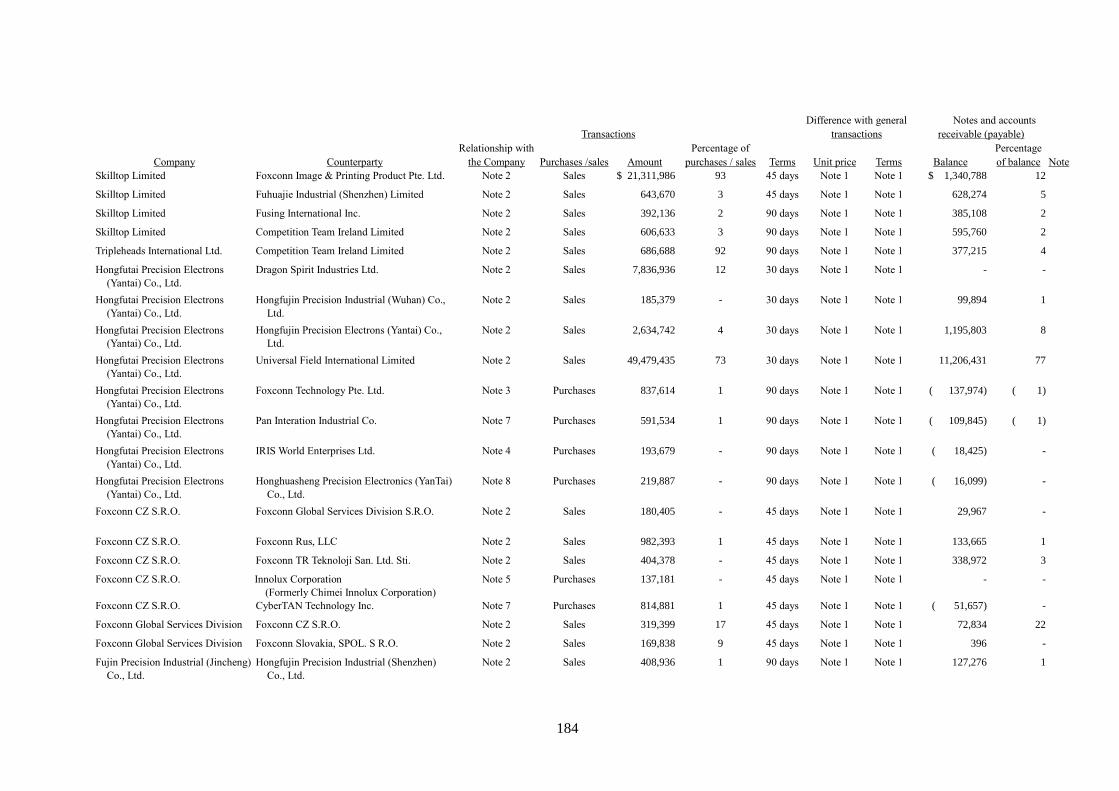
184
Difference with general Notes and accounts
Transactions transactions receivable (payable)
Relationship with Percentage of Percentage
Company Counterparty the Company Purchases /sales Amount purchases / sales Terms Unit price Terms Balance of balance Note
Skilltop Limited Foxconn Image & Printing Product Pte. Ltd. Note 2 Sales $ 21,311,986 93 45 days Note 1 Note 1 $ 1,340,788 12
Skilltop Limited Fuhuajie Industrial (Shenzhen) Limited Note 2 Sales 643,670 3 45 days Note 1 Note 1 628,274 5
Skilltop Limited Fusing International Inc. Note 2 Sales 392,136 2 90 days Note 1 Note 1 385,108 2
Skilltop Limited Competition Team Ireland Limited Note 2 Sales 606,633 3 90 days Note 1 Note 1 595,760 2
Tripleheads International Ltd. Competition Team Ireland Limited Note 2 Sales 686,688 92 90 days Note 1 Note 1 377,215 4
Hongfutai Precision Electrons
(Yantai) Co., Ltd.
Dragon Spirit Industries Ltd. Note 2 Sales 7,836,936 12 30 days Note 1 Note 1 - -
Hongfutai Precision Electrons
(Yantai) Co., Ltd.
Hongfujin Precision Industrial (Wuhan) Co.,
Ltd.
Note 2 Sales 185,379 - 30 days Note 1 Note 1 99,894 1
Hongfutai Precision Electrons
(Yantai) Co., Ltd.
Hongfujin Precision Electrons (Yantai) Co.,
Ltd.
Note 2 Sales 2,634,742 4 30 days Note 1 Note 1 1,195,803 8
Hongfutai Precision Electrons
(Yantai) Co., Ltd.
Universal Field International Limited Note 2 Sales 49,479,435 73 30 days Note 1 Note 1 11,206,431 77
Hongfutai Precision Electrons
(Yantai) Co., Ltd.
Foxconn Technology Pte. Ltd. Note 3 Purchases 837,614 1 90 days Note 1 Note 1 ( 137,974) ( 1)
Hongfutai Precision Electrons
(Yantai) Co., Ltd.
Pan Interation Industrial Co. Note 7 Purchases 591,534 1 90 days Note 1 Note 1 ( 109,845) ( 1)
Hongfutai Precision Electrons
(Yantai) Co., Ltd.
IRIS World Enterprises Ltd. Note 4 Purchases 193,679 - 90 days Note 1 Note 1 ( 18,425) -
Hongfutai Precision Electrons
(Yantai) Co., Ltd.
Honghuasheng Precision Electronics (YanTai)
Co., Ltd.
Note 8 Purchases 219,887 - 90 days Note 1 Note 1 ( 16,099) -
Foxconn CZ S.R.O. Foxconn Global Services Division S.R.O. Note 2 Sales 180,405 - 45 days Note 1 Note 1 29,967 -
Foxconn CZ S.R.O. Foxconn Rus, LLC Note 2 Sales 982,393 1 45 days Note 1 Note 1 133,665 1
Foxconn CZ S.R.O. Foxconn TR Teknoloji San. Ltd. Sti. Note 2 Sales 404,378 - 45 days Note 1 Note 1 338,972 3
Foxconn CZ S.R.O. Innolux Corporation
(Formerly Chimei Innolux Corporation)
Note 5 Purchases 137,181 - 45 days Note 1 Note 1 - -
Foxconn CZ S.R.O. CyberTAN Technology Inc. Note 7 Purchases 814,881 1 45 days Note 1 Note 1 ( 51,657) -
Foxconn Global Services Division Foxconn CZ S.R.O. Note 2 Sales 319,399 17 45 days Note 1 Note 1 72,834 22
Foxconn Global Services Division Foxconn Slovakia, SPOL. S R.O. Note 2 Sales 169,838 9 45 days Note 1 Note 1 396 -
Fujin Precision Industrial (Jincheng)
Co., Ltd.
Hongfujin Precision Industrial (Shenzhen)
Co., Ltd.
Note 2 Sales 408,936 1 90 days Note 1 Note 1 127,276 1
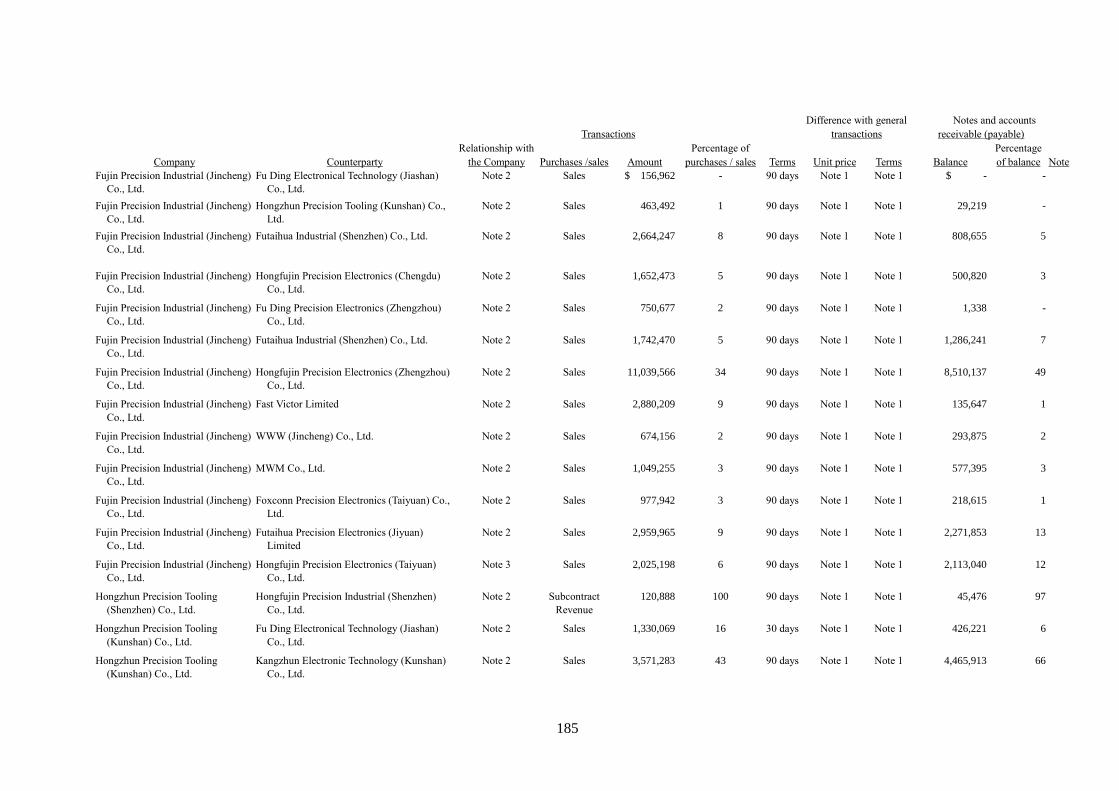
185
Difference with general Notes and accounts
Transactions transactions receivable (payable)
Relationship with Percentage of Percentage
Company Counterparty the Company Purchases /sales Amount purchases / sales Terms Unit price Terms Balance of balance Note
Fujin Precision Industrial (Jincheng)
Co., Ltd.
Fu Ding Electronical Technology (Jiashan)
Co., Ltd.
Note 2 Sales $ 156,962 - 90 days Note 1 Note 1 $ - -
Fujin Precision Industrial (Jincheng)
Co., Ltd.
Hongzhun Precision Tooling (Kunshan) Co.,
Ltd.
Note 2 Sales 463,492 1 90 days Note 1 Note 1 29,219 -
Fujin Precision Industrial (Jincheng)
Co., Ltd.
Futaihua Industrial (Shenzhen) Co., Ltd. Note 2 Sales 2,664,247 8 90 days Note 1 Note 1 808,655 5
Fujin Precision Industrial (Jincheng)
Co., Ltd.
Hongfujin Precision Electronics (Chengdu)
Co., Ltd.
Note 2 Sales 1,652,473 5 90 days Note 1 Note 1 500,820 3
Fujin Precision Industrial (Jincheng)
Co., Ltd.
Fu Ding Precision Electronics (Zhengzhou)
Co., Ltd.
Note 2 Sales 750,677 2 90 days Note 1 Note 1 1,338 -
Fujin Precision Industrial (Jincheng)
Co., Ltd.
Futaihua Industrial (Shenzhen) Co., Ltd. Note 2 Sales 1,742,470 5 90 days Note 1 Note 1 1,286,241 7
Fujin Precision Industrial (Jincheng)
Co., Ltd.
Hongfujin Precision Electronics (Zhengzhou)
Co., Ltd.
Note 2 Sales 11,039,566 34 90 days Note 1 Note 1 8,510,137 49
Fujin Precision Industrial (Jincheng)
Co., Ltd.
Fast Victor Limited Note 2 Sales 2,880,209 9 90 days Note 1 Note 1 135,647 1
Fujin Precision Industrial (Jincheng)
Co., Ltd.
WWW (Jincheng) Co., Ltd. Note 2 Sales 674,156 2 90 days Note 1 Note 1 293,875 2
Fujin Precision Industrial (Jincheng)
Co., Ltd.
MWM Co., Ltd. Note 2 Sales 1,049,255 3 90 days Note 1 Note 1 577,395 3
Fujin Precision Industrial (Jincheng)
Co., Ltd.
Foxconn Precision Electronics (Taiyuan) Co.,
Ltd.
Note 2 Sales 977,942 3 90 days Note 1 Note 1 218,615 1
Fujin Precision Industrial (Jincheng)
Co., Ltd.
Futaihua Precision Electronics (Jiyuan)
Limited
Note 2 Sales 2,959,965 9 90 days Note 1 Note 1 2,271,853 13
Fujin Precision Industrial (Jincheng)
Co., Ltd.
Hongfujin Precision Electronics (Taiyuan)
Co., Ltd.
Note 3 Sales 2,025,198 6 90 days Note 1 Note 1 2,113,040 12
Hongzhun Precision Tooling
(Shenzhen) Co., Ltd.
Hongfujin Precision Industrial (Shenzhen)
Co., Ltd.
Note 2 Subcontract
Revenue
120,888 100 90 days Note 1 Note 1 45,476 97
Hongzhun Precision Tooling
(Kunshan) Co., Ltd.
Fu Ding Electronical Technology (Jiashan)
Co., Ltd.
Note 2 Sales 1,330,069 16 30 days Note 1 Note 1 426,221 6
Hongzhun Precision Tooling
(Kunshan) Co., Ltd.
Kangzhun Electronic Technology (Kunshan)
Co., Ltd.
Note 2 Sales 3,571,283 43 90 days Note 1 Note 1 4,465,913 66
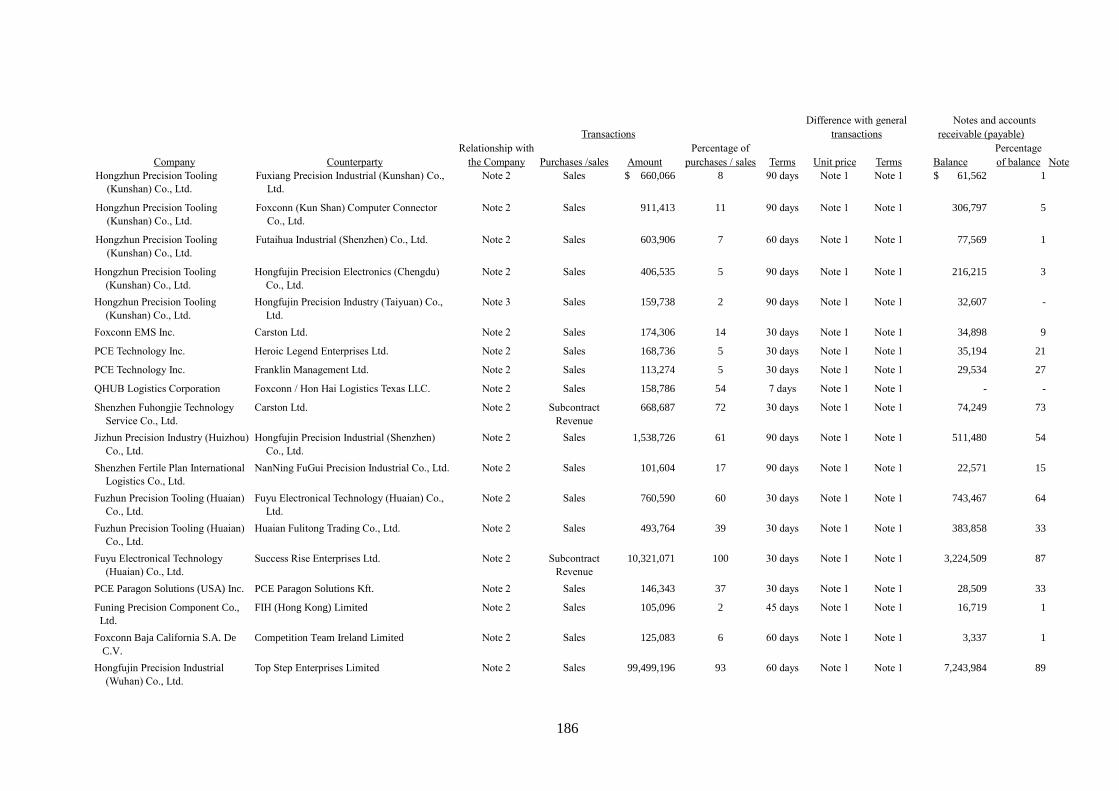
186
Difference with general Notes and accounts
Transactions transactions receivable (payable)
Relationship with Percentage of Percentage
Company Counterparty the Company Purchases /sales Amount purchases / sales Terms Unit price Terms Balance of balance Note
Hongzhun Precision Tooling
(Kunshan) Co., Ltd.
Fuxiang Precision Industrial (Kunshan) Co.,
Ltd.
Note 2 Sales $ 660,066 8 90 days Note 1 Note 1 $ 61,562 1
Hongzhun Precision Tooling
(Kunshan) Co., Ltd.
Foxconn (Kun Shan) Computer Connector
Co., Ltd.
Note 2 Sales 911,413 11 90 days Note 1 Note 1 306,797 5
Hongzhun Precision Tooling
(Kunshan) Co., Ltd.
Futaihua Industrial (Shenzhen) Co., Ltd. Note 2 Sales 603,906 7 60 days Note 1 Note 1 77,569 1
Hongzhun Precision Tooling
(Kunshan) Co., Ltd.
Hongfujin Precision Electronics (Chengdu)
Co., Ltd.
Note 2 Sales 406,535 5 90 days Note 1 Note 1 216,215 3
Hongzhun Precision Tooling
(Kunshan) Co., Ltd.
Hongfujin Precision Industry (Taiyuan) Co.,
Ltd.
Note 3 Sales 159,738 2 90 days Note 1 Note 1 32,607 -
Foxconn EMS Inc. Carston Ltd. Note 2 Sales 174,306 14 30 days Note 1 Note 1 34,898 9
PCE Technology Inc. Heroic Legend Enterprises Ltd. Note 2 Sales 168,736 5 30 days Note 1 Note 1 35,194 21
PCE Technology Inc. Franklin Management Ltd. Note 2 Sales 113,274 5 30 days Note 1 Note 1 29,534 27
QHUB Logistics Corporation Foxconn / Hon Hai Logistics Texas LLC. Note 2 Sales 158,786 54 7 days Note 1 Note 1 - -
Shenzhen Fuhongjie Technology
Service Co., Ltd.
Carston Ltd. Note 2 Subcontract
Revenue
668,687 72 30 days Note 1 Note 1 74,249 73
Jizhun Precision Industry (Huizhou)
Co., Ltd.
Hongfujin Precision Industrial (Shenzhen)
Co., Ltd.
Note 2 Sales 1,538,726 61 90 days Note 1 Note 1 511,480 54
Shenzhen Fertile Plan International
Logistics Co., Ltd.
NanNing FuGui Precision Industrial Co., Ltd. Note 2 Sales 101,604 17 90 days Note 1 Note 1 22,571 15
Fuzhun Precision Tooling (Huaian)
Co., Ltd.
Fuyu Electronical Technology (Huaian) Co.,
Ltd.
Note 2 Sales 760,590 60 30 days Note 1 Note 1 743,467 64
Fuzhun Precision Tooling (Huaian)
Co., Ltd.
Huaian Fulitong Trading Co., Ltd. Note 2 Sales 493,764 39 30 days Note 1 Note 1 383,858 33
Fuyu Electronical Technology
(Huaian) Co., Ltd.
Success Rise Enterprises Ltd. Note 2 Subcontract
Revenue
10,321,071 100 30 days Note 1 Note 1 3,224,509 87
PCE Paragon Solutions (USA) Inc. PCE Paragon Solutions Kft. Note 2 Sales 146,343 37 30 days Note 1 Note 1 28,509 33
Funing Precision Component Co.,
Ltd.
FIH (Hong Kong) Limited Note 2 Sales 105,096 2 45 days Note 1 Note 1 16,719 1
Foxconn Baja California S.A. De
C.V.
Competition Team Ireland Limited Note 2 Sales 125,083 6 60 days Note 1 Note 1 3,337 1
Hongfujin Precision Industrial
(Wuhan) Co., Ltd.
Top Step Enterprises Limited Note 2 Sales 99,499,196 93 60 days Note 1 Note 1 7,243,984 89
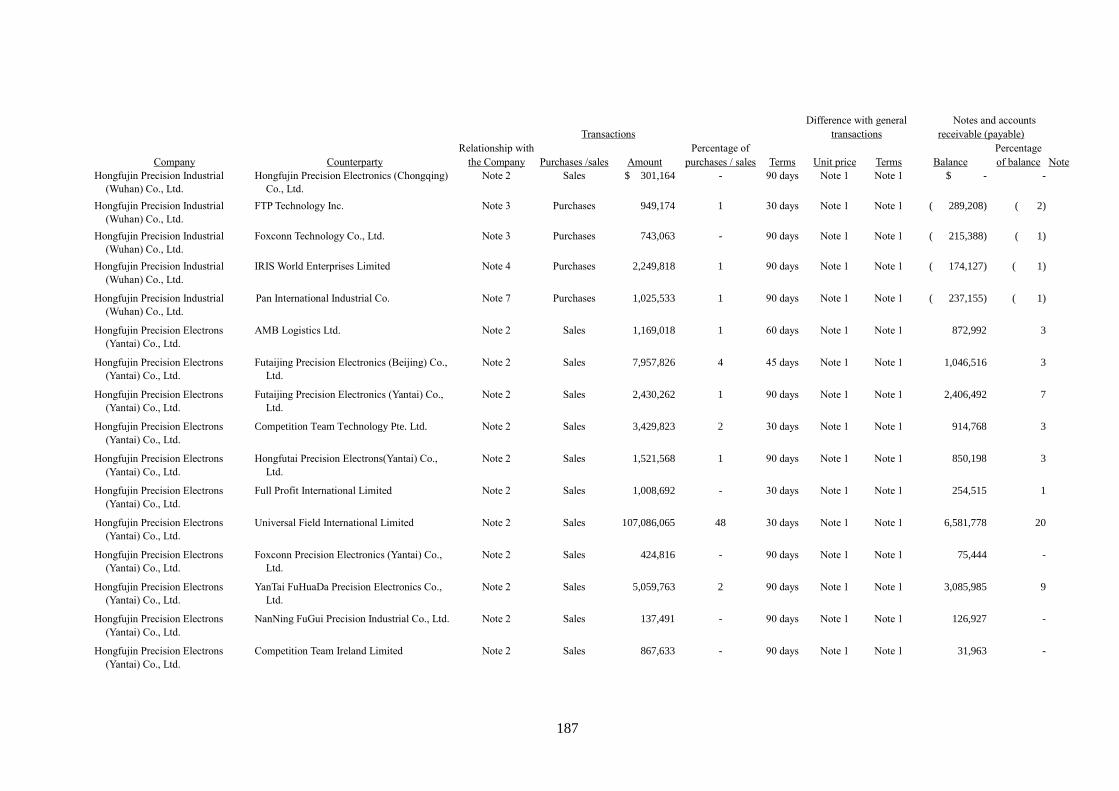
187
Difference with general Notes and accounts
Transactions transactions receivable (payable)
Relationship with Percentage of Percentage
Company Counterparty the Company Purchases /sales Amount purchases / sales Terms Unit price Terms Balance of balance Note
Hongfujin Precision Industrial
(Wuhan) Co., Ltd.
Hongfujin Precision Electronics (Chongqing)
Co., Ltd.
Note 2 Sales $ 301,164 - 90 days Note 1 Note 1 $ - -
Hongfujin Precision Industrial
(Wuhan) Co., Ltd.
FTP Technology Inc. Note 3 Purchases 949,174 1 30 days Note 1 Note 1 ( 289,208) ( 2)
Hongfujin Precision Industrial
(Wuhan) Co., Ltd.
Foxconn Technology Co., Ltd. Note 3 Purchases 743,063 - 90 days Note 1 Note 1 ( 215,388) ( 1)
Hongfujin Precision Industrial
(Wuhan) Co., Ltd.
IRIS World Enterprises Limited Note 4 Purchases 2,249,818 1 90 days Note 1 Note 1 ( 174,127) ( 1)
Hongfujin Precision Industrial
(Wuhan) Co., Ltd.
Pan International Industrial Co. Note 7 Purchases 1,025,533 1 90 days Note 1 Note 1 ( 237,155) ( 1)
Hongfujin Precision Electrons
(Yantai) Co., Ltd.
AMB Logistics Ltd. Note 2 Sales 1,169,018 1 60 days Note 1 Note 1 872,992 3
Hongfujin Precision Electrons
(Yantai) Co., Ltd.
Futaijing Precision Electronics (Beijing) Co.,
Ltd.
Note 2 Sales 7,957,826 4 45 days Note 1 Note 1 1,046,516 3
Hongfujin Precision Electrons
(Yantai) Co., Ltd.
Futaijing Precision Electronics (Yantai) Co.,
Ltd.
Note 2 Sales 2,430,262 1 90 days Note 1 Note 1 2,406,492 7
Hongfujin Precision Electrons
(Yantai) Co., Ltd.
Competition Team Technology Pte. Ltd. Note 2 Sales 3,429,823 2 30 days Note 1 Note 1 914,768 3
Hongfujin Precision Electrons
(Yantai) Co., Ltd.
Hongfutai Precision Electrons(Yantai) Co.,
Ltd.
Note 2 Sales 1,521,568 1 90 days Note 1 Note 1 850,198 3
Hongfujin Precision Electrons
(Yantai) Co., Ltd.
Full Profit International Limited Note 2 Sales 1,008,692 - 30 days Note 1 Note 1 254,515 1
Hongfujin Precision Electrons
(Yantai) Co., Ltd.
Universal Field International Limited Note 2 Sales 107,086,065 48 30 days Note 1 Note 1 6,581,778 20
Hongfujin Precision Electrons
(Yantai) Co., Ltd.
Foxconn Precision Electronics (Yantai) Co.,
Ltd.
Note 2 Sales 424,816 - 90 days Note 1 Note 1 75,444 -
Hongfujin Precision Electrons
(Yantai) Co., Ltd.
YanTai FuHuaDa Precision Electronics Co.,
Ltd.
Note 2 Sales 5,059,763 2 90 days Note 1 Note 1 3,085,985 9
Hongfujin Precision Electrons
(Yantai) Co., Ltd.
NanNing FuGui Precision Industrial Co., Ltd. Note 2 Sales 137,491 - 90 days Note 1 Note 1 126,927 -
Hongfujin Precision Electrons
(Yantai) Co., Ltd.
Competition Team Ireland Limited Note 2 Sales 867,633 - 90 days Note 1 Note 1 31,963 -
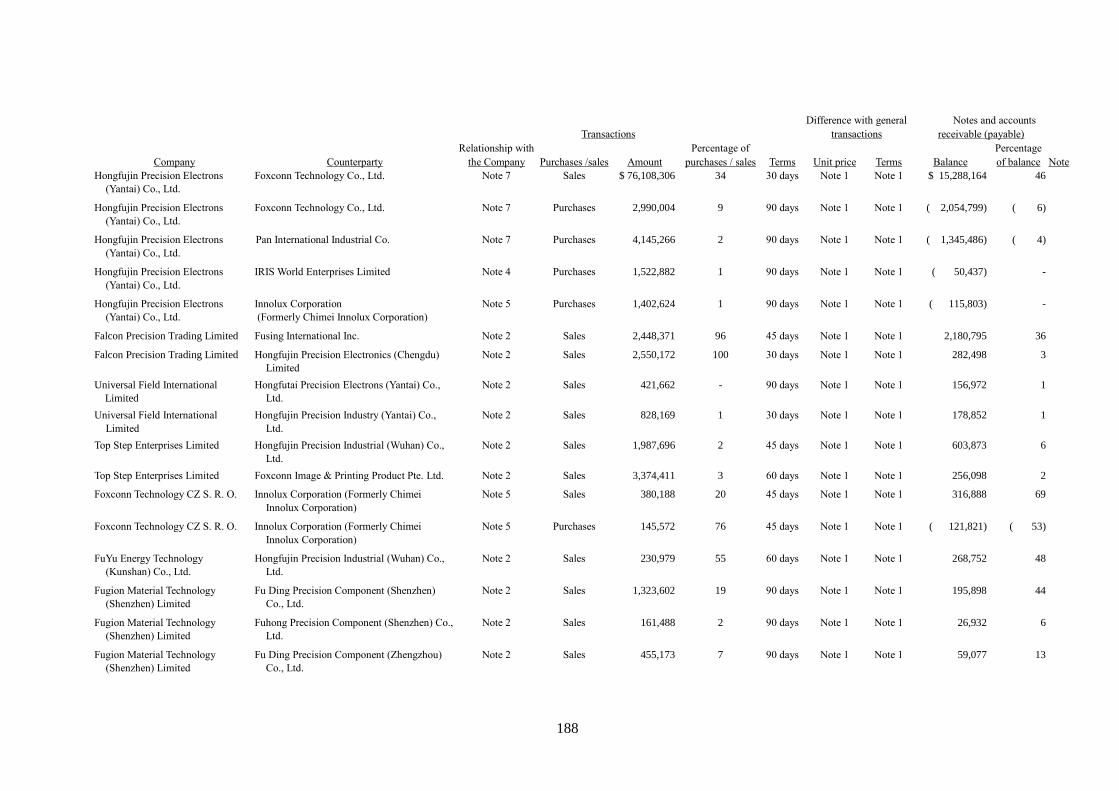
188
Difference with general Notes and accounts
Transactions transactions receivable (payable)
Relationship with Percentage of Percentage
Company Counterparty the Company Purchases /sales Amount purchases / sales Terms Unit price Terms Balance of balance Note
Hongfujin Precision Electrons
(Yantai) Co., Ltd.
Foxconn Technology Co., Ltd. Note 7 Sales $ 76,108,306 34 30 days Note 1 Note 1 $ 15,288,164 46
Hongfujin Precision Electrons
(Yantai) Co., Ltd.
Foxconn Technology Co., Ltd. Note 7 Purchases 2,990,004 9 90 days Note 1 Note 1 ( 2,054,799) ( 6)
Hongfujin Precision Electrons
(Yantai) Co., Ltd.
Pan International Industrial Co. Note 7 Purchases 4,145,266 2 90 days Note 1 Note 1 ( 1,345,486) ( 4)
Hongfujin Precision Electrons
(Yantai) Co., Ltd.
IRIS World Enterprises Limited Note 4 Purchases 1,522,882 1 90 days Note 1 Note 1 ( 50,437) -
Hongfujin Precision Electrons
(Yantai) Co., Ltd.
Innolux Corporation
(Formerly Chimei Innolux Corporation)
Note 5 Purchases 1,402,624 1 90 days Note 1 Note 1 ( 115,803) -
Falcon Precision Trading Limited Fusing International Inc. Note 2 Sales 2,448,371 96 45 days Note 1 Note 1 2,180,795 36
Falcon Precision Trading Limited Hongfujin Precision Electronics (Chengdu)
Limited
Note 2 Sales 2,550,172 100 30 days Note 1 Note 1 282,498 3
Universal Field International
Limited
Hongfutai Precision Electrons (Yantai) Co.,
Ltd.
Note 2 Sales 421,662 - 90 days Note 1 Note 1 156,972 1
Universal Field International
Limited
Hongfujin Precision Industry (Yantai) Co.,
Ltd.
Note 2 Sales 828,169 1 30 days Note 1 Note 1 178,852 1
Top Step Enterprises Limited Hongfujin Precision Industrial (Wuhan) Co.,
Ltd.
Note 2 Sales 1,987,696 2 45 days Note 1 Note 1 603,873 6
Top Step Enterprises Limited Foxconn Image & Printing Product Pte. Ltd. Note 2 Sales 3,374,411 3 60 days Note 1 Note 1 256,098 2
Foxconn Technology CZ S. R. O. Innolux Corporation (Formerly Chimei
Innolux Corporation)
Note 5 Sales 380,188 20 45 days Note 1 Note 1 316,888 69
Foxconn Technology CZ S. R. O. Innolux Corporation (Formerly Chimei
Innolux Corporation)
Note 5 Purchases 145,572 76 45 days Note 1 Note 1 ( 121,821) ( 53)
FuYu Energy Technology
(Kunshan) Co., Ltd.
Hongfujin Precision Industrial (Wuhan) Co.,
Ltd.
Note 2 Sales 230,979 55 60 days Note 1 Note 1 268,752 48
Fugion Material Technology
(Shenzhen) Limited
Fu Ding Precision Component (Shenzhen)
Co., Ltd.
Note 2 Sales 1,323,602 19 90 days Note 1 Note 1 195,898 44
Fugion Material Technology
(Shenzhen) Limited
Fuhong Precision Component (Shenzhen) Co.,
Ltd.
Note 2 Sales 161,488 2 90 days Note 1 Note 1 26,932 6
Fugion Material Technology
(Shenzhen) Limited
Fu Ding Precision Component (Zhengzhou)
Co., Ltd.
Note 2 Sales 455,173 7 90 days Note 1 Note 1 59,077 13
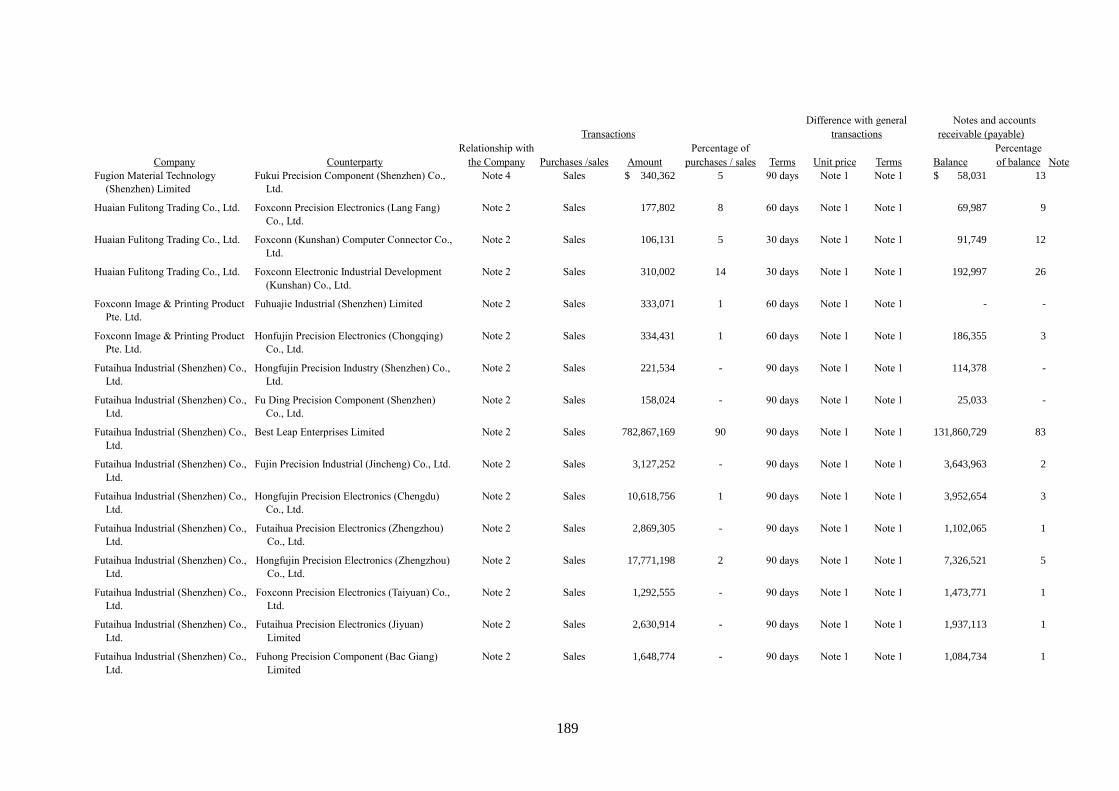
189
Difference with general Notes and accounts
Transactions transactions receivable (payable)
Relationship with Percentage of Percentage
Company Counterparty the Company Purchases /sales Amount purchases / sales Terms Unit price Terms Balance of balance Note
Fugion Material Technology
(Shenzhen) Limited
Fukui Precision Component (Shenzhen) Co.,
Ltd.
Note 4 Sales $ 340,362 5 90 days Note 1 Note 1 $ 58,031 13
Huaian Fulitong Trading Co., Ltd. Foxconn Precision Electronics (Lang Fang)
Co., Ltd.
Note 2 Sales 177,802 8 60 days Note 1 Note 1 69,987 9
Huaian Fulitong Trading Co., Ltd. Foxconn (Kunshan) Computer Connector Co.,
Ltd.
Note 2 Sales 106,131 5 30 days Note 1 Note 1 91,749 12
Huaian Fulitong Trading Co., Ltd. Foxconn Electronic Industrial Development
(Kunshan) Co., Ltd.
Note 2 Sales 310,002 14 30 days Note 1 Note 1 192,997 26
Foxconn Image & Printing Product
Pte. Ltd.
Fuhuajie Industrial (Shenzhen) Limited Note 2 Sales 333,071 1 60 days Note 1 Note 1 - -
Foxconn Image & Printing Product
Pte. Ltd.
Honfujin Precision Electronics (Chongqing)
Co., Ltd.
Note 2 Sales 334,431 1 60 days Note 1 Note 1 186,355 3
Futaihua Industrial (Shenzhen) Co.,
Ltd.
Hongfujin Precision Industry (Shenzhen) Co.,
Ltd.
Note 2 Sales 221,534 - 90 days Note 1 Note 1 114,378 -
Futaihua Industrial (Shenzhen) Co.,
Ltd.
Fu Ding Precision Component (Shenzhen)
Co., Ltd.
Note 2 Sales 158,024 - 90 days Note 1 Note 1 25,033 -
Futaihua Industrial (Shenzhen) Co.,
Ltd.
Best Leap Enterprises Limited Note 2 Sales 782,867,169 90 90 days Note 1 Note 1 131,860,729 83
Futaihua Industrial (Shenzhen) Co.,
Ltd.
Fujin Precision Industrial (Jincheng) Co., Ltd. Note 2 Sales 3,127,252 - 90 days Note 1 Note 1 3,643,963 2
Futaihua Industrial (Shenzhen) Co.,
Ltd.
Hongfujin Precision Electronics (Chengdu)
Co., Ltd.
Note 2 Sales 10,618,756 1 90 days Note 1 Note 1 3,952,654 3
Futaihua Industrial (Shenzhen) Co.,
Ltd.
Futaihua Precision Electronics (Zhengzhou)
Co., Ltd.
Note 2 Sales 2,869,305 - 90 days Note 1 Note 1 1,102,065 1
Futaihua Industrial (Shenzhen) Co.,
Ltd.
Hongfujin Precision Electronics (Zhengzhou)
Co., Ltd.
Note 2 Sales 17,771,198 2 90 days Note 1 Note 1 7,326,521 5
Futaihua Industrial (Shenzhen) Co.,
Ltd.
Foxconn Precision Electronics (Taiyuan) Co.,
Ltd.
Note 2 Sales 1,292,555 - 90 days Note 1 Note 1 1,473,771 1
Futaihua Industrial (Shenzhen) Co.,
Ltd.
Futaihua Precision Electronics (Jiyuan)
Limited
Note 2 Sales 2,630,914 - 90 days Note 1 Note 1 1,937,113 1
Futaihua Industrial (Shenzhen) Co.,
Ltd.
Fuhong Precision Component (Bac Giang)
Limited
Note 2 Sales 1,648,774 - 90 days Note 1 Note 1 1,084,734 1
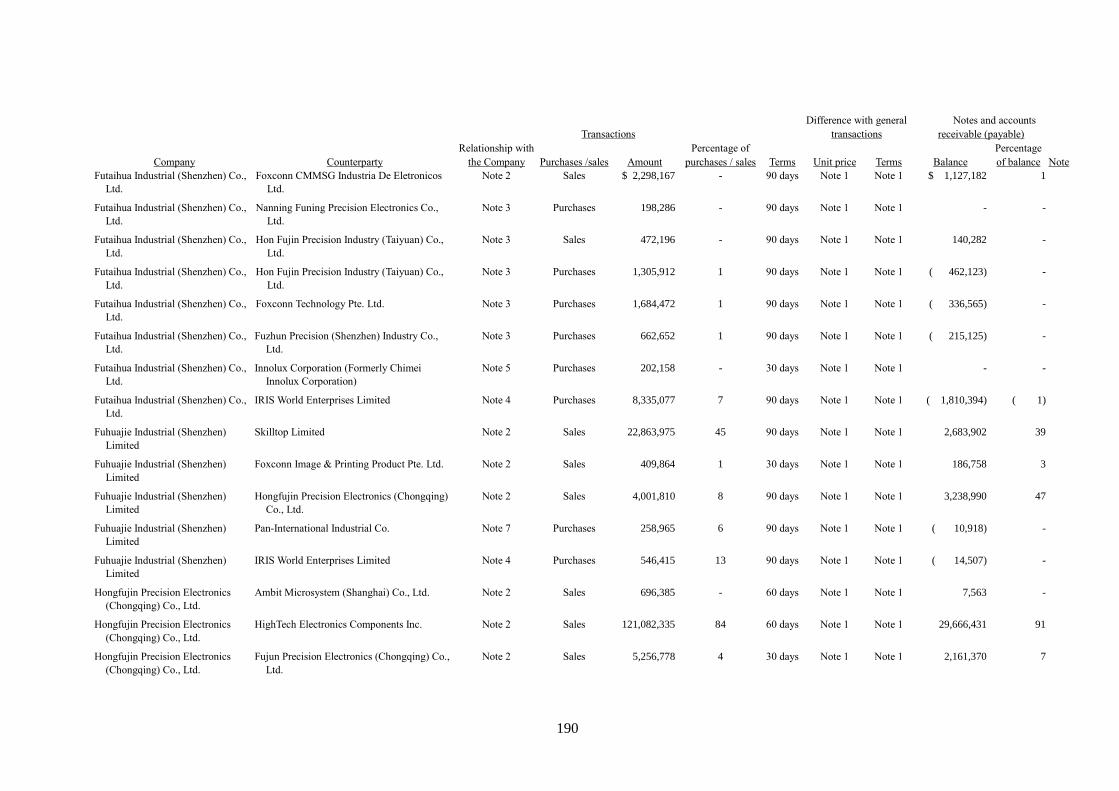
190
Difference with general Notes and accounts
Transactions transactions receivable (payable)
Relationship with Percentage of Percentage
Company Counterparty the Company Purchases /sales Amount purchases / sales Terms Unit price Terms Balance of balance Note
Futaihua Industrial (Shenzhen) Co.,
Ltd.
Foxconn CMMSG Industria De Eletronicos
Ltd.
Note 2 Sales $ 2,298,167 - 90 days Note 1 Note 1 $ 1,127,182 1
Futaihua Industrial (Shenzhen) Co.,
Ltd.
Nanning Funing Precision Electronics Co.,
Ltd.
Note 3 Purchases 198,286 - 90 days Note 1 Note 1 - -
Futaihua Industrial (Shenzhen) Co.,
Ltd.
Hon Fujin Precision Industry (Taiyuan) Co.,
Ltd.
Note 3 Sales 472,196 - 90 days Note 1 Note 1 140,282 -
Futaihua Industrial (Shenzhen) Co.,
Ltd.
Hon Fujin Precision Industry (Taiyuan) Co.,
Ltd.
Note 3 Purchases 1,305,912 1 90 days Note 1 Note 1 ( 462,123) -
Futaihua Industrial (Shenzhen) Co.,
Ltd.
Foxconn Technology Pte. Ltd. Note 3 Purchases 1,684,472 1 90 days Note 1 Note 1 ( 336,565) -
Futaihua Industrial (Shenzhen) Co.,
Ltd.
Fuzhun Precision (Shenzhen) Industry Co.,
Ltd.
Note 3 Purchases 662,652 1 90 days Note 1 Note 1 ( 215,125) -
Futaihua Industrial (Shenzhen) Co.,
Ltd.
Innolux Corporation (Formerly Chimei
Innolux Corporation)
Note 5 Purchases 202,158 - 30 days Note 1 Note 1 - -
Futaihua Industrial (Shenzhen) Co.,
Ltd.
IRIS World Enterprises Limited Note 4 Purchases 8,335,077 7 90 days Note 1 Note 1 ( 1,810,394) ( 1)
Fuhuajie Industrial (Shenzhen)
Limited
Skilltop Limited Note 2 Sales 22,863,975 45 90 days Note 1 Note 1 2,683,902 39
Fuhuajie Industrial (Shenzhen)
Limited
Foxconn Image & Printing Product Pte. Ltd. Note 2 Sales 409,864 1 30 days Note 1 Note 1 186,758 3
Fuhuajie Industrial (Shenzhen)
Limited
Hongfujin Precision Electronics (Chongqing)
Co., Ltd.
Note 2 Sales 4,001,810 8 90 days Note 1 Note 1 3,238,990 47
Fuhuajie Industrial (Shenzhen)
Limited
Pan-International Industrial Co. Note 7 Purchases 258,965 6 90 days Note 1 Note 1 ( 10,918) -
Fuhuajie Industrial (Shenzhen)
Limited
IRIS World Enterprises Limited Note 4 Purchases 546,415 13 90 days Note 1 Note 1 ( 14,507) -
Hongfujin Precision Electronics
(Chongqing) Co., Ltd.
Ambit Microsystem (Shanghai) Co., Ltd. Note 2 Sales 696,385 - 60 days Note 1 Note 1 7,563 -
Hongfujin Precision Electronics
(Chongqing) Co., Ltd.
HighTech Electronics Components Inc. Note 2 Sales 121,082,335 84 60 days Note 1 Note 1 29,666,431 91
Hongfujin Precision Electronics
(Chongqing) Co., Ltd.
Fujun Precision Electronics (Chongqing) Co.,
Ltd.
Note 2 Sales 5,256,778 4 30 days Note 1 Note 1 2,161,370 7
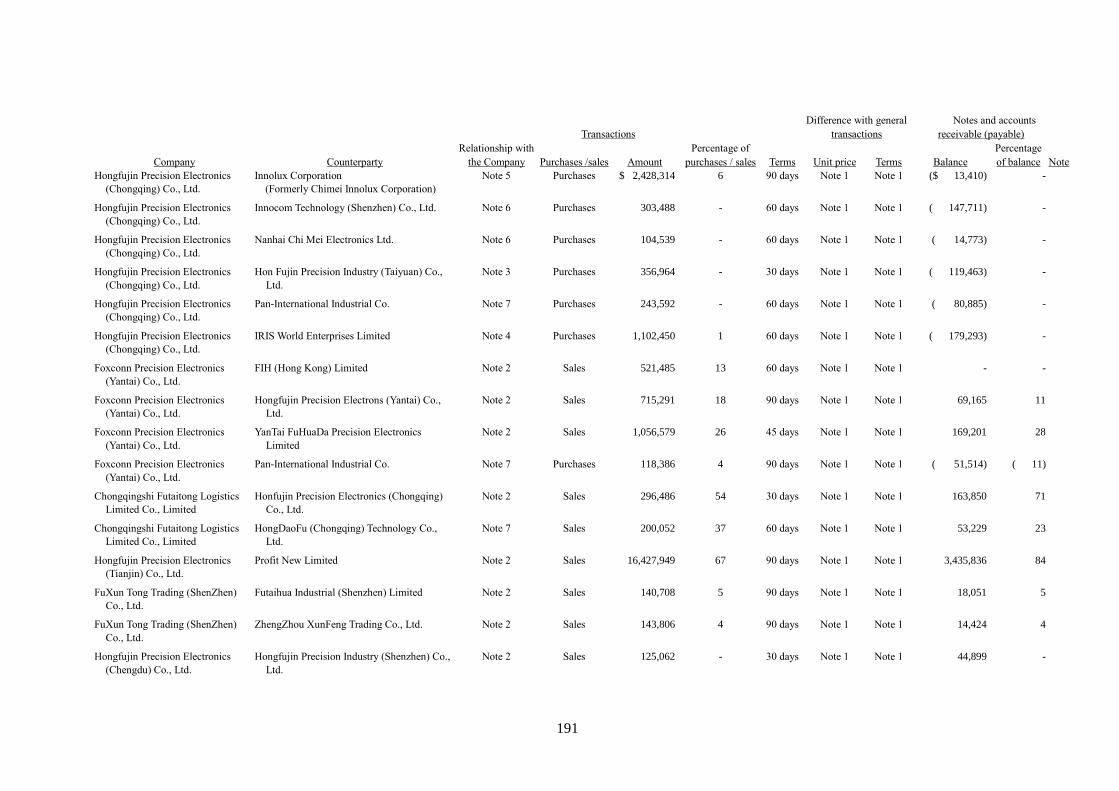
191
Difference with general Notes and accounts
Transactions transactions receivable (payable)
Relationship with Percentage of Percentage
Company Counterparty the Company Purchases /sales Amount purchases / sales Terms Unit price Terms Balance of balance Note
Hongfujin Precision Electronics
(Chongqing) Co., Ltd.
Innolux Corporation
(Formerly Chimei Innolux Corporation)
Note 5 Purchases $ 2,428,314 6 90 days Note 1 Note 1 ($ 13,410) -
Hongfujin Precision Electronics
(Chongqing) Co., Ltd.
Innocom Technology (Shenzhen) Co., Ltd. Note 6 Purchases 303,488 - 60 days Note 1 Note 1 ( 147,711) -
Hongfujin Precision Electronics
(Chongqing) Co., Ltd.
Nanhai Chi Mei Electronics Ltd. Note 6 Purchases 104,539 - 60 days Note 1 Note 1 ( 14,773) -
Hongfujin Precision Electronics
(Chongqing) Co., Ltd.
Hon Fujin Precision Industry (Taiyuan) Co.,
Ltd.
Note 3 Purchases 356,964 - 30 days Note 1 Note 1 ( 119,463) -
Hongfujin Precision Electronics
(Chongqing) Co., Ltd.
Pan-International Industrial Co. Note 7 Purchases 243,592 - 60 days Note 1 Note 1 ( 80,885) -
Hongfujin Precision Electronics
(Chongqing) Co., Ltd.
IRIS World Enterprises Limited Note 4 Purchases 1,102,450 1 60 days Note 1 Note 1 ( 179,293) -
Foxconn Precision Electronics
(Yantai) Co., Ltd.
FIH (Hong Kong) Limited Note 2 Sales 521,485 13 60 days Note 1 Note 1 - -
Foxconn Precision Electronics
(Yantai) Co., Ltd.
Hongfujin Precision Electrons (Yantai) Co.,
Ltd.
Note 2 Sales 715,291 18 90 days Note 1 Note 1 69,165 11
Foxconn Precision Electronics
(Yantai) Co., Ltd.
YanTai FuHuaDa Precision Electronics
Limited
Note 2 Sales 1,056,579 26 45 days Note 1 Note 1 169,201 28
Foxconn Precision Electronics
(Yantai) Co., Ltd.
Pan-International Industrial Co. Note 7 Purchases 118,386 4 90 days Note 1 Note 1 ( 51,514) ( 11)
Chongqingshi Futaitong Logistics
Limited Co., Limited
Honfujin Precision Electronics (Chongqing)
Co., Ltd.
Note 2 Sales 296,486 54 30 days Note 1 Note 1 163,850 71
Chongqingshi Futaitong Logistics
Limited Co., Limited
HongDaoFu (Chongqing) Technology Co.,
Ltd.
Note 7 Sales 200,052 37 60 days Note 1 Note 1 53,229 23
Hongfujin Precision Electronics
(Tianjin) Co., Ltd.
Profit New Limited Note 2 Sales 16,427,949 67 90 days Note 1 Note 1 3,435,836 84
FuXun Tong Trading (ShenZhen)
Co., Ltd.
Futaihua Industrial (Shenzhen) Limited Note 2 Sales 140,708 5 90 days Note 1 Note 1 18,051 5
FuXun Tong Trading (ShenZhen)
Co., Ltd.
ZhengZhou XunFeng Trading Co., Ltd. Note 2 Sales 143,806 4 90 days Note 1 Note 1 14,424 4
Hongfujin Precision Electronics
(Chengdu) Co., Ltd.
Hongfujin Precision Industry (Shenzhen) Co.,
Ltd.
Note 2 Sales 125,062 - 30 days Note 1 Note 1 44,899 -
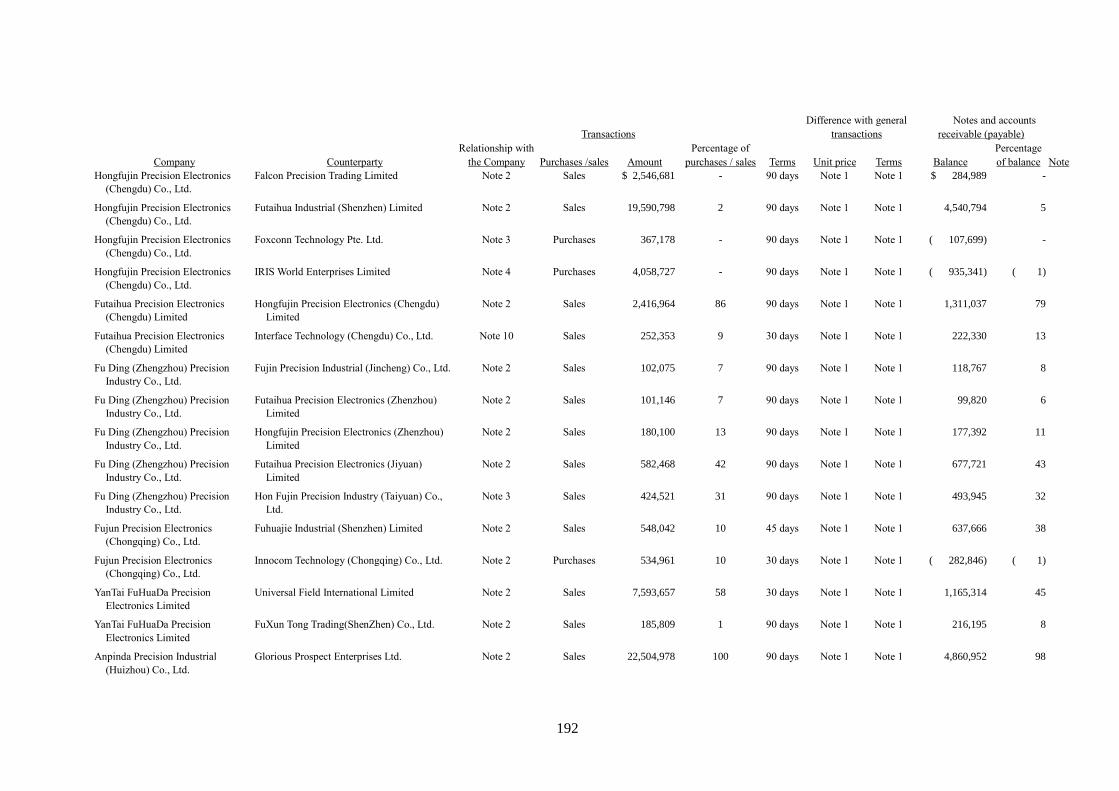
192
Difference with general Notes and accounts
Transactions transactions receivable (payable)
Relationship with Percentage of Percentage
Company Counterparty the Company Purchases /sales Amount purchases / sales Terms Unit price Terms Balance of balance Note
Hongfujin Precision Electronics
(Chengdu) Co., Ltd.
Falcon Precision Trading Limited Note 2 Sales $ 2,546,681 - 90 days Note 1 Note 1 $ 284,989 -
Hongfujin Precision Electronics
(Chengdu) Co., Ltd.
Futaihua Industrial (Shenzhen) Limited Note 2 Sales 19,590,798 2 90 days Note 1 Note 1 4,540,794 5
Hongfujin Precision Electronics
(Chengdu) Co., Ltd.
Foxconn Technology Pte. Ltd. Note 3 Purchases 367,178 - 90 days Note 1 Note 1 ( 107,699) -
Hongfujin Precision Electronics
(Chengdu) Co., Ltd.
IRIS World Enterprises Limited Note 4 Purchases 4,058,727 - 90 days Note 1 Note 1 ( 935,341) ( 1)
Futaihua Precision Electronics
(Chengdu) Limited
Hongfujin Precision Electronics (Chengdu)
Limited
Note 2 Sales 2,416,964 86 90 days Note 1 Note 1 1,311,037 79
Futaihua Precision Electronics
(Chengdu) Limited
Interface Technology (Chengdu) Co., Ltd. Note 10 Sales 252,353 9 30 days Note 1 Note 1 222,330 13
Fu Ding (Zhengzhou) Precision
Industry Co., Ltd.
Fujin Precision Industrial (Jincheng) Co., Ltd. Note 2 Sales 102,075 7 90 days Note 1 Note 1 118,767 8
Fu Ding (Zhengzhou) Precision
Industry Co., Ltd.
Futaihua Precision Electronics (Zhenzhou)
Limited
Note 2 Sales 101,146 7 90 days Note 1 Note 1 99,820 6
Fu Ding (Zhengzhou) Precision
Industry Co., Ltd.
Hongfujin Precision Electronics (Zhenzhou)
Limited
Note 2 Sales 180,100 13 90 days Note 1 Note 1 177,392 11
Fu Ding (Zhengzhou) Precision
Industry Co., Ltd.
Futaihua Precision Electronics (Jiyuan)
Limited
Note 2 Sales 582,468 42 90 days Note 1 Note 1 677,721 43
Fu Ding (Zhengzhou) Precision
Industry Co., Ltd.
Hon Fujin Precision Industry (Taiyuan) Co.,
Ltd.
Note 3 Sales 424,521 31 90 days Note 1 Note 1 493,945 32
Fujun Precision Electronics
(Chongqing) Co., Ltd.
Fuhuajie Industrial (Shenzhen) Limited Note 2 Sales 548,042 10 45 days Note 1 Note 1 637,666 38
Fujun Precision Electronics
(Chongqing) Co., Ltd.
Innocom Technology (Chongqing) Co., Ltd. Note 2 Purchases 534,961 10 30 days Note 1 Note 1 ( 282,846) ( 1)
YanTai FuHuaDa Precision
Electronics Limited
Universal Field International Limited Note 2 Sales 7,593,657 58 30 days Note 1 Note 1 1,165,314 45
YanTai FuHuaDa Precision
Electronics Limited
FuXun Tong Trading(ShenZhen) Co., Ltd. Note 2 Sales 185,809 1 90 days Note 1 Note 1 216,195 8
Anpinda Precision Industrial
(Huizhou) Co., Ltd.
Glorious Prospect Enterprises Ltd. Note 2 Sales 22,504,978 100 90 days Note 1 Note 1 4,860,952 98
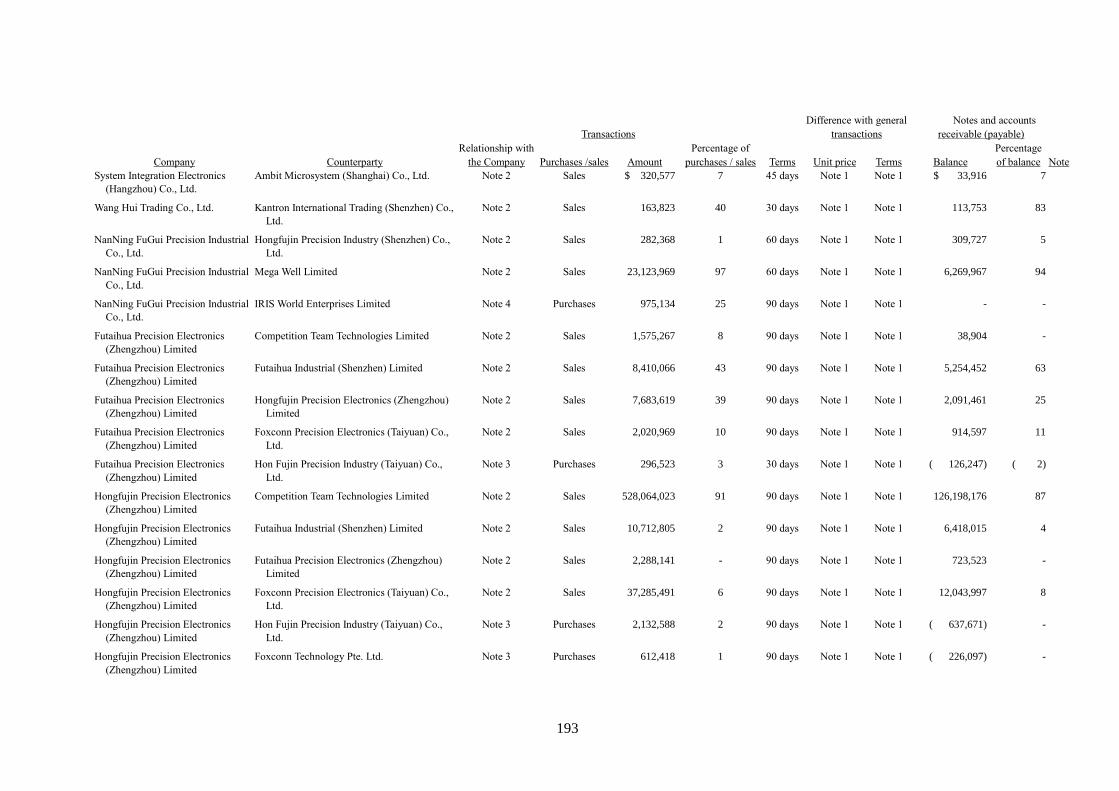
193
Difference with general Notes and accounts
Transactions transactions receivable (payable)
Relationship with Percentage of Percentage
Company Counterparty the Company Purchases /sales Amount purchases / sales Terms Unit price Terms Balance of balance Note
System Integration Electronics
(Hangzhou) Co., Ltd.
Ambit Microsystem (Shanghai) Co., Ltd. Note 2 Sales $ 320,577 7 45 days Note 1 Note 1 $ 33,916 7
Wang Hui Trading Co., Ltd. Kantron International Trading (Shenzhen) Co.,
Ltd.
Note 2 Sales 163,823 40 30 days Note 1 Note 1 113,753 83
NanNing FuGui Precision Industrial
Co., Ltd.
Hongfujin Precision Industry (Shenzhen) Co.,
Ltd.
Note 2 Sales 282,368 1 60 days Note 1 Note 1 309,727 5
NanNing FuGui Precision Industrial
Co., Ltd.
Mega Well Limited Note 2 Sales 23,123,969 97 60 days Note 1 Note 1 6,269,967 94
NanNing FuGui Precision Industrial
Co., Ltd.
IRIS World Enterprises Limited Note 4 Purchases 975,134 25 90 days Note 1 Note 1 - -
Futaihua Precision Electronics
(Zhengzhou) Limited
Competition Team Technologies Limited Note 2 Sales 1,575,267 8 90 days Note 1 Note 1 38,904 -
Futaihua Precision Electronics
(Zhengzhou) Limited
Futaihua Industrial (Shenzhen) Limited Note 2 Sales 8,410,066 43 90 days Note 1 Note 1 5,254,452 63
Futaihua Precision Electronics
(Zhengzhou) Limited
Hongfujin Precision Electronics (Zhengzhou)
Limited
Note 2 Sales 7,683,619 39 90 days Note 1 Note 1 2,091,461 25
Futaihua Precision Electronics
(Zhengzhou) Limited
Foxconn Precision Electronics (Taiyuan) Co.,
Ltd.
Note 2 Sales 2,020,969 10 90 days Note 1 Note 1 914,597 11
Futaihua Precision Electronics
(Zhengzhou) Limited
Hon Fujin Precision Industry (Taiyuan) Co.,
Ltd.
Note 3 Purchases 296,523 3 30 days Note 1 Note 1 ( 126,247) ( 2)
Hongfujin Precision Electronics
(Zhengzhou) Limited
Competition Team Technologies Limited Note 2 Sales 528,064,023 91 90 days Note 1 Note 1 126,198,176 87
Hongfujin Precision Electronics
(Zhengzhou) Limited
Futaihua Industrial (Shenzhen) Limited Note 2 Sales 10,712,805 2 90 days Note 1 Note 1 6,418,015 4
Hongfujin Precision Electronics
(Zhengzhou) Limited
Futaihua Precision Electronics (Zhengzhou)
Limited
Note 2 Sales 2,288,141 - 90 days Note 1 Note 1 723,523 -
Hongfujin Precision Electronics
(Zhengzhou) Limited
Foxconn Precision Electronics (Taiyuan) Co.,
Ltd.
Note 2 Sales 37,285,491 6 90 days Note 1 Note 1 12,043,997 8
Hongfujin Precision Electronics
(Zhengzhou) Limited
Hon Fujin Precision Industry (Taiyuan) Co.,
Ltd.
Note 3 Purchases 2,132,588 2 90 days Note 1 Note 1 ( 637,671) -
Hongfujin Precision Electronics
(Zhengzhou) Limited
Foxconn Technology Pte. Ltd. Note 3 Purchases 612,418 1 90 days Note 1 Note 1 ( 226,097) -
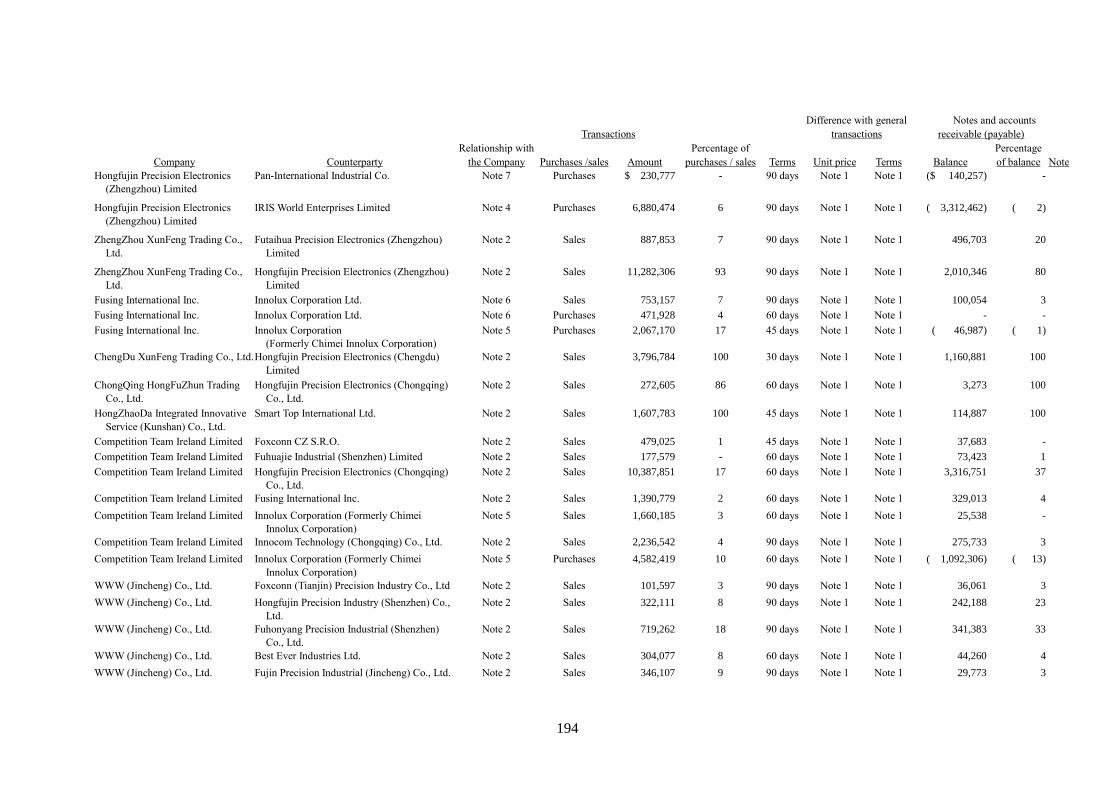
194
Difference with general Notes and accounts
Transactions transactions receivable (payable)
Relationship with Percentage of Percentage
Company Counterparty the Company Purchases /sales Amount purchases / sales Terms Unit price Terms Balance of balance Note
Hongfujin Precision Electronics
(Zhengzhou) Limited
Pan-International Industrial Co. Note 7 Purchases $ 230,777 - 90 days Note 1 Note 1 ($ 140,257) -
Hongfujin Precision Electronics
(Zhengzhou) Limited
IRIS World Enterprises Limited Note 4 Purchases 6,880,474 6 90 days Note 1 Note 1 ( 3,312,462) ( 2)
ZhengZhou XunFeng Trading Co.,
Ltd.
Futaihua Precision Electronics (Zhengzhou)
Limited
Note 2 Sales 887,853 7 90 days Note 1 Note 1 496,703 20
ZhengZhou XunFeng Trading Co.,
Ltd.
Hongfujin Precision Electronics (Zhengzhou)
Limited
Note 2 Sales 11,282,306 93 90 days Note 1 Note 1 2,010,346 80
Fusing International Inc. Innolux Corporation Ltd. Note 6 Sales 753,157 7 90 days Note 1 Note 1 100,054 3
Fusing International Inc. Innolux Corporation Ltd. Note 6 Purchases 471,928 4 60 days Note 1 Note 1 - -
Fusing International Inc. Innolux Corporation
(Formerly Chimei Innolux Corporation)
Note 5 Purchases 2,067,170 17 45 days Note 1 Note 1 ( 46,987) ( 1)
ChengDu XunFeng Trading Co., Ltd. Hongfujin Precision Electronics (Chengdu)
Limited
Note 2 Sales 3,796,784 100 30 days Note 1 Note 1 1,160,881 100
ChongQing HongFuZhun Trading
Co., Ltd.
Hongfujin Precision Electronics (Chongqing)
Co., Ltd.
Note 2 Sales 272,605 86 60 days Note 1 Note 1 3,273 100
HongZhaoDa Integrated Innovative
Service (Kunshan) Co., Ltd.
Smart Top International Ltd. Note 2 Sales 1,607,783 100 45 days Note 1 Note 1 114,887 100
Competition Team Ireland Limited Foxconn CZ S.R.O. Note 2 Sales 479,025 1 45 days Note 1 Note 1 37,683 -
Competition Team Ireland Limited Fuhuajie Industrial (Shenzhen) Limited Note 2 Sales 177,579 - 60 days Note 1 Note 1 73,423 1
Competition Team Ireland Limited Hongfujin Precision Electronics (Chongqing)
Co., Ltd.
Note 2 Sales 10,387,851 17 60 days Note 1 Note 1 3,316,751 37
Competition Team Ireland Limited Fusing International Inc. Note 2 Sales 1,390,779 2 60 days Note 1 Note 1 329,013 4
Competition Team Ireland Limited Innolux Corporation (Formerly Chimei
Innolux Corporation)
Note 5 Sales 1,660,185 3 60 days Note 1 Note 1 25,538 -
Competition Team Ireland Limited Innocom Technology (Chongqing) Co., Ltd. Note 2 Sales 2,236,542 4 90 days Note 1 Note 1 275,733 3
Competition Team Ireland Limited Innolux Corporation (Formerly Chimei
Innolux Corporation)
Note 5 Purchases 4,582,419 10 60 days Note 1 Note 1 ( 1,092,306) ( 13)
WWW (Jincheng) Co., Ltd. Foxconn (Tianjin) Precision Industry Co., Ltd Note 2 Sales 101,597 3 90 days Note 1 Note 1 36,061 3
WWW (Jincheng) Co., Ltd. Hongfujin Precision Industry (Shenzhen) Co.,
Ltd.
Note 2 Sales 322,111 8 90 days Note 1 Note 1 242,188 23
WWW (Jincheng) Co., Ltd. Fuhonyang Precision Industrial (Shenzhen)
Co., Ltd.
Note 2 Sales 719,262 18 90 days Note 1 Note 1 341,383 33
WWW (Jincheng) Co., Ltd. Best Ever Industries Ltd. Note 2 Sales 304,077 8 60 days Note 1 Note 1 44,260 4
WWW (Jincheng) Co., Ltd. Fujin Precision Industrial (Jincheng) Co., Ltd. Note 2 Sales 346,107 9 90 days Note 1 Note 1 29,773 3
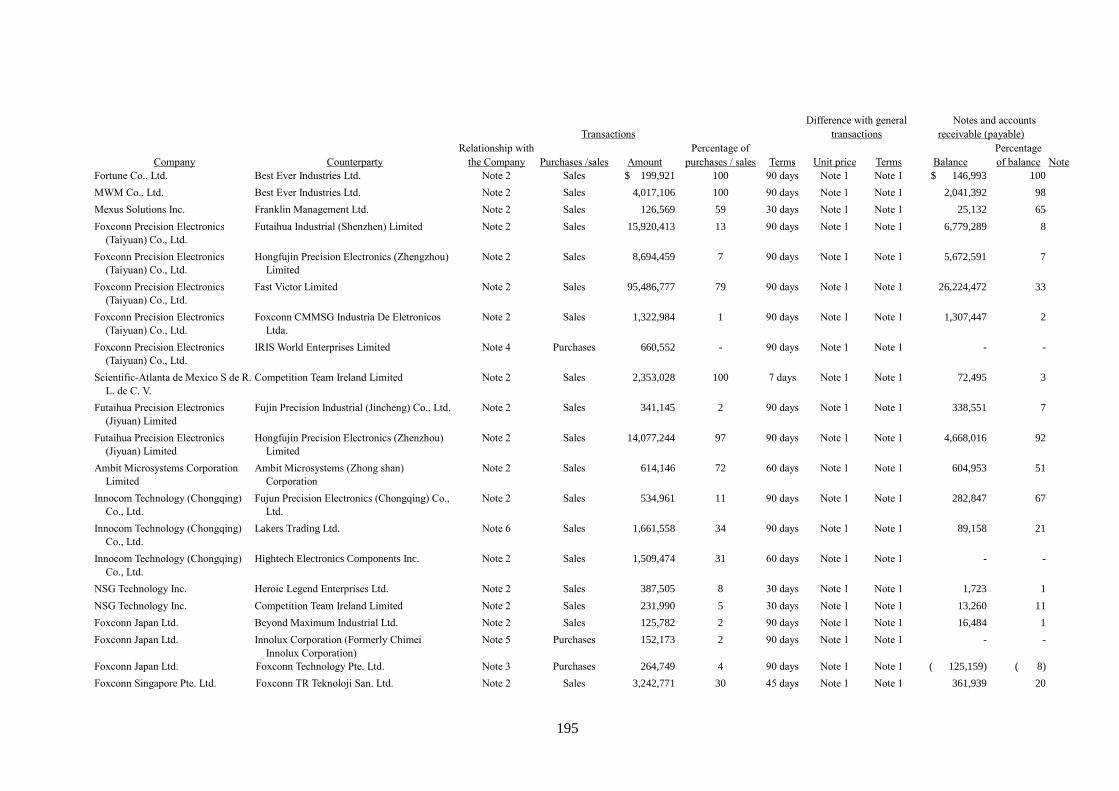
195
Difference with general Notes and accounts
Transactions transactions receivable (payable)
Relationship with Percentage of Percentage
Company Counterparty the Company Purchases /sales Amount purchases / sales Terms Unit price Terms Balance of balance Note
Fortune Co., Ltd. Best Ever Industries Ltd. Note 2 Sales $ 199,921 100 90 days Note 1 Note 1 $ 146,993 100
MWM Co., Ltd. Best Ever Industries Ltd. Note 2 Sales 4,017,106 100 90 days Note 1 Note 1 2,041,392 98
Mexus Solutions Inc. Franklin Management Ltd. Note 2 Sales 126,569 59 30 days Note 1 Note 1 25,132 65
Foxconn Precision Electronics
(Taiyuan) Co., Ltd.
Futaihua Industrial (Shenzhen) Limited Note 2 Sales 15,920,413 13 90 days Note 1 Note 1 6,779,289 8
Foxconn Precision Electronics
(Taiyuan) Co., Ltd.
Hongfujin Precision Electronics (Zhengzhou)
Limited
Note 2 Sales 8,694,459 7 90 days Note 1 Note 1 5,672,591 7
Foxconn Precision Electronics
(Taiyuan) Co., Ltd.
Fast Victor Limited Note 2 Sales 95,486,777 79 90 days Note 1 Note 1 26,224,472 33
Foxconn Precision Electronics
(Taiyuan) Co., Ltd.
Foxconn CMMSG Industria De Eletronicos
Ltda.
Note 2 Sales 1,322,984 1 90 days Note 1 Note 1 1,307,447 2
Foxconn Precision Electronics
(Taiyuan) Co., Ltd.
IRIS World Enterprises Limited Note 4 Purchases 660,552 - 90 days Note 1 Note 1 - -
Scientific-Atlanta de Mexico S de R.
L. de C. V.
Competition Team Ireland Limited Note 2 Sales 2,353,028 100 7 days Note 1 Note 1 72,495 3
Futaihua Precision Electronics
(Jiyuan) Limited
Fujin Precision Industrial (Jincheng) Co., Ltd. Note 2 Sales 341,145 2 90 days Note 1 Note 1 338,551 7
Futaihua Precision Electronics
(Jiyuan) Limited
Hongfujin Precision Electronics (Zhenzhou)
Limited
Note 2 Sales 14,077,244 97 90 days Note 1 Note 1 4,668,016 92
Ambit Microsystems Corporation
Limited
Ambit Microsystems (Zhong shan)
Corporation
Note 2 Sales 614,146 72 60 days Note 1 Note 1 604,953 51
Innocom Technology (Chongqing)
Co., Ltd.
Fujun Precision Electronics (Chongqing) Co.,
Ltd.
Note 2 Sales 534,961 11 90 days Note 1 Note 1 282,847 67
Innocom Technology (Chongqing)
Co., Ltd.
Lakers Trading Ltd. Note 6 Sales 1,661,558 34 90 days Note 1 Note 1 89,158 21
Innocom Technology (Chongqing)
Co., Ltd.
Hightech Electronics Components Inc. Note 2 Sales 1,509,474 31 60 days Note 1 Note 1 - -
NSG Technology Inc. Heroic Legend Enterprises Ltd. Note 2 Sales 387,505 8 30 days Note 1 Note 1 1,723 1
NSG Technology Inc. Competition Team Ireland Limited Note 2 Sales 231,990 5 30 days Note 1 Note 1 13,260 11
Foxconn Japan Ltd. Beyond Maximum Industrial Ltd. Note 2 Sales 125,782 2 90 days Note 1 Note 1 16,484 1
Foxconn Japan Ltd. Innolux Corporation (Formerly Chimei
Innolux Corporation)
Note 5 Purchases 152,173 2 90 days Note 1 Note 1 - -
Foxconn Japan Ltd. Foxconn Technology Pte. Ltd. Note 3 Purchases 264,749 4 90 days Note 1 Note 1 ( 125,159) ( 8)
Foxconn Singapore Pte. Ltd. Foxconn TR Teknoloji San. Ltd. Note 2 Sales 3,242,771 30 45 days Note 1 Note 1 361,939 20
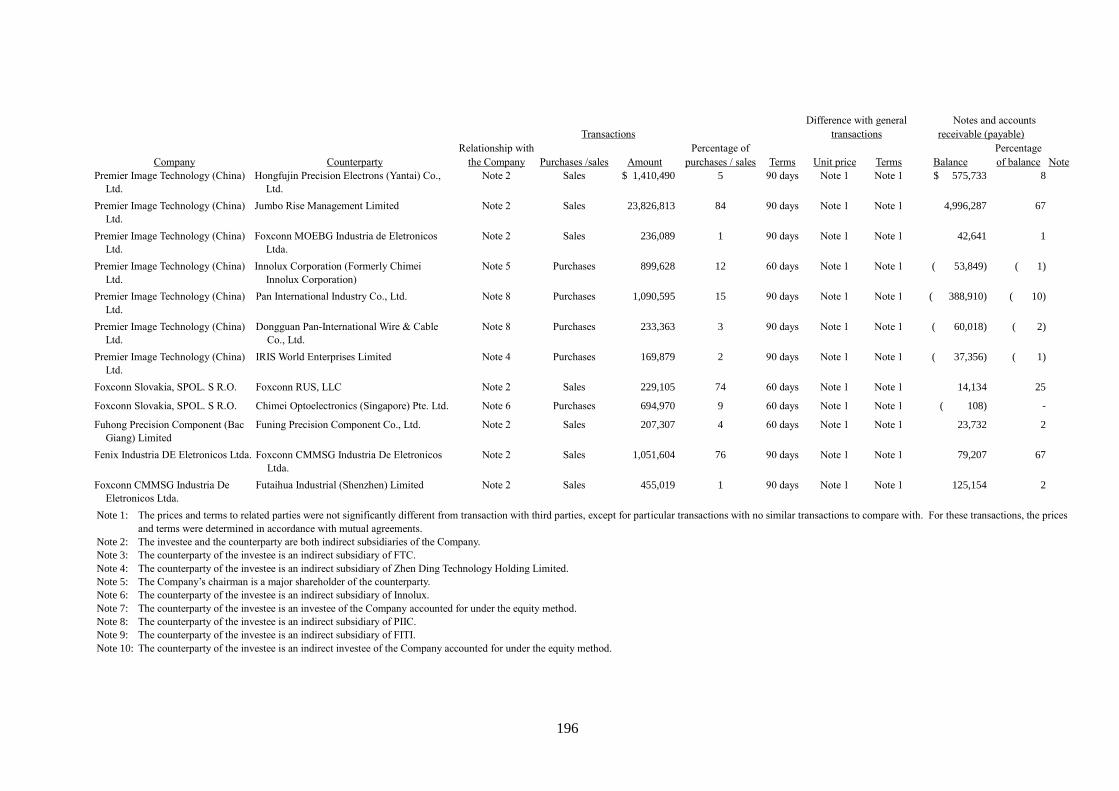
196
Difference with general Notes and accounts
Transactions transactions receivable (payable)
Relationship with Percentage of Percentage
Company Counterparty the Company Purchases /sales Amount purchases / sales Terms Unit price Terms Balance of balance Note
Premier Image Technology (China)
Ltd.
Hongfujin Precision Electrons (Yantai) Co.,
Ltd.
Note 2 Sales $ 1,410,490 5 90 days Note 1 Note 1 $ 575,733 8
Premier Image Technology (China)
Ltd.
Jumbo Rise Management Limited Note 2 Sales 23,826,813 84 90 days Note 1 Note 1 4,996,287 67
Premier Image Technology (China)
Ltd.
Foxconn MOEBG Industria de Eletronicos
Ltda.
Note 2 Sales 236,089 1 90 days Note 1 Note 1 42,641 1
Premier Image Technology (China)
Ltd.
Innolux Corporation (Formerly Chimei
Innolux Corporation)
Note 5 Purchases 899,628 12 60 days Note 1 Note 1 ( 53,849) ( 1)
Premier Image Technology (China)
Ltd.
Pan International Industry Co., Ltd. Note 8 Purchases 1,090,595 15 90 days Note 1 Note 1 ( 388,910) ( 10)
Premier Image Technology (China)
Ltd.
Dongguan Pan-International Wire & Cable
Co., Ltd.
Note 8 Purchases 233,363 3 90 days Note 1 Note 1 ( 60,018) ( 2)
Premier Image Technology (China)
Ltd.
IRIS World Enterprises Limited Note 4 Purchases 169,879 2 90 days Note 1 Note 1 ( 37,356) ( 1)
Foxconn Slovakia, SPOL. S R.O. Foxconn RUS, LLC Note 2 Sales 229,105 74 60 days Note 1 Note 1 14,134 25
Foxconn Slovakia, SPOL. S R.O. Chimei Optoelectronics (Singapore) Pte. Ltd. Note 6 Purchases 694,970 9 60 days Note 1 Note 1 ( 108) -
Fuhong Precision Component (Bac
Giang) Limited
Funing Precision Component Co., Ltd. Note 2 Sales 207,307 4 60 days Note 1 Note 1 23,732 2
Fenix Industria DE Eletronicos Ltda. Foxconn CMMSG Industria De Eletronicos
Ltda.
Note 2 Sales 1,051,604 76 90 days Note 1 Note 1 79,207 67
Foxconn CMMSG Industria De
Eletronicos Ltda.
Futaihua Industrial (Shenzhen) Limited Note 2 Sales 455,019 1 90 days Note 1 Note 1 125,154 2
Note 1: The prices and terms to related parties were not significantly different from transaction with third parties, except for particular transactions with no similar transactions to compare with. For these transactions, the prices
and terms were determined in accordance with mutual agreements.
Note 2: The investee and the counterparty are both indirect subsidiaries of the Company.
Note 3: The counterparty of the investee is an indirect subsidiary of FTC.
Note 4: The counterparty of the investee is an indirect subsidiary of Zhen Ding Technology Holding Limited.
Note 5: The Company’s chairman is a major shareholder of the counterparty.
Note 6: The counterparty of the investee is an indirect subsidiary of Innolux.
Note 7: The counterparty of the investee is an investee of the Company accounted for under the equity method.
Note 8: The counterparty of the investee is an indirect subsidiary of PIIC.
Note 9: The counterparty of the investee is an indirect subsidiary of FITI.
Note 10: The counterparty of the investee is an indirect investee of the Company accounted for under the equity method.
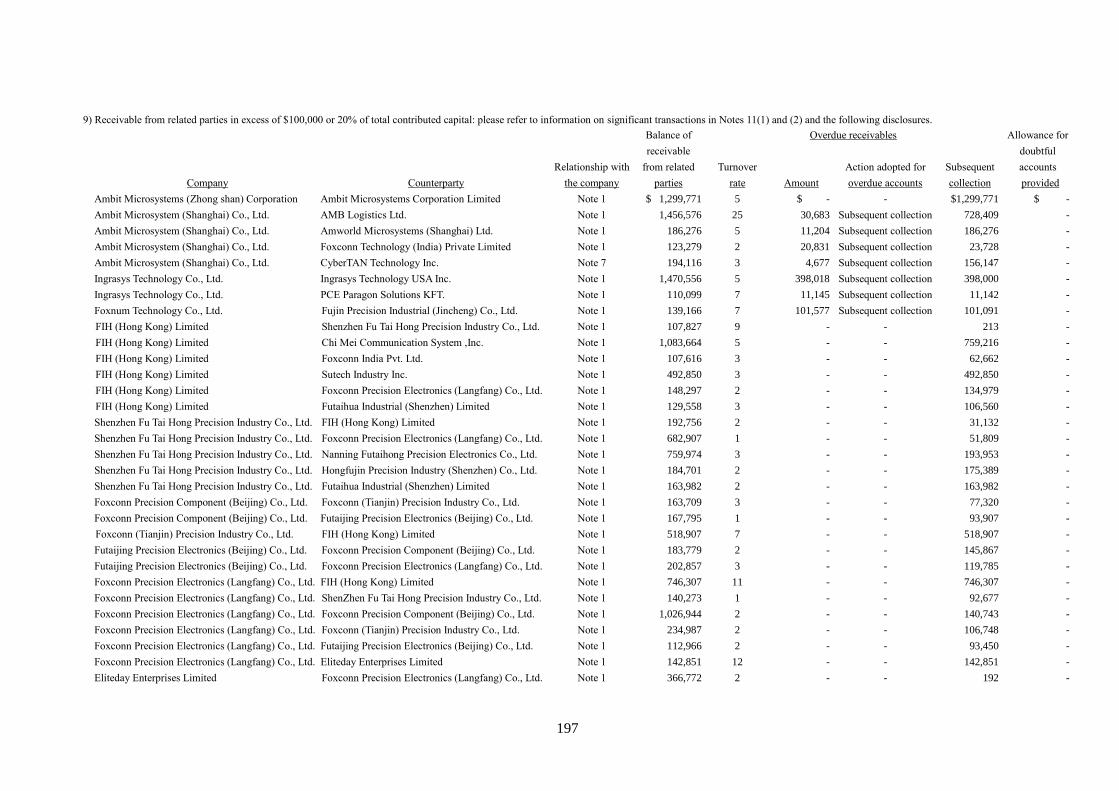
197
9) Receivable from related parties in excess of $100,000 or 20% of total contributed capital: please refer to information on significant transactions in Notes 11(1) and (2) and the following disclosures.
Balance of Overdue receivables Allowance for
receivable doubtful
Relationship with from related Turnover Action adopted for Subsequent accounts
Company Counterparty the company parties rate Amount overdue accounts collection provided
Ambit Microsystems (Zhong shan) Corporation Ambit Microsystems Corporation Limited Note 1 $ 1,299,771 5 $ - - $1,299,771 $ -
Ambit Microsystem (Shanghai) Co., Ltd. AMB Logistics Ltd. Note 1 1,456,576 25 30,683 Subsequent collection 728,409 -
Ambit Microsystem (Shanghai) Co., Ltd. Amworld Microsystems (Shanghai) Ltd. Note 1 186,276 5 11,204 Subsequent collection 186,276 -
Ambit Microsystem (Shanghai) Co., Ltd. Foxconn Technology (India) Private Limited Note 1 123,279 2 20,831 Subsequent collection 23,728 -
Ambit Microsystem (Shanghai) Co., Ltd. CyberTAN Technology Inc. Note 7 194,116 3 4,677 Subsequent collection 156,147 -
Ingrasys Technology Co., Ltd. Ingrasys Technology USA Inc. Note 1 1,470,556 5 398,018 Subsequent collection 398,000 -
Ingrasys Technology Co., Ltd. PCE Paragon Solutions KFT. Note 1 110,099 7 11,145 Subsequent collection 11,142 -
Foxnum Technology Co., Ltd. Fujin Precision Industrial (Jincheng) Co., Ltd. Note 1 139,166 7 101,577 Subsequent collection 101,091 -
FIH (Hong Kong) Limited Shenzhen Fu Tai Hong Precision Industry Co., Ltd. Note 1 107,827 9 - - 213 -
FIH (Hong Kong) Limited Chi Mei Communication System ,Inc. Note 1 1,083,664 5 - - 759,216 -
FIH (Hong Kong) Limited Foxconn India Pvt. Ltd. Note 1 107,616 3 - - 62,662 -
FIH (Hong Kong) Limited Sutech Industry Inc. Note 1 492,850 3 - - 492,850 -
FIH (Hong Kong) Limited Foxconn Precision Electronics (Langfang) Co., Ltd. Note 1 148,297 2 - - 134,979 -
FIH (Hong Kong) Limited Futaihua Industrial (Shenzhen) Limited Note 1 129,558 3 - - 106,560 -
Shenzhen Fu Tai Hong Precision Industry Co., Ltd. FIH (Hong Kong) Limited Note 1 192,756 2 - - 31,132 -
Shenzhen Fu Tai Hong Precision Industry Co., Ltd. Foxconn Precision Electronics (Langfang) Co., Ltd. Note 1 682,907 1 - - 51,809 -
Shenzhen Fu Tai Hong Precision Industry Co., Ltd. Nanning Futaihong Precision Electronics Co., Ltd. Note 1 759,974 3 - - 193,953 -
Shenzhen Fu Tai Hong Precision Industry Co., Ltd. Hongfujin Precision Industry (Shenzhen) Co., Ltd. Note 1 184,701 2 - - 175,389 -
Shenzhen Fu Tai Hong Precision Industry Co., Ltd. Futaihua Industrial (Shenzhen) Limited Note 1 163,982 2 - - 163,982 -
Foxconn Precision Component (Beijing) Co., Ltd. Foxconn (Tianjin) Precision Industry Co., Ltd. Note 1 163,709 3 - - 77,320 -
Foxconn Precision Component (Beijing) Co., Ltd. Futaijing Precision Electronics (Beijing) Co., Ltd. Note 1 167,795 1 - - 93,907 -
Foxconn (Tianjin) Precision Industry Co., Ltd. FIH (Hong Kong) Limited Note 1 518,907 7 - - 518,907 -
Futaijing Precision Electronics (Beijing) Co., Ltd. Foxconn Precision Component (Beijing) Co., Ltd. Note 1 183,779 2 - - 145,867 -
Futaijing Precision Electronics (Beijing) Co., Ltd. Foxconn Precision Electronics (Langfang) Co., Ltd. Note 1 202,857 3 - - 119,785 -
Foxconn Precision Electronics (Langfang) Co., Ltd. FIH (Hong Kong) Limited Note 1 746,307 11 - - 746,307 -
Foxconn Precision Electronics (Langfang) Co., Ltd. ShenZhen Fu Tai Hong Precision Industry Co., Ltd. Note 1 140,273 1 - - 92,677 -
Foxconn Precision Electronics (Langfang) Co., Ltd. Foxconn Precision Component (Beijing) Co., Ltd. Note 1 1,026,944 2 - - 140,743 -
Foxconn Precision Electronics (Langfang) Co., Ltd. Foxconn (Tianjin) Precision Industry Co., Ltd. Note 1 234,987 2 - - 106,748 -
Foxconn Precision Electronics (Langfang) Co., Ltd. Futaijing Precision Electronics (Beijing) Co., Ltd. Note 1 112,966 2 - - 93,450 -
Foxconn Precision Electronics (Langfang) Co., Ltd. Eliteday Enterprises Limited Note 1 142,851 12 - - 142,851 -
Eliteday Enterprises Limited Foxconn Precision Electronics (Langfang) Co., Ltd. Note 1 366,772 2 - - 192 -
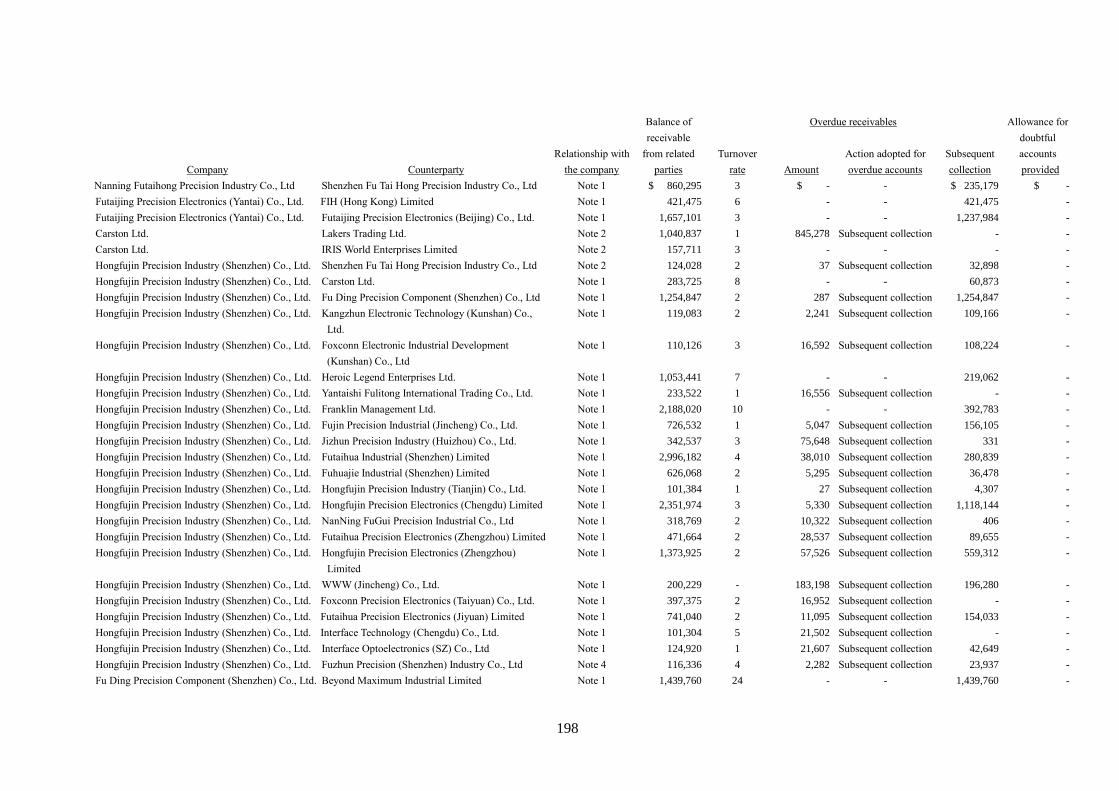
198
Balance of Overdue receivables Allowance for
receivable doubtful
Relationship with from related Turnover Action adopted for Subsequent accounts
Company Counterparty the company parties rate Amount overdue accounts collection provided
Nanning Futaihong Precision Industry Co., Ltd Shenzhen Fu Tai Hong Precision Industry Co., Ltd Note 1 $ 860,295 3 $ - - $ 235,179 $ -
Futaijing Precision Electronics (Yantai) Co., Ltd. FIH (Hong Kong) Limited Note 1 421,475 6 - - 421,475 -
Futaijing Precision Electronics (Yantai) Co., Ltd. Futaijing Precision Electronics (Beijing) Co., Ltd. Note 1 1,657,101 3 - - 1,237,984 -
Carston Ltd. Lakers Trading Ltd. Note 2 1,040,837 1 845,278 Subsequent collection - -
Carston Ltd. IRIS World Enterprises Limited Note 2 157,711 3 - - - -
Hongfujin Precision Industry (Shenzhen) Co., Ltd. Shenzhen Fu Tai Hong Precision Industry Co., Ltd Note 2 124,028 2 37 Subsequent collection 32,898 -
Hongfujin Precision Industry (Shenzhen) Co., Ltd. Carston Ltd. Note 1 283,725 8 - - 60,873 -
Hongfujin Precision Industry (Shenzhen) Co., Ltd. Fu Ding Precision Component (Shenzhen) Co., Ltd Note 1 1,254,847 2 287 Subsequent collection 1,254,847 -
Hongfujin Precision Industry (Shenzhen) Co., Ltd. Kangzhun Electronic Technology (Kunshan) Co., Note 1 119,083 2 2,241 Subsequent collection 109,166 -
Ltd.
Hongfujin Precision Industry (Shenzhen) Co., Ltd. Foxconn Electronic Industrial Development Note 1 110,126 3 16,592 Subsequent collection 108,224 -
(Kunshan) Co., Ltd
Hongfujin Precision Industry (Shenzhen) Co., Ltd. Heroic Legend Enterprises Ltd. Note 1 1,053,441 7 - - 219,062 -
Hongfujin Precision Industry (Shenzhen) Co., Ltd. Yantaishi Fulitong International Trading Co., Ltd. Note 1 233,522 1 16,556 Subsequent collection - -
Hongfujin Precision Industry (Shenzhen) Co., Ltd. Franklin Management Ltd. Note 1 2,188,020 10 - - 392,783 -
Hongfujin Precision Industry (Shenzhen) Co., Ltd. Fujin Precision Industrial (Jincheng) Co., Ltd. Note 1 726,532 1 5,047 Subsequent collection 156,105 -
Hongfujin Precision Industry (Shenzhen) Co., Ltd. Jizhun Precision Industry (Huizhou) Co., Ltd. Note 1 342,537 3 75,648 Subsequent collection 331 -
Hongfujin Precision Industry (Shenzhen) Co., Ltd. Futaihua Industrial (Shenzhen) Limited Note 1 2,996,182 4 38,010 Subsequent collection 280,839 -
Hongfujin Precision Industry (Shenzhen) Co., Ltd. Fuhuajie Industrial (Shenzhen) Limited Note 1 626,068 2 5,295 Subsequent collection 36,478 -
Hongfujin Precision Industry (Shenzhen) Co., Ltd. Hongfujin Precision Industry (Tianjin) Co., Ltd. Note 1 101,384 1 27 Subsequent collection 4,307 -
Hongfujin Precision Industry (Shenzhen) Co., Ltd. Hongfujin Precision Electronics (Chengdu) Limited Note 1 2,351,974 3 5,330 Subsequent collection 1,118,144 -
Hongfujin Precision Industry (Shenzhen) Co., Ltd. NanNing FuGui Precision Industrial Co., Ltd Note 1 318,769 2 10,322 Subsequent collection 406 -
Hongfujin Precision Industry (Shenzhen) Co., Ltd. Futaihua Precision Electronics (Zhengzhou) Limited Note 1 471,664 2 28,537 Subsequent collection 89,655 -
Hongfujin Precision Industry (Shenzhen) Co., Ltd. Hongfujin Precision Electronics (Zhengzhou) Note 1 1,373,925 2 57,526 Subsequent collection 559,312 -
Limited
Hongfujin Precision Industry (Shenzhen) Co., Ltd. WWW (Jincheng) Co., Ltd. Note 1 200,229 - 183,198 Subsequent collection 196,280 -
Hongfujin Precision Industry (Shenzhen) Co., Ltd. Foxconn Precision Electronics (Taiyuan) Co., Ltd. Note 1 397,375 2 16,952 Subsequent collection - -
Hongfujin Precision Industry (Shenzhen) Co., Ltd. Futaihua Precision Electronics (Jiyuan) Limited Note 1 741,040 2 11,095 Subsequent collection 154,033 -
Hongfujin Precision Industry (Shenzhen) Co., Ltd. Interface Technology (Chengdu) Co., Ltd. Note 1 101,304 5 21,502 Subsequent collection - -
Hongfujin Precision Industry (Shenzhen) Co., Ltd. Interface Optoelectronics (SZ) Co., Ltd Note 1 124,920 1 21,607 Subsequent collection 42,649 -
Hongfujin Precision Industry (Shenzhen) Co., Ltd. Fuzhun Precision (Shenzhen) Industry Co., Ltd Note 4 116,336 4 2,282 Subsequent collection 23,937 -
Fu Ding Precision Component (Shenzhen) Co., Ltd. Beyond Maximum Industrial Limited Note 1 1,439,760 24 - - 1,439,760 -
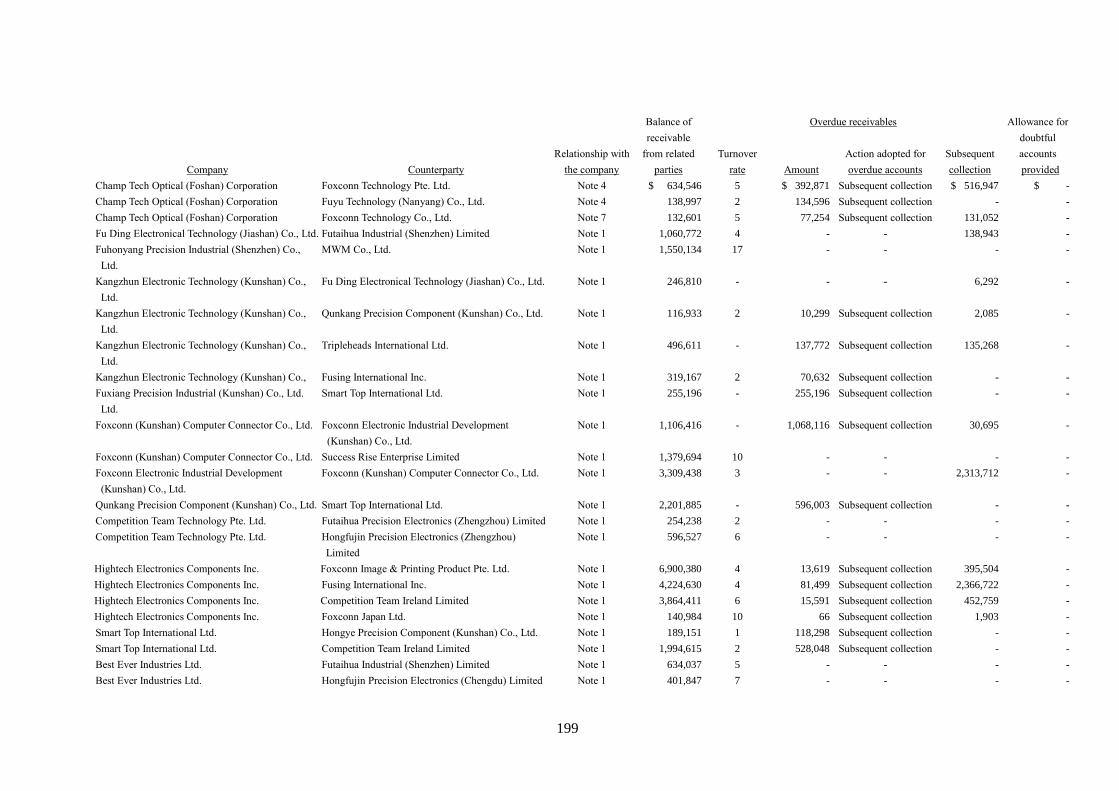
199
Balance of Overdue receivables Allowance for
receivable doubtful
Relationship with from related Turnover Action adopted for Subsequent accounts
Company Counterparty the company parties rate Amount overdue accounts collection provided
Champ Tech Optical (Foshan) Corporation Foxconn Technology Pte. Ltd. Note 4 $ 634,546 5 $ 392,871 Subsequent collection $ 516,947 $ -
Champ Tech Optical (Foshan) Corporation Fuyu Technology (Nanyang) Co., Ltd. Note 4 138,997 2 134,596 Subsequent collection - -
Champ Tech Optical (Foshan) Corporation Foxconn Technology Co., Ltd. Note 7 132,601 5 77,254 Subsequent collection 131,052 -
Fu Ding Electronical Technology (Jiashan) Co., Ltd. Futaihua Industrial (Shenzhen) Limited Note 1 1,060,772 4 - - 138,943 -
Fuhonyang Precision Industrial (Shenzhen) Co., MWM Co., Ltd. Note 1 1,550,134 17 - - - -
Ltd.
Kangzhun Electronic Technology (Kunshan) Co., Fu Ding Electronical Technology (Jiashan) Co., Ltd. Note 1 246,810 - - - 6,292 -
Ltd.
Kangzhun Electronic Technology (Kunshan) Co., Qunkang Precision Component (Kunshan) Co., Ltd. Note 1 116,933 2 10,299 Subsequent collection 2,085 -
Ltd.
Kangzhun Electronic Technology (Kunshan) Co., Tripleheads International Ltd. Note 1 496,611 - 137,772 Subsequent collection 135,268 -
Ltd.
Kangzhun Electronic Technology (Kunshan) Co., Fusing International Inc. Note 1 319,167 2 70,632 Subsequent collection - -
Fuxiang Precision Industrial (Kunshan) Co., Ltd. Smart Top International Ltd. Note 1 255,196 - 255,196 Subsequent collection - -
Ltd.
Foxconn (Kunshan) Computer Connector Co., Ltd. Foxconn Electronic Industrial Development Note 1 1,106,416 - 1,068,116 Subsequent collection 30,695 -
(Kunshan) Co., Ltd.
Foxconn (Kunshan) Computer Connector Co., Ltd. Success Rise Enterprise Limited Note 1 1,379,694 10 - - - -
Foxconn Electronic Industrial Development Foxconn (Kunshan) Computer Connector Co., Ltd. Note 1 3,309,438 3 - - 2,313,712 -
(Kunshan) Co., Ltd.
Qunkang Precision Component (Kunshan) Co., Ltd. Smart Top International Ltd. Note 1 2,201,885 - 596,003 Subsequent collection - -
Competition Team Technology Pte. Ltd. Futaihua Precision Electronics (Zhengzhou) Limited Note 1 254,238 2 - - - -
Competition Team Technology Pte. Ltd. Hongfujin Precision Electronics (Zhengzhou) Note 1 596,527 6 - - - -
Limited
Hightech Electronics Components Inc. Foxconn Image & Printing Product Pte. Ltd. Note 1 6,900,380 4 13,619 Subsequent collection 395,504 -
Hightech Electronics Components Inc. Fusing International Inc. Note 1 4,224,630 4 81,499 Subsequent collection 2,366,722 -
Hightech Electronics Components Inc. Competition Team Ireland Limited Note 1 3,864,411 6 15,591 Subsequent collection 452,759 -
Hightech Electronics Components Inc. Foxconn Japan Ltd. Note 1 140,984 10 66 Subsequent collection 1,903 -
Smart Top International Ltd. Hongye Precision Component (Kunshan) Co., Ltd. Note 1 189,151 1 118,298 Subsequent collection - -
Smart Top International Ltd. Competition Team Ireland Limited Note 1 1,994,615 2 528,048 Subsequent collection - -
Best Ever Industries Ltd. Futaihua Industrial (Shenzhen) Limited Note 1 634,037 5 - - - -
Best Ever Industries Ltd. Hongfujin Precision Electronics (Chengdu) Limited Note 1 401,847 7 - - - -
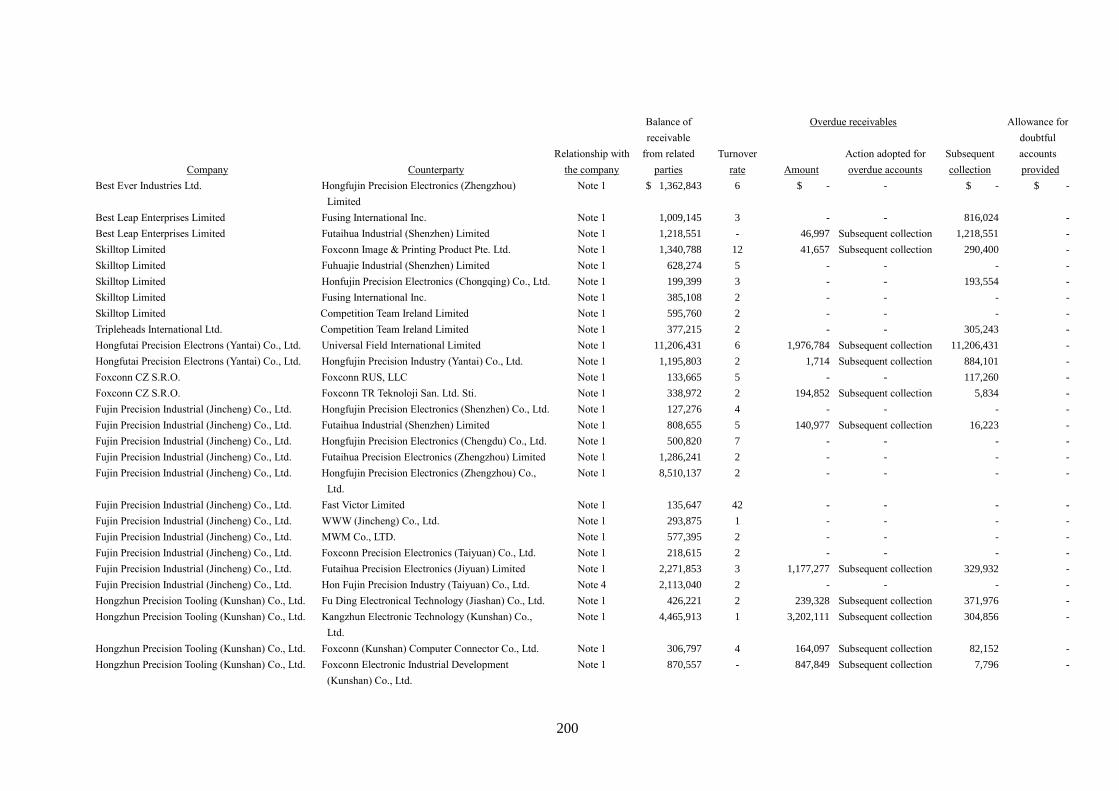
200
Balance of Overdue receivables Allowance for
receivable doubtful
Relationship with from related Turnover Action adopted for Subsequent accounts
Company Counterparty the company parties rate Amount overdue accounts collection provided
Best Ever Industries Ltd. Hongfujin Precision Electronics (Zhengzhou) Note 1 $ 1,362,843 6 $ - - $ - $ -
Limited
Best Leap Enterprises Limited Fusing International Inc. Note 1 1,009,145 3 - - 816,024 -
Best Leap Enterprises Limited Futaihua Industrial (Shenzhen) Limited Note 1 1,218,551 - 46,997 Subsequent collection 1,218,551 -
Skilltop Limited Foxconn Image & Printing Product Pte. Ltd. Note 1 1,340,788 12 41,657 Subsequent collection 290,400 -
Skilltop Limited Fuhuajie Industrial (Shenzhen) Limited Note 1 628,274 5 - - - -
Skilltop Limited Honfujin Precision Electronics (Chongqing) Co., Ltd. Note 1 199,399 3 - - 193,554 -
Skilltop Limited Fusing International Inc. Note 1 385,108 2 - - - -
Skilltop Limited Competition Team Ireland Limited Note 1 595,760 2 - - - -
Tripleheads International Ltd. Competition Team Ireland Limited Note 1 377,215 2 - - 305,243 -
Hongfutai Precision Electrons (Yantai) Co., Ltd. Universal Field International Limited Note 1 11,206,431 6 1,976,784 Subsequent collection 11,206,431 -
Hongfutai Precision Electrons (Yantai) Co., Ltd. Hongfujin Precision Industry (Yantai) Co., Ltd. Note 1 1,195,803 2 1,714 Subsequent collection 884,101 -
Foxconn CZ S.R.O. Foxconn RUS, LLC Note 1 133,665 5 - - 117,260 -
Foxconn CZ S.R.O. Foxconn TR Teknoloji San. Ltd. Sti. Note 1 338,972 2 194,852 Subsequent collection 5,834 -
Fujin Precision Industrial (Jincheng) Co., Ltd. Hongfujin Precision Electronics (Shenzhen) Co., Ltd. Note 1 127,276 4 - - - -
Fujin Precision Industrial (Jincheng) Co., Ltd. Futaihua Industrial (Shenzhen) Limited Note 1 808,655 5 140,977 Subsequent collection 16,223 -
Fujin Precision Industrial (Jincheng) Co., Ltd. Hongfujin Precision Electronics (Chengdu) Co., Ltd. Note 1 500,820 7 - - - -
Fujin Precision Industrial (Jincheng) Co., Ltd. Futaihua Precision Electronics (Zhengzhou) Limited Note 1 1,286,241 2 - - - -
Fujin Precision Industrial (Jincheng) Co., Ltd. Hongfujin Precision Electronics (Zhengzhou) Co., Note 1 8,510,137 2 - - - -
Ltd.
Fujin Precision Industrial (Jincheng) Co., Ltd. Fast Victor Limited Note 1 135,647 42 - - - -
Fujin Precision Industrial (Jincheng) Co., Ltd. WWW (Jincheng) Co., Ltd. Note 1 293,875 1 - - - -
Fujin Precision Industrial (Jincheng) Co., Ltd. MWM Co., LTD. Note 1 577,395 2 - - - -
Fujin Precision Industrial (Jincheng) Co., Ltd. Foxconn Precision Electronics (Taiyuan) Co., Ltd. Note 1 218,615 2 - - - -
Fujin Precision Industrial (Jincheng) Co., Ltd. Futaihua Precision Electronics (Jiyuan) Limited Note 1 2,271,853 3 1,177,277 Subsequent collection 329,932 -
Fujin Precision Industrial (Jincheng) Co., Ltd. Hon Fujin Precision Industry (Taiyuan) Co., Ltd. Note 4 2,113,040 2 - - - -
Hongzhun Precision Tooling (Kunshan) Co., Ltd. Fu Ding Electronical Technology (Jiashan) Co., Ltd. Note 1 426,221 2 239,328 Subsequent collection 371,976 -
Hongzhun Precision Tooling (Kunshan) Co., Ltd. Kangzhun Electronic Technology (Kunshan) Co., Note 1 4,465,913 1 3,202,111 Subsequent collection 304,856 -
Ltd.
Hongzhun Precision Tooling (Kunshan) Co., Ltd. Foxconn (Kunshan) Computer Connector Co., Ltd. Note 1 306,797 4 164,097 Subsequent collection 82,152 -
Hongzhun Precision Tooling (Kunshan) Co., Ltd. Foxconn Electronic Industrial Development Note 1 870,557 - 847,849 Subsequent collection 7,796 -
(Kunshan) Co., Ltd.
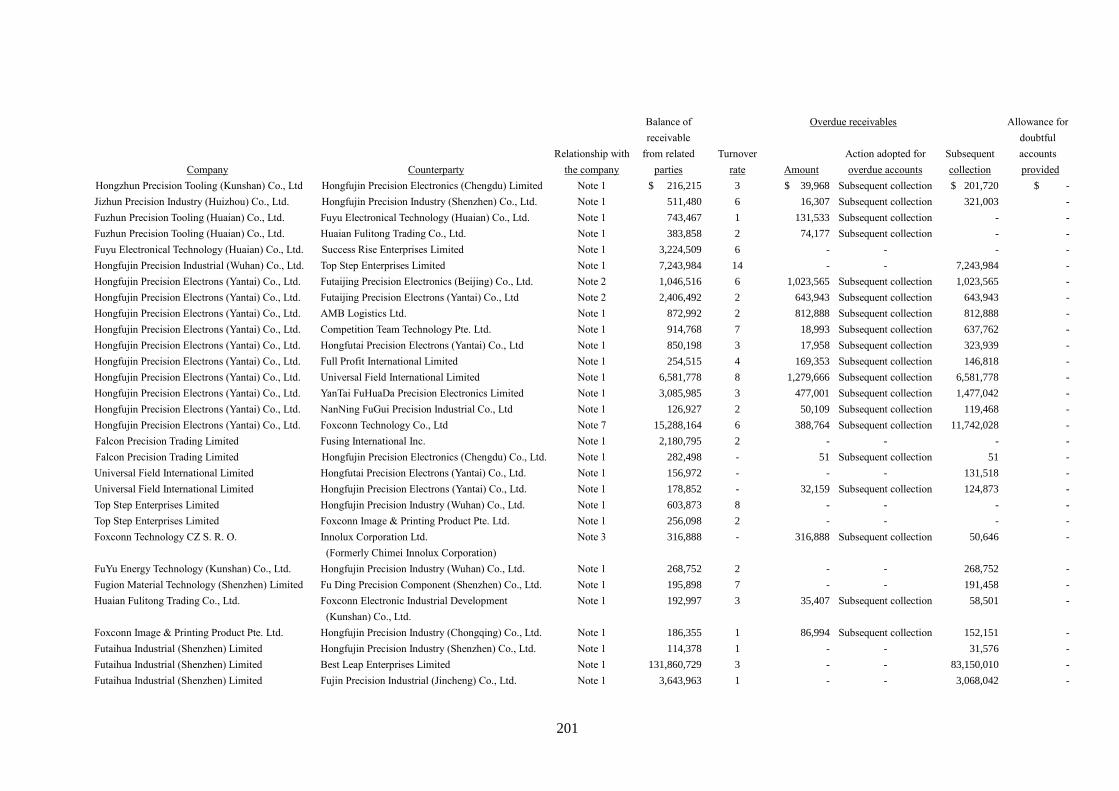
201
Balance of Overdue receivables Allowance for
receivable doubtful
Relationship with from related Turnover Action adopted for Subsequent accounts
Company Counterparty the company parties rate Amount overdue accounts collection provided
Hongzhun Precision Tooling (Kunshan) Co., Ltd Hongfujin Precision Electronics (Chengdu) Limited Note 1 $ 216,215 3 $ 39,968 Subsequent collection $ 201,720 $ -
Jizhun Precision Industry (Huizhou) Co., Ltd. Hongfujin Precision Industry (Shenzhen) Co., Ltd. Note 1 511,480 6 16,307 Subsequent collection 321,003 -
Fuzhun Precision Tooling (Huaian) Co., Ltd. Fuyu Electronical Technology (Huaian) Co., Ltd. Note 1 743,467 1 131,533 Subsequent collection - -
Fuzhun Precision Tooling (Huaian) Co., Ltd. Huaian Fulitong Trading Co., Ltd. Note 1 383,858 2 74,177 Subsequent collection - -
Fuyu Electronical Technology (Huaian) Co., Ltd. Success Rise Enterprises Limited Note 1 3,224,509 6 - - - -
Hongfujin Precision Industrial (Wuhan) Co., Ltd. Top Step Enterprises Limited Note 1 7,243,984 14 - - 7,243,984 -
Hongfujin Precision Electrons (Yantai) Co., Ltd. Futaijing Precision Electronics (Beijing) Co., Ltd. Note 2 1,046,516 6 1,023,565 Subsequent collection 1,023,565 -
Hongfujin Precision Electrons (Yantai) Co., Ltd. Futaijing Precision Electrons (Yantai) Co., Ltd Note 2 2,406,492 2 643,943 Subsequent collection 643,943 -
Hongfujin Precision Electrons (Yantai) Co., Ltd. AMB Logistics Ltd. Note 1 872,992 2 812,888 Subsequent collection 812,888 -
Hongfujin Precision Electrons (Yantai) Co., Ltd. Competition Team Technology Pte. Ltd. Note 1 914,768 7 18,993 Subsequent collection 637,762 -
Hongfujin Precision Electrons (Yantai) Co., Ltd. Hongfutai Precision Electrons (Yantai) Co., Ltd Note 1 850,198 3 17,958 Subsequent collection 323,939 -
Hongfujin Precision Electrons (Yantai) Co., Ltd. Full Profit International Limited Note 1 254,515 4 169,353 Subsequent collection 146,818 -
Hongfujin Precision Electrons (Yantai) Co., Ltd. Universal Field International Limited Note 1 6,581,778 8 1,279,666 Subsequent collection 6,581,778 -
Hongfujin Precision Electrons (Yantai) Co., Ltd. YanTai FuHuaDa Precision Electronics Limited Note 1 3,085,985 3 477,001 Subsequent collection 1,477,042 -
Hongfujin Precision Electrons (Yantai) Co., Ltd. NanNing FuGui Precision Industrial Co., Ltd Note 1 126,927 2 50,109 Subsequent collection 119,468 -
Hongfujin Precision Electrons (Yantai) Co., Ltd. Foxconn Technology Co., Ltd Note 7 15,288,164 6 388,764 Subsequent collection 11,742,028 -
Falcon Precision Trading Limited Fusing International Inc. Note 1 2,180,795 2 - - - -
Falcon Precision Trading Limited Hongfujin Precision Electronics (Chengdu) Co., Ltd. Note 1 282,498 - 51 Subsequent collection 51 -
Universal Field International Limited Hongfutai Precision Electrons (Yantai) Co., Ltd. Note 1 156,972 - - - 131,518 -
Universal Field International Limited Hongfujin Precision Electrons (Yantai) Co., Ltd. Note 1 178,852 - 32,159 Subsequent collection 124,873 -
Top Step Enterprises Limited Hongfujin Precision Industry (Wuhan) Co., Ltd. Note 1 603,873 8 - - - -
Top Step Enterprises Limited Foxconn Image & Printing Product Pte. Ltd. Note 1 256,098 2 - - - -
Foxconn Technology CZ S. R. O. Innolux Corporation Ltd. Note 3 316,888 - 316,888 Subsequent collection 50,646 -
(Formerly Chimei Innolux Corporation)
FuYu Energy Technology (Kunshan) Co., Ltd. Hongfujin Precision Industry (Wuhan) Co., Ltd. Note 1 268,752 2 - - 268,752 -
Fugion Material Technology (Shenzhen) Limited Fu Ding Precision Component (Shenzhen) Co., Ltd. Note 1 195,898 7 - - 191,458 -
Huaian Fulitong Trading Co., Ltd. Foxconn Electronic Industrial Development Note 1 192,997 3 35,407 Subsequent collection 58,501 -
(Kunshan) Co., Ltd.
Foxconn Image & Printing Product Pte. Ltd. Hongfujin Precision Industry (Chongqing) Co., Ltd. Note 1 186,355 1 86,994 Subsequent collection 152,151 -
Futaihua Industrial (Shenzhen) Limited Hongfujin Precision Industry (Shenzhen) Co., Ltd. Note 1 114,378 1 - - 31,576 -
Futaihua Industrial (Shenzhen) Limited Best Leap Enterprises Limited Note 1 131,860,729 3 - - 83,150,010 -
Futaihua Industrial (Shenzhen) Limited Fujin Precision Industrial (Jincheng) Co., Ltd. Note 1 3,643,963 1 - - 3,068,042 -
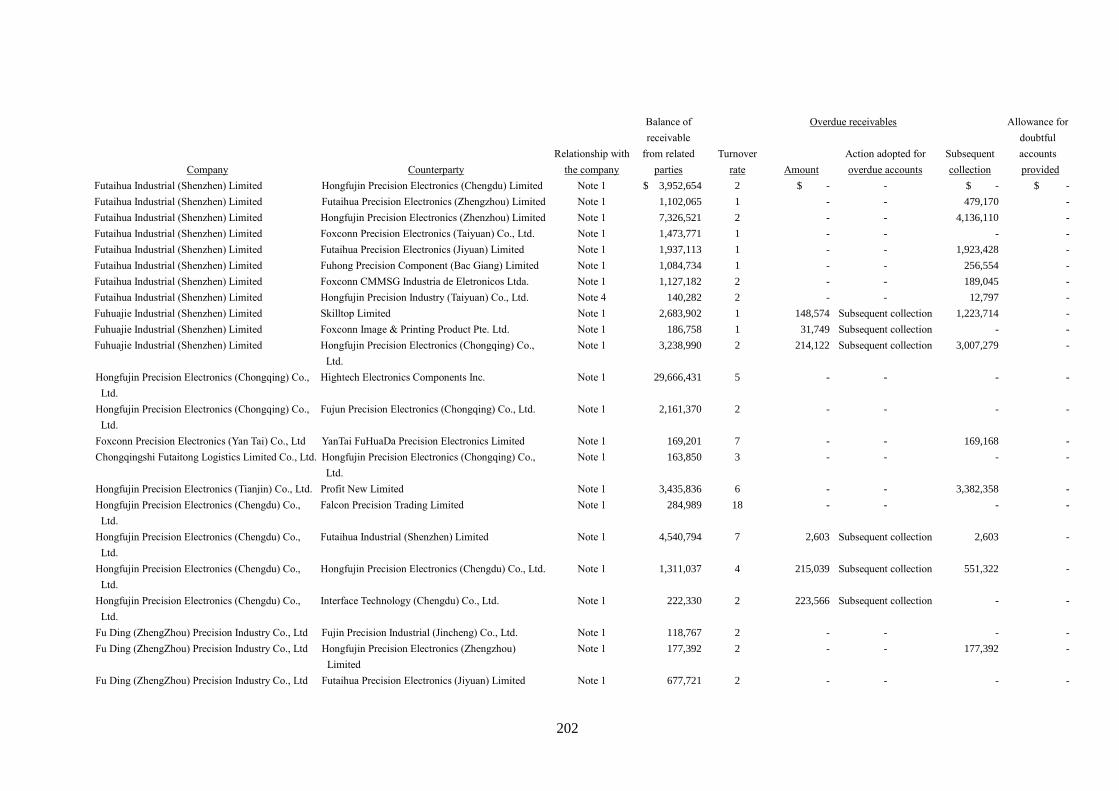
202
Balance of Overdue receivables Allowance for
receivable doubtful
Relationship with from related Turnover Action adopted for Subsequent accounts
Company Counterparty the company parties rate Amount overdue accounts collection provided
Futaihua Industrial (Shenzhen) Limited Hongfujin Precision Electronics (Chengdu) Limited Note 1 $ 3,952,654 2 $ - - $ - $ -
Futaihua Industrial (Shenzhen) Limited Futaihua Precision Electronics (Zhengzhou) Limited Note 1 1,102,065 1 - - 479,170 -
Futaihua Industrial (Shenzhen) Limited Hongfujin Precision Electronics (Zhenzhou) Limited Note 1 7,326,521 2 - - 4,136,110 -
Futaihua Industrial (Shenzhen) Limited Foxconn Precision Electronics (Taiyuan) Co., Ltd. Note 1 1,473,771 1 - - - -
Futaihua Industrial (Shenzhen) Limited Futaihua Precision Electronics (Jiyuan) Limited Note 1 1,937,113 1 - - 1,923,428 -
Futaihua Industrial (Shenzhen) Limited Fuhong Precision Component (Bac Giang) Limited Note 1 1,084,734 1 - - 256,554 -
Futaihua Industrial (Shenzhen) Limited Foxconn CMMSG Industria de Eletronicos Ltda. Note 1 1,127,182 2 - - 189,045 -
Futaihua Industrial (Shenzhen) Limited Hongfujin Precision Industry (Taiyuan) Co., Ltd. Note 4 140,282 2 - - 12,797 -
Fuhuajie Industrial (Shenzhen) Limited Skilltop Limited Note 1 2,683,902 1 148,574 Subsequent collection 1,223,714 -
Fuhuajie Industrial (Shenzhen) Limited Foxconn Image & Printing Product Pte. Ltd. Note 1 186,758 1 31,749 Subsequent collection - -
Fuhuajie Industrial (Shenzhen) Limited Hongfujin Precision Electronics (Chongqing) Co., Note 1 3,238,990 2 214,122 Subsequent collection 3,007,279 -
Ltd.
Hongfujin Precision Electronics (Chongqing) Co., Hightech Electronics Components Inc. Note 1 29,666,431 5 - - - -
Ltd.
Hongfujin Precision Electronics (Chongqing) Co., Fujun Precision Electronics (Chongqing) Co., Ltd. Note 1 2,161,370 2 - - - -
Ltd.
Foxconn Precision Electronics (Yan Tai) Co., Ltd YanTai FuHuaDa Precision Electronics Limited Note 1 169,201 7 - - 169,168 -
Chongqingshi Futaitong Logistics Limited Co., Ltd. Hongfujin Precision Electronics (Chongqing) Co., Note 1 163,850 3 - - - -
Ltd.
Hongfujin Precision Electronics (Tianjin) Co., Ltd. Profit New Limited Note 1 3,435,836 6 - - 3,382,358 -
Hongfujin Precision Electronics (Chengdu) Co., Falcon Precision Trading Limited Note 1 284,989 18 - - - -
Ltd.
Hongfujin Precision Electronics (Chengdu) Co., Futaihua Industrial (Shenzhen) Limited Note 1 4,540,794 7 2,603 Subsequent collection 2,603 -
Ltd.
Hongfujin Precision Electronics (Chengdu) Co., Hongfujin Precision Electronics (Chengdu) Co., Ltd. Note 1 1,311,037 4 215,039 Subsequent collection 551,322 -
Ltd.
Hongfujin Precision Electronics (Chengdu) Co., Interface Technology (Chengdu) Co., Ltd. Note 1 222,330 2 223,566 Subsequent collection - -
Ltd.
Fu Ding (ZhengZhou) Precision Industry Co., Ltd Fujin Precision Industrial (Jincheng) Co., Ltd. Note 1 118,767 2 - - - -
Fu Ding (ZhengZhou) Precision Industry Co., Ltd Hongfujin Precision Electronics (Zhengzhou) Note 1 177,392 2 - - 177,392 -
Limited
Fu Ding (ZhengZhou) Precision Industry Co., Ltd Futaihua Precision Electronics (Jiyuan) Limited Note 1 677,721 2 - - - -
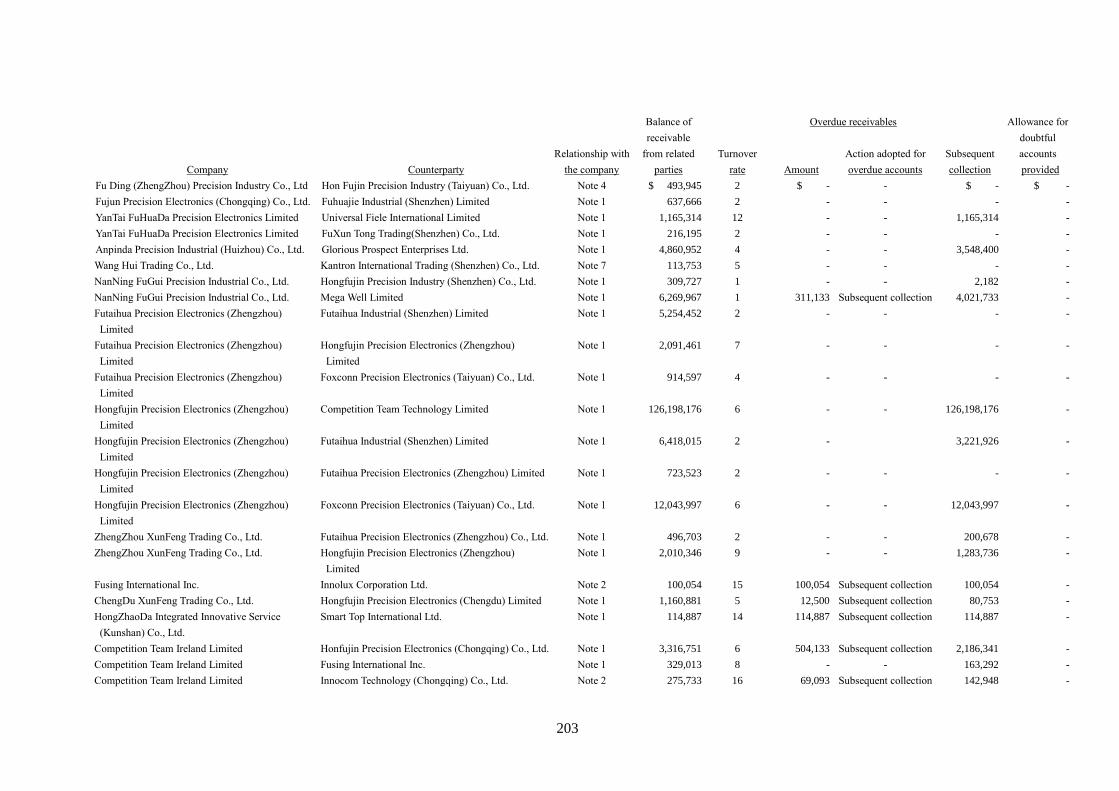
203
Balance of Overdue receivables Allowance for
receivable doubtful
Relationship with from related Turnover Action adopted for Subsequent accounts
Company Counterparty the company parties rate Amount overdue accounts collection provided
Fu Ding (ZhengZhou) Precision Industry Co., Ltd Hon Fujin Precision Industry (Taiyuan) Co., Ltd. Note 4 $ 493,945 2 $ - - $ - $ -
Fujun Precision Electronics (Chongqing) Co., Ltd. Fuhuajie Industrial (Shenzhen) Limited Note 1 637,666 2 - - - -
YanTai FuHuaDa Precision Electronics Limited Universal Fiele International Limited Note 1 1,165,314 12 - - 1,165,314 -
YanTai FuHuaDa Precision Electronics Limited FuXun Tong Trading(Shenzhen) Co., Ltd. Note 1 216,195 2 - - - -
Anpinda Precision Industrial (Huizhou) Co., Ltd. Glorious Prospect Enterprises Ltd. Note 1 4,860,952 4 - - 3,548,400 -
Wang Hui Trading Co., Ltd. Kantron International Trading (Shenzhen) Co., Ltd. Note 7 113,753 5 - - - -
NanNing FuGui Precision Industrial Co., Ltd. Hongfujin Precision Industry (Shenzhen) Co., Ltd. Note 1 309,727 1 - - 2,182 -
NanNing FuGui Precision Industrial Co., Ltd. Mega Well Limited Note 1 6,269,967 1 311,133 Subsequent collection 4,021,733 -
Futaihua Precision Electronics (Zhengzhou) Futaihua Industrial (Shenzhen) Limited Note 1 5,254,452 2 - - - -
Limited
Futaihua Precision Electronics (Zhengzhou) Hongfujin Precision Electronics (Zhengzhou) Note 1 2,091,461 7 - - - -
Limited Limited
Futaihua Precision Electronics (Zhengzhou) Foxconn Precision Electronics (Taiyuan) Co., Ltd. Note 1 914,597 4 - - - -
Limited
Hongfujin Precision Electronics (Zhengzhou) Competition Team Technology Limited Note 1 126,198,176 6 - - 126,198,176 -
Limited
Hongfujin Precision Electronics (Zhengzhou) Futaihua Industrial (Shenzhen) Limited Note 1 6,418,015 2 - 3,221,926 -
Limited
Hongfujin Precision Electronics (Zhengzhou) Futaihua Precision Electronics (Zhengzhou) Limited Note 1 723,523 2 - - - -
Limited
Hongfujin Precision Electronics (Zhengzhou) Foxconn Precision Electronics (Taiyuan) Co., Ltd. Note 1 12,043,997 6 - - 12,043,997 -
Limited
ZhengZhou XunFeng Trading Co., Ltd. Futaihua Precision Electronics (Zhengzhou) Co., Ltd. Note 1 496,703 2 - - 200,678 -
ZhengZhou XunFeng Trading Co., Ltd. Hongfujin Precision Electronics (Zhengzhou) Note 1 2,010,346 9 - - 1,283,736 -
Limited
Fusing International Inc. Innolux Corporation Ltd. Note 2 100,054 15 100,054 Subsequent collection 100,054 -
ChengDu XunFeng Trading Co., Ltd. Hongfujin Precision Electronics (Chengdu) Limited Note 1 1,160,881 5 12,500 Subsequent collection 80,753 -
HongZhaoDa Integrated Innovative Service Smart Top International Ltd. Note 1 114,887 14 114,887 Subsequent collection 114,887 -
(Kunshan) Co., Ltd.
Competition Team Ireland Limited Honfujin Precision Electronics (Chongqing) Co., Ltd. Note 1 3,316,751 6 504,133 Subsequent collection 2,186,341 -
Competition Team Ireland Limited Fusing International Inc. Note 1 329,013 8 - - 163,292 -
Competition Team Ireland Limited Innocom Technology (Chongqing) Co., Ltd. Note 2 275,733 16 69,093 Subsequent collection 142,948 -
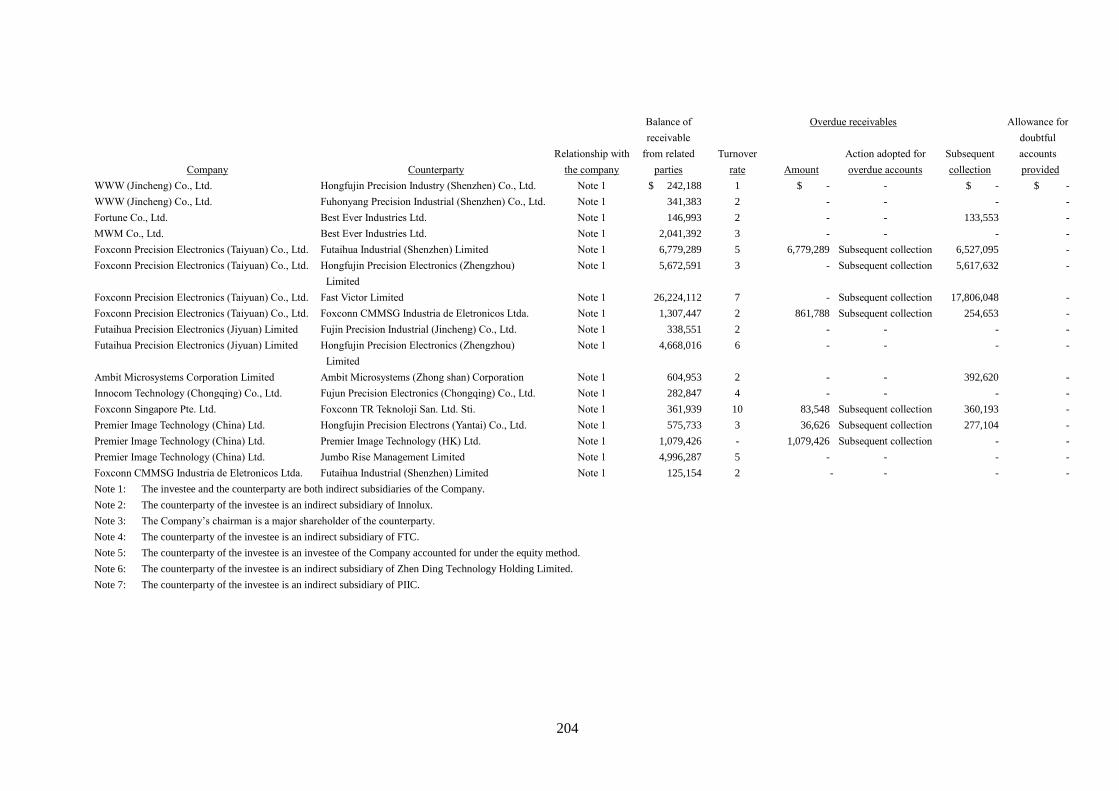
204
Balance of Overdue receivables Allowance for
receivable doubtful
Relationship with from related Turnover Action adopted for Subsequent accounts
Company Counterparty the company parties rate Amount overdue accounts collection provided
WWW (Jincheng) Co., Ltd. Hongfujin Precision Industry (Shenzhen) Co., Ltd. Note 1 $ 242,188 1 $ - - $ - $ -
WWW (Jincheng) Co., Ltd. Fuhonyang Precision Industrial (Shenzhen) Co., Ltd. Note 1 341,383 2 - - - -
Fortune Co., Ltd. Best Ever Industries Ltd. Note 1 146,993 2 - - 133,553 -
MWM Co., Ltd. Best Ever Industries Ltd. Note 1 2,041,392 3 - - - -
Foxconn Precision Electronics (Taiyuan) Co., Ltd. Futaihua Industrial (Shenzhen) Limited Note 1 6,779,289 5 6,779,289 Subsequent collection 6,527,095 -
Foxconn Precision Electronics (Taiyuan) Co., Ltd. Hongfujin Precision Electronics (Zhengzhou) Note 1 5,672,591 3 - Subsequent collection 5,617,632 -
Limited
Foxconn Precision Electronics (Taiyuan) Co., Ltd. Fast Victor Limited Note 1 26,224,112 7 - Subsequent collection 17,806,048 -
Foxconn Precision Electronics (Taiyuan) Co., Ltd. Foxconn CMMSG Industria de Eletronicos Ltda. Note 1 1,307,447 2 861,788 Subsequent collection 254,653 -
Futaihua Precision Electronics (Jiyuan) Limited Fujin Precision Industrial (Jincheng) Co., Ltd. Note 1 338,551 2 - - - -
Futaihua Precision Electronics (Jiyuan) Limited Hongfujin Precision Electronics (Zhengzhou) Note 1 4,668,016 6 - - - -
Limited
Ambit Microsystems Corporation Limited Ambit Microsystems (Zhong shan) Corporation Note 1 604,953 2 - - 392,620 -
Innocom Technology (Chongqing) Co., Ltd. Fujun Precision Electronics (Chongqing) Co., Ltd. Note 1 282,847 4 - - - -
Foxconn Singapore Pte. Ltd. Foxconn TR Teknoloji San. Ltd. Sti. Note 1 361,939 10 83,548 Subsequent collection 360,193 -
Premier Image Technology (China) Ltd. Hongfujin Precision Electrons (Yantai) Co., Ltd. Note 1 575,733 3 36,626 Subsequent collection 277,104 -
Premier Image Technology (China) Ltd. Premier Image Technology (HK) Ltd. Note 1 1,079,426 - 1,079,426 Subsequent collection - -
Premier Image Technology (China) Ltd. Jumbo Rise Management Limited Note 1 4,996,287 5 - - - -
Foxconn CMMSG Industria de Eletronicos Ltda. Futaihua Industrial (Shenzhen) Limited Note 1 125,154 2 - - - -
Note 1: The investee and the counterparty are both indirect subsidiaries of the Company.
Note 2: The counterparty of the investee is an indirect subsidiary of Innolux.
Note 3: The Company’s chairman is a major shareholder of the counterparty.
Note 4: The counterparty of the investee is an indirect subsidiary of FTC.
Note 5: The counterparty of the investee is an investee of the Company accounted for under the equity method.
Note 6: The counterparty of the investee is an indirect subsidiary of Zhen Ding Technology Holding Limited.
Note 7: The counterparty of the investee is an indirect subsidiary of PIIC.
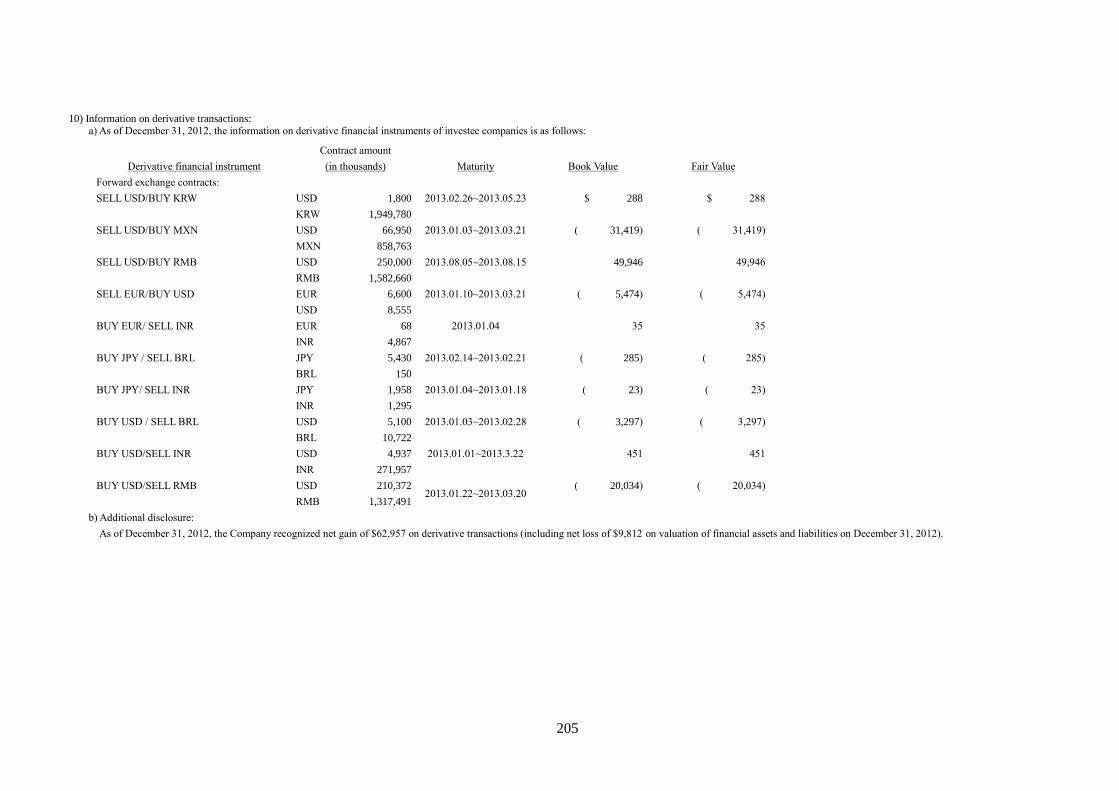
205
10) Information on derivative transactions: a) As of December 31, 2012, the information on derivative financial instruments of investee companies is as follows:
b) Additional disclosure:
As of December 31, 2012, the Company recognized net gain of $62,957 on derivative transactions (including net loss of $9,812 on valuation of financial assets and liabilities on December 31, 2012).
Derivative financial instrument
Contract amount
(in thousands) Maturity Book Value Fair Value
Forward exchange contracts:
SELL USD/BUY KRW USD 1,800 2013.02.26~2013.05.23 $ 288 $ 288
KRW 1,949,780
SELL USD/BUY MXN USD 66,950 2013.01.03~2013.03.21 ( 31,419) ( 31,419)
MXN 858,763
SELL USD/BUY RMB USD 250,000 2013.08.05~2013.08.15 49,946 49,946
RMB 1,582,660
SELL EUR/BUY USD EUR 6,600 2013.01.10~2013.03.21 ( 5,474) ( 5,474)
USD 8,555
BUY EUR/ SELL INR EUR 68 2013.01.04 35 35
INR 4,867
BUY JPY / SELL BRL JPY 5,430 2013.02.14~2013.02.21 ( 285) ( 285)
BRL 150
BUY JPY/ SELL INR JPY 1,958 2013.01.04~2013.01.18 ( 23) ( 23)
INR 1,295
BUY USD / SELL BRL USD 5,100 2013.01.03~2013.02.28 ( 3,297) ( 3,297)
BRL 10,722
BUY USD/SELL INR USD 4,937 2013.01.01~2013.3.22 451 451
INR 271,957
BUY USD/SELL RMB USD 210,372 2013.01.22~2013.03.20
( 20,034) ( 20,034)
RMB 1,317,491
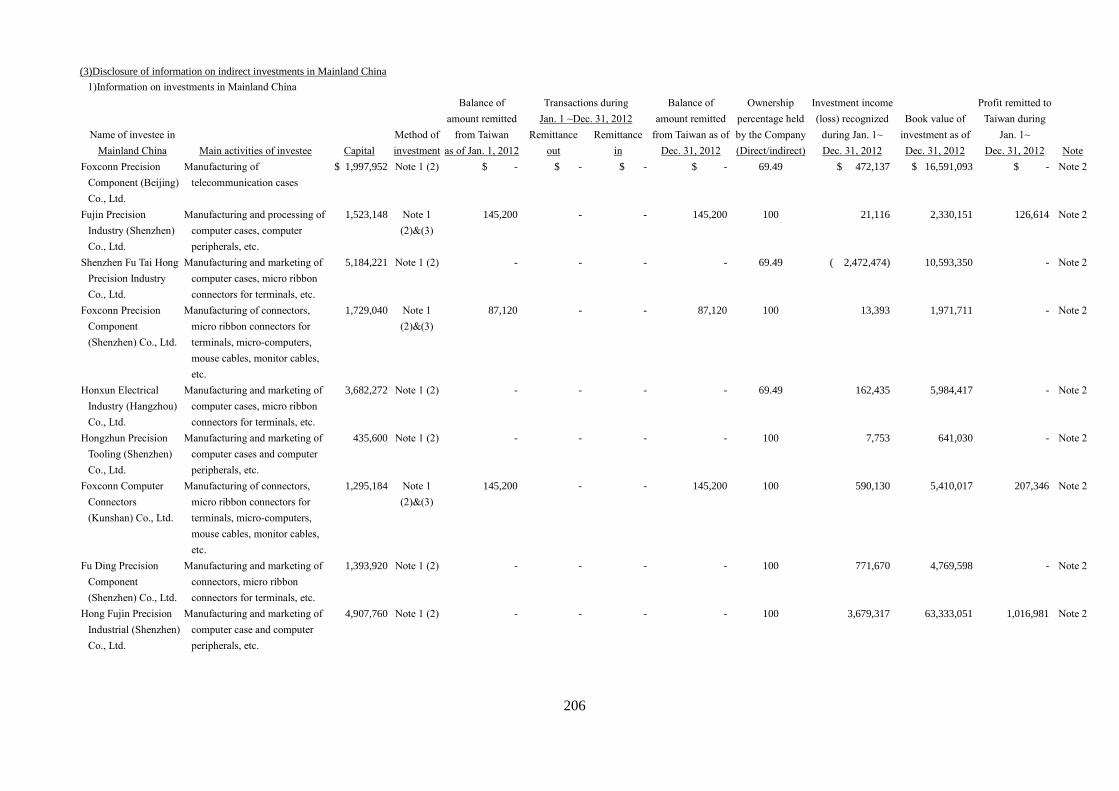
206
(3)Disclosure of information on indirect investments in Mainland China
1)Information on investments in Mainland China
Name of investee in
Mainland China Main activities of investee Capital
Method of
investment
Balance of
amount remitted
from Taiwan
as of Jan. 1, 2012
Transactions during
Jan. 1 ~Dec. 31, 2012
Balance of
amount remitted
from Taiwan as of
Dec. 31, 2012
Ownership
percentage held
by the Company
(Direct/indirect)
Investment income
(loss) recognized
during Jan. 1~
Dec. 31, 2012
Book value of
investment as of
Dec. 31, 2012
Profit remitted to
Taiwan during
Jan. 1~
Dec. 31, 2012
Note
Remittance
out
Remittance
in
Foxconn Precision
Component (Beijing)
Co., Ltd.
Manufacturing of
telecommunication cases
$ 1,997,952 Note 1 (2) $ - $ - $ - $ - 69.49 $ 472,137 $ 16,591,093 $ - Note 2
Fujin Precision
Industry (Shenzhen)
Co., Ltd.
Manufacturing and processing of
computer cases, computer
peripherals, etc.
1,523,148 Note 1
(2)&(3)
145,200 - - 145,200 100 21,116 2,330,151 126,614 Note 2
Shenzhen Fu Tai Hong
Precision Industry
Co., Ltd.
Manufacturing and marketing of
computer cases, micro ribbon
connectors for terminals, etc.
5,184,221 Note 1 (2) - - - - 69.49 ( 2,472,474) 10,593,350 - Note 2
Foxconn Precision
Component
(Shenzhen) Co., Ltd.
Manufacturing of connectors,
micro ribbon connectors for
terminals, micro-computers,
mouse cables, monitor cables,
etc.
1,729,040 Note 1
(2)&(3)
87,120 - - 87,120 100 13,393 1,971,711 - Note 2
Honxun Electrical
Industry (Hangzhou)
Co., Ltd.
Manufacturing and marketing of
computer cases, micro ribbon
connectors for terminals, etc.
3,682,272 Note 1 (2) - - - - 69.49 162,435 5,984,417 - Note 2
Hongzhun Precision
Tooling (Shenzhen)
Co., Ltd.
Manufacturing and marketing of
computer cases and computer
peripherals, etc.
435,600 Note 1 (2) - - - - 100 7,753 641,030 - Note 2
Foxconn Computer
Connectors
(Kunshan) Co., Ltd.
Manufacturing of connectors,
micro ribbon connectors for
terminals, micro-computers,
mouse cables, monitor cables,
etc.
1,295,184 Note 1
(2)&(3)
145,200 - - 145,200 100 590,130 5,410,017 207,346 Note 2
Fu Ding Precision
Component
(Shenzhen) Co., Ltd.
Manufacturing and marketing of
connectors, micro ribbon
connectors for terminals, etc.
1,393,920 Note 1 (2) - - - - 100 771,670 4,769,598 - Note 2
Hong Fujin Precision
Industrial (Shenzhen)
Co., Ltd.
Manufacturing and marketing of
computer case and computer
peripherals, etc.
4,907,760 Note 1 (2) - - - - 100 3,679,317 63,333,051 1,016,981 Note 2
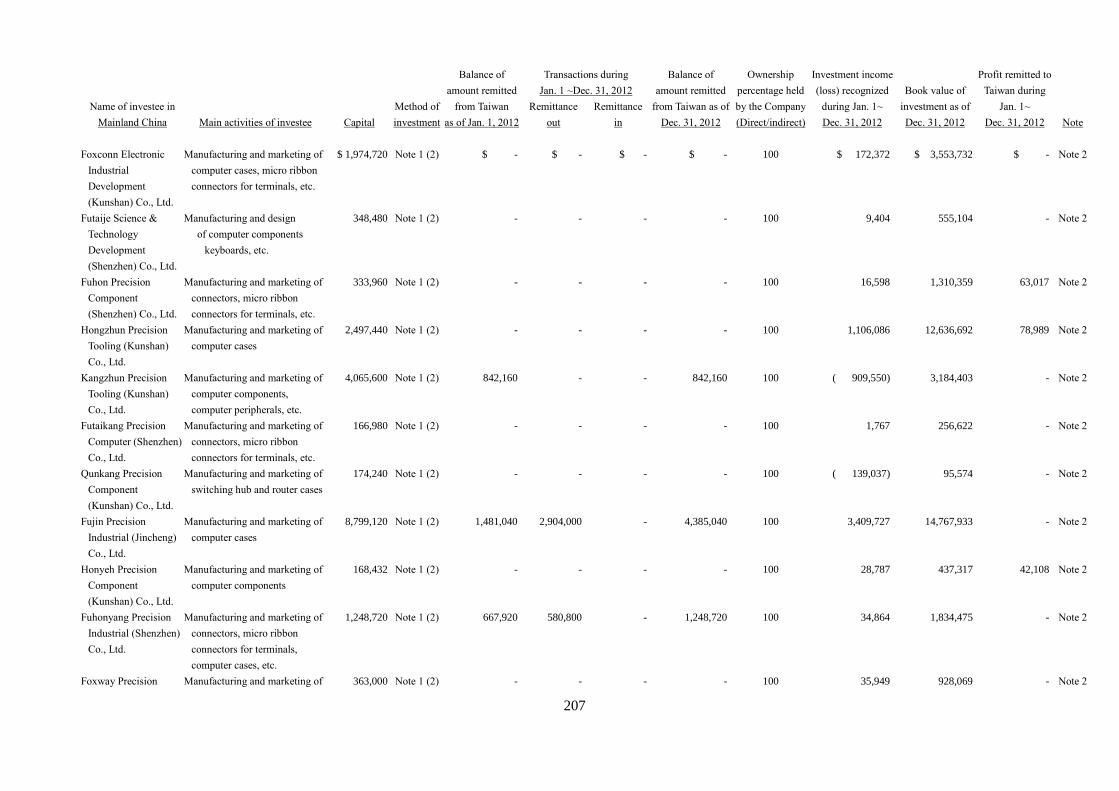
207
Name of investee in
Mainland China Main activities of investee Capital
Method of
investment
Balance of
amount remitted
from Taiwan
as of Jan. 1, 2012
Transactions during
Jan. 1 ~Dec. 31, 2012
Balance of
amount remitted
from Taiwan as of
Dec. 31, 2012
Ownership
percentage held
by the Company
(Direct/indirect)
Investment income
(loss) recognized
during Jan. 1~
Dec. 31, 2012
Book value of
investment as of
Dec. 31, 2012
Profit remitted to
Taiwan during
Jan. 1~
Dec. 31, 2012
Note
Remittance
out
Remittance
in
Foxconn Electronic
Industrial
Development
(Kunshan) Co., Ltd.
Manufacturing and marketing of
computer cases, micro ribbon
connectors for terminals, etc.
$ 1,974,720 Note 1 (2) $ - $ - $ - $ - 100 $ 172,372 $ 3,553,732 $ - Note 2
Futaije Science &
Technology
Development
(Shenzhen) Co., Ltd.
Manufacturing and design
of computer components
keyboards, etc.
348,480 Note 1 (2) - - - - 100 9,404 555,104 - Note 2
Fuhon Precision
Component
(Shenzhen) Co., Ltd.
Manufacturing and marketing of
connectors, micro ribbon
connectors for terminals, etc.
333,960 Note 1 (2) - - - - 100 16,598 1,310,359 63,017 Note 2
Hongzhun Precision
Tooling (Kunshan)
Co., Ltd.
Manufacturing and marketing of
computer cases
2,497,440 Note 1 (2) - - - - 100 1,106,086 12,636,692 78,989 Note 2
Kangzhun Precision
Tooling (Kunshan)
Co., Ltd.
Manufacturing and marketing of
computer components,
computer peripherals, etc.
4,065,600 Note 1 (2) 842,160 - - 842,160 100 ( 909,550) 3,184,403 - Note 2
Futaikang Precision
Computer (Shenzhen)
Co., Ltd.
Manufacturing and marketing of
connectors, micro ribbon
connectors for terminals, etc.
166,980 Note 1 (2) - - - - 100 1,767 256,622 - Note 2
Qunkang Precision
Component
(Kunshan) Co., Ltd.
Manufacturing and marketing of
switching hub and router cases
174,240 Note 1 (2) - - - - 100 ( 139,037) 95,574 - Note 2
Fujin Precision
Industrial (Jincheng)
Co., Ltd.
Manufacturing and marketing of
computer cases
8,799,120 Note 1 (2) 1,481,040 2,904,000 - 4,385,040 100 3,409,727 14,767,933 - Note 2
Honyeh Precision
Component
(Kunshan) Co., Ltd.
Manufacturing and marketing of
computer components
168,432 Note 1 (2) - - - - 100 28,787 437,317 42,108 Note 2
Fuhonyang Precision
Industrial (Shenzhen)
Co., Ltd.
Manufacturing and marketing of
connectors, micro ribbon
connectors for terminals,
computer cases, etc.
1,248,720 Note 1 (2) 667,920 580,800 - 1,248,720 100 34,864 1,834,475 - Note 2
Foxway Precision Manufacturing and marketing of 363,000 Note 1 (2) - - - - 100 35,949 928,069 - Note 2
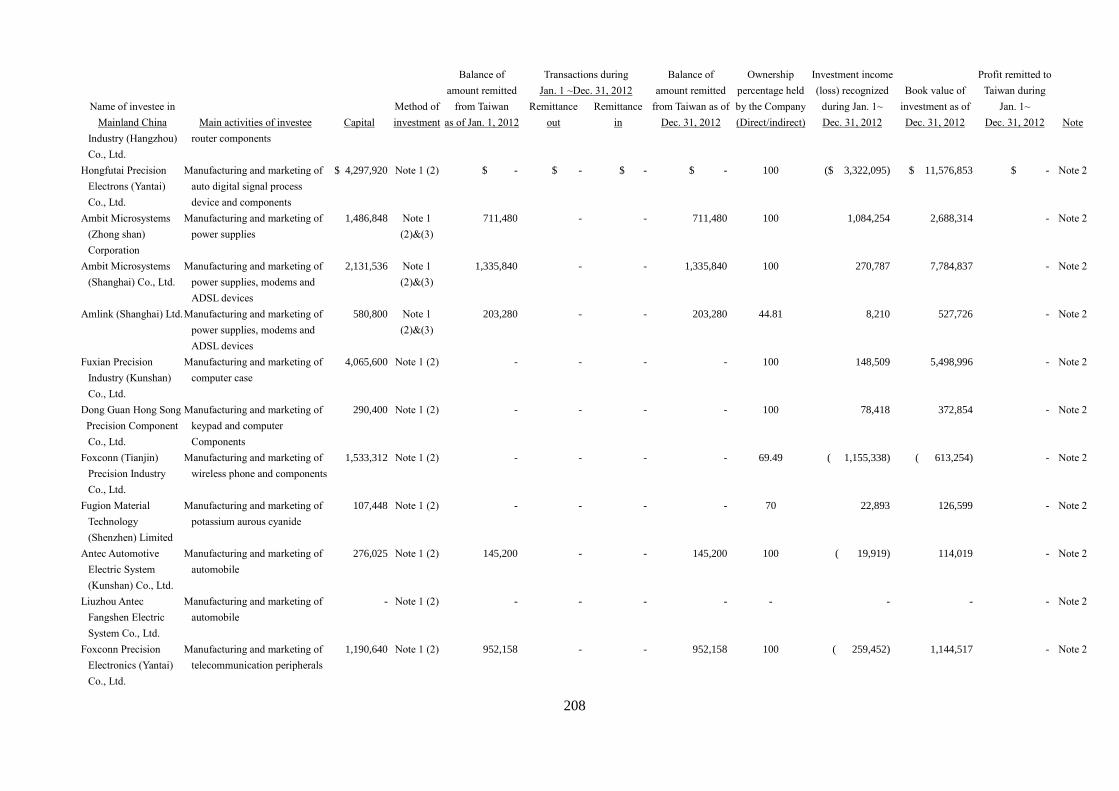
208
Name of investee in
Mainland China Main activities of investee Capital
Method of
investment
Balance of
amount remitted
from Taiwan
as of Jan. 1, 2012
Transactions during
Jan. 1 ~Dec. 31, 2012
Balance of
amount remitted
from Taiwan as of
Dec. 31, 2012
Ownership
percentage held
by the Company
(Direct/indirect)
Investment income
(loss) recognized
during Jan. 1~
Dec. 31, 2012
Book value of
investment as of
Dec. 31, 2012
Profit remitted to
Taiwan during
Jan. 1~
Dec. 31, 2012
Note
Remittance
out
Remittance
in
Industry (Hangzhou)
Co., Ltd.
router components
Hongfutai Precision
Electrons (Yantai)
Co., Ltd.
Manufacturing and marketing of
auto digital signal process
device and components
$ 4,297,920 Note 1 (2) $ - $ - $ - $ - 100 ($ 3,322,095) $ 11,576,853 $ - Note 2
Ambit Microsystems
(Zhong shan)
Corporation
Manufacturing and marketing of
power supplies
1,486,848 Note 1
(2)&(3)
711,480 - - 711,480 100 1,084,254 2,688,314 - Note 2
Ambit Microsystems
(Shanghai) Co., Ltd.
Manufacturing and marketing of
power supplies, modems and
ADSL devices
2,131,536 Note 1
(2)&(3)
1,335,840 - - 1,335,840 100 270,787 7,784,837 - Note 2
Amlink (Shanghai) Ltd. Manufacturing and marketing of
power supplies, modems and
ADSL devices
580,800 Note 1
(2)&(3)
203,280 - - 203,280 44.81 8,210 527,726 - Note 2
Fuxian Precision
Industry (Kunshan)
Co., Ltd.
Manufacturing and marketing of
computer case
4,065,600 Note 1 (2) - - - - 100 148,509 5,498,996 - Note 2
Dong Guan Hong Song
Precision Component
Co., Ltd.
Manufacturing and marketing of
keypad and computer
Components
290,400 Note 1 (2) - - - - 100 78,418 372,854 - Note 2
Foxconn (Tianjin)
Precision Industry
Co., Ltd.
Manufacturing and marketing of
wireless phone and components
1,533,312 Note 1 (2) - - - - 69.49 ( 1,155,338) ( 613,254) - Note 2
Fugion Material
Technology
(Shenzhen) Limited
Manufacturing and marketing of
potassium aurous cyanide
107,448 Note 1 (2) - - - - 70 22,893 126,599 - Note 2
Antec Automotive
Electric System
(Kunshan) Co., Ltd.
Manufacturing and marketing of
automobile
276,025 Note 1 (2) 145,200 - - 145,200 100 ( 19,919) 114,019 - Note 2
Liuzhou Antec
Fangshen Electric
System Co., Ltd.
Manufacturing and marketing of
automobile
- Note 1 (2) - - - - - - - - Note 2
Foxconn Precision
Electronics (Yantai)
Co., Ltd.
Manufacturing and marketing of
telecommunication peripherals
1,190,640 Note 1 (2) 952,158 - - 952,158 100 ( 259,452) 1,144,517 - Note 2
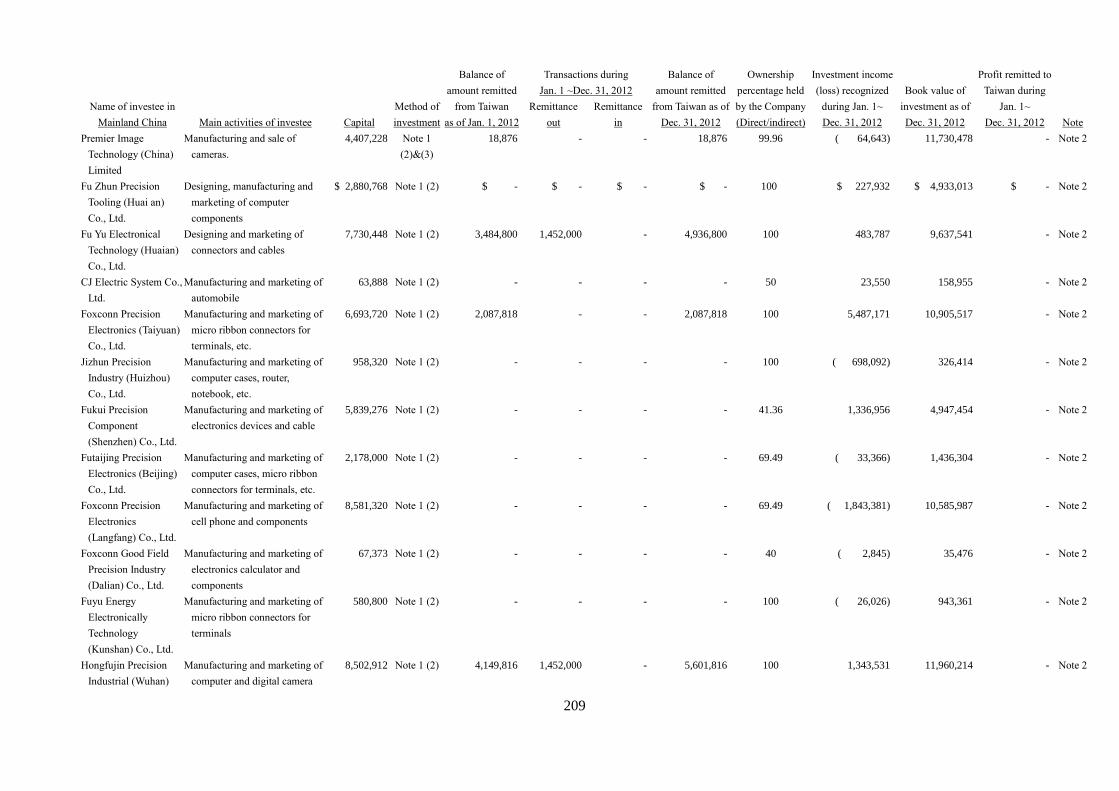
209
Name of investee in
Mainland China Main activities of investee Capital
Method of
investment
Balance of
amount remitted
from Taiwan
as of Jan. 1, 2012
Transactions during
Jan. 1 ~Dec. 31, 2012
Balance of
amount remitted
from Taiwan as of
Dec. 31, 2012
Ownership
percentage held
by the Company
(Direct/indirect)
Investment income
(loss) recognized
during Jan. 1~
Dec. 31, 2012
Book value of
investment as of
Dec. 31, 2012
Profit remitted to
Taiwan during
Jan. 1~
Dec. 31, 2012
Note
Remittance
out
Remittance
in
Premier Image
Technology (China)
Limited
Manufacturing and sale of
cameras.
4,407,228 Note 1
(2)&(3)
18,876 - - 18,876 99.96 ( 64,643) 11,730,478 - Note 2
Fu Zhun Precision
Tooling (Huai an)
Co., Ltd.
Designing, manufacturing and
marketing of computer
components
$ 2,880,768 Note 1 (2) $ - $ - $ - $ - 100 $ 227,932 $ 4,933,013 $ - Note 2
Fu Yu Electronical
Technology (Huaian)
Co., Ltd.
Designing and marketing of
connectors and cables
7,730,448 Note 1 (2) 3,484,800 1,452,000 - 4,936,800 100 483,787 9,637,541 - Note 2
CJ Electric System Co.,
Ltd.
Manufacturing and marketing of
automobile
63,888 Note 1 (2) - - - - 50 23,550 158,955 - Note 2
Foxconn Precision
Electronics (Taiyuan)
Co., Ltd.
Manufacturing and marketing of
micro ribbon connectors for
terminals, etc.
6,693,720 Note 1 (2) 2,087,818 - - 2,087,818 100 5,487,171 10,905,517 - Note 2
Jizhun Precision
Industry (Huizhou)
Co., Ltd.
Manufacturing and marketing of
computer cases, router,
notebook, etc.
958,320 Note 1 (2) - - - - 100 ( 698,092) 326,414 - Note 2
Fukui Precision
Component
(Shenzhen) Co., Ltd.
Manufacturing and marketing of
electronics devices and cable
5,839,276 Note 1 (2) - - - - 41.36 1,336,956 4,947,454 - Note 2
Futaijing Precision
Electronics (Beijing)
Co., Ltd.
Manufacturing and marketing of
computer cases, micro ribbon
connectors for terminals, etc.
2,178,000 Note 1 (2) - - - - 69.49 ( 33,366) 1,436,304 - Note 2
Foxconn Precision
Electronics
(Langfang) Co., Ltd.
Manufacturing and marketing of
cell phone and components
8,581,320 Note 1 (2) - - - - 69.49 ( 1,843,381) 10,585,987 - Note 2
Foxconn Good Field
Precision Industry
(Dalian) Co., Ltd.
Manufacturing and marketing of
electronics calculator and
components
67,373 Note 1 (2) - - - - 40 ( 2,845) 35,476 - Note 2
Fuyu Energy
Electronically
Technology
(Kunshan) Co., Ltd.
Manufacturing and marketing of
micro ribbon connectors for
terminals
580,800 Note 1 (2) - - - - 100 ( 26,026) 943,361 - Note 2
Hongfujin Precision
Industrial (Wuhan)
Manufacturing and marketing of
computer and digital camera
8,502,912 Note 1 (2) 4,149,816 1,452,000 - 5,601,816 100 1,343,531 11,960,214 - Note 2
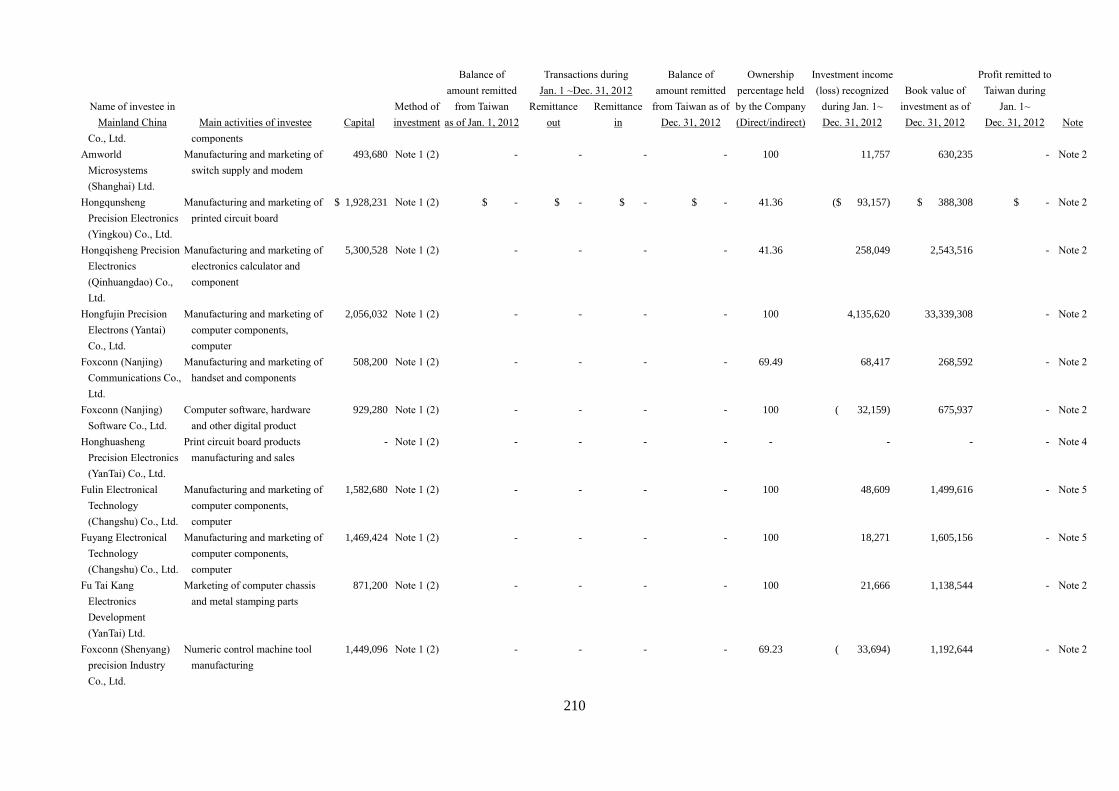
210
Name of investee in
Mainland China Main activities of investee Capital
Method of
investment
Balance of
amount remitted
from Taiwan
as of Jan. 1, 2012
Transactions during
Jan. 1 ~Dec. 31, 2012
Balance of
amount remitted
from Taiwan as of
Dec. 31, 2012
Ownership
percentage held
by the Company
(Direct/indirect)
Investment income
(loss) recognized
during Jan. 1~
Dec. 31, 2012
Book value of
investment as of
Dec. 31, 2012
Profit remitted to
Taiwan during
Jan. 1~
Dec. 31, 2012
Note
Remittance
out
Remittance
in
Co., Ltd. components
Amworld
Microsystems
(Shanghai) Ltd.
Manufacturing and marketing of
switch supply and modem
493,680 Note 1 (2) - - - - 100 11,757 630,235 - Note 2
Hongqunsheng
Precision Electronics
(Yingkou) Co., Ltd.
Manufacturing and marketing of
printed circuit board
$ 1,928,231 Note 1 (2) $ - $ - $ - $ - 41.36 ($ 93,157) $ 388,308 $ - Note 2
Hongqisheng Precision
Electronics
(Qinhuangdao) Co.,
Ltd.
Manufacturing and marketing of
electronics calculator and
component
5,300,528 Note 1 (2) - - - - 41.36 258,049 2,543,516 - Note 2
Hongfujin Precision
Electrons (Yantai)
Co., Ltd.
Manufacturing and marketing of
computer components,
computer
2,056,032 Note 1 (2) - - - - 100 4,135,620 33,339,308 - Note 2
Foxconn (Nanjing)
Communications Co.,
Ltd.
Manufacturing and marketing of
handset and components
508,200 Note 1 (2) - - - - 69.49 68,417 268,592 - Note 2
Foxconn (Nanjing)
Software Co., Ltd.
Computer software, hardware
and other digital product
929,280 Note 1 (2) - - - - 100 ( 32,159) 675,937 - Note 2
Honghuasheng
Precision Electronics
(YanTai) Co., Ltd.
Print circuit board products
manufacturing and sales
- Note 1 (2) - - - - - - - - Note 4
Fulin Electronical
Technology
(Changshu) Co., Ltd.
Manufacturing and marketing of
computer components,
computer
1,582,680 Note 1 (2) - - - - 100 48,609 1,499,616 - Note 5
Fuyang Electronical
Technology
(Changshu) Co., Ltd.
Manufacturing and marketing of
computer components,
computer
1,469,424 Note 1 (2) - - - - 100 18,271 1,605,156 - Note 5
Fu Tai Kang
Electronics
Development
(YanTai) Ltd.
Marketing of computer chassis
and metal stamping parts
871,200 Note 1 (2) - - - - 100 21,666 1,138,544 - Note 2
Foxconn (Shenyang)
precision Industry
Co., Ltd.
Numeric control machine tool
manufacturing
1,449,096 Note 1 (2) - - - - 69.23 ( 33,694) 1,192,644 - Note 2
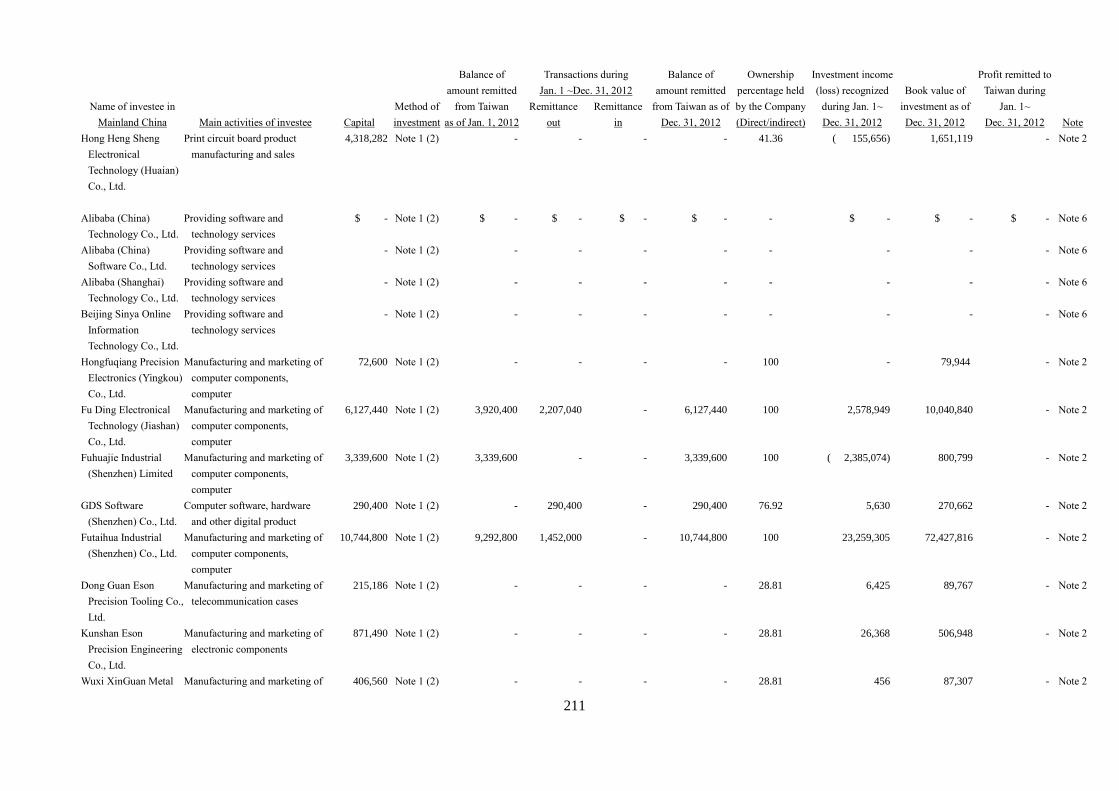
211
Name of investee in
Mainland China Main activities of investee Capital
Method of
investment
Balance of
amount remitted
from Taiwan
as of Jan. 1, 2012
Transactions during
Jan. 1 ~Dec. 31, 2012
Balance of
amount remitted
from Taiwan as of
Dec. 31, 2012
Ownership
percentage held
by the Company
(Direct/indirect)
Investment income
(loss) recognized
during Jan. 1~
Dec. 31, 2012
Book value of
investment as of
Dec. 31, 2012
Profit remitted to
Taiwan during
Jan. 1~
Dec. 31, 2012
Note
Remittance
out
Remittance
in
Hong Heng Sheng
Electronical
Technology (Huaian)
Co., Ltd.
Print circuit board product
manufacturing and sales
4,318,282 Note 1 (2) - - - - 41.36 ( 155,656) 1,651,119 - Note 2
Alibaba (China)
Technology Co., Ltd.
Providing software and
technology services
$ - Note 1 (2) $ - $ - $ - $ - - $ - $ - $ - Note 6
Alibaba (China)
Software Co., Ltd.
Providing software and
technology services
- Note 1 (2) - - - - - - - - Note 6
Alibaba (Shanghai)
Technology Co., Ltd.
Providing software and
technology services
- Note 1 (2) - - - - - - - - Note 6
Beijing Sinya Online
Information
Technology Co., Ltd.
Providing software and
technology services
- Note 1 (2) - - - - - - - - Note 6
Hongfuqiang Precision
Electronics (Yingkou)
Co., Ltd.
Manufacturing and marketing of
computer components,
computer
72,600 Note 1 (2) - - - - 100 - 79,944 - Note 2
Fu Ding Electronical
Technology (Jiashan)
Co., Ltd.
Manufacturing and marketing of
computer components,
computer
6,127,440 Note 1 (2) 3,920,400 2,207,040 - 6,127,440 100 2,578,949 10,040,840 - Note 2
Fuhuajie Industrial
(Shenzhen) Limited
Manufacturing and marketing of
computer components,
computer
3,339,600 Note 1 (2) 3,339,600 - - 3,339,600 100 ( 2,385,074) 800,799 - Note 2
GDS Software
(Shenzhen) Co., Ltd.
Computer software, hardware
and other digital product
290,400 Note 1 (2) - 290,400 - 290,400 76.92 5,630 270,662 - Note 2
Futaihua Industrial
(Shenzhen) Co., Ltd.
Manufacturing and marketing of
computer components,
computer
10,744,800 Note 1 (2) 9,292,800 1,452,000 - 10,744,800 100 23,259,305 72,427,816 - Note 2
Dong Guan Eson
Precision Tooling Co.,
Ltd.
Manufacturing and marketing of
telecommunication cases
215,186 Note 1 (2) - - - - 28.81 6,425 89,767 - Note 2
Kunshan Eson
Precision Engineering
Co., Ltd.
Manufacturing and marketing of
electronic components
871,490 Note 1 (2) - - - - 28.81 26,368 506,948 - Note 2
Wuxi XinGuan Metal Manufacturing and marketing of 406,560 Note 1 (2) - - - - 28.81 456 87,307 - Note 2
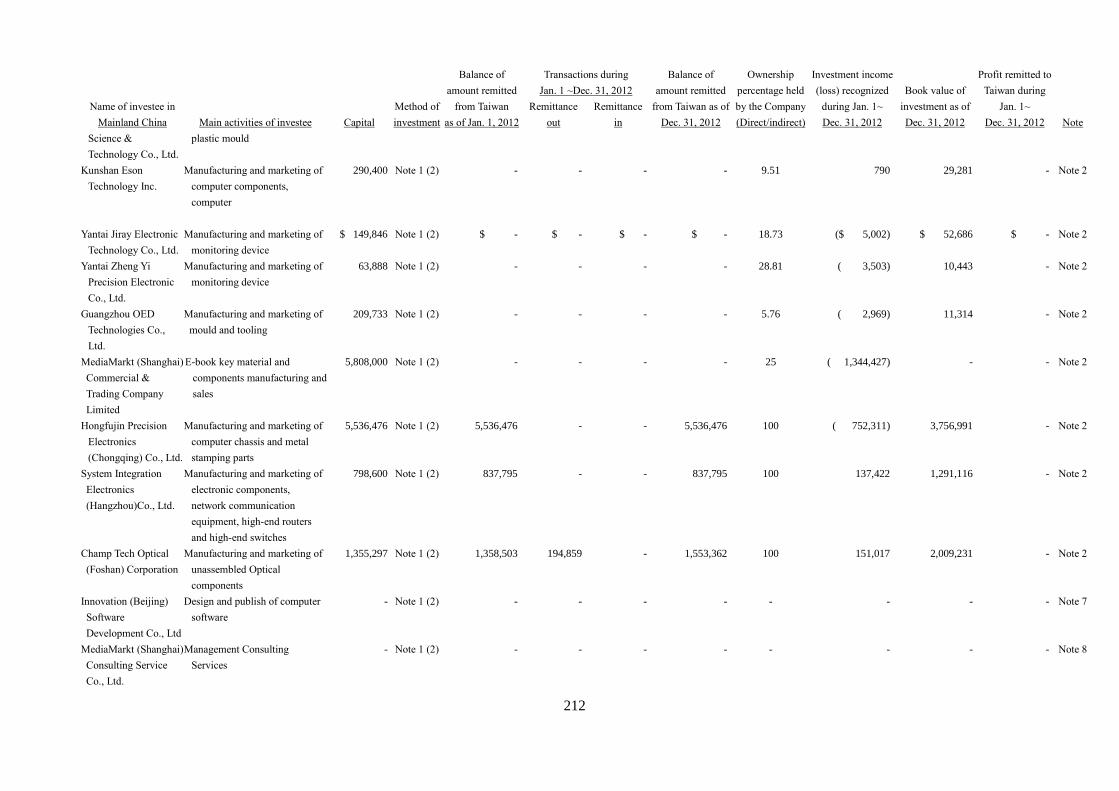
212
Name of investee in
Mainland China Main activities of investee Capital
Method of
investment
Balance of
amount remitted
from Taiwan
as of Jan. 1, 2012
Transactions during
Jan. 1 ~Dec. 31, 2012
Balance of
amount remitted
from Taiwan as of
Dec. 31, 2012
Ownership
percentage held
by the Company
(Direct/indirect)
Investment income
(loss) recognized
during Jan. 1~
Dec. 31, 2012
Book value of
investment as of
Dec. 31, 2012
Profit remitted to
Taiwan during
Jan. 1~
Dec. 31, 2012
Note
Remittance
out
Remittance
in
Science &
Technology Co., Ltd.
plastic mould
Kunshan Eson
Technology Inc.
Manufacturing and marketing of
computer components,
computer
290,400 Note 1 (2) - - - - 9.51 790 29,281 - Note 2
Yantai Jiray Electronic
Technology Co., Ltd.
Manufacturing and marketing of
monitoring device
$ 149,846 Note 1 (2) $ - $ - $ - $ - 18.73 ($ 5,002) $ 52,686 $ - Note 2
Yantai Zheng Yi
Precision Electronic
Co., Ltd.
Manufacturing and marketing of
monitoring device
63,888 Note 1 (2) - - - - 28.81 ( 3,503) 10,443 - Note 2
Guangzhou OED
Technologies Co.,
Ltd.
Manufacturing and marketing of
mould and tooling
209,733 Note 1 (2) - - - - 5.76 ( 2,969) 11,314 - Note 2
MediaMarkt (Shanghai)
Commercial &
Trading Company
Limited
E-book key material and
components manufacturing and
sales
5,808,000 Note 1 (2) - - - - 25 ( 1,344,427) - - Note 2
Hongfujin Precision
Electronics
(Chongqing) Co., Ltd.
Manufacturing and marketing of
computer chassis and metal
stamping parts
5,536,476 Note 1 (2) 5,536,476 - - 5,536,476 100 ( 752,311) 3,756,991 - Note 2
System Integration
Electronics
(Hangzhou)Co., Ltd.
Manufacturing and marketing of
electronic components,
network communication
equipment, high-end routers
and high-end switches
798,600 Note 1 (2) 837,795 - - 837,795 100 137,422 1,291,116 - Note 2
Champ Tech Optical
(Foshan) Corporation
Manufacturing and marketing of
unassembled Optical
components
1,355,297 Note 1 (2) 1,358,503 194,859 - 1,553,362 100 151,017 2,009,231 - Note 2
Innovation (Beijing)
Software
Development Co., Ltd
Design and publish of computer
software
- Note 1 (2) - - - - - - - - Note 7
MediaMarkt (Shanghai)
Consulting Service
Co., Ltd.
Management Consulting
Services
- Note 1 (2) - - - - - - - - Note 8
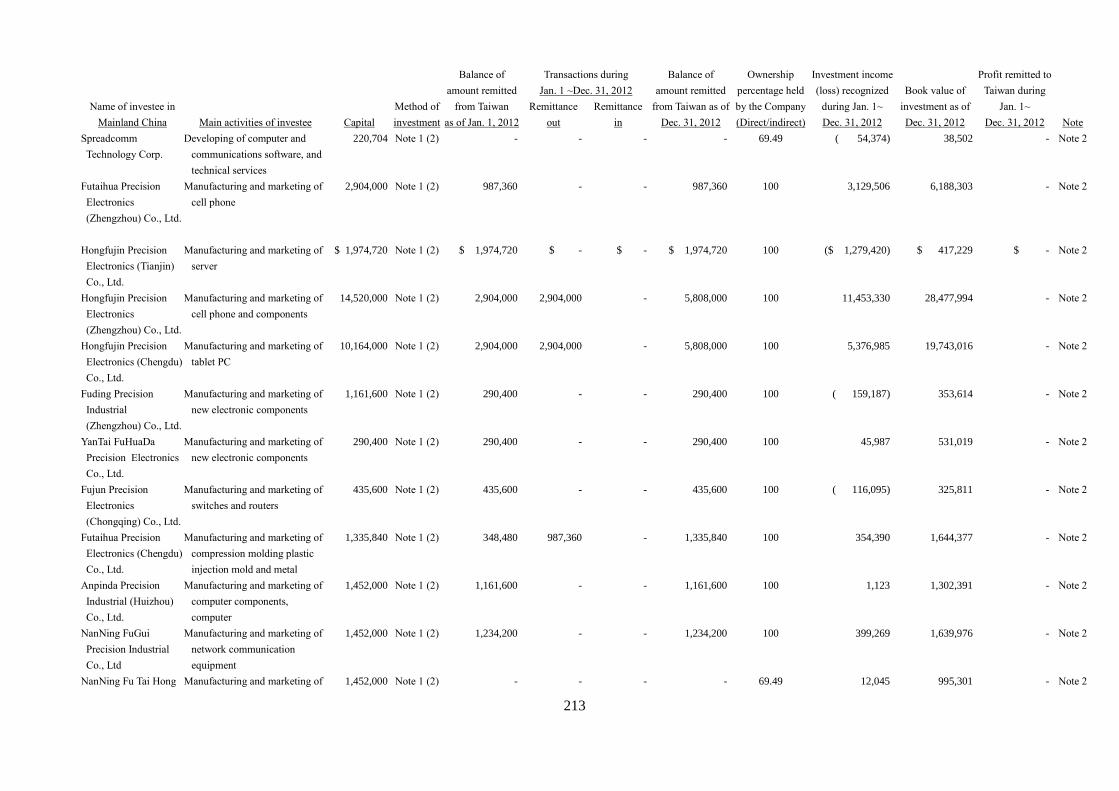
213
Name of investee in
Mainland China Main activities of investee Capital
Method of
investment
Balance of
amount remitted
from Taiwan
as of Jan. 1, 2012
Transactions during
Jan. 1 ~Dec. 31, 2012
Balance of
amount remitted
from Taiwan as of
Dec. 31, 2012
Ownership
percentage held
by the Company
(Direct/indirect)
Investment income
(loss) recognized
during Jan. 1~
Dec. 31, 2012
Book value of
investment as of
Dec. 31, 2012
Profit remitted to
Taiwan during
Jan. 1~
Dec. 31, 2012
Note
Remittance
out
Remittance
in
Spreadcomm
Technology Corp.
Developing of computer and
communications software, and
technical services
220,704 Note 1 (2) - - - - 69.49 ( 54,374) 38,502 - Note 2
Futaihua Precision
Electronics
(Zhengzhou) Co., Ltd.
Manufacturing and marketing of
cell phone
2,904,000 Note 1 (2) 987,360 - - 987,360 100 3,129,506 6,188,303 - Note 2
Hongfujin Precision
Electronics (Tianjin)
Co., Ltd.
Manufacturing and marketing of
server
$ 1,974,720 Note 1 (2) $ 1,974,720 $ - $ - $ 1,974,720 100 ($ 1,279,420) $ 417,229 $ - Note 2
Hongfujin Precision
Electronics
(Zhengzhou) Co., Ltd.
Manufacturing and marketing of
cell phone and components
14,520,000 Note 1 (2) 2,904,000 2,904,000 - 5,808,000 100 11,453,330 28,477,994 - Note 2
Hongfujin Precision
Electronics (Chengdu)
Co., Ltd.
Manufacturing and marketing of
tablet PC
10,164,000 Note 1 (2) 2,904,000 2,904,000 - 5,808,000 100 5,376,985 19,743,016 - Note 2
Fuding Precision
Industrial
(Zhengzhou) Co., Ltd.
Manufacturing and marketing of
new electronic components
1,161,600 Note 1 (2) 290,400 - - 290,400 100 ( 159,187) 353,614 - Note 2
YanTai FuHuaDa
Precision Electronics
Co., Ltd.
Manufacturing and marketing of
new electronic components
290,400 Note 1 (2) 290,400 - - 290,400 100 45,987 531,019 - Note 2
Fujun Precision
Electronics
(Chongqing) Co., Ltd.
Manufacturing and marketing of
switches and routers
435,600 Note 1 (2) 435,600 - - 435,600 100 ( 116,095) 325,811 - Note 2
Futaihua Precision
Electronics (Chengdu)
Co., Ltd.
Manufacturing and marketing of
compression molding plastic
injection mold and metal
1,335,840 Note 1 (2) 348,480 987,360 - 1,335,840 100 354,390 1,644,377 - Note 2
Anpinda Precision
Industrial (Huizhou)
Co., Ltd.
Manufacturing and marketing of
computer components,
computer
1,452,000 Note 1 (2) 1,161,600 - - 1,161,600 100 1,123 1,302,391 - Note 2
NanNing FuGui
Precision Industrial
Co., Ltd
Manufacturing and marketing of
network communication
equipment
1,452,000 Note 1 (2) 1,234,200 - - 1,234,200 100 399,269 1,639,976 - Note 2
NanNing Fu Tai Hong Manufacturing and marketing of 1,452,000 Note 1 (2) - - - - 69.49 12,045 995,301 - Note 2
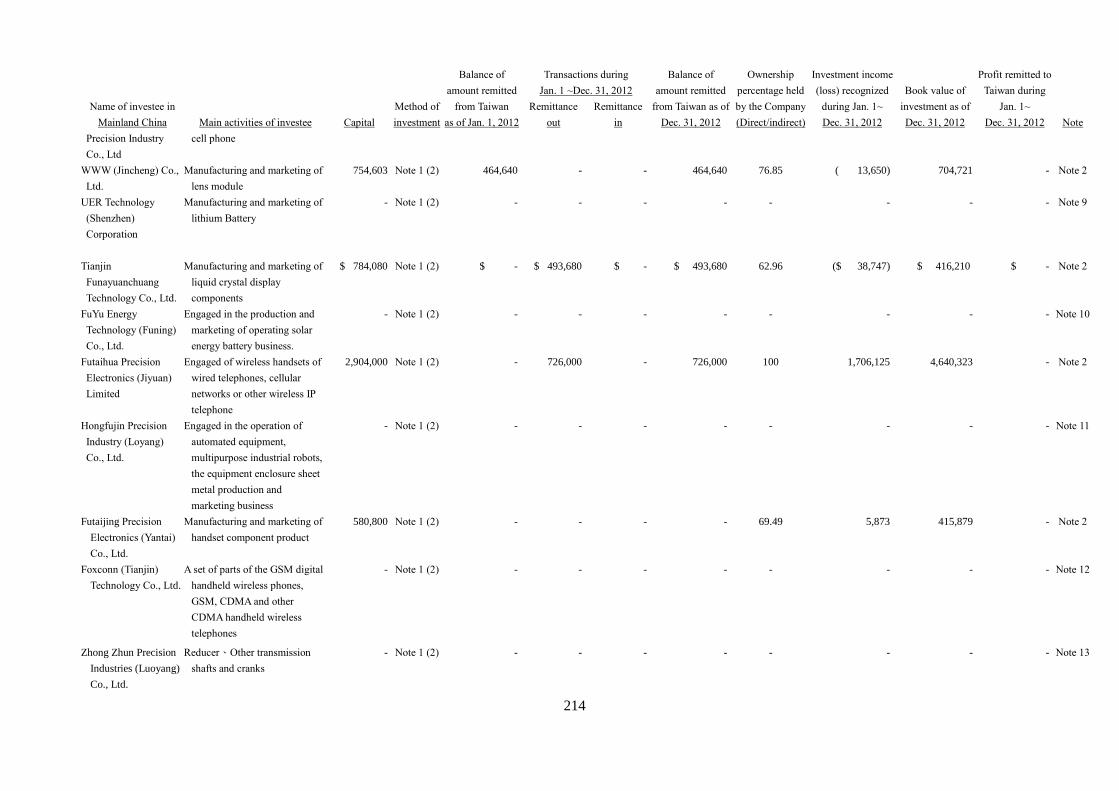
214
Name of investee in
Mainland China Main activities of investee Capital
Method of
investment
Balance of
amount remitted
from Taiwan
as of Jan. 1, 2012
Transactions during
Jan. 1 ~Dec. 31, 2012
Balance of
amount remitted
from Taiwan as of
Dec. 31, 2012
Ownership
percentage held
by the Company
(Direct/indirect)
Investment income
(loss) recognized
during Jan. 1~
Dec. 31, 2012
Book value of
investment as of
Dec. 31, 2012
Profit remitted to
Taiwan during
Jan. 1~
Dec. 31, 2012
Note
Remittance
out
Remittance
in
Precision Industry
Co., Ltd
cell phone
WWW (Jincheng) Co.,
Ltd.
Manufacturing and marketing of
lens module
754,603 Note 1 (2) 464,640 - - 464,640 76.85 ( 13,650) 704,721 - Note 2
UER Technology
(Shenzhen)
Corporation
Manufacturing and marketing of
lithium Battery
- Note 1 (2) - - - - - - - - Note 9
Tianjin
Funayuanchuang
Technology Co., Ltd.
Manufacturing and marketing of
liquid crystal display
components
$ 784,080 Note 1 (2) $ - $ 493,680 $ - $ 493,680 62.96 ($ 38,747) $ 416,210 $ - Note 2
FuYu Energy
Technology (Funing)
Co., Ltd.
Engaged in the production and
marketing of operating solar
energy battery business.
- Note 1 (2) - - - - - - - - Note 10
Futaihua Precision
Electronics (Jiyuan)
Limited
Engaged of wireless handsets of
wired telephones, cellular
networks or other wireless IP
telephone
2,904,000 Note 1 (2) - 726,000 - 726,000 100 1,706,125 4,640,323 - Note 2
Hongfujin Precision
Industry (Loyang)
Co., Ltd.
Engaged in the operation of
automated equipment,
multipurpose industrial robots,
the equipment enclosure sheet
metal production and
marketing business
- Note 1 (2) - - - - - - - - Note 11
Futaijing Precision
Electronics (Yantai)
Co., Ltd.
Manufacturing and marketing of
handset component product
580,800 Note 1 (2) - - - - 69.49 5,873 415,879 - Note 2
Foxconn (Tianjin)
Technology Co., Ltd.
A set of parts of the GSM digital
handheld wireless phones,
GSM, CDMA and other
CDMA handheld wireless
telephones
- Note 1 (2) - - - - - - - - Note 12
Zhong Zhun Precision
Industries (Luoyang)
Co., Ltd.
Reducer、Other transmission
shafts and cranks
- Note 1 (2) - - - - - - - - Note 13
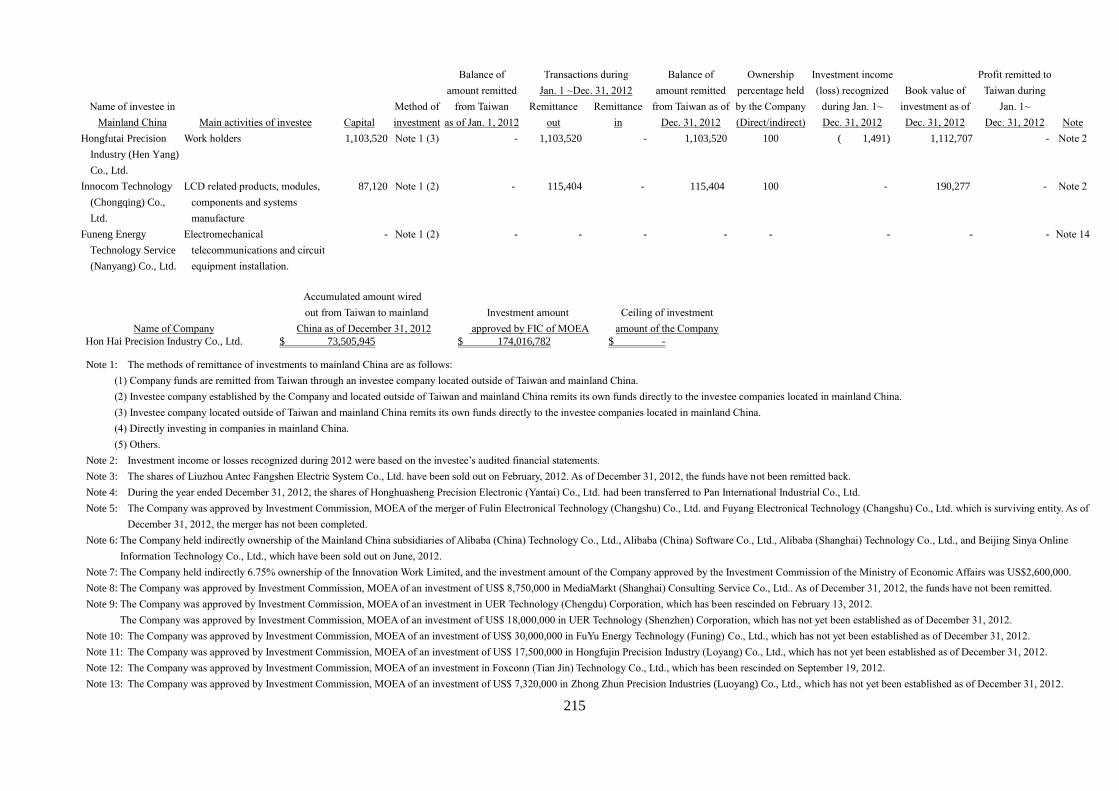
215
Name of investee in
Mainland China Main activities of investee Capital
Method of
investment
Balance of
amount remitted
from Taiwan
as of Jan. 1, 2012
Transactions during
Jan. 1 ~Dec. 31, 2012
Balance of
amount remitted
from Taiwan as of
Dec. 31, 2012
Ownership
percentage held
by the Company
(Direct/indirect)
Investment income
(loss) recognized
during Jan. 1~
Dec. 31, 2012
Book value of
investment as of
Dec. 31, 2012
Profit remitted to
Taiwan during
Jan. 1~
Dec. 31, 2012
Note
Remittance
out
Remittance
in
Hongfutai Precision
Industry (Hen Yang)
Co., Ltd.
Work holders 1,103,520 Note 1 (3) - 1,103,520 - 1,103,520 100 ( 1,491) 1,112,707 - Note 2
Innocom Technology
(Chongqing) Co.,
Ltd.
LCD related products, modules,
components and systems
manufacture
87,120 Note 1 (2) - 115,404 - 115,404 100 - 190,277 - Note 2
Funeng Energy
Technology Service
(Nanyang) Co., Ltd.
Electromechanical
telecommunications and circuit
equipment installation.
- Note 1 (2) - - - - - - - - Note 14
Note 1: The methods of remittance of investments to mainland China are as follows:
(1) Company funds are remitted from Taiwan through an investee company located outside of Taiwan and mainland China.
(2) Investee company established by the Company and located outside of Taiwan and mainland China remits its own funds directly to the investee companies located in mainland China. (3) Investee company located outside of Taiwan and mainland China remits its own funds directly to the investee companies located in mainland China.
(4) Directly investing in companies in mainland China.
(5) Others.
Note 2: Investment income or losses recognized during 2012 were based on the investee’s audited financial statements.
Note 3: The shares of Liuzhou Antec Fangshen Electric System Co., Ltd. have been sold out on February, 2012. As of December 31, 2012, the funds have not been remitted back.
Note 4: During the year ended December 31, 2012, the shares of Honghuasheng Precision Electronic (Yantai) Co., Ltd. had been transferred to Pan International Industrial Co., Ltd.
Note 5: The Company was approved by Investment Commission, MOEA of the merger of Fulin Electronical Technology (Changshu) Co., Ltd. and Fuyang Electronical Technology (Changshu) Co., Ltd. which is surviving entity. As of
December 31, 2012, the merger has not been completed.
Note 6: The Company held indirectly ownership of the Mainland China subsidiaries of Alibaba (China) Technology Co., Ltd., Alibaba (China) Software Co., Ltd., Alibaba (Shanghai) Technology Co., Ltd., and Beijing Sinya Online
Information Technology Co., Ltd., which have been sold out on June, 2012.
Note 7: The Company held indirectly 6.75% ownership of the Innovation Work Limited, and the investment amount of the Company approved by the Investment Commission of the Ministry of Economic Affairs was US$2,600,000.
Note 8: The Company was approved by Investment Commission, MOEA of an investment of US$ 8,750,000 in MediaMarkt (Shanghai) Consulting Service Co., Ltd.. As of December 31, 2012, the funds have not been remitted.
Note 9: The Company was approved by Investment Commission, MOEA of an investment in UER Technology (Chengdu) Corporation, which has been rescinded on February 13, 2012.
The Company was approved by Investment Commission, MOEA of an investment of US$ 18,000,000 in UER Technology (Shenzhen) Corporation, which has not yet been established as of December 31, 2012.
Note 10: The Company was approved by Investment Commission, MOEA of an investment of US$ 30,000,000 in FuYu Energy Technology (Funing) Co., Ltd., which has not yet been established as of December 31, 2012.
Note 11: The Company was approved by Investment Commission, MOEA of an investment of US$ 17,500,000 in Hongfujin Precision Industry (Loyang) Co., Ltd., which has not yet been established as of December 31, 2012.
Note 12: The Company was approved by Investment Commission, MOEA of an investment in Foxconn (Tian Jin) Technology Co., Ltd., which has been rescinded on September 19, 2012.
Note 13: The Company was approved by Investment Commission, MOEA of an investment of US$ 7,320,000 in Zhong Zhun Precision Industries (Luoyang) Co., Ltd., which has not yet been established as of December 31, 2012.
Name of Company
Accumulated amount wired
out from Taiwan to mainland
China as of December 31, 2012
Investment amount
approved by FIC of MOEA
Ceiling of investment
amount of the Company
Hon Hai Precision Industry Co., Ltd. $ 73,505,945 $ 174,016,782 $ -
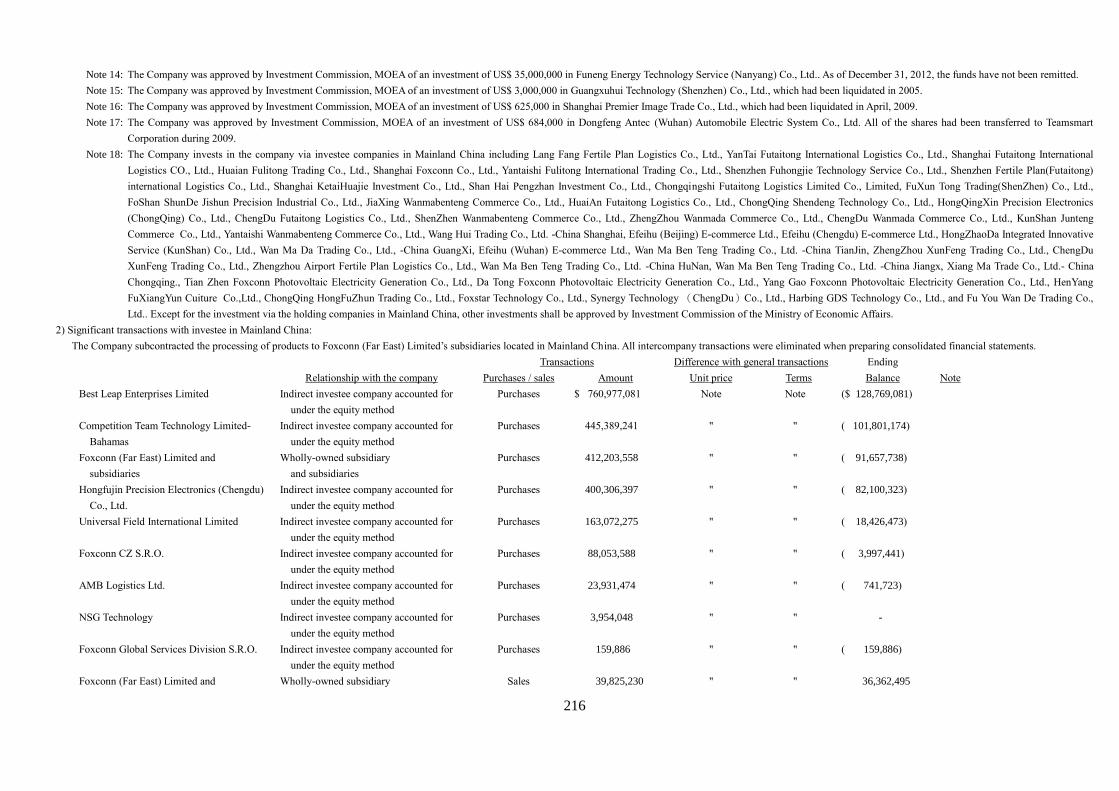
216
Note 14: The Company was approved by Investment Commission, MOEA of an investment of US$ 35,000,000 in Funeng Energy Technology Service (Nanyang) Co., Ltd.. As of December 31, 2012, the funds have not been remitted.
Note 15: The Company was approved by Investment Commission, MOEA of an investment of US$ 3,000,000 in Guangxuhui Technology (Shenzhen) Co., Ltd., which had been liquidated in 2005.
Note 16: The Company was approved by Investment Commission, MOEA of an investment of US$ 625,000 in Shanghai Premier Image Trade Co., Ltd., which had been liquidated in April, 2009.
Note 17: The Company was approved by Investment Commission, MOEA of an investment of US$ 684,000 in Dongfeng Antec (Wuhan) Automobile Electric System Co., Ltd. All of the shares had been transferred to Teamsmart
Corporation during 2009.
Note 18: The Company invests in the company via investee companies in Mainland China including Lang Fang Fertile Plan Logistics Co., Ltd., YanTai Futaitong International Logistics Co., Ltd., Shanghai Futaitong International
Logistics CO., Ltd., Huaian Fulitong Trading Co., Ltd., Shanghai Foxconn Co., Ltd., Yantaishi Fulitong International Trading Co., Ltd., Shenzhen Fuhongjie Technology Service Co., Ltd., Shenzhen Fertile Plan(Futaitong)
international Logistics Co., Ltd., Shanghai KetaiHuajie Investment Co., Ltd., Shan Hai Pengzhan Investment Co., Ltd., Chongqingshi Futaitong Logistics Limited Co., Limited, FuXun Tong Trading(ShenZhen) Co., Ltd.,
FoShan ShunDe Jishun Precision Industrial Co., Ltd., JiaXing Wanmabenteng Commerce Co., Ltd., HuaiAn Futaitong Logistics Co., Ltd., ChongQing Shendeng Technology Co., Ltd., HongQingXin Precision Electronics
(ChongQing) Co., Ltd., ChengDu Futaitong Logistics Co., Ltd., ShenZhen Wanmabenteng Commerce Co., Ltd., ZhengZhou Wanmada Commerce Co., Ltd., ChengDu Wanmada Commerce Co., Ltd., KunShan Junteng
Commerce Co., Ltd., Yantaishi Wanmabenteng Commerce Co., Ltd., Wang Hui Trading Co., Ltd. -China Shanghai, Efeihu (Beijing) E-commerce Ltd., Efeihu (Chengdu) E-commerce Ltd., HongZhaoDa Integrated Innovative
Service (KunShan) Co., Ltd., Wan Ma Da Trading Co., Ltd., -China GuangXi, Efeihu (Wuhan) E-commerce Ltd., Wan Ma Ben Teng Trading Co., Ltd. -China TianJin, ZhengZhou XunFeng Trading Co., Ltd., ChengDu
XunFeng Trading Co., Ltd., Zhengzhou Airport Fertile Plan Logistics Co., Ltd., Wan Ma Ben Teng Trading Co., Ltd. -China HuNan, Wan Ma Ben Teng Trading Co., Ltd. -China Jiangx, Xiang Ma Trade Co., Ltd.- China
Chongqing., Tian Zhen Foxconn Photovoltaic Electricity Generation Co., Ltd., Da Tong Foxconn Photovoltaic Electricity Generation Co., Ltd., Yang Gao Foxconn Photovoltaic Electricity Generation Co., Ltd., HenYang
FuXiangYun Cuiture Co.,Ltd., ChongQing HongFuZhun Trading Co., Ltd., Foxstar Technology Co., Ltd., Synergy Technology (ChengDu)Co., Ltd., Harbing GDS Technology Co., Ltd., and Fu You Wan De Trading Co.,
Ltd.. Except for the investment via the holding companies in Mainland China, other investments shall be approved by Investment Commission of the Ministry of Economic Affairs.
2) Significant transactions with investee in Mainland China:
The Company subcontracted the processing of products to Foxconn (Far East) Limited’s subsidiaries located in Mainland China. All intercompany transactions were eliminated when preparing consolidated financial statements.
Transactions Difference with general transactions Ending
Note Relationship with the company Purchases / sales Amount Unit price Terms Balance
Best Leap Enterprises Limited Indirect investee company accounted for
under the equity method
Purchases $ 760,977,081 Note Note ($ 128,769,081)
Competition Team Technology Limited-
Bahamas
Indirect investee company accounted for
under the equity method
Purchases 445,389,241 " " ( 101,801,174)
Foxconn (Far East) Limited and
subsidiaries
Wholly-owned subsidiary
and subsidiaries
Purchases 412,203,558 " " ( 91,657,738)
Hongfujin Precision Electronics (Chengdu)
Co., Ltd.
Indirect investee company accounted for
under the equity method
Purchases 400,306,397 " " ( 82,100,323)
Universal Field International Limited Indirect investee company accounted for
under the equity method
Purchases 163,072,275 " " ( 18,426,473)
Foxconn CZ S.R.O. Indirect investee company accounted for
under the equity method
Purchases 88,053,588 " " ( 3,997,441)
AMB Logistics Ltd. Indirect investee company accounted for
under the equity method
Purchases 23,931,474 " " ( 741,723)
NSG Technology Indirect investee company accounted for
under the equity method
Purchases 3,954,048 " " -
Foxconn Global Services Division S.R.O. Indirect investee company accounted for
under the equity method
Purchases 159,886 " " ( 159,886)
Foxconn (Far East) Limited and Wholly-owned subsidiary Sales 39,825,230 " " 36,362,495
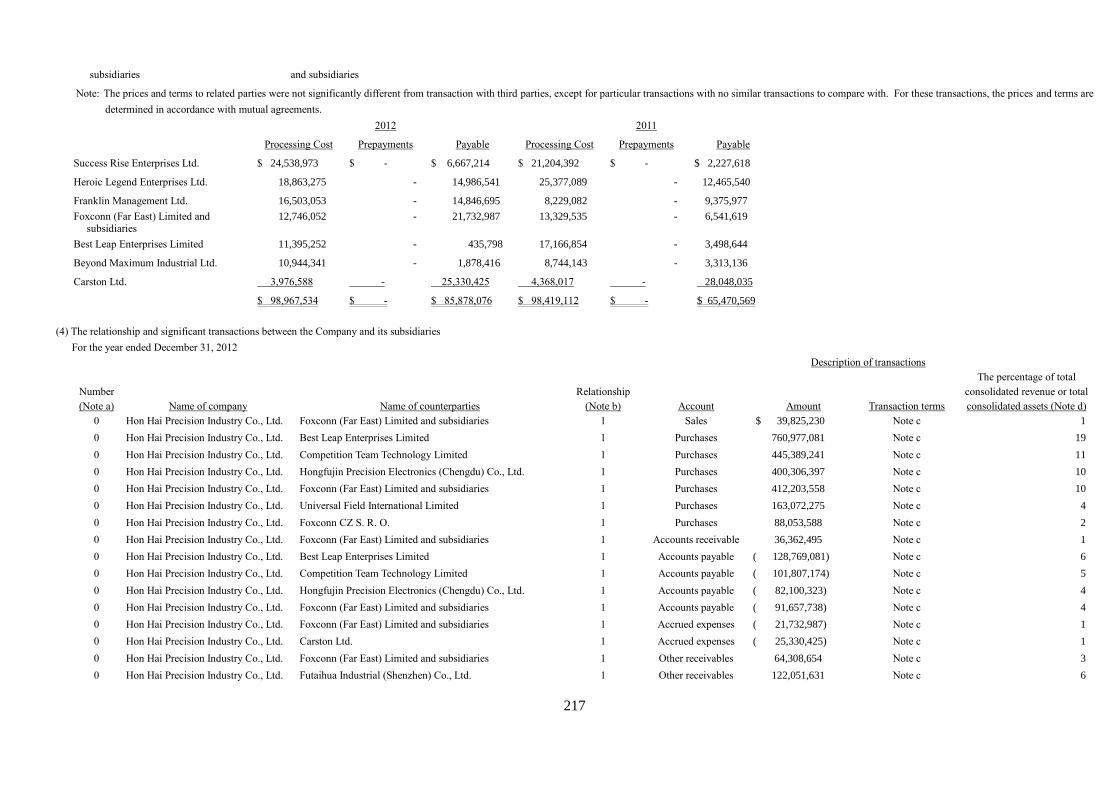
217
subsidiaries and subsidiaries
Note: The prices and terms to related parties were not significantly different from transaction with third parties, except for particular transactions with no similar transactions to compare with. For these transactions, the prices and terms are
determined in accordance with mutual agreements.
2012 2011
Processing Cost Prepayments Payable Processing Cost Prepayments Payable
Success Rise Enterprises Ltd. $ 24,538,973 $ - $ 6,667,214 $ 21,204,392 $ - $ 2,227,618
Heroic Legend Enterprises Ltd. 18,863,275 - 14,986,541 25,377,089 - 12,465,540
Franklin Management Ltd. 16,503,053 - 14,846,695 8,229,082 - 9,375,977
Foxconn (Far East) Limited and subsidiaries
12,746,052 - 21,732,987 13,329,535 - 6,541,619
Best Leap Enterprises Limited 11,395,252 - 435,798 17,166,854 - 3,498,644
Beyond Maximum Industrial Ltd. 10,944,341 - 1,878,416 8,744,143 - 3,313,136
Carston Ltd. 3,976,588 - 25,330,425 4,368,017 - 28,048,035
$ 98,967,534 $ - $ 85,878,076 $ 98,419,112 $ - $ 65,470,569
(4) The relationship and significant transactions between the Company and its subsidiaries
For the year ended December 31, 2012
Description of transactions
The percentage of total
Number Relationship consolidated revenue or total
(Note a) Name of company Name of counterparties (Note b) Account Amount Transaction terms consolidated assets (Note d)
0 Hon Hai Precision Industry Co., Ltd. Foxconn (Far East) Limited and subsidiaries 1 Sales $ 39,825,230 Note c 1
0 Hon Hai Precision Industry Co., Ltd. Best Leap Enterprises Limited 1 Purchases 760,977,081 Note c 19
0 Hon Hai Precision Industry Co., Ltd. Competition Team Technology Limited 1 Purchases 445,389,241 Note c 11
0 Hon Hai Precision Industry Co., Ltd. Hongfujin Precision Electronics (Chengdu) Co., Ltd. 1 Purchases 400,306,397 Note c 10
0 Hon Hai Precision Industry Co., Ltd. Foxconn (Far East) Limited and subsidiaries 1 Purchases 412,203,558 Note c 10
0 Hon Hai Precision Industry Co., Ltd. Universal Field International Limited 1 Purchases 163,072,275 Note c 4
0 Hon Hai Precision Industry Co., Ltd. Foxconn CZ S. R. O. 1 Purchases 88,053,588 Note c 2
0 Hon Hai Precision Industry Co., Ltd. Foxconn (Far East) Limited and subsidiaries 1 Accounts receivable 36,362,495 Note c 1
0 Hon Hai Precision Industry Co., Ltd. Best Leap Enterprises Limited 1 Accounts payable ( 128,769,081) Note c 6
0 Hon Hai Precision Industry Co., Ltd. Competition Team Technology Limited 1 Accounts payable ( 101,807,174) Note c 5
0 Hon Hai Precision Industry Co., Ltd. Hongfujin Precision Electronics (Chengdu) Co., Ltd. 1 Accounts payable ( 82,100,323) Note c 4
0 Hon Hai Precision Industry Co., Ltd. Foxconn (Far East) Limited and subsidiaries 1 Accounts payable ( 91,657,738) Note c 4
0 Hon Hai Precision Industry Co., Ltd. Foxconn (Far East) Limited and subsidiaries 1 Accrued expenses ( 21,732,987) Note c 1
0 Hon Hai Precision Industry Co., Ltd. Carston Ltd. 1 Accrued expenses ( 25,330,425) Note c 1
0 Hon Hai Precision Industry Co., Ltd. Foxconn (Far East) Limited and subsidiaries 1 Other receivables 64,308,654 Note c 3
0 Hon Hai Precision Industry Co., Ltd. Futaihua Industrial (Shenzhen) Co., Ltd. 1 Other receivables 122,051,631 Note c 6
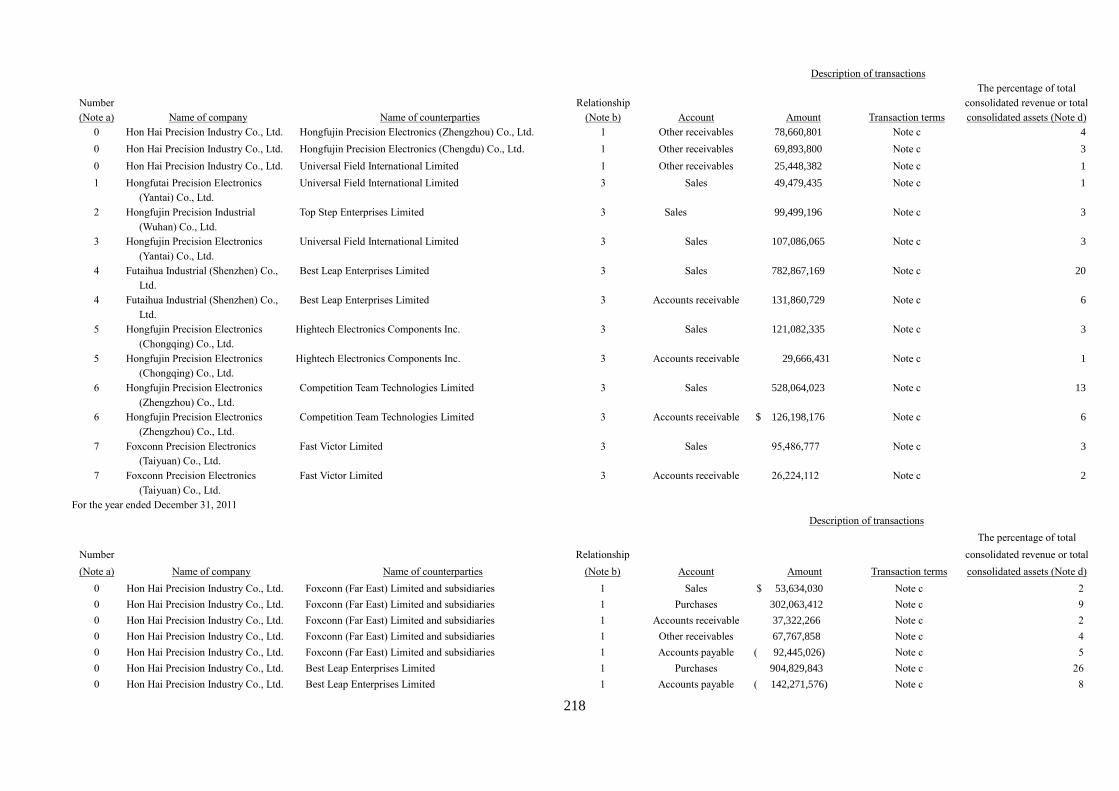
218
Description of transactions
The percentage of total
Number Relationship consolidated revenue or total
(Note a) Name of company Name of counterparties (Note b) Account Amount Transaction terms consolidated assets (Note d)
0 Hon Hai Precision Industry Co., Ltd. Hongfujin Precision Electronics (Zhengzhou) Co., Ltd. 1 Other receivables 78,660,801 Note c 4
0 Hon Hai Precision Industry Co., Ltd. Hongfujin Precision Electronics (Chengdu) Co., Ltd. 1 Other receivables 69,893,800 Note c 3
0 Hon Hai Precision Industry Co., Ltd. Universal Field International Limited 1 Other receivables 25,448,382 Note c 1
1 Hongfutai Precision Electronics
(Yantai) Co., Ltd.
Universal Field International Limited 3 Sales 49,479,435 Note c 1
2 Hongfujin Precision Industrial
(Wuhan) Co., Ltd.
Top Step Enterprises Limited 3 Sales 99,499,196 Note c 3
3 Hongfujin Precision Electronics
(Yantai) Co., Ltd.
Universal Field International Limited 3 Sales 107,086,065 Note c 3
4 Futaihua Industrial (Shenzhen) Co.,
Ltd.
Best Leap Enterprises Limited 3 Sales 782,867,169 Note c 20
4 Futaihua Industrial (Shenzhen) Co.,
Ltd.
Best Leap Enterprises Limited 3 Accounts receivable 131,860,729 Note c 6
5 Hongfujin Precision Electronics
(Chongqing) Co., Ltd.
0 Hightech Electronics Components Inc. 3 Sales 121,082,335 Note c 3
5 Hongfujin Precision Electronics
(Chongqing) Co., Ltd.
0 Hightech Electronics Components Inc. 3 Accounts receivable 29,666,431 Note c 1
6 Hongfujin Precision Electronics
(Zhengzhou) Co., Ltd.
Competition Team Technologies Limited 3 Sales 528,064,023 Note c 13
6 Hongfujin Precision Electronics
(Zhengzhou) Co., Ltd.
Competition Team Technologies Limited 3 Accounts receivable $ 126,198,176 Note c 6
7 Foxconn Precision Electronics
(Taiyuan) Co., Ltd.
Fast Victor Limited 3 Sales 95,486,777 Note c 3
7 Foxconn Precision Electronics
(Taiyuan) Co., Ltd.
Fast Victor Limited 3 Accounts receivable 26,224,112 Note c 2
For the year ended December 31, 2011
Description of transactions
The percentage of total
Number Relationship consolidated revenue or total
(Note a) Name of company Name of counterparties (Note b) Account Amount Transaction terms consolidated assets (Note d)
0 Hon Hai Precision Industry Co., Ltd. Foxconn (Far East) Limited and subsidiaries 1 Sales $ 53,634,030 Note c 2
0 Hon Hai Precision Industry Co., Ltd. Foxconn (Far East) Limited and subsidiaries 1 Purchases 302,063,412 Note c 9
0 Hon Hai Precision Industry Co., Ltd. Foxconn (Far East) Limited and subsidiaries 1 Accounts receivable 37,322,266 Note c 2
0 Hon Hai Precision Industry Co., Ltd. Foxconn (Far East) Limited and subsidiaries 1 Other receivables 67,767,858 Note c 4
0 Hon Hai Precision Industry Co., Ltd. Foxconn (Far East) Limited and subsidiaries 1 Accounts payable ( 92,445,026) Note c 5
0 Hon Hai Precision Industry Co., Ltd. Best Leap Enterprises Limited 1 Purchases 904,829,843 Note c 26
0 Hon Hai Precision Industry Co., Ltd. Best Leap Enterprises Limited 1 Accounts payable ( 142,271,576) Note c 8
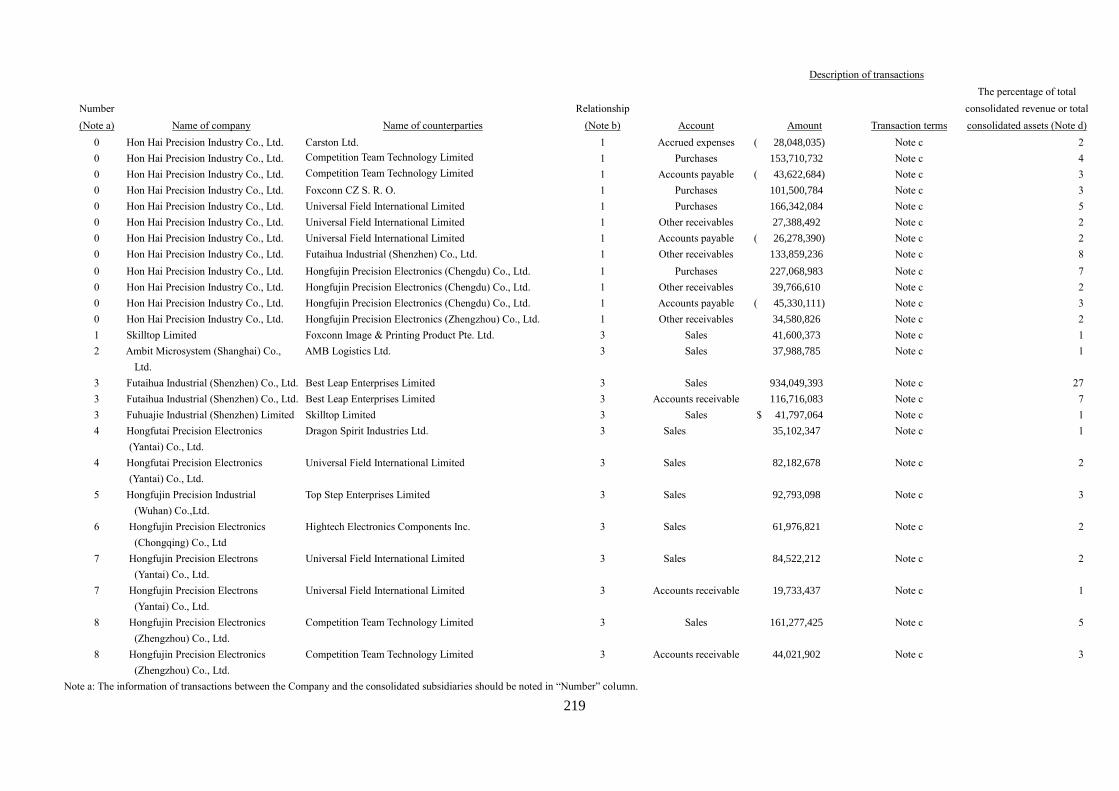
219
Description of transactions
The percentage of total
Number Relationship consolidated revenue or total
(Note a) Name of company Name of counterparties (Note b) Account Amount Transaction terms consolidated assets (Note d)
0 Hon Hai Precision Industry Co., Ltd. Carston Ltd. 1 Accrued expenses ( 28,048,035) Note c 2
0 Hon Hai Precision Industry Co., Ltd. Competition Team Technology Limited 1 Purchases 153,710,732 Note c 4
0 Hon Hai Precision Industry Co., Ltd. Competition Team Technology Limited 1 Accounts payable ( 43,622,684) Note c 3
0 Hon Hai Precision Industry Co., Ltd. Foxconn CZ S. R. O. 1 Purchases 101,500,784 Note c 3
0 Hon Hai Precision Industry Co., Ltd. Universal Field International Limited 1 Purchases 166,342,084 Note c 5
0 Hon Hai Precision Industry Co., Ltd. Universal Field International Limited 1 Other receivables 27,388,492 Note c 2
0 Hon Hai Precision Industry Co., Ltd. Universal Field International Limited 1 Accounts payable ( 26,278,390) Note c 2
0 Hon Hai Precision Industry Co., Ltd. Futaihua Industrial (Shenzhen) Co., Ltd. 1 Other receivables 133,859,236 Note c 8
0 Hon Hai Precision Industry Co., Ltd. Hongfujin Precision Electronics (Chengdu) Co., Ltd. 1 Purchases 227,068,983 Note c 7
0 Hon Hai Precision Industry Co., Ltd. Hongfujin Precision Electronics (Chengdu) Co., Ltd. 1 Other receivables 39,766,610 Note c 2
0 Hon Hai Precision Industry Co., Ltd. Hongfujin Precision Electronics (Chengdu) Co., Ltd. 1 Accounts payable ( 45,330,111) Note c 3
0 Hon Hai Precision Industry Co., Ltd. Hongfujin Precision Electronics (Zhengzhou) Co., Ltd. 1 Other receivables 34,580,826 Note c 2
1 Skilltop Limited Foxconn Image & Printing Product Pte. Ltd. 3 Sales 41,600,373 Note c 1
2 Ambit Microsystem (Shanghai) Co.,
Ltd.
AMB Logistics Ltd. 3 Sales 37,988,785 Note c 1
3 Futaihua Industrial (Shenzhen) Co., Ltd. Best Leap Enterprises Limited 3 Sales 934,049,393 Note c 27
3 Futaihua Industrial (Shenzhen) Co., Ltd. Best Leap Enterprises Limited 3 Accounts receivable 116,716,083 Note c 7
3 Fuhuajie Industrial (Shenzhen) Limited Skilltop Limited 3 Sales $ 41,797,064 Note c 1
4 Hongfutai Precision Electronics
(Yantai) Co., Ltd.
Dragon Spirit Industries Ltd. 3 Sales 35,102,347 Note c 1
4 Hongfutai Precision Electronics
(Yantai) Co., Ltd.
Universal Field International Limited 3 Sales 82,182,678 Note c 2
5 Hongfujin Precision Industrial
(Wuhan) Co.,Ltd.
Top Step Enterprises Limited 3 Sales 92,793,098 Note c 3
6 Hongfujin Precision Electronics
(Chongqing) Co., Ltd
Hightech Electronics Components Inc. 3 Sales 61,976,821 Note c 2
7 Hongfujin Precision Electrons
(Yantai) Co., Ltd.
Universal Field International Limited 3 Sales 84,522,212 Note c 2
7 Hongfujin Precision Electrons
(Yantai) Co., Ltd.
Universal Field International Limited 3 Accounts receivable 19,733,437 Note c 1
8 Hongfujin Precision Electronics
(Zhengzhou) Co., Ltd.
Competition Team Technology Limited 3 Sales 161,277,425 Note c 5
8 Hongfujin Precision Electronics
(Zhengzhou) Co., Ltd.
Competition Team Technology Limited 3 Accounts receivable 44,021,902 Note c 3
Note a: The information of transactions between the Company and the consolidated subsidiaries should be noted in “Number” column.
220
1. Number 0 represents the Company.
2. The consolidated subsidiaries are numbered in order from number 1.
Note b: The transaction relationships with the counterparties are as follows:
1. The Company to the consolidated subsidiaries.
2. The consolidated subsidiaries to the Company.
3. The consolidated subsidiaries to another consolidated subsidiaries.
Note c: The prices and terms to related parties were not significantly different from transactions with third parties, except for particular transactions with no similar transactions to compare with. For these transactions, the prices and terms
were determined in accordance with mutual agreements.
Note d: In calculating the ratio, the transaction amount is divided by consolidated total assets for balance sheet accounts and is divided by consolidated total revenues for income statement accounts.
Note e: For balance sheet accounts, transactions exceeding 1% of the consolidated total assets should be disclosed; for income statement accounts, transactions exceeding 1% of the consolidated total revenue should be disclosed.
All the transactions had been eliminated when preparing consolidated financial statement.
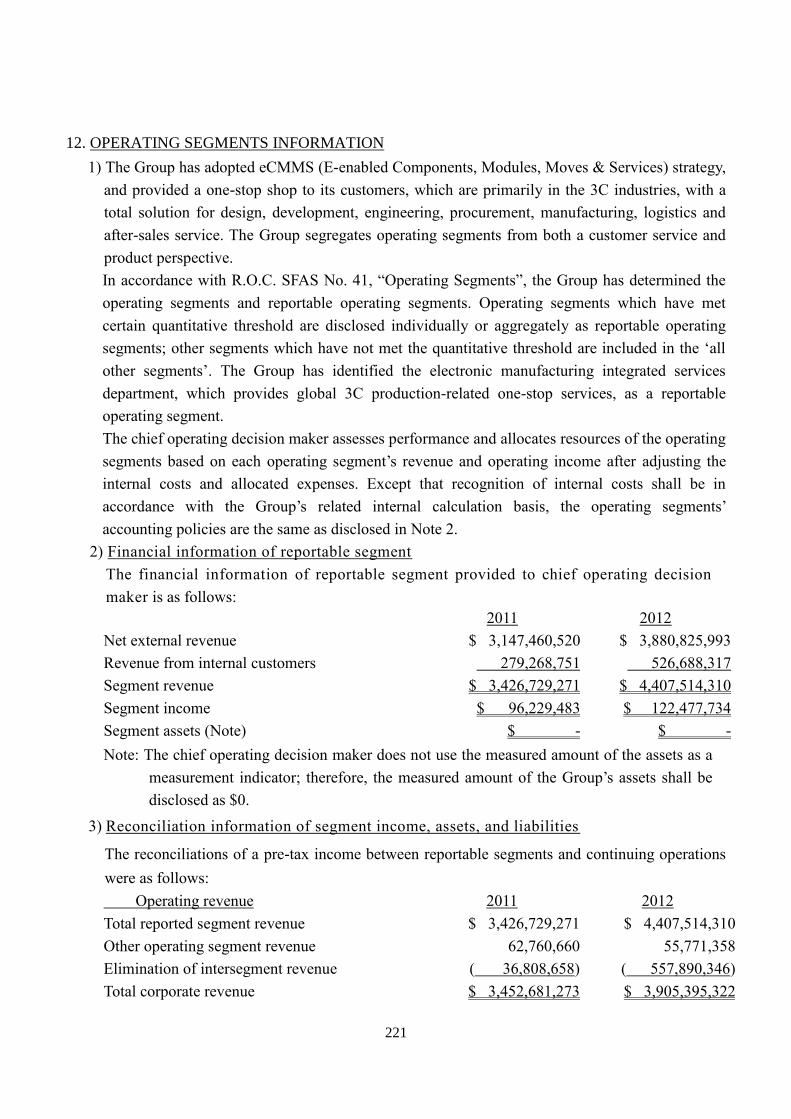
221
12. OPERATING SEGMENTS INFORMATION
1) The Group has adopted eCMMS (E-enabled Components, Modules, Moves & Services) strategy,
and provided a one-stop shop to its customers, which are primarily in the 3C industries, with a
total solution for design, development, engineering, procurement, manufacturing, logistics and
after-sales service. The Group segregates operating segments from both a customer service and
product perspective.
In accordance with R.O.C. SFAS No. 41, “Operating Segments”, the Group has determined the
operating segments and reportable operating segments. Operating segments which have met
certain quantitative threshold are disclosed individually or aggregately as reportable operating
segments; other segments which have not met the quantitative threshold are included in the ‘all
other segments’. The Group has identified the electronic manufacturing integrated services
department, which provides global 3C production-related one-stop services, as a reportable
operating segment.
The chief operating decision maker assesses performance and allocates resources of the operating
segments based on each operating segment’s revenue and operating income after adjusting the
internal costs and allocated expenses. Except that recognition of internal costs shall be in
accordance with the Group’s related internal calculation basis, the operating segments’
accounting policies are the same as disclosed in Note 2.
2) Financial information of reportable segment
The financial information of reportable segment provided to chief operating decision
maker is as follows:
2011 2012
Net external revenue $ 3,147,460,520 $ 3,880,825,993
Revenue from internal customers 279,268,751 526,688,317
Segment revenue $ 3,426,729,271 $ 4,407,514,310
Segment income $ 96,229,483 $ 122,477,734
Segment assets (Note) $ - $ -
Note: The chief operating decision maker does not use the measured amount of the assets as a
measurement indicator; therefore, the measured amount of the Group’s assets shall be
disclosed as $0.
3) Reconciliation information of segment income, assets, and liabilities
The reconciliations of a pre-tax income between reportable segments and continuing operations
were as follows:
Operating revenue 2011 2012
Total reported segment revenue $ 3,426,729,271 $ 4,407,514,310
Other operating segment revenue 62,760,660 55,771,358
Elimination of intersegment revenue ( 36,808,658) ( 557,890,346)
Total corporate revenue $ 3,452,681,273 $ 3,905,395,322
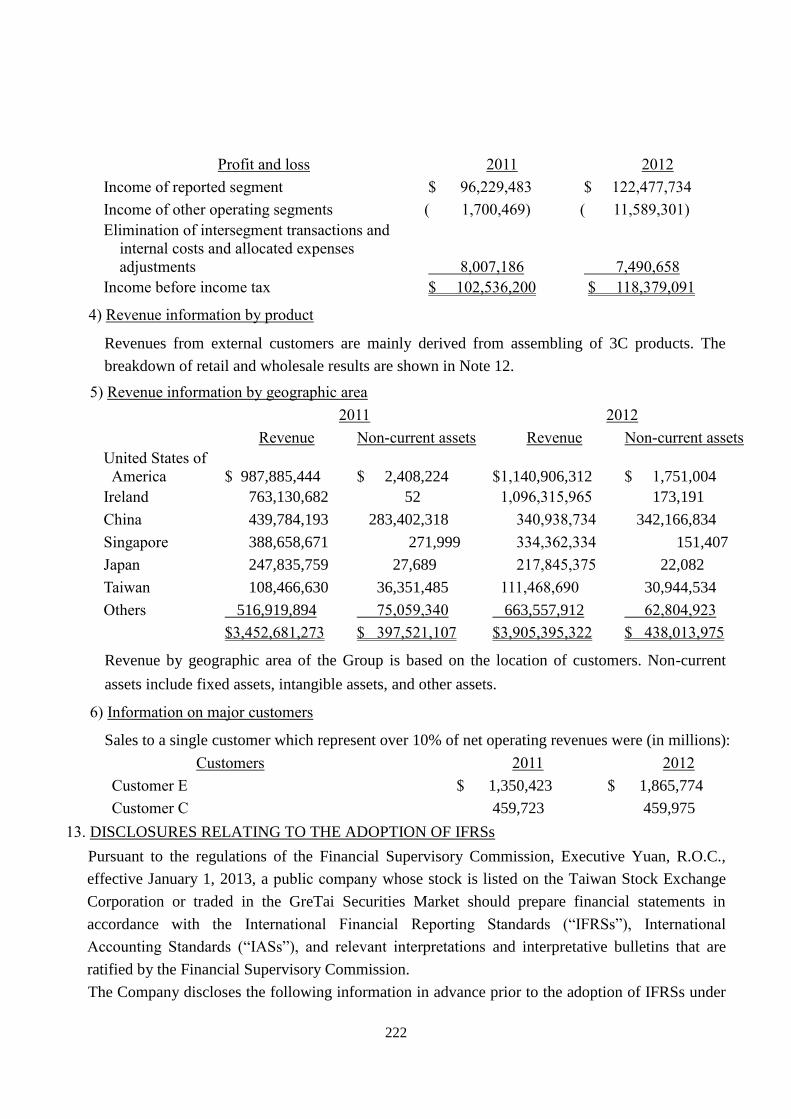
222
Profit and loss 2011 2012
Income of reported segment $ 96,229,483 $ 122,477,734
Income of other operating segments ( 1,700,469) ( 11,589,301)
Elimination of intersegment transactions and
internal costs and allocated expenses
adjustments 8,007,186 7,490,658
Income before income tax $ 102,536,200 $ 118,379,091
4) Revenue information by product
Revenues from external customers are mainly derived from assembling of 3C products. The
breakdown of retail and wholesale results are shown in Note 12.
5) Revenue information by geographic area
2011 2012
Revenue Non-current assets Revenue Non-current assets
United States of
America $ 987,885,444 $ 2,408,224 $1,140,906,312 $ 1,751,004
Ireland 763,130,682 52 1,096,315,965 173,191
China 439,784,193 283,402,318 340,938,734 342,166,834
Singapore 388,658,671 271,999 334,362,334 151,407
Japan 247,835,759 27,689 217,845,375 22,082
Taiwan 108,466,630 36,351,485 111,468,690 30,944,534
Others 516,919,894 75,059,340 663,557,912 62,804,923
$3,452,681,273 $ 397,521,107 $3,905,395,322 $ 438,013,975
Revenue by geographic area of the Group is based on the location of customers. Non-current
assets include fixed assets, intangible assets, and other assets.
6) Information on major customers
Sales to a single customer which represent over 10% of net operating revenues were (in millions):
Customers 2011 2012
Customer E $ 1,350,423 $ 1,865,774
Customer C 459,723 459,975
13. DISCLOSURES RELATING TO THE ADOPTION OF IFRSs
Pursuant to the regulations of the Financial Supervisory Commission, Executive Yuan, R.O.C.,
effective January 1, 2013, a public company whose stock is listed on the Taiwan Stock Exchange
Corporation or traded in the GreTai Securities Market should prepare financial statements in
accordance with the International Financial Reporting Standards (“IFRSs”), International
Accounting Standards (“IASs”), and relevant interpretations and interpretative bulletins that are
ratified by the Financial Supervisory Commission.
The Company discloses the following information in advance prior to the adoption of IFRSs under
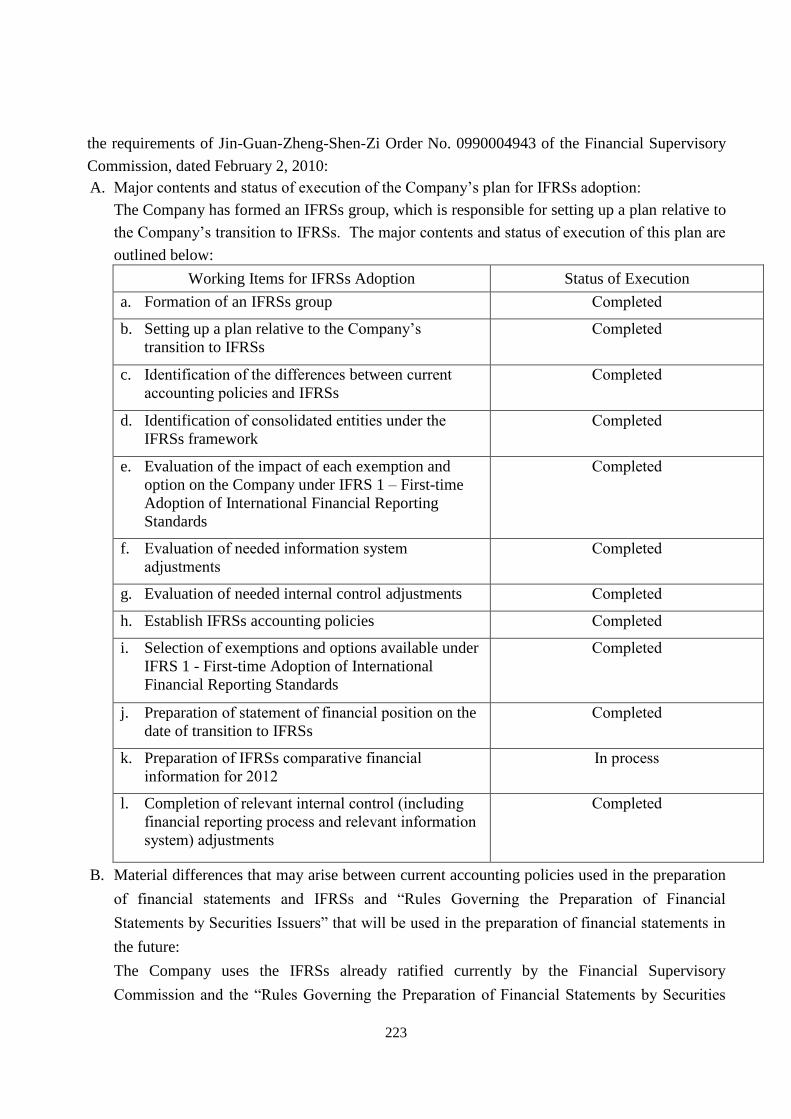
223
the requirements of Jin-Guan-Zheng-Shen-Zi Order No. 0990004943 of the Financial Supervisory
Commission, dated February 2, 2010:
A. Major contents and status of execution of the Company’s plan for IFRSs adoption:
The Company has formed an IFRSs group, which is responsible for setting up a plan relative to
the Company’s transition to IFRSs. The major contents and status of execution of this plan are
outlined below:
Working Items for IFRSs Adoption Status of Execution
a. Formation of an IFRSs group Completed
b. Setting up a plan relative to the Company’s
transition to IFRSs
Completed
c. Identification of the differences between current
accounting policies and IFRSs
Completed
d. Identification of consolidated entities under the
IFRSs framework
Completed
e. Evaluation of the impact of each exemption and
option on the Company under IFRS 1 – First-time
Adoption of International Financial Reporting
Standards
Completed
f. Evaluation of needed information system
adjustments
Completed
g. Evaluation of needed internal control adjustments Completed
h. Establish IFRSs accounting policies Completed
i. Selection of exemptions and options available under
IFRS 1 - First-time Adoption of International
Financial Reporting Standards
Completed
j. Preparation of statement of financial position on the
date of transition to IFRSs
Completed
k. Preparation of IFRSs comparative financial
information for 2012
In process
l. Completion of relevant internal control (including
financial reporting process and relevant information
system) adjustments
Completed
B. Material differences that may arise between current accounting policies used in the preparation
of financial statements and IFRSs and “Rules Governing the Preparation of Financial
Statements by Securities Issuers” that will be used in the preparation of financial statements in
the future:
The Company uses the IFRSs already ratified currently by the Financial Supervisory
Commission and the “Rules Governing the Preparation of Financial Statements by Securities
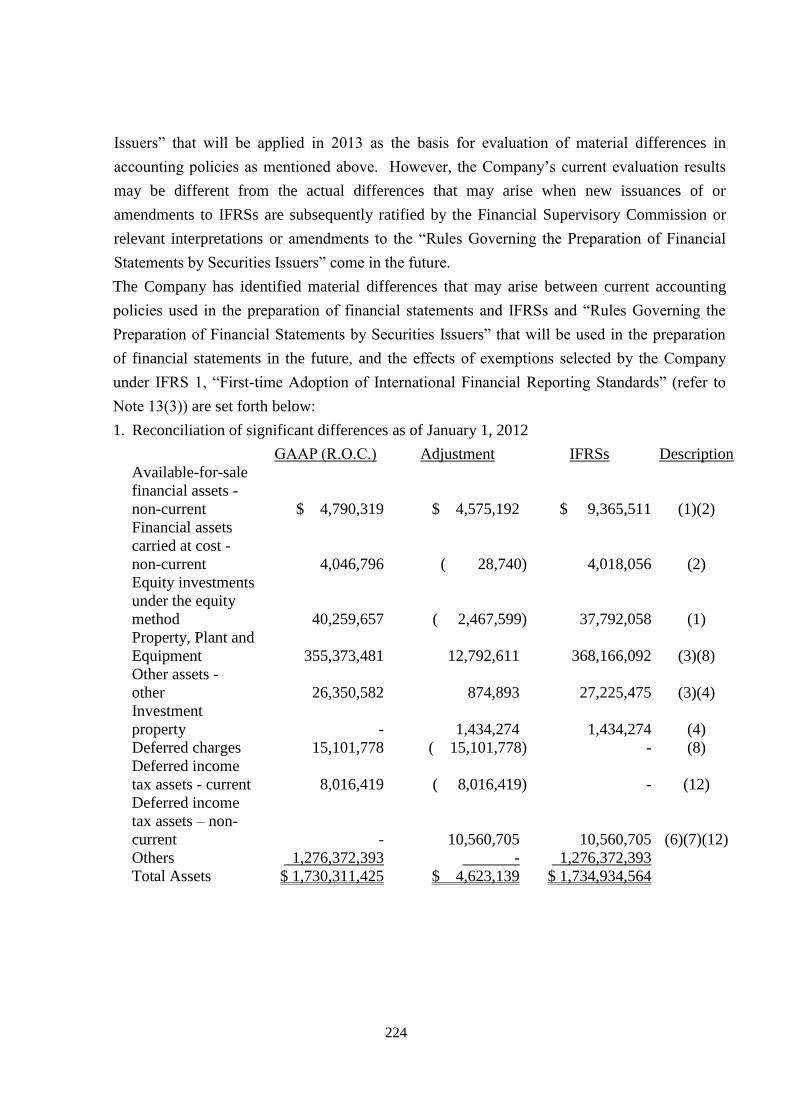
224
Issuers” that will be applied in 2013 as the basis for evaluation of material differences in
accounting policies as mentioned above. However, the Company’s current evaluation results
may be different from the actual differences that may arise when new issuances of or
amendments to IFRSs are subsequently ratified by the Financial Supervisory Commission or
relevant interpretations or amendments to the “Rules Governing the Preparation of Financial
Statements by Securities Issuers” come in the future.
The Company has identified material differences that may arise between current accounting
policies used in the preparation of financial statements and IFRSs and “Rules Governing the
Preparation of Financial Statements by Securities Issuers” that will be used in the preparation
of financial statements in the future, and the effects of exemptions selected by the Company
under IFRS 1, “First-time Adoption of International Financial Reporting Standards” (refer to
Note 13(3)) are set forth below:
1. Reconciliation of significant differences as of January 1, 2012
GAAP (R.O.C.) Adjustment IFRSs Description
Available-for-sale
financial assets -
non-current $ 4,790,319 $ 4,575,192 $ 9,365,511 (1)(2)
Financial assets
carried at cost -
non-current 4,046,796 ( 28,740) 4,018,056 (2)
Equity investments
under the equity
method 40,259,657 ( 2,467,599) 37,792,058 (1)
Property, Plant and
Equipment 355,373,481 12,792,611 368,166,092 (3)(8)
Other assets -
other 26,350,582 874,893 27,225,475 (3)(4)
Investment
property - 1,434,274 1,434,274 (4)
Deferred charges 15,101,778 ( 15,101,778) - (8)
Deferred income
tax assets - current 8,016,419 ( 8,016,419) - (12)
Deferred income
tax assets – non-
current - 10,560,705 10,560,705 (6)(7)(12)
Others 1,276,372,393 - 1,276,372,393
Total Assets $ 1,730,311,425 $ 4,623,139 $ 1,734,934,564
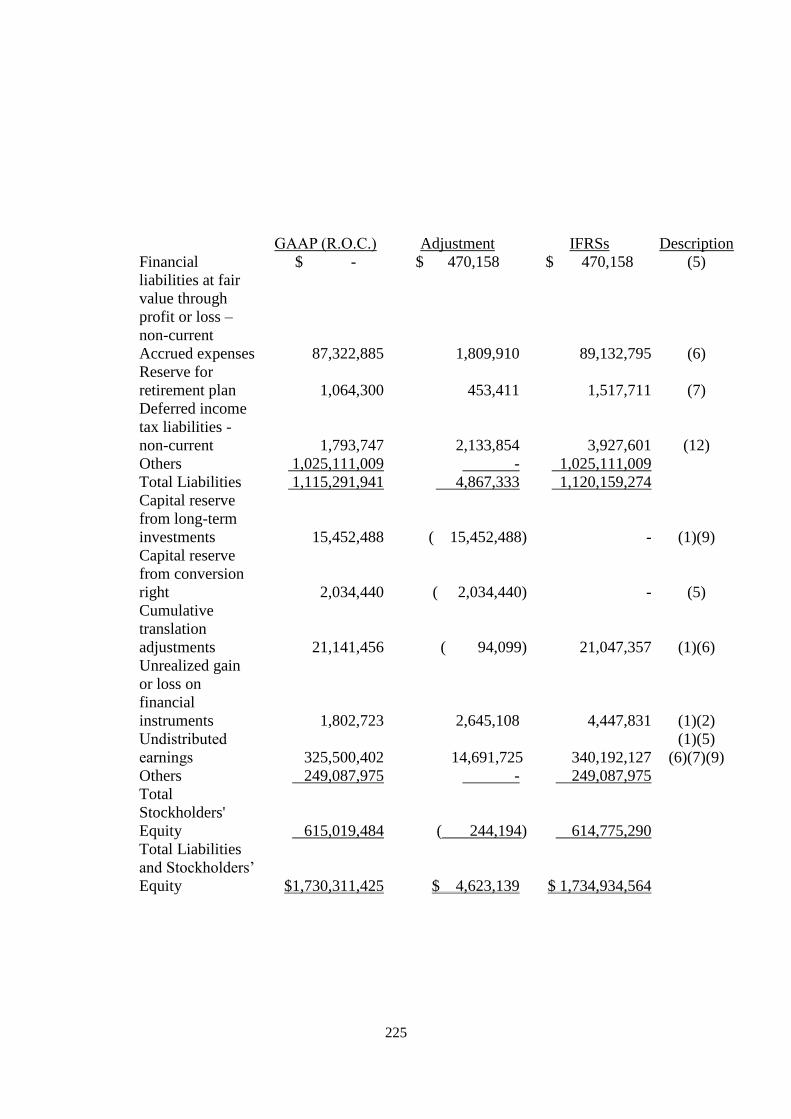
225
GAAP (R.O.C.) Adjustment IFRSs Description
Financial
liabilities at fair
value through
profit or loss –
non-current
$ - $ 470,158 $ 470,158 (5)
Accrued expenses 87,322,885 1,809,910 89,132,795 (6)
Reserve for
retirement plan 1,064,300 453,411 1,517,711 (7)
Deferred income
tax liabilities -
non-current 1,793,747 2,133,854 3,927,601 (12)
Others 1,025,111,009 - 1,025,111,009
Total Liabilities 1,115,291,941 4,867,333 1,120,159,274
Capital reserve
from long-term
investments 15,452,488 ( 15,452,488) - (1)(9)
Capital reserve
from conversion
right 2,034,440 ( 2,034,440) - (5)
Cumulative
translation
adjustments 21,141,456 ( 94,099) 21,047,357 (1)(6)
Unrealized gain
or loss on
financial
instruments 1,802,723 2,645,108 4,447,831 (1)(2)
Undistributed
earnings 325,500,402 14,691,725 340,192,127
(1)(5)
(6)(7)(9)
Others 249,087,975 - 249,087,975
Total
Stockholders'
Equity 615,019,484 ( 244,194) 614,775,290
Total Liabilities
and Stockholders’
Equity $1,730,311,425 $ 4,623,139 $ 1,734,934,564
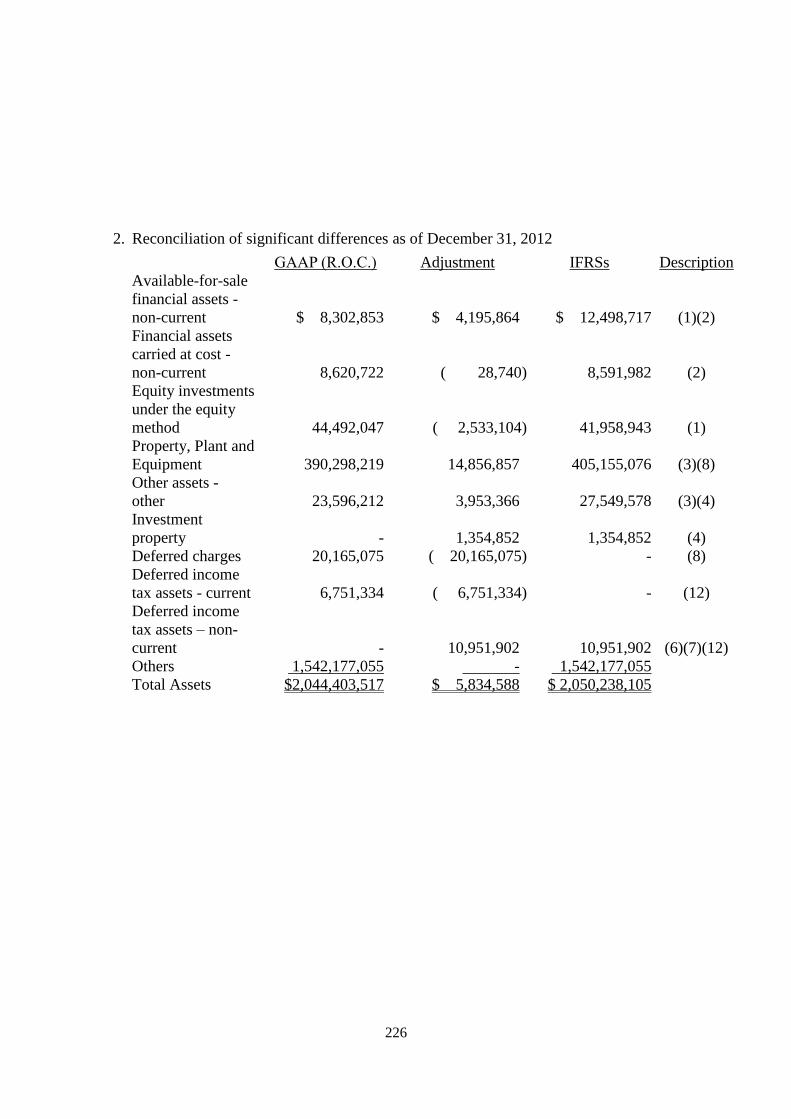
226
2. Reconciliation of significant differences as of December 31, 2012
GAAP (R.O.C.) Adjustment IFRSs Description
Available-for-sale
financial assets -
non-current $ 8,302,853 $ 4,195,864 $ 12,498,717 (1)(2)
Financial assets
carried at cost -
non-current 8,620,722 ( 28,740) 8,591,982 (2)
Equity investments
under the equity
method 44,492,047 ( 2,533,104) 41,958,943 (1)
Property, Plant and
Equipment 390,298,219 14,856,857 405,155,076 (3)(8)
Other assets -
other 23,596,212 3,953,366 27,549,578 (3)(4)
Investment
property - 1,354,852 1,354,852 (4)
Deferred charges 20,165,075 ( 20,165,075) - (8)
Deferred income
tax assets - current 6,751,334 ( 6,751,334) - (12)
Deferred income
tax assets – non-
current - 10,951,902 10,951,902 (6)(7)(12)
Others 1,542,177,055 - 1,542,177,055
Total Assets $2,044,403,517 $ 5,834,588 $ 2,050,238,105
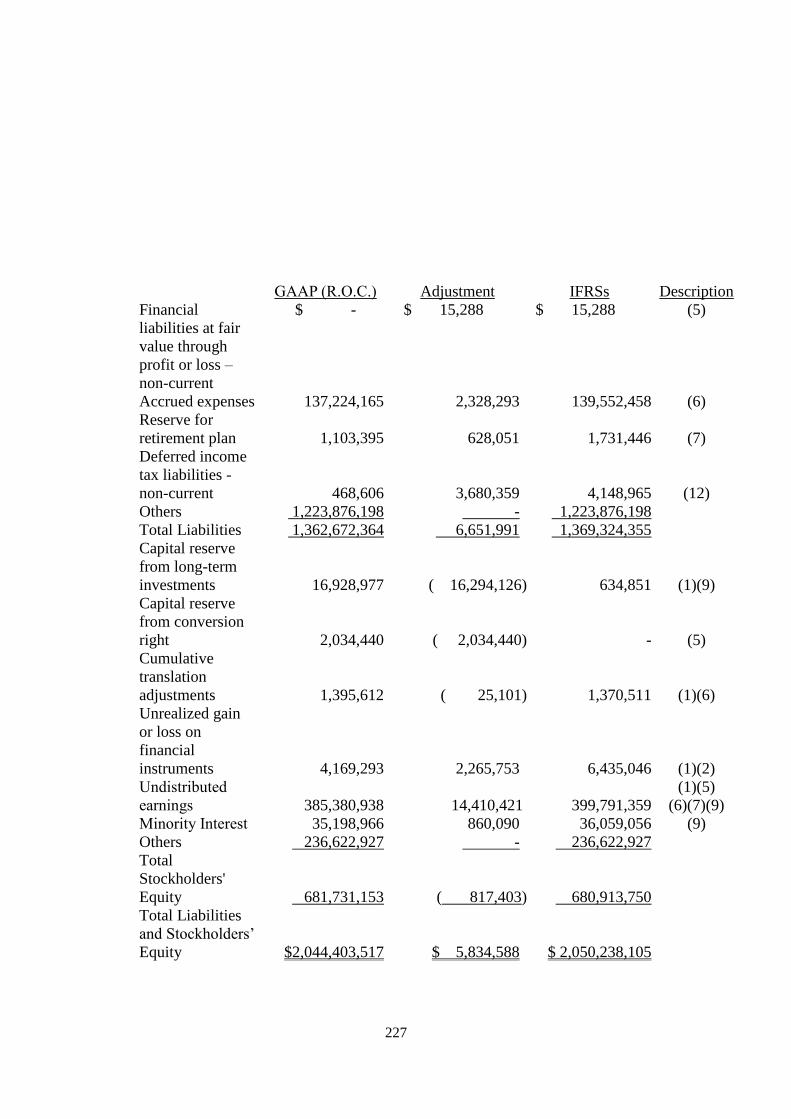
227
GAAP (R.O.C.) Adjustment IFRSs Description
Financial
liabilities at fair
value through
profit or loss –
non-current
$ - $ 15,288 $ 15,288 (5)
Accrued expenses 137,224,165 2,328,293 139,552,458 (6)
Reserve for
retirement plan 1,103,395 628,051 1,731,446 (7)
Deferred income
tax liabilities -
non-current 468,606 3,680,359 4,148,965 (12)
Others 1,223,876,198 - 1,223,876,198
Total Liabilities 1,362,672,364 6,651,991 1,369,324,355
Capital reserve
from long-term
investments 16,928,977 ( 16,294,126) 634,851 (1)(9)
Capital reserve
from conversion
right 2,034,440 ( 2,034,440) - (5)
Cumulative
translation
adjustments 1,395,612 ( 25,101) 1,370,511 (1)(6)
Unrealized gain
or loss on
financial
instruments 4,169,293 2,265,753 6,435,046 (1)(2)
Undistributed
earnings 385,380,938 14,410,421 399,791,359
(1)(5)
(6)(7)(9)
Minority Interest 35,198,966 860,090 36,059,056 (9)
Others 236,622,927 - 236,622,927
Total
Stockholders'
Equity 681,731,153 ( 817,403) 680,913,750
Total Liabilities
and Stockholders’
Equity $2,044,403,517 $ 5,834,588 $ 2,050,238,105
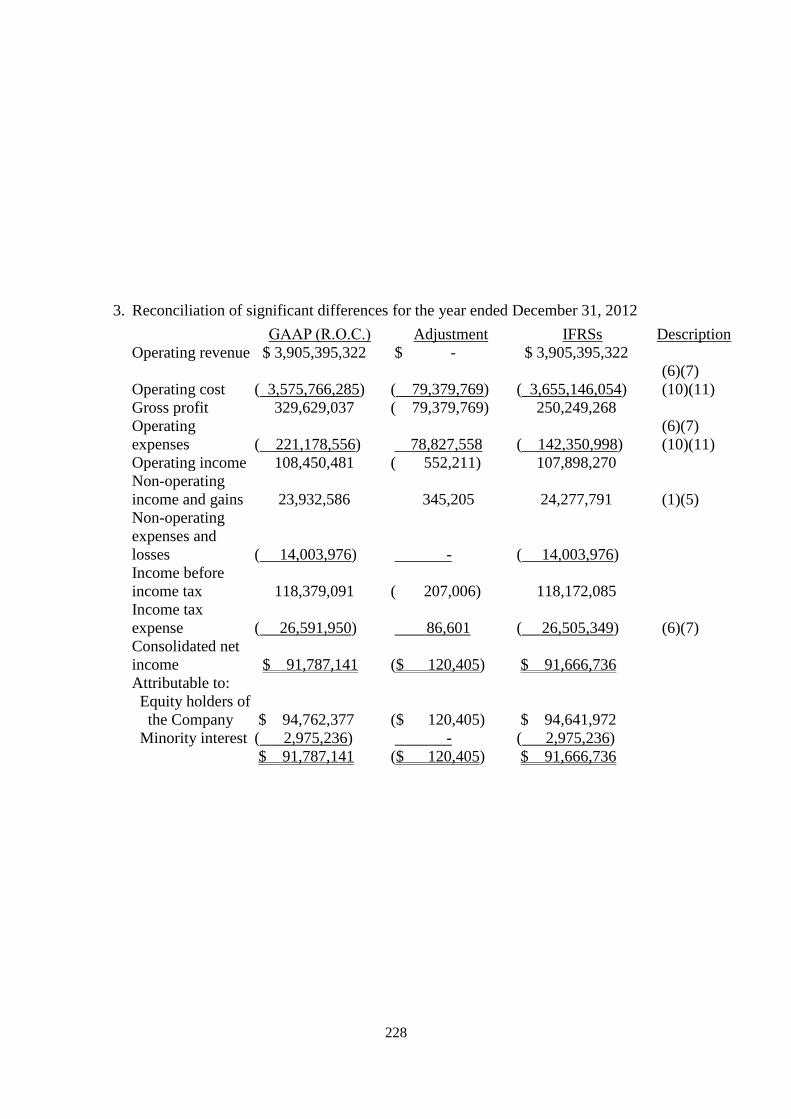
228
3. Reconciliation of significant differences for the year ended December 31, 2012
GAAP (R.O.C.) Adjustment IFRSs Description
Operating revenue $ 3,905,395,322 $ - $ 3,905,395,322
Operating cost ( 3,575,766,285) ( 79,379,769) ( 3,655,146,054)
(6)(7)
(10)(11)
Gross profit 329,629,037 ( 79,379,769) 250,249,268
Operating
expenses ( 221,178,556) 78,827,558 ( 142,350,998)
(6)(7)
(10)(11)
Operating income 108,450,481 ( 552,211) 107,898,270
Non-operating
income and gains 23,932,586 345,205 24,277,791 (1)(5)
Non-operating
expenses and
losses ( 14,003,976) - ( 14,003,976)
Income before
income tax 118,379,091 ( 207,006) 118,172,085
Income tax
expense ( 26,591,950) 86,601 ( 26,505,349) (6)(7)
Consolidated net
income $ 91,787,141 ($ 120,405) $ 91,666,736
Attributable to:
Equity holders of
the Company $ 94,762,377 ($ 120,405) $ 94,641,972
Minority interest ( 2,975,236) - ( 2,975,236)
$ 91,787,141 ($ 120,405) $ 91,666,736
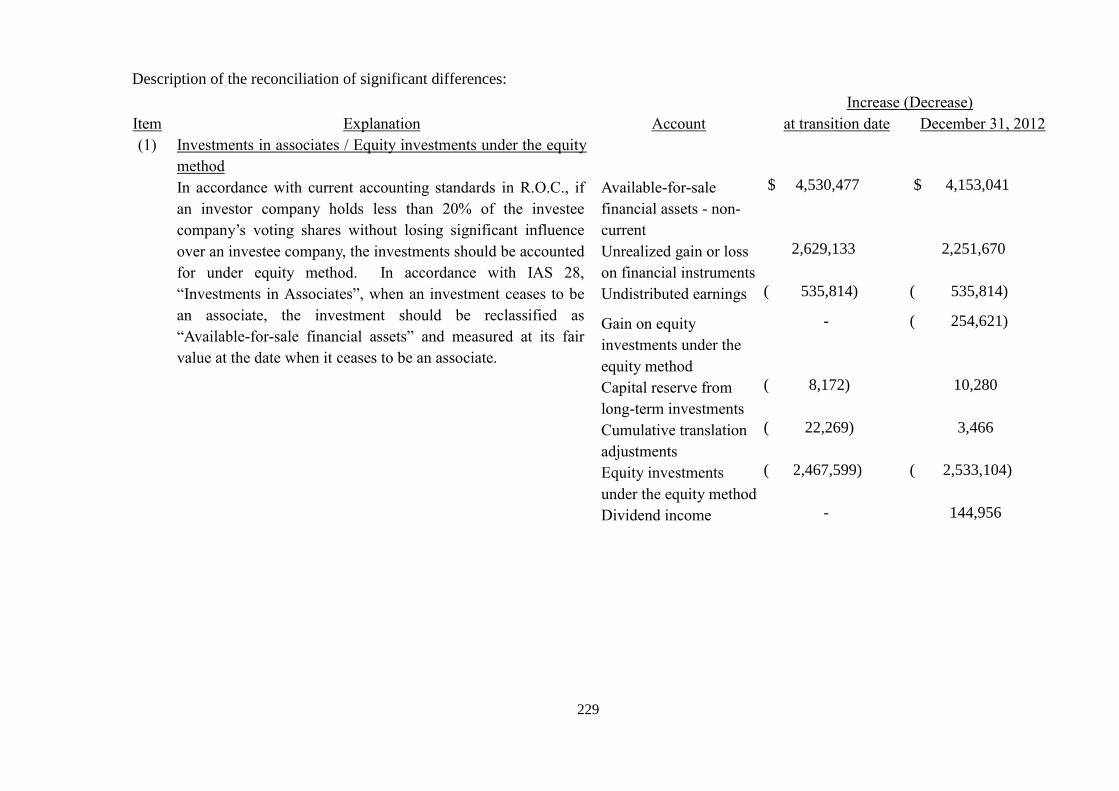
229
Description of the reconciliation of significant differences:
Increase (Decrease)
Item Explanation Account at transition date December 31, 2012
(1) Investments in associates / Equity investments under the equity
method
In accordance with current accounting standards in R.O.C., if
an investor company holds less than 20% of the investee
company’s voting shares without losing significant influence
over an investee company, the investments should be accounted
for under equity method. In accordance with IAS 28,
“Investments in Associates”, when an investment ceases to be
an associate, the investment should be reclassified as
“Available-for-sale financial assets” and measured at its fair
value at the date when it ceases to be an associate.
Available-for-sale
financial assets - non-
current
$ 4,530,477 $ 4,153,041
Unrealized gain or loss
on financial instruments
2,629,133 2,251,670
Undistributed earnings ( 535,814) ( 535,814)
Gain on equity
investments under the
equity method
- ( 254,621)
Capital reserve from
long-term investments
( 8,172) 10,280
Cumulative translation
adjustments
( 22,269) 3,466
Equity investments
under the equity method
( 2,467,599) ( 2,533,104)
Dividend income - 144,956
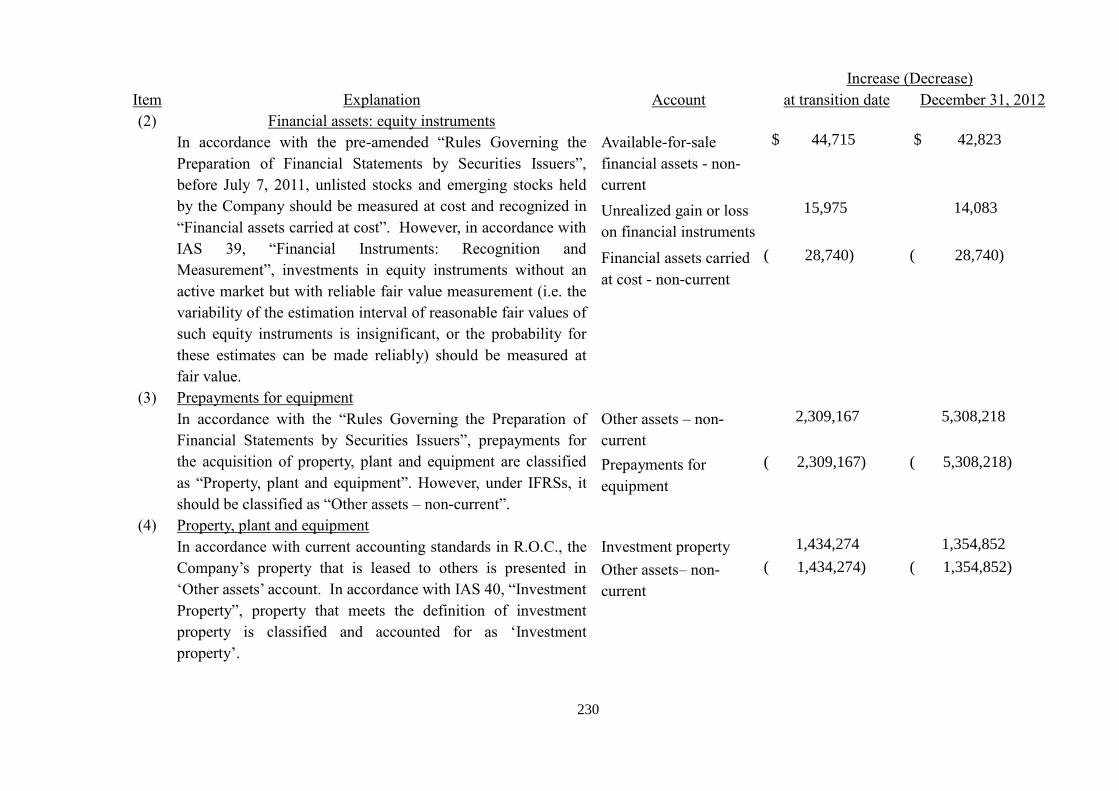
230
Increase (Decrease)
Item Explanation Account at transition date December 31, 2012
(2) Financial assets: equity instruments
In accordance with the pre-amended “Rules Governing the
Preparation of Financial Statements by Securities Issuers”,
before July 7, 2011, unlisted stocks and emerging stocks held
by the Company should be measured at cost and recognized in
“Financial assets carried at cost”. However, in accordance with
IAS 39, “Financial Instruments: Recognition and
Measurement”, investments in equity instruments without an
active market but with reliable fair value measurement (i.e. the
variability of the estimation interval of reasonable fair values of
such equity instruments is insignificant, or the probability for
these estimates can be made reliably) should be measured at
fair value.
Available-for-sale
financial assets - non-
current
$ 44,715 $ 42,823
Unrealized gain or loss
on financial instruments
15,975 14,083
Financial assets carried
at cost - non-current
( 28,740) ( 28,740)
(3) Prepayments for equipment
In accordance with the “Rules Governing the Preparation of
Financial Statements by Securities Issuers”, prepayments for
the acquisition of property, plant and equipment are classified
as “Property, plant and equipment”. However, under IFRSs, it
should be classified as “Other assets – non-current”.
Other assets – non-
current
2,309,167 5,308,218
Prepayments for
equipment
( 2,309,167) ( 5,308,218)
(4) Property, plant and equipment
In accordance with current accounting standards in R.O.C., the
Company’s property that is leased to others is presented in
‘Other assets’ account. In accordance with IAS 40, “Investment
Property”, property that meets the definition of investment
property is classified and accounted for as ‘Investment
property’.
Investment property 1,434,274 1,354,852
Other assets– non-
current
( 1,434,274) ( 1,354,852)
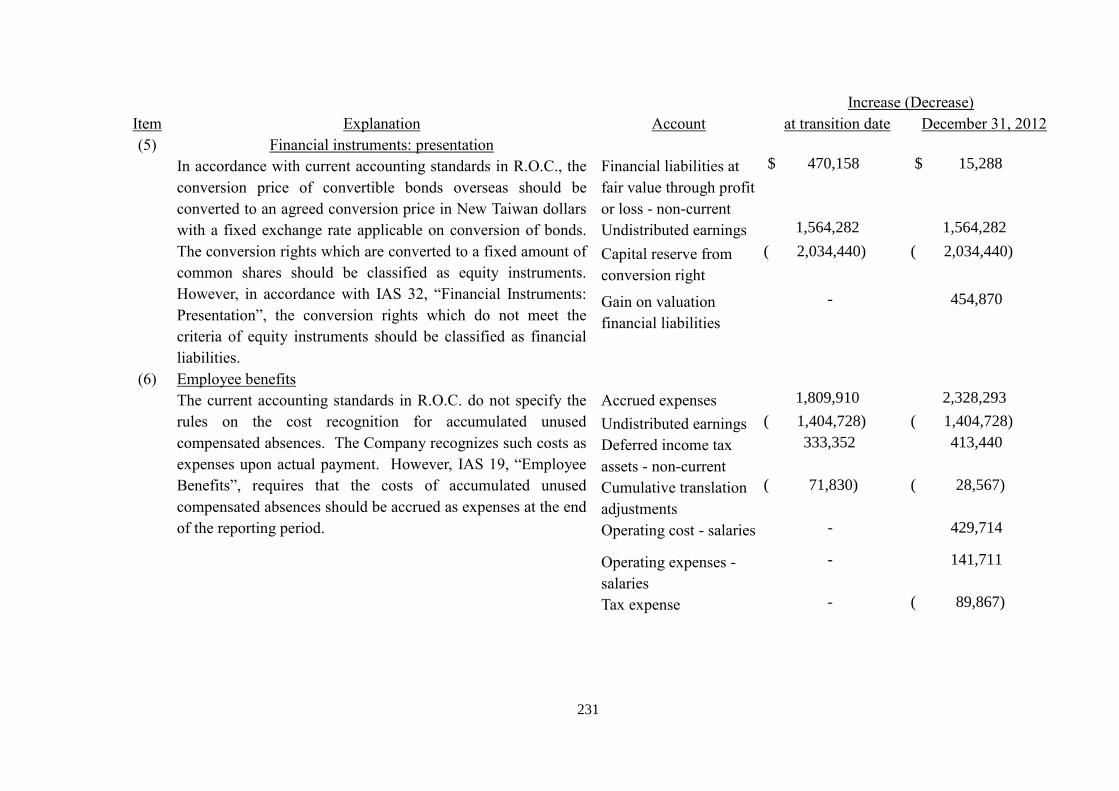
231
Increase (Decrease)
Item Explanation Account at transition date December 31, 2012
(5) Financial instruments: presentation
In accordance with current accounting standards in R.O.C., the
conversion price of convertible bonds overseas should be
converted to an agreed conversion price in New Taiwan dollars
with a fixed exchange rate applicable on conversion of bonds.
The conversion rights which are converted to a fixed amount of
common shares should be classified as equity instruments.
However, in accordance with IAS 32, “Financial Instruments:
Presentation”, the conversion rights which do not meet the
criteria of equity instruments should be classified as financial
liabilities.
Financial liabilities at
fair value through profit
or loss - non-current
$ 470,158 $ 15,288
Undistributed earnings 1,564,282 1,564,282
Capital reserve from
conversion right
( 2,034,440) ( 2,034,440)
Gain on valuation
financial liabilities
- 454,870
(6) Employee benefits
The current accounting standards in R.O.C. do not specify the
rules on the cost recognition for accumulated unused
compensated absences. The Company recognizes such costs as
expenses upon actual payment. However, IAS 19, “Employee
Benefits”, requires that the costs of accumulated unused
compensated absences should be accrued as expenses at the end
of the reporting period.
Accrued expenses 1,809,910 2,328,293
Undistributed earnings ( 1,404,728) ( 1,404,728)
Deferred income tax
assets - non-current
333,352 413,440
Cumulative translation
adjustments
( 71,830) ( 28,567)
Operating cost - salaries - 429,714
Operating expenses -
salaries
- 141,711
Tax expense - ( 89,867)
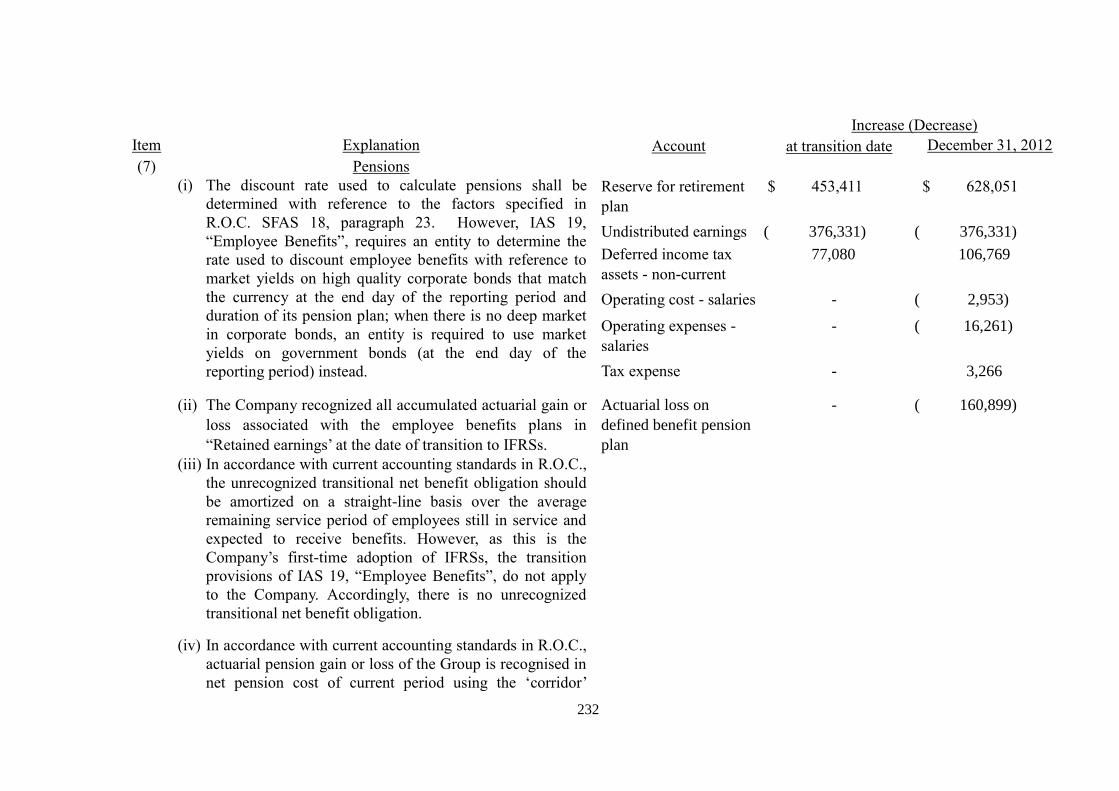
232
Increase (Decrease)
Item Explanation Account at transition date December 31, 2012
(7) Pensions
(i) The discount rate used to calculate pensions shall be
determined with reference to the factors specified in
R.O.C. SFAS 18, paragraph 23. However, IAS 19,
“Employee Benefits”, requires an entity to determine the
rate used to discount employee benefits with reference to
market yields on high quality corporate bonds that match
the currency at the end day of the reporting period and
duration of its pension plan; when there is no deep market
in corporate bonds, an entity is required to use market
yields on government bonds (at the end day of the
reporting period) instead.
Reserve for retirement
plan
$ 453,411 $ 628,051
Undistributed earnings
( 376,331) ( 376,331)
Deferred income tax
assets - non-current
77,080 106,769
Operating cost - salaries - ( 2,953)
Operating expenses -
salaries
- ( 16,261)
Tax expense - 3,266
(ii) The Company recognized all accumulated actuarial gain or
loss associated with the employee benefits plans in
“Retained earnings’ at the date of transition to IFRSs.
Actuarial loss on
defined benefit pension
plan
- ( 160,899)
(iii) In accordance with current accounting standards in R.O.C.,
the unrecognized transitional net benefit obligation should
be amortized on a straight-line basis over the average
remaining service period of employees still in service and
expected to receive benefits. However, as this is the
Company’s first-time adoption of IFRSs, the transition
provisions of IAS 19, “Employee Benefits”, do not apply
to the Company. Accordingly, there is no unrecognized
transitional net benefit obligation.
(iv) In accordance with current accounting standards in R.O.C.,
actuarial pension gain or loss of the Group is recognised in
net pension cost of current period using the ‘corridor’
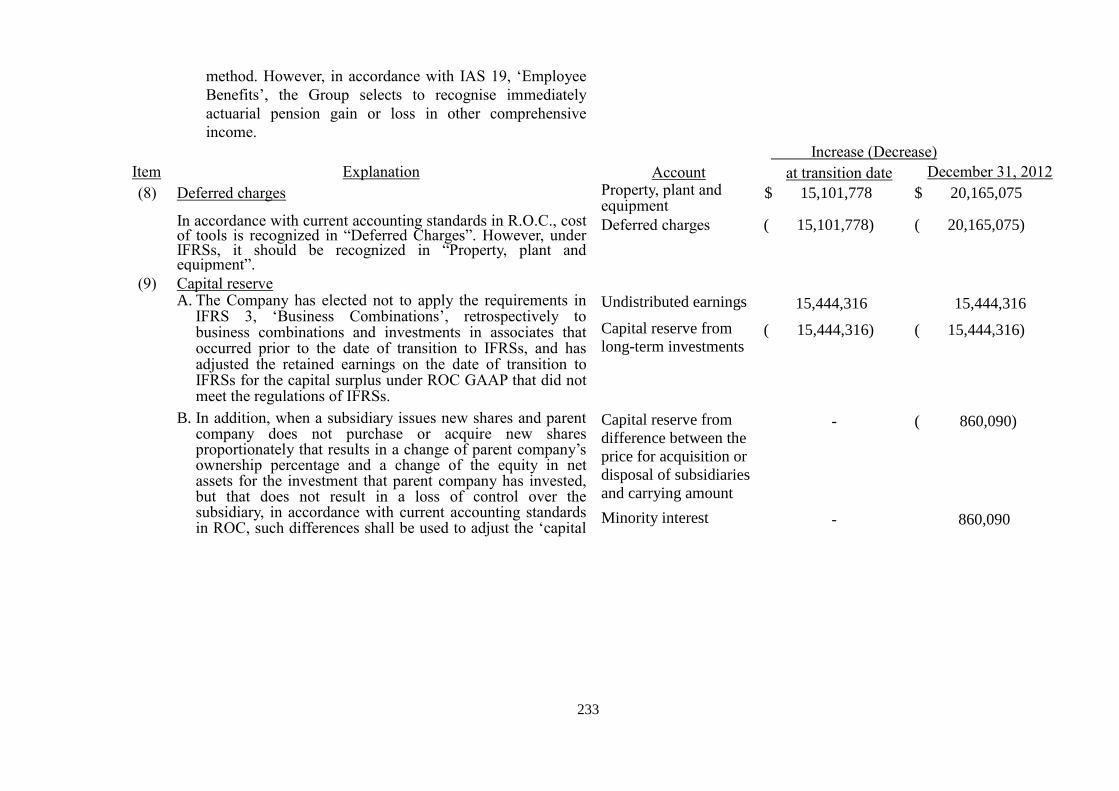
233
method. However, in accordance with IAS 19, ‘Employee
Benefits’, the Group selects to recognise immediately
actuarial pension gain or loss in other comprehensive
income.
Increase (Decrease)
Item Explanation Account at transition date December 31, 2012
(8) Deferred charges Property, plant and equipment
$ 15,101,778 $ 20,165,075
In accordance with current accounting standards in R.O.C., cost of tools is recognized in “Deferred Charges”. However, under IFRSs, it should be recognized in “Property, plant and equipment”.
Deferred charges ( 15,101,778) ( 20,165,075)
(9) Capital reserve
A. The Company has elected not to apply the requirements in IFRS 3, ‘Business Combinations’, retrospectively to business combinations and investments in associates that occurred prior to the date of transition to IFRSs, and has adjusted the retained earnings on the date of transition to IFRSs for the capital surplus under ROC GAAP that did not meet the regulations of IFRSs.
Undistributed earnings 15,444,316 15,444,316
Capital reserve from
long-term investments ( 15,444,316) ( 15,444,316)
B. In addition, when a subsidiary issues new shares and parent company does not purchase or acquire new shares proportionately that results in a change of parent company’s ownership percentage and a change of the equity in net assets for the investment that parent company has invested, but that does not result in a loss of control over the subsidiary, in accordance with current accounting standards in ROC, such differences shall be used to adjust the ‘capital
Capital reserve from
difference between the
price for acquisition or
disposal of subsidiaries
and carrying amount
- ( 860,090)
Minority interest - 860,090
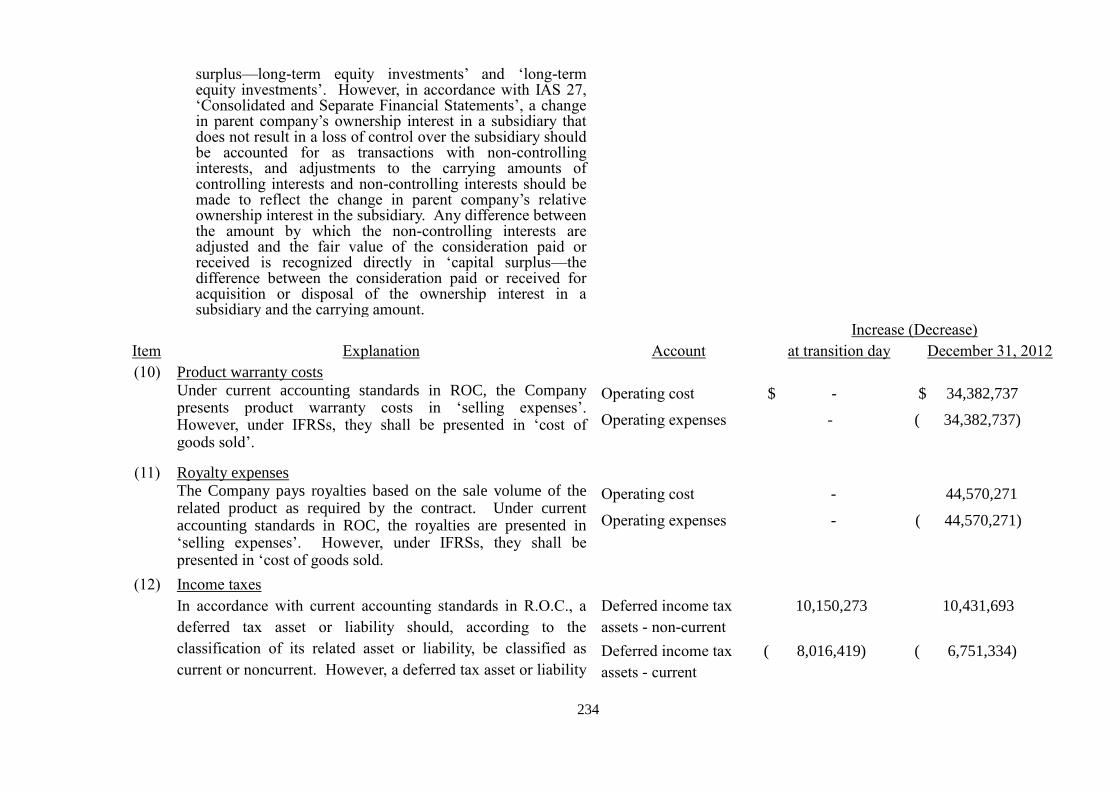
234
surplus—long-term equity investments’ and ‘long-term equity investments’. However, in accordance with IAS 27, ‘Consolidated and Separate Financial Statements’, a change in parent company’s ownership interest in a subsidiary that does not result in a loss of control over the subsidiary should be accounted for as transactions with non-controlling interests, and adjustments to the carrying amounts of controlling interests and non-controlling interests should be made to reflect the change in parent company’s relative ownership interest in the subsidiary. Any difference between the amount by which the non-controlling interests are adjusted and the fair value of the consideration paid or received is recognized directly in ‘capital surplus—the difference between the consideration paid or received for acquisition or disposal of the ownership interest in a subsidiary and the carrying amount.
Increase (Decrease)
Item Explanation Account at transition day December 31, 2012
(10) Product warranty costs
Under current accounting standards in ROC, the Company presents product warranty costs in ‘selling expenses’. However, under IFRSs, they shall be presented in ‘cost of goods sold’.
Operating cost $ - $ 34,382,737
Operating expenses - ( 34,382,737)
(11) Royalty expenses
The Company pays royalties based on the sale volume of the related product as required by the contract. Under current accounting standards in ROC, the royalties are presented in ‘selling expenses’. However, under IFRSs, they shall be presented in ‘cost of goods sold.
Operating cost - 44,570,271
Operating expenses - ( 44,570,271)
(12) Income taxes
In accordance with current accounting standards in R.O.C., a
deferred tax asset or liability should, according to the
classification of its related asset or liability, be classified as
current or noncurrent. However, a deferred tax asset or liability
Deferred income tax
assets - non-current
10,150,273 10,431,693
Deferred income tax
assets - current
( 8,016,419) ( 6,751,334)
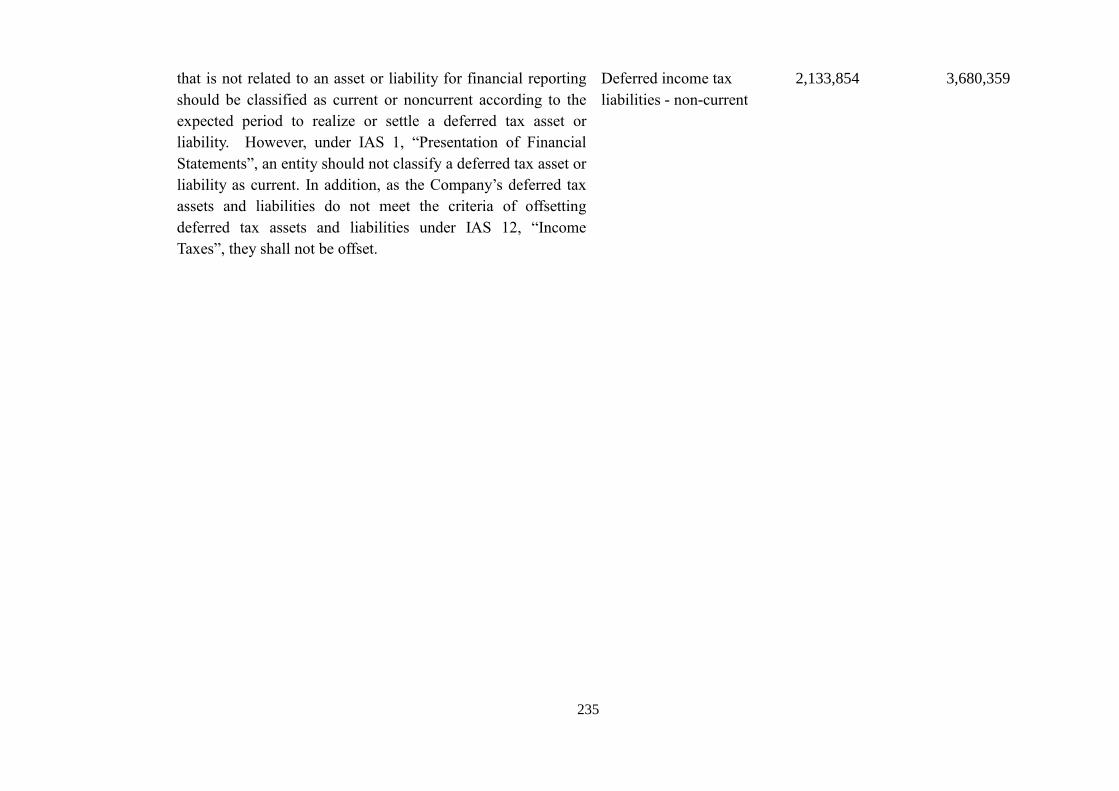
235
that is not related to an asset or liability for financial reporting
should be classified as current or noncurrent according to the
expected period to realize or settle a deferred tax asset or
liability. However, under IAS 1, “Presentation of Financial
Statements”, an entity should not classify a deferred tax asset or
liability as current. In addition, as the Company’s deferred tax
assets and liabilities do not meet the criteria of offsetting
deferred tax assets and liabilities under IAS 12, “Income
Taxes”, they shall not be offset.
Deferred income tax
liabilities - non-current
2,133,854 3,680,359
236
C. Exemptions elected in accordance with IFRS 1, “First-time Adoption of International
Financial Reporting Standards” and the “Rules Governing the Preparation of
Financial Statements by Securities Issuers” that will be applied in 2013 are set forth
below:
1. Business combinations
The Company has elected not to apply the requirements in IFRS 3, “Business
combinations”, retrospectively to business combinations that occurred prior to
transition to IFRSs (Transition Date). This exemption is also applied to investments
in associates of the Company.
2. Share-based payment
The Company has elected not to apply the requirements in IFRS 2, “Share-based
payment”, retrospectively to the equity instruments and liabilities that have been
settled due to share-based payment transactions prior to the Transition Date.
3. Leases
The Company has elected to apply the transitional provisions in IFRIC 4,
“Determining Whether an Arrangement Contains a Lease”. Therefore, the
Company determines whether an arrangement contains a lease based on the facts
and circumstances on the Transition Date.
4. Employee benefits
The Company has elected to recognize all accumulated actuarial gain or loss
associated with the employee benefits plans in ‘Retained earnings’ at the date of
transition to IFRSs, and to disclose the present value of defined benefit obligation,
fair value of plan assets, gain or loss on plan assets and experience adjustments in
accordance with paragraph 120A (P), IAS 19, “Employee Benefits”, based on their
prospective amounts of financial periods from the date of transition to IFRSs.
5. Compound financial instruments
The Company has elected not to segregate between liability components and equity
components of compound financial instruments whose liability components were
not outstanding at the Transition Date.
6. Designation of previously recognized financial instruments
The Company reclassified part of financial assets carried at cost to available-for-
sale financial assets on the Transition Date.
7. Decommissioning liabilities in property, plant and equipment
The Company measured decommissioning liabilities in property, plant and
equipment in accordance with IAS 37, “Provisions, Contingent Liabilities and
Contingent Assets” on the Transition Date.
8. Borrowing costs
The Company has elected to apply the transition provisions in paragraphs 27 and
28 in IAS 23, “Borrowing Costs”, amended in 2007, from the Transition Date.
9. Transfers of assets from customers
The Company has elected to apply the transitional provisions in paragraph 22 of
IFRIC 18, “Transfers of Assets from Customers” from the Transition Date.
The above exemptions are different from the actual selection at the Transition Date
due to the issuance of related regulations by competent authorities, changes in
economic environment, and assessment by the Company.
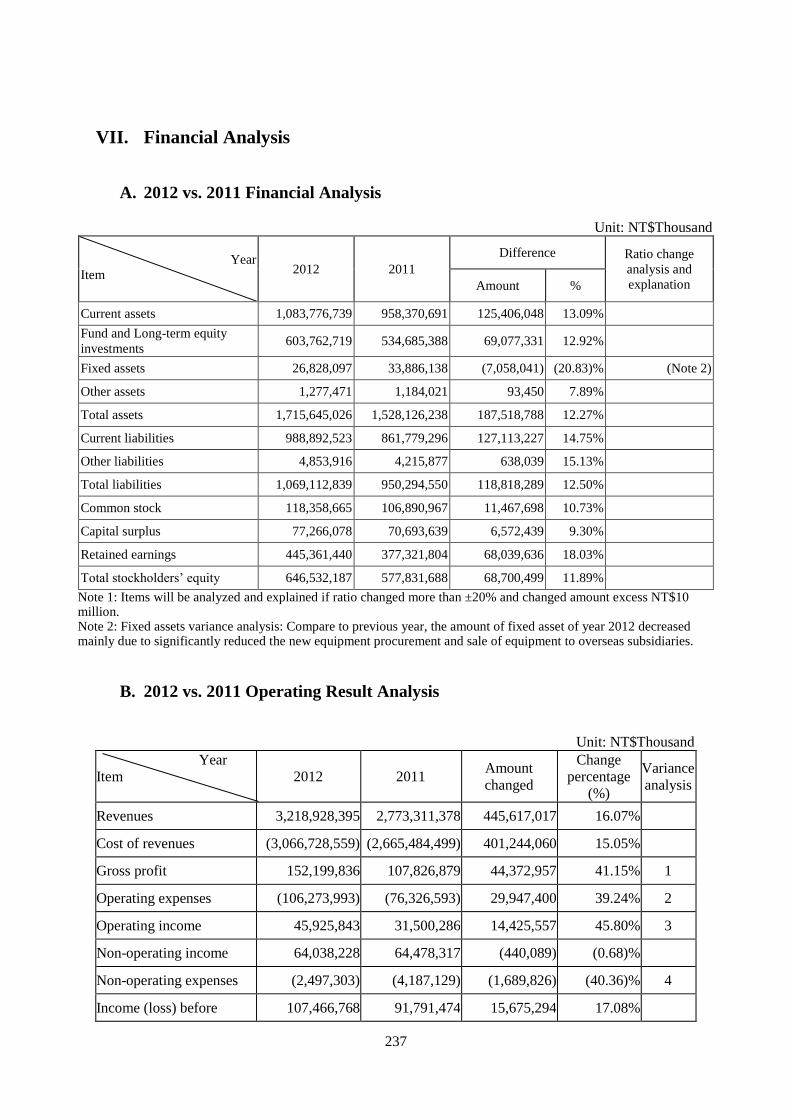
237
VII. Financial Analysis
A. 2012 vs. 2011 Financial Analysis
Unit: NT$Thousand
Year
Item 2012 2011
Difference Ratio change
analysis and
explanation Amount %
Current assets 1,083,776,739 958,370,691 125,406,048 13.09%
Fund and Long-term equity
investments 603,762,719 534,685,388 69,077,331 12.92%
Fixed assets 26,828,097 33,886,138 (7,058,041) (20.83)% (Note 2)
Other assets 1,277,471 1,184,021 93,450 7.89%
Total assets 1,715,645,026 1,528,126,238 187,518,788 12.27%
Current liabilities 988,892,523 861,779,296 127,113,227 14.75%
Other liabilities 4,853,916 4,215,877 638,039 15.13%
Total liabilities 1,069,112,839 950,294,550 118,818,289 12.50%
Common stock 118,358,665 106,890,967 11,467,698 10.73%
Capital surplus 77,266,078 70,693,639 6,572,439 9.30%
Retained earnings 445,361,440 377,321,804 68,039,636 18.03%
Total stockholders’ equity 646,532,187 577,831,688 68,700,499 11.89%
Note 1: Items will be analyzed and explained if ratio changed more than ±20% and changed amount excess NT$10 million. Note 2: Fixed assets variance analysis: Compare to previous year, the amount of fixed asset of year 2012 decreased mainly due to significantly reduced the new equipment procurement and sale of equipment to overseas subsidiaries.
B. 2012 vs. 2011 Operating Result Analysis
Unit: NT$Thousand
Year
Item 2012 2011 Amount
changed
Change
percentage
(%)
Variance
analysis
Revenues 3,218,928,395 2,773,311,378 445,617,017 16.07%
Cost of revenues (3,066,728,559) (2,665,484,499) 401,244,060 15.05%
Gross profit 152,199,836 107,826,879 44,372,957 41.15% 1
Operating expenses (106,273,993) (76,326,593) 29,947,400 39.24% 2
Operating income 45,925,843 31,500,286 14,425,557 45.80% 3
Non-operating income 64,038,228 64,478,317 (440,089) (0.68)%
Non-operating expenses (2,497,303) (4,187,129) (1,689,826) (40.36)% 4
Income (loss) before 107,466,768 91,791,474 15,675,294 17.08%
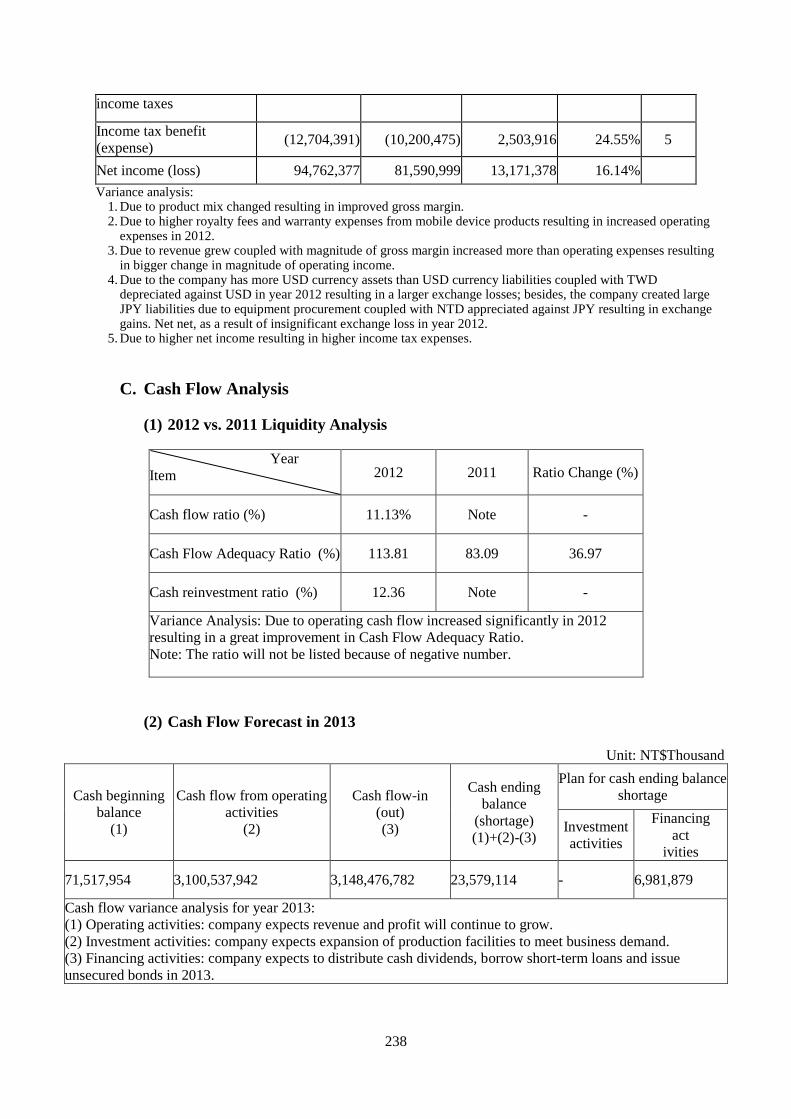
238
income taxes
Income tax benefit
(expense) (12,704,391) (10,200,475) 2,503,916 24.55% 5
Net income (loss) 94,762,377 81,590,999 13,171,378 16.14%
Variance analysis: 1. Due to product mix changed resulting in improved gross margin. 2. Due to higher royalty fees and warranty expenses from mobile device products resulting in increased operating
expenses in 2012. 3. Due to revenue grew coupled with magnitude of gross margin increased more than operating expenses resulting
in bigger change in magnitude of operating income. 4. Due to the company has more USD currency assets than USD currency liabilities coupled with TWD
depreciated against USD in year 2012 resulting in a larger exchange losses; besides, the company created large JPY liabilities due to equipment procurement coupled with NTD appreciated against JPY resulting in exchange gains. Net net, as a result of insignificant exchange loss in year 2012.
5. Due to higher net income resulting in higher income tax expenses.
C. Cash Flow Analysis
(1) 2012 vs. 2011 Liquidity Analysis
Year
Item 2012 2011 Ratio Change (%)
Cash flow ratio (%) 11.13% Note -
Cash Flow Adequacy Ratio (%) 113.81 83.09 36.97
Cash reinvestment ratio (%) 12.36 Note -
Variance Analysis: Due to operating cash flow increased significantly in 2012
resulting in a great improvement in Cash Flow Adequacy Ratio.
Note: The ratio will not be listed because of negative number.
(2) Cash Flow Forecast in 2013
Unit: NT$Thousand
Cash beginning
balance
(1)
Cash flow from operating
activities
(2)
Cash flow-in
(out)
(3)
Cash ending
balance
(shortage)
(1)+(2)-(3)
Plan for cash ending balance
shortage
Investment
activities
Financing
act
ivities
71,517,954 3,100,537,942 3,148,476,782 23,579,114 - 6,981,879
Cash flow variance analysis for year 2013:
(1) Operating activities: company expects revenue and profit will continue to grow.
(2) Investment activities: company expects expansion of production facilities to meet business demand.
(3) Financing activities: company expects to distribute cash dividends, borrow short-term loans and issue
unsecured bonds in 2013.
239
VIII. Special Notes
A. Consolidated Financial Statements of Affiliates
Hon Hai Precision Industry Co., Ltd.
Affiliates Consolidated Financial Statement Announcements
From 2012 fiscal year, the companies which should be included in the consolidated
financial statements of the Company pursuant to the Affiliates Consolidated Business
Reports and Consolidated Financial Statements Preparation of Affiliation Reports are
the same as those should be included pursuant to the Statement of Financial
Accounting Standards No. 7, and also the affiliates consolidated financial statements
should be disclosed information on supra parent company have already been disclosed
in the consolidated financial statements of the Company. Therefore the Company will
not prepare a separate affiliates consolidated financial statements.
Hereby declare
Company Name: Hon Hai Precision Industry Co., Ltd.
Chairman: Gou, Tai-Ming (Terry Gou)
On the Date of: 4/16/2013
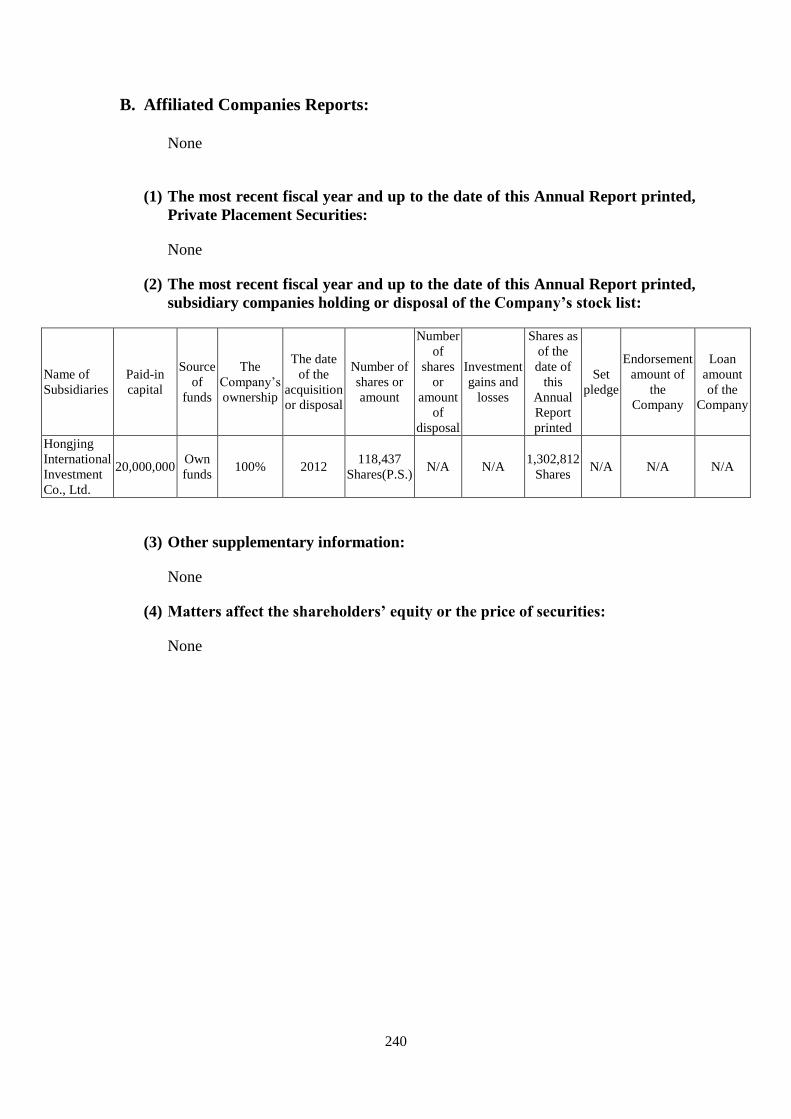
240
B. Affiliated Companies Reports:
None
(1) The most recent fiscal year and up to the date of this Annual Report printed,
Private Placement Securities:
None
(2) The most recent fiscal year and up to the date of this Annual Report printed,
subsidiary companies holding or disposal of the Company’s stock list:
Name of
Subsidiaries
Paid-in
capital
Source
of
funds
The
Company’s
ownership
The date
of the
acquisition
or disposal
Number of
shares or
amount
Number
of
shares
or
amount
of
disposal
Investment
gains and
losses
Shares as
of the
date of
this
Annual
Report
printed
Set
pledge
Endorsement
amount of
the
Company
Loan
amount
of the
Company
Hongjing
International
Investment
Co., Ltd.
20,000,000 Own
funds 100% 2012
118,437
Shares(P.S.) N/A N/A
1,302,812
Shares N/A N/A N/A
(3) Other supplementary information:
None
(4) Matters affect the shareholders’ equity or the price of securities:
None
241
Hon Hai Precision Industry Co., Ltd.
Chairman: Gou, Tai-Ming (Terry Gou)