Embed Size (px)
Citation preview

CEM 924 11.1 Spring 2001
5.12 Vibrational Surface Spectroscopy
One of the most powerful methods for surface chemical compositional analysis- produces vibrational spectrum of adsorbed species. Can:
- fingerprint adsorbed species
- use selection rules to deduce bonding orientation
Based on absorption of energy from incident particle (electron - EELS, IRphoton - RAIRS) - (won't discuss Raman or SHG)
- measure intensity vs. energy distribution of particle followingabsorption
CEM 924 11.2 Spring 2001
5.12.1 Introduction to IR Methods
Can be performed using conventional (non-dispersive) FTIR instrument
- sample all channels simultaneously (Jaquinot advantage)
- high signal level at detector (Fellgett advantage)
- high accuracy (use of accurate internal standard HeNe laser)
in transmission or reflectance mode
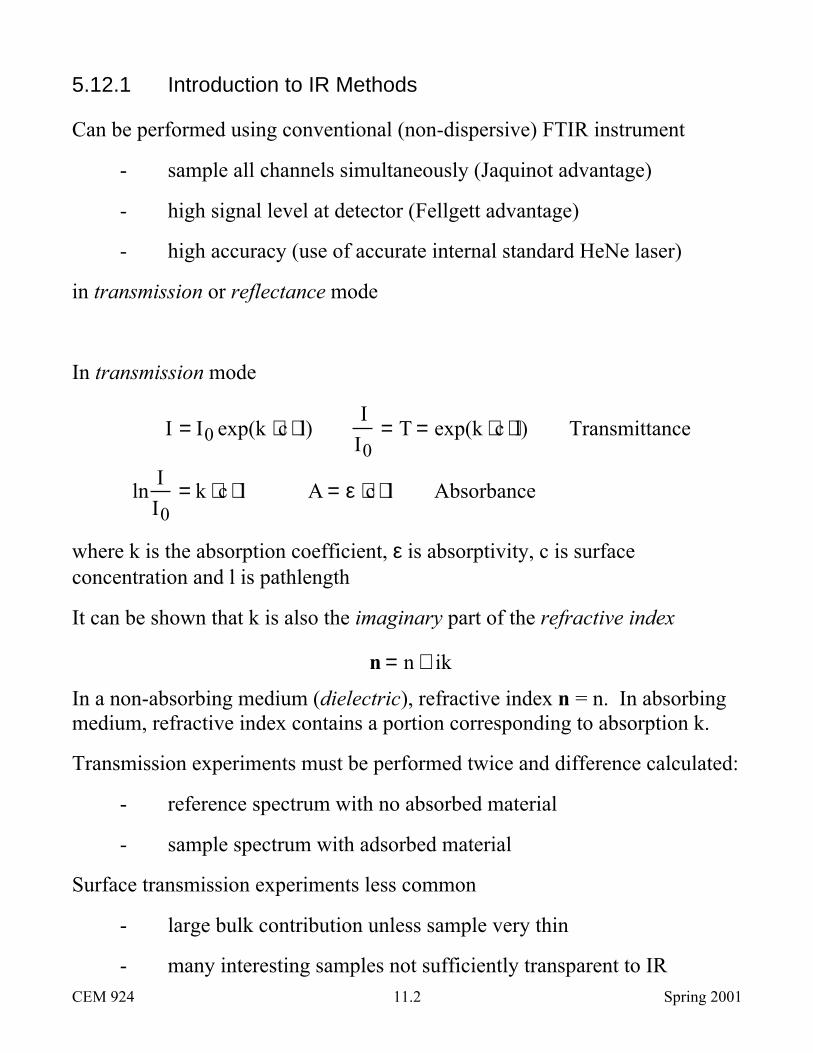
In transmission mode
I = I0 exp(k ⋅c ⋅ l)I
I0= T = exp(k ⋅c ⋅ l) Transmittance
lnI
I0= k ⋅c ⋅ l A = ε ⋅c ⋅ l Absorbance
where k is the absorption coefficient, ε is absorptivity, c is surfaceconcentration and l is pathlength
It can be shown that k is also the imaginary part of the refractive index
n = n + ik
In a non-absorbing medium (dielectric), refractive index n = n. In absorbingmedium, refractive index contains a portion corresponding to absorption k.
Transmission experiments must be performed twice and difference calculated:
- reference spectrum with no absorbed material
- sample spectrum with adsorbed material
Surface transmission experiments less common
- large bulk contribution unless sample very thin
- many interesting samples not sufficiently transparent to IR

CEM 924 11.3 Spring 2001
5.12.2 Reflection, Refraction and Absorption
Reflection, refraction and absorption all related through Maxwell's equationsfor electromagnetic radiation for interface of different n.
The reflection and refraction angles are given by Snell's Law:
Θ I
Θ R Θ T
y
x
ΘI = ΘR and
n1n2
=sinΘIsinΘT
for ΘI < Θcrit = sin −1 n2
n1
Where the plane containing the incident and reflected (and transmitted) wavesis called the plane of incidence
The intensities of the reflected waves are given by Fresnel equations and aredependant on their polarizations:
When n1 = 1.00 (vacuum/air) and n2 = n + ik:
For p-polarized light (E-field || to plane of incidence)
Rp =cos2 ΘT −2ncos ΘI cosΘT + n2 + k2
cos2 ΘI
cos2 ΘT + 2ncosΘI cosΘT + n2 + k2
cos2 ΘI
and for s-polarized light (E-field ⊥ to plane of incidence)
Rp =cos2 ΘI −2ncos ΘI cosΘT + n2 + k2
cos2 Θ2
cos2 Θ I +2ncosΘI cosΘT + n2 + k2
cos2 Θ2
Such equations allow us to predict the reflectivity of materials (n2) withincidence angle
CEM 924 11.4 Spring 2001
For very thick films on reflective surface (metal) ΘI can be normal (0°) -double-pass transmission experiment
For very thin films on reflective surface ΘI should be large (~75-85°) -grazing incidence experiment (RAIRS)
5.13 Reflection-Absorption Infrared Spectroscopy (RAIRS)
also known as Infrared Absorption-Reflection Spectroscopy (IRAS)
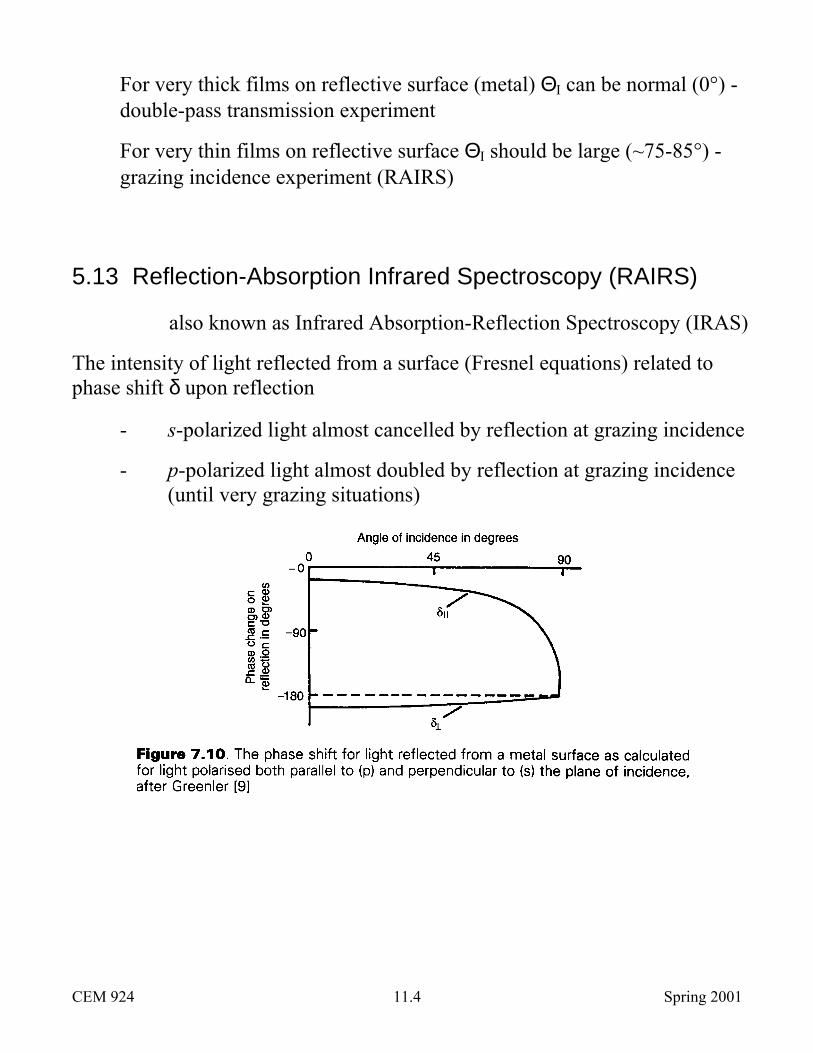
The intensity of light reflected from a surface (Fresnel equations) related tophase shift δ upon reflection
- s-polarized light almost cancelled by reflection at grazing incidence
- p-polarized light almost doubled by reflection at grazing incidence(until very grazing situations)

CEM 924 11.5 Spring 2001
Θ I
E(p)E'(p)
E(s)
E'(s)
plane of incidence
Only p-polarized component light can be reflected from surface at highincidence angles
Only vibrations with component dynamic dipole moment aligned ⊥ to surfaceplane can interact with (p-polarized) incident light - "surface selection rule"
Group theory tells us which vibrations have components in x, y and zdirections
Since absorbance A is proportional to E2 and area of surface sampled increasesas 1/cosΘI, sensitivity of RAIRS increases as E2/cosΘI

CEM 924 11.6 Spring 2001
Best sensitivity for observing an absorption feature in RAIRS is
- p-polarized light
- grazing incidence
- molecule with transition dipole arranged along surface normal
- molecule with large transition moment

CEM 924 11.7 Spring 2001
Using high quality FTIR spectrometers spectral acquisition (reference andsample) with high S/N can be acquired in few minutes with 2-4 cm-1 resolution
Width of absorption peak usually related to inhomogeneity of surface

CEM 924 11.8 Spring 2001
Frequency of internal vibrational mode often close to gas phase (red-shifted200-800 cm-1)
Frequency used to infer nature of bonding with surface
- ν(X-Y) decreases as coordination to surface atoms increases
- occupation of sites often varies with coverage - highsymmetry/coordination at low coverages → lowsymmetry/coordination at high coverages
- compared with organometallic compounds
"Softened" modes (by 100-200 cm-1) sometimes appear due to substantialinteractions with surface
∆R/R often very small - absorbance 0.1 to 10-3!
- sufficient for submonolayer sensitivity for molecule with strongdynamic dipole moment
∆R/R approximately linear with coverage (unless molecular orientationchange)
BUT relative intensity of band not good indicator of population
- dynamic dipoles of molecules in ordered array couple - modulatesdynamic dipole moment and hence modulates absorption
- orientation affects absorbance
Cannot observe vibrations with ν < 800 cm-1 - detector cut-off
5.13.1 Example Application of RAIRS: CO/NO on Metals
CO and NO have similar electronic structure
- HOMO is filled 5 σ and LUMO is 2 π* MO

CEM 924 11.9 Spring 2001
- Both considered σ donors and π* acceptors
Coadsorption of CO and NO on Rh/Pt/Ni extremely important in catalysis(vehicle emissions)
- CO most intensively studied adsorbate by vibrational spectroscopy
Wavenumbers (cm-1)
1600 1700 1800 1900 2000 2100 2200
Hollow Bridge Top | CO(g)
Ni(100) c(2x2)-CO |
Cu(100) c(2x2)-CO |
Pd(100) (2√2x√2)R45-2CO |
Ru(0001) (√3x√3)R30-CO |
Rh(111) (√3x√3)R30-CO |
Rh(111) (2x2)-3CO | |
Rh(111) c(2√3x4)rect-C6H6+CO |
Pt(111) c(4x2)-2CO | |
ν(CO(g)) = 2140 cm-1
CO on Ni(111):
- 2-fold bridge at ~1840 cm-1 at low coverage
- additional on-top sites at ~2040 cm-1 at coverages >0.5 ML
NO on Ni(111):
- tilted 2-fold bridge at ~1480 cm-1 at very low coverages
- shifts to more perpendicular 2-fold bridge up to ~1580 cm-1 at lowcoverages

CEM 924 11.10 Spring 2001
- on-top sites at >0.5 ML
When NO is added to CO covered surface:
- on-top sites appear - CO displaced by NO
- bridge CO shifts to higher ν - strengthened CO internal bond
- bridge CO broadens into doublet - multiple adsorption sites?
(Recent results have suggested that this interpretation is not correct - CO andNO on Ni(111) occupy fcc and hcp sites at all coverages!)

CEM 924 11.11 Spring 2001
5.14 Electron Energy Loss Spectroscopy (EELS)
also known as high resolution EELS (HREELS)
Based on inelastic scattering of monoenergetic beam of low energy electrons(Ei = 1-10 eV) from surface
E i
Specular
Off-specularE s
Θ i Θ s
E s
- kinetic energy analysis of inelastically-scattered electrons givesinformation about energy transfer to surface vibrational modes
- Es = Ei - hν ← energy loss
H2 adsorbed on TM expect hν ≈ 4560 cm-1 but for H on TM expecthν ≈ 800-1000 cm-1
- minimum resolution ∆Ei (FWHM of incident beam) of EELS >RAIRS - best <8 cm-1, typically 20-30 cm-1 (8 cm-1 ≅ 1 meV)

CEM 924 11.12 Spring 2001
- sufficient for submonolayer sensitivity, even for weak dynamicdipoles (best 10-3 ML)
5.14.1 Electron Scattering Mechanisms in EELS
Three basic scattering modes for electron, each with own selection rules:
(1) Dipole scattering
(2) Impact scattering
(3) Negative ion resonance scattering
- gives EELS added versatility over RAIRS
- all three modes operative (one usually dominates under certainexperimental conditions)
(1) Dipole scattering
Electron is scattered at long range (100's Å) by oscillating Coulombic fieldof surface
Electron momentum ⊥ to surface is conserved
Energy loss results in small angle deflections around specular direction -dipole scattering lobe
- Elastically-scattered electrons appear at Θi = Θs (specular)
- Inelastically-scattered electrons appear at Θi ≈ Θs (sharply peakednear specular)
CEM 924 11.13 Spring 2001
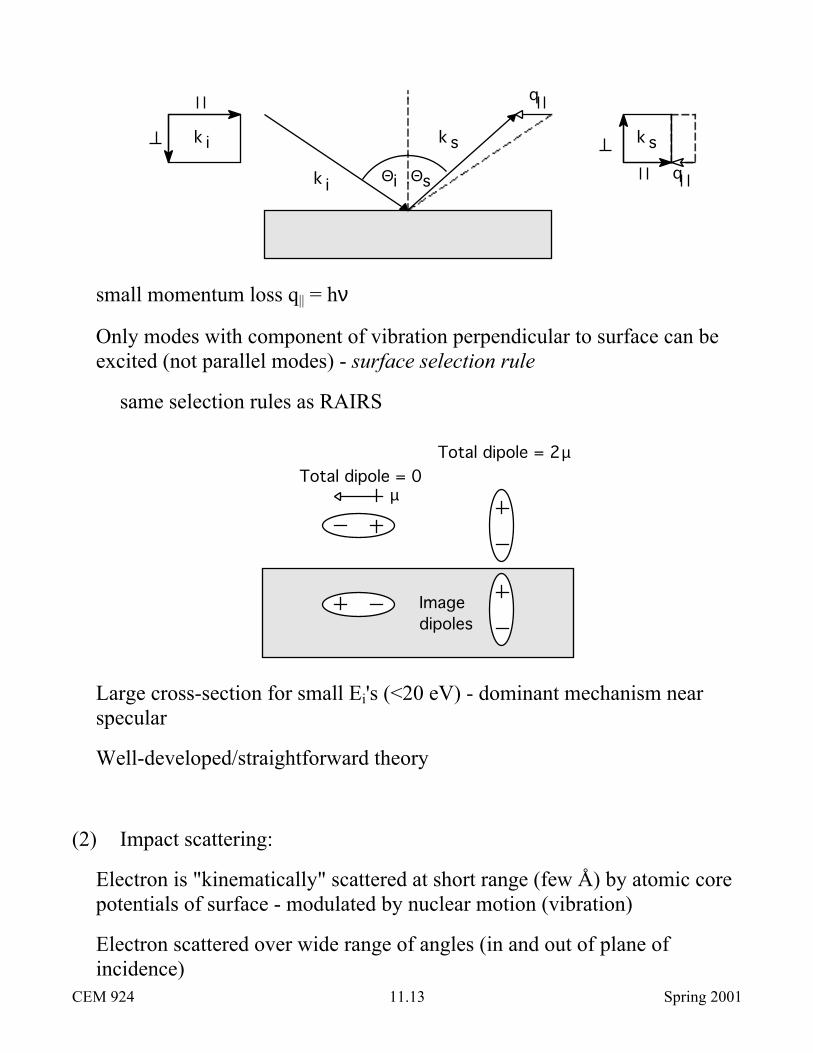
q
k i
k sk i k s
qΘi Θs
small momentum loss q|| = hν
Only modes with component of vibration perpendicular to surface can beexcited (not parallel modes) - surface selection rule
same selection rules as RAIRS
Total dipole = 0Total dipole = 2µ
Imagedipoles
µ
Large cross-section for small Ei's (<20 eV) - dominant mechanism nearspecular
Well-developed/straightforward theory
(2) Impact scattering:
Electron is "kinematically" scattered at short range (few Å) by atomic corepotentials of surface - modulated by nuclear motion (vibration)
Electron scattered over wide range of angles (in and out of plane ofincidence)

CEM 924 11.14 Spring 2001
Probability of scattering depends on surface dipole amplitude/direction(symmetry of mode) and electron energy (momentum)
Neither electron momentum || nor ⊥ conserved
- can see vibrational modes with dynamic dipoles both || and ⊥ tosurface plane (only off-specular)
Much lower cross-section than dipole scattering (weak loss features)
Poorly-developed/complex theory
(3) Negative Ion Resonance
Incident electron becomes transiently trapped in empty, high lying MO ofadsorbate - Rydberg state
Vibrational feature intensity strongly depends on incident energy -resonances
Very small cross-section off-resonance (rare)
Regardless of mechanism, most electrons scattered elastically - lossspectrum usually very weak
5.14.2 Instrumentation for HREELS
Electronsource
Monochromator AnalyzerSample
Detector
E>Eo
Eo
E<Eo

CEM 924 11.15 Spring 2001
Monochromation of electrons emitted by thermionic emission achieved bypassing through spherical-sector electron energy analyzer
- typical radius 5 cm, typical pass energy <500 meV (in XPS, radius~20-30 cm, pass energy 50-100 eV)
Electrons retarded before entry into sector, then accelerated to sample
Second spherical-sector used to analyze electron kinetic energy
Entire instrument magnetically shielded - no magnetic materials forconstruction
In very high resolution instruments, two sectors for monochromator and twofor analyzer
Detector
Sample
AnalyzerMonochromator
ElectronSource

CEM 924 11.16 Spring 2001
Space-charge effects always tend to produce divergent beam
Optimization of lens and sector potentials very difficult - computer controlled
In best HREELS, analyzer rotatable for off-specular (impact scattering)analysis
Ei variable 1-50 eV or more - can study vibrational and electronic lossprocesses (plasmons)
- observe electronic excitation from 0->50 eV
- observe vibrational modes from 0->4000 cm-1

CEM 924 11.17 Spring 2001
5.14.3 Example Application of HREELS: CO adsorption on W(100)
(gas exposure units 1 L = 1 Langmuir = 10-6 torr·s)
At low CO exposures
- 70 meV (565 cm-1) W-C (hollow site)
- 78 meV (630 cm-1) W-O (hollow site)
At high pCO
- 45 meV (363 cm-1) W-CO (on-top)
- 258 meV (2081 cm-1) -C≡O (CO(g) = 2140 cm-1)

CEM 924 11.18 Spring 2001
5.14.4 Example Application of HREELS: Ethylene adsorption onRh(111)
Ethylene is an important starting material in many industrial catalyticprocesses
How does it bond to transition metal catalyst surface?
π-bonded di σ-bonded
Wavenumber (cm-1)
π-bonded di σ-bonded
νs(CH2) 3075-2990 3000-2910
ν(C-C)/wag(CH2) 1560-1500 1170-830
ν(C-M) <400 480-400
Low temp (<150 K)-
π-bonded: Cu(100), Pd(111), Pd(100), Pd(110)
di σ-bonded: Fe(111), Fe(110), Ni(111), Ni(100), Ru(001), Pd(100),Pt(111), Pt(100)
(see N. Sheppard, Ann. Rev. Phys. Chem. 39 (1988) 589-644)

CEM 924 11.19 Spring 2001
At 77 K, ethylene non-dissociatively chemisorbs on Rh(111) with C=Capproximately parallel to surface in π-bonded configuration

CEM 924 11.20 Spring 2001
At 320 K-
- (i) v(C-C) (1120 cm-1) more like C-C than C=C
- (ii) appearance of CH3-type stretches
- (iii) 1/4 of total hydrogen desorbed between 100 and 300 K
Internal rearrangement to produce C2H3 - ethylidyne
At higher temperatures, sequential dehydrogenation → H-terminated Cpolymers → graphite
Also observe adsorbate-induced reconstruction:
Before HREELS (and LEED) analysis, ethylidyne structure never proposed
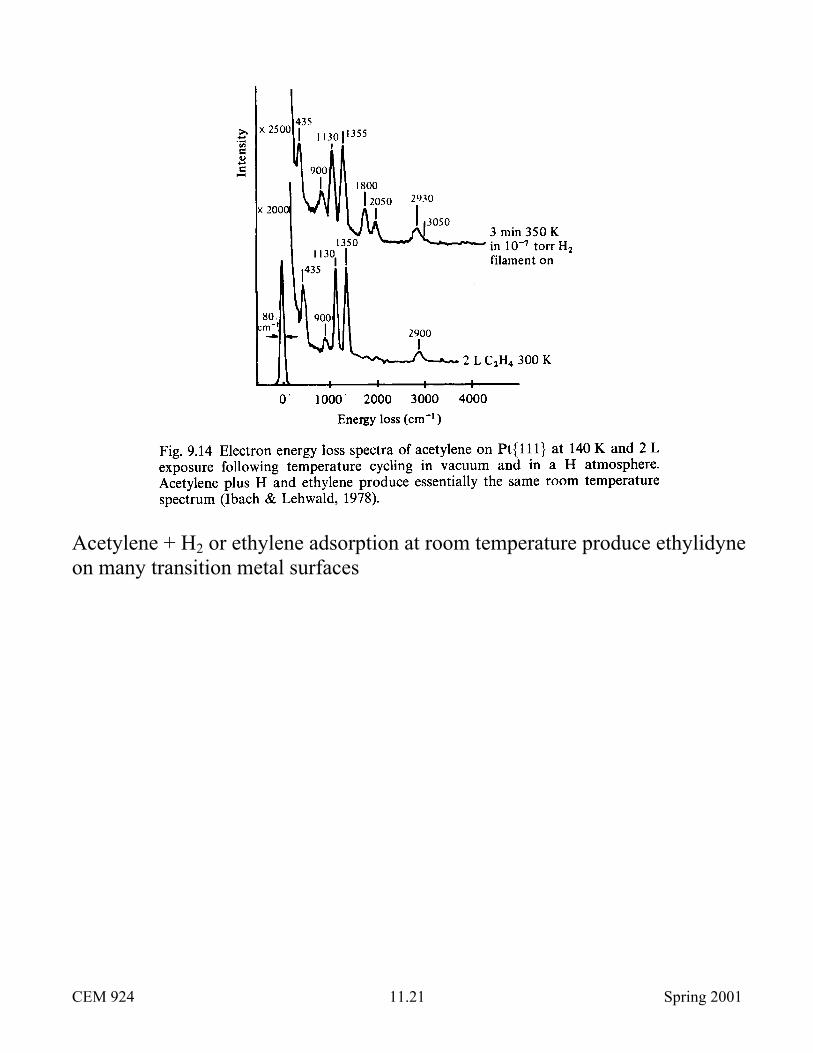
CEM 924 11.21 Spring 2001
Acetylene + H2 or ethylene adsorption at room temperature produce ethylidyneon many transition metal surfaces
CEM 924 11.22 Spring 2001
5.15 Summary
"Fingerprint technique" - can identify functional groups through vibrationalfrequency analysis
Use of selection rules/group theory allows determination of bond orientation
Difficult to quantify species (RAIRS easier then HREELS)
RAIRS:
Excellent energy resolution (<2 cm-1) - useful for separating multiple peaks,phase transitions, lateral interactions, dynamics of coupling
Straightforward instrumentation
Not restricted to surfaces in vacuum - can be used in "real world" conditionsfrom several atm to UHV
Theory well-developed
Rapid - 30 s-10 minutes - time-resolved spectra possible
BUT
Less sensitive than HREELS
Cannot observe modes <800 cm-1
Only dipole active modes - component perpendicular to surface
Need background (reference spectrum) subtraction
HREELS:
Multiple scattering mechanisms allow observation of modes parallel andperpendicular to surface

CEM 924 11.23 Spring 2001
Observe modes 0->4000 cm-1 - low frequency modes (molecule-surface)visible
Can perform vibrational and electronic loss spectroscopy
Can induce and probe electron-induced reactions with variable Ei
No background subtraction
Most common technique for surface and bulk phonon measurement
BUT
Poor resolution (6-8 cm-1 best)
Only works in UHV
Very expensive, complex, delicate instrumentation
Slow - 15-60 minutes per spectrum
Electron spectroscopy - surface charging on insulators
Difficult theory