Embed Size (px)
Citation preview
8/6/2019 Vib Signatures 1
http://slidepdf.com/reader/full/vib-signatures-1 1/12
8/6/2019 Vib Signatures 1
http://slidepdf.com/reader/full/vib-signatures-1 2/12
generator which is caused by the propel-ler would constitute environmental
“ibration, since the propeller is not
directly associated w~th- the operation
o f the turbo-generator.
Aboard ship the predominant sources
of environmental vibration come from
the blade passing frequencies and flow
turbulence of the propeller Plus the
wave action and flow turbulence imping-
ing on the hull. To a lesser extent,
there can also be environmental vibra-
tion caused by the transmission of one
machine 1 s vibration to another.
In the sections which follow,
instrumentation and measurement tech-
niques are discussed which have been
successfully used to implement vibra-
tion signature analysis as a preventive
tool aboard ship. Examples are given
~f vibration signatures which uncovered
defective machines. Further examples
show cases where environmental vibra-
tions of different types were encoun-
tered, and methods used for analyses
under these conditions.
INSTRUMENTATION AND PROCEDUSXS FOR A
SHIPBOARD VIBBATION MEASUREMENTPRSVENTIVE MAINTENANCE PROGBAM
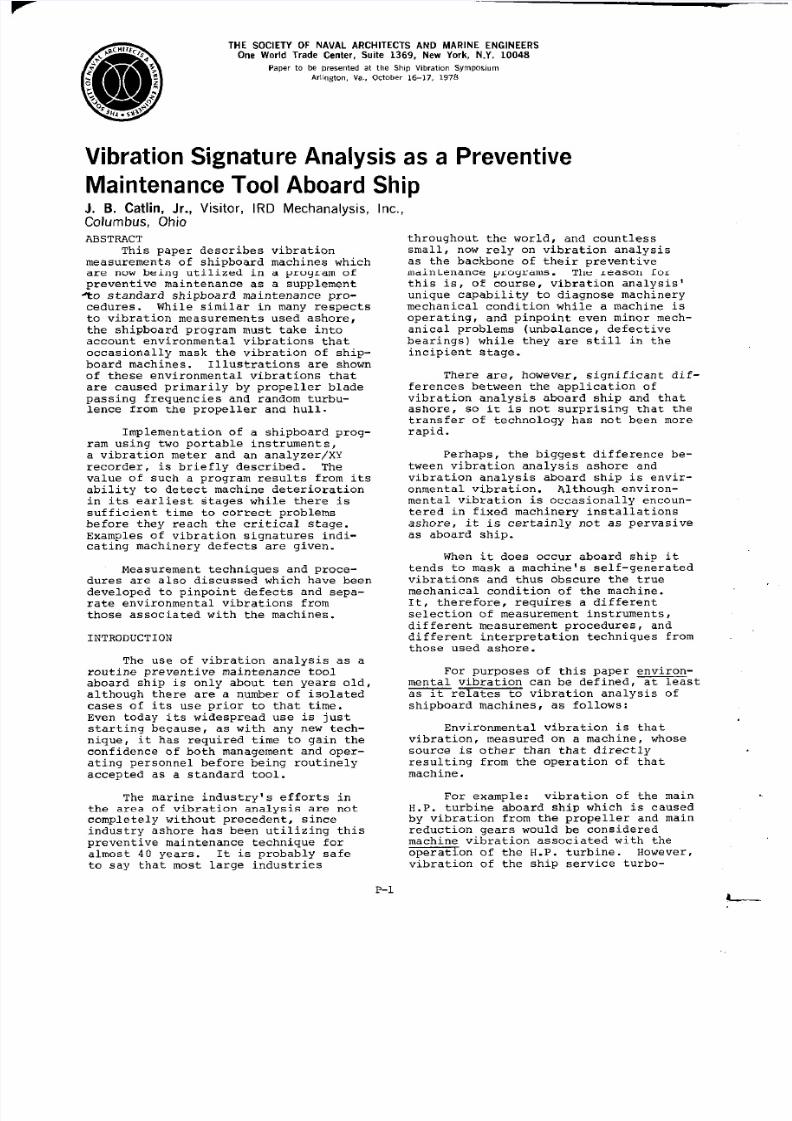
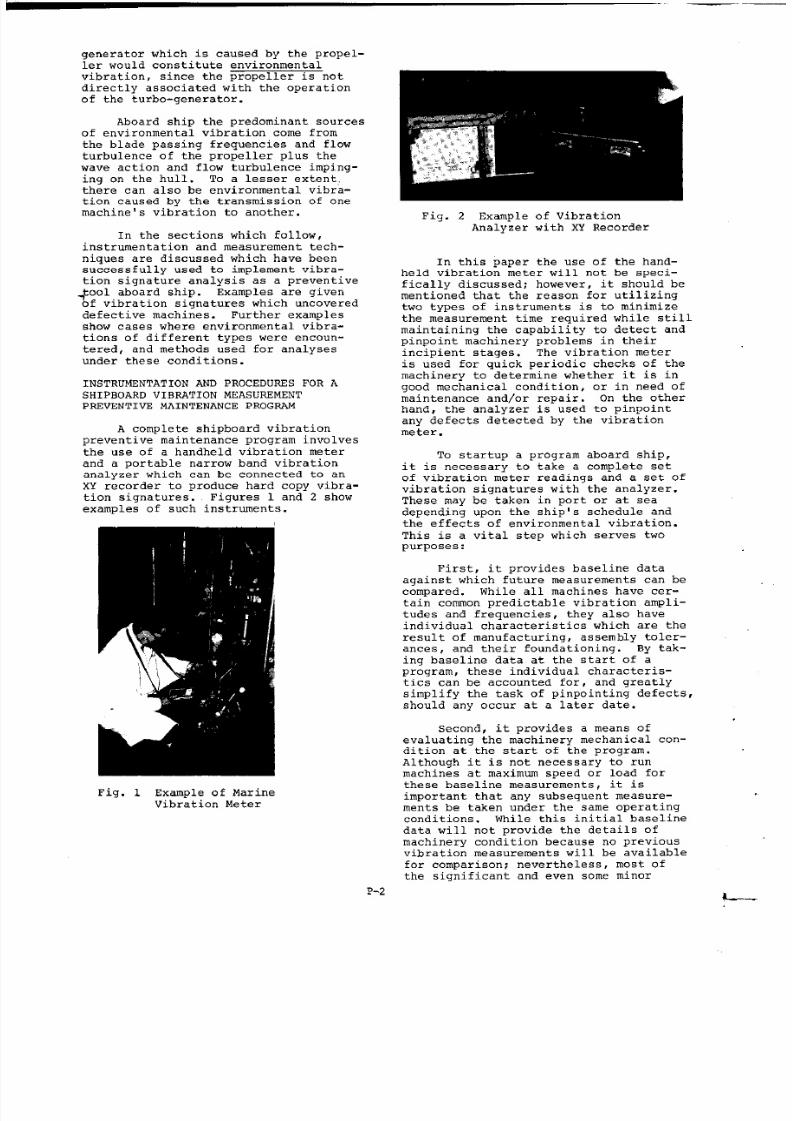
A complete shipboard vibration
preventive maintenance program involves
the use of a handheld vibration meter
and a portable narrow band vibration
analyzer which can be connected to an
XY recorder to produce hard COPY vibra-
tion signatures. Figures 1 and 2 show
examples of such instruments.
Fig. 1 Example of Marine
Vibration Meter
P-2
Fig. 2 Example of Vibration
Analyzer with XY Recorder
In this paper the use of the hand-
held vibration meter will not be speci-fically discussed; however, it should be
mentioned that the reason for utilizing
two types of instruments is to minimize
the measurement time required while stillmaintaining the capability to detect and
pinpoint machinery problems in their
incipient stages. The vibration meteris used for quick periodic checks of the
machinery to determine whether it is ingood mechanical condition, or in need ofmaintenance and/or repair. On the other
hand, the analyzer is used to pinpoint
any defects detected by the vibrationmeter.
To startup a program aboard ship,
it is necessary to take a complete set
of vibration meter readings and a set ofvibration signatures with the analyzer.
These may be taken in port or at sea
depending upon the ship 1s schedule andthe effects of environmental vibration.
This is a vital step which serves two
purposes:
First, it provides baseline data
against which future measurements can be
compared. While all machines have cer-
tain common predictable vibration ampli-
tudes and frequencies, they also have
individual characteristics which are theresult of manufacturing, assembly toler-
ances, and their foundationing. By tak-
ing baseline data at the start of aprogram, these individual characteris-
tics can be accounted for, and greatlysimplify the task of pinpointing defects,should any occur at a later date.
Second, it provides a means of
evaluating the machinery mechanical con-
dition at the start of the program.
Although it is not necessary to run
machines at maximum speed or load for
these baseline measurements, it is
important that any subsequent measure-
ments be taken under the same operating
conditions. while this initial baseline
data will not provide the details of
machinery condition because no previous
“ibration measurements “ill be available
for
the
comparison;
significant
nevertheless, most ofand even some minor
L--
8/6/2019 Vib Signatures 1
http://slidepdf.com/reader/full/vib-signatures-1 3/12
—
problems can be caught with this data.
Once this set of measurements is
complete, a schedule of periodic,
routine vibration meter checks is set
up to coincide with the ship’s operat-
ing schedule. These checks are designed
to catch any machinery mechanical prob-
lems before they become serious, andprovide the lead time necessary to
enable the ship to correct the problemat a convenient time.
No additional vibrat ion signatures
are required after the initial baselinesignatures are taken until such time
that the vibration meter indicates amechanical problem in the machine. In
such case tbe analyzer and XY recorderare brought back aboard ship, and a newset of signatures obtained for themachine. These are then compared withthe baseline measurements for thatmac%ine to indicate the specific fre-
quencies which have changed, thereby,pinpointing the source of the trouble.
As was implied above, it is only
necessary to maintain the “ibraticm
meter aboard ship. The analyzer, be-cause of its relatively infrequent use,can be left ashore at some strategic
location; and brought to the ship onlywhen necessary to analyze a problem.
Limiting the shipboard equipment
to a simple handheld meter is desirablefor several reasons. First, the crews
aboard ship have been reduced to apoint where there are very few manhours
available for special tasks. By using
the vibration meter, measurements
require only a few seconds; hardly morethan the time it takes for a man comingon watch to place his hand on machine
bearings to check their temper.at”re.Recording these measurements also takesonly a matter of minutes. Second, the
simplicity of meter operation and datainterpretation requires a very minimum
of training, so it is not necessary forcrew members to attend any lengthytraining sessions.
The analyzer, on the other hand,
which requires somewhat more skill inits operation and data interpretation,
can be handled by sboreside personnel,such as a port engineer, who would bemore readily available for training.
At this point it might be worth
noting that while the primary benefitof vibration analysis aboard ship is
derived from its use in preventivemaintenance, it can also prove valuablein a number of other areas, namely:
1. As an inspection tool for new
construction to “erify mechani-cal condition of main and
auxiliary machinery prior toship delivery.
2. As a troubleshooting technique
to pinpoint tbe cause of sus-pected machine faults.
3. As a means of verifying thatmachinery repairs have been
done correctly.
4. As a pre-overhaul technique to
aid in determining what repairwork is required.
5. As a post-overhaul techniquefor verification that repair
work has been properly accom-plished.
The specific signatures shown inthe figures of this paper which follow
were for the most part generated with amanual lY tuned s“ept frequency narrow
band (5 percent bandwidth) analyzer whichwas connected to an XY recorder to pro-vide the hard copy. All measurements
were made on the bearing housings of tbemachines with a velocity type transducer.
These signatures were tbe result ofpreventive maintenance program startups,
troubleshooting, as well as pre and post
overhaul measurement.
SOME EXAMFLES OF MACHINERY PROBLEMSPinpOinted BY SIGNATURS ANALYSIS
some marine engineers are able todetect defects in shipboard machines bychanges in sound or touch, although this
capability requires considerable know-ledge and skill plus extended timeaboard the ship.
As an aid to the shipboard engineer,vibration siqnature analysis offers two
primary advantages for machinery defectdetection. It provides a positive indi-
cation of specific faults such as un-balance, misalignment, or defective
bearings which would be difficult to
distinguish by sound or touch, and which
would not be indicated by temperature or
pressure. It also gives a quantitative
number (i.e. , vibration level) which can
be used to evaluate the severity of the
defect, and aid in the decision as to
whether to shut down or to run; and if
the decision is to run, how long it will
last. Guidelines indicating acceptable
machinery vibration levels are available
frem: machinery manufacturers, indus-
trial associations, U.S. Navy (1) ,
SNAME (2) , lRD Mechanalysis, lnC. (3),
and others.
By using vibration signature analy-
sis along with the traditional inputs
of temperature, pressure, sound and
touch , the engineer is in a much better
position to minimize operational prob-
lems. This also gives the shipboard
engineer the opportunity to reduce open-
and-inspect work, as well as minimizing
repairs through knowledge of the spe-
cific repairs which are needed.
P-3L-_
8/6/2019 Vib Signatures 1
http://slidepdf.com/reader/full/vib-signatures-1 4/12
Given below are some case hist~ries
which illustrate the use of vibration
signature analysis as a preventive
maintenance tool.
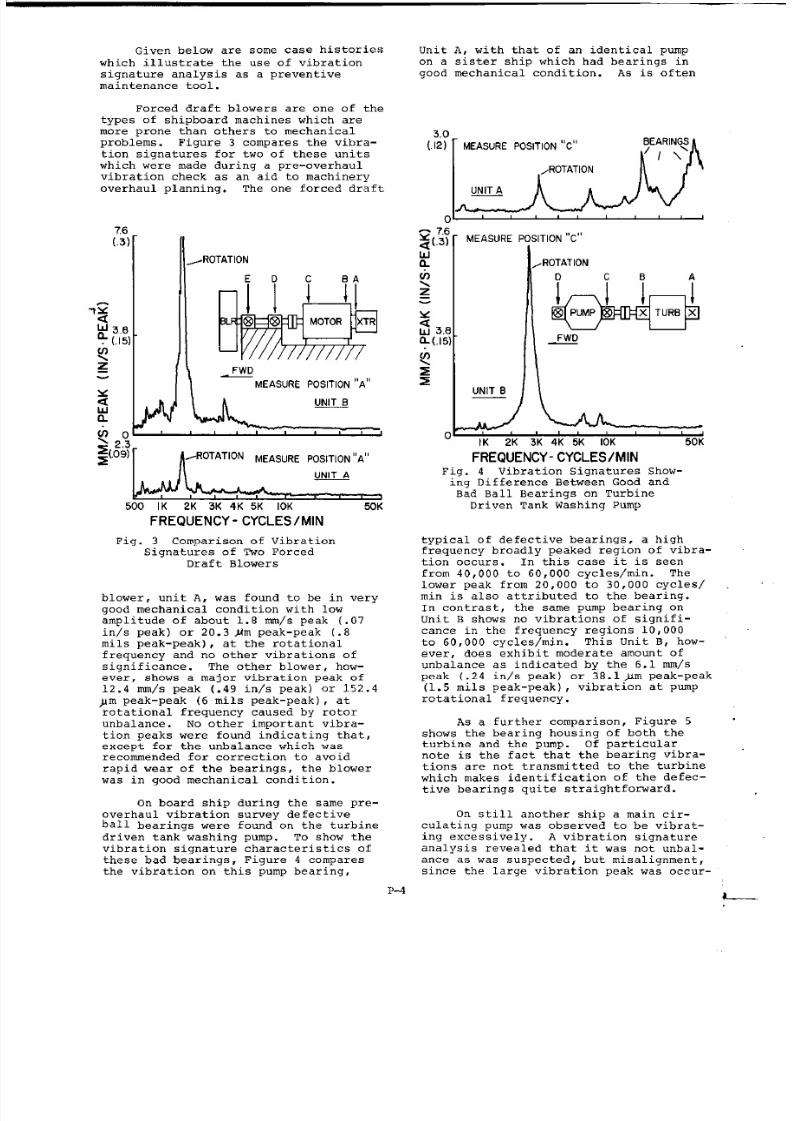
Forced draft blowers are one of the
types of shipboard machines which aremore prone than others to mechanical
problems. Figure 3 compares the “ibra-
tion signatures for two of these “nits
which were made during a pre-overhaul
vibration check as an aid to machinery
overhaul planning. The one forced draft
7,6
(.3)
;,
,ROTATION MEASURE pOSITlON “A”
_
) IK 2K 3K 4K 5K IOK FA3K
FREQUENCY - CYCLESIMIN
Fig. 3 Comparison of Vibration
Signatures of TWO Forced
Draft Blowers
blower, unit A, was found to be in very
good mechanical condition with low
amplitude of about 1.8 nnn/s peak (.07
in/s peak) or 20.3 Jlm peak-peak (.8
roils peak-peak) , at the rotational
frequency and no other vibrations of
significance. The other blower, how-
ever, shows a major vibration peak of
12.4 n!m/s peak (.49 in/s peak) or 152.4
)m peak-peak (6 roils peak-peak), at
rotational frequency caused by rotor
unbalance. No other important vibra-
tion peaks were found indicating that,
except for the unbalance which wasrecommended for correction to avoid
rapid wear of the bearings, the blower
was in good mechanical condition.
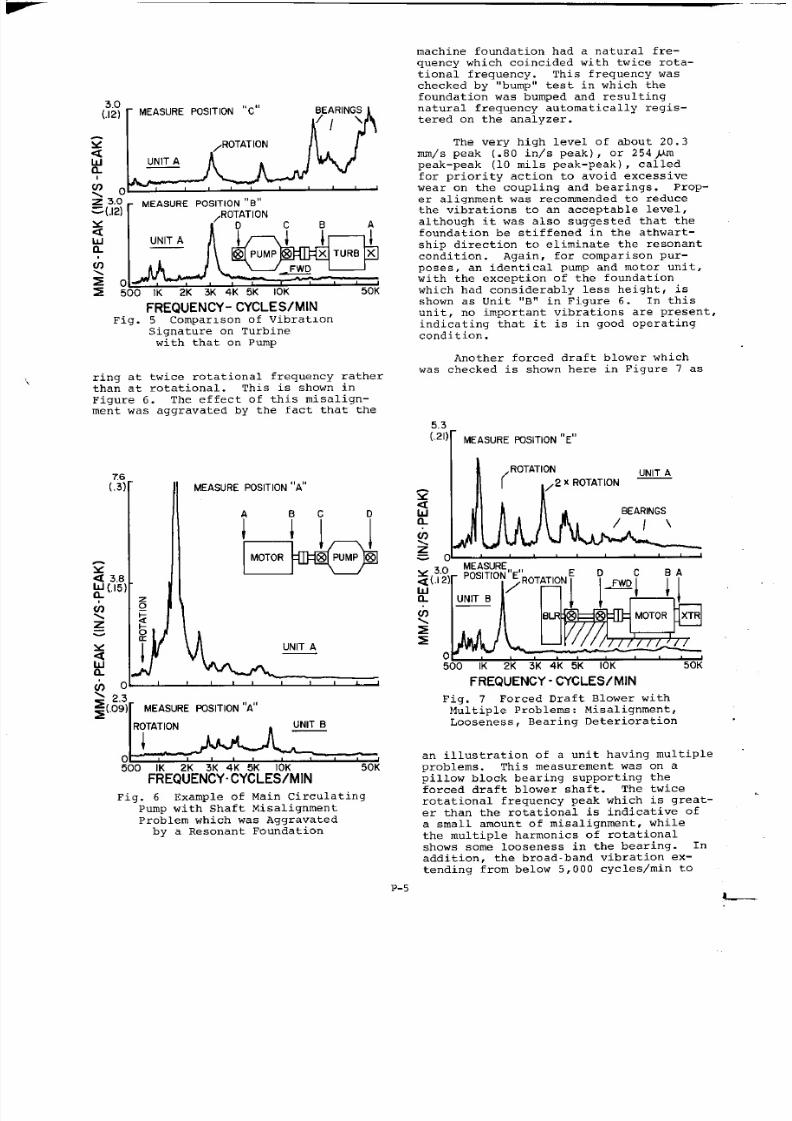
On board ship during the same pre-o“erhaul vibration survey defecti”eball bearings were found on the turbine
driven tank washing pump. To show thevibration signature characteristics of
these bad bearings, Figure 4 comparesthe “ibration on this pump bearing,
Unit A, with that of an identical pump
on a sister ship which had bearings in
good mechanical condition. As is often
3.C
(.12)
(
- 7.{~(,3)
wL
h\z=
xuu 3.(
+(.15
Q
zz
(
MEASURE
W
MEASURE POSITION”C”
I ,ROTATION~
UNIT B
.IK 2K 3K 4K 5K IOK 50K
FREQUENCY- CYCLES/MINFig. 4 Vibration Signatures Show-ing Difference Between Good and
Bad Ball Bearings on Turbine
Driven Tank Washing Pump
tYPiCal of defective bearings, a highfrequency broadly peaked region of vibra-
tion occurs. In this case it is seenfrom 40,000 to 60,000 cycles/rein. The
lower peak from 20,000 to 30,000 cycles/min is also attributed to the bearing.
In contrast, the same pump bearing on
Unit B shows no vibrations of signifi-cance in the frequency regions 10,000
to 60,000 cycles/rein. This Unit B, how-
ever, does exhibit moderate amount of
unbalance as indicated by the 6.1 mm/s
peak (.24 in/s peak) or 38.1 J!.mpeak-peak(1.5 roils peak-peak), vibration at pump
rotational frequency.
As a further comparison, Figure 5
shows the bearing housing of both the
turbine and the pump. of particularnote is the fact that the bearing vibra-
tions are not transmitted to the turbine
which makes identification of the defec-
tive bearings quite straight fon+ard.
On still another ship a main cir-
culating pump was ob.ser”ed to be “ibrat-ing excess iwsly. A vibration signatureanalysis re”ealed that it was not “nbal-
ance as was suspected, but misalignment,since the large “ibration peak was occ”r-
8/6/2019 Vib Signatures 1
http://slidepdf.com/reader/full/vib-signatures-1 5/12
—
‘Ow?$ r MEASURE POSITION “B“
<ROTATION
FREQUENCY- CYCLES/MINFig. 5 Comparison of Vibration
Signature on Turbine
with that on Pump
ring at twice rotational frequency ratherthan at rotational. This is shown in
Figure 6. The effect of this misalign-
ment was aggravated by the fact that the
MEASURE POSITION”A”
MEASURE FCSITION”A”
!OTATION
i
) IK 2K 3K 4K 5K IOK 30K
FREQUENCY.CYCLES/MIN
Fig. 6 Example of Main Circulating
Pump with Shaft Misalignment
Problem which was Aggravated
by a Resonant Foundation
machine foundation had a natural fre-
quency which coincided with twice rota-
tional frequency. This frequency was
checked by “bump” test in which the
foundation was bumped and resulting
natural frequency automatically regis-
tered on the analyzer.
The very high level of about 20.3
mm/s peak (.80 in/s peak) , or 254,Lim
peak-peak (10 roils peak-peak), called
for priority action to avoid excessive
wear on the coupling and bearings. P rOp-
er alignment was recommended to reduce
the vibrations to an acceptable level,
although it was also suggested that thefoundation be stiffened in the athwart-
ship direction to eliminate the resonantcondition. Again, for comparison p“r--poses, an identical pump and motor unit,
with the exception of the foundation
which had considerably less height, isshown as Unit “B” in Figure 6. In this
unit, no important vibrations are presentindicating that it is in good operating
condition.
Another forced draft blower which
was checked is shown here in Figure 7 as
MEASURE P3SITION”E”
1f’ROTATION _
l/2 x ROTATION
)JLhh-&_
EARINGS
//\
FREQUENCY- CYCLES/MIN
Fig. 7 Forced Draft Blower with
Multiple Problems: Misalignment,
Looseness, Bearing Deterioration
an illustration of a unit having multiple
problems. This measurement was on a
pillow block bearing supporting the
forced draft blower shaft. The twice
rotational frequency peak which is great-
er than the rotational is indicative of
a small amount of misalignment, while
the multiple harmonics of rotational
shows some looseness in the bearing. Inaddition, the broad-band vibration ex-
tending from below 5,0OO cycles/rein to
P-5~
8/6/2019 Vib Signatures 1
http://slidepdf.com/reader/full/vib-signatures-1 6/12
above 20,000 cycles/rein shows some minorbearing deterioration. While this analy-
sis indicated that the beari”q couldprobably operate for some time, it wasrecommended that “ibration checks be made
at frequent intervals to watch for fur-ther deteriorations, and plans made to
change bearings at a convenient time inport .
In the sections which follo”, theeffect of environmental “ibration from
propeller, hull and adjacent machineswhich occasionally interfere “ithmachinery measurement is discussed.
HULL VIBRATION GENERATED BY SHAFT ROTA-TION AND PROPELLER BLADE FREQUENCIES
To obtain a true indication of a
machine ‘ s mechanical condition it is
necessary to eliminate the effects of any
significant environmental .?ibration from
the vibration measurement. It is worth-
while, therefore, to identify the charac-
teristics of those environmental vibra-
tions which may affect vibration readings .
As a result of vibration rneasure-
ments on a nunOJer of ships, scone tentat-ive observations ca” be made concerning
hull environmental “ibration. These
observations are limited primarily to
vibration measurements on auxiliary
machinery, and not the hull girder itself.
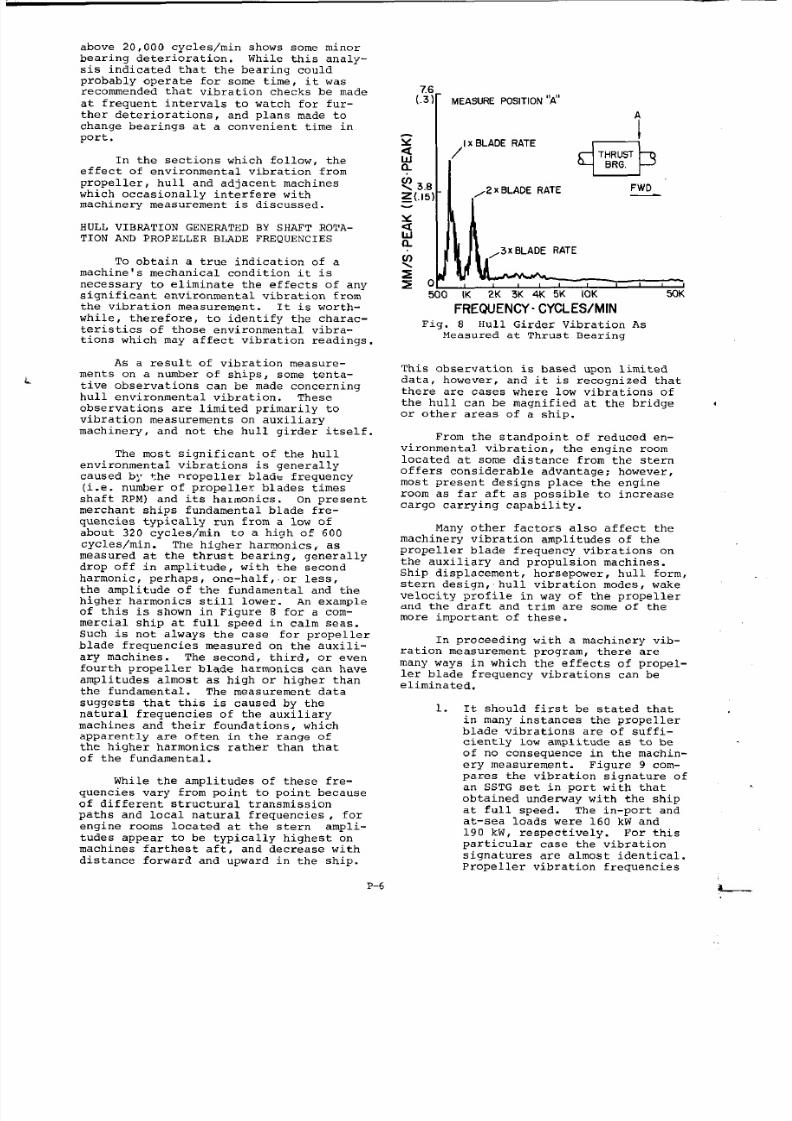
The “ost significant of the hull
environmental vibrations is generallycaused by the nropeller blade frequency(i.e. number of propeller blades times
shaft RPM) and its hazmonics. on present
merchant ships fundamental blade fre-quencies typically run fvmn a low of
about 32o cycles/rein to a high of 600cycles/rein. The higher harmonics, as
measured at the thrust bearing, qenerally
drop off in amplitude, with the secondharmonic, perhaps, one-half, or less,
the amplitude of the f“ndamental and the
higher harmonics still lCJWI-. An example
of this is shown in Figure 8 for a com-
mercial ship at full speed in calm seas.
Such is not always the case for propeller
blade frequencies meaa”red on the a“xili-
ary machines. The second, third, or e“en
fourth propeller blade harmonics can ha”e
amplitudes almost as high or higher than
the fundamental. The measurement data
suggests that this is caused by thenatural frequencies of the auxiliary
machines and their foundations, “hich
aPPar~ntlY are often in the range of
the higher harmonics rather than thatof the fundamental.
While the amplitudes of these fre-
quencies nary from point to point becauseof different structural transmissionpaths and local natural frequencies , for
engine rooms located at the stern ampli-
tudes appear to be typically highest cm
machines farthest aft, and decrease with
distance forward and upward in the ship.
7.6
-[l
(.3) MEASURE FuSITION “A”
~
I/
‘XBLADERATE d
! 3.8 ,2x BLADE RATE FWD./ ,., ,
4Un
<
=’-”1
A/xBLAOE RATE
: o L00 IK 2K 3K 4K 5K IOK 50K
L——k————
FREQUENCY. CYCLES/MINFig. 8 HuI1 Girder Vibration As
Measured at Thrust Bearinq
This observation is based upon limited
data, ho”ever, and it is recognized that
there are cases where low vibrations of
the hull can be magnified at the bridge *or other areas of a ship.
From the standpoint of reduced en-
vironmental “ibration, the engine room
located at some distance from the sternoffers considerable ad”antaqe; hows”er,
most present designs place the engine
room as far aft as possible to increase
cargo carrying capability.
Many other factors also affect themachinery vibration amplitudes of the
propeller blade frequency vibrations on
the auxiliary and propulsion machines.Ship displacement, horsepower, hull form,stern design, hull “ibration modes , wake
velocity profile in way of the propeller
and the draft .a”d trim are some of the
more important of these.
In proceeding with a machinery “ib-ration measurement program, there are
many ways in which tbe effects of propel-ler blade frequency “ibrations can be
eliminated.
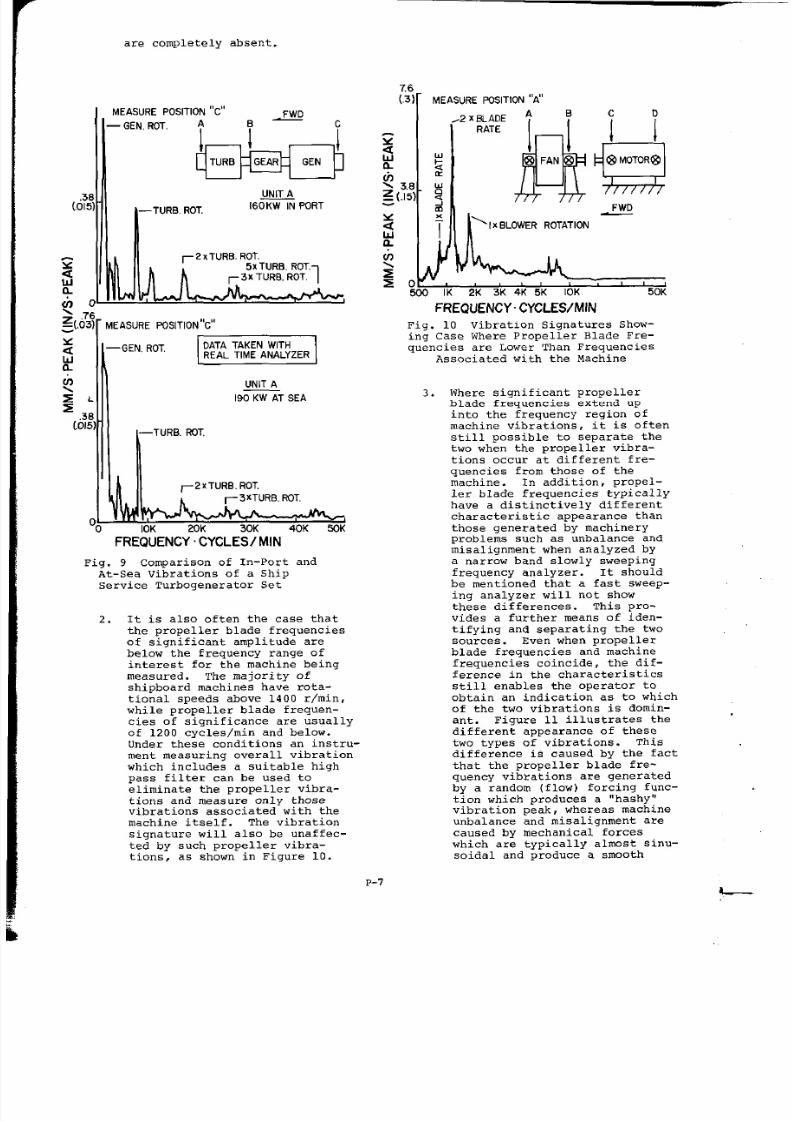
1. It should first be stated thatin many instances the propeller
blade vibrations are of suffi-
ciently 10” amplitude as to be
of no consequence in the machin-ery measurement. Figure 9 com-
pares the vibration siqnature ofan SSTG set in port with that
obtained underway with the ship
at full speed. The in-port and
at-sea loads were 160 kw and190 kW, respectively. For this
particular case the “ibration
signatures are almost identical.Propeller “ibration frequencies
P-6 L
8/6/2019 Vib Signatures 1
http://slidepdf.com/reader/full/vib-signatures-1 7/12
.31(.01
~
1A!n
are completely absent.
MEASURE POSITION “C” ~
— GEN, ROT. : y y
wW
—TURB. ROT.
I
160KW IN PORT
1 tl r 2 x T u RYz Rm
A T6:(.03) MEASURE POSITION“C”
2
&
~ hGENROTmma$ jUNIT A
z=
/L
IIi190KW AT SEA
:.3810IS)
—TURB. ROT,
i r-2 xTURB. ROT.
1~,~3XTURB, ROT.
00 IOK 20K 30K 40K 30K
FREQUENCY CYCLES/MIN
Fig. 9 Comparison of In-Port andAt-Sea Vibrations of a Ship
Service Turbogenerator Se’c
2. It is also often the case thatthe propeller blade frequenciesof significant amplitude are
below the frequency range ofinterest for the machine beingmeasured. The majority ofshipboard machines have rota-
tional speeds above 1400 r/rein,while propeller blade frequen-cies of significance are usuallyof 1200 cycles/rein and below.
Under these conditions an instru-ment measuring overall vibrationwhich includes a suitable high
pass filter can be used toeliminate tbe propeller vibra-
tions and measure only thosevibrations associated with themachine itself. The vibration
signature will also be unaffec-ted by such propeller vibra-tions, as shown in Figure 10.
xawL
( h2z c
MEASURE POSITION”A”
i
‘Ix BLOWER ROTATION
FWD
., ‘~,I IK 2K 3K 4K 5K IOK 50K
FREQUENCY CYCLES/MIN
Fig. 10 Vibration Signatures Show-
ing Case Where Propeller Blade Fre-
quencies are Lower Than Frequencies
Associated with the Machine
3. Where significant propeller
blade frequencies extend upinto the frequency region of
machine vibrations, it is often
still possible to separate the
two when the propeller vibra-
tions occur at different fre-
quencies from those of the
machine. In addition, propel-ler bIade frequencies typicallyhawe a distinctively differentcharacteristic appearance than
those generated by machinery
problems such as unbalance andmisalignment when analyzed by
a narrow band slowly sweepingfrequency analyzer. It shouldbe mentioned that a fast sweep-ing analyzer will not show
these differences. This prO-Videz a further means of iden-tifying and separating the two
sources. Even when propellerblade frequencies and machinefrequencies coincide, the dif-
ference in the characteristicsstill enables the operator to
obtain an indication as to whichof the two vibrations is domin-ant. Figure 11 illustrates tbedifferent appearance of thesetwo types of vibrations. Thisdifference is caused by the fact
that the propeller blade fre-
quency vibrations are generatedby a random (flow) forcing func-tion “hich produces a “hashy”vibration peak, whereas machine
unbalance and misalignment arecaused by mechanical forces
which are typically almost sinu-soidal and produce a smooth
P-7
8/6/2019 Vib Signatures 1
http://slidepdf.com/reader/full/vib-signatures-1 8/12
vibration peak.
76
EASURE POSITION“B” O ~ B A,,,
-’XBLAERAT*I E
I2x BLAOE RATE I xTURBINE,/ ~~T~~,~N
,,]U
( 7K 3K 4K 5K IOK 50Ks O&+
-..
FREQUENCY. CYCLES/MIN
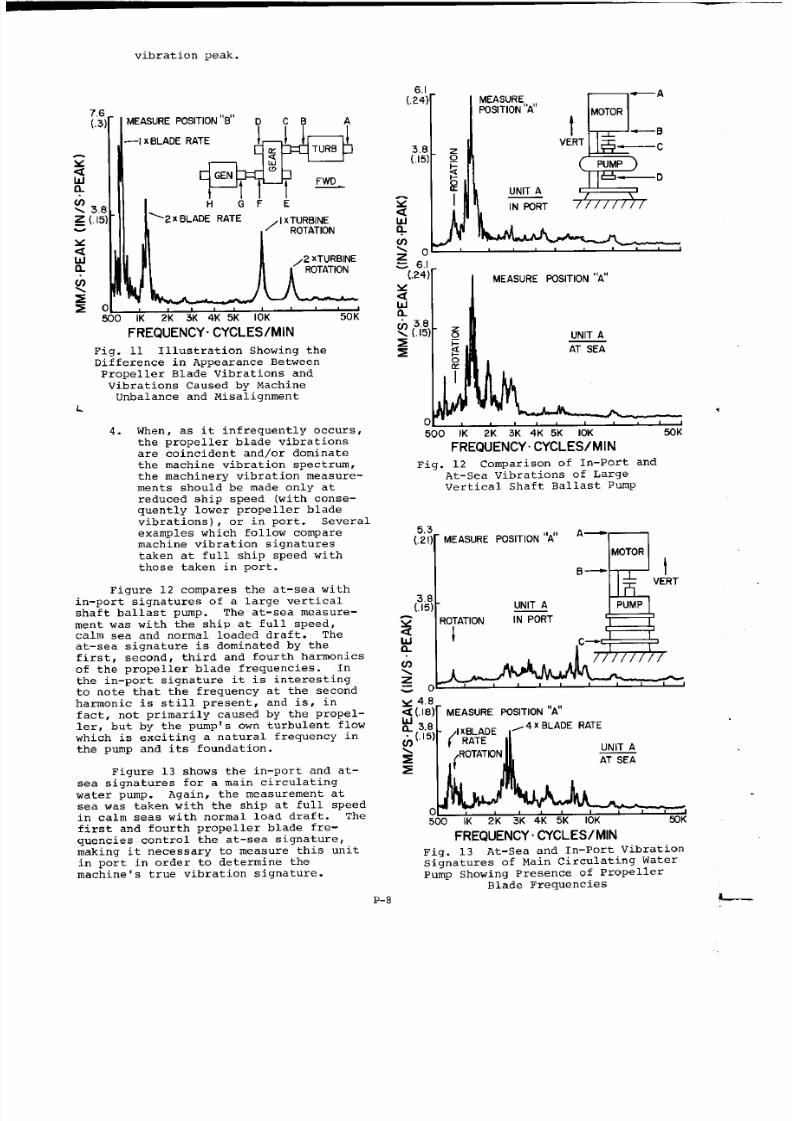
Fig. 11 Illustration Showing theDifference in Appearance Between
Propeller Blade Vibrations andVibrations Caused by MachineUnbalance and Misalignment
L
4. When, as it infrequently occurs,the propeller blade vibrations
are coincident and/or dominatethe machine vibration spectrum,the machinery vibration measure-
ments should be made only atreduced ship speed (with conse-
quently lower propeller bladevibrations) , or in port. Severalexamples which follow comparemachine vibration signatures
taken at full ship speed with
those taken in port.
Figure 12 compares the at-sea within-port signatures of a large vertical
shaft ballast pump. The at-sea measure-
ment was with the ship at full speed,calm sea and normal loaded draft. Theat-sea signature is dominated by the
first, second, third and fourth harmonicsof the propeller blade frequencies. In
the in-port signature it is interestingto note that the frequency at the secondharmonic is still present, and is, in
fact, not primarily caused by the propel-ler, but by tbe pump’s own turbulent flow
which is exciting a natural frequency in
the pump and its foundation.
Figure 13 shows the in-port and at-
sea signatures for a main circulating
water pump. Again, the measurement at
sea was taken with the ship at full speedin calm seas with normal load draft. The
first and fourth propeller blade fre-
quencies control the at-sea signature tmaking it necessary to measure this unit
in port in order to determine themachine’s true vibration signature.
6.I
(.24)1
3,8(.15
~
wn
MEASUREFOSITION ‘8A”
UNIT A
I IN R3RT
—A
liii
OTOR
t —BVERT
—c
PUMP
—D
t: J j
(.24) MEASURE POSITION “A”xauL~ 3.8A (.15) - siz Fz g
AT SEA
,
0 ,500 IK 2K 3K 4K 5K IOK 50K
FREQUENCY.CYCLES/MIN
Fig. 12 Comparison of In-Port and
At-Sea Vibrations of Large
Vertical Shaft Ballast Pump
5.3,.,lr.,=...,0=OnCITIfW’A” A+~
;L:’””- B-EV)RT
% I‘“i”’’””,,-...
(n ////////
\z=0~ 4.s-
~(.ls) MEASURE POSITION “A”
a 3.8~(.15) “ (1 ~~:y
,4 x BLADE RATE
UNIT A2
(ROTATION
AT SEAz
o 4 ,500 IK 2K 3K 4K 5K IOK 50K
FREQUENCY CYCLES/MIN
Fig. 13 At-Sea and In-Port VibrationSignatures of Main Circulating Water
Pump Showing Presence of PropellerBlade Frequencies
8/6/2019 Vib Signatures 1
http://slidepdf.com/reader/full/vib-signatures-1 9/12
HULL vIBRAT1ON GENE~TED By HULL ANDPRDPELLER RANDOM FLOW TURBULENCE
Machine vibration caused by hull
and propeller generated random flow tur-
bulence is not often a problem in machin-
ery vibration measurement but can OCCaS -
s~onally result in masking a machine’s
vibration signature. Impact type vibra-
tions can also occur which are caused
primarily by wave action, but these are
generally intermittent and do not have a
significant effect on the vibration sig-
natures. It is the random turbulence
generated vibration which is not easy to
measure and identify because it lacks
the distinctive discrete frequency
characteristics which are associated withmachine vibrations and those of the prop-
eller blade frequencies. Identificationis primarily by deduction through the
process of elimination of identifiable
frequencies. This process is aided
somewhat by the fact that it’srandom
broad band nature produces a distributed“hashy” type signature when plotted by a
slow swept narrow band frequency analyzer.
This distributed energy often forms intobroadly peaked frequency regions, and
occasionally is exhibited as fairly
&arply pronounced frequency peaks. Thispeaking appears to be the result of weak,
or strong excitation of local hull and/orfoundation structural natural frequencies.The extent of the peaking is felt to be
related to the degree of damping in the
structure, although some periodic flow
vortex generation could be a contributing
f actor.
As might be expected, flow turbu-
lence appears to be most pronounced
toward the stern; and, therefore, when
it is seen it generally affects machin-
e~ :nstalled close to the stern and
particularly those mounted low in tbe
ship.
Since the various pumping systems
aboard ship can develop flow excited
vibrations in themselves as a result
of the fluids passing throuqh the pumps
and piping, it is often difficult toseparate these vibrations from those
generated by the hull and propeller flow.In such cases, where it is suspected
that hull and/or propeller may be contri-buting to the vibrations measured on a
pumping system, it is necessary to take
measurements in port or at reduced shipspeed where hull and propeller flow were
felt to be contributing , as shown inthe following examples:
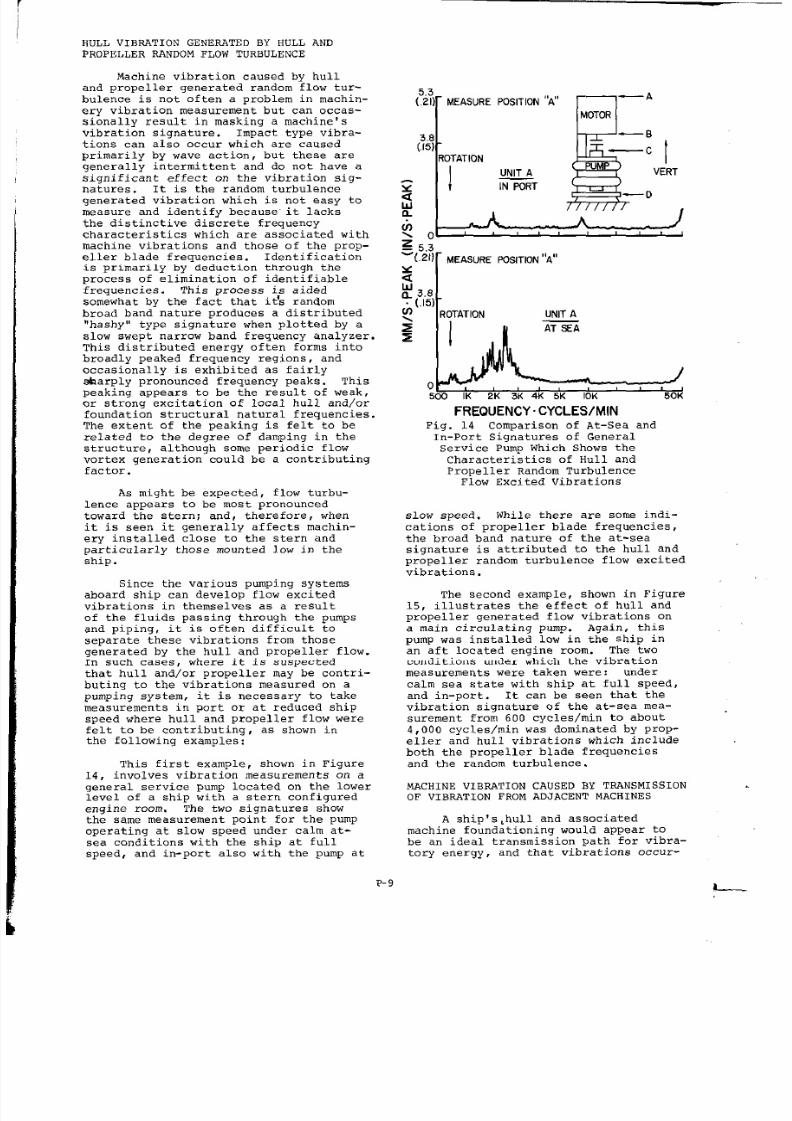
This first example, shown in Figure
14, involves vibration measurements on a
general service pump located on the lower
level of a ship with a stern configured
engine room. The two signatures show
the same measurement point for the pump
operating at slow speed under calm at-
sea conditions with the ship at full
speed, and in-port also with the pump at
5.3
[
(.21) MEASURE POSITION “A”
3,8(.15)
t
ROTATION
l—
UNIT A
g IN FURT
—A
E
OTOR
—B
‘c t
VERT
—o
fiL
( i J
10G 5,3
[‘(.21) MEASURE POSITION “A”
v
“(’:LCCI IK 2K 3K 4K 5K IOK 50K
FREQUENCY CYCLES/MINFig. 14 Comparison of At-Sea andIn-Port Signatures of General
Service Pump Which Shows theCharacteristics of Hull andPrope her Random Turbulence
Flow Excited Vibrations
slow speed. While there are some indi-
cations of propeller blade frequencies,
the broad band nature of the at-sea
signature is attributed to the hull and
propeller random turbulence flow excited“ibrations.
The second example, shown in Figure15, illustrates the effect of hull andpropeller generated flow vibrations on
a main circulating pump. Again, this
pump was installed low in the ship inan aft located engine room. The two
conditions under which the vibration
measurements were taken were: under
calm sea state with ship at full speed,
and in-port. It can be seen that thevibration signature of the at-sea mea-
surement from 600 cycles/rein to about4,000 cycles/rein was dominated by prop-
eller and hull vibrations which include
both the propeller blade frequenciesand the random turbulence.
NACHINE VIBRATION CAUSED BY TRANSMISSIDN
OF VIBRATION FROM ADJACENT MACHINES
A ship’s ,hull and associated
machine foundationing would appear tobe an ideal transmission path for vibra-tory energy, and that vibrations occur-
P-9L
8/6/2019 Vib Signatures 1
http://slidepdf.com/reader/full/vib-signatures-1 10/12
—–——
5,3
[
(.21)MEASURE POSITION ‘~
n
—A
MOTOR
z 5,3- (.21)r MEASURE puslTloN ‘x’
“ION
1n
AT SEA
AA’Jk< 2K 3K 4K 5K IOK 50K
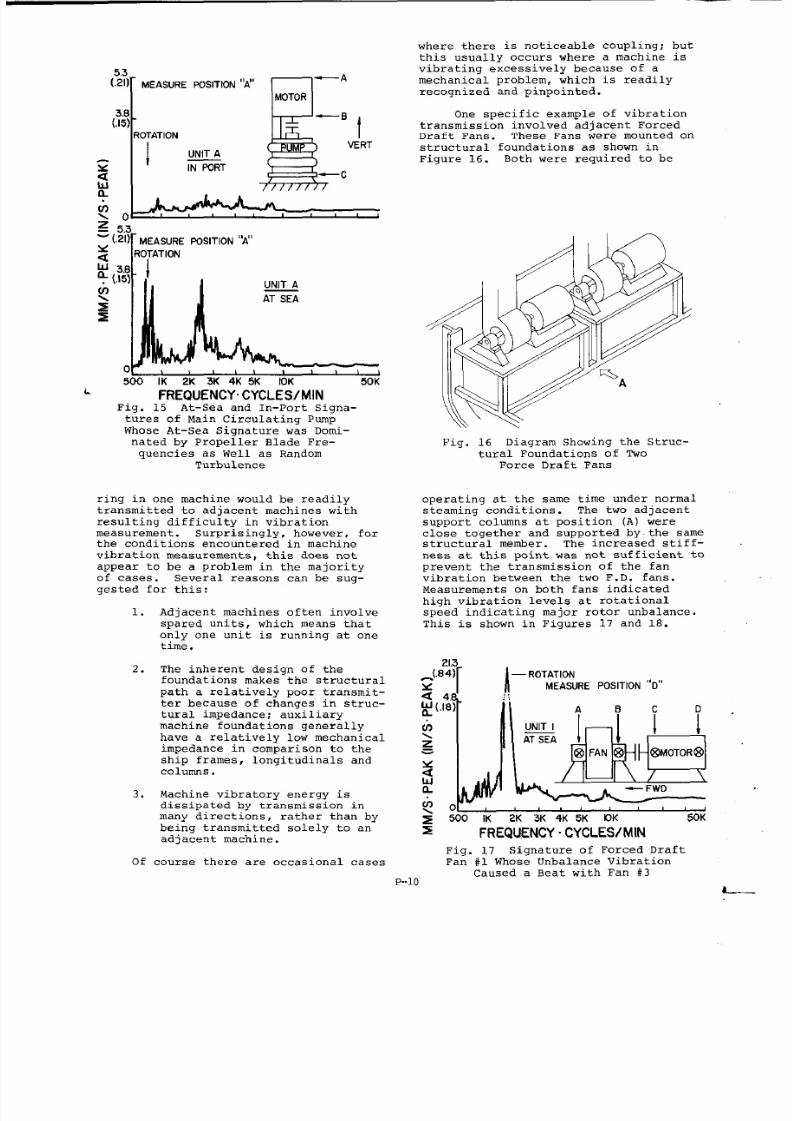
‘REQUENCY. CYCLES/MINFig. 15 At-Sea and In-Port Signa-tures of Main Circulating Pump
Whose At-Sea Signature was Domi-nated bv Propeller Blade Fre-
quenci~s as-well as Random
Turbulence
ring in one machine would be readilytransmitted to adjacent machines with
resulting difficulty i“ vibration
measurement. Surprisingly, however, for
the conditions encountered in machine
vibration measurements, this does not
aPPear tO be a problem in the majorityof cases. Several reasons can be sug-
gested for this:
1. Adjacent machines often involve
spared units, which means that
only one unit is running at one
time.
2. The inherent design of tbefoundations makes the structural
path a relatively poor tranmnit-
ter because of changes in struc-tural impedance; auxiliary
machine foundations generally
have a relatively low mechanical
impedance in comparison to theship frames, longitudinal and
columns .
3. Machine vibratory energy is
dissipated by transmission in
many directions, rather than by
being transmitted solely to anadjacent machine.
Of course there are occasional cases
where there is noticeable coupling: butthis usually occurs where a machine is
vibrating excessively because of amechanical problem, which is readily
recognized and pinpointed.
One specific example of vibration
transmission involved adjacent ForcedDraft Fans. These Fans were mounted on
structural foundations as shown in
Figure 16. Both were required to be
“%A
Fig. 16 Diagram showing the Struc-
tural Foundations of TwoForce Draft Fans
operating at the same time under normalsteaming conditions. The two adjacentsupport columns at position (A) were
close together and supported by. the samestructural member. The increased stiff-ness at this point was not sufficient to
prevent tbe transmission of the fanvibration between the two F.D. fans.
Measurements on both fans indicated
high vibration levels at rotationalspeed indicating major rotor unbalance.
This is shown in Figures 17 and 18.
21.3
_(.84)
[A
— ROTATION
MEASURE POSITION “O”
[~~,,,
: ,.
-M- FWO
2K 3K 4K 5K OK 50K
z FREQUENCY CYCLES/MIN
Fig. 17 Signature of Forced Draft
Fan #1 Whose Unbalance Vibration
Caused a Beat with Fan #3P-lo
?--
8/6/2019 Vib Signatures 1
http://slidepdf.com/reader/full/vib-signatures-1 11/12
16.6
~(.66)
$ 4.’s
r
L (.!6)
I
J,-OTATION
MEASURE POSITION “D”
J\ -
UNIT 3
AT SEA
o t500 IK 2K 3K 4K 5K IOK 50K
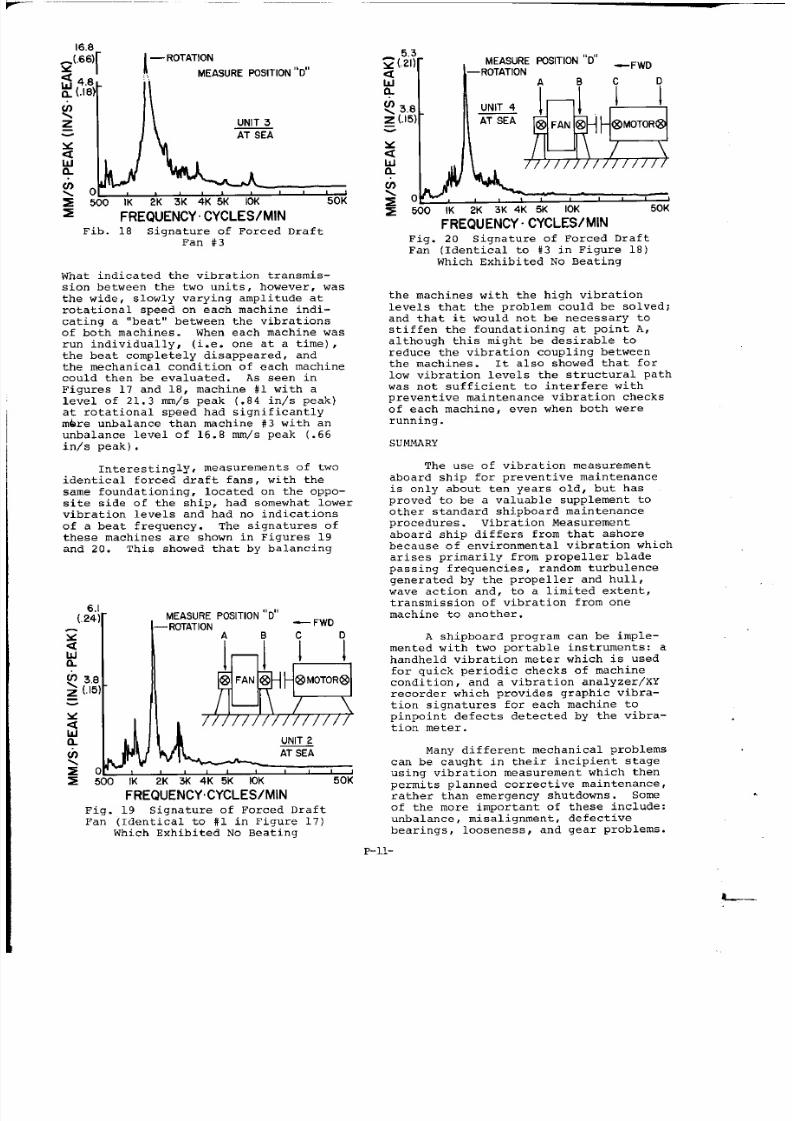
FREQUENCYCYCLES/MINFib. 18 Signature of Forced Draft
Fan #3
What indicated the vibration transmis-sion between the two units, bowever, wasthe wide, slowly varying amplitude at
rotational speed on each machine indi-
cating a “beat” between the vibrationsof both machines. When each machine wasrun individually, (i.e. one at a time),
the beat completely disappeared, and
the mechanical condition of each machinecould then be evaluated. As seen inFigures 17 and 18, machine #1 with a
level of 21.3 mm/s peak (.84 in/s peak)
at rotational speed had significantlymbre unbalance than machine #3 with an
unbalance level of 16.8 mm/s peak (.66
in/s peak) .
lnterestinglYr measurements Of two
identical forced draft fans, with the
same foundationing, located on the oPPo-
site side of the ship, had somewhat lower
vibration levels and had no indications
of a beat frequency. The signatures ofthese machines are shown in Figures 19
and 20. This showed that by balancing
6,1(,24) MEASURE POSITIOND”
— FWO
~
wa
h ATSEA\
= 500 IK 2K 3K 4K 5K IOK 50K
FREQUENCYCYCLES/MINFig. 19 Signature of Forced DraftFan (1f3entical to #1 in Figure 17)
Which Exhibited No Beating
A B c D
~ (% MEASURE FOSITION “O”
—ROTATION-FWO
wn
<3,6 - UNIT 4
z (.15) AT SEA=
300 IK 2K 3K 4K 5K IOK 50K
FREQUENCY CYCLES/MIN
/ I 1 \ [//////////////)
Fig. 20 Si9natUre of Forced DraftFan (Identical to #3 in Figure 18)
Which Exhibited No Beating
the machines “ith tbe high vibration
levels that the problem could be solved;
and that it would not be necessary tostiffen the foundationing at point A,
although this might be desirable to
reduce the vibration coupling betweenthe machines. It also showed that for
low vibration levels the structural pathwas not sufficient to interfere withpreventive maintenance vibration checks
of each machine, even when both wererunning.
SUMMARY
The use of vibration measurement
aboard ship for preventive maintenance
is only about ten years old, but has
proved to be a valuable supplement to
other standard shipboard maintenanceprocedures. Vibration Measurementaboard ship differs from that ashore
because of environmental vibration which
arises primarily from propeller bladepassing frequencies, random turbulencegenerated by the propeller and hull,wave action and, to a limited extent,transmission of vibration from one
machine to another.
A shipboard program can be imple-
mented “ith two portable instruments: a
handheld vibration meter which is usedfor quick periodic checks of machine
condition, and a vibration analyzer/XYrecorder which provides graphic vibra-
tion signatures for each machine topinpoint defects detected by the vibra-
tion meter.
Many different mechanical problemscan be caught in their incipient stageusing “ibration measurement which then
permits planned corrective maintenance,rather than emergency shutdowns. Some
of the more important of these include:
unbalance, misalignment, defective
bearings, looseness, and gear problems.
P-ll-
J--
8/6/2019 Vib Signatures 1
http://slidepdf.com/reader/full/vib-signatures-1 12/12
—-
Under some conditions environmentalvibrations can interfere with the truemeasurement of machine vibrations. A
number of procedures are a“ailable for
dealing with this. Special electronicfiltering in the vibration meter will
reduce the effect of low.frecf”ency
propeller vibrations, and careful sig-
nature analysis can separate environmen-tal vibrations from those of the meichine.For some machines in areas of high
environmental vibration it nay be neces-
sary to carry o“t the measurements inport or at low ship speeds. Where en-vironmental vibrations are caused byvibration transmission from adjacent
machines, foundation stiffening may be
required, but more often the problem can
be solved by reducing the vibrations ofthe offending machine by balancing, or
as otherwise required. This impro”esthe machine 1.snwcb.anical condition andeliminates the environmental “ibrationproblem.
Machinery preventive maintenanceand a knowledge of each machine, s condi-
tion is of vital concern aboard ship for
several reasons: 1) ships are often atlocations where it is difficult to obtainspare parts and repair work, 2) ship-
board machinery is forced to functionin a hostile environment of corrosionand “ibration, and 3) a machineryfailure at sea is always a serious and
sometimes dangerous occurance. Against
this , vibration measurement provides one
more preventive maintenance tool for theshipboard engineer.
REFERENCES
1. “Military Standard Mechanical
Vibrations of ShipboardEquipment, ” MIL-sTD-167B
(SHIPS), August, 1969.
2. “Acceptable Vibration of Marine
Steam and Heavy-duty Gas
Turbine Main and Auxiliary
Machinery Plants, ,’T & R Code
C-5, SNANE, September, 1976.
3. R. L. Baxter and D. L. Bernhard,
“Vibration Tolerances for
Industry, ” ASME 67-PEM-14 ,April, 1967. (Available asReprint No. 985 from lRD
Mechanalysis, Inc. , Columbus,
Ohio. )
2-12


![2nd term lecture,_,vib,_helico,tb,_spiro,rick[1]](https://img.pdfslide.us/doc/110x75/555080deb4c905a85c8b4615/2nd-term-lecturevibhelicotbspirorick1.jpg)