Embed Size (px)
Citation preview
ICCVAM Test Method Evaluation Report: Section 5.0 November 2006
5.0 THE HET-CAM TEST METHOD
5.1 HET-CAM Technical Summary
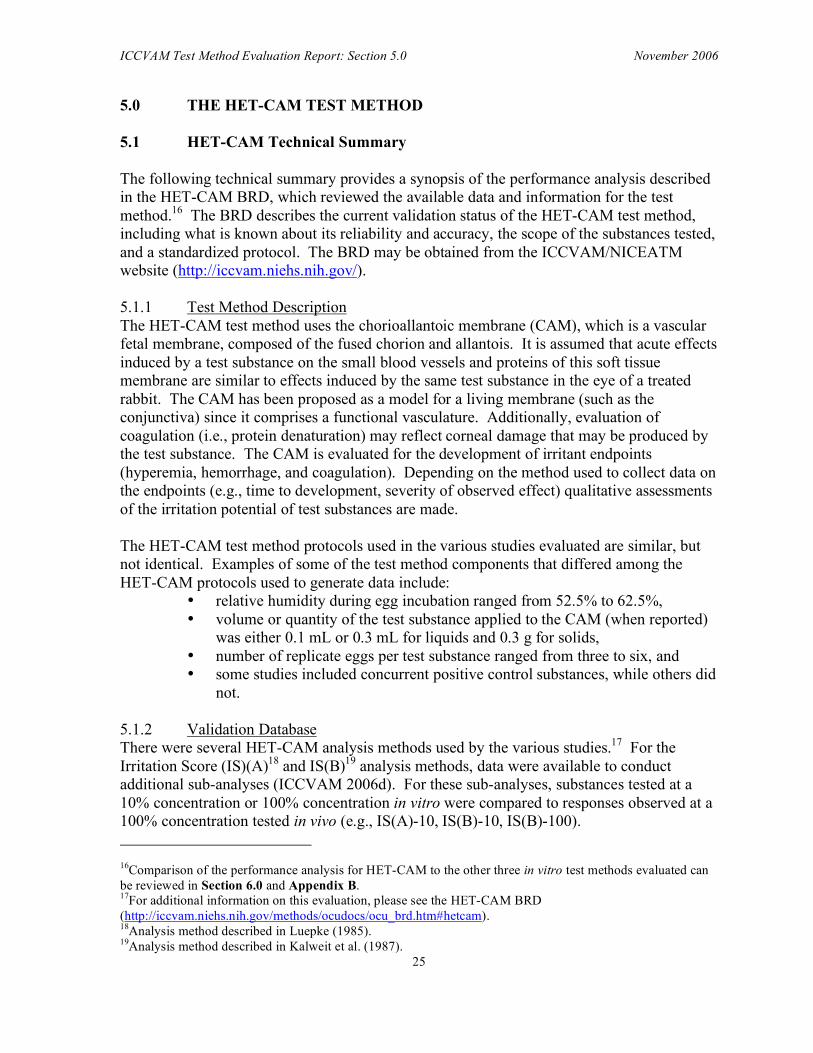
The following technical summary provides a synopsis of the performance analysis described in the HET-CAM BRD, which reviewed the available data and information for the test method.16 The BRD describes the current validation status of the HET-CAM test method, including what is known about its reliability and accuracy, the scope of the substances tested, and a standardized protocol. The BRD may be obtained from the ICCVAM/NICEATM website (http://iccvam.niehs.nih.gov/).
5.1.1 Test Method Description The HET-CAM test method uses the chorioallantoic membrane (CAM), which is a vascular fetal membrane, composed of the fused chorion and allantois. It is assumed that acute effects induced by a test substance on the small blood vessels and proteins of this soft tissue membrane are similar to effects induced by the same test substance in the eye of a treated rabbit. The CAM has been proposed as a model for a living membrane (such as the conjunctiva) since it comprises a functional vasculature. Additionally, evaluation of coagulation (i.e., protein denaturation) may reflect corneal damage that may be produced by the test substance. The CAM is evaluated for the development of irritant endpoints (hyperemia, hemorrhage, and coagulation). Depending on the method used to collect data on the endpoints (e.g., time to development, severity of observed effect) qualitative assessments of the irritation potential of test substances are made.
The HET-CAM test method protocols used in the various studies evaluated are similar, but not identical. Examples of some of the test method components that differed among the HET-CAM protocols used to generate data include:
• relative humidity during egg incubation ranged from 52.5% to 62.5%, • volume or quantity of the test substance applied to the CAM (when reported)
was either 0.1 mL or 0.3 mL for liquids and 0.3 g for solids, • number of replicate eggs per test substance ranged from three to six, and • some studies included concurrent positive control substances, while others did
not.
5.1.2 Validation Database There were several HET-CAM analysis methods used by the various studies.17 For the Irritation Score (IS)(A)18 and IS(B)19 analysis methods, data were available to conduct additional sub-analyses (ICCVAM 2006d). For these sub-analyses, substances tested at a 10% concentration or 100% concentration in vitro were compared to responses observed at a 100% concentration tested in vivo (e.g., IS(A)-10, IS(B)-10, IS(B)-100).
16Comparison of the performance analysis for HET-CAM to the other three in vitro test methods evaluated can be reviewed in Section 6.0 and Appendix B. 17For additional information on this evaluation, please see the HET-CAM BRD (http://iccvam.niehs.nih.gov/methods/ocudocs/ocu_brd.htm#hetcam). 18Analysis method described in Luepke (1985). 19Analysis method described in Kalweit et al. (1987).
25
ICCVAM Test Method Evaluation Report: Section 5.0 November 2006
A total of 24 and 20 substances were evaluated for the IS(A)-10 and IS(A)-100 analysis methods, respectively, using the decision criteria of Luepke (1985). For the IS(B)-10 and IS(B)-100 analysis methods, using the decision criteria of Luepke (1985), 101 and 138 substances were evaluated, respectively. The chemical classes tested included, but were not limited to, alcohols, amines, esters, ethers, formulations, heterocyclic compounds, inorganic salts, ketones, and organic salts. The product classes tested included, but were not limited to, cosmetics, solvents, shampoos, flavor ingredients, and pharmaceutical synthetics.
5.1.3 Test Method Accuracy For the IS(A) analysis method, accuracy increased when substances were evaluated in vitro at 100% concentration (IS(A)-100) compared to the 10% concentration (IS(A)-10) and where in vivo data were classified according to the EPA (1996), EU (2001), and GHS (UN 2003) classification systems. The opposite pattern was observed for the IS(B) analysis method; test method accuracy increased when substances were evaluated in vitro at 10% concentration (IS(B)-10) compared to the 100% concentration (IS(B)-100) and where in vivo data were classified according to the EPA (1996), EU (2001), and GHS (UN 2003) classification systems.
Chemical classes that were overpredicted by the HET-CAM IS(B) analysis methods, when testing substances at either a 10% or at 100% concentration, include alcohols (IS(B)-10: 89% [8/9]; IS(B)-100: 88% [14/16]), ethers (IS(B)-10: 50% [5/10]; IS(B)-100: 50% [6/12]), amines (IS(B)-10: 60% [3/5]; IS(B)-100: 83% [5/6]), organic salts (IS(B)-10: 57% [4/7]; IS(B)-100: 86% [6/7]), and heterocyclic compounds (IS(B)-10: 86% [6/7]; IS(B)-100: 78% [7/9]). Formulations appeared to have the lowest false positive rates for both IS(B)-10 and IS(B)-100 (Table 5-1). Chemical classes that were underpredicted by both analysis methods were amines and ethers.
An evaluation based on the physical form of the test substance in vivo depended on the analysis method being evaluated. For the IS(B)-100 analysis method, substances tested as solids in vivo had a false positive rate of 67% (16/24) and substances tested as liquids in vivo had a false positive rate of 65% (33/51) (Table 5-1). For the IS(B)-100 analysis method, substances tested as liquids in vivo had a false negative rate of 0% (0/9) and substances tested as solids in vivo had a false negative rate of 24% (4/17). For the IS(B)-10 analysis method, liquids had a false positive rate of 19% (3/16) and false negative rate of 37% (7/19) while solids had false positive and false negative rates of 58% (11/19) and 13% (1/8), respectively.
An analysis of the ability of the HET-CAM test method to identify ocular corrosives and severe irritants, depending on the nature of the in vivo ocular lesions (i.e., severity and/or persistence) responsible for classification of a substance as an ocular corrosive/severe irritant, indicated that, for IS(B)-10, the underpredicted substances were more likely to be substances classified as corrosive or severely irritating in vivo based on persistent lesions, with a false negative rate of 37% (10/27) compared to 15% (2/13) for substances classified as corrosive or severely irritating in vivo based on severity. For the IS(B)-100 analysis method, the underpredicted substances were more likely to be substances classified as corrosive or severely irritating in vivo based on severe lesions, with a false negative rate of 11% (2/19)
26
ICCVAM Test Method Evaluation Report: Section 5.0 November 2006
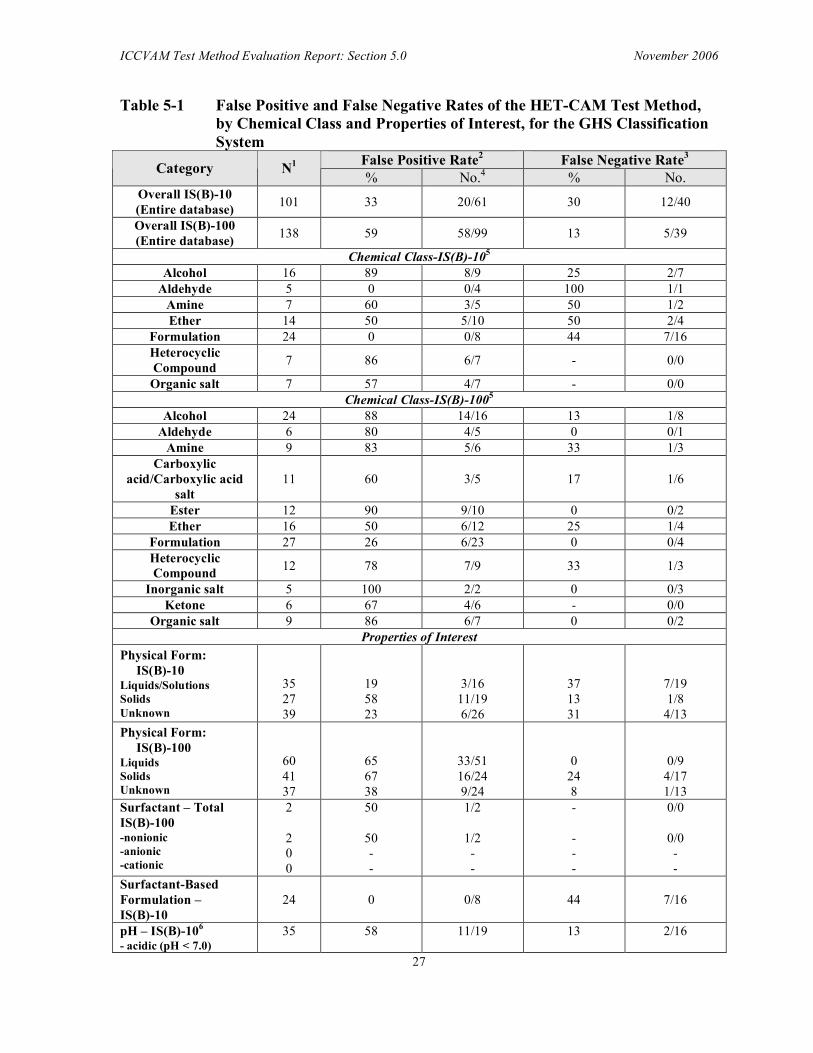
Table 5-1 False Positive and False Negative Rates of the HET-CAM Test Method, by Chemical Class and Properties of Interest, for the GHS Classification System
Category N1 False Positive Rate2 False Negative Rate3
% No.4 % No. Overall IS(B)-10 (Entire database)
101 33 20/61 30 12/40
Overall IS(B)-100 (Entire database)
138 59 58/99 13 5/39
Chemical Class-IS(B)-105
Alcohol 16 89 8/9 25 2/7 Aldehyde 5 0 0/4 100 1/1
Amine 7 60 3/5 50 1/2 Ether 14 50 5/10 50 2/4
Formulation 24 0 0/8 44 7/16 Heterocyclic Compound
7 86 6/7 - 0/0
Organic salt 7 57 4/7 - 0/0 Chemical Class-IS(B)-1005
Alcohol 24 88 14/16 13 1/8 Aldehyde 6 80 4/5 0 0/1
Amine 9 83 5/6 33 1/3 Carboxylic
acid/Carboxylic acid salt
11 60 3/5 17 1/6
Ester 12 90 9/10 0 0/2 Ether 16 50 6/12 25 1/4
Formulation 27 26 6/23 0 0/4 Heterocyclic Compound 12 78 7/9 33 1/3
Inorganic salt 5 100 2/2 0 0/3 Ketone 6 67 4/6 - 0/0
Organic salt 9 86 6/7 0 0/2 Properties of Interest
Physical Form: IS(B)-10
Liquids/Solutions Solids Unknown
35 27 39
19 58 23
3/16 11/19 6/26
37 13 31
7/19 1/8
4/13 Physical Form:
IS(B)-100 Liquids Solids Unknown
60 41 37
65 67 38
33/51 16/24 9/24
0 24 8
0/9 4/17 1/13
Surfactant – Total IS(B)-100 -nonionic -anionic -cationic
2
2 0 0
50
50 --
1/2
1/2 --
-
---
0/0
0/0 --
Surfactant-Based Formulation – IS(B)-10
24 0 0/8 44 7/16
pH – IS(B)-106
- acidic (pH < 7.0) 35 58 11/19 13 2/16
27
ICCVAM Test Method Evaluation Report: Section 5.0 November 2006
Category N1 False Positive Rate2 False Negative Rate3
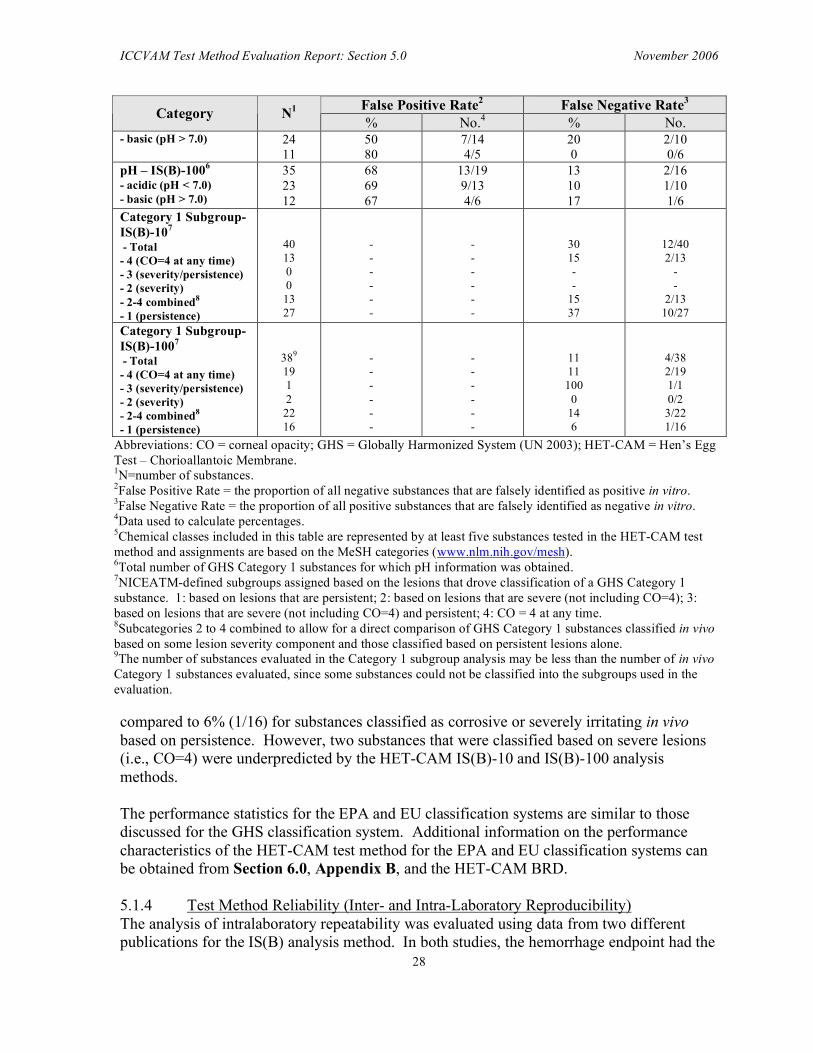
% No.4 % No. - basic (pH > 7.0) 24
11 50 80
7/14 4/5
20 0
2/10 0/6
pH – IS(B)-1006
- acidic (pH < 7.0) - basic (pH > 7.0)
35 23 12
68 69 67
13/19 9/13 4/6
13 10 17
2/16 1/10 1/6
Category 1 Subgroup-IS(B)-107
- Total 40 - - 30 12/40 - 4 (CO=4 at any time) 13 - - 15 2/13 - 3 (severity/persistence) 0 - - - -- 2 (severity) 0 - - - -
- 2-4 combined8 13 - - 15 2/13
- 1 (persistence) 27 - - 37 10/27
Category 1 Subgroup-IS(B)-1007
- Total 389 - - 11 4/38
- 4 (CO=4 at any time) 19 - - 11 2/19
- 3 (severity/persistence) 1 - - 100 1/1
- 2 (severity) 2 - - 0 0/2 - 2-4 combined8 22 - - 14 3/22 - 1 (persistence) 16 - - 6 1/16
Abbreviations: CO = corneal opacity; GHS = Globally Harmonized System (UN 2003); HET-CAM = Hen’s Egg Test – Chorioallantoic Membrane. 1N=number of substances. 2False Positive Rate = the proportion of all negative substances that are falsely identified as positive in vitro. 3False Negative Rate = the proportion of all positive substances that are falsely identified as negative in vitro. 4Data used to calculate percentages. 5Chemical classes included in this table are represented by at least five substances tested in the HET-CAM test method and assignments are based on the MeSH categories (www.nlm.nih.gov/mesh). 6Total number of GHS Category 1 substances for which pH information was obtained. 7NICEATM-defined subgroups assigned based on the lesions that drove classification of a GHS Category 1 substance. 1: based on lesions that are persistent; 2: based on lesions that are severe (not including CO=4); 3: based on lesions that are severe (not including CO=4) and persistent; 4: CO = 4 at any time. 8Subcategories 2 to 4 combined to allow for a direct comparison of GHS Category 1 substances classified in vivo based on some lesion severity component and those classified based on persistent lesions alone. 9The number of substances evaluated in the Category 1 subgroup analysis may be less than the number of in vivo Category 1 substances evaluated, since some substances could not be classified into the subgroups used in the evaluation.
compared to 6% (1/16) for substances classified as corrosive or severely irritating in vivo based on persistence. However, two substances that were classified based on severe lesions (i.e., CO=4) were underpredicted by the HET-CAM IS(B)-10 and IS(B)-100 analysis methods.
The performance statistics for the EPA and EU classification systems are similar to those discussed for the GHS classification system. Additional information on the performance characteristics of the HET-CAM test method for the EPA and EU classification systems can be obtained from Section 6.0, Appendix B, and the HET-CAM BRD.
5.1.4 Test Method Reliability (Inter- and Intra-Laboratory Reproducibility) The analysis of intralaboratory repeatability was evaluated using data from two different publications for the IS(B) analysis method. In both studies, the hemorrhage endpoint had the
28
ICCVAM Test Method Evaluation Report: Section 5.0 November 2006
highest CV value (109.10%-117.56%). The CV values for the coagulation endpoint ranged from 41.78% to 95.69%. The difference in the numbers may be due to several factors including test substances evaluated and differences in the test method protocols used between the two studies. The calculated variability for the endpoints and the overall test method may be exaggerated because of the relatively small dynamic ranges for each of the endpoints (0.02 to 5 for hemorrhage, 0.02 to 7 for lysis, and 0.03 to 9 for coagulation). Similar results were obtained from the analysis of intralaboratory reproducibility.
A qualitative analysis of interlaboratory reliability also was conducted. For the IS(B)-10 analysis method, the participating laboratories were in 100% agreement for 84 to 85 (79% to 81%) of 104 to 107 substances evaluated, when compared to all three hazard classification systems. For the IS(B)-100 analysis method, the participating laboratories in a study were in 100% agreement for 80 to 81 (82% to 84%) of the 95 to 99 substances evaluated, when compared to all three hazard classification systems. There was 100% agreement with regard to the ocular irritancy classification for 11 (64% to 69%) of the 16 to 17 substances evaluated in five laboratories using the IS(A) analysis method, when compared to all three hazard classification systems.
The overall reliability statistics, arranged by HET-CAM data analysis method, were consistent with what was observed for the individual studies evaluated. For the IS(B)-10, the statistics were identical to what was discussed previously. For the IS(A) and IS(B)-100 analysis methods, additional laboratory data was available for a subset of the substances tested for each analysis method. For both of these analysis methods, the addition of the results from additional testing laboratories yielded a concordance pattern consistent with that described above.
Quantitative evaluations of interlaboratory reproducibility were conducted for the same analysis methods. For one study, two different evaluations were conducted based on the concentration tested in vitro using the IS(B) analysis method. For 14 substances evaluated at 100% concentration, the mean and median CV values were 31.86% and 33.04%, respectively. In the same study, for 12 substances evaluated at 10% concentration, the mean and median CV values were 66.29% and 60.75%, respectively. For the substances evaluated in another study, which used the IS(B) analysis method, the mean and median CV values for substances tested at 10% concentration were 60.17% and 42.65%, respectively. For substances tested at 100% concentration in the same study, the mean and median CV values were lower: 35.21% and 26.22%, respectively. When substances that were tested in three different testing laboratories (instead of two) were removed from the assessment, little change was seen in the mean and median CV values for both concentrations tested. For a study using the IS(A) analysis method, the mean and median CV for substances classified as GHS Category 1 (UN 2003) were 26.09% and 27.08%, respectively. The mean and median CV for substances classified as EPA Category I (EPA 1996) were 25.86% and 26.43%, respectively.
29
ICCVAM Test Method Evaluation Report: Section 5.0 November 2006
5.2 ICCVAM Recommendations for the HET-CAM Test Method
5.2.1 Use of the HET-CAM Test Method ICCVAM evaluated several HET-CAM analysis methods proposed for identifying substances that are ocular corrosives or severe irritants. These included one analysis method termed the IS(B)-10 and another analysis method termed IS(B)-100. The range of hazard classification accuracy rates across the EU, EPA, and GHS classification systems for these two analysis methods ranged from 65% (64/98) to 68% (69/101) for IS(B)-10 and 52% (69/133) to 57% (94/164) for IS(B)-100, when the decision criteria of Luepke (1985) were used. The overall false negative and false positive rates of the IS(B)-10 analysis method range from 30% (10/33 to 12/40) to 32% (10/31) and 33% (20/61) to 36% (24/67), respectively, depending on the classification system. The overall false negative and false positive rates for the IS(B)-100 analysis method range from 6% (2/33) to 13% (5/39) and 52% (68/131) to 59% (58/99), respectively, depending on the classification system. Based on these rates, the use of these analyses methods and decision criteria for screening and identifying ocular corrosives and severe irritants (i.e., EPA Category I, GHS Category 1, EU R41) in a tiered-testing strategy, as part of a weight-of-evidence approach, is not recommended.
Users should be aware that HET-CAM’s performance characteristics could be revised as additional data become available. Therefore, prior to initiation of non-regulatory, validation, or optimization HET-CAM studies, investigators are encouraged to consult the ICCVAM/NICEATM website (see http://iccvam.niehs.nih.gov/methods/eyeirrit.htm) to review the most current validation database, overall performance characteristics, and chemical and physical class performance characteristics. Evaluation of the most current information will allow users to determine the appropriateness of this test method for evaluating substances that are within a specific chemical, physical, or product classes.
5.2.2 HET-CAM Test Method Protocol When non-regulatory, validation, or optimization studies are conducted using the HET-CAM test method, the protocol should be based on the standardized protocol provided in Appendix G. This will facilitate collection of consistent data and expand the current validation database. Exceptions and/or changes to the test method protocol should be accompanied by a scientific rationale.
Users should be aware that HET-CAM’s standardized test method protocol could be revised as additional data become available. Therefore, prior to initiation of HET-CAM studies, investigators are encouraged to consult the ICCVAM/NICEATM website (see http://iccvam.niehs.nih.gov/methods/eyeirrit.htm) to review the most current recommended standardized test method protocol.
ICCVAM recommends that, for all studies, raw data be collected and maintained. The availability of such data will allow for further retrospective evaluation of test method accuracy and/or reliability.
30
ICCVAM Test Method Evaluation Report: Section 5.0 November 2006
5.2.3 Optimization of the Current HET-CAM Test Method Protocol
ICCVAM recommends that additional studies should be conducted to further optimize the HET-CAM prediction models and the decision criteria (e.g., mtc10) that would be used to identify ocular corrosives and severe irritants for the EPA, GHS, or EU classification systems. Such studies could potentially improve the usefulness of the HET-CAM test method for identifying severe ocular irritants and corrosives and its possible future use for the identification of mild and moderate ocular irritants (e.g., EPA Category II, III, and IV; GHS Category 2; EU R36).
31