Embed Size (px)
Citation preview

AlWWUa ASESB LIBRARY
h/WC
USADAC TECHNICAL LIBRARY
TECHNICAL PROGRESS REPORT 413 NOTS TP 3910
COPY 5 3
5 0712 01019401 6
HIGH EXPLOSIVE EQUIVALENCY TESTS OF ROCKET MOTORS by
F. H. Weals C. H. Wilson
Systems Development Department
ABSTRACT. From November 1964 to 19 March 1965 seven solid propellant motor hazard tests and two high explosive calibration tests were conducted at the U.S. Naval Ordnance Test Station, China Lake, California. The primary purpose of the tests was to assess the blast yield of two classes of solid propel- lant material, when subjected to severe explosive shock, and to compare the propellant blast yields to those produced by a standard explosive. The following yields, in percent of TNT equivalency by weight, were determined from over- pressure and impulse data from a blast gage array: The highest yield of class 2 propellants tested alone approximated 40%; class 7 propellants tested alone produced well over 100%; and a combination of equal amounts of each class produced approximately 100%. The quantity and dispersion of fragments varied widely with the propellants used and with the test configuration.
Additional tests are planned using different motor configurations, different pro- pellants, and varying explosive stimuli.
U.S. NAVAL ORDNANCE TEST STATION
China Lake, California
November 1965
ASESB LJBRARy
y ro ^
V

NAVAL ORDNANCE TEST STATION
AN ACTIVITY OF THE BUREAU OF NAVAL WEAPONS
J. I. HARDY, CAPT.. USN WM. B. MCLEAN. PH.D. Commander Technical Director
FOREWORD
This report documents results from the initial seven tests in a continuing series
of experiments planned to investigate the blast yield of solid propellant motors.
Blast yields from the seven motor tests are related to those produced by common
explosives, TNT, and Composition B, to arrive at high explosive equivalency
values for the propellants investigated.
The tests were conducted during the period November 1964 to March 1965 for
the Armed Services Explosives Safety Board (ASESB). The primary funding was
provided by the National Aeronautics and Space Administration (NASA) under
Work Request W-11S43B-Am. 1 and Local Project Number 965.
Supplemental funding was provided through the Dividing Wall program, which
is supported by funds from the three Military Departments and from the Defense
Atomic Support Agency (DASA). The Dividing Wall program is currently iden-
tified as Task Assignment RMMO-62061/216-1/F008-11-05 and Local Project
No. 556.
Released by ,, . , . , _ , Under authority of
JAMES E. COLVARD, Head _ w ' M ' ' WM. B. McLEAN Project Engineering Division _ . . _ 3 a a Technical Director August 1965
NOTS Technical Publication 3910
Technical Progress Report 413
Published by Systems Development Department
Manuscript 30/MS-751
Collation Cover, 25 leaves, DD Form 1473, abstract cards
First printing 135 numbered copies
11

—
THIS REPORT HAS BEEN DELIMITED
AND CLEARED FOR PUBLIC RELEASE
UNDER DOD DIRECTIVE 5200,20 AND
NO RESTRICTIONS ARE IMPOSED UPON
ITS USE AND DISCLOSURE, • -
•
DISTRIBUTION STATEMENT A
APPROVED FOR PUBLIC RELEASE;
DISTRIBUTION UNLIMITED, <
.
•
•fl«W
*

SECURITY MARKING
The classified or limited status of this report applies
to each page, unless otherwise marked.
Separate page printouts MUST be marked accordingly.
THIS DOCUMENT CONTAINS INFORMATION AFFECTING THE NATIONAL DEFENSE OF THE UNITED STATES WITHIN THE MEANING OF THE ESPIONAGE LAWS, TITLE 18, U.S.C., SECTIONS 793 AND 794. THE TRANSMISSION OR THE REVELATION OF ITS CONTENTS IN ANY MANNER TO AN UNAUTHORIZED PERSON IS PROHIBITED BY LAW.
NOTICE: When government or other drawings, specifications or other data are used for any purpose other than in connection with a defi- nitely related government procurement operation, the U. S. Government thereby incurs no responsibility, nor any obligation whatsoever; and the fact that the Government may have formulated, furnished, or in any way supplied the said drawings, specifications, or~uther data is not to be regarded by implication or otherwise as in any manner licensing the holder or any other person or corporation, or conveying any rights or permission to manufacture, use or sell any patented invention that may in any way be related thereto.

I TPR U13
I
CONTENTS
Introduction 1 Description of Tests 1
Motor Tests 1 Calibration Firings With High Explosive 2 Test Instrumentation 4
Test Results 10 Summary 10
Analysis of Blast Gage Data 19 Comparison With Published Data 19 Overpressure Comparison With High Explosive Calibration Firings 20 Impulse Comparison With High Explosive Calibration Firings 21 Limitations of Reference Data 23 Explanation of Tables 1 Through 9 23
Analysis of Blast Yield Comparisons 33 Comparison With TNT 33 Comparison With Composition B 33 General Observations Concerning Derived Yields 36
Conclusions 37 Appendix: Armed Services Explosives Safety Board Solid Propellant Motor Hazards Tests ... 39
Figures:
1. Montage Showing Motors in Place for Tests 1 Through 7 3 2. Test Configurations Used in Calibration Firings A and B 3 3. Overpressure Gage Layout for Motor Hazard Tests Using 1 or 2 Motors Per Test .... 5 4. Fragment Distribution, Test No. 1 7 5. Propellant Fragment Dispersion on Preselected Plots, Test No. 4 8 6. Propellant Fragment Dispersion on Preselected Plots, Test No. 5 9 7. Aerial View of Test No. 1 at Time of Explosion 11 8. Aerial View of Test No. 1 Approximately 5 Seconds After the Explosion
Showing Burning Fragments of Propellant in the Air 12 9. Crater Formed by Test No. 1 13
10. Test Site After Test No. 1 13 11. Residue of Class 2 Propellant After Burning on Ground, Test No. 1 14
111
TPR Ul3 I
12. Crater Formed by Test No. 2 15 13. Crack in Ground Surface Near Crater Formed by Test No. 2 15 14. Side View of Crater Formed by Test No. 3 17 15. Top View of Crater Formed by Test No. 3 17 16. Overpressure Versus Scaled Distance Calibration Curves 20 17. Scaled Impulse Versus Scaled Distance 22 18. Impulse Versus W2^3 for R Values of 210, 340, 520, 880,
1,400, and 2,000 Feet (Calibration Tests A and B) 22 19. Impulse Versus W2/3 for R Values of 80, 110, and 150
Feet (Calibration Tests A and B) 23
Tables:
1. Test #1 (ES-4259) 24 2. Test #2 (ES-4260) 25 3. Test #3 (ES-4261-1) 26 4. Test #4 (ES-4261-2) 27 5. Test #5 (ES-5001) 28 6. Test #6 (ES-5058) 29 7. Test #7 (ES-5065) 30 8. Calibration Test "A" (ES-4262) 31 9. Calibration Test "B" (ES-5064) 32
10. Summary of TNT Equivalent Yield 34 11. Summary in Terms of Composition "B" Equivalent Yield 35
I
ACKNOWLEDGMENT
Constructive comments in test planning and report preparation have been received from members of the staff of ASESB. Will Filler of the Naval Ordnance Laboratory, White Oak, has pro- vided valuable suggestions relating to the technical aspects of the report.
IV

I TPR Ul3
I
I
INTRODUCTION
This report presents an interim summary of data presently available from a continuing series of solid propellant motor hazard tests. The tests are being conducted at the U. S. Naval Ordnance Test Station (NOTS), China Lake, California, under the auspices of the Armed Services Explo- sives Safety Board (ASESB), with funds provided primarily by the National Aeronautics and Space Administration (NASA). The motors tested were pro- vided by the Bureau of Naval Weapons, Special Projects Office.
The seven motor tests and two calibration high-explosive tests de- scribed in this report were conducted from 5 November 196^ through 19 March 1965- The purpose of the tests was to assess the blast yield of two classes of solid propellant material, when subjected to severe ex- plosive shock, and to compare the propellant blast yields to those pro- duced by standard explosives.
DESCRIPTION OF TESTS
MOTOR TESTS
One class 2 motor was used in Test No. 1, and one class 7 motor was used in Test No. 2. A primary objective of the two tests was to determine the blast yield of large solid propellant motors when subject- ed to the severe stimulus of the detonation of a high explosive primer in intimate contact with the propellant grain. The priming explosive consisted of 96 lb of Composition C-^- placed in the grain perforation, with an electric detonator embedded in each end of the priming charge.
Two motors (one class 2 and one class 7) were used in each of the next three tests. Only the motor containing class 7 propellant was primed; the stimulus to the class 2 motor was provided by the explosion of the class 7 donor motor. Tests 3 and h were identical, with the mo- tors placed side-by-side in a horizontal attitude; in Test 5, the class 7 motor was placed on top of the class 2 motor, with both motors in a vertical position.
TPR 1+13
The test setup for Test No. 6 was the same as for Tests 3 and k, except that two class 2 motors (each primed with 96 lb of C~k) were used. The seventh test configuration was like that of Test 5; i.e., a class 7 motor was placed on top of the class 2 motor; however, the priming agent used in this test was a 100-lb spherical charge of cyclotol placed on top of the class 7 motor.
Figure 1 shows the test configurations used in each of the seven motor tests.
CALIBRATION FIRINGS WITH HIGH EXPLOSIVE
Calibration Test A
The common explosive, Composition B, was employed for this test. The Comp B was in cast form and contained in cubical metal cans. Each container and its contents weighed Vfl" pounds. The cans were arranged in a configuration approximating that of two test motors, side-by-side, as in Tests 3 and k. The explosive configuration measured 8l inches by _ 56 inches in plan form and was 36 inches high. Two cans were removed from the main group and stacked on top to make room for the two UO-lb • booster charges that were inserted, one in either side of the stack. Each booster charge was equipped with two electric blasting caps, all four of which were fired simultaneously.
Calibration Test B
In this test, flaked TNT was placed in a braced wooden structure of octagonal cross section. The length-to-diameter ratio of the explo- sive charge approximated that of a single motor of the types employed in the motor tests. The main axis of the charge was horizontal, and the bottom of the charge was separated from the ground plane by the thickness of the container floor--about four inches. Priming was accomplished with 96 lb of C-k contained in a 6x6-inch wooden box that extended from one end to the other at the main axis of the TNT package. The C-k explosive was detonated by two electric detonators, one at each end of the priming charge. Because the flaked TNT was considerably less dense than were the propellants in the motors tested, and also because of the weight differ- ence, the volume of the TNT charge was substantially greater than that of a single motor. •
Test configurations used for the two calibration tests are shown in Fig. 2.

£• 11 •-<
<v 0 V n o
9 2 n
H 3
3 r+
IK oi It t-* (/)
3" ', O y 3- R 3
IN IN
3" 2 ~>J O
o o 3 3
»/•*;> ,y.- v->-, |, | • ....
H * O
n ^V^ (A U1 4flfc ** \ ro '. ^0 * 0
0
w
3 Bfc v T) ST i (i O (B
£* * H CT>
1
"'
CD
i
o s a o s ? -J <• W ^vH « CL CD j | %$>» J O •
O 0 i W•H m
=1 7 f M :FV o »
§ i [ .^ -* o 2
•J » w -* tn
^B^nPrW
ff I—i
n Cl (u
N)
cr i K H »-" re 0 3 » T1 n tj- o 5' B.
IN VI
> 1 H 3 0 a 3
OJ
-+ rt CO
9 a
° o .-
O a,
cr o
•p-
TPR 1+13
Test parameters for both the motor and calibration tests are sum- marized below:
Class 2 Class 7 NOTS
Experiment Motor Number of motors
motors motors
Test test Prop. Prop. Specifica- number tested Number wt. Number wt. date tion Number
1 1 1 7,250 0 0 5 Nov 61+ 1+259
2 1 0 0 1 7,360 16 Nov 6k 1+260
3 2 1 7,250 1 7,360 18 Nov 6k 1+261-1
I* 2 1 7,250 1 7,360 20 Nov 6k 1+261-2
5 2 1 7,250 1 7,360 8 Jan 65 5001
6 2 2 ik,500 0 0 16 Mar 65 5058
7 2 1 7,250 1 7,360 17 Mar 65 5065
Calibration Test NOTS ES test Explosives date number
A 10 ,260 lb Comp. B & 80 lb C-k 25 Nov 61+ 1+262
B 10 ,650 lb TNT & 96 lb C-k 19 Mar 65 5061+
TEST INSTRUMENTATION
Blast Gages
Three different types of blast gages were used to measure overpres- sure-time history: Ballistics Research Laboratory (BRL) mechanical PHS gages, BRL mechanical PNS gages, and Kistler piezoelectric gages. The blast-measuring instruments were deployed on two radial lines at right angles to each other, as shown in the diagram in Fig. 3- Because of the differences in response times, the Kistler gages were placed relatively close in, PNS gages were located at mid-positions, and PHS gages were used in the more distant locations. The table below lists the gages and their positions; however, all gages were not used in all tests.

TPR Ul3
Detail: Configuration of Test Motors
.2000 (Not to scale)
0 m- One Motor: Tests 1 & 2
Two Motors: Tests 3 & 4 and Test 6
© Two Motors Vertical
Test No. 5 Test No. 7
North Gage Line Coincident With Motor Longitudinal Axis or Mean Position of Motor Axes
Center of Propellant Mass (See Detail)
East Gage Line Perpendicular to Motor Longitudinal Axis
^\r
FIG. 3. Overpressure Gage Layout for Motor Hazard Tests Using 1 or 2 Motors Per Test.

TPR Ul3
3age type (1) and nomi rial pressure rating (2)
Nominal R gage distance from
for each | gage line pressure region (psi)
Line Worth Line East
(ft) Gage A Gage B Gage C Gage D
6k 80 K None K None
32 110 K P-50 K None
16 150 K P-25 K None
8 210 P-10 B-15 P-10 B-15
k 3I+O B-5 B-5 P-5 B-15
2 520 B-5 B-5 B-5 B-5
1 880 B-l B-5 P-2 B-5
0.5 1,1*00 B-0.5 B-l B-0.5 B-l
0-3 2,000 B-0.5 None B-0.5 None
NOTE: (l) B = Ballistics Research Lab, PHS type gage P = Ballistics Research Lab, PNS type gage K = Kistler piezoelectric gage
(2) Ballistics Research Lab gages yield reliable data to double their nominal pressure rating.
Optical Instrumentation
Both motion-picture and still cameras (ranging in size from l6mm to Ux5-inch and operating at various frame rates) were used to record fire- ball growth and fragment travel. The tac5 cameras all used infrared film and long exposure times--from 15 to 20 seconds. The frame rates employed with the motion picture cameras ranged from 30 to 8000 frames per second. In general, photographic coverage was from two directions: one along a continuation of the test motor centerline and the other at right angles to the first.
Fragment Search Procedures
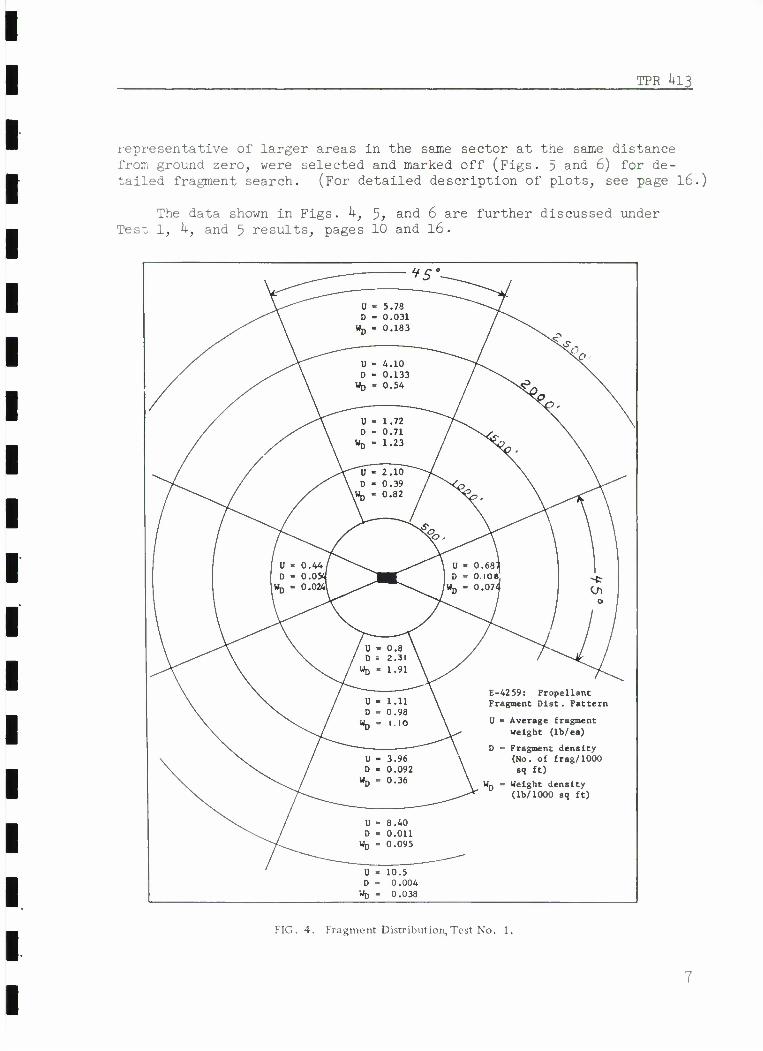
Prior to the first test, the test site was divided into search areas as shown in Fig. k, and as propellant fragments were collected, they were identified with the area in which they were found. After the first three tests, however, it became apparent that an attempt to recover all fragments from a large area was extremely time-consuming and expen- sive. Therefore, for the remaining tests, small plots, considered to be
TPRj+13
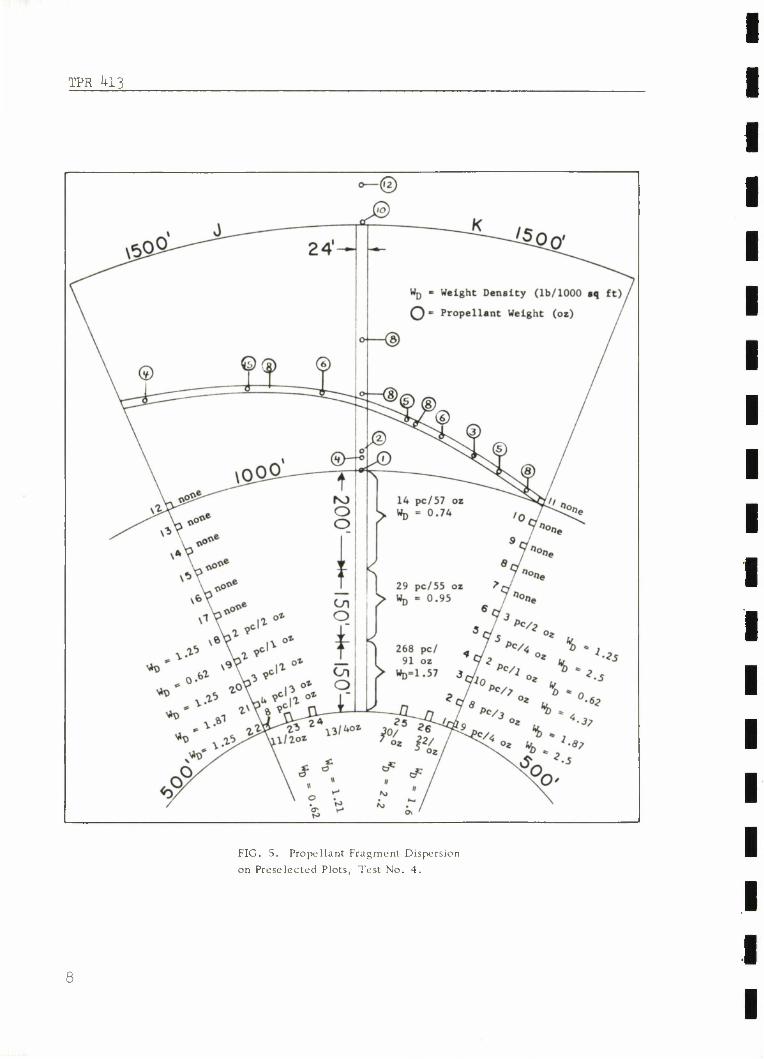
representative of larger areas in the same sector at the same distance from ground zero, were selected and marked off (Figs. 5 and 6) for de- tailed fragment search. (For detailed description of plots, see page 16.)
The data shown in Figs, h, 5> anc^ 6 are further discussed under Test 1, k, and 5 results, pages 10 and 16.
it 5°-
\
U - 5.78 D - 0.031
W,j - 0.183
U - 4.10 D - 0.133
WD - 0.54
U - 1.72 D - 0.71
WD - 1.23
\ \ V-""u~- 2.10""""- \ D - 0.39 W - 0.82
S U - 0.44/ D - 0.0W
Hp - 0.0241
\ u * D -
K - 0 0 0
.681 108. .074
J ) -*•
/ V - 0.8 \ / D = 2.31 \ / WD - 1.91
U - 1.11 D - 0.98
WD - ..10
E-4259: Propellant Fragment Dist. Pattern
U • Average fragment weight (lb/ea)
D • Fragment density (No. of frag/1000 sq ft)
WQ • Weight density (lb/1000 sq ft)
U - 3.96 D - 0.092
Wp - 0.36
U » 8.40 D - 0.011
WD - 0.095
U - 10.5 D •= 0.004
WQ •= 0.038
FIG. 4. Fragment Distribution, Test No. 1.
TPR U13
FIG. 5. Propellant Fragment Dispersion
on Preselected Plots, Test No. 4.
8

TPR 1+13
A • °.z
FIG. 6. Propellant Fragment Dispersion
on Preselected Plots, Test No. 5.
TPR 1+13
TEST RESULTS
SUMMARY
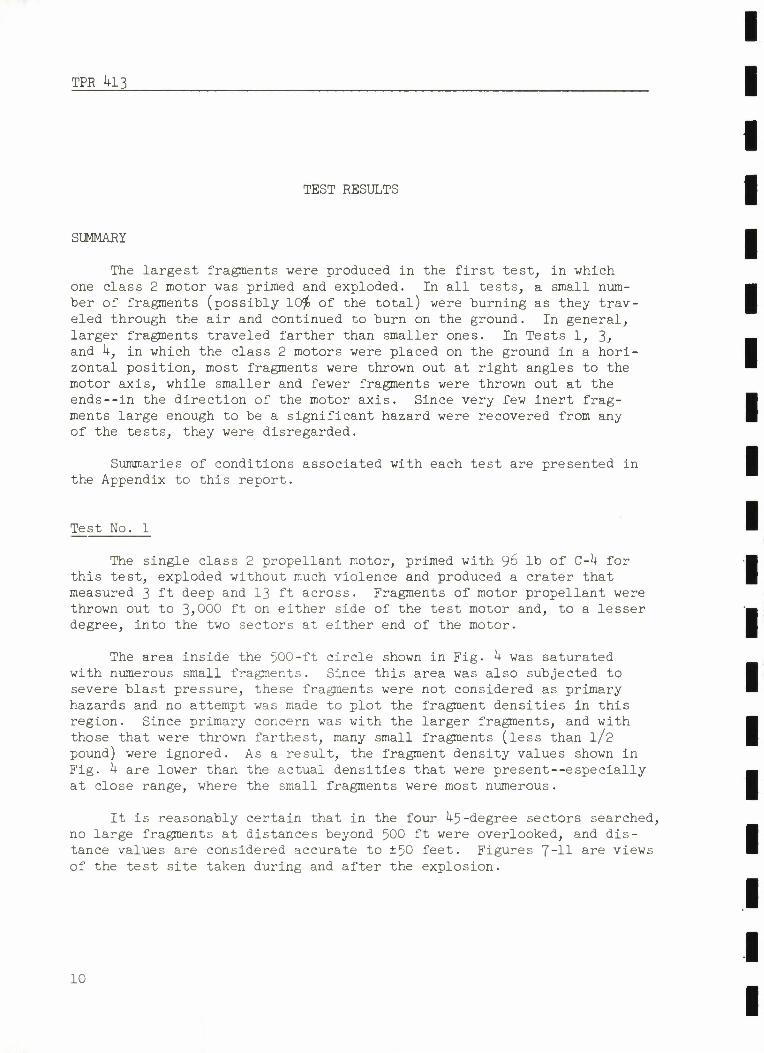
The largest fragments were produced in the first test, in which one class 2 motor was primed and exploded. In all tests, a small num- ber of fragments (possibly 10$ of the total) were burning as they trav- eled through the air and continued to burn on the ground. In general, larger fragments traveled farther than smaller ones. In Tests 1, 3, and k, in which the class 2 motors were placed on the ground in a hori- zontal position, most fragments were thrown out at right angles to the motor axis, while smaller and fewer fragments were thrown out at the ends--in the direction of the motor axis. Since very few inert frag- ments large enough to be a significant hazard were recovered from any of the tests, they were disregarded.
Summaries of conditions associated with each test are presented in the Appendix to this report.
Test No. 1
The single class 2 propellant motor, primed with 96 lb of C-h for this test, exploded without much violence and produced a crater that measured 3 ft deep and 13 ft across. Fragments of motor propellant were thrown out to 3>000 ft on either side of the test motor and, to a lesser degree, into the two sectors at either end of the motor.
The area inside the 500-ft circle shown in Fig. h was saturated with numerous small fragments. Since this area was also subjected to severe blast pressure, these fragments were not considered as primary hazards and no attempt was made to plot the fragment densities in this region. Since primary concern was with the larger fragments, and with those that were thrown farthest, many small fragments (less than l/2 pound) were ignored. As a result, the fragment density values shown in Fig. h are lower than the actual densities that were present—especially at close range, where the small fragments were most numerous.
It is reasonably certain that in the four 45-degree sectors searched, no large fragments at distances beyond 500 ft were overlooked, and dis- tance values are considered accurate to ±50 feet. Figures 7-H a*"e views of the test site taken during and after the explosion.
10

TPR k!3
o
H
o 2
o
>
il

TPR k!3
Jf^
••I •
V
<
c o u V
1/3
0 a.
o X.
o
-J
<
x c
c
I o u
— 0
~ B -J
E be rt •_
u» w
a
O "J

TPR U13
II -I IIIM» 5^SES2S=3S3SS
FIG. 9. Crater Formed by Test No. 1.
UHL 10 8 913
FIG. 10. Test Site After Test No. 1. Unburned class 2 propellant is shown at upper left; impact position is shown at left center.
L3
TPR Ul3
LHL 10891*
FIG. 11. Residue of Class 2 Propellant
After Burning on Ground, Test No. 1.
Test No. 2
The second test also involved only one motor--a class 7--'which produced a sharp explosion, with attendant high pressure readings, and carved out a crater 7 ft deep and 36 ft across. Essentially, all of the propellant contributed to the explosive effects. No propellant fragments were found, and only a few firebrands can be seen in the test pictures. Figures 12 and 13 show the test site after the explosion.
lU
TPR Ul3
FIG. 12. Crater Formed by Test No. 2.
FIG. 13. Crack in Ground Surface
Near Crater Formed by Test No. 2.
LHL 099678
15

TPR U13
Tests 3 and h
These two test setups were identical, and the results were very sim- ilar. In each test, one class 7 motor and one class 2 motor were placed side-by-side on the ground. The class 7 (donor) motor, which was primed with 96 lb of C-J+, exploded completely leaving no propellant fragments, while the class 2 (acceptor) motor produced both burning fragments and scraps of unburned propellant.
In each test, the fragments were smaller and less numerous than those observed in Test No. 1. Maximum fragment travel was only 1,650 feet. A 3~lh fragment was recovered at this distance after Test No. 3- None of the other fragments recovered after either test weighed over 3/1+ pound. Each explosion produced a crater measuring about 10 ft deep and 52 ft across. Two views of the crater produced by Test No. 3 are
shown in Figs, ik and 15.
In Test No. k, fragments were collected from small discrete plots (see Fig. 5)- Each of the square plots encompassed 100 sq ft of area, while the rectangular plots contained 200 square feet. The cleared di- agonal path was 12 ft wide, and the radial path on the centerline was 2k ft wide. In those areas where the fragments were larger and less numer- ous (beyond 1,000 ft), individual fragments were plotted. Fragment den- sities Wj) (weight of recovered propellant per 1,000 sq ft of area) are listed for each individual plot and for several sections of the cleared paths.
The number of fragments recovered and the total weight of propellant recovered are also listed for each plot and for three sections of the cleared radial path.
This fragment collection scheme was used for the two 22-r-degree sectors on one side of the test motors only. Photographs taken during the two tests indicated that this region (i.e., on the open side of the class 2 motor) received the heaviest concentration of fragments.
Test No. 5
The fifth test also involved two motors--one class 7 and one class 2, However, for this test, the motors were in a vertical position, one on top of the other. The top motor was the class 7, which was primed with 96 lb of Comp C-U. Test results were similar to those obtained in Tests 3 and U, although fewer and smaller fragments were recovered, probably because of the difference in placement of the motors.
Once again, fragments were collected only from the discrete plots shown in Fig. 6. The test configuration favored a symmetrical fragment dispersal and, as expected, the collection plots produced fewer fragments
16

TPR 413
IL 099443
FIG. 14. Side View of Crater Formed by Test No. 3.
LHL 099442
FIG. 15. Top View of Crater Formed by Test No. 3.
17

TPR kl3
than were recorded for either of the two previous tests. In general, the fragments were not thrown quite so far. The largest fragment of unburned propellant recovered was one pound, and the maximum distance traveled was 1,500 ft from ground zero.
The motor placement also accounted for the crater configuration-- which was much shallower, but had a larger diameter than those produced by Tests 3 and k. The crater was saucer-shaped with a small conical hole at the center. The deepest point at the bottom of the cone was five feet; average depth, exclusive of the cone, was two feet; and the diameter was 60 feet.
Test No. 6
Two class 2 motors, each primed with 96 lb of C-U, were placed side- by-side for this test. Unburned propellant fragments ranging up to eight pounds were found, and maximum fragment throw was 2,300 feet. The frag- ment recovered at this distance weighed 2^ pounds. Average crater diam- eter was 20 feet, rim-to-rim.
Test No. 7
This test setup was identical to that for Test No. 5 except that the primer was a 100-lb spherical charge of cyclotol placed on top of the class 7 motor. Small fragments of propellant were thrown out to 1,500 ft, or more, in all directions. The average rim-to-rim crater diameter was 60 feet.
Calibration Test A
The 10,260 lb of Comp B used in this test was primed with 80 lb of C-^ and produced two distinct Shockwaves. The explosion produced a cra- ter that measured 9 ft deep and 52 ft across.
Calibration Test B
This test, in which 10,650 lb of TNT was placed in a wooden con- tainer and primed with a 96-lb charge of C-k) produced a large fireball and blackened the ground to a distance of 150 ft outward in all direc- tions. The average crater diameter was 30 feet. Observers at 3^000 ft, and beyond, reported that the sound of the explosion was less 'sharp' than that produced by the Comp B calibration firing and the motor fir- ings involving class 7 motors.
18
TPR *H3
ANALYSIS OF BLAST GAGE DATA
The analytical approaches used to compute high explosive equivalency weight for the motor tests are described belowj tabulations of blast gage data and derived blast parameters are presented in Tables 1-9-
COMPARISON WITH PUBLISHED DATA
BRL Memorandum Report No. 15l8, Peak Overpressure Versus Scaled Dis- tances for TNT Surface Bursts (April 196U), shows graphical and tabulated data covering results of overpressure measurement in connection with the surface firing of 20- and 100-ton hemispherical TNT charges. Using data from Report 1518 as a reference, yields for the seven motor tests were derived from peak pressure based on the following:
Pz R 3
W = Wo — U—) (see footnote) p XA ' o 1
where
W = yield in lb of TNT
Wo = 1 lb of TNT
p = ambient air pressure
p = standard sea level air pressure 1013 mb
R = distance from center of charge to gage
A = scaled distance determined by the ratio:
recorded overpressure / , , , . . _ -,,--, o\ — £ (as tabululated in Report 151°) ambient pressure
In application, values of R/Aj were computed for each gage distance for each test, using averaged values of overpressures from all gages at that distance. Values of R/A are directly related to W1'3 and should, therefore, be of similar magnitude at each gage distance, if the func- tion of overpressure-versus-scaled distance parallels that derived by
In making the computations, the ratio (ambient air pressure/stan- dard sea level air pressure) was used in lieu of the more precise ratio pz/pQ (ambient air density/air density at 1013 mb and 59 °F) in order to conform to correction practices employed in BRL Report No. 1518.
19

TPR U13
BRL. Values of R/Ax were averaged for all gage distances and again for all distances exclusive of those at 80, 110, and 150 feet. The latter average was determined because of the evident tendency of close-in gage recordings from the high explosive calibration firings and motor Tests 3, 5, and 7 to register markedly higher than BRL data.
OVERPRESSURE COMPARISON WITH HIGH EXPLOSIVE CALIBRATION FIRINGS
In a second approach to computing high explosive equivalency from peak overpressure data, curves of peak overpressure versus scaled dis- tance were prepared from the gage results of each of the calibration firings (Fig. 16). These curves were then used with the motor test over- pressure data to determine the TNT and Comp B equivalencies. Thus, the average peak overpressure for each gage distance was used to determine the corresponding scaled distance A2 value, and this value was used to derive R/A2 values (see Tables 1-7)• The R/A2 /values were then averaged, and this value--which determines an average W1' 3--was cubed to arrive at the Comp B and TNT equivalencies (Tables 10 and 11). Because the atmo- spheric changes from test-to-test were small, no attempt was made to introduce an atmospheric correction.
1000
BOO
s 100
? 80
40
.5 0 --a N0TS Calibration lest A
N0TS Calibrotion ttst "B"
-- Data from BRL mtmo rtport No. 1516 TNT values at S«0 level
_1 I I I I •—-L 60 80 100
FIG. 16. Overpressure Versus Scaled Distance Calibration Curves.
20

TFR Ul3
Comparison of motor test data with the derived calibration curves presented difficulties similar to some of those experienced in comparing the data with the BRL curve, in that the calibration curves do not appear to parallel the function of overpressure-versus-scaled-distance for some tests (notably Tests 1, 2, and k) as demonstrated by lower-than-average R/A values at close-in gage stations for the motor tests. Additionally, there is some concern over the tendency for the blast records from the Calibration A firing to show double and well-separated peaks, particu- larly at intermediate and long ranges.
While it is not considered that the atypical separated peaks tend to diminish the peak pressure values below normal values (as discussed later in this report), it would be somewhat easier to place confidence in overpressure-time histories of more classical shape.
The Calibration B results agree reasonably well with data in BRL Report No. 1518 at intermediate and longer ranges, but the readings run higher than the BRL data at two close-in gage positions.
Although Calibration B data and the above described BRL data were alike in being derived from TNT explosions, there were differences in the following test parameters:
a. The charge shapes and means of priming b. The physical condition and density of the TNT c. Gage arrays, and some differences in gage types d. Data reduction techniques e. Terrain f. Number of tests and variety of explosive weights involved
IMPULSE CCMPARISON WITH HIGH EXPLOSIVE CALIBRATION FIRINGS
Scaled-impulse-versus-scaled-distance values were plotted for the two high explosive calibration firings (Fig. 17)• Since these curves cannot be entered directly without first knowing the desired value W, a family of curves (Figs. 18 and 19) were derived relating impulse with W2/3 for each gage distance. (The relationship of impulse versus W2'3
approximates linearity for a specific gage distance.) The impulse versus W2/3 curves were then entered with averaged impulse values for each gage distance. The extracted W2/3 values were then averaged for all distances, and this average W2/3 was converted to W--or high explosive equivalency.
21

TPR U13
Seal
psi- 40
30
20
t impulse
ms/lb"3
- \ \\ -
\\ \\
-
- \
-
NX -
Q -a NOTS Calibration lest "A" ^
NOTS Calibration test "B"
Oota from Surface Bursts
Y
from BRL letter No. 31258. ^v x
' ' 1 1 1 1 l l l l 1 ii l i i i Kvi ' 3 4 6 8 10 20 30 40 60
Scale Distance ( ft/ lb l/s )
80 100
FIG. 17. Scaled Impulse Versus Scaled Distance.
FIG. 18. Impulse Versus W20 for R Values of 210, 340, 520, 880, 1,400, and 2,000 Feet (Calibration Tests A and B).
22

TPR 413
II _|4 II
TABLE 1. Test #1 (ES-4259)
JJ R
gage distance
(ft) Gage
position
Gage type
Peak overpres.
N leg (psi)
Peak overpres.
E leg (psi)
Avg. peak
overpres. (psi)
If Tive^res. amb. atmos. • •
Scaled distance BRL 1518
R/x,
X2
Scaled distance overpres. calib.
A
R/X2
Impulse N leg
(psi-ms)
Impulse E leg
(psi-ms)
Avg. impulse (psi-ms)
V2'3
from impulse calib.
A
N leg
E leg
80 1A K(D K 23.61 28.23 25.92 1 1
1.898 5.99 13.3 6.9 11.6 168.86 174.50 171.68 175
110 2A 2B
P(2)
K K **
18.01 11.20
11.03 **
13.41 1 As2 8.17 13.4 8.5 12.9 93.42 105.86
123.79 **
107.69 165
150 3A 3B
P K
K **
8.63 4.47
5.71 **
6.27 • A59 12.14 12.3 12.4 12.1 67.38 79.02
79.37 **
75.25 150
210 4A 4B
P B<3)
P B
* 3.26
5.98 4.18
4.47 • W327 14.77 14.2 15.3 14.7 * 46.37
74.10 53.96
58.14 145
340 5A 5B
B B
P B
2.63 1.81
* 2.72
2.39 0^175 22.17 15.3 24.7 13.7 24.13 28.56
* 30.55
27.75 95
520 6A 6B
B B
B B
1.13 1.16
1.02 *
1.10 0.081
II 0.042
• |
39.65 13.1 50.0 10.4 20.37 19.68
26.92 *
22.32 110
880 7A 7B
B **
P B
0.58 **
0.63 0.54
0.58 66.25 13.2 76.0 11.6 11.44 **
14.68 14.77
13.63 115
1400
2000
8A 8B
9A
B B
B
B B
B
0.32 0.24
0.14
0.32 0.28
0.17
0.29
0.16
B •021
1 loi2
106.6
158.33
13.1
12.6
115.0 12.2 6.54 7.16
3.94
7.47 8.29
5.18
7.37
4.56
100
95
Note (1 (2 (3
) K = Kis ) P = BRL ) B = BRL
tier Gage -PNS Type G -PHS Type G
age age
Average for a] •gle distances 13.39 12.4 128
Average excluc of 80', 11C
mg riistanci -1 Md 150'
iS
13.58 12.5 110
** No g * Gage
age. failure.
• 1
II II
2k II II
TPR U13
,2/3 ,1,,2'J,
FIG. 19. Impulse Versus W2P for R Values of 80, 110, and 150 Feet (Calibration Tests A and B).
LIMITATIONS OF REFERENCE DATA
It should be noted that this is a progress report outlining initial results in a continuing series of tests. There are acknowledged limita- tions in the use of the BRL data as a standard for comparison, primarily because of differences in charge geometry. There are also acknowledged limitations in the use of the Calibration A and B firing data, for the obvious reason that each set of data is derived from a single test. It is probable that additional high explosive calibration firings will be conducted in the future, thus providing a firmer basis for comparison.
EXPLANATION OF TABLES 1 THROUGH 9
The purpose of the tables is to list blast gage records and to show the methods of computation used. Derived values of ~h and R/AJ are explained above. Derived values of A2, R/A2, and W2/3 are based on Calibration A results; therefore, these values relate to Comp B. Identical procedures were used in relating the tests to Calibration B TNT test results; however, these computations are not shown.
23
TPR 413
TABLE 2. Test #2 (ES-4260)
R gage
distance (ft)
Gage position
Gage type
Peak overpres. N leg (psi)
Peak overpres.
E leg (psi)
Avg. peak
overpres. (psi)
Avg. peak
overpres. amb. atmos.
x, Scaled
distance BRL 1518
R/X,
x2 Scaled
distance overpres. calib.
A
R/X2
Impulse N leg (psi-ms)
Impulse E leg (psi-ms)
Avg. impulse (psi-ms)
w2'3
from impulse calib.
A
N leg
E leg
80
110
150
210
340
520
880
1400
2000
1A
2A 2B
3A 3B
4A 4B
5A 5B
6A 6B
7A 7B
8A 8B
9A
Ku)
K
P K
P BO)
B B
B B
B **
B B
B
K
K **
K **
P B
P B
B B
P B
B B
B
99.12
86.09 44.48
21.88 15.13
6.52 6.99
6.15 4.92
2.26 2.37
1.29 **
0.75 0.64
0.46
127.53
51.06 **
18.67 **
9.42 11.60
4.85 5.36
2.36 2.37
1.62 1.05
0.70 0.55
0.32
113.32
60.54
18.56
8.63
5.32
2.34
1.32
0.66
0.39
8.301
4.435
1.359
0.632
0.389
0.171
0.096
0.048
0.028
3.13
4.13
6.98
10.20
13.45
22.50
34.70
59.16
88.00
25.5
26.6
21.4
20.6
25.3
23.1
25.4
23.7
22.7
4.05
5.1
7.7
10.5
13.6
25.2
43.0
71.0
98.0
19.7
21.6
19.5
20.0
25.0
20.6
20.5
19.8
20.7
*
425.61 *
271.74 *
173.03 167.93
128.77 116.09
59.59 62.51
37.89 **
32.28 32.82
20.69
*
* **
* **
165.62 158.91
129.84 114.75
85.65 75.37
46.86 45.79
27.11 26.20
18.27
*
425.61
271.74
166.37
122.36
70.78
43.51
29.60
19.48
*
533
560
465
530
398
365
404
395
Note (1) K = Kistler Gage m P = RRT.-PNS Tvne Gae«»
Average for all gage distances 23.81 20.8 456
(3 ) B = BRL- PHS Ty pe Ga ge Average excluding distances of 80', 110' and 150' 23.46 21.1 426
* Gage failure. ** No gage.
25
TPR kl$
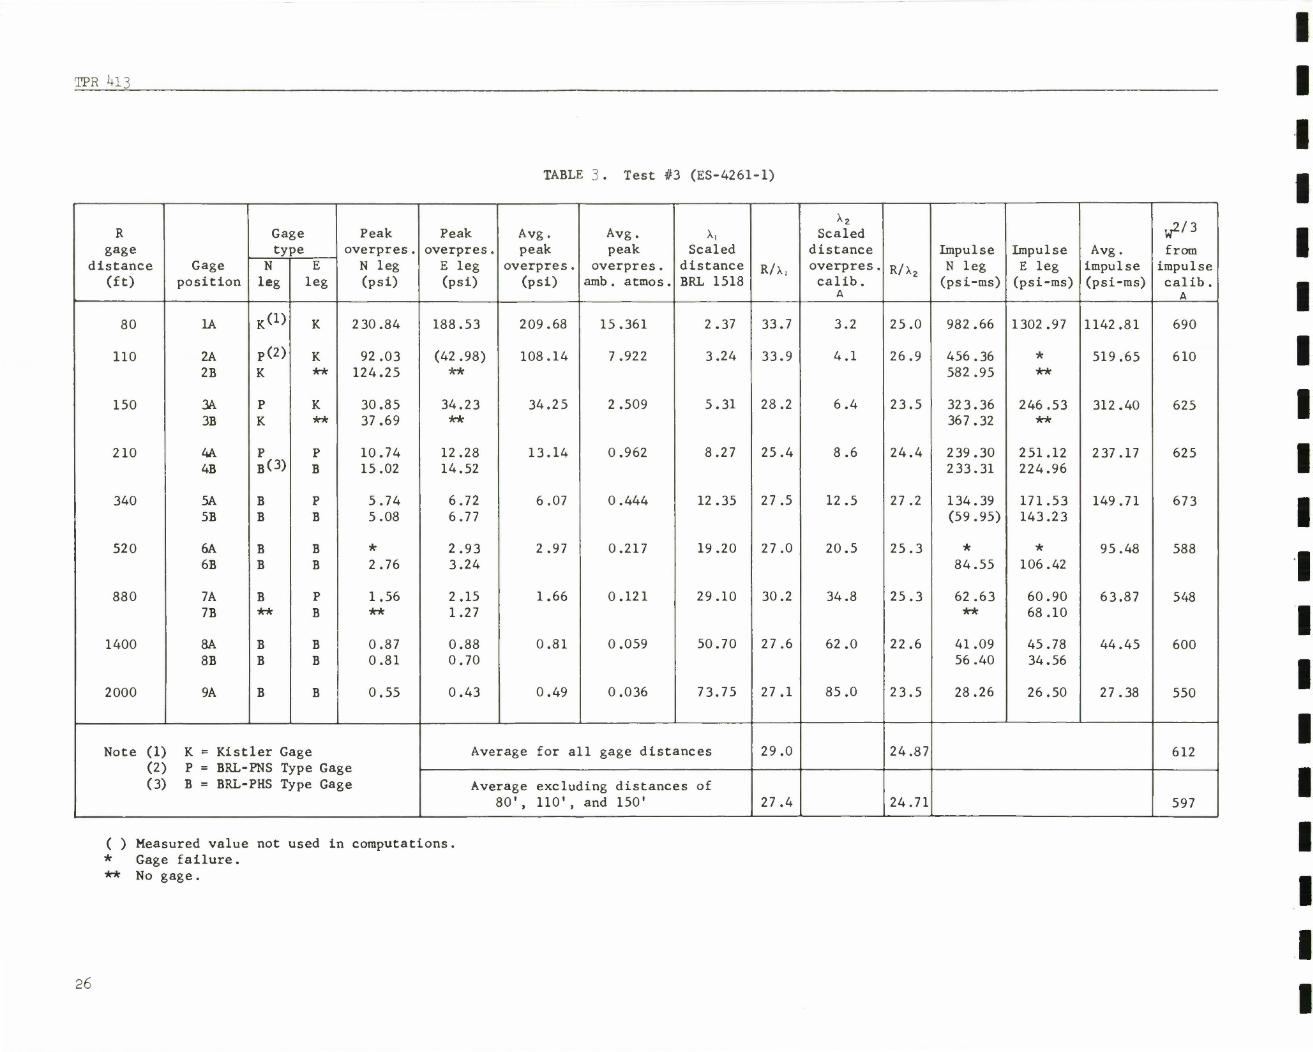
TABLE 3. Test #3 (ES-4261-1)
R gage
distance (ft)
Gage position
Gage type
Peak overpres. N leg (psi)
Peak overpres.
E leg (psi)
Avg. peak
overpres. (psi)
Avg. peak
overpres. amb. atmos.
x, Scaled
distance BRL 1518
R/x,
X2 Scaled
distance overpres. calib.
A
R/X2
Impulse N leg (psi-ms)
Impulse E leg (psi-ms)
Avg. impulse (psi-ms)
1
W2'3
from impulse calib.
A
N E leg
80 1A K(D K 230.84 188.53 209.68 15.361 2.37 33.7 3.2 25.0 982.66 1302.97 1142.81 690
110 2A 2B
P(2) K
K **
92.03 124.25
(42.98) **
108.14 7.922 3.24 33.9 4.1 26.9 456.36 582.95
*
** 519.65 610
150 3A 3B
P K
K **
30.85 37.69
34.23 **
34.25 2.509 5.31 28.2 6.4 23.5 323.36 367.32
246.53 **
312.40 625
210 4A 4B
P B(3)
P B
10.74 15.02
12.28 14.52
13.14 0.962 8.27 25.4 8.6 24.4 239.30 233.31
251.12 224.96
237.17 625
340 5A 5B
B B
P B
5.74 5.08
6.72 6.77
6.07 0.444 12.35 27.5 12.5 27.2 134.39 (59.95)
171.53 143.23
149.71 673
520 6A 6B
B B
B B
*
2.76 2.93 3.24
2.97 0.217 19.20 27.0 20.5 25.3 *
84.55 *
106.42 95.48 588
880 7A 7B
B **
P B
1.56 **
2.15 1.27
1.66 0.121 29.10 30.2 34.8 25.3 62.63 **
60.90 68.10
63.87 548
1400 8A 8B
B B
B B
0.87 0.81
0.88 0.70
0.81 0.059 50.70 27.6 62.0 22.6 41.09 56.40
45.78 34.56
44.45 600
2000 9A B B 0.55 0.43 0.49 0.036 73.75 27.1 85.0 23.5 28.26 26.50 27.38 550
Note (1] (2] (3]
K = Kist P = BRL- B = BRL-
ler Gage PNR Tvno Ca ge
ge
Avei rage for a] LI gage dist. ances 29.0 24.87 612
PHS T ype Ga Ave-
1 rage excluc JO', 110',
ling distanc and 150'
BS Of
27.4 24.71 597
( ) Measured value not used in computations * Gage failure. ** No gage.
26
TPR 413
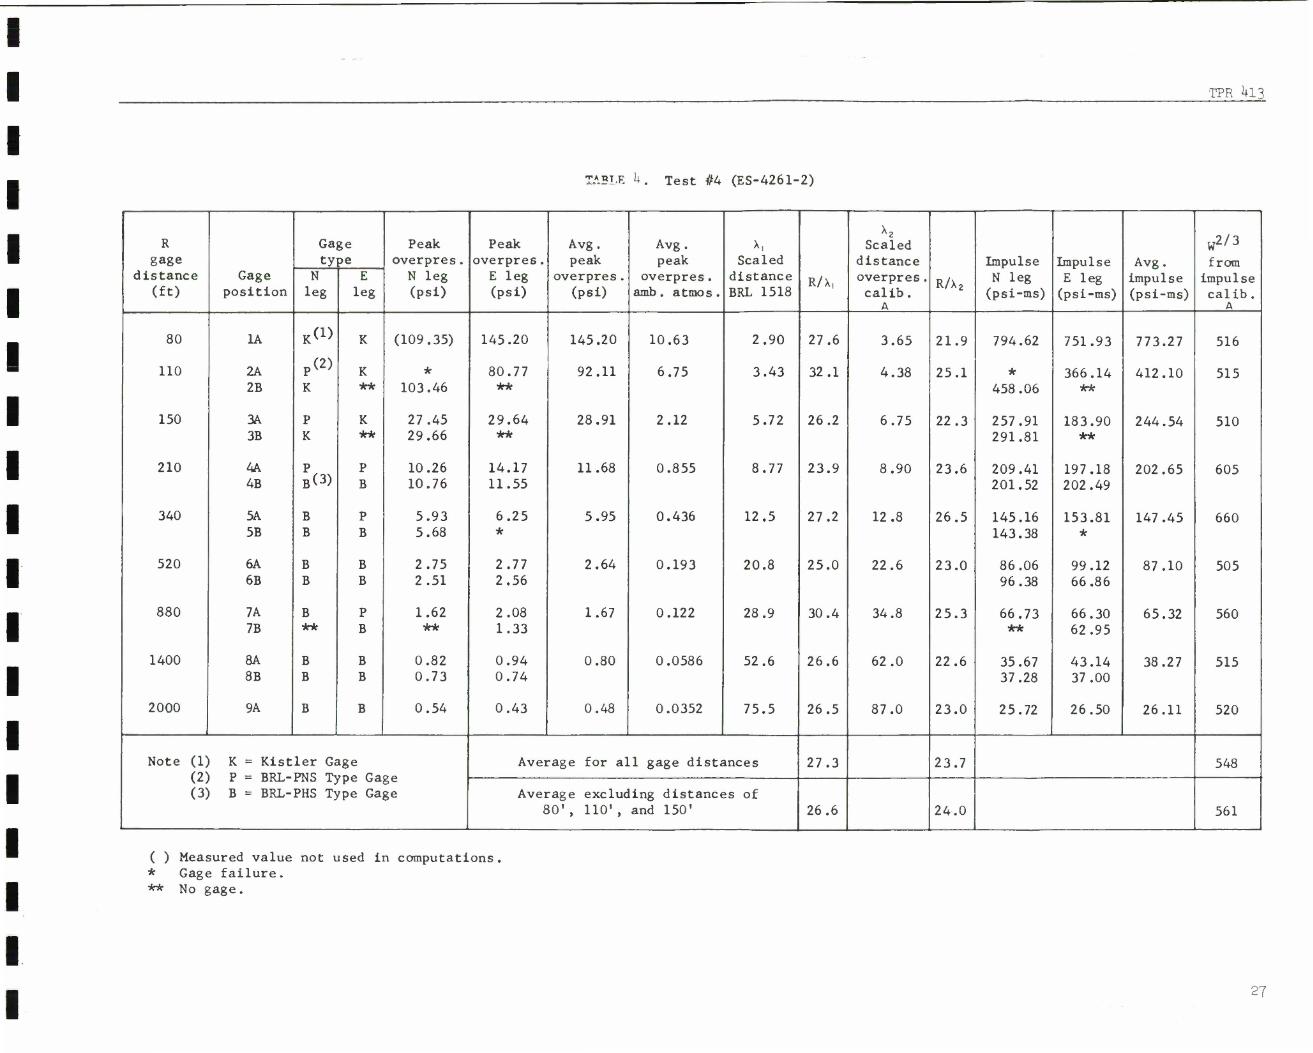
TABLE k. Test #4 (ES-4261-2)
R gage
distance (ft)
Gage position
Ga
ty ge >e
Peak overpres. N leg (psl)
Peak overpres.
E leg (psl)
Avg. peak
overpres. (psi)
Avg. peak
overpres. arab . atmos.
Scaled distance BRL 1518
R/X,
x2 Scaled
distance overpres. calib.
A
R/X 2
Impulse N leg (psi-ms)
Impulse E leg (psi-ms)
Avg. impulse (psi-ms)
w2/3
from impulse calib.
A
N leg
E leg
80 1A Kd) K (109.35) 145.20 145.20 10.63 2.90 27.6 3.65 21.9 794.62 751.93 773.27 516
110 2A 2B
p(2)
K K **
*
103.46 80.77 **
92.11 6.75 3.43 32.1 4.38 25.1 *
458.06 366.14 **
412.10 515
150 3A 3B
P K
K **
27.45 29.66
29.64 **
28.91 2.12 5.72 26.2 6.75 22.3 257.91 291.81
183.90 **
244.54 510
210 4A 4B
P B(3)
P B
10.26 10.76
14.17 11.55
11.68 0.855 8.77 23.9 8.90 23.6 209.41 201.52
197.18 202.49
202.65 605
340 5A 5B
B B
P B
5.93 5.68
6.25 5.95 0.436 12.5 27.2 12.8 26.5 145.16 143.38
153.81 *
147.45 660
520 6A 6B
B B
B B
2.75 2.51
2.77 2.56
2.64 0.193 20.8 25.0 22.6 23.0 86.06 96.38
99.12 66.86
87.10 505
880 7A 7B
B **
P B
1.62 **
2.08 1.33
1.67 0.122 28.9 30.4 34.8 25.3 66.73 **
66.30 62.95
65.32 560
1400 8A 8B
B B
B B
0.82 0.73
0.94 0.74
0.80 0.0586 52.6 26.6 62.0 22.6 35.67 37.28
43.14 37.00
38.27 515
2000 9A B B 0.54 0.43 0.48 0.0352 75.5 26.5 87.0 23.0 25.72 26.50 26.11 520
Note (1] (2] (33
K = Kist P = BRL- B = BRL-
ler Gage ge Be
Average for &] 1 gage distJ inces 27.3 23.7 548
PHS T) rpe Ga Average excluc 80', 110',
Ing distance and 150'
:s of 26.6 24.0 561
( ) Measured value not used in computations. * Gage failure. ** No gage.
27

TPR 413
TABLE 5. Test #5 (ES-5001)
R gage
distance (ft)
Gage position
Gage type
Peak overpres. N leg (psi)
Peak overpres.
E leg (psi)
Avg. peak
overpres. (psi)
Avg. peak
overpres. amb. atmos.
x, Scaled
distance BRL 1518
R/X,
X2 Scaled
distance overpres. calib.
A
R/X2
Impulse N leg (psi-ms)
Impulse E leg (psi-ms)
Avg. impulse (psi-ms)
W2/3
from impulse calib.
A
N leg
E leg
80 1A K(D K * 252 .40 252.40 18.490 2.17 36.8 2.97 26.9 * 738.94 738.94 492
110 2A 2B
P(2)
K K **
76.60 *
150.92 **
113.76 8.334 3.12 35.3 4.05 27.2 393.11 *
556.80 **
474.95 575
150 3A 3B
P K
K **
31.39 *
55.01 **
43.20 3.164 4.79 31.3 5.80 25.9 420.00 *
244.00 **
332.00 660
210 4A 4B
P BO)
P B
* *
*
13.22 13.22 0.968 8.24 25.5 8.60 24.5
* *
*
219.74 219.74 662
340 5A 5B
B B
P B
6.19 5.25
6.07 6.13
5.91 0.432 12.51 27.2 12.8 26.6 158.65 141.59
151.82 137.61
147.4 660
520 6A 6B
B B
B B
* *
(0.71) 2.79
2.79 0.204 19.92 26.1 21.6 24.0 * *
(19.13) 95.70
95.7 564
880 7A 7B
B **
P B
1.57 **
1.61 1.22
1.46 0.106 32.07 27.4 39.0 22.6 60.80 **
**
54.69 57.7 490
1400 8A 8B
B B
B B
0.86 0.71
0.84 0.66
0.76 0.055 53.55 26.1 65.0 21.6 40.80 37.76
29.57 32.35
35.1 475
2000 9A B B * 0.39 0.39 0.028 88.00 22.7 98.0 20.7 * 28.83 28.8 570
Note (1 (2 (3
) K = Kist ) P - BRL- ) B = BRL-
ler Gage PNS Tvne Gae e
e
Average for a'. .1 gage distances 28.71 24.44 572
PHS Ty pe Gag Average excluc 80', 110',
ling distanc and 150'
es of 25.83 23.33 570
( ) Measured value not used in computations, * Gage failure. ** No gage.
28
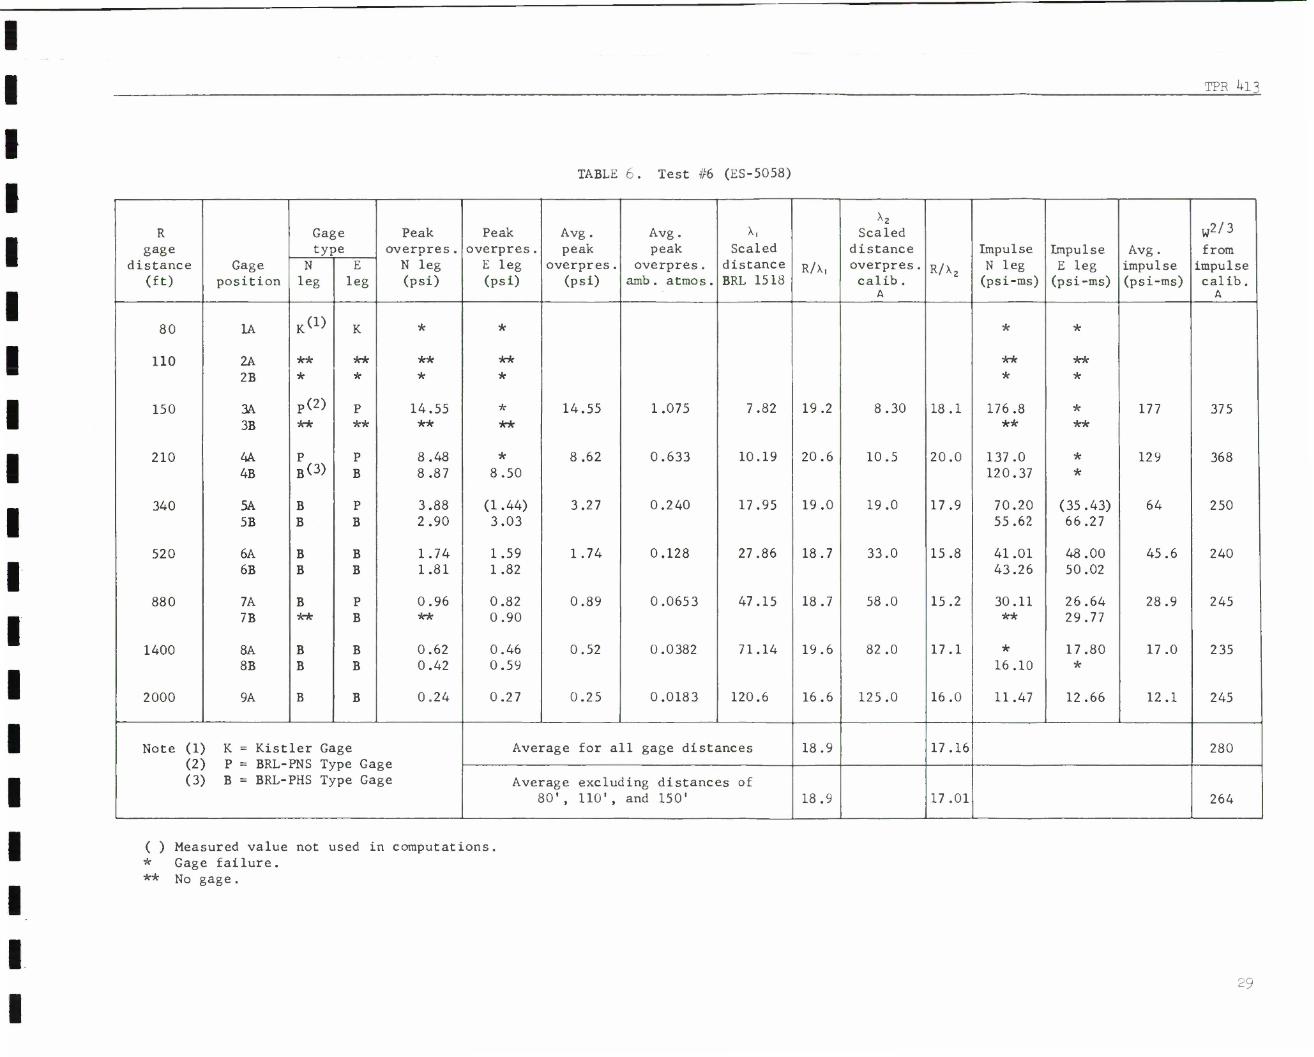
TABLE 6. Test #6 (ES-5058)
TPR Ul3
R gage
distance (ft)
Gage position
Gage type
Peak overpres. N leg (psi)
Peak overpres.
E leg (psi)
Avg. peak
overpres. (psi)
Avg. peak
overpres. amb . atmos.
x, Scaled
distance BRL 1518
R/x,
x2 Scaled
distance overpres. calib.
A
R/X2
Impulse N leg (psi-ms)
Impulse E leg (psi-ms)
Avg. impulse (psi-ms)
w2/3
from impulse calib.
A
N leg
E leg
80 1A K(D K * * * *
110 2A 2B
** *
** *
** *
** *
** *
** *
150 3A 3B
P(2) **
P **
14.55 **
* **
14.55 1.075 7.82 19.2 8.30 18.1 176.8 **
* **
177 375
210 4A 4B
P B<3)
P B
8.48 8.87
* 8.50
8.62 0.633 10.19 20.6 10.5 20.0 137.0 120.37
* *
129 368
340 5A 5B
B B
P B
3.88 2.90
(1-44) 3.03
3.27 0.240 17.95 19.0 19.0 17.9 70.20 55.62
(35.43) 66.27
64 250
520 6A 6B
B B
B B
1.74 1.81
1.59 1.82
1.74 0.128 27.86 18.7 33.0 15.8 41.01 43.26
43.00 50.02
45.6 240
880 7A 7B
B **
P B
0.96 **
0.82 0.90
0.89 0.0653 47.15 18.7 58.0 15.2 30.11 **
26.64 29.77
28.9 245
1400 8A 8B
B B
B B
0.62 0.42
0.46 0.59
0.52 0.0382 71.14 19.6 82.0 17.1 * 16.10
17.80 *
17.0 235
2000 9A B B 0.24 0.27 0.25 0.0183 120.6 16.6 125.0 16.0 11.47 12.66 12.1 245
Note (i; (2]
) K = Kist > P = BRL- 1 B = BRL-
ler Gage PMQ T\rr\a P.a ge
ge
Average for all gage distances 18.9 17.16 280
PHS T> rpe Ga Average excluc 80', 110',
iing distance and 150'
is of 18.9 17.01 264
( ) Measured value not used in computations. * Gage failure. ** No gage.
^9

TPR Ul3
TABLE 7. Test #7 (ES-5065)
R gage
distance (ft)
Gage position
Gage type
Peak overpres.
N leg (psi)
Peak overpres.
E leg (psi)
Avg. peak
overpres. (psi)
Avg. peak
overpres. amb. atmos.
x, Scaled
distance BRL 1518
R/X,
X2
Scaled distance overpres. calib.
A
R/X2
Impulse N leg
(psi-ms)
Impulse E leg
(psi-ms)
Avg. impulse (psi-ms)
w2/3
from impulse calib.
A
N leg
E leg
80 1A K(1> K (*176 .04) 281.77 281.77 20.8 2.05 39.0 2.85 28.0 (*432.61) 840.33 840 552
110 2A 2B
** K
** K
** 187.56
** 95.37 141.46
10.4 2.83 38.9 3.70 29.7 ** 470.98
** 438.02
454 555
150 3A 3B
P(2) **
P **
31.23 **
* **
31.32 2.31 5.49 27.3 6.60 22.7 386.4 **
* **
386 740
210 4A 4B
P B<3)
P B
11.61 13.66
* 12.08
12.45 0.919 8.47 24.8 8.75 23.7 210.1 207.13
* *
209 570
340 5A 5B
B B
P B
5.88 4.66
5.97 6.21
5.68 0.419 12.80 26.6 13.2 25.8 144.82 119.79
(7.8) 135.83
133 583
520 6A 6B
B B
B B
2.78 *
2.62 2.68
2.69 0.198 20.39 25.5 22.3 23.3 90.70 *
92.00 92.12
91.6 535
880 7A 7B
B **
P B
1.59 **
1.35 1.28
1.41 0.104 32.66 26.9 40.0 22.0 64.77 **
61.94 50.71
58.8 500
1400 8A 8B
B B
** B
0.87 0.71
** 0.71
0.76 0.0561 53.07 26.4 65.0 21.6 37.49 33.37
** 31.15
34.0 460
2000 9A B 0.46 0.42 0.44 0.0325 79.84 25.1 91.0 22.0 22.65 22.76 22.70 455
Note (1 (2 (3
) K = Kis ) P = BRL ) B = BRL
tier Gage -PNR Tvne Ci ige
ige
Avei rage for all gage distances 29.0 24.3 561
-PHS 1 ?ype Gi Ave i rage excluc JO", 110',
ling distanc and 150'
es of 25.9 23.1 517
( ) Measured value not used in computations * Gage failure. ** No gage.
30

TPR U13
TABLE 8. Calibration Test "A" (ES-4262)
R gage
distance (ft)
Gage position
Gage type
Peak overpres.
N leg (psi)
Peak overpres.
E leg (psi)
Avg. peak
overpres. (psi)
Avg. peak
overpres. amb. atmos.
X, Scaled
distance BRL 1518
R/X,
Impulse N leg
(psi-ms)
Impulse E leg
(psi-ms)
Avg. impulse (psi-ms)
N leg
E leg
80 1A K(1) K 131.73 158.36 145.04 10.63 2.95 27.1 773.16 635.10 704.13
110 2A 2B
P(2)
K K **
61.02 (32.43)
64.21 **
62.61 4.59 4.06 27.1 326.16 287.70
427.73 **
347.19
150 3A 3B
P K
K **
38.52 25.30
34.57 **
32.79 2.40 5.32 28.2 343.83 187.05
158.17 **
229.68
210 4A 4B
P B<3)
P B
9.30 10.95
9.94 *
10.06 0.73 9.50 22.1 132.10 125.41
195.82 *
151.11
340 5A 5B
B B
P B
4.91 3.78
4.36 4.09
4.28 0.313 15.1 22.5 94.18 83.53
155.66 127.19
115.14
520 6A 6B
B B
B B
2.30 2.11
2.69 2.92
2.50 0.183 21.6 24.1 77.16 54.84
93.09 91.95
79.26
880 7A 7B
B **
P B
1.12 **
1.69 1.47
1.42 0.104 32.6 26.9 (17.47) **
63.98 55.17
59.57
1400 8A 8B
B B
B B
0.69 0.57
1.05 0.81
0.78 0.057 52.5 26.6 37.71 35.88
30.21 34.42
34.55
2000 9A B B 0.43 0.45 0.44 0.032 81.0 24.7 25.12 23.60 24.36
Note (1 (2 (3
) K = Kist ) P = BRL- ) B = BRL-
ler Gag PNS Tyi PHS Ty[
>e Gage >e Gage
Average for all gage distances 25.47
Average excluding distances of 80', 110', and 150' 24.48
( ) Measured value not used in computations. ** No gage. * Gage failure.
31
TPR *H3
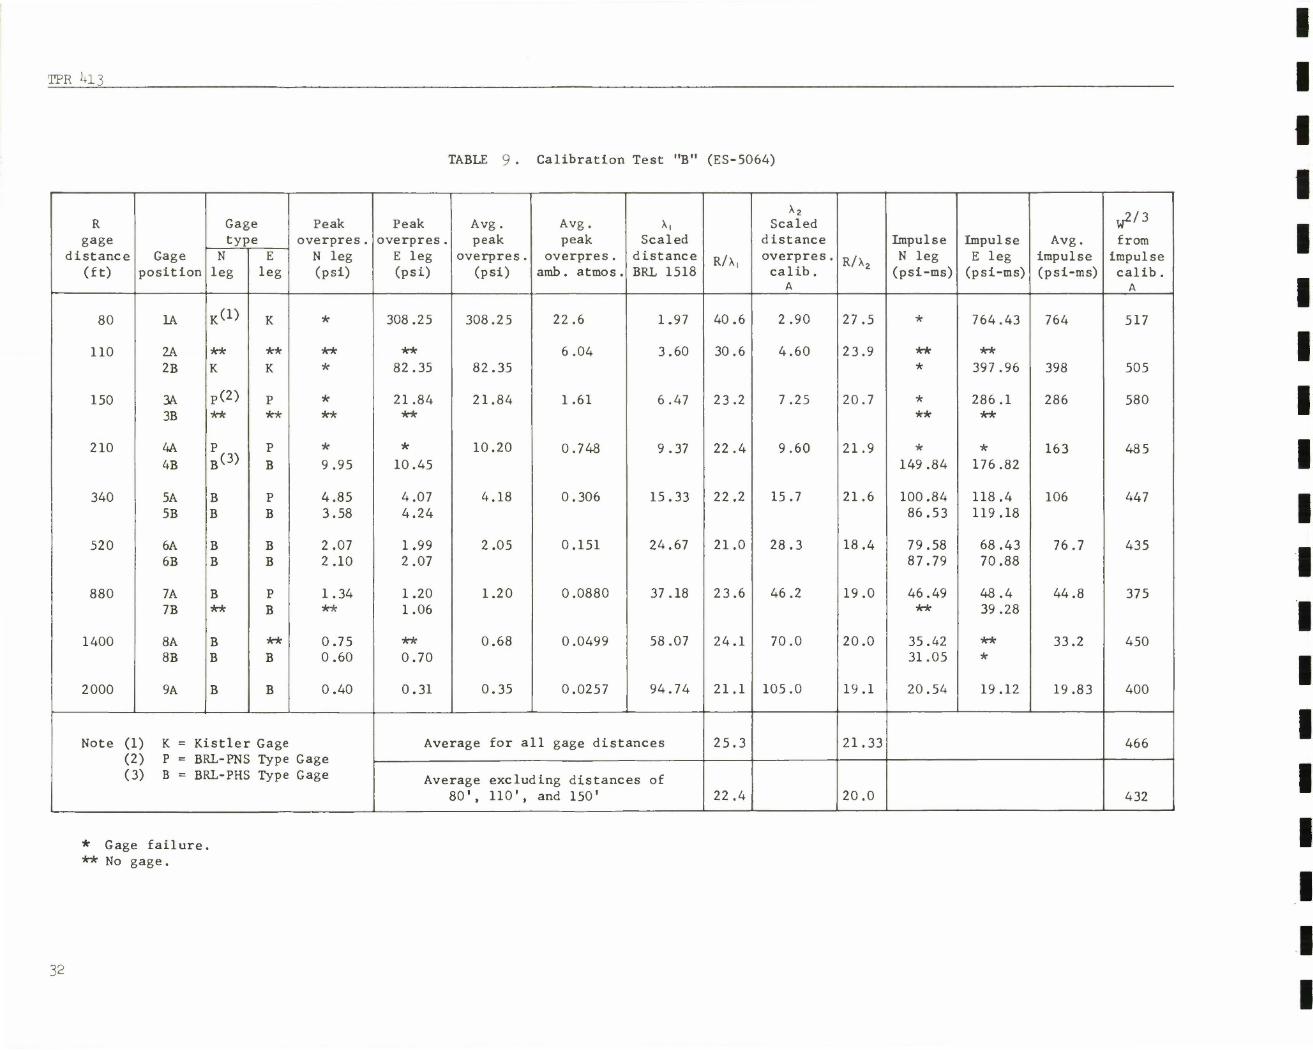
TABLE 9. Calibration Test "B" (ES-5064)
R gage
distance (ft)
Gage position
Gage type
Peak overpres. N leg (psi)
Peak overpres.
E leg (psi)
Avg. peak
overpres. (psi)
Avg. peak
overpres. amb . atmos.
X, Scaled
distance BRL 1518
R/X,
X2 Scaled
distance overpres. calib.
A
R/X2
Impulse N leg (psi-ms)
Impulse E leg (psi-ms)
Avg. impulse (psi-ms)
W2'3
from impulse calib.
A
N leg
E leg
80 1A K(D K * 308.25 308.25 22.6 1.97 40.6 2.90 27.5 * 764.43 764 517
110 2A 2B
**
K **
K ** *
**
82.35 82.35 6.04 3.60 30.6 4.60 23.9 **
* **
397.96 398 505
150 3A 3B
P(2) **
P **
* **
21.84 **
21.84 1.61 6.47 23.2 7.25 20.7 * **
286.1 **
286 580
210 4A 4B B<3)
P B
*
9.95
*
10.45 10.20 0.748 9.37 22.4 9.60 21.9 *
149.84 *
176.82 163 485
340 5A 5B
B B
P B
4.85 3.58
4.07 4.24
4.18 0.306 15.33 22.2 15.7 21.6 100.84 86.53
118.4 119.18
106 447
520 6A 6B
B B
B B
2.07 2.10
1.99 2.07
2.05 0.151 24.67 21.0 28.3 18.4 79.58 87.79
68.43 70.88
76.7 435
880 7A 7B
B **
P B
1.34 **
1.20 1.06
1.20 0.0880 37.18 23.6 46.2 19.0 46.49 **
48.4 39.28
44.8 375
1400 8A 8B
B B
**
B 0.75 0.60
**
0.70 0.68 0.0499 58.07 24.1 70.0 20.0 35.42
31.05 ** *
33.2 450
2000 9A B B 0.40 0.31 0.35 0.0257 94.74 21.1 105.0 19.1 20.54 19.12 19.83 400
Note (1) K = K; (0\ P - P.1
Lstler Gage JT -PMQ Tirno Gage
Gage
Ave rage for a LI gage dist ances 25.3 21.33 466
c 5) B = BI IL-PHE Type Ave 1 rage exclu< JO', 110',
iing distanc and 150'
es of 22.4 20.0 432
* Gage failure. ** No gage.
32

TPR k!3
ANALYSIS OF BLAST YIELD COMPARISONS
COMPARISON WITH TNT
In Table 10, which summarizes TNT equivalent yields for the tests conducted, six different yield values are identified for each motor test, representing three different approaches to yield determination. It is not considered that all columns of values are equally valid; e.g., the Wrpi column is believed to exaggerate the yield for some tests. However, the multiple listing of values does serve to illustrate the variation that can result with different choices of gage distance ranges and cali- bration standards, and when different blast characteristics, such as im- pulse versus overpressure, are used in yield determination.
The multiplicity of values also illustrates the difficulty of making an arbitrary choice of a single value of TNT equivalency for any of the tests. Some comments on the differences are presented below:
1. The differences between Wpo and Wrp^ and those between Wipe and Wijig simply suggest that the blast decay patterns of the propellants tested do not parallel those of TNT as tested in the Calibration B fir- ing.
2. The differences between Wpp and Wip2 also suggest nonparallel de- cay patterns; however, they also include differences ir. charge geometry and differences in test techniques, including gage recording and inter- pretation of data at close-in positions. The agreement between Wpg and Wipl^ is good, which suggests that the above described differences diminish in significance when close-in gage records are disregarded.
3- Differences between Wpo and Wipe, and between WIJ^ and Wpg are con- sidered acceptable, since it is not anticipated that equivalent yields based on impulse would be the same as those based on overpressure.
COMPARISON WITH COMPOSITION B
Table 11 summarizes Composition B equivalency yields for the tests conducted, based on overpressure and impulse comparisons of like values from the Calibration A Comp B firing.
As in Table 10, values are shown with all gages considered, and also with records of the three close-in positions omitted. Again, there are differences between values for an individual test in each of the four columns, but these are generally of less magnitude than the correspond- ing differences appearing in Table 10.
33

TPR 1+13
o H
„ 1 1 o
r. w in BQ 01 rH = 60
O <D • 60 o o o o o o o o U W J O vO o o o o o CO o o •
"4-1 i-l i-l 60 H 3 r-4 tf ^
H m ON 00 CM CO CO oo CO • 3 ft A A #1 ft n •i •
•tt a, at i-t
<u -3 3 o 1-4 o M5 m m m CO CM i
rH i-l i-i rH i-H •-H
i-i g I-H oo
M X 4J <w u id
O 03 w M 4) = V
UH (0 60 o o o o o o o o IH • aj m vO o o o o o o o i
•O 343 M H vO ON o in CO eg r-~ rH i i-t P--rl 3 i aj B I-I t-i rH o y£> CO <t m CO i-H •
•H «rt a) i-H i-H i-4 i-H i-H i-H i-H
r wo pa 4) in
<U = 60r-l En «) 5 3 • 60<3 M W jQ o o O o o O o o
'4-1 10 iM 60 O St r* o O o o CO o o i 0) rH C rH .H m co v£> <t m m o r-4 i
•O H U TIH 3 ft •s A * * A A #t i H ftOfl CM CM ch 00 vO vO vO <f i
<U U 3 •> i-l i-i rH i-l i-H rH •H a) a I-H o >< > 5 o oo
0 U X IH (lU
0)
01
O 3 = W ri w PQ o>
M-< w ; oo O o o o o o o o 0) at to to o o o o CO o o •
T3 M * 60 JH en V© o m vO m m m i .-I O.J3 » w% A •I ft ft A A *> i <U M -i-l H CM o r- m m v£> in CM •
•H 0) i-l i-l i-H H i-H i-i i-H i-H >• > at at
O O
oo w o I-H at in
ai c m oo I-I S n o r-i at O 3 •-« 00 ^ )-i in u 4-i o o O o o o O o o
14-1 w at n 60O CM M? o O o o m o o o <u u o c —< H co CM vt r^ CO CO i-H r-» •4-
T3 U £i O-i-l i-t » •» A A * ft •* ft n A
i-l a -i-t <D "O CM CM o^ r^ vO vO M3 en O <U ri r-1 a! 3 « i-l i-H i-H rH i-H •-H i-i
•I-I 4) at I-H O ^^r 03 (U 4-1
at
oo 0) r-H
6 u C m 5 3 o I-I w M to i-i a)
14-1 (0 4J 4-1 60 o o o o O o o o o cu nl >H at i-l m o o o O m O o o
•O M U O 60 H CM p- <^ <F CM CO vO ^J- o r-i p«,o. a s ai £ i-i ai I-I CM cg CM 00 CM vO CM m m
•rl 0) i-l Pd •-* i-4 CM i-H CM CM i-H i-H X > at at
°°g P3
U . 4-1 0) £> W ,jQ i-l CM rn <t m vD r*. •H < PQ at s rH H 3
C 8
3h

TPRjt03
OJ
a 0)
t-H
> •r-4 3 XT
W
C o
o
M-l
o 03
B H
3 n
w o <u m 60--"
8=3 5 <D < 60 <£ h w = o o O O o o o o
4-1 i-l 00 o -* vO o o o o ON o oo 3 • C --i o i-H 00 1-1 Cl vD CM 00 ON
T) (X -O -H i-l Et r-4 6 •H T3 r-4 00 «* M CO <T t-i 00
<D -H r-l 3 « 1-4 r-H r-H i-H
•H tfl i-l O >4 O O 00
X 0) 4J
cd
5 < to
4-1 W 60 o o o O O o o o I-H • id CO CM o o O o ON o o
T3 3 .O 60 o m 00 CM 00 r» vD CO i-i H ft'H EB M ** m #>» n n •» *» a) B •-< i-i 1-1 CT» m CM co <r CO o
•i-l i-l Id r-l r-H r-H i-H r-H 1-1
>i o id
03 O <u m
CU 60i-4 6 M = cd O 3 < 60<#
o O O O o o O o 14-1 03 60 O Cvl m o O o o CM O o
<u • c >-i u ON s* r—1 00 vO ON CO o •O Mfl^rl EB i-l O-'H TJ iH ON uO m CM vt CM 00 tl )4rl 3 • r—l i-i i-H r-H
••-I o id r-< o >4 > O O 00
o X QJ 4-1
at
OJ _
5 3 <; w u <n r a)
4-1 0) 60 o O O o o O O o <u • id i-H i—i o O o o vD O o
•O U J3 60 o <y> o o- en CO O CO r>. i-H P,'i-I Es 0) M i-l r-4 i—i ON m en •tf m <r ON
•r-l 0) q) r-4 r-4 i-i 1-1 •—I
>4 > O id O
M • 4-> a) 43 = 03 XI r-1 CM co •tf in KD r*» •H pq a) B i-l ~ H 3 id
C o
35
TPR Ul3
GENERAL OBSERVATIONS CON- CERNING DERIVED YIELDS
Comparison of Tables 10 and 11 suggests that the propellants tested are behaving more like Comp B than like TNT. A comparison of the yields derived in the high explosive calibration firings is also of interest.
For example, when Comp B is expressed in TNT equivalency, using overpressure and the full range of gages (Wipo), the ratio value becomes (12,500 lb/lO,3^-0 lb) or 1.20, which compares to the commonly accepted value of 1.13• Using impulse and all gages (WrpO, the ratio value be- comes (ll,100/l0,3^0) or 1.07, which is quite close to the commonly ac- cepted 1.06 value. However, when records of close-in gages are omitted, these values change from 1.20 to I.36 (1M-, 100/10, 3^0) when using Wipl+j and from 1.07 to 1.19 (12,300/l0,3U0) when using WTg.
It should be noted that these changes with gage distances in TNT- versus-Composition B relationships are reflected in cross comparison of propellant values in Columns Wrpo through Wijg of Table 10 with correspond- ing columns of Table 11.
If columns Wrpo and W^c of Table 10 and the corresponding columns, WQ]_ and Wc3, of Table 11 are arbitrarily selected for derivation of per- centage equivalencies, the following values are obtained.
Test No.
TNT equiv. over-
pressure TNT equiv. impulse
Comp. "B" equiv.
overpressure
Comp. "B" equiv. impulse
Test geometry
1 32$
Ihkio
11656
106$
107$
^5$
106$
23$
11+8$
109$
92$
98$
36$
9ty
26$
122$
105$
91$
98$
98$
21$
133$
10U$
88$
9U$
32$
91$
© 2
ft
3 W> k ®G) 5 • 7
2
6 (RXfz)
7 7
2
The dot in the geometry configuration for each test shows the place- ment of the charge; the numbers 2 and 7 indicate the class of propellant.
30

TPR U13
In the above grouping, only two tests--3 and 4--were essentially identical; however, they did not produce identical results.
Tests 3; ^> 5> and 7 used identical motor combinations, but were different in motor attitude and method of priming. The results are sim- ilar despite the differences in test conditions.
Test 1 used only one class 2 motor, and test 6 used two class 2 motors involving twice as much propellant; however, there is a substan- tial increase in percentages between the two tests. This suggests that the added mass, or the distribution of mass and relative positioning of of priming charge, influenced the increase.
If Tests 1, 2, 3> ^> and 6 are compared, and if it is assumed that the class 7 motor in Test 2 was producing near maximum yield, then it follows that the class 2 motors in Tests 3 and k were producing a higher yield than they were in Tests 1 or 6. Using TNT overpressure values (Wrjno) and averaging results of Tests 3 and U, the following defines av- erage yield of the class 2 motor in Tests 3 and k:
Y (class 2 yield) . 1^20^10,600 _ 5^5° , 0.77 or 77*
Using Comp B overpressure values (WQ]_), the following applies:
i-1*'^,;,g'000-o.7tor7*
This indicates that the large application of externally applied energy from the exploding class 7 motor produced greater yield in the class 2 motor than the yield produced in a similar motor by the explo- sion of 96 lb of C-U placed in the grain perforation.
CONCLUSIONS
The derived percentage values of high explosive equivalency are considered to represent a convenient expression of potential blast dam- age effects in terms of common explosives; however, it is acknowledged that there are differences in structure and rates of decay of blast waves produced by different explosives and propellants so that expres- sions of high explosive equivalency are limited to generalizations with- out specific identification of quantities, distances, and types of energy measured.
37
TPR J03
Additionally, it is emphasized that the measurements made and the analytical approaches used in this evaluation required the cubing of the derived W1/3 values to arrive at the W values shown in Tables 10 and 11. Thus, errors in measurement (and the possible real anomalies in the blast wave itself) are amplified in the expression of W.
With the above qualifications in mind, the tests show that, under strong stimulus, motors of the class 7 type tested are capable of pro- ducing blast yields that exceed those of some common explosives. Motors of the class 2 type tested are also capable of producing significant blast yields, the magnitude of which tends to vary with the strength of the stimulus and with propellant mass, or the distribution of mass and relative positioning of the priming charge.
Fragment type, size, quantity, and distribution were considered to be consistent with the explosive effects noted with each test. In gen- eral, the estimated total weight of unburned propellant fragments varied inversely with the blast effectiveness, as might be expected.
No attempt has been made to correlate blast yield with crater size for two main reasons: (l) the craters tended to assume different shapes according to the configuration and orientation of the propellant and explosive charges, and (2) the same site was used for all tests in or- der to maintain consistent gage position; therefore, there was progres- sive pulverization and change of soil structure with each explosion and subsequent re-leveling operation.
38

TPR Ul3
Appendix
ARMED SERVICES EXPLOSIVES SAFETY BOARD SOLID PROPELLANT MOTOR HAZARDS TESTS
Summaries of conditions associated with each test are shown on the following pages.
39
TPR kl3
Conducted by: US NOTS Test No. 1 E.S. No. E-4259
Funds: Date S Nov 1964 Test Site Victor "C"
Number 1 Type Serial No.
ei 0 H 0 2 Q
Propellant Class 2 Propellant Weight 7250 lbs Motor Case Mat. Steel
Position relative to ground In contact with: horizontal
Position of main motor axis Horizontal, head end NE
3 Remarks (including motor deficiencies) Four nozzles in aft bulkhead
s on O s 1 2
Priming Explosive: Type C-4 Amount 96 lbs Position Grain perforation
Detonators: Type Engine Sp. Number 2 Position One fore; one aft
Remarks Some of the explosive was packed into the cavity where the nozzle chambers join the grain perforation at the aft end of the motor
0,
to Number None Type Serial No.
O
o Propellant Class Propellant Weight Motor Case Mat.
S OS o Position relative to primed motor
OL.
8 Remarks (including motor deficiencies) u <
OS
5
Pressure mb 941.7 Temperature I7 75 Density Slugs
Humidity 18% Wind Direction 095° Wind Velocity, ft/sec 8
ko

TPR Ul3
Conducted by: US NOTS Test No. 2 E.S. No. E-4260
Funds: Date 16 Nov 1964 Test Site Victor "C"
Number 1 Type Serial No.
OS 0 H O
Q
Propellant Class 7 Propellant Weight 7358 Motor Case Mat. Fiberglass
Position relative to ground On ground: horizontal
Position of main motor axis Horizontal; head end NE
OH
Remarks (including motor deficiencies) There were no nozzles on this motor.
s Priming Explosive: Type C-4 Amount 96 lbs Position Grain perforation
to 0 s i
Detonators: Type Electric Number 2 Position One fore; one aft
Remarks Two electric blasting caps were fired simultaneously.
ON
t/5 Number None Type Serial No. OS O h O 2 OS 0
Propellant Class Propellant Weight Motor Case Mat.
Position relative to primed motor P OH W O Remarks (including motor deficiencies)
<
OS w
s 5
Pressure mb 940.6 Temperature*£ 47 Density Slugs
Humidity 40 Wind Direction 080° Wind Velocity, ft/sec_10^
Ui

TPR U13
Conducted by: US NOTS Test No. 3 E.S. No. 4261-1
Funds: Date 18 Nov 1964 Test Site Victor "C"
Number 1 Type
Propellant Class 7 Propellant Weight 7358
Position relative to ground On ground: horizontal
Serial No.
OS 0 H O 2
Motor Case Mat. Fiberglass
Position of main motor axis Horizontal; head end NE
0.
Remarks (including motor deficiencies) Rear bulkhead but no nozzles in this motor.
0 52 I/)
0 5
Priming Explosive: Type C-4 Amount 96 lbs
Detonators: Type Electric Number 2
Remarks
Position Grain perforation
Position One fore; one aft
OH
t/3 Number 1 Type
Propellant Class 2 Propellant Weight 7250
Position relative to primed motor Side by side: touching
Serial No. OS 0 H O
os 0
Motor Case Mat. Steel
P OH W U Remarks (including motor deficiencies) Rear bulkhead con- plete with nozzle bosses (no
< nozzles) was on this motor.
OS w Pressure mb 935.7 Temperature°F 54
Humidity 12.'•. Wind Direction S
Density Slugs
Wind Velocity, ft/sec 7
k2

TPR U13
Conducted by: US NOTS Test No. 4 E.S. No. 4261-2
Funds: Date 20 Nov 1964 Test Site "C"
Number 1 Type
Propellant Class 7 Propellant Weight 7358
Serial No.
PS 0 H
Motor Case Mat. Fiberglass
O 2 Q
Position relative to ground On ground: horizontal
§ Position of main motor axis Horizontal; head end NE
2 Remarks (including motor deficiencies) No nozzles on this motor.
2 Priming Explosive: Type C-4 Amount 96 lbs Position In grain perforation
52 to Detonators: Type Electric Number 2 Position One fore; one aft
0 5 | 2
Remarks
OH
IO Number 1 Type Serial No. OS O h O Propellant Class 2 Propellant Weight 7250 Motor Case Mat. Steel
2 oS O Position relative to primed motor Side by side: touching P 0. U Remarks (including motor deficiencies) No rear bulkhead in this motor. U <
OS w Pressure mb 943.7 Temperature°F 55 Density Slugs
Humidity 22 Wind Direction Calm Wind Velocity, ft/sec --
»0
TPR Ul3
Conducted by: US NOTS Test No. 5 E.S. No. 5001
Funds: Date 8 Jan 1965 Test Site Victor "C"
Number 1 Type Serial No.
Pi O h O 2
Propellant Class 7 Propellant Weight 7358 Motor Case Mat. Fiberglass
Position relative to ground Above ground, resting on acceptor motor
Position of main motor axis Vertical^ head end down
1 04 Remarks (including motor deficiencies)
B S2 0 s
Priming Explosive: Type C-4 Amount 96 lbs Position Grain perforation
Detonators: Type Electric Number 2 Position One fore; one aft
Remarks
E
10 Number 1 Type Serial No. 2 B 0
O
Propellant Class 2 Propellant Weight 7250 Motor Case Mat. Steel
Position relative to primed motor On groundj vertical head end up_ P w O Remarks (including motor deficiencies) U <
Pi
8 5 Pressure mb 941.2 Temperature I7 45 Density Slugs
Humidity 30% Wind Direction 100° Wind Velocity, ft/sec 5
hk

TPR 1+13
Conducted by: US NOTS Test No. 6 E.S. No. 5058
Funds: Date 16 Mar 1965 Test Site C
O H O 2
Number 2 Type_ Serial No.
Propellant Class 2 Propellant Weight 14,500 Motor Case Mat. Steel
Position relative to ground On ground - horizontal - side-by-side
Position of main motor axis Horizontal - head ends NE
Remarks (including motor deficiencies) No nozzles on either motor.
I S § 5 a.
Priming Explosive: Type C-4 Amount 96#/motor Position Grain perforation
Detonators: Type Electric Number 2/motor Position One fore; one aft
Remarks
o H O S
£ a. w U U <
Number Type_
Propellant Class Propellant Weight
Position relative to primed motor
Remarks (including motor deficiencies)_
Serial No.
Motor Case Mat.
i Pressure mb 937. 1 Temperature°F 70. 5
Humidity 16% Wind Direction Calm
Density Slugs 0.00215
Wind Velocity, ft/seccalm
45
TPR Ul3
Conducted by: US NOTS Test No. 7 E.S. No. 5065
Funds: Date 17 Mar 1965 Test Site C
O H
a CLc
Number 1 Type_ Serial No.
Propellant Class 7 Propellant Weight 7358 Motor Case Mat. Fiberglass
Position relative to ground On top of acceptor - 6' above ground
Position of main motor axis Vertical
Remarks (including motor deficiencies) There were no nozzles on this motor.
1/5
O S 5 2 a,
Priming Explosive: Type Comp B Amount 100#
Detonators: Type Electric Number 2_
Remarks
Position On top of donor motor
Po s it ion On top of primer charge
ti
o
R p.
<
Number 1 Type_ Serial No.
Propellant Class 2 Propellant Weight 7250#
Position relative to primed motor On ground directly under donor.
Remarks (including motor deficiencies)
Motor Case Mat. Steel
w Pressure mb 935.9 Temperature*F 72. 5
Humidity 14% Wind Direction 125°
Density Slugs 0.00215
Wind Velocity, ft/sec W
kt

TPR 1+13
Conducted by: US NOTS Test No. Calibration-A E.S. No. 4262
Funds: Date 25 Nov 1964 Test Site Victor "C"
Number 216 cans Type Reclaimed Comp. B
Propellant Class Propellant Weight 10,260
Serial No.
Oi Motor Case Mat. 0 H O 2 Position relative to ground On pallets
Position of main motor axis
2 a-
Remarks (including motor deficiencies) 216 metal cans 9x9x9 in. Stack was 9 cans x
6 cans x 4 cans high.
1 Priming Explosive: Type C-4 Amount 80 lbs Position Each side
<2 in Detonators: Type Electric Number 4 Position 2/each primer chg.
O 2 Remarks
ft.
(/) Number Type Serial No. Pi o o Propellant Class Propellant Weight Motor Case Mat.
a pi o Position relative to primed motor
ft. u Remarks (including motor deficiencies)
<
Pi w B
Pressure mb 933. 1 Temperature'F 64 Density Slugs
Humidity 18 Wind Direction E Wind Velocity, ft/sec 3.5
hi
TPR 14-13
Conducted by: US NOTS Test No. Calibration B E.S. No. 5064
Funds: Date 19 Mar 1965 Test Site C
Number 213 boxes Type Flake TNT
Propellant Class Propellant Weight 10,650
Position relative to ground Loose in one large wooden box
Serial No.
oi Motor Case Mat. o H O 2
Position of main motor axis Box oriented NEXSW
s Remarks (including motor deficiencies) 10 boxes, containing 500#, were stacked on top
of the loose TNT.
2 P
o S
Priming Explosive: Type C-4 Amount 96#
Detonators: Type Electric Number 2
Remarks The 96# of priming explosive were contained in a 6
Position E of box
Position One fore; one aft
-in. x 6-in. wooden box which
extended from one end to the other at the exact center of the main explosive charge. CU
i/i Number Type
Propellant Class Propellant Weight
Position relative to primed motor
Serial No.
o H o Motor Case Mat.
2 oS o H ou M U Remarks (including motor deficiencies)
<
Pressure mb 940.0 Temperature°F 65
Humidity 13% Wind Direction 150°
Density Slugs
Wind Velocity, ft/sec 3.4 £
kQ

Unclassified
Security Classification
DOCUMENT CONTROL DATA - R&D (Security ctaaaification ot title, body ol abstract and indexing annotation must be entered when the overall report ia clasaitied)
1 ORIGINATIN G ACTIVITY (Corporate author)
U. S. Naval Ordnance Test Station China Lake, California 93555
2a. REPORT SECURITY CLASSIFICATION
Unclassified
2b CROUP
3 REPORT TITLE
HIGH EXPLOSIVE EQUIVALENCY TESTS OF ROCKET MOTORS
4. DESCRIPTIVE NOTES (Type ot report and inclusive dates)
Progress report on solid propellant motor hazard tests; 5 November 1964 through 19 March 1965.
5 AU THORNS) (Lam name, lirat name, initial)
Weals, F. H. Wilson, C. H.
6 REPORT DATE
November 1965
7« TOTAL NO. OF PASES 7b. NO OF REFS
8« CONTRACT OR GRANT NO.
Work Request W-11543B-Am. 1 6. PROJECT NO. Local Project Number 965
TA RMMO-62061/216-1/F008-11-05
c. Local Project Number 556
9a ORIGINATOR'S REPORT NUMBERfS)
TPR 413 NOTS TP 3910
9b. OTHER REPORT No(S) (Any other numbers that may be assigned this report)
10 AVAILABILITY/LIMITATION NOTICES
All distribution of this report is controlled. Qualified DDC users shall request through The Armed Services Explosives Safety Board, DOD, Washington, D. C. 20315.
II SUPPLEMENTARY NOTES
Ballistics Research Lab Memorandum Report 1518, dated April 1964, used as comparison reference.
12. SPONSORING MILITARY ACTIVITY
ASESB Department of Defnese, Washington, D. C. 20315
13 ABSTRACT
ABSTRACT. From November 1964 to 19 March 1965 seven solid propellant motor hazard tests and two high explosive calibration tests were conducted at the U. S. Naval Ordnance Test Station, China Lake, California. The primary purpose of the tests was to assess the blast yield of two classes of solid propel- lant material, when subjected to severe explosive shock, and to compare the propellant blast yields to those produced by a standard explosive . The following yields, in percent of TNT equivalency by weight, were determined from over- pressure and impulse data from a blast gage array: The highest yield of class 2 propellants tested alone approximated 4 0%; class 7 propellants tested alone produced well over 100%; and a combination of equal amounts of each class produced approximately 100%. The quantity and dispersion of fragments varied widely with the propellants used and with the test configuration.
Additional tests are planned using different motor configurations, different pro- pellants, and varying explosive stimuli.
DD FORM 1 JAN 64 1473 0101-807-6800 Unclassified
Security Classification

Unclassified
Security Classification
KEY WORDS
Propellant hazard
Explosive equivalency
Rocket motor safety
INSTRUCTIONS I. ORIGINATING ACTIVITY: Enter the name and address of the contractor, subcontractor, grantee, Department of De- fense activity or other organization (corporate author) issuing the report.
2a. REPORT SECURITY CLASSIFICATION: Enter the over- all security classification of the report* Indicate whether "Restricted Data" is included. Marking is to be in accord- ance with appropriate security regulations.
26. GROUP: Automatic downgrading is specified in DoD Di- rective 5200.10 and Armed Forces Industrial Manual. Enter the group number. Also, when applicable, show that optional markings have been used for Group 3 and Group 4 as author- ized.
3. REPORT TITLE: Enter the complete report title in all capital letters. Titles in all cases should be unclassified. If a meaningful title cannot be selected without classifica- tion, show title classification in all capitals in parenthesis immediately following the title.
4. DESCRIPTIVE NOTES: If appropriate, enter the type of report, e.g., interim, progress, summary, annual, or final. Give the inclusive dates when a specific reporting period is coveted. 5. AUTHOR(S): Enter the name(s) of authors) as shown on or in the report. Enter last name, first name, middle initial. If military, show rank and branch of service. The name of the principal author is an absolute minimum requirement.
6. REPORT DATE: Enter the date of the report as day, month, year; or month, year. If more than one date appears on the report, use date of publication.
7*. TOTAL NUMBER OF PAGES: The total page count should follow normal pagination procedures, i.e., enter the number of pages containing information.
76. NUMBER OF REFERENCES: Enter the total number of references cited in the report.
8a. CONTRACT OR GRANT NUMBER: If appropriate, enter the applicable number of the contract or grant under which the report was written.
86, 8c, & 8d. PROJECT NUMBER: Enter the appropriate military department identification, such as project number, subproject number, system numbers, task number, etc. 9a. ORIGINATOR'S REPORT NUMBER(S): Enter the offi- cial report number by which the document will be identified and controlled by the originating activity. This number must be unique to this report.
96. OTHER REPORT NUMBER(S): If the report has been assigned any other report numbers (either by the originator or by the sponsor), also enter this number(s).
10. AVAILABILITY/LIMITATION NOTICES: Enter any lim- itations on further dissemination of the report, other than those
imposed by security classification, such as:
using standard statements
(1)
(2)
(3)
(4)
(5)
"Qualified requesters may obtain copies of this report from DDC"
"Foreign announcement and dissemination of this report by DDC is not authorized."
"U. S. Government agencies may obtain copies of this report directly from DDC. Other qualified DDC users shall request through
"U. S. military agencies may obtain copies of this report directly from DDC. Other qualified users shall request through
"All distribution of this report is controlled, ified DDC users shall request through
Qual-
If the report has been furnished to the Office of Technical Services, Department of Commerce, for sale to the public, indi- cate this fact and enter the price, if known.
H. SUPPLEMENTARY NOTES: Use for additional explana- tory notes.
12. SPONSORING MILITARY ACTIVITY: Enter the name of the departmental project office or laboratory sponsoring (pay ing {or) the research and development. Include address.
13. ABSTRACT: Enter an abstract giving a brief and factual summary of the document indicative of the report, even though it may also appear elsewhere in the body of the technical re- port. If additional space is required, a continuation sheet shall be attached.
It is highly desirable that the abstract of classified reports be unclassified. Each paragraph of the abstract shall end with an indication of the military security classification of the in- formation in the paragraph, represented as (TS). (S), (C). or (U)
There is no limitation on the length of the abstract. How- ever, the suggested length is from 150 to 225 words.
14. KEY WORDS: Key words are technically meaningful terms or short phrases that characterize a report and may be used as index entries for cataloging the report. Key words must be selected so that no security classification is required. Identi- fiers, such as equipment model designation, trade name, military project code name, geographic location, may be used as key words but will be followed by an indication of technical con- text. The assignment of links, rales, and weights is optional.
Unclassified Security Classification


.pdf · 73451 / 173 (0712) 5224481 - 85 : (0712) 5224478 : golsazshirazi@gmail.com 1386-87](https://img.pdfslide.us/doc/110x75/5b0830057f8b9a404d8bf322/73451-173-0712-5224481-85-0712-11pdf73451-173-0712-5224481-85.jpg)