Embed Size (px)
Citation preview

PNNL-1190!M?.€avLUC-2030
Pacific NorthwestNational LaboratoryOperated by Battelle for theU.S. Department of Energy
Organic Tanks Safety ProgramWaste Aging Studies Final Report
D, M, CamaioniW- D SamuelsJ C. Linehan
A K. SharmaS. T. Autrey
M. A. LilgaM. O. Hogan5.. A QaussEl L WahlJ A. Campbell
September 1998
Prepared for the US Department of "Energyunde r Co extract DE-AC06-76ELO 1830
4DO
D
MASTER fOF 1>OCUM£WT
BISCLAIMER
This report was prepare-d as an account, of work sponsored by an agency of the UnitedStates Government Neither the United States Government, nor any agency thereof, norBatteUe Memo rial Institute,, m.irany of their employees,, mites any warranty,, espress orimplied, or ?is<aitnre- any legal liability or responsibility for the acairaqy, complfcteness,or usefulness of any information, apparatus, product, or process disduved, orrepnsents that its use would not infringe privately owned rights Reference herein to.any specific .commercial product, process, or service by trade name, trademark,,manufacturer, or otherwise does not necessarily constitute or imply its endorsement,recommendation, tirfxvoring by the United States Government or any agency thereof, orBattelle Memonal Institute The views and opinions of authors expressed herein do notnecessarily state or reflect those of the United States Gn^emmentarany agency thereof
PACIFIC NORTHWEST NATIOM:/y: LABORATORYoperated b)1
BATTELLEfor the
Ul-mT£D STATES DEPARTMENT OF ENERGYunder ContractDE-AC06-76RLO J830
Printfcd in the Unittd Stat«~ of jimenca
Availjiblt: to DOE and DOE contractor from theOffice of SdMdtulc. and Technical InTnrmatinn, P..O Box 62, Oak Badge, TN 37S3lv
pricfcs arailable from Ibl5(576-*4O1
Arail Alt to the public from the National Technical Information Service,US. Department of Commerte, S2S5 Port Royal B,tL, SprinEfield, VA 22161
This document was printed on recydeii paper.

DISCLAIMER
Portions of this document may be illegiblein electronic image products. Images areproduced from the best available originaldocument.

PNNL-11909 Rev. 1UC-2030
Organic Tanks Safety ProgramWaste Aging Studies Final Report
D. M. CamaioniW. D. SamuelsJ. C. LinehanA. K. SharmaS. T. AutreyM. A. LilgaM. O. HoganS. A. ClaussK. L. WahlJ. A. Campbell
September 1998
Prepared forthe U. S. Department of Energyunder Contract DE-AC06-76RLO 1830
Pacific Northwest National LaboratoryRicMand, Washington 99352

Summary
Uranium and plutonium production at the Hanford Site produced large quantities of radio-active byproducts and contaminated process chemicals that are stored in underground tanksawaiting treatment and disposal. Aging of the organic compounds used in the extraction proc-esses has a direct bearing on several safety issues, including gas generation and chemical behaviorhazards associated with fuel-nitrate combustion accidents. The purpose of this project was todetermine the fate of organic species added to the tank wastes. We were interested specifically inlearning the extent to which waste aging changes the energy content of organic species. Ourapproach included subjecting nonradioactive waste simulants to a range of temperatures anddoses of y-radiation and then performing chemical analyses for inorganic and organic species. Wecorrelated the results with literature insights, inferred mechanisms, and developed fundamentalkinetic models for complex reaction sequences. We also transformed the species data to carbonand energy content to obtain a quantitative description of the effects of temperature, radiationdose, and radiation flux on the indexes that are key to assessing the safety of stored wastes.
The results show that radiation and heat promote redox reactions between organic compounds(reducing agents) and nitrates/nitrites (precursors to oxidizing agents) in the wastes. We find thatproduction of Eb, N2, and N2O by radiolysis is significant and that it occurs concurrently withthe disappearance of organic species and appearance of oxidized fragments of the original species.The observations are consistent with progressive degradation to species with more C-0 bondsand fewer C-H and C-C bonds, resulting in an overall lower energy content of the organicinventory. The results of studies using both simple and complex waste simulants showquantitatively that the energy content of the wastes should decrease due to aging. However, thelifetimes and aging rates of organic complexants are strongly dependent on radiolytic and thermalexposure, and therefore the degree of aging will vary from tank to tank.
The modeling effort provides the first measurements of rate constants for reactions of NO2with carboxylate salts and complexants. The absolute rate constant for formate is ~10 M-ls-land ~70 M-ls-l for glycine. The ratios of these rate constants agree well with reactivitiesmeasured by competition kinetic experiments. Reactivities of other complexants relative toformate were also measured. Thus, rate constants may be estimated.
The studies corroborate the hypothesis (Meisel et al. 1991,1993,1997) that NO2 is radicaldominates the radiolytic oxidation of complexants. Under laboratory conditions of highconcentrations of nitrite and hydroxide and high dose rates (to accelerate aging), kinetic modelsshow that NO2 and O" are the primary oxidizing species. However, under conditions likely to beencountered in actual wastes, e.g., low dose rates, the models predict that NO2 is dominantlyresponsible.
Generation of NO is also shown to be important. Modeling results suggest that NO mainlydisproportionates with NO2, making nitrite ions. However, other reactions leading to generationof N2O, N2, and NH3 must also occur. But information reactions is not sufficient to supportquantitative models.
111

The multiple roles that nitrite ion plays are noteworthy. First, it reduces radiolysis radicals,OH/0" and forms NO2. Second, it oxidizes NO32- radicals that form by reaction of electronswith nitrate. To the extent that this reaction occurs, it reduces the efficiency of radiolytic agingby converting NO2 to NO, a much less powerful oxidizing radical. The reaction is relatively slowand requires high nitrite ion concentrations for it to scavenge a significant fraction of NO32-radicals. Third, nitrite ion reacts with organic radicals generated from complexants, and therebypromotes organic reactions that yield simple innocuous products such as oxalate, formate, andcarbonate. Without this step, the products from complexants would be complicated and perhapsmore troublesome issues for storage, retrieval, and pretreatment activities. And finally, nitrite isrequired for thermal degradation of complexants.
Although the safety issue surrounding safe storage of organic wastes is nearing closure, wesuggest directions that continued studies could follow. We note that the product identificationsand subsequent modeling of the reactions of higher complexants are incomplete. We suggest thatcontinued work to expand the model is worthwhile, especially if the effort also leads to theaddition of thermal and thermal plus radiolytic reaction mechanisms so that the combinedprocesses can be modeled and understood. Steps for reactions that lead to gaseous products mayalso be added so that the model yields information about generation rates and distributions ofgaseous products. Developing such capabilities could facilitate resolution of flammable gassafety issues and answer questions about reactions that may be induced byretrieval andpretreatment activities.
References
Meisel D,H Diamond, EPHorwitz, MS Matheson, MC Sauer Jr, and JC Sullivan. 1991.Radiation Chemistry of Synthetic Waste. ANL-91/40, Argonne National Laboratory, Argonne,Illinois.
Meisel D, CD Jonah, S Kapoor, MS Matheson, and MC Sauer Jr. 1993. Radiolytic andRadiolytically Induced Generation of Gases from Synthetic Wastes. ANL-93/43, ArgonneNational Laboratory, Argonne, Illinois.
Meisel D, A Cook, D Camaioni, and T Orlando. 1997. "Chemistry, Radiation, and Interfaces inSuspensions of Nuclear Waste Simulants." Photoelectrochemistry, K Rajeshwar, LM Peter,A Fujishima, D Meissner, M Tomkiewicz, eds. The Electrochemical Society, 97-20:350-7.
IV

Acknowledgments
This work progressed in collaboration with projects on "The NOX System in Nuclear Waste"at Argonne National Laboratory (ANL) and "Interfacial Radiolysis Effects in Tank WasteSpeciation" at Pacific Northwest National Laboratory. These projects are funded by the DOEEnvironmental Management Science Program (EMSP).
We thank Phil Cappe, Associated Western Universities Summer Undergraduate ResearchParticipant, and Dr. Sarah Burton (PNNL) for recording NMR spectra. We thank Dr. LeonStock, consultant to Organic Tanks Safety Program, for helpful discussion and for contributingAppendix C. And we thank Dr. Harry Babad, formerly of Westinghouse Hanford Co., forguidance and unwavering enthusiasm for these studies.
Dr. William D. Samuels led the simulant aging studies Task (Section 4). Amit Sharma, ScottClauss, Dr. Karen Wahl, and Dr. James A. Campbell provided analytical support for this task.Dr. John Linehan led the task to measure relative reactivities of organic species (Section 3). Hedeveloped the NMR analytical methods and collected and reduced much of the data. Dr. TomAutrey performed the mechanistic kinetic modeling of formate and glycine and extrapolated theresults to low dose rates representative of actual tank wastes. Michael O. Hogan and Dr.Michael A. Lilga provided technical support for work in Section 3 by handling the preparation ofsamples and scheduling them in and out of the y facilities. Dr. Donald M. Camaioni led theWaste Aging Studies project at PNNL. Inquiries about and comments on this report or theWaste Aging Studies Task should be directed to him at 509-375-2739 or e-mail:[email protected].

This page(s) is (are) intentionally left blank.

Abbreviations
DBPEDMAEDTAEDDAED3AEMSPGCFAIFYHEDTAhexone
HPLCIDAICIPCMSNMRNPHNTAPUREXREDOXRSSTSSTTBPTOC
dibutyl phosphateethylenediaminemonoacetate •ethylenediaminetetraacetateethylenediaminediacetateethylenediaminetriacetateEnvironmental Management Science Programgas chromatographyFauske & Associates, Inc.fiscal yearhydroxyethylethylenediaminetriacetatemethyl isobutyl ketone
high performance liquid chromatographyiminodiacetateion chromatographyion-pair chromatographymass spectrometrynuclear magnetic resonancenormal paraffinic hydrocarbonsmtrilotriacetatePlutonium-Uranium Extraction (Plant)Reduction-Oxidation (Plant)Reactive Systems Screening Toolsingle-shell storage tanktributyl phosphatetotal organic carbon
vn

This page(s) is (are) intentionally left blank.

Contents
Summary iii
Acknowledgments v
Abbreviations vii
1.0 Introduction 1.1
1.1 Objective 1.11.2 Approach 1.11.3 Background 1.2
2.0 Mechanisms of Organic Aging 2.12.1 Mechanism and Kinetics of Radiolytically Induced Organic Aging 2.1
2.1.1 Oxidizing Radicals Generated by Radiolysis of Wastes 2.12.1.2 Reactions of O~ Radicals with Organic Species 2.22.1.3 Reactions of N 0 x Radicals 2.3
2.2 Mechanisms and Kinetic Parameters for Thermal Aging -2.52.2.1 Mechanisms for Thermal Aging of Complexants 2.52.2.2 Activation Barriers for Thermal Aging of HEDTA and Glycolate 2.7
2.3 Synergistic Effects of Radiation on Thermal Reactions 2.8
3.0 Relative Rate Constants for Radiolytic Aging of Organic Species 3.13.1 Reactivities of Organic Complexants Relative to Formate 3.13.2 Kinetic Model for Radiolytic Oxidation 3.4
3.2.1 Oxidation of Formate 3.63.2.2 Oxidation of Glycine : 3.10
3.3 Products of Degradation 3.163.4 Experimental Section 3.20
3.4.1 Sample Preparation 3.203:4.2 NMR Analysis 3.213.4.3 Fricke Dosimetry 3.213.4.4 Calculation of Radiolytic Yields 3.223.4.5 Mechanistic Kinetic Modeling 3.223.4.6 Calculation of Fractions of Formate and Glycine Oxidized by O~,
OH,H, andNO2 3.23
4.0 Organic Aging Studies Using Waste Simulants 4.1
4.1 Results 4.24.1.1 Effect of Radiation Dose on Aging 4.24.1.2 Effect of Temperature on Radiolytic Aging 4.34.1.3 Results for Thermal Aging of the Simulant .' 4.5
IX

4.1.4 Effects of 0 2 and Fe on Aging 4.74.2 Radiolytic Effects on TOC and Nitrate Oxidation Enthalpies of
Organic Species 4.94.3 Experimental Section 4.12
4.3.1 Simulant Preparation and Irradiation : 4.124.3.2 Solution Phase Analyses , 4.13
5.0 Organic Aging in Tank Wastes 5.15.1 Organic Species Found in Tank Wastes 5.15.2 Radiolytic Aging in Wastes 5.2
5.2.1 Effects of Dose Rate, Nitrite, and Hydroxide on Radiolytic Yields 5.25.2.2 Radiolytic Contribution to Organic Aging in Tank Wastes 5.5
5.3 Thermally Activated Organic Aging 5.85.4 Rates of Aging in High Heat-Load Waste Tanks 5.8
6.0 Conclusions 6.16.1 Effects of Aging on Organic Nitrate Reaction Enthalpies 6.16.2 Mechanistic Understanding of Organic Aging 6.26.3 Recommendations ; 6.2
7.0 References 7.1
Appendix A: Data for Relative Rate Determinations A.I
AppendixB: Datafor SIM-PAS-95-1 Aging Studies B.I
Appendix C: Energy Content of Intermediate Organic Compounds . -. C.I

Figures
2.1 Pathways for Oxidation of Aminocarboxylates 2.3
2.2 Electron Transfer and Combination Reactions of Organic Radicals with
NO2andNO2" 2.5
2.3 Mechanism for Base-Catalyzed Decomposition of Citrate Ion 2.5
2.4 Potential Energy Surface for Nitrosation of Primary Alcohols by Nitrite Ion 2.7
3.1 we NMR Spectra of 0.024 M Sodium Formate in a 3.75 M NaNO3,1.25 M
NaNO2, and 2 M NaOH Solution before and after y Radiolysis 3.2
3.2 1H NMR Spectra ofUriirradiated and Irradiated EDTA/Formate-i3C Solutions 3.2
3.3 Dependence of Radiolytic Yield of Carbonate from Formate versus Initial EDTAConcentration in a 3.75 M NaNO3,1.25 M NaNO2, and 2 M NaOH Solution 3.3
3.4 Reactivity of EDTA Relative to Formate Correlates with Average EDTA andConversion of EDTA 3.4
3.5 Measured and Modeled Radiolytic Yield of Carbonate Versus FormateConcentration < 3.6
3.6 Time Dependence of NO and NO2 Radicals Predicted by Kinetic Model for
Radiolytic Oxidation of Formate in NaNO2, NaN03 ,2 M NaOH Solutions 3.8
3.7 13C NMR Spectrum of Equal Parts l-i3C-Glycine and 2-i3C-Glycine in 2 MNaNO3, 2 M NaNO2,2 M NaOH Solutions After y Radiolysis at 22°C 3.11
3.8 13C-NMR Spectrum of a 2-i3C-Glycine in a 2 M NaNO3,2 M NaOHSolution after a 29 MradDose at25°C 3.12
3.9 Results of Kinetic Model and Experiments for Radiolytic Degradationof Glycine 3.14
3.10 1H NMR Spectra Showing that NTA Degrades to IDA and Glycine
During y Radiolysis in Nitrate/Nitrite/Hydroxide Solution 3.18
XI

3.11 1H NMR Spectra of EDTA before and after y Radiolysis in 2 M NaNO2,
2 MNaNO3,2 MNaOH Solution 3.18
3.12 iH NMR Spectra of HEDTA before and after y Radiolysis inNitrate/Nitrite/Hydroxide Solution 3.19
3.13 Structures Consistent with Hydroxyethylene Resonances in IH NMRSpectra of y Irradiated HEDTA Solutions 3.19
'4.1 Disappearance of Complexants and Appearance of Products in a Radiation
Field of-3x10⁵ radhr-i at70°C : 4.3
4.2 Plots of Carbon Content Versus Dose for 70 and 90°C Irradiations .4.4
4.3 Effects of Temperature and Initial O2 Concentration in Headspace Gas onRadiolytic Yields of Gases 4.5
4.4 Disappearance of Starting Organic Compounds and Appearance ofProducts Versus Time at 90°C in the Absence of y Radiation 4.6
4.5 Effects of Initial Concentration of O2 in Headspace Gas on Distributionof Gases Produced at 90°C 4.9
4.6 Nitrate Reaction Enthalpy and TOC of Simulants Versus Dose at 40,70,and 90°C 4.11
5.1 Effects of Dose Rate, Nitrite, and Hydroxide on the Radiolytic Yield ofCO32- from Formate 5.4.
Xll

Tables
3.1 Relative Rate Constants for Disappearance of Organic Species inNitrate/Nitrite/Hydroxide Solutions during y Radiolysis 3.5
3.2 Kinetic Model for Radiolytic Aging of Formate in Solutions ContainingNitrite, Nitrate and Hydroxide 3.7
3.3 Total Yield and Fractions of Carbonate Produced from RadiolyticallyGenerated Species 3.10
3.4 Kinetic Reaction Steps Added to Formate Kinetic Model to Model Glycine•Oxidation in Solutions of Nitrate, Nitrite, and Hydroxide 3.13
3.5 Radiolytic Yields of Glycine in Solutions Containing Nitrite, Nitrate,and Hydroxide 3.15
3.6 Products Identified by NMR from Radiolytic Oxidation of Complexants
in Nitrate/Nitrite/Hydroxide Solutions : 3.17
4.1 Target Composition of SIM-PAS-95-lc and -Id Simulants . . .• 4.1
4.2 Effects of Temperature on Radiolytic Aging of SIM-PAS-95-ld 4.4
4.3 Effects of O2 on Radiolytic Aging of SM-PAS-95-ld at 70°C 4.7
4.4 Nitrate Reaction Enthalpies (AHr) for Organic Species 4.10
4.5 Effect of Dose on Organic Carbon Content and Average -AHr of
SIM-PAS-95-1 Simulants 4.11
5.1 Fractions ofTOC that are Oxalate in Tank Wastes 5.2
5.2 Analyses of Organic Species in Tank Waste Samples 5.3
5.3 Summary of Radiolytic Aging Model Showing Effects of Dose Rate, Nitrite,and Hydroxide on Radiolytic Yield and Distribution of Oxidizing Species 5.4
5.4 Changes in Nitrate Reaction Enthalpies Due to Aging Reactions 5.7
5.5 Radiolytic Yield and Thermal Rates of Formation of Aging Products fromPAS-95 Simulantsat90°C 5.9
xin

5.6 AZ-101 and AZ-102 Characterization Data 5.10
5.7 Estimated Rates of Organic Aging to Carbonatej Formate, and Oxalate Ionsat 120°C in AZ Tank Wastes 5.10
xiv

1.0 Introduction
Uranium and plutonium production at the Hanford Site produced large quantities of radio-active byproducts and contaminated process chemicals that are stored in underground tanksawaiting treatment and disposal. Having been made strongly alkaline and then subjected tosuccessive water evaporation campaigns to increase storage capacity, the wastes now exist in thephysical forms of saltcakes, metal oxide sludges, and aqueous brine solutions. Tanks that containorganic process chemicals mixed with nitrate/nitrite salt wastes might be at risk for fuel-nitratecombustion accidents. This project started in fiscal year (FY) 1993 to provide information onthe chemical fate of stored organic wastes. While historical records (Klem 1990; Sederburg andReddick 1994) had identified the organic compounds originally purchased and potentially presentin wastes, aging experiments were needed to identify the probable degradation products andevaluate the current hazard. The determination of the rates and pathways of degradation havefacilitated prediction of how the hazard changes with time and altered storage conditions. Also,the work with aged simulated waste contributed to the development of analytical methods forcharacterizing actual wastes. Finally, the results for simulants provide a baseline for comparingand interpreting tank characterization data.
1.1 Objective
The purpose of the Waste Aging Studies project is to elucidate how chemical and radiologicalprocesses have transformed the organic compounds stored in the tanks. Ultimately, the projecthas developed quantitative measures of how aging changes the energetic properties of the wastes.This information directly supports efforts to evaluate the hazard as well as to develop potentialcontrol and mitigation strategies.
1.2 Approach
Hazards posed by uncontrolled exothermic oxidation of organic compounds by nitrate andnitrite relate directly to the energy content and oxidation kinetics of the various organic com-pounds in the waste. Because sampling and analysis of the tank wastes for aging characteristicswere not routine procedures, our approach to assessing the probable current organic content ofthe tanks was to simulate the chemical conditions of the tanks and elucidate mechanisticpathways that would reveal whether the hazards have increased, decreased, or remained constant.Accordingly, this project has used simulants in its studies of chemical aging. The effects ofradiation were simulated by irradiating simulants with an external 60Co y source rather thanincluding radioactive isotopes in the simulant The major radiation sources in tank wastes arel37Cs an(^ 90Sr5 which emit y and p radiation. Because "there are no significant differences in thechemical effects of yand p irradiation" (Meisel et al. 1991a), using an external y source is areasonable, cost-efficient,'and safe alternative to using radioactive simulants. The dose rates usedwere 100 to 1000 times greater than tank waste dose rates so that tests could be performed overperiods of days or weeks rather than years. After irradiation, the disappearance and appearanceof detectable organic species in the simulant and evolved gases were determined.
1.1

1.3 Background
Waste aging is an integral part of the effort to understand and assess the organic-nitratehazard. Each of the 177 waste tanks on the Hanford Site has a unique and uncertain compositionof organic, inorganic, and radioactive elements (Agnew 1996a,b,c). Organic-containing wasteshave been stored in underground storage tanks at Hanford for nearly half a century, during whichtime they have been constantly exposed to radiation andheated to temperatures of up to 140°C(284°F). The wastes contain hydroxide, nitrate, nitrite, aluminate, oxides of transition metalsincluding noble metals, radioactive elements (e.g., uranium, plutonium, cesium, strontium), andmany other substances that may catalyze or promote degradation of the original compounds.Many of the single-shell tanks have been sampled and total organic carbon (TOC) contentsmeasured. However, knowledge of the TOC in a particular storage tank is insufficient to boundthe safety risk because the organic species in the wastes have different energy content and theheats of oxidation vary widely.
The organic compounds that were added to the tanks are divided into two main classes:complexants and solvents. The major organic complexants believed to have been added to thetanks are glycolate, citrate, hydroxyethylethylenediaminetriacetate (HEDTA), and ethylene-diaminetetraacetate (EDTA). Allen (1976) estimated the approximate quantities that were usedat Hanford .
• glycolic acid, 8.8x10⁵ kg• citric acid, 8.5x10⁵ kg• hydroxyemylethylenediaminetriacetic acid, 8.3x10⁵ kg• ethylenediaminetetraacetic acid, 2.2x10⁵ kg.
Lesser amounts of other complexants such as nitrilotriacetate and oxalate were used, but amountsthat actually were discharged to the tanks are not known.
Process solvents of concern that were used in chemical processes and stored in the tanks aretributyl phosphate (TBP), normal paraffin hydrocarbons (NPHs), and methyl isobutyl ketone(hexone). Sederburg and Reddick (1994) examined material balances at the Plutonium-UraniumExtraction (PUREX) Plant from 1955 to 1991 ;(«& their findings indicate that 7.22x10⁵ and1.3 lxl 06 kg of TBP and NPH, respectively, went to the storage tanks. Other processes alsoused organic solvents and organic phosphate extractants, but less is known about the quantitiesthat were added to the tanks. Di(2-ethylhexyl)phosphoric acid diluted with hydrocarbon solventwas used in the waste fractionation and encapsulation process. The reflux solvent extractionprocess used TBP/carbon tetrachloride (Cleveland 1967) and dibutyl butyl phosphonate/carbontetrachloride for extraction solvents (Kingsley 1965). Considerable quantities of hexone were
(a) The amount of organic entrained in PUREX wash waste discharged to the tanks was estimatedto be 2,479 m3 (655,000 gal). Assuming the composition of this waste was similar to the PUREXsolvent (nominally 30 vol% TBP and 70 vol% NPH), then approximately 7.22x10⁵ and1.31x106 kg of the respective solvents would have been discharged to the waste tanks.
1.2

used in the Reduction-Oxidation (REDOX) Plant as both extractant and solvent. For example,65,000 kg (65 metric tons) of hexone were retrieved from one storage tank, treated, and sent•offsite (Gerber et al. 1992).
The evidence suggests that the quantities of organic solvents added to the tanks rival thequantities of complexants. However, the volatile organic solvents have escaped the wastesthrough evaporation, and the phosphate esters have saponified in the alkaline wastes. Althoughthe amounts remaining are not known precisely, a recent topical report by Meacham et al. (1998)points out that during early PUREX operations, the organic wash waste was combined withhigh-level wastes that generated enough thermal heat to boil the tank wastes.
At the start of this project in FY1994, little work had been performed on aging of organicsolvent components. Therefore, an extensive series of aging experiments was begun on simulantsthat contained organic solvent compounds and complexants. One simulant, designated SY1-SIM-94C (Camaioni et al. 1995,1996), contained equimolar amounts of dodecane, EDTA, TBP,dibutyl phosphate. (DBP), methyl isobutyl ketone (hexone), stearate, and citrate hi an inorganicmatrix containing hydroxide, nitrate, nitrite, aluminum hydroxide, and a variety of alkali, alkalineearth, and transition metal cations. Radiolytic yields (G, molecules/100 eV) of gases at 70°Cwere measured for hydrogen (0.11), nitrous oxide (0.17), and nitrogen (0.08). Ammonia was alsoproduced, but its yield was not measured. Concurrent with gas generation, the organic com-pounds disappeared. Identified products included dodecanones, heptadecane, isobutyrate,succinate, oxalate, formate, and glycolate. The TBP was totally consumed in almost every run;its rapid consumption was attributed to alkaline hydrolysis to DBP and butanol.Disappearances of EDTA and citrate were fit to a first-order kinetic rate law, A=Aoe-kD, whereD is the radiolytic dose. The radiation doses necessary to reduce the concentration of EDTA inthe simulant by half were 63 Mrad at 50°C, 51 Mrad at 70°C, and 41 Mrad at 90°C. Citrate wasless reactive, requiring about five times more radiation to reduce its concentration by half.Analyses for hexone, stearate, and dodecane showed significant scatter due to sample variabilitycaused by then* low solubility in the inorganic matrix of the simulant.
Studies were also performed to learn the possible fates of TBP hydrolysis products: sodium •dibutyl phosphate (DBP) and butanol (Camaioni et al. 1996). Aging of sodium butyrate was alsoexamined because butanol may oxidize to butyrate in the PUREX process. The disappearance ofthe subject compounds and appearance of products during radiolysis were consistent withradiolytically induced oxidation reactions. Radiolytic doses in excess of 60 Mrad completelyconsumed butanol and sodium butyrate, producing formate, oxalate, acetate, glycolate, malonate(propan-l,3-dioate), malate (2-hydroxysuccinate), and possibly fumarate ions. These productsaccounted for about 25 and 40%, respectively, of the initial carbon in butyrate and butanolsimulants that had received 100 Mrad doses. A review of the literature found that alkalinehydrolysis of DBP and MBP is probably only a minor pathway for aging of DBP in tankwastes. Radiolysis experiments showed that DBP and MBP degrade by oxidation of the butylgroups.
While the above studies were in progress, energetics arid reactivity tests performed by Fauske& Associates, Inc. (Fauske 1995,1996; Webb et al. 1995; Fauske and Epstein 1995) showed that
1.3

complexants and organic salts pose the greatest risk of propagating reactions. Attempts to ignitesodium nitrate-organic solvent mixtures (Fauske 1995, Webb et al. 1995) in either a ReactiveSystems Screening Tool (RSST) (Creed and Fauske 1990) or in a tube propagation device (Webbet al. 1995) did not lead to propagating reactions, despite the high potential energy content of testcompounds such as dodecane, mineral oil, tributyl phosphate and sodium di-2-ethylhexylphosphate, calcium dibutyl phosphate and sodium stearate. Instead, the solvent componentsvaporized away from the ignition source. Although tributyl phosphate and dibutyl phosphateion have low or negligible vapor pressures, they tend to decompose, liberating hydrocarbon gases,before ignition temperatures are attained. Presumably, the amounts of the complexants and low .molecular weight carboxylic acid salts (e.g., acetate, butyrate, and succinate) have sufficientlyhigh thermal stability to keep them in contact with an ignition source until melt temperatures(~200 to 250°C) are attained and propagating reactions ensue. Accordingly, these findingsfocused bur concern on how aging affects the organic complexants that can sustain propagatingreactions.
In FY 1996, we initiated a study of a neutralized PUREX Acid Sludge (PAS) simulant thatcontained HEDTA, EDTA, glycolate and citrate. Radiolytic aging was studied at 70°C. Thechange in distribution of organic carbon and average energy content was determined as a functionof radiolytic dose. In FY 1997, we did similar experiments at 90°C in the absence of radiation toassess susceptibilities of organic species to thermal degradation, and we extended radiolytic agingstudies to 40 and 90°C with and without O2 gas in contact with the simulant. Section 3 of thisreport describes these results.
In FY 1997, aging studies of the PAS simulant were completed, and new work was startedmeasuring relative reactivities of organic species and their reaction paths as a first step towarddeveloping chemical kinetic models of organic aging. Although an aggressive campaign to speciatea large-number of representative tank wastes is underway to better determine the organic speciesthat are now present, many tanks remain unsampled, and few tanks will be extensively sampled.Consequently, this targeted investigation was designed to elaborate on the behavior of the manydifferent chemical complexants under the diverse storage conditions (temperature and dose rate)to provide the information necessary for the establishment of models enabling quantitativepredictions of future aging and to assess the safety of long-term storage. For example, althoughmuch of the current waste inventory is too wet to sustain propagating reactions regardless of itsenergy content, unsafe conditions could develop as the wastes dry out. Thermally activated agingreactions have significant activation barriers and much of the waste is at relatively lowtemperatures (~25-60°C). Therefore, this investigation focused on the evaluation of the rate ofthe ongoing, temperature independent, radiolytic process.
1.4
2.0 Mechanisms of Organic Aging
Complex mechanisms are involved in the degradation of organic chemicals in tank wastes.This section summarizes some pertinent literature on radiolytically and thermally inducedreactions. For a primer on the wide range of chemistry organic reactions that may occur, thereport by Stock and Pederson (1997) is recommended.
2.1 Mechanism and Kinetics of Radiolytically Induced Organic Aging
Passage of ionizing radiation through the wastes generates highly reactive radicals that eitheroxidize the organic species directly or induce production.of other radicals that subsequentlyoxidize the organic species. Little temperature dependence is observed because the oxidizingradicals react with relatively low energies of activation. Reaction rates are controlled by the rateof generation of radicals, which is controlled by the radiation dose rate, and the selectivity of theradicals for various organic functionalities. Products depend on how the radicals attack theorganic species and on how the resulting organic radicals convert to products, e.g., combinationwith NO, NO2, O2, or oxidation by NC>2~.
2.1.1 Oxidizing Radicals Generated by Radiolysis of Wastes
Pathways for radiolytic aging are expected to involve generation of O~, and NOX radicals that,in turn, attack and oxidize the organic complexants (Meisel et al. 1991a, 1991b, 1993,1997).Although primary intermediates of water radiolysis are e~, H, and OH, Equations 2.1-2.4 showthat these species will convert to NOX radicals in wastes that are high in nitrate and nitrite ions.te)
s-i- (2.1)
H + N02"-> NO + OH" k2 = 7.lxl 08 M-1 s*1 (2.2)
e-aq + NO3" -> NO32- k3 = 9.7x10⁹ M"1 s*1 (2.3)
NO32-(+H2O) ->NO 2 + 2OrT k4 = 5.5xl04s-i (2.4)
Essentially all of the electrons are scavenged by nitrate to make the reducing radical, NO32-. Itis short-lived, dissociating to NO2 in less than 15 usec (Meisel et al. 1997). The pKa for HO is11.8. In highly alkaline solutions, HO may convert to O~ ,which also reacts with nitrite toproduce NO2 but at a rate that is significantly below the diffusion limit.
OH + HO" -> H2O + O" k5 = 1.3x10¹⁰ M-i s'1 (2.5)
O~ + NO2"(+ H2O) -> NO2 + 2 OH" k6 = 3.1x10» M-i s"1 (2.6)
The tank wastes are heterogeneous mixtures consisting of considerable solids and colloidalparticles in contact with solution phases. The possible role that interfacial radiolysis may play isjust starting to be explored (Orlando et al. 1998; Meisel et al. 1998). Fundamental studies ofelectron beams interacting with NaNO3 crystal surfaces in vacuum show that species that desorb
(a) All rate constants from Buxton et al. (1988).
2.1
from the surface are NO, 0 ,02 , and NO2 (Knutsen and Orlando 1997). The dominant species
are NO and O. The O atoms react in part with N03~ to form O2 and NO2. Extrapolating to
NaN03 interfaces with tank waste aqueous supernatants, we expect that O atom would be
scavenged by N02~and NO3" (Warneck and Worzdnger 1988). Therefore, radiolysis of wastes.
containing solid NaN03 is expected to generate the same oxidants as solution phase radiolysis,with perhaps greater yields of NO. NO is not a good oxidant of organic species; however, it is aready scavenger of organic radicals, the products of which subsequently react to produce organiccarbonyl compounds and hydroxylamine. Hydroxylamine decomposes rather rapidly in alkalinesolutions to form NH3, N2 and N2O in varying ratios depending on temperature and presence ofother reactive species, e.g., nitrite ion (Meisel et al 1993; Ashby et al. 1994). To understandradiation chemical effects in solutions containing colloidal oxide particles, Meisel and coworkers(Schatz et al. 1998; Orlando et al. 1998a, 1998b) have studied the radiolysis of silica-loadedaqueous solutions. These studies indicate that small solid particles may absorb ionizing radiationand transfer charge across the particle-liquid interface, initiating chemistry at the interface and inthe surrounding solution. For SiO2 particles, the fraction of energy (ionizing radiation) absorbedby the particles increases with loading. Meisel (see Schatz et al. 1998; Meisel and Camaioni1998; Orlando et al. 1998a, 1998b) suggests that the absorption of radiation by the solid particlescauses electrons to be ejected into the surrounding solution. If the radiation effects were localized,within silica particles, the yield of solvated electrons should decrease. Instead, the yields followthe average sample densities that are calculated from particle concentrations and the density ofsilica. The results have many practical implications: For high-level wastes, they suggest thatheterogeneous systems will generate the same radicals that are observed in homogeneous solution.
Relatively little information exists on the reaction mechanisms and kinetics of NOX radicals
reacting with organic species such as those in tank wastes. While some rate data are available for
0" reactions, information on reaction mechanisms and ultimate products is still limited.
2.1.2 Reactions of 0" Radicals with Organic Species
Reactions of 0~ with many organic species have rate constants that are equal to or greater thanthe rate constant for reaction with nitrite ion. For example, formate, aminoacetate, and imino-diacetate have rate constants of 1.4x10⁹ (Buxton 1969), 5.6x10⁸ (Lati and Meyerstein 1972), and9.1x108 M-i s-i (Bhattacharyya and Saha 1976). Thus, contributions to the degradation oforganic complexants by O~ depend on the concentrations of organic species, hydroxide, andnitrite in a given waste solution.
Monig et al. (1985) studied the oxidation of amino acids by OH. Decarboxylation was adominant reaction path in alkaline solutions with a pH above the pKa of an amino acid zwitterion(e.g., H3+NCH2CO2"). Radiolytic yields of CO2 from glycine were high (G=4.6 molecules/100eV), and from N,N-dimethylglycine, a tertiary amine, yields were nearly quantitative:G=5.4 molecules/100 eV. The mechanism of this reaction is uncertain. One possibility is thatreactions with aminocarboxylates occur by electron transfer from N followed by decarboxylationof the radical zwitterion, R3N+*CH2CO2~. Precedent for such a path is found in the autoxidationof trialkylamines in alkaline aqueous solutions (Chen et al. 1990) and recently observed
2.2

decarboxylations of anilinoacetate radical cations (Su et al. 1997). It is unknown whetherreactions at pH 13 or 14, where O~ becomes dominant, will be as efficient at producing C02 . Itmay be that 0 " reacts by H-abstraction such that oxalate production will increase. Alternatively,the same result may be obtained from the electron transfer intermediate since it mightdeprotonate when formed in solutions that are high in hydroxide (see Figure 2.1)
)NCH2CO2" ^ ^ >CH2CO,fR e" R
OH" \ (R'=H)
Radical R1 . H20Coupling «< )NCHCO2" " < ~ , RNCH2CO2
Products R (R'=H)
\
R N N H + "O2CCO2- "O2CCO2- + ?
R '
Figure 2.1. Pathways, for Oxidation of Aminocarboxylates
2.1.3 Reactions of NOX Radicals
Quenching reactions exist for NO2 and NO, namely recombination and hydrolysis to nitrateand nitrite ion, as shown in Equations 2.7 and 2.8. Overall rate constants for Equations 2.7 and2.8 are about 108 moHs-i (Lee and Schwartz 1981; Park and Lee 1988).
2 N 0 2 -» N2O4 (+ 2 OET) -» N02" + N0 3" + H 20 k7 = 6x10⁷ M-V1 (2.7)
NO2 + NO->N 2 O 3 ( + 2 O I T ) - > 2 N O 2 - + H2O k8 = 1x10⁸ M'W • (2.8)
The oxidation potential of NO (E°—0.35 v) (Stanbury 1989) is not great enough for it tooxidize organic species. NO2 is a much better oxidizing agent (E=1.0 v) (Stanbury 1989).However, to be an effective oxidant of organic complexants, its reactions must be competitivewith the hydrolysis reactions. For example, a radiation field of ~105 rad/h generates ~10-7 M/s ofNO2. In the absence of reducing agents, the steady-state concentration of NO2 will be —10-8 Msuch that the lifetime of NO2 defined by Equation 2.7 is -0.1 s.(a) From this, we conclude thatrate constants for attack on organic species need only be on the order of 1 to 10 M^s-1 for 1% of
(a) Assume rate of generation equals rate of disappearance:rate = 2k7[NO2]2
steady-state [NOJ = ^
2.3

NC>2to oxidize organic species.(a) Furthermore, the fraction of attack is inversely dependent onthe steady-state concentration of NO2, which has a square-root dependence on dose rate. Withdose rates common to single-shell tank wastes (Parra 1994; Stauffer 1997), steady-stateconcentrations of NO2 are much lower, so oxidation of organic species should be more efficient.
Work by Challis and Kyrtopoulos (1979) suggests that NOX dimers may nitrosate amineseven under alkaline conditions, but these reactions generally require relatively high concentrationsof NOX species to favor formation of nitrosating agents, N2O4 and N2O3. With the low doserates common to most tank wastes (Parra 1994; Stauffer 1997), steady-state concentrations ofNO2 should disfavor formation of N2O4 and N2O3.
The reaction kinetics and products of NO2 oxidations of organic complexants are beinginvestigated by Environmental Management Science Program (EMSP) projects (Meisel andCamaioni 1998; Orlando et al. 1998a, 1998b). The experiments contact aqueous alkalinesolutions of organic species with <100 ppm NO2 in N2 gas. Preliminary experiments havesurveyed the reactions of nitrilotriacetate (NTA), iminodiacetate (IDA), glycine, and formate.Products were analyzed using *H and 13C nuclear magnetic resonance spectroscopy and ionchromatography. The results show that NTA degrades via stepwise dealkylation giving mainlyIDA, formate, carbonate, and oxalate. Formate degrades to carbonate when reacted with NO2 butat a slower rate. Competition experiments that measured the initial rates of formate productionfrom complexants and compared them with production of 13CO32- from formate-13C gaverelative reactivities of 19:11:5:1 for NTA:IDA:glycine:formate. The results suggest that theselectivity of NO2 radical is significantly different from 070H. For example, formate is ~3times more reactive than glycine towards O~ and similar to glycine in its reactivity toward OH.Therefore, relative reactivity measurements are one way to show that NO2 plays a role in theradiolytic degradation of complexants in wastes and waste simulants.
Meisel and coworkers have recently measured rate constants of reactions of NO2 and NO2~with organic radicals derived from formate and simple alcohols (methanol, ethanol, z-propanol,and t-butanol). For NO2 radicals, two possible pathways were identified: 1) electron transfer toform nitrite, and 2) radical combination to form nitro compounds (see Figure 2.2). The latterpathway (2) occurs either at the 0 or the N atoms of NO2 with near equal probabilities. Thenitrite esters hydrolyze to produce NO2"". For reactions of the same organic radicals with NO2~,electron transfer is a leading pathway and becomes faster as the pH decreases. This reaction isimportant in tank chemistry because it generates a carbonyl compound (e.g., an aldehyde thatmay proceed to generate H2 thermally) and NO from nitrite. As discussed above, the latterprovides another route for production of N2O.
(a) Assume pseudo-first-order lifetime for attack on organic species is 10 s, i.e., 100 times slowerman self-reaction lifetime. If concentration of species is 0.01 M, then 1/10 = 2k[0.01] and k = 5.
2.4

0H« OH
(CH3)2CHOH (CH3)2COH + CH3CHCH2»
(CH3)2COH + NO2 +HO" (CH3)2C=O + NO2" +H2O
OH
OHb (CH3)CCH2ONO
H,O OH
I + N O 2(CH3)CCH2«
(CH3)CCH2OH + N02"
c ^ OH
(CH3)CCH2NO2
(CH3)2COH + NO2" +H2O - > . (CH3)2C=O + NO + OH"
Figure 2.2. Electron Transfer (a) and Combination (b and c) Reactions of OrganicRadicals with NO2 and NO2~
2.2 Mechanisms and Kinetic Parameters for Thermal Aging
Our discussion of the literature on thermal aging focuses mainly on the work performed atGeorgia Institute of Technology. First, we summarize the mechanistic conclusions, then wereview and make estimates of activation barriers for thermal aging.
2.2.1 Mechanisms for Thermal Aging of Complexants
Workers at Georgia Institute of Technology (Ashby et al. 1994; Barefield et al. 1995,1996)studied the thermal reactions of the major complexants in aqueous solutions. The studies showthat citrate degrades to acetate and oxalate in the presence of hydroxide alone; glycolate andHEDTA degradations require nitrite and are catalyzed by aluminumand hydroxide ions; andEDTA is essentially inert. The reaction of citrate produced little gas and was not catalyzed byaluminate. Therefore, the reaction can be formulated "classically" as a "reverse Claisen" reaction,which is shown is Figure 2.3.
HO CO2"
CO,OH" O
Q .OH"
'co2-
C H 3 C O 2 ' + ~O2C—CO2
Figure 2.3. Mechanism for Base-Catalyzed Decomposition of Citrate Ion
2.5

The overall reaction (Equation 2.9) shows that 2 C-C bonds are converted to 2 C-H bonds and a
C=O bond. Consequently, the enthalpies of the organic species change little.
HOC(CO21(CH2CO2~)2 + H 2 ° + OH" -> 2 CH3CO2" + "O2CCO2~ (2.9)
The observations of glycolate and HEDTA oxidations lead to conclusions that the mechanisminvolves heterolytic decomposition of the corresponding nitrite esters.
ROH + NO2~ =^= OH" + RONO (2.10)
RONO-* products (2.11)
Aluminum hydroxides are proposed to complex with nitrite to generate a nitrosyl transfer agent,e.g., [(HO)3A1ONO]~. The esters of HEDTA and glycolate then undergo concerted fragmenta-tion to NO", CH2O, and imminium ion, R2N+=CH2 (from HEDTA) or CO2 (from glycolate).
R2NCH2CH2ONO -> R2NH + CH2=O + NO" (2.12)
ONOCH2CO2" -> NO" + H2C=O + CO2 (2.13)
By this mechanism, H2 yields are strongly dependent on the dynamics of the caged species.
Decomposition of formaldehyde in strong base produces H2 and formate. However, to explain
less than stoichiometric yields of H2, they suggest that NO" adds to formaldehyde competitively
with cage escape. The adduct then produces formate and hydroxylamine; the latter decomposesto nitrogenous gases. The imminium ion is competitively trapped by hydroxide and nitrite.These reactions produce R2NCH2OH and R2NCH2ONO, which may degrade to either formateand H2 or the nitrogenous gases N2O and NH3.
The oxidation kinetics are complex. Evidence for inhibition by O2 and autocatalysis has beenobserved. No satisfactory explanation of the effects of O2 have been advanced. The auto-catalysis was attributed to generation of nitrite esters and N-nitroso compounds that form fromHEDTA fragments. These compounds may transfer the nitrosyl group to HEDTA, as shown inEquations 2.14 and 2.15.
R2NCH2ONO + HEDTA -» R2NCH2OH + R2NCH2CH2ONO (2.14)
R2NCH2ONO + HEDTA + H2O ->
R2NCH2OH + R2N+(NO)CH2CH2OH + OET (2.15)
The investigators also pointed out that aminium ions (Keefer and Roller 1973) have beenobserved to react with nitrite to produce formaldehyde and N-nitrosamine, possibly via thenitrite ester (the second step in Equation 2.16 is not necessarily a unimolecular reaction).
R2N=CH2 + ONO" -» R2NCH2ONO -> R2N-NO + CH2O (2.16)
Ashby et al. (1994) suggest that N-nitrosomines may act as nitrosyl transfer agents ordecompose producing NO", aldehyde, and a primary amine (Equation 2.17).
2.6

CO2CCH2)RN-NO + O H " ^ R N H 2 + "O2CCH=O+NO" + H2O . (2.17)
2.2.2 Activation Barriers for Thermal Aging of HEDTA and GlycolateFigure 2.4 shows a potential energy diagram for Equation 2.10. The equilibrium constant,
Kio, for Equation 2.10 is ~10-u such that AG=15 kcal/mol for production of RONO from nitritein alkaline conditions.® Rate constants for hydrolysis of primary alkyl nitrite esters (reverse ofEquation 2.10) are on the order of 5x10⁻⁴ L/mol/s (Oae et al. 1978; Challis and Shuker 1979).Thus, the uncatalyzed rate constant for producing nitrite esters under alkaline conditions is~1O-14 L/mol/s at 35°C. The entropy change for ester production is negative, such that AH~10kcal/mol for ester production in alkaline solutions. Therefore, Ea for uncatalyzed Equation 2.10is ~26 kcal/mol. Clearly, this reaction is prohibitively slow and probably rate-controlling in theabsence of catalysts. If Al catalyzes Equation 2.10, then Ea>10 kcal/mol.
o
"reg.
RCH2ONO + OH-
RCH2OH + NO2
Reaction Coordinate
Figure 2.4. Potential Energy Surface for Nitrosation of Primary Alcohols by Nitrite Ion
Barefleld et al. (1995) have estimated Ea for glycolate and HEDTA decomposition fromkinetic analyses of H2 gas production rates. Their analysis suggested Ea for glycolate might be aslow as 11 kcal/mol and Ea for HEDTA could be as low as 16 kcal/mol. The magnitude of thesebarriers is consistent with Equation 2.10 being rate-controlling, provided that catalysis by Alsubstantially reduces the 16 kcal/mol barrier for hydrolysis of nitrite esters and rates for Equa-tion 2.12 are faster than rates for the reverse of Equation 2.10. .
Assuming mechanisms proposed by Barefield et al. (1995), we estimate from thermochemicaldata that Eas for Equation 2.11 are on the order of 8 kcal/mol for glycolate and 22 kcal/mol for
(a) The equilibrium constant for reaction of primary alcohols with nitrous acid is ~1 at 0 °C (Airedet al. 1982). Combining this with Kw and Ka for nitrous acid gives K for forming nitrite esters inalkaline conditions.
2.7

HEDTA. Given the magnitude of these barriers, if Equation 2.10. is rate limiting, then theArrhenius A-factor for Equation 2.11 would need to be substantially larger than the A-factor forEquation 2.10. Because Equation 2.11 is a unirnolecular reaction, we may expect larger A-factorscompared with the reverse of Equation 2.10. However, information is insufficient to estimate themagnitudes of the A-factors. If barriers are as low as Barefield et al. (1995) estimate, thenlifetimes of glycolate and HEDTA at 60°C would be on Hie order of a few years, so little of thesecompounds should now be present in tank wastes, provided that optimum levels of catalyst andhydroxide are present. Because samples from several tanks (e.g., U Farm tanks) have been foundto contain significant glycolate and HEDTA, we must conclude that either higher barriers pertainor temperature and concentrations of catalysts and hydroxide are far from optimum for thermaldegradation in these tanks. The latter case may well pertain and perhaps it could be establishedwith relevant waste characterization data. On the other hand, if nitrite ester formation (Equation2.10) is not rate-limiting, then kobserved = Kiokn such that Arrhenius temperature dependenciesare the sum of the free energy for nitrosation (Equation 2.10) and Ea for thermal degradation ofnitrite ester (Equation 2.11), i.e., 15 kcal/mol + Ea. Therefore, we estimate Eas of 23 kcal/mol forglycolate and 37 kcal/mol for HEDTA would apply when Equation 2.11 is rate-controlling.(a)These estimates probably represent upper limits for the overall reactions. They are comparableto barriers measured for gas evolution from these compounds (Ashby et al. 1994) as well as fromtank wastes (Person 1996; Pederson and Bryan 1996) and are qualitatively consistent with the .relative reactivities observed by Barefield et al. (1995).
In conclusion, mechanisms for thermally initiated oxidations are not well understood andbarriers are uncertain. These factors severely limit attempts to quantify the extent of aging due tothermal oxidations.
2.3 Synergistic Effects of Radiation on Thermal Reactions
Meisel et al. (1993) observed that preirradiation of waste simulants containing HEDTAyielded more gas from thermal treatment than unirradiated simulants. We have observed that
(a) Eas derived using thermochemical cycles; AH°s estimated from heats of formation data (Liaset al. 1988) and group additivity schemes:
ONOCH2CO2H==NO + CH2OH + CO2 AH° = 40 kcal/molCH2OH = CH2=O + H+ pKa = 10.7 (Schwarz and Dodson 1989)
CO2 ' + H+ = CO2H pKa = 1.4 (Schwarz and Dodson 1989)ONOCH2CO2H = ONOCH2CO2' pKa ~ 3.8 (assigned; same as glycolic acid)
CH2O~= CH2O + e" E° = -1.81 v (Schwarz and Dodson 1989)NO + e~ = NO' E° = -0.4 v (Schwarz and Dodson 1989)
Me2NCH2CH2ONO = Me2NCH2 + CH2O + NO AH° = 38 kcal/molMe2NCH2 = [Me2N=CH2]+ + e E° = 1.1 v (Wayner and Griller 1990)
e" = NO" E° = -0.4 v(Stanbury 1989)
2.8

radiolysis and reactions of NO2 cause deamination and decarboxylation of complexants, e.g.,NTA —> IDA, glycine, formate, and oxalate. It is probable that, in addition to reactions in Fig-ure 2.1, nitrosation reactions may also occur (Equations 2.10,2.11 and 2.13-2.16) because oxi-dation of carbon-centered radicals by NO2 can produce nitrite esters (see path b, Figure 2.2).(*0Nitrosomines could accumulate if produced at low temperatures and then degrade to gaseousproducts (Smith and Loeppky 1967) when heated.
(a) Personal communication with Dan Meisel, Argonne National Laboratory.
2.9

3.0 Relative Rate Constants for Radiolytic Aging of Organic Species
This section reports on studies of the radiolysis of organic complexants and related com-pounds in alkaline nitrate/nitrite solutions to elucidate reactivity and reaction paths. Our goalswere to develop models for understanding and interpreting tank waste speciation results and toprovide capabilities for predicting how TOC and energy content might evolve during interimstorage. Reactivities of the complexants and several of their degradation products were measuredrelative to formate oxidation by irradiating binary mixtures of an organic compound and r e -labeled formate in alkaline nitrate/nitrite solution. Conversions of organic species were measuredby 13C and !H nuclear magnetic resonance (NMR) spectrometry and corroborated by ion andliquid chromatography. Products were identified, as well, to provide reaction path information.In addition to binary competition experiments, oxidations of formate and glycine in the absenceof other organic species were performed and modeled kinetically to obtain estimates of the •absolute rate constant for reactions of NO2 with these species and the rate constant of anotherkey reaction, oxidation of NO32- by NO2~. This effort was substantially aided by closecollaboration with EMSP projects on fundamental aspects of radiolytic effects in wastes, "TheNOX System in Nuclear Waste" and "Interfacial Radiolysis Effects in Waste Speciation."
3.1 Reactivities of Organic Complexants Relative to Formate
Formate degrades cleanly to carbonate during y radiolysis. For this reason, we chose tomeasure reactivities of other organic species relative to formate ion. i3C-Formate w a s u s e ^ toavoid interference from formate and carbonate produced by degradation of other organic species(e.g., see Figure 4.1). Figure 3.1 shows 13C NMR spectra of the formate/carbonate region beforeand after radiolysis. The ratio of the carbonate peak area to the formate peak area equals theconversion of formate to carbonate. Thus, for binary competition between an organic species andformate-i3C, the relative reactivity of a species S is given by Equation 3.1:
InsF
In 1-
[S],
[ I3co32"] t 1
[ H 1 3 C O ; ] O
(3.1)
where S is the organic species that competes with i3C-formate for radiolytically generatedoxidants, and subscripts o and t designate concentrations at the start of irradiation and after time tin the y field. Scouting experiments were performed in which two ratios of EDTA/formate wereirradiated for 5-11 days in a y-field of 8x10⁴ rad/h. Figure 3.2 shows typical 1H NMR spectraobtained from unirradiated and irradiated samples. Products that appear in the irradiated sampleare carbonate-i3C from formate-i3C, formate-i2C, and a variety of other products from EDTA.
3.1

7MRad
5MRad
2MRad
OMradH«CO3-
| i i n I I I I | I I I I > u i | i i i > I I I I | I I I I i i u p i u n i i | u i l I I I I | I I I I | I I I > | U > I | J I I I | I I I I i i i i | i i n i i i i iii* ife 3So lit tie 1*4 ik lio ids tie PPH
Chemical Shift
Figure 3.1.13C NMR Spectra of 0.024 M Sodium Formate in 0.1 M NaNO3,0.03 M NaNO2,2 M NaOH before and after y Radiolysis
>N-CHz-CO2-
H-12CO2-
S.S 0 .7 Q.G B.S 8.4 Q.3 B.2. ppi« 3.8 3.6 3.4 3.2 3.0 Z.S 2.S ppn
Figure 3.2. IH NMR Spectra of Unirradiated (top) and Irradiated (bottom)EDTA/Formate-i3C Solutions
3.2

Figure 3.3 shows the observed dependence of radiolytic yield, G(13CC«32-), on initial formateand EDTA concentrations (see Table A.1, Appendix A for data). Note that in the absence ofEDTA, G(I3CO32-) is greater at 0.1 M formate than at 0.05 M formate. This behavior isconsistent with a mechanism in which oxidation of organic species by radiolytically generatedradicals occurs in competition with NOX disproportionation reactions shown in Equations 2.7and 2.8 (Section 2.1.3). Also, at both initial concentrations of formate, GO3CO32-) decreases asinitial EDTA concentrations increase from 0 to 0.1 M. This behavior shows that formate andEDTA do compete for the radiolytically generated oxidants.
From measurements of the conversion of EDTA and formate, we obtain a relative rateconstant, kEDTA/kfbimate = 5 ± 2, using Equation 3.1. The uncertainty in kEDTA f̂ormate is largerthan we expected, with values ranging from 2.1 to 9.3. We estimate uncertainties in measure-ments of EDTA, formate, and carbonate concentrations are - 5 % . Interestingly, we observed thatthe relative rate correlated linearly with the extent of EDTA conversion: the higher the conver-sion the greater the relative rate constant. Also, the relative rate and extent of conversion showeda general correlation with the initial concentration of EDTA: lower concentrations gave higherconversions and higher relative rates (see Figure 3.4). The origins of these effects are not fullyunderstood; however, they may be a manifestation of two or more oxidizing radicals withdifferent selectivities contributing to the oxidation of EDTA, e.g., O~ and NO2.
> 1.00)
• 0.1 M Formate-isc
O 0.05 M Formate-13C
(D 0.00.00 0.02 0,04 0.06 0.08 0.10 0H2
EDTA (M)
Figure 3.3 Dependence of Radiolytic Yield of Carbonate from Formate versus InitialEDTA Concentration in a Solution of 3.75 M NaNO3,1.25 M NaNO2, and2 M NaOH; dose rate = 8x10⁴ rad/h; irradiation times from 5 to 11 days
3.3

9 -8 -7 •6 •
£ 5 -X
4 -3 -2 •1 -0 -
' ••
• •
1 U •
9 -8 •
7 -6 •
£ 5 -X 4 -
3 -2 -1 -n .
••
• •• •
' 0.00 0.50 1.00 0.00 0.05 • 0."EDTA conversion Average [EDTA]
Figure 3.4. Reactivity (Equation 3.1) of EDTA Relative to FormateCorrelates with Average EDTA and Conversion of EDTA; key: (•) 0.05 Mformate; (•) 0.1 M formate
Subsequent experiments were run to measure relative reactivities of other organic speciesunder conditions that convert 30-70% of organic compound. The results are summarized inTable 3.1. The table lists starting concentrations, average fractions of formate-i3C and organicspecies remaining after irradiation, and average krei. Standard deviations in the averages and
number of measurements are also listed. The values Co and Co in Table 3.1 are the concen-trations of species (superscript S) and l3C-formate (superscript F)before irradiation.
The reactivities in Table 3.1 show that glycolate and nitrogen-containing complexantsHEDTA, EDTA, and their fragments are more reactive than formate by factors of 5 to 20.Compounds such as citrate and acetate are slightly less reactive than formate. Preliminary workon DBP, butyrate, and succinate suggest these compounds have reactivities similar to acetate andcitrate. The reactivities of ethylenediaminetriacetate (ED3A) and ethylenediaminemonoacetate(EDMA) have not been measured, but by analogy to related compounds, similarly high reactivityis expected.
3.2 Kinetic Model for Radiolytic Oxidation
In this section we describe the development of chemical kinetic models for radiolytic oxi-dations of formate and glycine in solutions of nitrate, nitrite, and hydroxide. These models weredeveloped to gain fundamental insight on and advance the understanding of radiolytic aging oforganic complexants in waste solutions. Formate is the simplest system to model because onlytwo one-electron transfer steps are required to convert it to carbonate. No oxalate or otherintermediate organic products are produced. Formate is also a product of organic aging.
3.4

Table 3.1. Relative Rate Constants for Disappearance of Organic Species inNitrate/Nitrite/HydroxideOO Solutions during yRadiolysis
Specie
u-EDDA
s-EDDA
s-EDDA(c),
IDA
NTA
NTAGO
HEDTAto
HEDTA
HEDTA
Glycine
Glycolate
Glycolate "
EDTAW
EDTA
EDTA
Formate
Citrate®Citrate
Citrate
Acetate®
Acetate
c;0.0120
0.0206
0.0797
0.0486
0.0164
0.0546
0.0406
0.0395
0.088
0.0549.
0.0401
0.12
0.0403
0.0200
0.0499
0.0047
0.0047 .
0.506
0.0078
<
0.0900
0.0991
0.100
, 0.133
0.127
0.100
0.102
0.103
0.10
0.111
0.101
0.1
0.100
0.103
0.0526
0.0670
0.0670
0.0530
0.0995
13.0 ±0.3
13±2.
10±l
12 + 3
9.8 ±0.5
7±2
19±3
14+1
5.4 ±0.4
7±16.1 ±0.4
4±210±2
5.7 ±0.7
5±2Wl(e)
0.4 ±0.2(0
0.6 ± 0.5
0.7 ±0.1
0.24 + 0.05®
0.7 + 0.1
(3)
(3)
(4)
( 3 ) .
(3)
(4)
(3)
(3)
(3)
(3)
(2)
(3)
(4)
(3)
(13)
(4)
(3)
(3)
(3)
(3)
(a) In 3.75 M NaNO3, 1.25 M NaNO2', 2 M NaOH and at 20°C unless noted.Concentrations of S and 13C-formate measured by IH NMR and 13C NMR,respectively.(b) Number of measurements in parentheses.(c) In 2 M NaNO3, 2 M NaNO2, 2 M NaOH, and at 25°C.(d) From experiments in Figure 3.3 and Table A.I , EDTA concentrations are average ofIPC and IH NMR measurements.(e) Defined value.
. (f) Based on amount of i2C-formate produced.
3.5

Glycine is the simplest nitrogen-containing complexant It is also a product of organic aging.Meisel et al. (1991a) described a chemical kinetic model for radiolysis of alkaline solutions ofnitrate and nitrite. We adapted this model by adding reactions necessary to describe the oxidationof formate. Once this was accomplished, we added reactions for glycine oxidation.
3.2.1 Oxidation of Formate
Solutions containing i3C-formate, nitrate, nitrite, and hydroxide were irradiated to obtain datafor developing the quantitative model for radiolytic aging. The i^C-formate w a s u s e d so atmos-pheric carbon dioxide would not interfere with measurements of carbonate yields determined by13C NMR spectroscopy. The concentration of formate was varied from 0.03 to 1.0 M (no otherorganic species were added). Figure 3.5 shows how the radiolytic yield of carbonate varied withformate concentration. Most experiments were run in 3.75 M NaN03,1.25 M NaNC>2,2 MNaOH, although the Ferrocyanide Project (Lilga et al. 1996) had reported results for experimentsin which nitrate and nitrite were 0.1 M and 0.03 M, respectively. These data are represented bythe "O" data point in Figure 3.5. The results depicted in the figure are tabulated in Table 3.3(also in Appendix A, Tables A.3 and A.4).
2.5
o©
•300"oS
n
8
2.0 -
1.5 -
1.0 -
-
0.5 -
o0.0
Formate Concentration (M)
Figure 3.5. Measured and Modeled Radiolytic Yield of Carbonate (G, molecules/100 eV)Versus Formate Concentration: (•) experiment with 3.75 M nitrate, 1.25 Mnitrite, and 2 M hydroxide; (O) experiment with 0.1 M nitrate, 0.03 M nitrite,2 M hydroxide; (X) model
3.6

Table 3.2. Kinetic Model for Radiolytic Aging of Formate in Solutions Containing Nitrite,Nitrate and Hydroxide
Eq. No.12345678910111213141516171819202122232425262728
Reactant(a)
NO32-NO32-
OHOHOHHH0 "0"NO2
CO2*
CO2-
CO2-NO2
N2O4
N2O4NO2
N2O3
N2O3
NO"N2O2"N2O2-N3O3-
He"(aq)
+ H20 -»+ NO2"(+H2O) ->+ OH- - *
+ NO2" ->+ HCO2" ->
+ NO2" ->+ HCO2" ->+ NO2" ->+ HCO2" -»+ HCO2" -»
+ NO2" ->+ NO2 ->
• +NO ->+ NO2 -»
->(+2OH1 ->+ NO ->
->(+2OH1 ->+ NO . ->
->+ NO ->
-»+ OH- -^+ NO3- -»
ProductsNOs2-OHHN02 +NO +0" +NO2 +
• C02" +NO +C02" +N02 +C02" +CO2" +
C02 +N02" +C02 +N2O4
NC^ +NO^ +
N2OsNO2 +NO2" ' +N2O2-NO" +N3O3-N20 +
e"(aq)NO32-
20H"NO3-(+2OH")H20OH"H20OH"H2
OH"OH-N02"NOC02
NO"
N02
NOs"
NO
N02"
NO
NO2-
k(s-l)4.9x10-75.2x10-71.0x10-75.5x104
2.0x1041.3x1010
1.0x10104.1x1091.6x1092.4x1083.1x108
1.4x109104.3x106
3.0x1092.9x1094.5x1086.7x1031.0x103
1.1X1098.0x1045.3x1021.7x1096.0x1044.9x106
8.7x1012.0x1079.7x109
Notebbbcd,efcc
c,gcccefi
jkkkkkkkkkkd,hc
(a) Reactants appearing in the rate law for each reaction step are listed; species in parentheses areshown for clarity but are not included in the rate law.(b) Assigned based on G(NO32-) = 2.9, G(OH) = 2.9, G(H) = 0.4 (see Meisel et al. 1991a,b;Buxton et al. 1988).(c) Buxton et al. 1988.(d) D. Meisel, unpublished result, k<5xl(H M-is-1.(e) value adjusted to fit data in Table 3.3.(f) Han and Bartels 1990.(g) Mezyk and Bartels 1997.(h) D. Meisel, unpublished result.(i) assigned same rate constant as reaction 15.0) Czapski et al. 1994.(k) Neta et al. 1988.
The yield of carbonate was strongly dependent on nitrite and formate concentrations. With1.25 M nitrite, the yields of carbonate increased with increasing initial formate concentration,leveling off at G-1.8 molecules/100 eV (see Figure 3.5). When both nitrite and initial formate
3.7

concentrations were low (0.03 M), the yield was comparable to those obtained when formateconcentrations were high. This behavior is well reproduced by the mechanistic kinetic model inTable 3.2. It includes the dominant reactions for e", H, HO, 0", NO, and NO2, a reaction offormate ion with NO2, and a reaction of NO32- with NO2". Evidence for this last reaction hasnot been observed previously. However, recent experiments by Meisel et al.(a) show that it isthermodynamically favorable but occurs with a rate constant of <5xlO4 M-is-*. The fit to thedata shown in Figure 3.5 was obtained with rate constants of 10 M-is-i for NO2 attack onformate and 2xlO4 M-is-1 for reaction of NO32- with NO2". Figure 3.6 illustrates the timedependence of NO and NO2 as they approach steady state conditions in the radiolytic oxidationof formate ion in waste simulants.
Notice how different nitrite and formate concentrations affect the steady-state concentrationsof NO and NO2. With the high nitrite concentration, the steady-state concentration of NO issignificantly higher, and that of NO2 is somewhat smaller. In either case, the concentration ofNO under the reaction conditions is generally an order of magnitude greater than the concentra-tion of NO2, so cross-termination dominates over self-termination (Equations 18 and 21, respec-tively, in Table 3.2). Both reactions lead to a decrease in the oxidation efficiency and result inyields of products that are much less than stoichiometric.
1 M Formate 0.03 M Formate1.0E-04 =
o
c
1.0E-05 =
1.0E-06
1.0E-07 =
1.0E-08
1.0E-09
N0_
0.05
Time (h)0.1 0
1.0E-04
•:1.0E-05
• = 1.0E-06
•:1.0E-07
•:1.0E-08
1.0E-090.05
Time (h)
Figure 3.6. Time Dependence of NO and NO2 Radicals Predicted by Kinetic Modei forRadiolytic Oxidation of 1 M Formate in 1.25 M NaNO2,3.75 M NaNO3,
(a) Unpublished result.
3.8

2 M NaOH (left) and 0.03 M Formate in 0.03 M NaNO2, 0.1 M NaNO3,2MNaOH(right)
Consistent with finding no experimental evidence for conversion of formate to.oxalate ion, themodel predicts steady-state concentrations of CC>2~ (<10-i2 M) that are too low to producedetectable amounts of oxalate ions by self-reaction. Even the cross reactions of CC>2~ with NO orNO2 do not appear to compete with its reaction with nitrite ion (Equation 14 in Table 3.2).Although reaction of NO with CO2" is fast, ki6 = 3x10⁹ M-I s-i (Czapski et al. 1994), NOcannot compete when NO2~ ion is present in mM concentrations. For example, when [NO2"1 =0.03 M, the model calculates that the steady-state concentration'of NO is ~ 6x1 (H M such thatreaction of CO2" with NO2" is still 70 times more favorable than reaction with NO (Equation 3.2calculates the relative rate (nVne) for Equations 14 and 16 in Table 3.2).
r14 k u [ N b ; ] 4.3 xlO6 [0.03]
'16~ k16[NO] ~ 3 x l O 9 [ 6 x K T 7 ] C" }
Therefore, NO serves mainly as a trap for NO2. This result is consistent with observations thatN2O was not radiolytically generated from waste simulants containing only formate ion (Meiselet al. 1993). If NO were to react with CO2~, it would generate NO" (Czapski et al. 1994), whichis a precursor to N2O (see Equations 23-26 in Table 3.2).
The relative amounts of CO32- produced by each oxidizing radical estimated from the modeland experimental data are listed in Table 3.3: The highest fraction of attack (~51%) by NO2occurred when the nitrite concentration was high and the formate concentration was low. • Theseconditions favor conversion of O", OH, and H to NO2. High formate or low nitrite favor O~attack on formate. Direct attack of H on formate ion (and glycine) is minimal; only at very highorganic concentrations, > 0.75 M, does direct attack contribute to more that 1% of the conversionyield. This result is consistent with observations by Meisel et al. (1993) that irradiation of wastesimulants containing formate ion as the only organic species did not generate significant amountsofrkgas.
The observation that O~ is a significant contributor to formate oxidation even at 1.25 M NO2~suggests that it is important for understanding the relative reactivities listed in Table 3.1. Clearly,the observed relative reactivities are a composite of O" and NO2 reactivities and therefore do notrepresent true reactivities of NO2. However, because formate is one of the more reactive com-pounds toward O~, the relative reactivities in Table 3.1 may qualitatively represent the reactivityof NO2. For example, EDTA probably is as reactive as formate toward O". Because relativereactivities as high as 10 were observed in our competition experiments (Figure 3.4), NO2 mustbe significantly more reactive toward EDTA than it is toward formate. Similarly, glycine is aboutthree times less reactive than formate toward O~ (Neta and Schuler 1975). Since we observed arelative reactivity of ~7 (Table 3.1), NO2 reaction with glycine must be faster than reaction withformate.
3.9

Table 33. Total Yield and Fractions of Carbonate Produced from Radiolytically GeneratedSpecieste)
Formate, M
0.05
0.1
0.2
0.4
0.8
1
0.03(b)
G(CO32-)molecules/100 eV
Expt
0.5
0.8
1.3
1.7
2.0
2.0
2.1
Model
0.6
0.8
1.2
1.7
1.8
1.8
2.2
% of Carbonate Yield by Oxidizing Species
H
0
1
1
1
2
2
1
OH
34
5
7
13
15
1
O"
46
61
62
64
72
74
96
NO 2
51
35
32
27
14
8
2
(a) Conditions: 1.25 M nitrite, 3.75 M nitrate, 2 M hydroxide; dose Rate ~0.5Mrad/h.(b) 0.03 M nitrite, 0.1 M nitrate, 2 M hydroxide, dose rate -0.1 Mrad/hr (Lilga et al. 1996).
3.2.2 Oxidation of Glycine
Figure 3.7 shows results for radiolytic aging of i3C-glycine in 2 M NaOH, 2 M NaNO3, and2 M NaNO2- An equimolar mixture of 1- and 2-labeled glycines was used to avoid C-C coup-lings (doublets) in the glycine resonances. Furthermore, the appearance of any C-C couplings inoxalate would indicate that combination of radicals derived from two glycines. The spectrum isclean, showing conversion of glycine to three products: oxalate, formate, and carbonate.
The radiolytic yield for disappearance of glycine was G = -1.3 molecules/100 eV. This yieldis more than double the yield for disappearance of fonriate under analogous conditions (see Table3.3 where Gcarbonate= -GformateX suggesting glycine is more reactive than formate and consistentwith relative reactivity measurements in Table 3.1. No doublets are observed in the resonancesof oxalate; therefore, we rule out oxalate ion being formed from intermediates along the pathwaysthat produce carbonate and formate ions and conclude that glycine degrades to the three productsby competing pathways (Equations 3.3a and 3.3b):
H2NCH2CO2-->-O2CCO2~ (3.3a)
H2NCH2CO2" -> HCO2"+ CO32- (3.3b)
3.10

O2C13CO2"
H13CO2" 13 C o 3 2-
178 176 174 172
H2N13CH2CO2-
200 150 100 50 0 ppm
Figure 3.7. 13C NMR Spectrum of Equal Parts l-i3C-Glycine and 2-13C-Glycine in a Solution of 2 M NaNO3,2 M NaNO2, and 2 M.NaOHafter a 16.8 Mrad yDose at 22°C
The partitioning of products by these pathways may be caused by different oxidizing inter-mediates or the same one, i.e., O~ and/or NO2. We did not determine the fate of amino nitrogen inthese experiments; it is reasonable that it goes to ammonia, although it could be oxidized to N2 orN2O.
Figure 3.8 shows the 13C NMR spectrum of glycine simulant solution that was irradiated (29Mrad) without NaNC>2 present. This result is interesting in that different distributions of thethree principal products are obtained along with other products. The other products appear togive doublet resonances indicating combination and addition reactions have occurred. Signifi-cantly higher conversions of glycine were observed; for example, a 7.8-Mrad dose gave 50%conversion of glycine for a G ~ -3.7 molecules/100 eV, and nearly 70% of the glycine carbon wentto other products. Oxalate, formate, and carbonate were obtained in a 28:31:19 distribution.Since only 2-13C-glycine was used in this experiment, the appearance of carbonate-^C requiresthat either formate or oxalate is further oxidized or that glycine is oxidized directly to carbonate:
H2N13CH2CO2" -> 13CO32- + CO3
2- (3.4)
When the nitrite ion concentration is low, as it was in this experiment (Figure 3.8), only the
radiolytically generated electrons will produce NO2 radicals; conversion of 0" radicals to NO2
radicals (Equations 2.1 and 2.6) will be inefficient. Instead, 0" radicals will attack the organic
3.11
-o2c13co2"H13CO2"
150 100 50ppmFigure 3.8. 13C-NMR Spectrum of a 2-i3C-Glycine Simulant Solution after a
29 Mrad Dose at 25°C; solution initially contained 0.1 M 2-"C-glycine, 2 MNaNO3 and 2 M NaOH
species that are present. Since O~ reactivity with formate is much greater than the reactivity ofNO2 with formate, it is probable, that the carbonate-i3C in this experiment derives from O~ attackon formate.
The appearance of other products and the greater reactivity of formate in this experimentunderscores the major role that NO2" plays in controlling the course of radiolytic reactions.Apparently, NO2" not only converts OH and O" to NO2 (see Equations 2.1 and 2.6), it oxidizesorganic radicals to products. Meisel and coworkers at Argonne National Laboratory recentlymeasured rate constants for reactions of some organic radicals with NO2~. The rates are fastenough to allow reactions to compete favorably with organic radical combination/disproportion-ations reactions. While NC>2~ appears beneficial for clean oxidation of complexants, it suppressesthe radiolytic yield by oxidizing NO32-, a precursor for up to 50% of NO2. Also, its reductionproduct, NO, combines with NO2 to give N2O3, which hydrolyses rapidly in alkaline conditionsto NO2~ (Park and Lee 1988). The NO radical combines with organic radicals giving rise tooxidized organic products and reduced forms of nitrogen, such as hydroxylamine, which give riseto N2, N2O and NH3 (Meisel et al. 1993; Barefield et al. 1996).
To model the results for oxidation of glycine, we expanded the formate kinetic model(Table 3.2) by adding the reaction steps shown in Table 3.4. The model assumes the formationof a common intermediate, I, that partitions to formate and CO32- via aminomethyl radical (A)
3.12

and to oxalate via glycine radicals (G).OO When the model was run using literature rate constants
for reactions of H, OH and 0" with glycine (steps 29-31 in the table) and the rate constant forstep 32 set to 0, it underestimated the conversion of glycine. Addition of IC32 provided both animproved fit to the experimentally observed glycine disappearance as well a reasonable fit toproduction of formate, oxalate and carbonate yields. Figure 3.9 shows model results for twoexperiments in which solutions containing 2-i3C-glycine, NO2"", NO3", and OH" were irradiatedfor 9-30 hours in a y field of 0.5 Mrad/h. The second experiment (Figure 3.9) had formate-i2Cpresent in the solution initially. Numerical results are listed in Appendix A (Table A.5). Glycineconversion was less in this experiment because, as the model shows, formate reacted with afraction of the O~ and NO2 radicals.
Table 3.5 summarizes results obtained at different nitrite concentrations and compares themwith model results. As previously observed hi the formate studies, O~ dominates the oxidationpathways when the nitrite concentration is low.(b) However, when nitrite is high, NO2 is thedominant oxidant of glycine. This result is consistent with the selectivity observed in competi-tion experiments with glycine and formate-i3C (see Section 3.1 and Table 3.1). The conversion
Table 3.4. Kinetic Reaction Steps Added to Formate Kinetic Model to Model GlycineOxidation in Solutions of Nitrate, Nitrite,, and Hydroxide
Eq.2930313233343536
GlyGlyGlyGlyI1AG
Reactants+ H+ O"(++ OH+ NO2 (
+ OH"+ NO2"+ NO2"
H2O) ->-)
+ OH1 ->-»
->
ProductsG +1 +1 +1 +A +G +NO +C2O42- +
H22OH"H2ONO2-(+H2O)CO32-H2OHCO2"NO
k4.5x1075.6x108
5.3x10⁹ •703x1065x105106106
Note• a
b
cd
eeff
(a) Assigned same rate constant as glycolate ion (Buxton et al. 1988).(b) Neta and Schuler 1975.(c) Lati and Meyerstein 1972.(d) Varied to provide best fit to observed data.(e) Set to reproduce observed ratio (3:1) of formate to oxalate.(f) Assigned same magnitude as step 14 in Table 3.2.
(a) These steps are a simplified version of Figure 2.1, which shows the glycine zwiterionpartitioning to three radicals: H2NCH2«, H2NCH(«)CO2", and •HNCH2CO2" The last radicalmay partition to formate and carbonate or to oxalate products. Therefore, including pathways inthe model to A and G radicals is sufficient to model product yields.(b) We did not model results obtained without initial nitrite because additional steps involvingtermination reactions of organic intermediate radicals are needed.
3.13
0.08 -0.08
0.0010 20Time (h)
30 0 10 20Time (h)
30
Figure 3.9. Results of Kinetic Model and Experiments for Radiolytic Degradation of Glycine:(left) 2-i3C-glycine in 1.26 M NO2", 3.76 M NO3" and 2 M OH"; (right) mixtureof 2-i3C-glycine and i2C-formate in 2.0 M NO2~, 2.0 M NO3" and 2 M OH".T = 22°C; flux = 0.5 Mrad/h; points are measured concentrations, solid and dottedlines are model predictions. Key: (•) 2-i3C-glycine; ( • ) i3C-formate;(A) i3C-carbonate; (T) i3C-oxalate; (—) i2C-formate.
of glycine in the absence of nitrite is significantly higher than it is when nitrite is present (seeTable 3.5). Such high yields are possible because organic radicals generated by attack of oxidizingradicals on glycine undergo self-termination reactions. When nitrite is present, these radicalsreact with nitrite to produce NO or other intermediate radicals that react with NO2 radical (e.g.,steps 18 and 19, Table 3.2), thereby limiting organic conversion.
A shortcoming of the glycine model is that it does not allow for producing N2O or N2 in anysignificant quantities. In running the formate model, we observed that the NO radicals producedin reaction steps 5,9, and 14 (Table 3.2) mainly reacted withNO2. Reaction of NO with CO2"to make NO", a precursor to N2O and N2, was negligible because nitrite ion reacted ~100 timesfaster with CO2~. Although reactions of nitrite ion with radicals derived from glycine (A and Gin Table 3.4) have not been measured, we expect the radicals will have comparable reactivitiesbecause hydroxyalkyl radicals do.te) Thus the glycine model did not include reactions of NO
(a) For example, 1-hydroxy-l-ethyl and 2-hydroxy-2-propyl radicals have rate constants of1x106 M-is-i (unpublished result by Dan Meisel, Argonne National Laboratory).
3.14

with glycine-derived radicals. However, Meisel et al. (1991a) report that G(N20) = 0.15 mole-cules/100 eV from 0.3 M glycine in a waste simulant. Meisel et al. also measured yields of N2Ofrom a number of other complexants: 0.085 M EDTA, 0.60 molecules/100 ev; 0.85 M HEDTA,0.5 molecules/100 eV; 0.17 MNTA, 0.56 molecules/100 eV; 0.17 M IDA, 0.76 molecules/100 eV; 0.86 M glycolate, 0.42 molecules/100 eV; 0.17 M citrate, 0.045 molecules/100 eV.
Table 3.5. Radiolytic Yields of Glycine in Solutions Containing Nitrite, Nitrate, andHydroxide
[Glycine] [Nitrite] -
0.080
0.082
0.080
0.08100
0
1.25
2
2
G(Glycine)(a)
Expt
-3.7
-1.3
-0.9
-0.9
Model
—
-1.2
-0.8
-1
% of Yield by Oxidizing Radicals
H
3
0
0
0 -
HO
1
2
3
3
O"
77
14
11
10
NO2
19
83
86
87
(a) Molecules/100 eV.
(b) With 0.05 M 12C-formate.
Compatible mechanisms for forming nitrogen gases might involve intermediates formed byaddition of organic radicals (R) to nitrite ion (Equations 3.5-3.9). Reaction at both O andNatoms of NO2 are possible (Equations 3.5 and 3.6).
R + NO2" -» [RONO"] -» RO" + NO (3.5)
R + NO2--*RNO2- (3.6)
RNO2~ + NO 2 ->RNO 2 + NO2- (3.7)
RNO2" + NO -> R(NO)ONO" -» RNO + NO2" (3.8)
RNO2" + NO2 -> R(NO)ONO2" -» RNO + NO3" (3.9)
Equation 3.5 is analogous to the reaction of H with nitrite ion (Equation 2.2). The adduct,RONO", may only be a transition state. However, intermediates such as the nitroanion radicalformed in Equation 3.6, are sufficiently long-lived to be observed by electron spin resonance spec-trometry (Zeldes and Livingston 1968; Madden et al. 1988; Gilbert et al. 1972,1982). Electrontransfer to an acceptor, e.g., NO2 (Equation 3.7), produces a nitro compound. Numerous reac-tions leading to observed products are possible for nitro compounds in the alkaline wastes (Stockand Pederson 1997). The nitroanion radical may undergo combination/disproportionation reac-tions with NO and NO2. These reactions produce organic nitroso compounds that readily tauto-merize to oximes and hydrolyze to observed products and hydroxylamine (Equations 3.10-3.12).
H2NCH(NO)CO2-->H2NC(=NOH)CO2- (3.10)
H2NC(=NOH)CO2~ + H2O -» NH2OH + H2NC(=O)CO2" (3.
3.15

H2NC(=O)CO2~ + 0H~-> NH3 + "O2CCO2" (3.12)
Few of the key rate constants are available to include Equations 3.5-3.9 in the glycine kineticmodel. To the extent Equation 3.6 occurs, the stoichiometry for consumption of glycine may bedifferent from that predicted by the model in Table 3.4. In that model, NO mainly disproportion-ates with NO2 and limits the overall yield of organic oxidation. Equation 3.8 allows it to partici-pate in oxidizing organic species so that the rate constant for NO2 attack on glycine (Equation 32in Table 3.4) probably would need to be smaller to fit the data. However, if Equations 3.5,3.7,and 3.9 dominate, the model could be made to generate nitrogen gases without needing to changethe rate constant for NO2 attacking glycine.
3.3 Products of Degradation
When possible, products from competition experiments in Section 3.1 were identified fromthe chemical shifts of NMR peaks that appeared after y irradiation. Irradiated, oxidized sampleswere spiked with authentic materials to corroborate assignments based on chemical shift informa-tion. The chemical shifts of compounds of interest were dependent on ionic strength such thatthey had to be specifically determined for the highly caustic and high-ionic-strength solutionsused in these studies. Table A.6 in Appendix A shows the specific chemical shifts for reactantsand products identified in these experiments. Table 3.6 lists the products identified by matchingNMR chemical shifts. It also identifies products that cannot be present and some that areconsistent with observed resonances but could not be unambiguously assigned.
. Formate was almost always a significant product. More than two moles of formate are •produced per mole of EDTA consumed, ~1 mole formate is formed per mole of glycolateconsumed; and for citrate, acetate, and HEDTA, ~0.5 mole formate is formed per mole of speciesconsumed. Oxalate is also produced, and presumably carbonate (e.g., see Figure 3.1).
The pathway for NTA degradation is better understood. Figure 3.10 shows spectra takenbefore and after irradiation of an NTA solution. Readily identifiable products are IDA, glycine,and formate. In one experiment, 45% of the starting NTA remained; 17% was IDA and 29%was glycine. These products accounted for 91% of the nitrogen originally present in NTA. Wepresume the missing N is due to inorganic N from oxidation of glycine. This progression ofproducts is consistent with the reactivities measured for NTA, IDA, and glycine by competitionwith formate-i3C (see Table 3.1). The yield of formate-i2C was 83%, which suggests that cleav-age of R2NCH2CO2~ by oxidative decarboxylation is a significant pathway for NTA and IDA.
The 1HNMR spectra of EDTA in nitrate/nitrite/hydroxide solution before and after yradio-lysis are shown in Figure 3.11. The peaks identified (along with unidentified peaks) in the figureare also shown in tabular form in Appendix A. The major products of EDTA radiolysis besidesformate are ED3A, s-EDDA and NTA. Peaks in the "after radiolysis" spectrum consistent withproducts such as IDA, glycine, u-EDDA, and glycolate are identified in Figure 3.11, which alsoshows a minor product peak that matches acetate outside the spectral region. Resonances for
3.16

Table 3.6. Products Identified by NMR from Radiolytic Oxidation of Complexants
in Nitrate/Nitrite/Hydroxide Solutions
SubstrateEDTA
HEDTA
u-EDDA
s-EDDA
NTA
IDA
Rel. Amt.
major
minor
majorminor
major
minor
major
minormajor
minor
major
Positively Identified^
ED3A, s-EDDA, IDA,Formate
Acetate, Glycolate
Glycine
s-EDDA, IDA, FormateGlycine
IDA, Formate
Glycine
IDA, Formate
GlycineIDA, Formate
Glycine
Glycine, Formate
Products®Possibly Present
u-EDDA, NTA(c)
NTA(c)u-EDDA
(c)
EDMA
(c)
Not Present^)
HEDTA
EDTA, ED3A
NTA
(a) In all cases, carbonate (and oxalate) is assumed to be a product based on the results with 13Clabeled glycine. In addition, almost all substrates yielded trace amounts of glycolate and acetate uponprolonged radiolysis.(b) Assigned based on proton and 13C NMR experiments.(c) Proton NMR resonances of unidentified products are present.(d) NMR resonances of these compounds were not detected.
hydroxyethyl groups such as HEDTA (see Figure 3.12) are missing in Figure 3.11. The twosmall peaks near 3.5 ppm and 2.8 ppm are similar to peaks found after s-EDDA radiolysis. Thepeaks are currently unidentified but appear in positions that are similar to those of lactams.
Figure 3.12 shows the JH NMR spectra of a nitrate/nitrite/hydroxide solution of HEDTAbefore and after y radiolysis. The major identified products of the HEDTA radiblysis ares-EDDA and IDA. Other major products have not been identified but are consistent with theN-hydroxyethyl group. The hydroxyethyl group of HEDTA shows up as two triplets in the1H NMR spectrum at 3.6 and 2.56 ppm, respectively. After radiolysis these triplets are muchsmaller, and new multiplets appear just downfield from the original HEDTA triplets. Thesemultiplets may be overlapping triplets from isomers of hydroxyethylethylenediamine diacetateand hydroxyethylenediaminemonoacetate in Figure 3.13.
The EDDA product mixtures contained IDA and formate as the major products. A majorproduct tentatively identified as EDMA was found in the s-EDDA but not u-EDDA mixture.Glycine was a minor product, and only trace quantities of acetate and glycolate were formed. Noproducts other than formate could be identified from the 1H NMR spectra of irradiated solutionsof citrate, succinate, butyrate, butanol, and DBP.
3.17

1NTA
IIDA
Glycine __^.
8.7 B.G 8.5 B.4 B.3 8.2 pp<a 3.4 3.3 3.2 3.1 3.0 2.9 2.8 ppn
Figure 3.10. 1H NMR Spectra Showing that NTA Degrades to IDA and Glycine During yRadiolysis in Nitrate/Nitrite/Hydroxide Solution. Top spectrum, unirradiatedsample; bottom spectrum, irradiated sample, ~8 Mrad dose.
NTA, IDA
,ED3A
Glycolate
IDA
glycine
\ E DED3A
s-EDDA
\
u-EDDA
-CHJCOJ"
tu-EDDA
L.4.0 3.8 3.6 3.4 3.2 3.0 2.8 2.6 2.4 ppm
Figure 3.11. !H NMR Spectra of EDTA before (bottom) and after (top) y-Radiolysis in2 M NaN02, 2 M NaN03, 2 M NaOH Solution; 18.4. Mrad Dose
3.18

Glycolate
i
s-EDDA, IDA
NTA
S-EDDA
•CHjCO2"
HOCH2CH2N<
A
tno EDTA
>NCH2CH2N<
HOCH2CH2N<
4.0 3.8 3.6 3.4 3.2 3.0 2.8 2.6 2.4 ppm
Figure 3.12. Proton NMR Spectra of HEDTA before (bottom) and after y Radiolysis(top) in Nitrate/Nitrite/Hydroxide Solution (dose was 18.4 Mrad)
Figure 3.13. Structures Consistent with Hydroxyethylene Resonances in 1HNMR Spectra of y Irradiated HEDTA Solutions (see Figure 3.12)
3.19

3.4 Experimental Section
Organic compounds were purchased from chemical suppliers with the exception of u-EDDA,which was provided by JA Campbell (PNNL). The purity of all compounds was established by1H NMR. The water used in these experiments was purified using a Millipore deionizationsystem; irradiations were performed in the PNNL High Dose 6°Co Facility or the PNNL yFacility.
The High Dose 6OC0 Facility is located in the 331 Building in the Hanford Site 300 Area. Theirradiator, a Model Gammabeam 650 manufactured by Nordion International Inc., is locatedwithin a concrete vault that is 7.6 by 7.6 by 3.0 m high and has an adjacent control room. Cableraceways between the vault and control room are available for real-time monitoring of the testsample(s). Twelve vertical stainless steel source tubes are arranged in a circular array. Thesources are operated pneumatically, and irradiations can be terminated using a preset timer. Forirradiation of samples in the center of the array, the diameter can be adjusted from 12 to 80 cm.Each source tube contains from 115 to 7700 curies of 60Co. Dose rates from 3 rad/h up to2.5 Mrad/h can be obtained. The facility can accommodate sample sizes of ~1 m3 (35 ft3). Forour experiments, all 12 sources were arrayed in a circle with a diameter of 24 cm, providing anominaldose rate of 6x10⁵ rad/h. Three polyethylene cups (6.5 cm high by 10 cm diameter)were stacked in the center of the source array. Each cup was loaded with 3-4 samples (7-mLvials containing 2 mL test and/or dosimetry solutions). Fricke dosimetry demonstrated that the yfield was homogeneous, with dose rates within each cup varying by 1 to 3%.
The PNNL y Irradiation Facility^) is in the 3730 Building in the Hanford 300 Area. It con-tains 37 stainless steel irradiation tubes in a 2.13-m-diameter by 4.19-m-deep stainless steel in-ground tank. Two arrays of 60Co ^sources with a combined inventory of 1.184xlO16 Bq arenear the bottom of the tank. For radiation shielding purposes, the tank is completely rilled withwater, and a concrete wall, 1.1 m in height, surrounds the top of the tank. The irradiation tubes,which are sealed on the bottom, range in length from 4.9 to 5.5 m and in diameter from 4.6 to5.1 cm. The irradiation fluxes of the tubes range from 2 to 2x10⁶ rad/h. The uniform flux regionis 15.2 cm from the tubes closest to the sources and more than 30.5 cm from the tubes farthestfrom the sources. Samples are lowered into the tubes to a depth that yields the desired dose rate.
3.4.1 Sample Preparation
In a typical procedure, stock solutions containing NaNQ3, NaN02, and NaOH were pre-pared, sparged with N2, and transferred to an inert atmosphere glovebox. Sample solutions wereprepared by dissolving the solid organic andNaHCO2, when desired, in stock solutions in 10 mLvolumetric flasks. An autopipet was used to deliver 2 mL of the sample solutions to each ofthree or four 7-mL vials. Vials fitted with polyethylene-lined caps were sealed tight, removedfrom the glovebox, and arranged in polyethylene cups that served as sample holders. Sampleswere irradiated for times ranging from 9 to 30 hours in the High Dose Facility or up to 11 days inthe PNNL y Facility before being removed and analyzed. Tables A.1-A.3 (Appendix A) lists
(a) http://www.pnl.gov/gamma/
3.20

sample concentrations, irradiation schedules, and absorbed doses. Exceptions to the aboveprocedures include EDTA scoping experiments (Figure 3.3, Table 3.1 entry 2; and Appendix A,Table A.1) that were performed in 5-mm-o.d. NMR tubes without N2 purge and scoutingexperiments for HEDTA and glycolate (Table 3.1 entries 4 and 8, respectively) that were run inglass vials without N2 purge. In the latter, vials were filled to capacity. Selected samples werealso analyzed by ion-pair liquid chromatography (IPC) or ion chromatography (TC) to confirmthe NMR results. The IC and HPLC methods are described in Section 4.3.2.
3.4.2 NMR Analysis
The relative rates of substrate disappearance compared with formate were determined by 1Hand/or 13C NMR spectroscopies. In FY97 experiments (MH sample numbers in Table A.2,Appendix A), a 0.50-ml aliquot of the homogeneous sample solution was transferred to a 5-mmo.d. NMR tube along with 0.10 ml of a caustic (2.0 M NaOH) deuterated water solutioncontaining 0.040 M 2,2-dimethylmalonic acid (an internal chemical shift and integrationstandard). In FY98 experiments (ML sample numbers in Table A.2, Appendix A), 0.20 mL ofthe irradiated sample solution was dried under a nitrogen stream at room temperature. The solidwas then redissolved using 0.60 mL of a deuterium oxide solution containing 0.00184 M 2,2-dimethyhnalonic acid. The three-fold dilution of the sample promoted dissolution of oxalate ion.
1H (300 MHz) and carbon (75 MHz) NMR spectra were recorded using a Varian VXR-300NMR spectrometer. The following conditions for recording 1H NMR spectra gave reproducible.and quantitative results: 9° pulse, 7-second acquisition time, 1-second recycle time. The numberof transients collected depended on the concentrations of the species; the minimum number was200. The spectra were carefully integrated to eliminate any contribution from the *H signalbetween 5.5 and 4 ppm due to protonated water. The following conditions for recording 1Hdecoupled 13C NMR spectra gave reproducible and quantitative results: 70° pulse, acquisitiontime of 1.8 seconds, and recycle time of 60 seconds. A line broadening of 1 Hz was used toprocess each spectrum. The relative areas of the formate-i3C and carbonate-i3C peaks were usedto calculate the conversion of formate-i3C. The contribution to the NMR signal from naturalabundance 13C from formate or carbonate produced by radiolysis of other organic species wasnegligible in all cases. The reproducibility of triplicate spectral collections of the same samplewas ±4%; triplicate reintegration of the same spectrum routinely gave reproducibility of ±1%.Product identifications were made by comparing the 1H NMR spectra of authentic samples ofpotential products collected in the same reaction medium as the radiolytic experiments.
3.4.3 Fricke Dosimetry
Dose rates were determined by Fricke dosimetry (Draganic and Draganic 1971; Spinks andWoods 1964) using the same reaction vials and irradiation methods used in aging experiments.The dosimetry solution contained 0.01 M Fe(NH4)2(SO4)2 and 0.001 M NaCl in 0.4 M H2SO4.The solution was purged with oxygen and placed in 7-rnL glass capped vials. For the High DoseRate Facility, vials containing the Fricke solution were arranged in polyethylene cups withidentical vials containing sample solutions and irradiated for four minutes at the beginning of theirradiation run. For the PNNL y Irradiation Facility, vials were arranged in an Inconel vessel,
3.21

lowered into the irradiator, and removed after 15,30, or 60 minutes. A control solution washandled identically but was not irradiated. The concentration of Fe(Tfl) formed was determinedwith use of a Cary 3E UV/Vis spectrophotometer. Doses absorbed by aging samples werecalculated using appropriate corrections for solution density.
3.4.4 Calculation of Radiolytic Yields
Radiolytic yields were calculated using Equation 3.13:
G(5)= — 965 molecules/100 eV (3.13)dosexp
where AM5 is the measured change in molar concentration of a species, S, for an absorbed dose(Mrad) in a solution of density p (g/ml), and 965 converts units of moles/kg/Mrad to mole-cules/100 eV. Accordingly, the modeled radiolytic yields were determined from the predictedyield of carbonate as a function of time at a given dose rate. Table 3.3 compares the experi-mentally measured yield with the yield predicted by the formate model shown in Table 3.2.
3.4.5 Mechanistic Kinetic Modeling
Two well-documented kinetic modeling approaches were used to run the models depicted inTables 3.2 and 3.4: Acuchem (Braun 1988) and GEAR (Weigert and McKinney 1986)»Acuchem and GEAR are PC/DOS-based programs that output concentrations of species versustime for a user-specified isothermal chemical kinetic model (reaction steps and rate constants)from a set of initial concentrations. Acuchem provides an internal switch that permits the con-centration of species to be output at 50 equally spaced times or at user-specified times. Thislatter feature was used to test the model against experimental data and to calculate predictedyields as in Tables 3.3 and 3.5 (also, Tables A.4 and A.5 in Appendix A). The former feature isuseful for generating graphs with experimental data superimposed on model results, as in Fig-ure 3.5. The output provided by GEAR is limited to monitoring no more than four species in agiven analysis. However, the output varies the step size so that small steps are used early in thereaction, when concentrations are changing more rapidly. GEAR was used to examine the time-dependent reactivity of the transient intermediates. The output allows observation of theapproach to stead-state concentrations of intermediates such as NO and NO2 radicals, as inFigure 3.6.
Some rate constants hi the models (ki3 and k28 in Table 3.2 and k32 and k33/k34 in Table 3.4)were adjusted to fit experimental data; the optimum fit was found by minimizing the sum ofsquared deviations, R(d), between experimental, yb and calculated data points, J(f) (Equa-tion 3.14).
(a) The GEAR program was adapted by TE Beukehnan ( El du Pont de Nemours & Co.) fromHAVCHEM (Stabler and Chesick 1978).,
3.22

(3.14)
. For the formate model, y(ti) values are carbonate concentrations at times, /, under the sevendifferent conditions listed in Table 3.3 (see also Appendix A, Table A.4). For the glycine model,deviations in concentrations of glycine, formate, carbonate, and oxalate (Appendix A, Table A.5)were included in the calculation of R(d)2 (Equation 3.15).
R(d)2= 2
The rates of formation of primary radiolytic radicals OH, H, and NO32- were estimated forinput to the models (Eq. 1—3 in Table 3.2). Equation 3.16 relates the rate of formation to doserate of a sample.
rate = radiolytic yield x dose rate x density x conversion factor (3.16)
The conversion factor is 1.04x10⁻³ moles/kg/Mrad w h e n m e ^ ^ ^ Ws for r a t e 5
molecules/100 eVmolecules/100 eV for radiolytic yield, Mrad/h for the dose rate, and kg/L for sample density.
3.4.6 Calculation of Fractions of Formate and Glycine Oxidized by O", OH, H, and NO2
Tables 3.3 and 3.5 list the fractions of formate and glycine oxidized by radiolytically pro-duced radicals. These fractions were estimated from the radiolytic yields of primary radicals(OH, H, and NO32-) and the reactions they undergo (Tables 3.2 and 3.4). According to thekinetic model, the radiolytic yield of carbonate, G (CO*")^, is the sum of contributions from H,
OH,O" andNO2:
=G ( c°nH+ G K
where G (COl~)H is the yield of carbonate derived from H attack on formate, G (CO3~)OH is the
yield from OH attack, G (CO*")^ is the yield from O" attack, and G (CO*-)^ is the yield of
carbonate derived from NO2 attack. Each of the first three terms in Equation 3.17 may beevaluated analytically provided conversions are low so that initial concentrations may be used toestimate rates, and reactions of H, OH, O~, and NO2 with products can be neglected. Forexample, the yield of carbonate, G (COl~)H, from formate ions that react with H is given by
(Equation 3.18):
where G(H) is the radiolytic yield of H, and rg, rio, and r-n are rates for the reactions listed inTable 3.2. The rate fraction is calculated from the respective reaction rate constants and initialconcentrations of reactants, i.e., Equation 3.19.
3.23

r9+r10+r21
klo[HCQ;]
Substituting Equation 3.19 into Equation 3.18 gives Equation 3.20:
G(CO2-) -C(I I ) kio[HCQ2j
G(C°3 )H GiHik9[NO-]+kio[Hcoi]+k27[6H-]
Analogous expressions give G (COr)OHand G (CO*")^ (Equation 3.21 and 3.22):
t i\ _ I \ ^[HCO;] "G (C°3 )OH-G ( ° H ) kg [0H"]+k7 [NO-]+k8
The G(O~) is calculated from G(OH) by Equation 3.23:
The G (CO^JNQ is estimated by combining Equations 3.17,3.20,3.21, and 3.22:
G (COr )NO2=G (COr )total-G (COr )H-G (CO32-)0H-G (CO.r ) a (3-24)
Analogous equations give the contributions radiolytic conversion of glycine:00
k29[glycine]
/ \ k,, [glycine] . ._ _ _G(glycine)0H=-G OH —r -, -r ^ \ J , T (3.26)
\&y ion \ /k[oH-]+k[NOi]+k[HCO;]+k31 [glycine]
. k30 [glycine]
G(O ^ = G l ° H ^ k [ O H - ] + k | - N O - J + k | - H C O - ] + k [ g l y c i n e ] •
(a) Formate appears in the equations because a set of experiments with 2-i3C-glycine alsocontained i2C-fonnate (see Table 3.5).
3.24

G (glycine)N0=G (glycine ) total-G (glycine)H- G (glycine) 0 H - G (glycine) o- (3-29)
3.25

4.0 Organic Aging Studies Using Waste Simulants
Aging tests were performed using a simulant that was developed for Fauske Associates,Incorporated (FAI) energetics and reactivity tests (Carlson and Babad 1996). The simulant,designated SIM-PAS-95-lc for FY 1996 studies and SIM-PAS-95-ld for FY 1997 studies, is amodified version of the SIM-PAS-94 simulant, which Scheele (1995) developed from B-plantchemical inventories and process flow sheets.
The simulant (Table 4.1) is a heterogeneous mix of metal oxide/hydroxide precipitates andaqueous solutions containing a variety of inorganic anions, mainly nitrate, nitrite, and hydroxide, .and the organic complexants HEDTA, EDTA, citrate, and glycolate. The density is ~1.27 g/mLand the carbon content is 21 g/L or 4.5 wt% (dry basis). The SIM-PAS-95-ld simulant has thesame components as SIM-PAS-95-lc, although the concentration of EDTA was lower and thatof glycolate was higher.
Aging tests were run over a variety of radiation doses, temperatures, and cover gascompositions of either pure Ar or 20/80 02/Ar. The simulant was also heated at 90°C for up toeight months under cover gases that started out as either pure Ar or 20/80 02/Ar. To fosterreproducible results, the simulant was prepared before each irradiation by measuring exactquantities of three homogeneous stock solutions into the reactor vessel (see Section 4.3). Thesame vessel was used for each irradiation, and it was placed in the same location relative to theradiation source. The radiation flux was 3x10⁵ rad/h. After irradiation, the contents of the vesselwere quantitatively transferred and analyzed for organic compounds carbonate, nitrate, and
nitrite. In addition, another sample of the simulant was mixed and then analyzed without havingbeen irradiated. Additional experimental information is provided in Section 4.3.
Table 4.1.
Species
HEDTA3"
EDTA4-
CitrateS-
Glycolate
NO3-
Na+
OH-
NO2-
Fe3+
Target Composition of SIM-PAS-95-lc,and -Id Simulants
mg/g
1^9
3.1
17.3
11.3
109
107
39.3
37.9
2.61
Species
Al 3 +
F-
Pb2+
PO43*
SO42-
Bi2+
Ce3 +
Ni2+
mg/g
1.493
1.281
1.066
0.507
0.506
0.419
0.377
0.099
Species
Ca2+
Mn2+
Cr3+
ci-Pd2*
Rh3 +
Ru4 +
H2O
mg/g
0.080
0.068
0.044
0.004
0.003
0.003
0.003
640
4.1
4.1 Results
Section 4.1 presents analytical results showing how organic aging is affected by temperature,time, radiolytic dose, and O2 in the cover gas. Section 4.2 uses the data to show how nitratereaction enthalpies (AHr) and TOC of the simulant change with radiation dose and thermalexposure. This latter treatment of the data is of particular interest because energy content andTOC are used to screen wastes for the likelihood of propagating reactions in tanks. Section 4.3describes experimental procedures. Tables in Appendix B list the results of analyses performed.Species analyzed include HEDTA, EDTA, glycolate, citrate, oxalate, formate, carbonate, nitrate,nitrite and ammonia. Gases analyzed in theheadspace above the aged mixtures include Ar, O2,N2 , N2O, H2, CO, CO2, and CH4.
4.1.1 Effect of Radiation Dose on Aging
Figure 4.1 shows the disappearance of starting organic species and appearance of oxalate,formate, and carbonate as a function of radiation dose and time at 70°C. The results show that allthe complexants and their remnants are susceptible to radiolytic degradation. The kinetic life-times obtained from fitting species concentrations to exponential decay functions (C=Coe-t/'t)suggest that reactivities of complexants decrease in the order HEDTA>EDTA>glycolate>citrate.(a) Similar results were obtained for runs at 40 and 90°C. The results also show thathighly oxidized products grow in without delay. Nitrate decreases with increasing dose, whilenitrite and ammonia increase (see Tables B.I, B.3, and B.4). And gaseous products H2, N2O, andN2 accumulate in the headspace above the aged simulant (see Table B.10). These reactionproducts are all consistent with radiolysis-induced redox chemistry in which organic species arereductants and radiolytically generated species (O~ andNO2) are oxidants.
The species listed in Figure 4.1 represent more than 75% of the organic carbon present in theaged simulants. Figure 4.2 shows how radiolytic aging affects the concentrations of organiccarbon in the simulants at 70 and 90°C. The figure plots the concentrations of carbon in formateand oxalate, the starting species (glycolate, citrate, EDTA, and HEDTA), and unspeciated ormissing carbon, i.e.j the difference of total carbon at start less total carbon at time, t. TablesB.1-B.4 contain the data used to generate these plots and provide similar data for othertemperatures and conditions. This missing carbon is thought to largely be associated withchelator fragments such as ED3A, NTA, IDA, and EDDA. These particular species wereidentified by GC-MS analyses and by ion pair-liquid chromatography, but amounts were notquantified. Small amounts of acetic and succinic acids were detected by ion chromatography inirradiated simulants (see Tables B.1-B.4 in Appendix B).
(a) For example, half-lives in a 0.3 Mrad/h y field at 70°C (Appendix B, Table B.2) wereHEDTA: 7.7 days; EDTA: 9.3 days; glycolate: 43 days; citrate: 66 days. These rate datacorrespond to relative reactivities (HEDTA:EDTA:glycolate:citrate) of 8.6:7.1:1.5:1.
4.2
0.15
Time (Days)5 10 15 20 0
Time (Days)5 10 15 20
o
a 0.10
d)ocoO
<5 0.054-oao
0.00
Carbonate
^.Oxalate
50 100Dose (Mrad)
150 0
0.4
0.3
0.2
oQ.
ooooo3o"3
0,1
50 100Dose (Mrad)
1500.0
Figure 4.1. Disappearance of Complexants and Appearance of Products in aRadiation Field of ~3xlO5 rad hr-i at 70°C; headspace gas is initially20/80 O2/Ar
As shown in Figure 4.2, the amounts of missing carbon goes through maximum values of ~25and ~15% at ~100 Mrad at 70 and 90°C, respectively. The lower amounts of missing carbon in90°C experiments are probably due to the more rapid consumption of intermediate compoundsand the fact that less EDTA was used in the simulant. Carbonate production at 90°C is nearlytwice as fast as at 70°C (see Figure 4.1). The disappearance of carbon in starting species appearsbiexponential at 70° and exponential at 90°C. This behavior may be due to the higher fraction ofglycolate in the 90°C, PAS-95-ld simulant
4.1.2 Effect of Temperature on Radiolytic Aging
Aging tests were run at 40,70, and 90°C to evaluate the effect of temperature on radiolyticaging. Table 4.2 lists results for samples that received y doses of 40 to 50 Mrad. The effects ondisappearance of the chelators seem small and may be masked by experimental scatter. Amountsof glycolate, citrate, HEDTA, and EDTA found at 40 and 70°C are similar. At 90°C, lessglycolate is present compared to 70°C, but the amounts of HEDTA and citrate present at 90°Care greater than at 70°C. The formate, oxalate, and carbonate products show a trend of increasingyield with increasing temperature. The results imply that rates of disappearance of chelators arecontrolled by the intensity of the radiation field (i.e., dose rate), whereas formation of productsdepends on thermally activated "ionic" processes (e.g., hydrolyses) that convert intermediates to
4.3

a,"5£0)
co.Q
reO
Time (Days)5 10 15 20 0
Time (Days)5 10 15
50 100 150 0
Dose (Mrad)
50 100Dose (Mrad)
20
• 10 3
150
o3-o3
2L3cET3
Figure 4.2. Plots of Carbon Content Versus Dose for 70 and 90°C Irradiations:(•) Organic Carbon, (•) Carbon in Organic Starting Compounds,(A) Oxalate and Formate Carbon, (T) Carbon in Other OrganicCompounds, e.g., ED3A, NTA, and IDA
end products. Consistent with this view, the fraction of unidentified carbon (subtract totalcarbon valuesin lines 2,3, or 4 from line 1, Table 4.2) decreases with increasing temperature.Gas analyses show an increase in the yield of Efe on going from 70 to 90°C. These analyses aresummarized in Figure 4.3 (Tables B.7 and B.8).
Table 4.2. Effects of Temperature on Radiolytic Aging of SIM-PAS-95-ld
T, Dose(°C, Mrad) '
20°, 0
40°, 43
70°, 4760
90°, 50
Formate
0.00
0.14
0.21
0.52
Oxalate
0.00
0.34
0.41
1.0
Reactants/Products, mg
Glycolate
3.7
3.3
3.3
2.7
Citrate
5.6
4.7
5.0
5.7
HEDTA
6.5
1.9
1.8
2.6
c/gEDTA
0.80
0.36
0.38
0.37
co32-
0.16
1.1
1.4
1.7
OrgC
16.5
10.8
11.1
12.9
Total
16.7
12.0
12.5
14.7
(a) Average of two runs (see Tables C.I, C.7, and C.9).
4.4

Figure 4.3. Effects of Temperature and Initial O2 Concentration in Headspace Gas on• Radiolytic Yields of Gases. (O2), starting with 20/80 O2/Ar; (no O2),starting with 100% Ar; (no Fe), starting with 20/80 O2/Ar and simulantprepared by substituting water for Fe(HI) solution (see Section 4.3 andTable 4.6)
The bar chart in Figure 4.3 shows the radiolytic yields (G) in molecules/100 eV of O2, H2,N2O, and N2 at 40,70, and 90°C. The yield of H2 increases from G-0.03 at 40°C to G-0.1 at90°C. We noted a similar trend for H2 production from radiolytic aging of simulant SY1-SIM-94C (Camaioni et al. 1996,1995). This trend may indicate that reaction paths to H2-producingaldehyde intermediates are favored by higher temperatures. Formaldehyde and glyoxal degrade inalkaline solutions with irradiation producing H2 (Ashby et al. 1993,1994; Meisel et al. 1993;Karpoor et al. 1995). Finally, we mention that yields of H2 are relatively unaffected by eitherthe presence or absence of O2 in the headspace gas or Fe in the simulant. These results will bediscussed in Section 4.1.4.
4.1.3 Results for Thermal Aging of the Simulant
Figure 4.4 shows how the organic composition of the simulant changes with time at 90°C inthe absence of y radiation. Note that the time scale for thermal aging in Figure 4.4 is significantlylonger than that for radiolytic aging in Figure 4.1 (120 days in the former, 20 days in the latter).Even after heating for three months at 90°C, negligible EDTA has reacted. Thus, the degradationof organic species observed in Figure 4.1 is mainly caused by radiolysis.
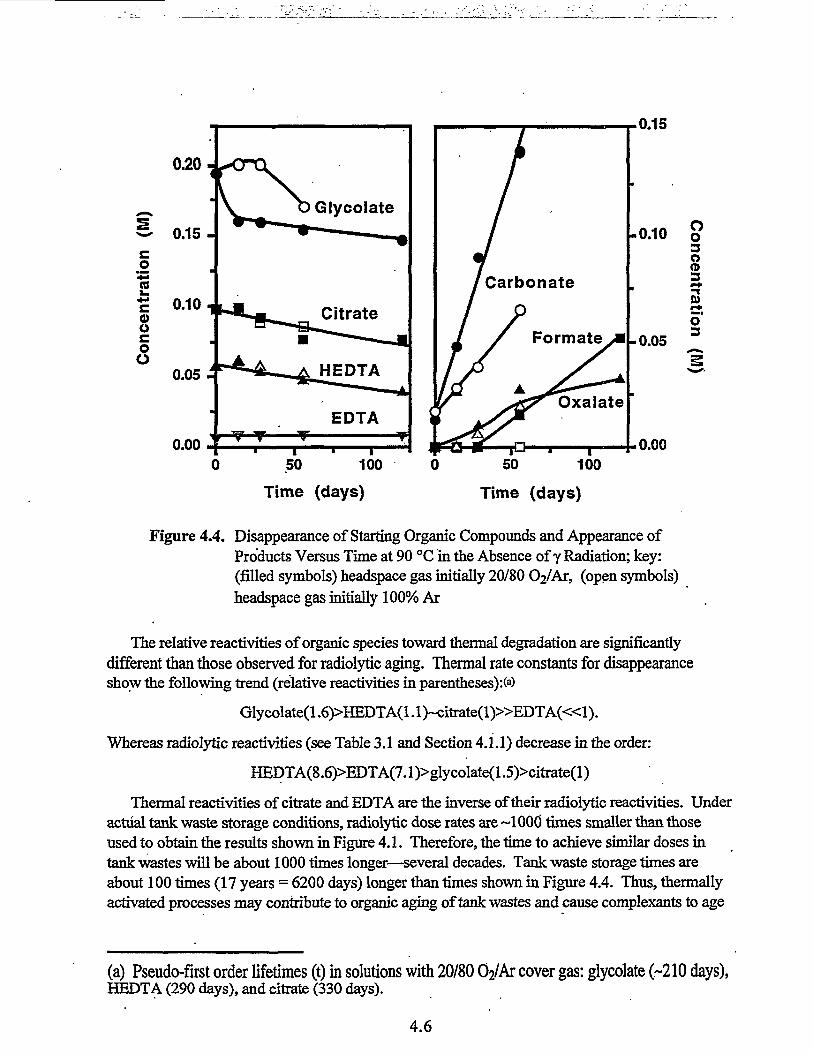
0.20
-0.10 ?
3Ma.
o
0.00
Time (days)
50
Time (days)
Figure 4.4. Disappearance of Starting Organic Compounds and Appearance ofProducts Versus Time at 90 °C in the Absence of y Radiation; key:(filled symbols) headspace gas initially 20/80 02/Ar, (open symbols)headspace gas initially 100% Ar
The relative reactivities of organic species toward thermal degradation are significantlydifferent than those observed for radiolytic aging. Thermal rate constants for disappearanceshow the following trend (relative reactivities in parentheses):(a)
Glycolate(1.6)>HEDTA(l.l)~citrate(l)»EDTA(«l).
Whereas radiolytic reactivities (see Table 3.1 and Section 4.1.1) decrease in the order:
HEDTA(8.6)>EDTA(7. l)>glycolate(l .5)>citrate(l)
Thermal reactivities of citrate and EDTA are the inverse of their radiolytic reactivities. Underactual tank waste storage conditions, radiolytic dose rates are ~1000 times smaller than thoseused to obtain the results shown in Figure 4.1. Therefore, the time to achieve similar doses intank wastes will be about 1000 times longer—several decades. Tank waste storage times areabout 100 times (17 years = 6200 days) longer than times shown in Figure 4.4. Thus, thermallyactivated processes may contribute to organic aging of tank wastes and cause complexants to age
(a) Pseudo-first order lifetimes (t) in solutions with 20/80 02/Ar cover gas: glycolate (-210 days),HEDTA (290 days), and citrate (330 days).
4.6

more uniformly than might be indicated by Figure 4.1. The results suggest that lifetimes andaging rates of organic complexants will strongly depend on the radiolytic and thermal history ofindividual tank wastes.
4.1.4 Effects of O2 and Fe on Aging
The effects of O2 on thermal and radiolytic aging were explored by running tests with and
without O2 cover gas. Thermal aging tests were run at 90°C for times of up to two months.Radiolytic aging tests were run at 70°C with y doses of-50 Mrad. The initial compositions ofthe cover gas were either 20/80 02/Ar or 100% Ar. At the end of the experiments, the headspacegas was sampled (see Section 3.2 and Table 3.8) and analyzed for O2, H2, N2O, N2, and Ar.
4.1.4.1 Effects of O2 and Fe on Radiolytic Aging
Table 4.3 shows organic and carbonate speciation results for radiolytically aged samples. Theresults suggest that there is little effect on the distribution of analytes whether O2 is initiallypresent or absent in the headspace. The differences do not significantly exceed experimentalscatter. The experiments with 20/80 02/Ar had 15.8 mmol of gas (3.2 mmol O2) in theheadspace. Assuming a radiolytic yield of 6 molecules/100 eV of oxidizing radicals, a 47 Mraddose yields 29 mmol of oxidizing radicals. Even if all of these attacked the complexants makingorganic radicals, there would only have been enough oxygen to scavenge 40% of radicals. LeavingFe out of the simulant does not strongly affect the distributions either.
Headspaee gas analyses (see Figure 4.3 and Tables B.7 and B.8) show O2 was consumedwhen initially present. When O2 was initially absent, small quantities were generated. Relativelymore O2 is consumed at 70° than at 40 or 90°C; however, the yield at 90° is based on data for asample that was dosed with 146 Mrad. We observed in previous aging studies with SY1-SIM-94C that O2 levels in the headspace reached steady state during irradiation that increased with
Table 4.3 Effects of O2 on Radiolytic Aging of SIM-PAS-95-ld at 70°C(a)
Conditions
Initial
20/80 O2/Ar(b)
100% Ar0>)
No Fe(c)
Formate
0.000
0.022
0.025
0.042
Oxalate
0.000
0.031
0.022
0.020
Reactants/Products, M
Glycolate
0.20
0.17
0.18
0.18
Citrate
0.098
0.088
0.090
0.089
HEDTA
0.057
0.018
0.022
0.025
EDTA
0.0068
0.0040
0.0040
0.0034
CO32-
0.011
0.11
0.10
0.13
(a) From data in Appendix B, Table B.2; 47 Mrad dose, 0.3 Mrad/h dose rate.(b) Average of two runs.(c) Simulant prepared by substituting water for Fe(m) solution (solution 2 in Table 3.7);
initial composition of headspace gas was 20/80 02/Ar.
4.7

temperature (Camaioni et al. 1996). Steady state was achieved with a dose of 20 Mrad at 90°C.So, yields derived from such a large dose might be artificially low. Effects on H2 and N2 yieldswere negligible; however, less N2O was produced when O2 was absent at start.
The effects of Fe on radiolytic aging are modest. Approximately 25% more HEDTA isconsumed when Fe is present than when it is absent (O2 and other simulant constituents presentin both cases), more formate is produced, and relatively less oxalate is produced. Headspace gasanalyses showed that leaving Fe out of the simulant caused increased consumption of O2,increased production of H2, and.decreased production of N2O (see Figure 4.3 and Tables B.7 andB.8). Taken together, the results may suggest a synergistic effect of Fe and O2 on the rate ofHEDTA degradation and gas generation under radiolytic conditions.
4.1.4.2 Effects of O2 on Thermal Aging
Figure 4.4 shows results for aging in the presence and absence of O2. These results show asignificant effect on glycolate. When O2 is initially present, glycolate decreases, rapidly con-suming about 20% of the initial amount. Then the decrease is gradual. The O2 in the cover gaswas maximally 0.2 mmol. There was 2.5 mmol of glycolate in condensed phase. Cover gasanalyses showed that 71% of the O2 was consumed after 1236 hours at 90°C. This is probablywhy consumption of glycolate (0.19 M at t=0) slowed down after 20% was consumed. In theabsence of O2, glycolate degradation appears to be autocatalytic or initially inhibited. Effects ofO2 on citrate and HEDTA disappearance rates appear negligible. The effect on carbonateproduction is more pronounced—carbonate forms nearly twice as fast in the presence of O2.EDTA reactivity does not appear to be different, although heated samples in both cases wereroutinely found to contain ~30% higher concentrations of EDTA than were measured in unagedsamples of the simulant. Reasons for this anomalous behavior are unknown; one possibility isthat degradation products of HEDTA interfered with EDTA analyses.
Results for headspace gas analyses are shown in Figure 4.5. Yields for 1330- and 2330-hourruns are normalized to 1000 and 2000 hours and charted in a bar graph for visual comparison.Like radiolysis experiments, headspace gas analyses show that, when O2 was initially present, itwas consumed by aging reactions, and when it was initially absent, it was generated in smallamounts. N2O and H2 were generated at comparable rates when O2 was initially present, butN2O was generated faster than H2 when O2 was initially absent.
Similar observations about the effects of O2 on gas production have been reported forsimulants (Barefield et al. 1995,1996) and real wastes (Person 1996). However, our observa-tions of the effects on organic aging contrasts with recent observations for HEDTA in a muchsimpler simulant (sodium nitrite, aluminum hydroxide, sodium hydroxide) were that consumptionof HEDTA was inhibited by O2.
4.8

1.0
0.8 +
o
& 0.4 +o
0.2
0.0
-0.2
(A)
N2O O2 N2
Figure 4.5. Effects of Initial Concentration of O2 in Headspace Gas on Distribution of GasesProduced at 90°C: (A) starting with 20/80 O2/Ar; (B) starting with 100%Ar; B 1000 hours; • 2000 hours
4.2 Radiolytic Effects on TOC and Nitrate Oxidation Enthalpies of OrganicSpecies
The results in Section 4.1.1 show how organic carbon in SIM-PAS-95-1 redistributes as afunction of aging conditions. We now examine how the TOC and enthalpy of the simulantchange with aging. We define the enthalpy to be the heat that would be released fromstoichiometric reaction of the organic species with nitrate on a dry weight basis, i.e., the mixtureshave been concentrated to dryness. Since the starting and aged simulants all have excess nitrateand NaOH, we assume the products of reaction to be H2O, Na2CO3, and N2 and then calculatethe reaction enthalpy of each species from AHf data (Burger 1995). Table 4.4 lists the AHf andAHr data we used.
The concentrations of organic species and their nitrate reaction enthalpies in aged simulantsare tabulated in Appendix B, Tables B.4-B.6. These data were used to calculate TOC andreaction enthalpies. The contribution that each organic species makes to AHr of the simulant isobtained by multiplying the concentration (mg C/g) of the species times the AHr (kJ/g C) of thespecies (Table 4.4). The AHr for missing organic species (calculated as the difference, ^organicCo - inorganic Q - ETOQ) is assumed to be the average of values for Na3ED3A, Na2EDDA,NasNTA, Na2lDA, and sodium glycinate (aminoacetate). Prior to aging, the reaction enthalpiesof the simulants are 1340 J/g for SIM-PAS-95-1 c and 1240 J/g for SIM-PAS-95-1 d. Over thetemperature range of 40-90°C, radiolytic aging decreases the magnitudes of nitrate reaction
4.9
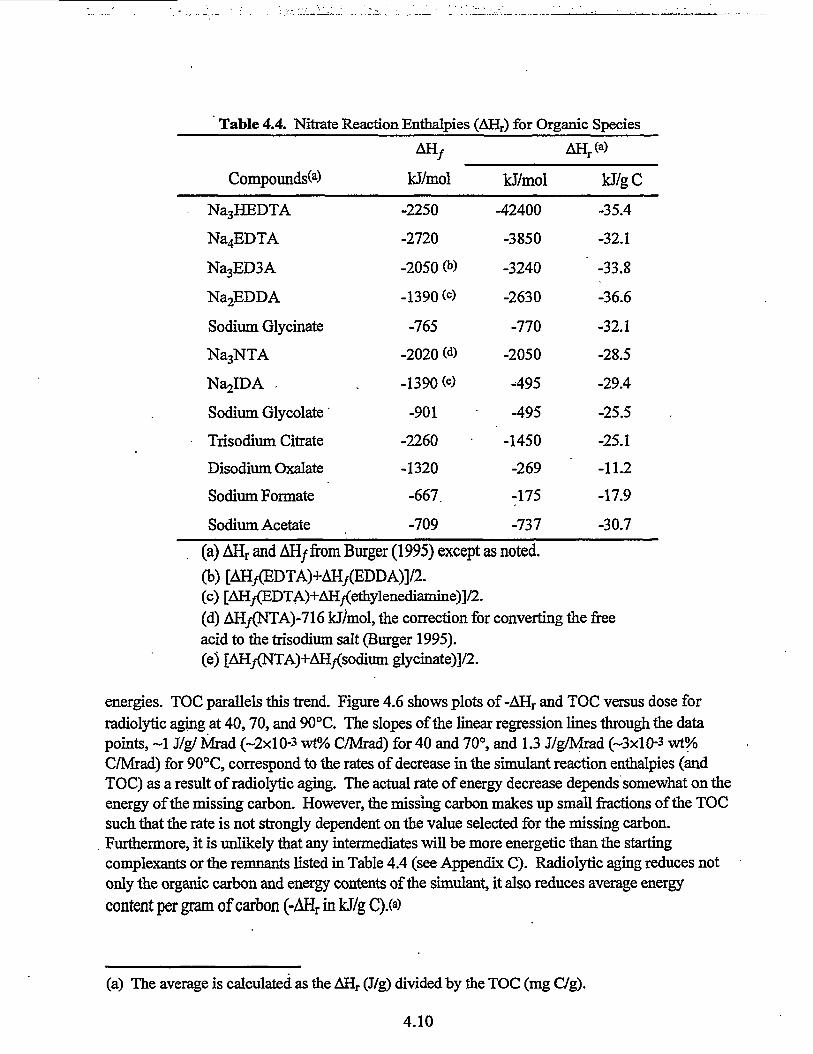
Table 4.4. Nitrate Reaction Enthalpies (AHr) for Organic Species
Compounds®
Na3HEDTA
Na4EDTA
Na3ED3A
Na2EDDA
Sodium Glycinate
Na3NTA
Na2IDA .
Sodium Glycolate
Trisodium Citrate
Disodium Oxalate
Sodium Formate
Sodium Acetate
AH/
kJ/mol
-2250
-2720
-2050 0»)
-1390 (<0
-765
-2020 («0
-1390 (e)
-901
-2260
-1320
-667.
-709
I
kJ/mol
-42400
-3850
-3240
-2630
-770
-2050
-495
-495
-1450
-269
-175
-737
IJ/gC
-35.4
-32.1
-33.8
-36.6
-32.1
-28.5
-29.4
-25.5
-25.1
-11.2
-17.9
-30.7
(a) AHr and AH/from Burger (1995) except as noted.
(b) [AHr(EDTA)+AH/EDDA)]/2.(c) [AH/(EDTA)+AH/(ethylenediamine)]/2.(d) AH/(NTA)-716 kJ/mol, the correction for converting theacid to the trisodium salt (Burger 1995).(e) [AH/(NTA)+AH/(sodiumglycinate)]/2.
free
energies. TOC parallels this trend. Figure 4.6 shows plots of-AHr and TOC versus dose forradiolytic aging at 40,70, and 90°C. The slopes of the linear regression lines through the datapoints, ~1 J/g/Mrad (-2x10⁻³ wt% C/Mrad) for 40 and 70°, and 1.3 J/g/Mrad (-3x10⁻³ wt%C/Mrad) for 90°C, correspond to the rates of decrease in the simulant reaction enthalpies (andTOC) as a result of radiolytic aging. The actual rate of energy decrease depends somewhat on theenergy of the missing carbon. However, the missing carbon makes up small fractions of the TOCsuch that the rate is not strongly dependent on the value selected for the missing carbon.Furthermore, it is unlikely that any intermediates will be more energetic than the startingcomplexants or the remnants listed in Table 4.4 (see Appendix C). Radiolytic aging reduces notonly the organic carbon and energy contents of the simulant, it also reduces average energycontent per gram of carbon (-AHr in kJ/g C).(a)
(a) The average is calculated as the AHr (J/g) divided by the TOC (mg C/g).
4.10

500
CO
<I
250 -
20012080
Dose (MRad)
160 0 40 80
Dose, (MRad)
120
Figure 4.6. Nitrate Reaction Enthalpy and TOC of Simulants Versus Dose at 40,70,and 90°C; SIM-PAS-95-1 c: (•) 70°C; SIM-PAS-95-ld: 40° (A) and (•)90°C
The average energy content and organic carbon content of the.simulants as a function of dose andtemperature are shown in Table 4.5. The average energy content started out at ~30 kJ/g C. After
Table 4.5.
Dose(Mrad)
0
28
43
65
40°C(b)
OrgCwt%
4.3
4.1
4.0
3.8
Effect of Dose on Organic Carbon Content and Average -AHr (*0SIM-PAS-95-1 Simulants
-AH,.(kJ/gC)
29.1
28.6
27.7
26.7
Dose(Mrad)
0
30
50
100
150
70°C(c)
OrgC(wt%)
4.5
4.4
4.3
3.9
3.7
-AHr
(kJ/gC)
. 29.9
28.6
27.8
26.8
25.3
Dose(Mrad)
0
22
50
114
146
90°C(b)
OrgC(wt%)
4.3
4.1
3.9
3.3
2.9
of
-AHr
(kJ/gC)
29.1
28.4
26.2
25.3
23.3 •
(a) AHr (J/g dry simulant) divided by TOC mg C/g dry simulant).(b) SIM-PAS-95-ld; (c) SIM-PAS-95-1 c.
4.11

a dose of 150 Mrad, the value had dropped to -23-24 kJ/g C. An 150 Mrad dose at 70°Creduced the organic carbon content of SIM-PAS-95-lc from 4.5 wt% C to 3.5 wt% C and, at90°C, reduced SIM-PAS-95-d from 4.3 wt% C to 2.9 wt% C. These results lend quantitativesupport to the idea that aging degrades the organic species in tank wastes to lower averageenergies and therefore results in safer storage conditions with respect to organic-nitrate reactions.
4.3 Experimental Section
All the chemicals used in this study were purchased from Aldrich Chemical Company,Eastman Kodak, or Baker Chemicals. Their purities were reagent grade or better, as defined bythe American Chemical Society, and the chemicals were not further purified. Water used forpreparing the simulant was deionized by a Milli-Q™ Deionization System (MilliporeCorporation, San Francisco, CA).
Sample irradiation experiments were performed in the PNNL y Facility described in Sec-tion 3.4. Vessels of the simulant are lowered manually into the irradiation tubes to the desiredflux, where they are left for a specific length of time to attain the required exposure. A gas-manifold system was connected to the reaction vessels, providing headspace gas, pressuremonitoring equipment^ and a port for headspace gas removal. A datalogger recorded both theautomated temperature and pressure measurements of the reaction vessels.
The cylindrical autoclave reactors used for this study were made from 316 stainless steel andwere of two volumes, 500 mL and 30 mL. The larger one was used for radiolytic aging tests andthe smaller for thermal aging tests. Reaction temperatures were measured by a K-thermocouplethat inserted through a port in the reactor cover to within 5 mm of the bottom. Another port wasconnected to the gas manifold via small-diameter stainless steel tubing. The reactors were heatedto operating temperatures by heating tape wrapped around the outside. Reaction temperatureswere maintained at set temperatures by feedback control (Bryan and Pederson 1994). Pressureand temperature in the vessel were monitored with a datalogger. The gas volume of the reactorsincludes the reactor headspace, the tubing that connects the reactor to the manifold, and theportion of the manifold dedicated to the reactor. The tubing and manifold volume was measuredto be 7.8 mL. The sample volumes were 130 mL for the large, 500-mL reactor and 13 mL for thesmall, 30-mL reactor. Thus, total headspace is 378 mL for the large reactor and 23 mL for thesmall reactor.
43.1 Simulant Preparation and Irradiation
The SIM-PAS-95-lc and -Id simulants are based on recipes published in the test plan(Carlson and Babad 1996) for tube propagation experiments (Fauske 1996). We noted thataddition of solid ferric nitrate to alkaline solutions containing nitrite ion produced copiousamounts of NO2 gas. On varying the order and timing of addition, we found that if sufficienttime (~2 hours) were allowed for ferric nitrate to dissolve and hydrolyze to ferric hydroxidebefore addition of nitrite, then no gas was evolved. Therefore, due caution should be taken inmixing the reagents in proportions or orders different from that recommended here or in the testplan (Carlson and Babad 1996). To avoid errors associated with dispensing aliquots of a hetero-
4.12

geneous simulant, the simulant was prepared in the reaction vessel before each irradiation bymixing together three homogeneous stock solutions (Appendix B, Table B.I 1). These solutionswere stored at approximately 4°C and were allowed to warm to room temperature beforevolumetric transfers were made. Simulant SIM-PAS-95-ld was prepared and dispensed asdescribed above for SIM-PAS-95-lc, except that the quantities of all components were doubledto allow a greater number of tests. The three solutions were stored in 1-L plastic containers,sealed with tape, and refrigerated. Solution 1, which had a total volume of 2 L, was divided intotwo bottles. For each test run in the large reactor, 100 mL of solution 1,20 mL of solution 2, and10 mL of solution 3 were added sequentially to the reactor. Test runs in smallreactors used 10,2, and 1 mL of the respective stock solutions. No NO2 gas was observed on mixing thesolutions. Control runs were similarly mixed and analyzed without exposure to radiation. Themeasured density of the simulant was 1.27 g/mL. Water content is estimated to be 64%.
The charged reactors were sealed and transported to the y irradiation facility, where the irradia-tion experiments were performed according to the procedures described hi Table B.12. The gasesgenerated during the irradiations were usually vented to the atmosphere, except for certain runsthat were selected for gas analyses. In these cases, the gases were collected in an evacuated vesseland analyzed by mass spectrometry (Goheen 1994).
4.3.2 Solution Phase Analyses
The reactor was cooled to room temperature, removed from the gas manifold at the y irradia-tion facility, sealed, and transported to analytical facilities. The contents were diluted 3.85-fold(130 mL in 500 mL for large reactor and 13 mL in 50 mL for small reactor) with deionized water.Aliquots of this were used for IC, IPC, ammonia, and carbonate analyses. EDTA and HEDTAwere quantified using IPC. Organic acid anions, including formic, glycolic, citric, and oxalic acids,were quantified by IC; nitrate and nitrite were also analyzed by IC. TOC was determined with acarbon analyzer. Analysis of dissolved ammonia (NH3)aq was performed with an Orion 720ApH/ISE (ion selective electrode) meter equipped with an Orion 95-12 NH3ISE (Burt 1989).
43.2.1 Ion Pair Chromatography Analyses of EDTA and HEDTA
Using a volumetric pipet, 1 mL of the diluted aqueous solution was placed in a 10-mLvolumetric flask to which 100 uL of 0.5 M Q1SO4 was added and diluted to volume with water.The solution was analyzed using a Waters Associates high-performance liquid chromatography(HPLC) instrumentation with columns and conditions listed hi Appendix B, Table B.13.
4.3.2.2 Ion Chromatography Preparation/Analyses of Organic Acids
Analyses were carried out using a Dionex model IC unit (Dionex Corp., Sunnyvale, CA)equipped with a Dionex, Model CD20 conductivity detector. Analyses of formate, oxalate, andcitrate were carried out using a Dionex AS-11 column. A Dionex AS-6 column was used forglycolate, acetate, and succinate analyses, because glycolate coreluted with acetate on the AS-11column. The standard concentrations bracketed the estimated concentrations of the samples.
4.13

The AS-11 chromatographic conditions are listed in Appendix B, Tables B.14 and B.15. Analiquot of the simulant solution (Section 4.3.2) was diluted 250-fold for these analyses.Themobile phase contained a gradient of deionized water and a weak solution of sodium hydroxidefor the AS-11 column. Two solutions, 5 mM and 100 mM NaOH, were prepared from 18.5 MNaOH stock solution. The water used to prepare the mobile phase and run the gradient wasstirred under vacuum for over 12 hours, and then sparged with helium to avoid interference fromdissolved carbon dioxide. Gradient conditions used for AS-11 column separation are shown inAppendix B, Table B.14. The column was allowed to equilibrate at initial conditions for at leastseven minutes before each run.
The mobile phase for the AS-6 column (Appendix B, Table B.I6) was made up of 0.4 mMheptafluorobutyric acid in deionized water. We used 5 mM tetrabutylammonium hydroxide as asuppression eluant. Concentrations were determined using a linear calibration curve.Quantification based on high dilution is not ideal but is possible, as the plots of standardconcentration versus response exhibit linear behavior down to 100 ppb for the key analytes.
4.14

5.0 Organic Aging in Tank Wastes
This section compares results of waste aging studies with waste speciation results, discusseskey factors such as dose rate, hydroxide concentration, and nitrite concentration that control ratesand yields of radiolytic aging, and gives estimates of the contributions that radiolytic and thermalaging have made and are likely to make in the future toward reducing the organic carbon andenergy content of organic tank wastes.
5.1 Organic Species Found in Tank Wastes
The preceding sections show that oxalate ion is a product of organic aging. Oxalate ion andTOC concentrations have been measured on samples from 52 single-shell waste storage tanks(SSTs). The data have been compiled in the Organic Complexant Topical Report (Meacham et al.1998). The results for seven tanks are inconclusive; the TOC concentrations are below 0.1% in13 tanks; the results for the other 32 are shown in Table 5.1. Seven SSTs had oxalateconcentrations sufficient to account for more than 75% of the TOC (BY-109, BY-102, BY-105,BY-107, BY-110, BY-111, BY-112, and C-106); 18 tank wastes had oxalate concentrationssufficient to account for 25 to 75% of the measured TOC (A-101, AX-101, AX-103, BX-110,BY-101, BY-104, BY-108, BY-110, S-101, S-102, S-106, S-107, SX-101, SX-106, S- l l l , U-107,and U-108). Seven tanks had less than 25% of the TOC identified as oxalate (A-102, AX-102,C-104, C-105, U-102, U-105, and U-106).
Samples from a number of waste tanks have now been speciated for organic compounds. Ingeneral, the analyses clearly show the wastes have aged to the same compounds found in agingstudies performed here and at Georgia Tech (Ashby et al. 1994). Some tanks have significantTOC that is not oxalate (AX-102, U-105 and U-106). Analyses of samples from these tanksshow that the organic inventory is consistent with partial aging of these wastes. Table 5.2 listsorganic results for several tanks (Meacham et al. 1998). The inventory of organic speciesincludes the original complexants, a variety of intermediate degradation products, formate, andoxalate.
The quantitative analyses shown in Tables 5.1 and 5.2 are consistent with laboratory agingstudies showing degradation of complexants to chelator fragments and carboxylate salts such asoxalate and formate. Oxalate ion appears to persist in the wastes, attaining higher concentrationsthan formate and many other aging intermediates. Oxalate ion probably has low reactivitycompared with the chelators and other fragments. Also, the solubility of oxalate ion in tankwaste supernates is very low (Barney 1995). Since oxidation of the organic species mainlyoccurs in the aqueous solution phase, these conditions favor the accumulation of oxalate ion inthe solid components of the wastes.
5.1

Table 5.1. Fractions of TOC that are Oxalate in Tank Wastesfo)
_, . - TOC %TOC ^ , TOC %TOC asTank • .„/ i . Tank J O / , .
wt%, wet as oxalate wt%, wet oxalateA-101
A-102AX-101AX-102
AX-103
BX-110BY-101
. BY-102BY-104
BY-105BY-106
BY-107BY-108
BY-109BY-110
BY-111
0.311.110.621.87
0.52
0.150.48
0.330.67
0.730.51
0.520.39
0.330.64
0.55
44'223812
436274
>9952
9575
7946
8543
86
BY-112C-104C-106S-101
S-102
S-106S-107
S-lllSX-101
SX-106U-102
U-103U-105
U-106U-107
U-108
0.71
1.001.340.22
0.33
0.230.20
0.170.53
0.390.74
0.641.23 •
2.160.18
0.42
9611
>9952
5758677156
3618
922
1238
27(a) TOC concentrations are mean values calculated from the best basis inventory and % carbonas oxalate ion evaluated from inventory or sampling data.
5.2 Radiolytic Aging in Wastes
To extrapolate effects observed in aging studies of waste simulants, we must understand therelationship between reaction conditions and radiolytic yields. We consider two kinds of effects:dose rate effects and matrix effects. Rates of radiolytic aging are governed by the dose rate. Itdetermines the rate of production of oxidizing radicals. After that, the physical and chemicalproperties of the organic species and the medium determine organic reactivity.
5.2.1 Effects of Dose Rate, Nitrite, and Hydroxide on Radiolytic Yields
Radiation flux, nitrite, and hydroxide are all expected to affect the radiolytic yields of organicdegradation. As we have shown for formate oxidation (Section 3.2.1), nitrite and hydroxide con-trol the yield and distribution of products from OH(O~) and NO2 attack. For example, O~ andOH convert nitrite ion to NO2 and also convert NO32- to NO. Since NO is not a strong, effectiveoxidant of organic complexants, this latter reaction causes the radiolytic yield of organic productsto follow an inverse dependence on nitrite concentration. The dose rate is hot expected to affectthe yield of primary radicals and followup reactions that generate NO2 and NO. However, sincereactions of NO2 with organic species compete with NOX hydrolysis reactions that
5.2

Table 5.2. Analyses of Organic Species (wt%) in Tank Waste Samples
Tank Sample
A-101C154S10UH
A-102 96-AUG-3
AW-101 C139 S21 UH
AX-102 95-AUG-007
B-106 C93 SI UH
BY-102 C157 S4
BY-104C116SLG
BY-105 C108 SI DL
BY-107 C161 SI
BY-110C101S7
BY-110C103S4UH
BY-11OC113S8
C-104C162S2UH
C-105 C76 SI DL
C-201 TNK COMP
U-105 C136 S7UH
U-106 C148 S2UH
U-107 C134 SLG
U-108C141S4UH
Acetate
0.214
0.174
0.093
0.0032
0.0119
0.108
0.140
0.0939
0.0451
0.0713
0.2530
0.226
0.0951
0.0705
0.0356
0.0385
0.0595
Citrate
0.127
0.0165
0.509
3.020
0.208
0.390
0.386
0.591
0.0900
Glycolate
0.0473
0.7700
0.399
0.451
0.160
Formate
0.269
0.165
0.0988
0.4780
0.0115
0.0040
0.0874
0.0603
0.0350
0.0119
0.190
0.0459
0.0169
0.718
0.267 '
0.116
0.184
Oxalate
3.764
1.444
1.045
1.795
6.825
5.350
2.606
9.468
3.680
0.044
0.227
0.0511
3.720
0.825
0.475
0.237
0.503
EDTA4-
0.0191
0.302
0.404
0.633
O.0993
HEDTA3- IDA2"
0.147 1.188
0.538
0.667
0.026
NTA3-
0.0064
0.101
0.107
TOC
1.22
1.03
1.51
3.49
0.20
1.94
1.75
0.18 .
0.88
2.09
0.75
0.21
0.91
0.35
2.17
2.37
0.15
0.63

are second order,'lowering the rate of generation of radicals increases the yield of organic oxida-tion from NO2. We demonstrate these effects with the model for formate oxidation (seeTable 3.3) by reducing the rate of generation of NO32- (from e"), OH, and H radicals to simulatethe effects of changing the dose rate from 0.1 Mrad/hr to 10 rad/h (equivalent to changing the rateof radical and production from 10-7 to 10-u M/s). Results are shown in Table 5.3 and Figure 5.1.
The yield of CO32- increases significantly as the dose rate is decreased, approaching limitingvalues of ~1.9 and 2.9 molecules/100 eV for high and low nitrite concentrations, respectively.Table 5.3 shows the percent (in parentheses) of formate that is oxidized by each oxidizing radical.
Table 5.3. Summary of Radiolytic Aging Model Showing Effects of Dose Rate, Nitrite, and
Hydroxide on Radiolytic Yield and Distribution of Oxidizing Species
[Formate]
0.05
0.03
0.05
[NO2-]
1.25
0.03
1.25
[OH-]
2
2
0.1
G(CO32") and Relativemolecules/100 <
105 Rad/h
0.66
2.5
0.51
(55:42:2:0)
(5:93:1:1)
(84:8:8:0)
Contributions by OxidantssV (NO2:O~:OH:H)
101 Rad/h
1.9 (84:15:1:0)
2.9 (19:79:0:1)
1.9 (96:2:2:0)
> 3o>oo
"wfl) p
u
"o
I
CMmoo
o
1 t 1 1 1 1 1
1 11 I 1 • S B
t
1 1 1 \
_ 1
• B«
1 • • • •
•m.
s
-A
B
C
1
• • m
N
• • • •
• I I I
102 103 104
Dose Rate, Rad/h
105
Figure 5.1. Effects of Dose Rate, Nitrite, and Hydroxide on the Radiolytic Yield of CO32-from Formate: (A) 0. 03 M HCO2", 0.03 M NO2", 2 M OH"; (B) 0.05 MHCO2", 1.25 M NO 2 ' 2 M OET; (C) 0.05 HCO2", 0.05 M NO2" 0.1 M OH"
5.4
The increase is largely due to increased efficiency of formate oxidation by NO2. The steady-stateconcentrations of NOX radicals decrease with dose rate, and the rates of NO2 termination(Equations 2.5 and 2.6) decrease too. The yields of primary radicals (OH, e-, and H) total6.1 molecules/100 eV. The stoichiometry is two oxidants per CO32-, so a maximum yield of3 CO327IOO eV is theoretically possible. The oxidations at the lowest dose rate are still less than100% efficient. With high nitrite ion, a significant fraction of NO32- and essentially all H atomsare converted to NO (Equation 5 in Table 3.3). With low nitrite ion, less of these oxidantsconvert to NO, and the yield of CO32- increases. The competing reactions of OH with NO2~ andOH" (Equations 2.1 and 2.5) cause the yield of CO32- to vary inversely with hydroxide ion (seeFigure 5.1 and Table 5.3). The effect is smaller than the effect of nitrite ion and is moreimportant at high dose rates because the steady-state concentration of NO2 is proportional todose rate. The fraction of NO2 that disproportionates (Equations 2.7) or oxidizes NO (Equation2.8) is thus greater at higher dose rates. In summary, the modeling results strongly support theidea that NO2 is the dominant oxidizing species in tank wastes (Meisel et al. 1991b, 1993,1997).They also paint important roles for O", OH, and NO.
5.2.2 Radiolytic Contribution to Organic Aging in Tank Wastes
To estimate the amount of aging that has occurred or will occur in a given tank waste, wedefine a coefficient for radiolytic aging as the change in heat content or organic carbon content perMrad of absorbed dose. Equating change per unit time with the product of the dose rate and thecoefficient of aging gives an equation that expresses the rate of change in energy content ororganic carbon content as a function of dose rate. For example,
d[C]/dt = -cF (5.1)d(-AHr)/dt = -hF (5.2)
where [C] is organic carbon concentration, AHr is the heat content of the waste, c and h arecoefficients of aging for changes in carbon and hi heat content, respectively, and F is radiation flux(dose per unit tune). Since the dose rate is determined mainly by radioactive decay of 137Cs and90Sr with half-lives of 30 and 28 years respectively, knowledge of the dose rate, Fo, at time, to,allows the rate of change at time, t, to be written
d[C]/dt= -cF0e-o.0239(t-t0) (5.3)d(-AHr)/dt = -hFoe-o.0239(H,) (5.4)
where the constant 0.0233 is the average of decay rate constants for 90Sr and i3?Cs in y-i.
Integration of Equations 5.3 and 5.4 leads to expressions for the change that occurs during thetune interval t-to:
A[C] = 41.8[l-e-0.0239(t-to)]cFo (5.5)
r = 41.8[l-e-0.0239(t-to)]hFo (5.6)
5.5

where t is in years, 41.8 years is the reciprocal of the exponential decay constant (0.0239 y-i), cis the aging coefficient in wt% C/Mrad, h is the aging coefficient in J/g/Mrad, and Fo is theradiation flux at to in Mrad/y.
In Section 4.2, we calculated aging coefficients from speciation data for radiolytic aging of thePAS-95-1 simulant. The coefficients for this simulant are 1.0 J/g/Mrad at 40 and 70°C and1.3 J/g/Mrad at 90°C. In terms of TOC, the coefficients are 2.3x10-3,2.0x10-3, and3.2x10-3 wt% C/Mrad at 40,70, and 90°C, respectively.
Coefficients for aging can be derived from other basic information. The radiolytic yield ofoxidants is expected to be ~6 molecules/100 eV absorbed dose (Meisel et al. 1997). Thistranslates to 6x10⁻³ moles/kg waste/Mrad.(a) Because the oxidants are one-electron oxidants, andwhereas products have even numbers of electrons, the stoichiometry for conversion is generally2 moles of oxidants per mole of reactant converted (Equations 5.7-5.9).
EDTA4- + 2 NO2 + 3 HO" -> NTA3- + IDA2- + 2 NO2" + H2O + H2 (5.7)
EDTA4' + 2 NO2 + 4 HO" -> ED3A3- + HCO2" + CO32- + 2 NO2" + H20 + H2 (5.8a)
EDTA4- + 2 NO2 + 2 HO" -> ED3A3- + C2O42- + NO3" + NH2OH (5.8b)
EDTA4- + 2 NO2 + 4 HO" -» ED3A3- + 2 CO32- + NO3" + NH3 + H2O (5.8c)
EDTA4- + 2 NO2 + 3 HO" -> ED3A3- + HCO2" + CO32- + NO3" + NH2OH (5.8d)
EDTA4- + NO2 + NO + 3 HO" -> ED3A3- + HCO2" + CO32- + NO2" + NH2OH (5.8e)
HOCH2CO2" + 2 NO2 + 2 HO" -> C2O42- + 2 NO2~ + H2O + H2 (5.9)
Mechanistic studies show that the nitrogen-containing complexants cleave carboxymethylgroups, giving formate, carbonate and oxalate ions. If reactions such as Equation 5.8a are dom-inant, a maximum value of 3.7x10⁻³ wt% C/Mrad would be obtained for the TOC aging coef-ficient.0>) This is about 1.1-1.8 times the TOC coefficients measured for the PAS-95 simulants.However, for reasons discussed in Section 5.2.1, we should not expect theoretical yields to beobtained at the high doses used in simulant aging studies. Also, to the extent that pathways tooxalate ion such as Equation 5.9 occur, yields of carbonate ion will be smaller.
The aging coefficient in energy units is derived by calculating the enthalpy change for knownor plausible oxidation pathways of the complexants and their fragments. Multiplying theseenthalpy changes by the radiolytic yield gives the aging coefficient for the reaction path. Typicalvalues for oxidation reactions of complexants are summarized in Table 5.4. In general, we find
(a) The conversion from molecules/100 eV to 10-3 mol/kg/Mrad is as follows:
1 molecule lmol leV 1 J/kg 3 mol/kgX X X ••• 1 •\JeT X 1 U
100 eV * 6.02 x 1023 molecule 1.6 x 10"19 J 100 rad • " Mrad
(b) If G= 3 molecules/100 eV for carbonate production, then 3.1x10⁻³ moles CO32-/kg/Mrad areproduced such that
c = 3.1 x 10⁻³ m°}f^S x 12-^f- = 3.7x l O " 2 - ^ ^ - or3.7x 10~3wt%C/MradMrad mol Mrad
5.6

Table 5.4. Changes in Nitrate Reaction Enthalpies Due to Aging Reactions
Reaction Type
R2NCH2-CH2NR2
R2NCH2-CH2NR2
R2NCH2CO2"->Ii
R2NCH2CO2-^F
H O C H 2 C O 2 " ^ C
HCO2" orC2O42"-
-^2HCO2~ + R2NH
-» R2NCH2CO.
LNH + HCO,-.
^NH + C2O42-
2O42-orHCO2"
^ 1 or 2 CO32"
f + RjNH
v CO32-
+ CO32-
AAH,.
-540+60
-410+30
-330±20(a)
-350+20(a)
-330
-170±10
Aging Coef.
1.1
0.8
0.7
0.7
0.7
0.3'
(J/g/Mrad)
1.6
1.2
1.0
1.1 .
1.0
0.5
(a) Value for sodium salt of glycine is —50% greater than average.
values for oxidation reactions of complexants are summarized in Table 5.4. In general, we findthat the aging coefficients for reactions cluster between 0.3 and 1.6 J/g/Mrad with values of ~1predominating for reactions in Equations 5.7 through 5.9.
Contributions to radiolytic aging up to the present and into the future can be estimated withknowledge of the waste dose rates. Stauffer (1997) reports current y dose rates, historicaly doses, and past and current temperatures for SST wastes. Best-basis tank inventories of 9°Srand l37Cs are listed in the Tank Waste Inventory Network System (TWINS).(a) We estimateddose rates that included contributions from 90Sr (a |3 emitter) using Equation 5.10:
(CiCsx0.8MeV+Ci&x 1.13 MeV) 3 rad-kg « , m
DoseRate=- L - - , . . . * ^x2.13xlO 3 ZT r f ^ (5-10)kg Waste h • Ci • MeV
where the units for dose rate are rad/h and 0.8 MeV and 1.13 MeV are average decay energies for137Cs and 90Sr, respectively (Meisel et al. 1991a; Spinks and Woods 1964).0>) For many tanks,the contribution from 90Sr is negligible. However, for some tanks of interest such as AX-102(TOC ~5.7 wt% C, wet), the dose rate computed in Equation 5.10 is 2300 rad/h, seven-foldgreater than the y dose rate estimated by Stauffer (1997). Using average aging coefficients (~1J/g/Mrad and 2.4 x 10⁻³ wt% C/Mrad) and a starting dose rate of 3700 rad/h (ca. 1978), wecalculate from Equations 5.5 and 5.6 that the energy decrease over a 50-year period would be-950 J/g (2.3 wt% C). Tanks U-105 and U-106, with -1.2 wet wt% carbon, have dose rates of-450 and 490 rad/h, respectively, according to Equation 5.10, compared with 200 and 215 rad/h
(a) TWINS 2 database is on the World-Wide Web (http://twins.pnnl.gov:8001/).
(b) The factor in Equation 5.10 is derived as follows:
_ 1.33 x 10¹⁴ disentigrations/h 1.6xlO"13J 100rad 3 rad-kgfactor- Ci/disentigration x MeV x J /kg " 2 - 1 3 x 1 0 h-Ci-MeV
5.7

y dose rates estimated by Stauffer (1997). Using a starting dose rate of ~760 rad/h (ca. 1978), wecalculate that the energy decrease over a 50-year period will be only 200 J/g (0.5 wt% C).
5.3 Thermally Activated Organic AgingNon-radiolytic (thermal) decomposition reactions contribute to aging. When tank
temperatures are high, thermally activated processes can rapidly age the organic constituents.The results for thermal aging of the PAS-95 simulant (see Section 4) shows that TOC and energycontent decrease with increasing time of exposure at 90°C. Analytical results show thatHEDTA, glycolate, and citrate were degraded and that carbonate grew in approximately linearlywith time. The initial rates of carbonate production were 0.6 wet wt% C/y in the presence of O2and 0.3 wet wt% C/y in the absence of O2. Extrapolated over several years, this rate ofproduction could yield significant reductions in TOC.
Tank wastes at higher temperatures show more aging than those at lower temperatures. Forexample, of Tanks A-101, AX-102, U-105, and U-106, only A-101 has a significant fraction(44%) of its TOC as oxalate. The dose rate for U-105, U-106, and A-101 are relatively low.Stauffer (1997) estimates the y dose rate for A-101 is 301 rad/h. The amount of 90Sr in A-101 is~8 times smaller than the amount of i3?Cs, so the p dose rate is inconsequential. Stauffer (1997)lists the historical temperatures of A-101, AX-102, U-105, and U-106 as 79,46,35, and 36°C,respectively; current temperatures are 66,27,34, and 35°C (Stauffer 1997). Review of tempera-ture measurements for U-106GO shows that in or about 1976, U-106 was filled with waste thatwas only ~50°C; it then cooled rapidly to ~30°C. Under such conditions, little thermal agingwould have occurred. The fraction of TOC that is oxalate in U-106 is only 12% (see Table 5.2).The aging that has occurred (see Table 5.2) can be attributed to radiolytic effects. Tank A-101waste was ~80°C when it was filled; current temperature is ~66°C. Accordingly, a significantfraction (44%) of the TOC in this waste is oxalate. We conclude that the degree of aging dependson the temperature history of the waste.
5.4 Rates of Aging in High Heat-Load Waste Tanks
Certain tanks such as AZ-101 and AZ-102 have significant enough radionuclide inventoriesthat dose rates and temperatures are elevated more than other tanks. These tanks must beactively ventilated to maintain supernatant temperatures below bulk waste or supernate boilingpoints. If active ventilation were interrupted, the wastes could dry out within several years andperhaps heat these wastes enough to cause bulk runaway reactions. However, if the complexantsin these wastes are substantially aged already, or age rapidly during the time that water is boiledoff, the propagation hazard will be mitigated.
The results and discussion in previous sections provide information that may be used toestimate rates of thermal and radiolytic aging for these tanks. The PAS-95 aging experiments
performed with and without irradiation provide baseline data for estimating complexant aging toacetate, succinate, formate, oxalate, and carbonate. Table 5.5 lists the thermal rate of formation
(a) TW1NS2 database, http://twins.pnl.gov:8001/.
5.8

Table 5.5. Radiolytic Yield and Thermal Rates of Formation ofAging Products from PAS-95 Simulants at 90°C
Aging Product
Formate
Acetate
Succinate
Oxalate
Carbonate
Radiolytic Yield
0.007
0.0003
0.008
0.001
0.036
Thermal(a)
(gC/kg/y)
1
5
3
2.3
(a) In the absence of O2.
and the radiolytic yields measured at 90°C. Multiplying the radiolytic yield by the dose rate(Mrad/y) gives a rate of formation that can be combined with the thermal rate of aging to obtainan overall rate.
The AZ-101 and AZ-102 wastes may be similar to the PAS-95 simulants, but they certainlyare not identical. Therefore, the rates in Table 5.5 must be scaled to correct for differences. Forthermal aging, studies (Ashby 1994; Delegard 1987) suggest that rates of aging depend on TOC,aluminate, hydroxide and nitrite concentrations. Also, gas production rates show large tempera-ture dependencies with Ea~ 90 kJ/mol (Ashby 1994; Person 1996; Pederson and Bryan 1996).Therefore, the PAS-95 thermal aging rates (^thermal) may be scaled as in Equation 5.11:
[OH-] [NO;] 4 ( W 4 ) f 5 i n
where rWjthermai is the thermal rate of waste aging and the factors corrected for concentration andtemperature differences from simulant results (denoted with s subscript). Assuming a boilingtemperature for tank supernates of ~120°C, the exponential factor in Equation 5.11 is 9.7 forEa = 90kJ/mol.
As discussed in Section 5.2.2, the radiolytic rate depends mainly on dose rate and radiolyticyield of oxidants. If concentrations of organic complexants are sufficiently high, then the yield ofproducts may approach or even exceed one-half the yield of oxidants. If TOC concentrations arenot sufficiently large to scavenge oxidants competitively with disproportionation reactions(Equations 2.7 and 2.8), then smaller yields may occur. Since TOC in the AZ tanks is signifi-cantly less than in PAS-95 simulants, the expression for computing radiolytic aging ratesi/w,radioiytic) from PAS-95 simulant radiolytic aging rates (/Vyadioiytic) includes a scaling factor forTOC (Equation 5.12):
TOC
5.9

Table 5.6 lists characterization data taken from a double-shell tank composition statusquarterly report^) Data are provided for liquid and sludge fractions of the wastes, and a thirdentry for each tank shows data taken from the best Basis Inventory/Best Basis/TCR TankInventory database. These data are used to obtain average total dose rates and TOCconcentrations for entire tank wastes.
Table 5.6. AZ-101 and AZ-102 Characterization Data
T o , w . Vol H2O _ _ TOC TOC nsjo-, r A 1 1 ^ r n t n a>Sr i37CsTank Waste ( k L ) ^ SpG ( g / L ) ( w t % ) \NO2~] [Al]« [Off] cykg c i / k g
3230 70.7 1.21 1.13 0.093 1.35 0.03 0.75 0.0011 1.4
132 43.1 1.48 13.50 0.91 1.39 0.03 0.75 . 33 1.5
AZ-10105) 3280 1.22 1.85 1.5 1.6 1.9
f^'l02 . 3000 82.9 1.11 1.62 0.15 0.65 0.06 0.12 0.0017 1.0
liquid
357 53.8 1.41 6.35 0.45 0.59 0.06 0.13 7.0 0.81
AZ-102(fa) 3360 1.14 1.7 1.5 0.97 1.1(a) From sample analysis data in the Tank Waste Inventory database.(b) Values derived from Best Basis Inventory database, except that specific gravity (SpG) is weightedaverage of values for liquid and sludge fractions.^)
Table 5.7 lists the resulting aging rates calculated using Equations 5.11 and 5.12. Rates areestimated for liquid (supernate) fractions and for the entire waste. The entire waste estimateassumes that the total dose rate from solid and liquid fractions contributes to radiolytic aging.
Table 5.7. Estimated Rates of Organic Aging to Carbonate, Formate, and Oxalate Ions at120°C in AZ Tank Wastes
Tank
WasteAZ-101 (L)(a
AZ-101
AZ-102 (L)(a
AZ-102
TOC
(gC/kg)
> 0.93
1.4> 1.5
1.5
Dose
Rate
(MRad/y)30572136
.Thermal Rate(gC/kg/y)
co,2- co42-
0.3 . 0.2
0.1 0.04
Radiolytic Rate(gC/kg/y)
co,2- co42-
0.07 0.020.13 0.030.07 0.020.13 0.03
Total Rate^(gC/kg/y)
CO,2' CO 42 '
0.3 0.20.4 0.20.1 0.060.2 0.1
(a) Liquid (supernate) fraction.(b) Sum of radiolytic and thermal rates; entries for entire waste are sums of liquid thermal ratesand entire waste radiolytic rates.
(a) StaufferLA. September 2,1997. "Double-Shell Tank Composition Status—QuarterlyReport." Memo 74650-97-013, Lockheed Martin Hanford Corporation, Richland, Washington.
5.10

Thermal aging is assumed to occur only in the liquid fraction because the complexants, exceptoxalate (Barney 1995), are very soluble. . So the liquid thermal rates are combined with the entirewaste radiolytic rates to obtain the total entire waste aging rate. Because 90Sr is largely in thesludge fraction and i37Cs mainly in the liquid fraction, the entire waste rate estimates effectivelycombine the radiolytic effects of both *37Cs and 90Sr decay. For this reason, the rates are higherthan the liquid aging rates. Since the supernates will concentrate over time, these aging rates mayincrease as the radionuclides and reactants concentrate.
In conclusion, the results suggest that if the wastes were allowed to heat to boiling, much of
the existing inventory of TOC would convert to carbonate and oxalate within two to five years.The results for AZ-101 sum to ~0.6 g C/kg/y (average of the sum for liquid and entire waste agingrates to carbonate and oxalate ions) so that the TOC would oxidize in two to three years. Theestimated drying time for AZ-101 is four years (Meacham 1998). The AZ-102 rates sum to~0.3 g C/kg/y, so the TOC in this tank would convert to oxalate and carbonate ions in about fiveyears. The estimated time for AZ-102 to dry out (Meacham 1998) is 10 years. The rates ofconversion to carbonate ion are about two times the rates to oxalate ion. However, the PASsimulant measurements model the disappearance of the more reactive, more energetic carbonremaining in the waste, i.e., the higher energy carbon of the original complexants and theirimmediate remnants such as NTA and IDA. The AZ-101 and AZ-102 wastes are already aged.(a)Therefore, if one-third of the TOC is now oxalate, then the TOC in these tanks may age to equalamounts of carbonate and oxalate ions during the times it would take the wastes to dry out in theevent that active cooling is interrupted. Significant production of formate, acetate, and succinateis also predicted by the PAS-95 model (see Table 5.4). These compounds are less reactivethermally (Ashby et al. 1994) and radiolytically (see Table 3.1) than the nitrogen containingcomplexants and their remnants. .However, as they build up and more reactive species disappear,radiolytically generated oxidants may be expected to degrade these remnants to oxalate andcarbonate ions as well.
(a) During sludge characterization and washing tests on AZ-102, TOC was noted to be five timeshigher in the sludge than in the supernate (Herting DL. 1995. Caustic Washing of Sludge Samplesfrom Tank AZ-102. Memo 75764-PCS95-086, Westinghouse Hanford Company). Indeed,characterization data (Stauffer LA. 1997. "Double Shell Tank Composition Status— QuarterlyReport." Interoffice Memo 74650-97-013, Lockheed Martin Hanford Corporation) compiled inTable 5.6 show that a disproportionate amount of TOC appears in the sludge fractions: AZ-101sludge is 5% of the waste mass but contains 33% of the TOC; AZ-102 sludge is 13% of thewaste mass but 32% of the TOC. Considering the low solubility of sodium oxalate (Barney1995) in supernates, it is probable that the TOC in the sludge is mainly oxalate, which wouldindicate that significant aging of the complexants in these wastes has already occurred.
5.11

6.0 Conclusions
The Waste Aging Studies task has shown that radiation and heat promote redox reactionsbetween organic compounds (reducing agents) and nitrates/nitrites (precursors to oxidizingagents) in the wastes. Radiolysis and heating of waste simulants causes conversion of NC>3~ toNO2", N2, and N2O and probably NH3 concurrent with the disappearance of organic species andappearance of highly oxidized fragments of the original species. The observations are consistentwith progressive degradation to species with more C-0 bonds and fewer C-H and C-C bonds,resulting in an overall lower energy content of the organic inventory.
6.1 Effects of Aging on Organic Nitrate Reaction Enthalpies
The simulated waste aging studies using the PAS-95 simulants show quantitatively thatenergy content of the wastes should decrease due to aging (see Table 3.6).. The theoretical energycontent of the simulants declined steadily with increasing radiolytic dose; a radiation dose of100 Mrad at 70°C decreased the energy content of the waste simulant by ~25% from a startingvalue of ~1300 J/g dry simulant. Much of the remaining enthalpy is due to undegraded glycolate,citrate, and chelator fragments. We also established that the decline in energy content is tempera-ture dependent, declining more rapidly at 90°C man at 40 or 70°C. Aging occurs at a muchslower rate in the absence of radiation, but for long storage times at elevated temperatures, certainspecies, namely HEDTA, citrate, and glycolate, are susceptible to thermal degradation (see alsoDelegard 1987; Ashby et al. 1993; Barefield et al. 1995,1996). The results suggest that'lifetimesand aging rates of organic complexants are strongly dependent on radiolytic and thermal histories.This partly explains the tank-to-tank variations in organic aging (based on organic analyses)observed in actual waste samples (see Tables 5.1 and 5.2).
TOC measurements have been obtained from a significant number of tank wastes. Theseresults have been used to screen for tanks that could have sufficient fuel to undergo propagatingreactions (Webb et al. 1995; Meacham et al. 1998). The assessment essentially converts TOC toenthalpy by assuming a proportionality factor:
AHr(kJ/g waste) = TOC (mg/g waste) x AH (kJ/g C) (6.1)
Presently, the conversion factor is taken to be thereactionenthalpy of sodium acetate. OurPAS-95 simulants aging tests suggest that the actual conversion factor decreases as a consequenceof aging. Recent analytical data (see Table 5.2) for actual waste samples enables the reactionenthalpy of the samples to be calculated. We estimated the enthalpies per gram of carbon in thesamples and found that the energy was only ~70% of the energy for pure acetate. Thus, ascurrently used, TOC is a conservative, and therefore a useful initial screen for problem tanks.
6.1

6.2 Mechanistic Understanding of Organic Aging
Mechanistic and kinetic results of Waste Aging Studies corroborate the hypothesis (Meisel etal. 1991b, 1993,1997) that NO2 is the dominant radical responsible for radiolytic oxidation ofcomplexants. We note that the reactivities of citrate, glycolate, EDTA, and HEDTA measured insimple homogeneous simulants of Section 3 are comparable to those observed in the morecomplex heterogeneous simulants studied in Section 4. This suggests that the same oxidizingspecies are acting in homogeneous and heterogeneous systems. The modeling results for formateand glycine suggest mat the oxidizing species in alkaline systems are primarily NO2 and O~.However, under conditions likely to be encountered in actual wastes such as low dose rates, thedominant oxidizing species is NO2 (see Table 5.3).
The modeling effort provides the first measurements of rate constants for reactions of NO2with carboxylates and complexants. The absolute rate constant for formate is ~10 M-is-i and,for glycine, 70 M-is-i. The ratio of these rate constants agree well with the relative reactivitieslisted in Table 3.1. Thus rate constants for the other complexants may be estimated from newlydetermined relative rate constants.
Finally, the multiple roles that nitrite plays are noteworthy. First, it reduces OH/0" andforms NO2. Second, it oxidizes NO32- radicals (formed by reaction of electrons with NO3",Equations 2.3 and 2.4 and 3 of Table 3.3). This reaction acts to reduce the efficiency ofradiolytic aging. It has a small rate constant and requires high nitrite concentrations. Thirdly,nitrite ion combines with organic radicals, thereby facilitating the conversion of complexants tosimple innocuous products such as oxalate, formate, and carbonate. Without this step, theproducts from complexants would be complicated (see Figure 3.7) and perhaps more troublesomeissues for storage, retrieval, and pretreatment activities. Finally, nitrite also is required forthermal degradation of complexants.
6.3 Recommendations
Although the safety issue surrounding safe storage of organic wastes nears closure, we suggestdirections that continued studies could follow. We note that the product identifications andsubsequent modeling of the reactions of higher complexants are incomplete. We suggest thatcontinued work to expand the model is worthwhile, especially if the effort also leads to theaddition of thermal and thermal-plus-radiolytic reaction mechanisms, so the combined processescan be modeled and understood. Steps for reactions that lead to gaseous products may also beadded so that the model yields information about generation rates and distributions of gaseousproducts. The acquisition of such capabilities could facilitate resolution of flammable gas safetyissues as well as answer questions regarding reactions that may be induced by retrieval andpretreatment activities.
6.2

7.0 References
AgnewSF. 1996a. Hanford Defined Wastes: Chemical and Radionuclide Compositions.LA-UR-94-2657 Rev. 2, Los Alamos National Laboratory, Los Alamos, New Mexico.
AgnewSF. 1996b. Hanford Tank Chemical and Radionuclide Inventories. LA-UR-96-858, LosAlamos National Laboratory, Los Alamos, New Mexico.
Agnew SF. 1996c. History of Organic Carbon in Hanford HLW Tanks: HDWModel Rev. 3.LA-UR-96-989, Los Alamos National Laboratory, Los Alamos', New Mexico.
Allen GK, 1976. Estimated Inventory of Chemicals Added to Underground Waste Tanks, 1944Though 1975. ARH-CD-610B, Atlantic Richfield Hanford Company, Richland, Washington.
Aired SE, DLH Williams, and M Garley. 1982. JChem Soc JPerkin Trans 77:777-782.
Ashby EC, F Doctorovich, CL Liotta, HM Neumann, EK Barefield, A Konda, K Zhang, andJ Hurley. 1993. "Concerning the Formation of Hydrogen in Nuclear Waste. Quantitative
Generation of Hydrogen via a Cannizzaro Intermediate." JAm Chem Soc 115:1171.Ashby EC, A Annis, EK Barefield, D Boatright, F Doctorovich, CL Liotta, HM Neumann,A Konda, C-F Yao, K Zhang, and NG Duffie. 1994. Synthetic Waste Chemical MechanismStudies. WHC-EP-0823, Westinghouse Hanford Company, Richland, Washington.
Barefield EK, D Boatright, A Deshpande, F Doctorovich, CL Liotta, HM Neumann, andS Seymore. 1995. Mechanisms of Gas Generation from Simulated SY Tank Farm Wastes:FY1994 Progress Report. PNL-10822, Pacific Northwest Laboratory, Richland, Washington.
Barefield EK, D Boatright, A Deshpande, F Doctorovich, CL Liotta, HM Neumann, andS Seymore. 1996. Mechanisms oj'Gas Generation from SimulatedSH'TankFarm Wastes:FY1995 Progress Report. PNNL-11247, Pacific Northwest Laboratory, Richland, Washington.
Barney GS. 1995. The Solubilities of Significant Organic Compounds in HLW Tank SupernateSolutions. WHC-SA-2565-FP, Westinghouse Hanford Company, Richland, Washington.
Bhattacharyya SN and NC Saha. 1976. Radiat Res 68:234-43
Braun W, JT Herron, and DK Kahaner. 1988. "Acuchem: A Computer Program for ModelingComplex Chemical Reaction Systems."/Chem Kinet 20:51-62.
Bryan SA and LR Pederson. 1994. Composition, Preparation, and Gas Generation fromSimulated Wastes of Tank 241-1OJ-SY. PNNL-10075, Pacific Northwest Laboratory, Richland,Washington.
Burger LL. 1995. Calculation of Reaction Energies andAdiabaiic Temperatures for Waste TankReactions. PNL-8557 Rev 1, Pacific Northwest National Laboratories.
BurtRW. 1989. Ammonia (nitrogen) in Aqueous Samples. PNNL-ALO-226 RO,-226.1,-226.2, -226.3, Pacific Northwest Laboratory, Richland, Washington.
7.1

BuxtonGV. 1969. Trans. Faraday Soc. 65:2150-8.
Buxton GV, WP Greenstock, WP Helman, and AB Ross. 1988. "Critical Review of RateConstants for Reactions of Hydrated Electrons, Hydrogen Atoms, and Hydroxyl Radicals(OH/0") in Aqueous Solution." J. Phys. Chem. Ref. Data, 17:513.
Camaioni DM, WD Samuels, SA Clauss, BD Lenihan, KL Wahl, JA Campbell, and WJ Shaw.1995. Organic Tanks Safety Program FY95 Waste Aging Studies. PNNL-10794, PacificNorthwest National Laboratory, Richland, Washington.
Camaioni DM, WD Samuels, JC Linehan, SA Clauss, AK Sharma, KL Wahl, JA Campbell.
1996. Organic Tanks Safety Program FY96 Waste Aging Studies. PNNL-11312, PacificNorthwest National Laboratory, Richland, Washington.-
Camaioni DM, WD Samuels, JC Linehan, AK Sharma, MO Hogan, MA Lilga, SA Clauss,KL Wahl, and JA Campbell. 1998. Organic Tanks Safety Program FY97 Waste Aging Studies.PNNL-11670 Rev. 1, Pacific Northwest National Laboratory, Richland, Washington.
Carlson CD and H Babad. 1996. Test Plan for Fauske and Associates to Perform TubePropagation Experiments with Simulated Hanford Tank Wastes. PNNL-10970 Rev 1, Pacific .Northwest National Laboratory, Richland, Washington.
Challis BC and SA Kyrtopoulos. 1979. "The Chemistry of Nitroso-Compounds. Part 11.Nitrosation of Amines by the Two-Phase Interaction of Amines in Solution with Gaseous Oxidesof Nitrogen." J. Chem. Soc, Perkin Trans. 1,299-304.
Challis BC and DEG Shuker. 1979. "Rapid Nitrosation of Amines in Aqueous Alkaline
Solutions by (3-Substituted Alkyl Nitrites." JChem Soc, Chem. Commun., 315-16.
Chen MJ,JC Linehan, and JWRathke. 1990. "Autoxidation of Trimethylamine in AqueousSolutions." J. Org. Chem., 55:3233.
Cleveland JM. 1967. "Plutonium Recovery and Waste Disposa/." Plutonium Handbook, Vol.II, OJ Wick, ed. Gordon and Breach, Science Publishers, New York.
Creed MJ and HK Fauske. 1990. "An Easy, Inexpensive Approach to the DIERS Procedure."Chem. Eng. Prog, 45-49.
Czapski G, J Holcman, and BHJ Bielski. 1994. "Reactivity .of Nitric Oxide with Simple Short-
Lived Radicals in Aqueous Solutions." JAm Chem Soc 116:11465-11469.
Delegard CH. 1987. Identities ofHEDTA and Glycolate Degradation Products in SimulatedHanford High-level Waste, RHO-RE-ST-55P, Rockwell Hanford Operations, Richland,Washington.
Draganic IG and ZD Draganic. 1971. The Radiation Chemistry of Water. Academic Press, NewYork.
7.2

Fauske HK. 1995. Summary of Laboratory Scoping Tests Related to Organic SolventsCombustion by Nitrate Oxidation and Organic Solvent Ignitability. Fauske & Associates, BurrRidge, Illinois.
Fauske HK. 1996. An Update of Requirements for Organic-Nitrate Propagating ReactionsIncluding RSST and Tube Propagation Test Results with Simulants. FAI/96-48, Fauske &Associates, Burr Ridge, Illinois.
Fauske HK and M Epstein. 1995. The Contact-Temperature (CTI) Criteria for PropagatingChemical Reactions Including the Effect of Moisture and Application to Hanford Waste.WHC-SD-WM-ER-496 Rev 0, Westinghouse Hanford Company, Richland, Washington.
Gerber MA, IX Burger, DA Nelson, JL Rayan, and RL Zollars. 1992. Assessment ofConcentration Mechanisms for Organic Wastes in Underground Storage Tanks at HanfordPNL-8339, Pacific Northwest Laboratory, Richland, Washington.
Gilbert BC, JP Larkin, and ROC Norman. 1972. "Electron Spin Resonance Studies. Part
XXXTV. The Use of The acz-Anion from Nitromethane as a Spin Trap for Organic Radicals inAqueous Solutions." JChem Soc, Perkin Trans II1272-1279.
Gilbert BC and ROC Norman. 1982. "Radical Reactions in aqueous Solutions: Use of the aci-Anion of Nitromethane as a Spin Trap." Can JChem60:1379.
GoheenMW. 1994. Quantitative Gas Mass Spectrometry. PNNL-ALO-284 Rev. 1, PacificNorthwest Laboratory, Richland, Washington.
Han P and DM Bartels. 1990. "Reevaluation of Arrhenius Parameters for H- + OH" -> (e^ +H2O and the Enthalpy and Entropy of Hydrated Electrons." J. Phys. Chem. 94:7294-7299.
Karpoor S, FA Barnabas, MC Sauer, Jr., D Meisel, and CD Jonah. 1995. "Kinetics ofHydrogen Formation from Formaldehyde in Aqueous Solutions." J. Phys. Chem. 99:6857-6863.
KeeferLK and PP Roller. 1973. Science 181.
Kingsley RS. 1965. Solvent Extraction Recovery ofAmericium with Dibutyl Butyl Phosphonate.RL-SEP-518, Hanford Atomic Products Operation, Richland, Washington.
KlemMJ. 1990. Inventory of Chemical Used at Hanford Site Production Plants and SupportOperations (1944-1980). WHC-EP-0172 Rev. 1, Westinghouse Hanford Company, Richland,Washington.
Knutsen K and TM Orlando. 1997. "Low Energy (5-100 eV) Electron- and Ultraviolet (6.4 eV)Photon-Stimulated Desorption of Neutral Fragments from NaNO3 Single Crystal." Appl. Surf.
Scl, in press.
Lati J and D Meyerstein. 1972. Inorg. Chem. 11:2397-401.
Lee Y-N, and SE Schwartz. 1981. "Reaction Kinetics of Nitrogen Dioxide with Liquid Water atLow Partial Pressure." JPhys Chem, 85:840-848.
7.3

Lilga MA, RT Hallen, EV Alderson, MO Hogan, TL Hubler, GL Jones, DJ Kowalski,MR Lumetta, WF Reimath, RA Romine, GF Schiefelbein, and MR Telander. 1996.Ferrocyanide Safety Project Ferrocyanide Aging Studies Final Report. PNNL-11211, PacificNorthwest National Laboratory, Richland, Washington.
Lias, SG, JE Bartmess, JF Liebman, JL Holmes, RD Levin and WG Mallard. 1988. "Gas PhaseIon and Neutral Thermochemistry." JPhys Chem RefData 17, Sup. 1.
Madden KP, H Taniguchi, and RWFessenden. 1988. "A Time-Resolved ESR Study of theKinetics of Spin Trapping by Nitromethane acz-Anion." J Am Chem Soc 110:2753-2758.
Meacham JE, AB Webb, NW Kirch, JA Lechelt, DA Reynolds, GS Barney, DM Camaioni,FGao,RT Hallen, and PGHeasler. 1998. Organic Complexant Topical Report. HNF-SD-WM-CN-058 Rev. 2, DE&S Hanford, Richland, Washington.
Meisel D, H Diamond, EP Horwitz, MS Matheson, MC Sauer Jr, JC Sullivan, F Barnabas,E Cerny, and YD Cheng. 1991a. Radiolytic Generation of Gases from Synthetic Waste.ANL-91/41, Argonne National Laboratory, Argonne, Illinois.
Meisel D,H Diamond; EP Horwitz, MS Matheson, MC Sauer Jr, and JC Sullivan. 1991b.Radiation Chemistry of Synthetic Waste. ANL-91/40, Argonne National Laboratory, Argonne,Illinois.
Meisel D, CD Jonah, S Kapoor, MS Matheson, and MC Sauer Jr. 1993. Radiolytic andRadiolytically Induced Generation of Gases from Synthetic Wastes. ANL-93/43, ArgonneNational Laboratory, Argonne, Illinois.
Meisel D, A Cook, D Camaioni, and T Orlando. 1997. "Chemistry, Radiation, and Interfaces inSuspensions of Nuclear Waste Simulants." Photoelectrochemistry, K Rajeshwar, LM Peter,A Fujishima, D Meissner, M Tomkiewicz,eds. The Electrochemical Society Pub., 97-20:350-7.
Meisel D and DM Camaioni. July 1998. "The NOX System in Nuclear Waste." EMSP ProjectSummaries, Environmental Management Science Program Workshop. CONF-980736, U.S.Department of Energy, Washington, D. C , pp. 125-127.
Mezyk SP and DM Bartels. 1997. "Temperature Dependence of Hydrogen Atom Reaction withNitrate and Nitrite Species in Aqueous Solution." JPhys Chem A 101:6233-6237.
Monig J, R Chapman, and KD Asmus. 1985. "Effect of the Protonation State, of the AminoGroup on the «OH Radical Induced Decarboxylation of Amino Acids in Aqueous Solutions." JPhysChem 89:3139-3144.
Neta P, RE Huie, and AB Ross. 1988. "Rate Constants for Reactions of Inorganic Radicals inAqueous Solution." JPhys Chem RefData 17:1027-1284.
Neta P and RH Schuler. 1975. "Rate Constants for the Reaction of O" Radicals with OrganicSubstrates in Aqueous Solution." JPhys Chem 79:1-6.
OaeS,NAsai, and K Fujimori. 1978. "Alkaline Hydrolysis of Alkyl Nitrites and RelatedCarboxylic Esters." J Chem Soc, Perkin Trans II571-577.
7.4

Orlando TM, DM Camaioni, and D Meisel. 1998a. "Interfacial Radiolysis Effects in TankWaste Speciation." EMSP Project Summaries, Environmental Management Science ProgramWorkshop. CONF-980736, U.S. Department of Energy, Washington, D. C.,pp. 127-130.
Orlando TM, DM Camaioni, and D Meisel. 1998b. "Interfacial Radiolysis Effects in TankWaste Speciation." Science to Support DOE Site Cleanup: The Pacific Northwest NationalLaboratory Environmental Management Science Program Awards, pp. 1.1-1.13. PNNL-11899,Pacific Northwest National Laboratory, Richland, Washington.
Park J-Y and Y-N Lee; 1988. "Solubility and Decomposition of Kinetics of Nitrous Acid inAqueous Solution." JPhys Chem 92:6294-6302.
ParraSA. 1994. "Integrated Beta and Gamma Radiation Dose Calculations for the FerrocyanideWaste Tanks." WHC-SD-WM-TI-634 Rev. 1, Westinghouse Hanford Company, Richland,Washington.
Pederson LR and SA Bryan. 1996. Status and Integration Studies of Gas Generation in HanfordWastes. PNNL-11297, Pacific Northwest National Laboratory, Richland, Washington.
Person JC. 1996. Effects of Oxygen Cover Gas an NaOH Dilution on Gas Generation in Tank241-Sy-101 Waste. WHC-SD-WM-DTR-043, Westinghouse Hanford Company, Richland,Washington.
SchatzT,AR Cook, and D Meisel. 1998. "Charge Carrier Transfer Across the SilicaNanoparticle/ Water Interface" (in press).
Scheele RD, JL Sobolik, RL Sell, and LL Burger. 1995. Organic Tank Safety Project: Prelimin-ary Results of Energetics and Thermal Behavior Studies of Model Organic Nitrate and/or NitriteMixtures and a Simulated Organic Waste. PNNL-10206, Pacific Northwest Laboratory,Richland, Washington.
Schwarz HA and RW Dodson. 1989. "Reduction Potentials of CO2" and the Alcohol Radicals."
JPhys Chem 93:409-414.Sederburg JP, and JA Reddick 1994. TBP and Diluent Mass Balances in the PUREX Plant atHanford 1955-1991. WHC-SD-WM-ER-396 Rev. 0, Westinghouse Hanford Company,Richland, Washington.
Smith PAS and RN Loeppky. 1967. JAm Chem Soc 89:1147-1157.
Spinks JWT and RJ Woods. 1964. An Introduction to Radiation Chemistry. John Wiley andSons, New York.
Stabler RN and JPChesick: 1978. "HAVCHM: A Program System for Computer Integration ofMulti-Step Reaction Rate Equations Using the Gear Iteration Method." Int J Chem Kinet10:461-469.
StanburyDM. 1989. "Reduction Potentials Involving Inorganic Free Radicals in AqueousSolution." Adv Inorg Chem 33:69-138.
7.5

StaufferLA. 1997. Temperature and Radiation Dose History of Single-Shell Tanks: HNF-SD-WM-TI-815, Lockheed Martin Hanford Corporation, Richland Washington.
Stock LM and LR Pederson. 1997. Chemical Pathways fat the Formation of Ammonia in
Hanford Wastes. PNNL-11702 Rev. 1, Pacific Northwest National Laboratory, Richland,Washington.
SuZ,DEFalvey,UCYoon, and PS Mariano. 1997. "The Dynamics of a-Anilino Carboxylateand Related Cation Radical a-Heterolytic Fragmentations." JAm Chem Soc 119:5261.
Warneck P and C Wurzinger. 1988. "Product Quantum Yields for the 305-nm Photo-decomposition of NO3- hi Aqueous Solution." JPhys Chem 92:6278.
WaynerDDMandDGriller. 1990. "Free Radical Thermochemistry." Advances in Free RadicalChemistry, D. Tanner, ed. JAI Press Inc., Vol. 1, pp. 159-192.
Webb AB, JL Stewart, DA Turner, MG Plys, G Malinovic, JM Grigsby, DM Camaioni,PG Heasler, WD Samuels, and JJ Toth. 1995. Preliminary Safety Criteria for Organic WatchList Tanks at the Hanford Site. WHC-SD-WM-SARR-033 Rev. 0, Westinghouse HanfordCompany, Richland, Washington.
Wiegert FJ and RJ McKinney. 1986. GEAR Iterator: Fitting Experimental Data with GEAR• Algorithm Iteration of Chemical Kinetics Equations, Ver. #QCMP022 for PC. QuantumChemistry Program Exchange, Indiana University, Bloomington, Indiana.
ZeldesH and R Livingston. 1968. "Paramagnetic Resonance Study of Liquids duringPhotolysis. VI. Aliphatic Nitroanions." JAm Chem Soc 90:4540-4544/
7.6

Appendix A
Data for Relative Rate Determinations

Table A.I. Scoping Experiments Run with 0.049 M H13CO2- and 0 to 0.1 M EDTA
No.
1
2
3
4
5
6
7
8
91011
12
13
Timeh
120
192
216
0
120
216
0
192
216
0120
192
216
DoseW
Mrad
9.6
15.3
17.3
0.0
9.6
17.3
0.0
15.3
17.3
0.09.6
15.3
17.3
[EDTA]OmM(b')
0
0
0
22.5
22.5
22.5
44.5
44.5
44.593.193.1
93.1
93.1
Final
EDTA«»
9.3
5,6
•44.5
19.7
76.6
65.1
Concentration
»3CO32-
6.52
12.3
13.7
6.13
9.67
9.02
9.04
3.82
7.06
7.12
, mM
H12CO2-
17.0
26.7
30.4
16.2
31.5
6.6
6.4
4.0
.2.4
2.3
Radiolytic Yield, G(molecules/100 ev)
0.48
0.57
0.45
0.40
0.41
0.37
0.28
0.32
0.29
EDTA
-0.97
-0.69
-1.01
-1.21
-1.14
H12CO2~
1.25
1.09
1.24
1.19
1.28
(a) y dose-rate ~ 0.08 Mrad/h; (b) Average of determinations by NMR ana ion pair chromatography.
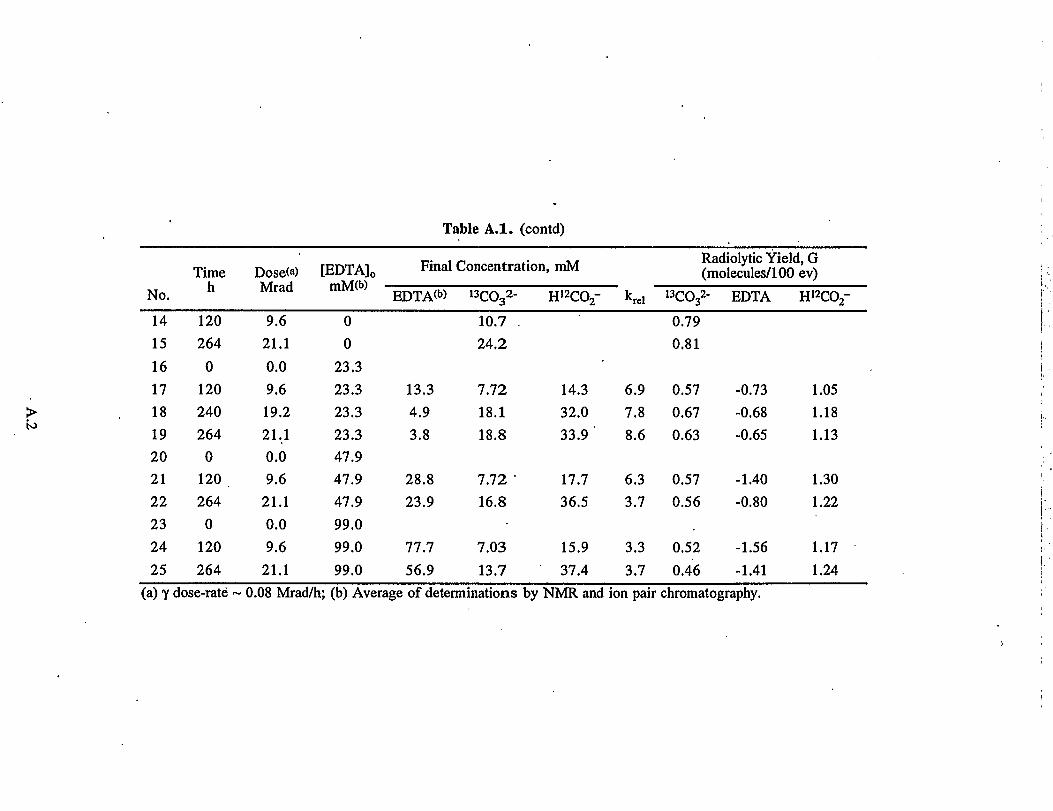
Table A.I. (contd)
to
No.
14
15
16
17
18
1920
21
22
23
24
25
Timet.
n120
264
0
120
240
2640
120
264
0
120
264
Dose(<»)
Mrad
9.6
21.1
0.0
9.6
19.2
21,10.0
9.6
21.1
0.0
9.6
21.1
[EDTA]0
0
0
23.3
23.3
23.3
23.3
47.9
47.9
47.9
99.0
99.0
99.0
Final
EDTAW
13.3
4.9
3.8
28.8
23.9
77.7
56.9
Concentration
13co32-
10.7 .
24.2
7.72
18.1
18.8
7.72 •
16.8
7.03
13.7
, mM
H12CO2-
14.3
32.0
33.9
17.7
36.5
15.9
37.4
6.9
7.8
8.6
6.3
3.7
3.3
3.7
*3CO
0.79
0.81
0.57
0.67
0.63
0.57
0.56
0.52
0.46
Radiolytic Yield, G(molecules/100 ev)2- EDTA
-0.73
-0.68
-0.65
-1.40
-0.80
-1.56
-1.41
H12CO2-
1.05
1.18
1.13
1.30
1.22
1.17
1.24
(a) y dose-rate ~ 0.08 Mrad/h; (b) Average of determinations by NMR and ion pair chromatography.
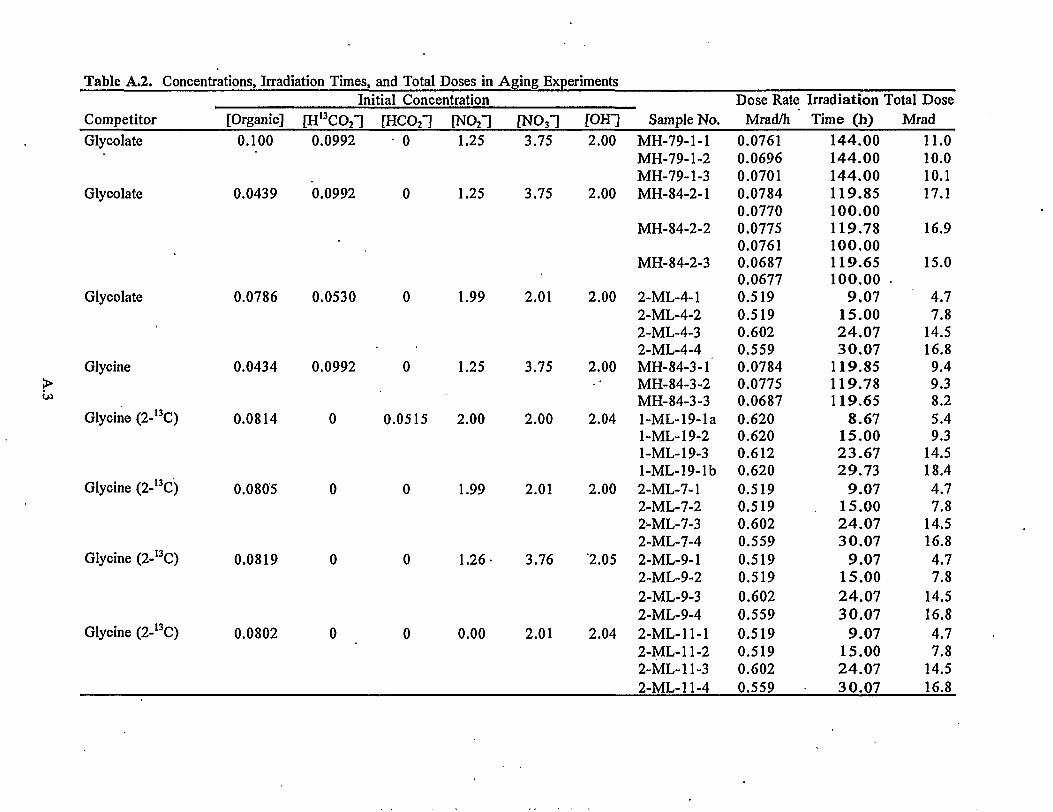
Table A.2. Concentrations, Irradiation Times, and Total Doses in Aging ExperimentsInitial Concentration
Competitor [Organic] [H13CO21 [HCO2"| [NO2~] [NO31 [PIT] Sample No.MH-79-1-1MH-79-1-2MH-79-1-3MH-84-2-1
MH-84-2-2
MH-84-2-3
2-ML-4-12-ML-4-22-ML-4-32-ML-4-4MH-84-3-1MH-84-3-2MH-84-3-3l-ML-19-la1-ML-19-2l-ML-19-3l-ML-19-lb2-ML-7-12-ML-7-22-ML-7-32-ML-7-42-ML-9-12-ML-9-22-ML-9-32-ML-9-42-ML-ll-l2-ML-11-22-ML-11-32-ML-11-4
Dose RateMrad/h
0.07610.06960.07010.07840.07700.07750.07610.06870.06770.5190.5190.6020.5590.07840.07750.06870.6200.6200.6120.6200.5190.5190.6020.5590.5190.5190.6020.5590.5190.5190.6020.559
IrradiationTime (h)
144.00144.00144.00119.85100.00119.78100.00119.65100.00
9.0715.0024.0730.07
119.85119.78119.65
8.6715.0023.6729.73
9.0715.0024.0730.07
9.0715.0024.0730.07
9.0715.0024.0730.07
Total DoseMrad
11.010.010.117.1
16.9
15.0
4.77.8
14.516.89.49.38.25.49.3
14.518.44.77.8
14.516.84.77.8
14.516.84.77.8
14.516.8
Glycolate
Glycolate
Glycolate
Glycine
Glycine (2-13C)
Glycine (2-13C)
Glycine (2-13C)
Glycine (2-13C)
0.100
0.0439
0.0992
0.0992
0.0786 0.0530 0
0.0434 0.0992
1.25
1.25
1.99
1.25
0.0814 0 0.0515 2.00
0.0805 0 0 1.99
0.0819 0 0 1.26
0.0802 0 0 0.00
3.75
3.75
2.01
3.75
2.00
2.01
3.76
2.01
2.00
2.00
2.00
2.00
2.04
2.00
2.05
2.04

Table A.2.
Competitor
Continued.
[Organic] [H13CO:f]
Initial Concentration[HCO2T [NO21 [NO31 [Off] Sample No.
Dose RateMrad/h
IrradiationTime (h)
Total DoseMrad
Glycine (1- & 2-uC) 0.0798w 0~
IDA
IDA
NTA
NTA
EDTA
EDTA
HEDTA
HEDTA
0.0435 0.0992
0.0794 0.100
0.0145 0.0992 0
0.0546 0.100
0.0218 0.0992 0
0.0403 0.100
0.100 0.0992
0.0218 0.0992 0
1.99 2.01 2.00
1.25 3.75 2.00
2.02 2.00 2.02
1.25 3.75 2.00
2.02 2.00 2.02
1.25 3.75 2.00
2.02 2.00 2.02
1.25 3.75 2.00
1.25 3.75 2.00
2-ML-5-12-ML-5-22-ML-5-32-ML-5-4MH-84-5-1MH-84-5-2MH-84-5-3l-ML-18-la1-ML-18-21-ML-18-3l-ML-18-lbMH-84-4-1MH-84-4-2MH-84-4-3l-ML-16-la1-ML-16-21-ML-16-3l-ML-16-lbMH-84-1-1MH-84-1-2MH-84-1-3l-ML-15-lal-ML-15-21-ML-15-3l-ML-15-lbMH-79-2-1MH-79-2-2MH-79-2-3MH-84-7-1MH-84-7-2MH-84-7-3
0.5190.5190.6020.559
0.07840.07750.06870.6200.6200.6120.620
0.07840.07750.06870.6200.6200.6120.620
0.07840.07750.06870.6200.6200.6120.620
0.07610.06960.07010.07840.07750.0687
9.0715.0024.0730.07119.85119.78119.658.6715.0023.6729.73119.85119.78119.658.6715.0023.67 "29.73119.85119.78119.658.6715.0023.6729.73144.00144.00144.00119.85119.78119.65
• 4.77.814.516.89.49.38.25.49.314.518.49.49.38.25.49.314.518.49.49.38.25.49.314.518.411.010.010.19.49.38.2

>
Table A.2.
Competitor
Continued.
[Organic] [H13CO21Initial Concentration[HCO21 [NO2T [NO;n [oin Sample No.
Dose RateMrad/h
IrradiationTime (h)
Total DoseMrad
HEDTA
ED3A
0.0406 0.102
0.0426 0.103
0
s-EDDA 0.0217 0.0992 0
s-EDDA 0.0797 0.100
u-EDDA 0.0781 0.099O 0
EDMA 0.0859 0.0546
Acetate 0.0041 0.05OO 0
Acetate 0.0506 0.0530 0
1.99
1.99
1.25
2.02
1.25
1.99
1.25
2.00
2.01
2.01
3.75
2.00
3.75
2.01
3.75
2.00
2.00
2.00
2.00
2.02
2.00
2.00
2.00
•2.04
2-ML-l-l2-ML-1-2
•2-ML-1-3 ~2-ML-1-42-ML-2-12-ML-2-22-ML-2-32-ML-2-4MH-84-6-1
' MH-84-6-2MH-84-6-3l-ML-17-la1-ML-17-2l-ML-17-3l-ML-17-lbMH-87-11-1MH-87-11-2MH-87-11-32-ML-3-12-ML-3-22-ML-3-32-ML-3-4MH-84-9-1MH-84-9-2MH-84-9-3l-ML-22-lal-ML-22-2l-ML-22-3l-ML-22-lb
0.5190.5190.6020.5590.5190.5190.6020.559
0.07840.07750.0687
0.6200.6200.6120.620
0.07700.07610.0677
0.5190.5190.6020.559
0.07840.07750.0687
0.6200.6200.6120.620
9.0715.0024.0730.07
9.0715.0024.07 •30.07
119.85119.78119.65
8.6715.0023.6729.7399.9299.9299.92
9.0715.0024.0730.07
119.85119.78119.65
8.6715.0023.6729.73
4.77.8
14.516.84.77.8
14.516.89.49.38.25.49.3
14.518.47.77.66.84.77.8
14.516.89.49.38.25.49.3
14.518.4

Table A.2.
Competitor
Continued.
[Organic] [H13CO2"]
Initial Concentration
[HCO21 [NO21 [NO31 [OH~] Sample No.Dose Rate
Mrad/hIrradiationTime (h)
Total DoseMrad
Acetate ( 1 - & 2-13C) 0 .101 w 0~
Butyrate
Citrate
Citrate
Citrate
Succinate
Butanol
0.0125 0.0500 0
0.100 0.0020 0
0.0063 0.0500 0
0.0499 0.0526 0
0.0125 0.0500 0
0.0144 0.0500 0
1.99 2.01
1.25 3.75
1.25 3.75
1.25 3.75
2.00 2.00
1.25 3.75
1.25 3.75
2.00
2.00
2.00
2.00
2.04
2.00
2.00
2-ML-6-12-ML-6-22-ML-6-32-ML-6-4MH-84-10-1MH-84-10-2MH-84-10-3MH-79-3-1
MH-79-3-2
MH-79-3-3
MH-84-8-1MH-84-8-2MH-84-8-3l-ML-21-lal-ML-21-2l-ML-21-3l-ML-21-lbMH-87-12-1MH-87-12-2 .MH-87-J2-3MH-87-14-1MH-87-14-2MH-87-14-3
0.5190.5190.6020.559
0.07840.07750.06870.07610.069O0.06960.07490.07010.06850.07840.07750.06870.62O0.62O0.6120.620
0.077O0.07610.06770.077O0.07610.0677
9.0715.00.24.0730.07
119.85i 19.78119.65144.00144.00144.00144.00144.00144.00119.85119.78119.65
8.6715.0023.6729.7399.9299.9299.9299.92 .99.9299.92
4.77.8
14.516.89.4
• 9.38.2
20.9
20.8
20.0
9.49.38.25.49.3
14.518.47.77.66.87.77.66.8
(b) 0.0481 M 2-uC-Acetate and 0.0526 M l-13C-Acetate

Table A.2.
Competitor
Continued.
[Organic] [H1 3CO21Initial Concentration
[HCCvI [NOH [NO31 [OH1 Sample No.Dose Rate
Mrad/hIrradiationTime (h)
Total DoseMrad
dibutyl Phosphate 0.0253 0.0500 0
0 0.0992 0
0 0.0500 0
1.25 3.75
0.0530 0.0501 1.25 3.75
0.0984 0.100 1.25 3.75
0.199 0.204 1.25 3.75
0.404 0.413 1.25 3.75
0.505 0.506 1.25 3.75
1.25 3.75
1.25 3.75
2.00
2.02
2.02
2.02
2.02
2.02
2.00
2.00
MH-87-13-1MH-87-13-2MH-87-13-3l-ML-10-1l-ML-10-2l-ML-10-31-ML-ll-ll-ML-11-2l-ML-11-3l-ML-12-1l-ML-12-21-ML-12-3
l-ML-13-1l-ML-13-2
.1-ML-13-3
1-ML-14-11-ML-14-2
1-ML-14-3
MH-84-0.10MH-84-0.10MH-84-0.10MH-84-0.05MH-84-0.05MH-84-0.05
0.07700.07610.06770.4670.4670.4670.4670.4670.4670.4670.4670.4670.6120.4670.4670.6120.467
•0.6120.4670.4670.6120.4670.612
0.06570.06460.06700.06570.06460.0670
99.9299.92
. 99.928.67
23.6731.67
8.6723.6731.6723.6731.6731.6716.0057.7331.6716.0031.6742.0752.7331.6716.0031.6742.07
120.12120.10120.13120.12120.10120.13
7.77.66.84.0
11.014.84.0
11.014.811.014.824.6
26.924.6
40.5
24.624.6
40.5
7.97.88.07.97.88.0
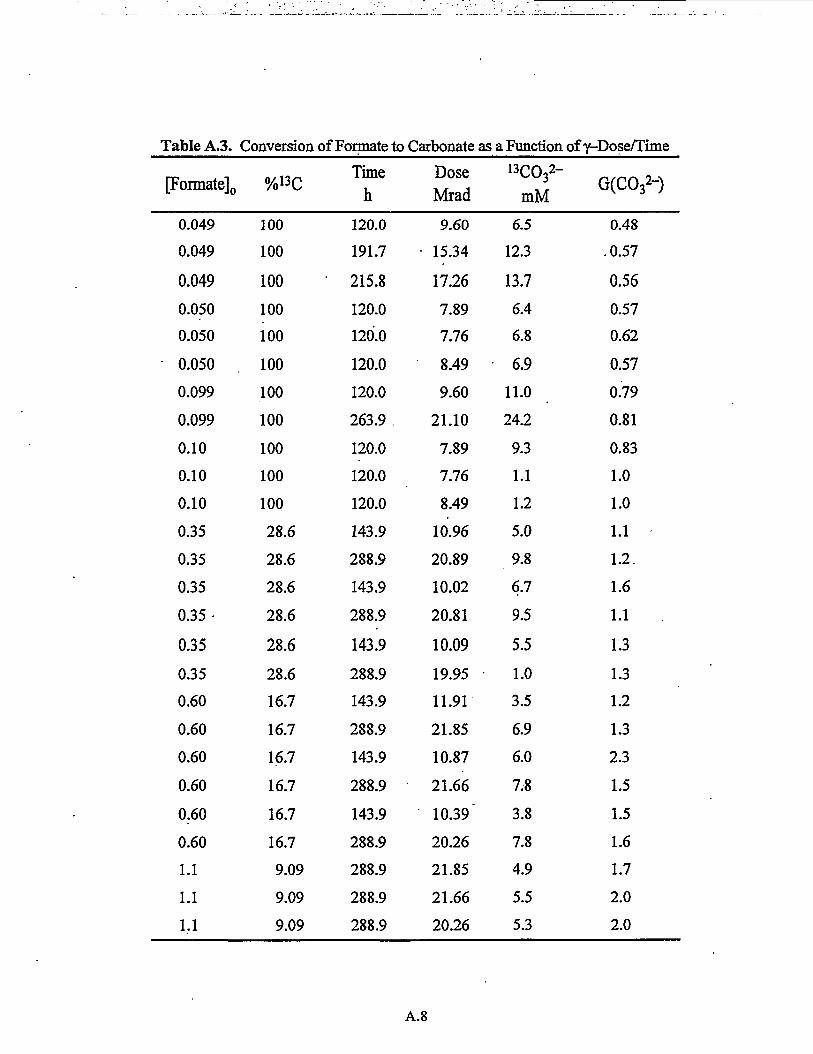
Table A.3. Conversion of Formate to Carbonate as a Function of y-Dose/Time
Po^ate
0.049
0.049
0.049
0.050
0.050
0.050
0.099
0.099
0.10
0.10
0.10
0.35
0.35
0.35
0.35-
0.35
0.35
0.60
0.60
0.60
0.60
0.60
0.60
1.1
1.1
1-1
100
100
100
100
100
100
100
100
100
100
100
28.6
28.6
28.6
28.6
28.6
28.6
16.7
16.7
16.7
16.7
16.7
16.7
9.09
9.09
9.09
Ttoe
120.0
191.7
215.8
120.0
120.0
120.0
120.0
263.9
120.0
120.0
120.0
143.9
288.9
143.9
288.9
143.9
288.9
143.9
288.9
143.9
288.9
143.9
288.9
288.9
288.9
288.9
9.60
• 15.34
17.26
7.89
7.76
8.49
9.60
21.10
7.89
7.76
8.49
10.96
20.89
10.02
20.81
10.09
19.95
11.91
21.85
10.87
21.66
10.39"
20.26
21.85
21.66
20.26
6.5
12.3
13.7
6.4
6.8
6.9
11.0
24.2
9.3
1.1
1.2
5.0
9.8
6.7
9.5
5.5
1.0
3.5
6.9
6.0
7.8
3.8
7.8
4.9
5.5
5.3
W-)0.48
.0.57
0.56
0.57
0.62
0.57
0.79
0.81
0.83
1.0
1.0
1.1
1.2.
1.6
1.1
1.3
1.3
1.2
1.3
2.3
1.5
1.5
1.6
1.7
2.0
2.0
A.8

Table
initial
[Formate]0.03(b)
0.049w
0.1
0.2
0.4
0.8
1
A.4. Yields of Carbonated) from Radiolysis of Formate: Experiment versus Model
time
00244868120
191.7215.8
8.723.731.78.7
23.731.723.731.7
31.7,16(e)
57.731.7,16(e)
31.7,42(e)
57.731.7,16(e)
31.7,42(e)
Dose
(Mrad)2.44.86.86.615.317.34.0611.0614.794.0611.0614.7911.0614.824.626.924.6
40.56. 26.9
24.640.56
[CO3:
expt0.00470.01110.01600.00650.01230.01370.00460.01120.01200.01800.02000.02630.04060.0354
ND0.07190.06940.11080.07500.06380.1040
model0.00640.01200.01610.00660.01310.01450.00460.01210.01590.00720.01920.02540.02590.0344
0.06900.06750.10720.06320.06320.1033
G(CO32")
molecules/100 eV
expt1.732.072.100.700.570.570.810.720.583.171.291.272.621.71
1.912.021.951.991.851.83
% sample
model conversion identity2.382.232.120.710.610.600.800.780.771.271.241.231.671.66
1.831.961.891.68 '1.841.82
16%37%53%13%25%27%5%11%12%9%10%13%10%9%
9% •9%14%8%6%10%
• (c)
(c)(c)
Table A2Table A2Table A21-ML10-11-ML10-21-ML10-31-ML11-11-ML11-21-ML11-31-ML12-11-ML12-21-ML12-31-ML13-11-ML13-21-ML13-31-ML14-11-ML14-21-ML14-3
(a) In 3.75 M NaNO3, 1.25 M NaNOa, and 2 M NaOH (p(b) In 0.1 M NaNO3, 0.03 M NaNO2, and 1 M NaOH (p =(c) Lilgaetal. 1996.(d) Dose rate: 0.01 Mrad/h.(e) Initial dose rate: 0.466 Mrad/h; final dose rate: 0.612 Mrad/h.
= 1.35 g/mL) unless noted.= 1.08 g/mL).
A.9

Table A.5. Yields of 13C-labeled Carbonate, Oxalate, and Formate from Radiolysis of 2-13C-Glycine: Experiment versus Model
? *»—>o
timeCh)
9.1«15<a>2 4 ( a )
30(a)
8.7 ( c )
15<c>29 .8 ( c )
Dose(Mrad)
4.77.814.516.8
5.49.318.4
[2-13C-Glycine]expt
0.07310.06630.05720.0538
0.07600.06960.0590
model
0.07240.06660.05840.0534
0.07450.06970.0592
[H13
expt
0.00660.01080.01800.0190
0.00420.00870.0155
CO2"]
model
0.00690.01090.01620.0193
6.00510.00860.0158
[l3
expt
0.00000.00060.00160.0021
0.00000.00000.0011
CO32"]
model
0.00020.00050.00130.0020
0.00010.00020.0009
[13C-Oxalate]expt
0.00210.00420.00510.0066
0.00090.00310.0055
model
0.00240.00380.00580.0071
0.00170.00290.0055
Glycineconversion
%
11%19%30%34%
8%-14%2 7 % •
Sample #
2-ML-9-12-ML-9-22-ML-9-32-ML-9-4
l-ML19-la1-ML19-2l-ML19-lb
(a) In 1.25 M NaNO2, 3.75 M NaNO3, 2 M NaOH (d=1.35 g/mL); (b) in 2 M NaNO2, 2 M NaNO3, 2 M NaOH, and 0.052 M l2C-Formate.

Table A.6. Chemical Shifts of Organic Species StudiedCompoundEDTA
HEDTA
ED3A
s-EDDA
u-EDDA
NTA
IDA
Glycine
Formate
Glycolate
Acetate
1H Chemical Shift (ppm")(a)2.4623.049
2.5132.5673.0673.0863.616
2.5803.1423.182
2.6443.153
2.4662.6523.067
3.097
3.147
3.185
8.438
3.95
1.896
Multiplicity(singlet)(singlet)
(singlet)(triplet)(singlet)(singlet)(triplet)
(singlet)(singlet) .(singlet)
(singlet)(singlet)
(triplet)(triplet)(singlet)
(singlet)
(singlet)
(singlet)
(singlet)
(singlet)
(singlet)
AssignmentN-CH2-CH2-NO2C-CH2-N
N-CH2-CH2-NHO-CH2-CH2-NN-(CH2-CO2-)2N-CH2-CO2-HO-CH2-CH2-N
N-CH2-CH2-N
N-(CH2-CO2-)2N-CH2-CO2-
N-CH2-CH2-NN-CH2-CO2-
H2NCH2-CH2-N(CH2CO2-)2H2NCH2-CH2-N(CH2CO2-)2N-(CH2-CO2-)2
(a) Peak positions and shape can change with temperature and concentration.
Table A.7.
Sample NameMH-84-1MH-84-1-1MH-84-1-2MH-84-1-3
Reactivity of EDTA Relative toIon: MH-84 Series
Concentrations (M)I3C-Formate
0.09920.09120.09090.0888
EDTA0.02000.01150.01260.0111
i3C-Formate
6.65.35.3
A.11

Table A.8. NMR Data for EDTA Aging Experiments: l-ML-15
Species13C-Formate12C-FormateGlycolate
(a)(a)(a)(b)
ED3AEDTA
(a)(a)(a)
s-EDDA(a)
ED3AEDTAAcetate
Integral regions8.8-8.7, 8.2-8.0
8.45-8.423.98-3.903.58-3.553.51-3.493.23-3.2
3.18-3.143.14-3.113.08-3.022.86-2.842.84-2.822.79-2.772.66-2.642.64-2.622.62-2.582.48-2.431.88-1.86
(a) Unassigned peaks; nm; not:
Species1SC-Formate12C-FormateDMMGlycolate
(a)(a)(a)(b)
ED3AEDTA
(a)(a)(a)
s-EDDA(a)
ED3AEDTAAcetateDMM
Table A.9.
Integral regions8.8-8.7, 8.2-8.0
8.45-8.421.27-1.183.98-3.903.58-3.553.51-3.493.23-3.2
3.18-3.143.14-3.11 .3.08-3.022.86-2.842.84-2.822.79-2.772.66-2.642.64-2.622.62-2.582.48-2.431.88-1.861.27-1.18
Concentrations from *H NMR Spectra of EDTA Aging Experimentsl-ML-15
. 1.11E-011.17E-030.00E+000.00E+000.00E+000.00E+000.00E+000.00E+004.65E-020.00E+000.00E+000.00E+000.00E+000.00E+000.00E+004.35E-020.00E+00
l-ML-15-la9.57E-021.03E-027.85E-050.00E+002.62E-054.94E-048.06E-031.78E-033.02E-023.92E-057.06E-053.92E-057.26E-040.00E+005.29E-032.90E-020.00E+00
measured, (b) Glycine and/or
NMR Data for EDTA AgingPeak Areas
l-ML-15762.3
8227.1
2552.4
11940
227.1
in Proton NMR
l-ML-15-29.74E-021.70E-021.66E-030.00E+004.26E-041.02E-031.19E-022.25E-032.59E-021.20E-033.10E-052.05E-042.73E-030.00E+007.96E-032.54E-020.00E+00
s-EDDA '
l-ML-15-39.63E-022.72E-020.00E+001.91E-046.91E-048.80E-041.32E-022.50E-032.17E-021.81E-034.55E-04O.OOE+003.23E-030.00E+007.44E-032.12E-028.67E-05
Experiments: l-ML-15
l-ML-15-lb9.56E-023.22E-028.12E-042.02E-055.29E-041.19E-031.84E-022.03E-031.97E-021.39E-031.18E-043.97E-04
%3.57E-034-.57E-048.29E-031.92E-025.01E-04
Spectra of EDTA Aging Experimentsl-ML-15-la 1-ML-15-2 1-ML-15-3 4-ML-15-lb
609.465.7
210.9101
18.9154
204.21538.9
11.81
18.50
134.7739
0210.9
785.1137.3266.926.8
020.649.5
287.2326.2167138.7
16.688.1
0256.7819.4
0266.9
740.9209.5254.7 '
nm8.8
31.940.6
305.7345.81336.355.6
14
99.40
229.1651.1
2254.7
789.1266.1273.313.4
126.259.1
456.9301.11303.945.78
3.913.1
117.815.1
273.9634.79
12.4273.3
A.12

Table A.10. NMR Data for HEDTA Afiing Experiments: 2-ML-l
w
Species12C Formate13C Formate
GlycolateHEDTA(a)
HEDTA(b)
HEDTA(a)
HEDTAAcetate
DMM
Glycine
EDDA + IDA
NTA
(c)EDDA
(c)(c)
(c)
(c)(c)
descriptor
CH2-OH
CH2-CO2
CH2-CH2OHN-CH2CH2-N
singletsinglet
shouldermultiplet
singlet
multiplet
singletsinglet
shoulder
Integral region8.45-8.42
8.8-8.7,8.2-8.03.98-3.903.68-3.543.18-2.95
2.65-2.542.54-2.421.88-1.86
1.27-1.183.18-3.163.16-3.143.10-3.092.7-2.62
2.62-2..592.59-2.572.83-2.78
3.27-3.263.24-3.223.1-3.09
Peak Areas2-ML-l
38.33276
028689178
33705695
0
11860000000
000
in'HNMR2-ML-l-l
112.41348.349.91912.8
1987.6
886.251405.9
7.37
431.8112.01476.06103.71411.73355.34
107.20
000
Spectra of HEDTA Aging2-ML-l-2 2-ML-l-3
148.71205.135.46
897.821332.5
588.7946.110.25
429.4175.6621.4
94.2474.9392.9132.7
18.9
21.321.1
145.8
307.81047.6
42.6712.7868.6
363.9532.6
19.2
337.3117
689.4192.7639.3342.5109.545.5
14.713.266.7
Experiments2-ML-l-4
405.9.1254.4
56.9825.7847.7
408.7544.6130.6
483.8183.9
1000.578.6898
439.1137.643.5
13.325.378.6
(a) During radiolysis a second multiplet (possibly a triplet) grows in coincidental with the CH2-OH of HEDTA.(b) Broad overlapping peaks may hide product resonances.
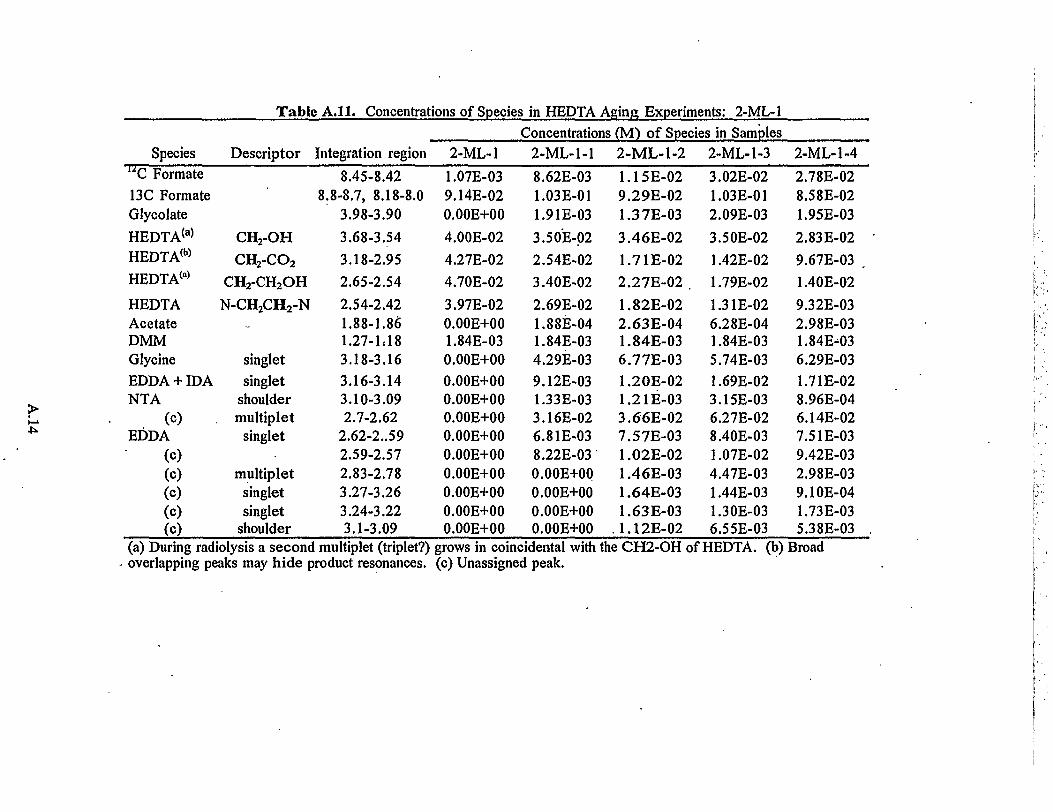
Table A.ll . Concentrations of Species in HEDTA Aging Experiments: 2-ML-l
Species1ZC Formate13C FormateGlycolate
HEDTA(a)
HEDTA(b)
HEDTA(a)
HEDTAAcetateDMMGlycineEDDA + IDANTA
(c)EDDA
(c)(c)(c)(o)(c)
Descriptor
CH2-OH
CH r CO 2
CH2-CH2OH
N-CH2CH2-N
singletsinglet
shouldermultiplet
singlet
multipletsingletsinglet
shoulder(a) During radiolysis a second
Integration region
8.45-8.428.8-8.7, 8.18-8.0
3.98-3.90
3.68-3.54
3.18-2.95
2.65-2.54
2.54-2.421.88-1.861.27-1.183.18-3.163.16-3.143.10-3.092.7-2.62
2.62-2..592.59-2.572.83-2.783.27-3.263.24-3.223.1-3.09
[ multiplet (triplet?)overlapping peaks may hide product resonances.
2-ML-l
1.07E-039.14E-020.00E+00
4.00E-02
4.27E-024.70E-02
3.97E-020.00E+001.84E-030.00E+000.00E+000.00E+000.00E+000.00E+000.00E+000.00E+000.00E+000.00E+000.00E+00
Concentrations (M) of Species in Samples2-ML-l-1
8.62E-031.03E-011.91E-03
3.50E-022.54E-02
3.40E-02
2.69E-021.88E-041.84E-034.29E-039.12E-031.33E-033.16E-026.81E-038.22E-030.00E+0QO.OOE+000.00E+000.00E+00
grows in coincidental with(c) Unassigned peak.
2-ML-l-2
1.15E-029.29E-021.37E-03
3.46E-02
1.71E-022.27E-02 .
1.82E-022.63E-041.84E-036.77E-031.20E-021.21E-033.66E-027.57E-031.02E-021.46E-031.64E-031.63E-031.12E-02
2-ML-l-3
3.02E-021.03E-012.09E-03
3.50E-02
1.42E-02
1.79E-02
1.31E-026.28E-041.84E-035.74E-031.69E-023.15E-036.27E-028.40E-031.07E-024.47E-031.44E-031.30E-036.55E-03
the CH2-OH of HEDTA. (b)
2-ML-l-4
2.78E-028.58E-021.95E-03
2.83E-029.67E-03 .
1.40E-02
9.32E-032.98E-031.84E-036.29E-031.71E-028.96E-046.14E-027.51E-039.42E-032.98E-039.10E-041.73E-035.38E-03
Broad

Table A.12.. Reactivity of HEDTA Relative toMH Samples
Concentrations, (M)
Sample Name 13C-Formate
MH-79-2-CMH-79-2-1MH-79-2-2MH-79-2-3
0.09920.09300.09190.0930
HEDTA0.0880.0630.0570.061
i3C-Formate
HEDTA
avo0.1050.0720.0740.076
Ion:
* « i
5.53'6.135.40 •
MH-84-7-CMH-84-7-1MH-84-7-2MH-84-7-3
0.09920.09200.09170.0899
0.03950.0137'0.01000.0110
13.914.013.1
Table A.13. 1H NMR Data for s-EDDA Aging Experiments: l-ML-17Peak Areas of Species in Samples
SpeciesuC-Formate12C-Formate
DMMEDDA
EDDAGlycolate
Descriptor
CH2-CO2
NCH2CH2N
l-ML-173960.85
37.341285.64
13427.63
13362.70
l-ML-17-la2158.05
216.69716.376201.3
5598.720
l-ML-17-21908.06350.59678.23
5391
4582.627.8
l-ML-17-31940.66560.89714.48
4582.16
3599.45
44.7
l-ML-17-lb1858.04
648.22710.09
4263.02
3242.7345.31
Table A.14. *3C NMR Data for s-EDDA Aging Experiments: l-ML-17Peak Areas of Species in Samples'
Species Descriptor l-ML-17 l-ML-17-la l-ML-17-2 l-ML-17-3 l-ML-17-lb13C-Formate
13C-Carbonatenmnm
7646.41211.74
7599.28357.74
7261525.44
7228.63573.39
Table A.15. Concentrations of Species Determined by !H NMR in s-EDDA AgingExperiments: l-ML-17 Series
Concentrations (M) of Species in SamplesSpecies Descriptor l-ML-17 l-ML-17-la l-ML-17-2 l-ML-17-3 l-ML-17-lb
13C-Formate 1.02E-01 9.97E-02I2C-Formate 9.62E-04 1.00E-02EDDA CH2-CO2 8.64E-02 7.16E-02
EDDA NCH2CH2N 8.60E-02 6.47E-02
Glvcolate O.OOE+00 0.00E+00
9.31E-02 8.99E-02 " 8.66E-021.71E-02 2.60E-02 3.02E-026.58E-02 5.31E-02 4.97E-02
5.59E-02 4.17E-02 3.78E-021.90E-04 1.04E-03 1.06E-03
A.15
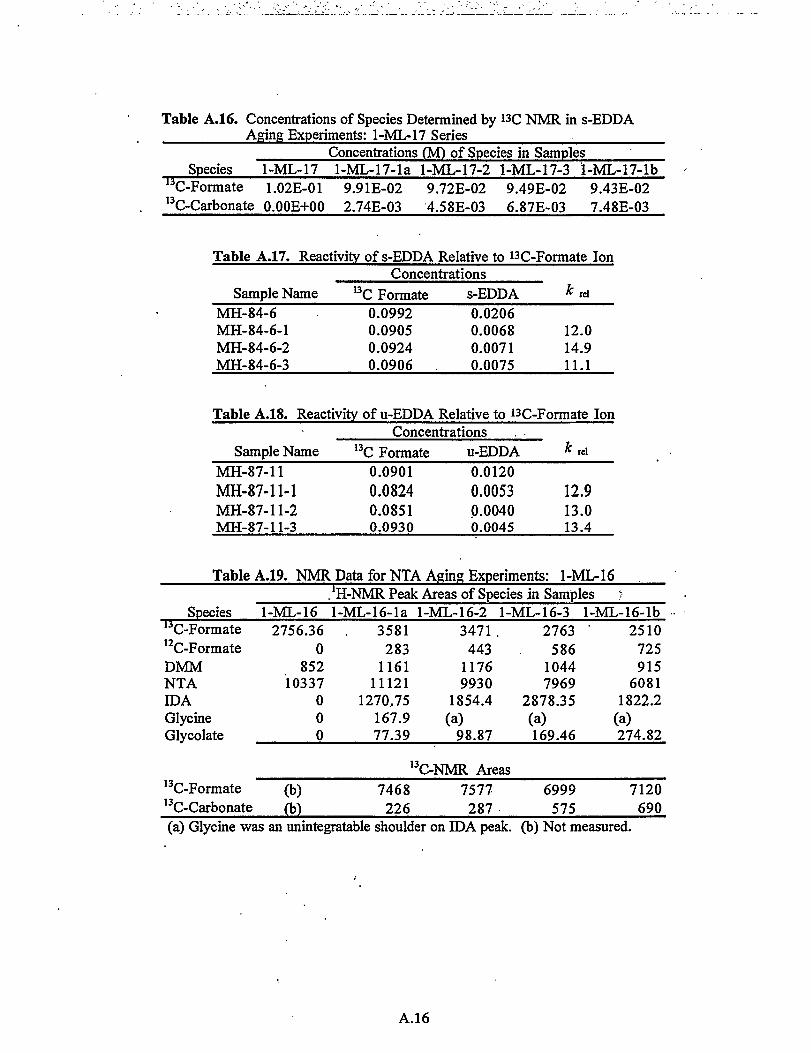
Table A.16. Concentrations of Species Determined by "C NMR in s-EDDAAging Experiments: l-ML-17 Series
Concentrations (M) of Species in Samples 'Species l-ML-17 l-ML-17-la l-ML-17-2 l-ML-17-3 l-ML-17-lb
13C-Formate 1.02E-01 9.91E-02 9.72E-02 9.49E-02 9.43E-0213C-Carbonate O.OOE+00 2.74E-03 4.58E-03 6.87E-03 7.48E-03
Table A.17. Reactivity of s-EDDA Relative to i3C-Formate IonConcentrations
Sample Name 13C Formate s-EDDA k reiMH-84-6 0.0992 0.0206MH-84-6-1 0.0905 0.0068 12.0MH-84-6-2 0.0924 0.0071 14.9MH-84-6-3 0.0906 0.0075 11.1
Table A.18. Reactivity of u-EDDA Relative to i3C-Formate IonConcentrations
Sample NameMH-87-11MH-87-11-1MH-87-11-2MH-87-11-3
13C Formate0.09010.08240.08510.0930
u-EDDA0.01200.00530.00400.0045
k rel
12.913.013.4
Table A.19. NMR Data for NTA Aging Experiments: l-ML-16. H-NMR Peak Areas of Species in Samples y
Species l-ML-16 l-ML-16-la l-ML-16-2 l-ML-16-3 l-ML-16-lb"C-Formate12C-FormateDMMNTAIDAGlycineGlycolate
13C-Formate13C-Carbonate
2756.360
85210337
000
(b)(b)
3581283
116111121
1270,75167.977.39
7468226
3471.443
11769930
1854.4(a)
98.87
13C-NMR Areas7577287
2763 '586
10447969
2878.35(a)169.46
6999575
2510725915
60811822.2
(a)274.82
7120690
(a) Glycine was an unintegratable shoulder on IDA peak, (b) Not measured.
A.16

Table A.20. Concentrations of Species in'NTA Aging Experiments: l-ML-16
SpeciesuC-Formate12C-FormateNTAIDAGlycolate
SpeciesuC-Formate13C-Carbonate
l-ML-161.07E-010.00E+006.69E-020.00E+00
0
Concentrationsl-ML-16-la
1.02E-018.07E-035.29E-029.06E-031.10E-03
Concentrationsl-ML-161.02E-010.00E+00
l-ML-16-la9.88E-022.99E-03
(M) in Samples by 'H-NMRl-ML-16-2
9.77E-021.25E-024.66E-021.31E-021.39E-03
l-ML-16-38.76E-021.86E-024.21E-022.28E-022.69E-03
l-ML-16-lb9.09E-022.63E-023.67E-021.65E-024.97E-03
(M) in Samples by "C-NMRl-ML-16-2
9.81E-023.71E-03
l-ML-16-39.41E-027.73E-03
l-ML-16-lb9.28E-029.00E-03
Table A.21.
Sample NameMH-84-4MH-84-4-1MH-84-4-2MH-84-4-3 .
Reactivity of NTA Relative to!3C-Formate Ion: MH Series
Concentrations13C Formate
0.09920.09110.08720.0901
NTA -0.01640.00740.00440.0063
£ rel
9.310.29.9
Table A.22. NMR Data for IDA Aging Experiments: l-ML-18'H-NMR Peak Areas of Species in Samples
SpeciesuC-Formate12C-FormateDMMIDAGlycineGlycolate"3.1 ppm peak"
l-ML-182231.38
12.57•732.196631.15
000
l-ML-18-la794.71
89.45256.85
1640.09367.29
53.110.96
l-ML-18-2538.03393.8
250.921410.75352.17
56.5724.14
l-ML-18-3770.07212.95253.48
1064.81469.13
88.6626.14
«l-ML-18-lb747.21250.87
257.7995.3
366.23100.5532.66
13C-NMR Areas13C-Formate (a) 7742.6 7565.18 • 7593.93 7206.6713C-Carbonate (a) 241.2 445.76 597.09 621.62
Table A.23. Concentrations of Species in IDA Aging Experiments: l-ML-18Concentrations (M) in Samples by 'H-NMR
Species l-ML-18 l-ML-18-la l-ML-18-2 l-ML-18-3 l-ML-18-lbuC-Formate 1.01E-01 1.02E-01 7.10E-02 1.01E-01 9.60E-02"C-Formate 5.68E-04 1.15E-02 5.20E-02 2.78E-02 3.22E-02IDA 7.50E-02 5.28E-02 4.65E-02 3.48E-02 3.20E-02Glycine 0.00E+00 2.37E-02 2.32E-02 3.06E-02 2.35E-02Glycolate 0.00E+00 3.42E-03 3.73E-03 5.79E-03 6.46E-033.1 ppm 0.00E+00 2.06E-05 5.31E-04 .5.69E-04 6.99E-04
A.17

Table A.24.
Species"C-Formate"C-Carbonate
Concentrations of Speciesi
l-ML-181.02E-010.00E+00
Concentrationsl-ML-18-la
9.87E-02~ 3.08E-03
in IDA Aging; Experiments: l-ML-18(M) in Samples by "C-NMRl-ML-18-29.61E-025.66E-03
l-ML-18-39.44E-027.42E-03
l-ML-18-lb9.37E-028.08E-03
Table A.25. Reactivity of IDA Relative toi3C-Formate Ion
Sample NameConcentrations (M)
13C-Formate IDA id
MH-84-5MH-84-5-1MH-84-5-2MH-84-5-3
0.09920.09290.09040.0905
0.03630.01630.01550.0153
15.712.39.1
Table A.26. NMR Data for Glycine Aging Experiments: 2-ML-llPeak Areas in 'H-NMR Spectra of Samples
Species 2-ML-11-2 2.ML-11-3 2-ML-11^4"C-Formate12C-Formate
DMMTotal Glycine2-12C-Glycine2-13C-Glycine
OxalateFormate
Carbonate2-13C-Glycine
383.9811.84
2496.715229.13
865143.13
284.17690.482.7
3036.13
454.689.45
2456.32232.81
402192.81
13C-NMR Areas642.32901.79356.681260.98
487.929.46
2365.621871.96
641807.96
652.36835.01398.311097.76
Table A.27. NMR Data for Glycine Aging Experiments: 2-ML-9Peak Areas in ̂ -NMR Spectra of Samples
Species"C-Formate12C-Formate
DMMTotal Glycine2-12C-Glycine2-I3C-Glycine
OxalateFormate
Carbonate2-I3C-Glycine
2.ML-9-192.880.83
568.852210.67
17.632193.04
168.21526.25trace
5787.78
2.ML-9-2148.273.51
539.622046.23
' 13.742032.49
13C-NMR308.23782.0745.21
4819.43
2.ML-9-3237.62
5.13507.271442.918.85
1424.05
Areas332.451173.28103.19
3723.91
2.ML-9-4325.11
5.84655.151860.91
9.331851.58
447.161314.52143.46
3638.87
A.18

Table A.28. NMR Data for Glycine Aging Experiments: 2-ML-7Peak Areas in 'H-NMR Spectra of Samples
SpeciesuC-Formate12C-FormateDMMTotal Glycinel-13C-Glycine2-13C-Glycine
OxalateFormate -Carbonatel-13C-Glycine2-13C-Glycine
2-ML-700
690.692874.872854.5420.33
13C-NMR(a)(a)(a)(a)(a)
2-ML-7-429.650.9267.13
• 237.7235.23
2.47
Areas365.321075.0586.03
04162.57
(a) Not measured
Table A.29. NMR Data for Glycine Aging Experiments: 2-ML-5Peak Areas in 'H-NMR Spectra of Samples
Species13C-Formate12C-Formate
DMMTotal Glycinel-13C-Glycine2-13C-Glycine
OxalateFormate •
Carbonatel-13C-GIycine2-I3C-Glycine
2-ML-50
8.4269.96
2398.09153.01160.04
000
2377.922697.88
2-ML-5-135.837.11
671.95280.931139.6
1258.49
13C-NMR Areas112.61146.37101.09
2125.332891.85
2-ML-5-26.866.86
71.35348.71138.04142.89
196.64285.12170.151955.812311.34
2-ML-5-318.8118.7391.32
0169.51179.2
(a)(a)(a)(a)(a)
(a)Not measured
Table A.30. Reactivity of Glycine Relative to i3C-FormateIon: MH-84-3 Series
Sample NameMH-84-3MH-84-3-1MH-84-3-2MH-84-3-3
Concentrations13C Formate
0.09920.00830.00840.0083
Glycine0.04960.02530.02490.0243
k
798
rel
.8
.0
.1
A.19

Table A.31. Reactivity of Glycine Relative to "C-Formate:MH-79-1 Series
Sample NameMH-79-1MH-79-1-1MH-79-1-2MH-79-1-3
MH-84-2MH-84-2-1MH-84-2-2MH-84-2-3
Concentrations13C Formate
0.10000.0935
. 0.09000.0920
0.10070.07230.08490.0910
Glycolate0.12000.08430.08120.0747
0.04010.01380.01480.0212
k rel
4.72.96.2
3.25.86.3
Table A.32. NMR Data for Species in Citrate IonAging Experiments: ML Seriesfe)
'H-NMR Peak Areas of Species in SamplesSpecies .
uC-Formate12C-FormateDMMCitrate (a)Citrate (b)Citrate (c)Citrate (d)
13C-Formate13C-Carbonate
l-ML-21432.22
3.2258.82
254.2531.27445.41226.63
(a)(a)
l-ML-21-2 l-ML-21-3791.77
19.21532.02404.28
1080.03755.44554.48
13C-NMR3990.85
167.52
341.7810.1
228.45241.77496.52371.04216.39
Areas3744.6387.79
•i-ML-21-lb348.714.84
272.24240.13516.34422.45
231.5
3203.36350.94
(a) Citrate proton NMR is a second order spectrum with four peakslabelled a, b, c, and d. The "b" peak was used for the calculationsdue to the strongest signal The concentrations are based on the "b"peak being 37.3% of the total signal from citrate.
Table
Species"C-Formate12C-FormateCitrate (b)
Species"C-Formate13C-Carbonate
A.33. Concentrations of Species in CitrateIon Aging Experiments: ML Series
Concentrationsl-ML-215.53E-024.09E-044.55E-02
l-ML-21-24.93E-021.20E-034.50E-02
Concentrationsl-ML-215.26E-020.00E+00
l-ML-21-24.86E-024.01E-03
(M) From 'H-NMRl-ML-21-3
4.95E-021.46E-034.82E-02
.l-ML-21-lb4.24E-021.80E-034.21E-02
(M) From "C-NMR "l-ML-21-3
4.69E-025.74E-03
l-ML-21-lb4.64E-026.24E-03
A.20

Table A.34. Reactivity of Citrate Ion Relative toi3C-Formate Ion: MH Series
Sample Name
MH-79-3MH-79-3-1MH-79-3-2MH-79-3-3
MH-84-8MH-84-8-1MH-84-8-2MH-84-8-3
Concentrations13C Formate
0.06700.05670.05420.0537
0.06700.03070.03880.0347
Citrate
0.00470.00440.00410.0046
0.00520.00270.00370.0033
0.440.690.11
0.820.640.70
Table A.35. NMR Data for Acetate Ion AgingExperiments: 2-ML-6
Species13C-Formate12C-FormateDMMTotal Acetatel-13C-Acetate2-13C-Acetate
OxalateFormateCarbonatel-13C-Acetate2-I3C-Acetate
Peak Areas in 'H-NMR2-ML-6-3
19.1224.99667.02
4773.782479.73290.35
13C-NMR0
77.9575.68
2652.893628.32
Spectra of Samples2-ML-6-4
1.652.3462.27
549.01261
288.01
Areas0 .
68.2684.22
2694.63 •3661.01
A.21

Table A.36. NMR Data and Concentrations for Acetate Aging Experiments: l-ML-22• P e a k Areas in 'H-NMR Spectra of Samples
Species l-ML-22 l-ML-22-la l-ML-22-2 l-ML-22-3 l-ML-22-lb"C-Formate12C-FormateDMMAcetate
447.483.1
257.831211.41
788.568.81
498.692109.56
801.7521.8
510.092247.08
683.9917.27
490.842093.22
371.2510.95
256.561188.21
13C-FormateC-Carbonate13,
13,C-Formate12C-FormateAcetate
(a)(a)
5.75E-023.98E-045.18E-02
13C-NMR Areas3990.85 3744.6167.52 387.79
Concentrations (M) From5.23E-02 5.20E-025.85E-04 1.41E-034.67E-02 4.86E-02
Concentrations (M) From
3203.36350.94
!H-NMR4.61E-021.16E-034.71E-02
13C-NMR
3534.62602.63
4.79E-021.41E-035.11E-02
C-Formate 5.06E-0213C-Carbonate 0.00E+00
4.86E-022.04E-03
Table A.37. Reactivity of Acetate :Ion: MH Series
Sample NameMH-84-9MH-84-9-1 .MH-84-9-2MH-84-9-3
MH-84-9-lbMH-84-9-2bMH-84-9-3b
4.59E-024.75E-03
Ion Relative to
Concentrations13C Formate
0.09950.08460.04950.0770
0.03160.01980.0279
Acetate0.00780.00790.00470.0073
0.00320.00240.0033
4.56E-02 4.32E-025.00E-03 7.37E-03
nc-Formate
% rel
0.720.28
0.770.730.66
A.22

8.8 B.7 6.6 B.S 0.1 8.3 8.2 ppn Z.BO 2.70 2.60 2.50 2.40 pen
Figure A.I. NMR Spectra of Citrate and Formate-i3C Solutionbefore(top) and after (bottom) y Irradiation at 20°C
8.8 8.7 8.E B.a 8.4 8.3 8.2 ppa 3.S 3.7 3.5 3.3 3.1 2.3 2.7 pp*
Figure A.2. NMR Spectra of s-EDDA and Formate-i3C Solution before(top) and after (bottom) y Irradiation at 20°C
A.23

A .
A-A.... L**JL**-.. .a.8 B.? 8.6 8.9- 8.4 B.3 8.2 ppn 3.6 3.4 3.2 3.0 2.8 2.6 ppn
Figure A.3. NMR Spectra of u-EDDA and Formate-i3C Solutionbefore (top) and after (bottom) y Irradiation at 20°C
• Hli .. i,
8.8 S.7 8.6 8.9 8.4 8.3 B.2 ppa 3.8 3.E 3.4 3.2 3.0 2.8 2.S
Figure A.4. NMR Spectra of EDTA and Formate-i3C Solutionbefore (top) and after (bottom) ylrradiation at 20°C
A.24

B.8 B.7 8.6 8.9 8.4 8.3 8.2 ppo 3.8 3.7 3.6 3.S 3.4 3.3 3.2 ppn
Figure A.5. NMR Spectra of Glycine and Formate-i3C Solutionbefore (top) and after (bottom) y Irradiation at 20°C
^ ^
B.B 8.7 8.E 8.S B.4 8.3 8.2 pp» 4.1 4.0 3.9 3.8 3.7 3.S ppn
Figure A.6. NMR Spectra of Glycolate and Formate-i3C Solutionbefore (top) and after (bottom) y Irradiation at 20°C
A.25

Jt^-+~tJ V.
B.B 8.7 8.S 0.5 8.4 B.3 B.2 ppn 3.8 3.6 3.4 3.2 3.0 2.8 2.E ppn
Figure A.7. Spectra of HEDTA and Formate-i3C Solution before(top) and after (bottom) y Irradiation at 20°C
8.9 8.8 8.7 8.E 8.S 8.4 B.3 B.2 pp« 3.9 3.4 3.3 3.2 3.1 3.0 2.9 ppn
Figure A.8. . NMR Spectra of IDA and Formate-i3C Solutionbefore (top) and after (bottom) y Irradiation at 20°C
A.26

j I I | | | ] i y | | | | ( p | |S.B B.7 Q.e B.9 B.4 B.3 8.2 PPR 3.4 3.3 3.2 3.1 3.0 Z.S 2.8 PCM
Figure A.9. NMR Spectra of NTA and Formate-i3C Solution before(top) and after (bottom) y Irradiation at 20°C
A.27

Appendix B
Data for SIM-PAS-95-1 Aging Studies
Table B.I. Effects of Radiation on PAS-95 Simulants at 40, 70, and 90°C(a)T
DoseMrad
90 °C0
2250114146
70 °C0
3050100150
40 °C0
284365
Formate
0.0000.0010.0550.0660.111
0.0000.0220.0480.0700.124
0.0000.0080.0150.077
Oxalate
0.0000.0050.0550.0680.075
0.0000.0240.0400.0500.074
0.0000.0010.0180.016
Glycolate
0.1950.1860.1430.1190.122
0.1390.1260.1130.0990.088
0.1950.1830.1770.145
Citrate
0.0980.1020,1000.0700.071
0.1020.0980.0910.0830.075
0.0980.0950.0840.084
Reactants/Products, M
HEDTA
0.0570.0410.0280.0120.003
0.0690.0400.0230.0100.004
0.0570.0370.0200.014
EDTA
0.00680.00580.004O0.00180.0014
0.01360.009O0.00550.00380.001O
0.00680.00610.00390.0039
Succinate
0.00000.00350.01300.02320.0237
0.00000.00110.00310.01170.0192
0.00000.00680.01860.0384
Acetate
0.00000.00000.00000.00310.0035
0.0060.0110.0130.0150.017
0.00000.00000.00000.0000
CO32"
0.0110.0760.1540.3670.515
. 0.0280.0890.1300.2640.338
0.0170.0770.1180.175
NOf
1.211.191.091.421.50
1.011.091.151.270.57
1.380.521.181.18
NO3"
2.482.171.831.891.70
2.071.971.891.691.67
2.522.432.582.29
NH3
0.0000.0000.0000.0670.076
0.0000.0040.0080.008
SampleNumber
99-2:198-1:199-1:199-4:1
100-2:1
97-184-3:190-5:1
. 93-1:196-1:1
104-2:1101-1:1107-2:2111-1:1
(a) Starting composition of cover gas is 80/20 Ar/O2

wto
Table B.2. Effects of 0 2 in Cover Gas and Iron on Radiolytic Aging of PAS-95-ld Simulant at 70°
DoseMrad
0 .47(a)
48(a)
47.6<b)
45.6(b)
46.2(a)l(c)
Formate
0.0000.027 '0.0160.0160.0340.042
Oxalate
0.0000.0300.0330.0230.0210.020
Glycolate
0.1950.1740.1760.1790.1850.183
Citrate
0.0980.1000.0770.0900.0900.089
Reactants/Products, M
HEDTA
0.0570.0180.0190.0200.0230.025
EDTA
0.00680.00440.00360.00380.00420.0034
Succinate
0.00000.03170.01120.02910.02870.0244
CO32 '
0.0110.1370.0890.1110.0960.127
NO2"
1.261.160.531.071.000.92
NO3"
2.932.251.812.091.802.34
NH3
0.0000.0200.0070.0050.0010.003
SampleNumber110-2:1107-3:1104-3:1105-1:1108-1:1110-1:1
(a) 20/80 O2/Ar; (b) 100% Ar; (c) 20/80 O2/Ar, no Fe.
Table B.3. Thermal Aging of PAS-95-ld Simulant at 90°C in Presence and Absence of O2 in Cover GasCover Gas
Time, h Formate
20/80 O2/Ar
033567513292880
100% Ar0
3366661338
0.0000.0000.0000.0150.052
0.0000.0000.0000.000
Oxalate
0.0000.0260.0100.0270.032
0.0000.0000.0060.019
Glycolate
6.1950.1600.1590.1540.147
0.1950.2010.2010.170
Citrate
0.0980.0990.0920.0770.077
0.0980.0970.0890.086
Reactants/Products, M
HEDTA
0.0570.0600.0530.0470.039
0.0570.0610.0570.052
EDTA
0.00680.00810.00850.00890.0084
0.00680.00900.00880.0092
Succinate
0.00000.00000.00810.0099.0.0250
0.00000.00550.00570.0328
Acetate
0.00000.00000.00370.00750.0598
0.00000.00450.00420.0038
CO32'
0.0110.0410.0650.1170.199
0.0110.0230.0320.055
NO2"
1.211.010.951.170.59
1.210.440.320.41
NO3"
2.481.761.712.031.71
2.482.362.602.47
NH3
0.0000.0040.0090.0280.027
0.0000.0060.0090.024
SampleNumber
99-2:199-3:1
100-1:1100-3:1111-4:1
99-2:1101-2:1104-1:1107-1:1
Table B.4. Effects of Radiation on PAS-95 Simulants at 40, 70, and 90°C:(a) Concentrations of Analytes(mg C/g) and Nitrate Reaction Enthalpies
w
T
Dose,Mrad
PAS-95-lc,0
2250114146
PAS-95-lc,0
3050100150
PAS-95-lc,0
284365
Formate
90 °C0.00 .0.010.520.621.04
70 °C0.000.20'0.450.661.17
40 °C0.000.070.140.73
Oxalate
0.000.101.041.291.41
0.000.460.760.941.39
0.000.020.340.31
Glycolate
3.683.512.712.252.30
2.632.382.141.871.67
3.683.463.342.73
Reactants/Products,
Citrate
5.585.795.673.974.00
5.765.585.174.694.25
5.585.374.744.74
HEDTA
5.433.892.611.090.24
6.513.752.190.920.42
5.423.501.881.32
mgC/g
EDTA
0.640.550.370.170.13
1.280.850.520.360.09
0.64 •0.570.370.37
Succinate
0.000.130.490.880.90
0.000.040.120.440.72
0.000.260.701.45
Acetate
0.000.000.000.060.07
0.110.200.240.280.32
0.000.000.000.00
co32-
0.120.711.463.474.87
0.27".0.841.232.503.19
0.170.731.121.65
Tot.Org.Cwt%(a)
1.531.471.401.201.06
1.631.571.53
. 1.411.34
1.531.471.441.38
AHrJ/gsolnw
447419367303246
> 487449426376338
446421398369
SampleNumber
99-2:198-1:199-1:199-4:1
100-2:1
97-184-3:190-5:193-1:196-1:1
104-2:1101-1:1107-2:2111-1:1
(a) Starting composition of cover gas is 80/20 Ar/C>2. (b) Calculated as the XOCj+(TC0-TC,i) where OCj is concentration of organicspecies in mg C/g, TC0 is total concentration of organic and carbonate carbon at start of irradiation, and TC<j is the totalconcentration of organic and carbonate carbon after having absorbed dose d. (c) Calculated as XOCjXAHj where AHj is enthalpy (kJ)for reaction of a quantity of specie i that contains 1 g of carbon with excess nitrate, e.g., specie, AH (kJ/gC): formate, -17.9;Oxalate, -11.2; glycolate, -25.5; citrate, -25.1; Na3HEDTA, -35.4; Na4EDTA, -32.1; succinate, -24.7; acetate, -30.7; unidentifiedproducts, -32.1, average of Na3ED3A, Na3NTA, Na2IDA, Na2EDDA, and glycine (see Table 4.4).

Table B.5. Effects of O2 in Cover Gas and Iron on Radiolytic Aging of PAS-95-ld Simulant at 70°Concentrations of Analvtes (mgC/g) and Nitrate Reaction Enthalpies
DoseMrad
047(b)
4 8(b)
47.6(c>45.6(c)
46.2(bWd)
Formate
0.000.260.150.150.320.40
Oxalate
0.000.570.62.0.430.400.38
Reactants/Products, mg C/g
Glycolate
3.683.293.333.383.493.47
Citrate
5.585.664.365.125.12 "5.03
HEDTA
5.421.691.761.892.202.33
EDTA
0.640.420.340.360.390.32
Succinate
0.001.200.421.101.080.92
co32-
0.101.300.84
. 1.050.911.20
Tot.Org.Cwt%(a)
1.531.401.451.431.441.41
AH,J/g
soln(a)
446371400388391383
SampleNumber
110-2:1107-3:1104-3:1105-1:1108-1:1.110-1:1
(a) See notes in Table B.4. (b) 20/80 O2/Ar. (c) 100% Ar: (d) 20/80 O2/Ar, no Fe.
po Table B.6. Thermal Aging of PAS-95-ld Simulant at 90°C in Presence and Absence of O2 in Cover Gas: Concentrations ofAnalytes (mgC/g) and Nitrate Reaction Enthalpies
Timeh Formate
20/80 O2/Ar
033567513292880
100 % Ar0
3366661338
0.000.000.000.140.50
0.000.000.000.00
Oxalate
0.000.490.190.510.60
0.000.000.120.35
Glycolate
3.683.033.012.902.78
3.683.793.813.22
Reactants/Products,
Citrate
5.585.625.204.374.38
5.585.505.064.85
HEDTA
5.435.665.054.483.68
5.425.735.374.96
mgC/g
EDTA
0.640.760.800.840.80
0.640.850.840.87
Succinate
0.000.000.310.370.95
0.000.210.211.24
Acetate
0.000.000.070.141.13
0.000.080.080.07
CO32'
0.110.380.611.101.88
0.1040.2200.3020.519
Tot.Org.Cwt%(a)
1.531.511.481.431.36
1.531.521.511.49
soln(a)
447430427407367
446445444435
SampleNumber
99-2:199-3:1
100-1:1100-3:1111-4:1
99-2:1101-2:1104-1:1107-1:1
(a) See notes in Table B.4.

Table B.7. Headspace Gas Composition (mol%) versus Radiolytic Dose, Temperature, and O2 in Cover Gas (PAS-95-ld simulant)
Starting Headspace Gas
Temperature, °C
Dose/Time, Mrad (h)
Ar
o2
H2
N2O
N2
CH4
NOX
20/80
40°
47.2 (143)
74.8
15.6
1.48
6.9
1.13
0.004
0.005
64.9 (251)
75.3
13.1
2.38
8.2
1.08
0.003
0.05
O2/Ar
70°
47 (167)
73.5
13.6
2.74
8.6
1.57
0.009
0.005
90°
146 (428)
65.4
2.17
.12.6
16.5
3.29
0.035
0.019
Ar
70°
47.6 (169)
90.40
0.07
3.14
4.33
2.01
0.06
0.01
45.6 (170)
90.55
0.078
2.9
4.8
1.66
0.047
0.005
20/80 O2/Ar
70°
46.2 (175.5)
77.2
11.9
4.6
5.2
1.04
0.005
0.05
Cover gas volume is 378 mL, of which 7.8 mL is tubing between the gas manifold and reactor. Starting gas pressure was 1 atm at 292K.
Table B.8. Radiolytic Yield (G) of Gas from Simulant PAS-95-ld in a 105 rad/h y Field
Gas
0 2
H2
N 20
N2
Radiolytic Yield (G) vs.
40 °C,O2/Ar(a)
-0.086
0.033
0.13
0.020
70 °C,O2/Ar0>)
-0.11
0.058
0.18
0.033
Temp and Starting Headspace Composition
l\j u, Pay*'
o!ooi0.058
0.088
0.036
90 °C,O2/Ar(d>
-0.110.097
0.13
0.025
70 °C,O2/Ar(e)
-0.17
0.095
0.11
0.021
(a) Average of 47 Mrad and 65 Mrad doses (Table B.I), (b) 46 Mrad dose (Table B.2).(c) Average of 46 Mrad and 48 Mrad doses (Table B.I), (d) 146 Mrad dose (Table B.I),(e) Simulant without Fe; 46 Mrad dose (Table B.2).
Table B.9. Rates of Production of Gas from Simulant PAS-95-1 d at 90°C without Irradiation(a)
Gas
Rate of Disappearance/Production
Starting with 20/80 O2/Ar
mmol/1000 h
Starting with Ar
mmol/1000 h mmol/2000 h
o2H2
N2O
N2
Total Products
-0.140.22
0.22
0.022
0.46
0.00360.21
0.30
0.019
0.52 •
0.0490.71
0.88
0.050
1.69(a) Derived from Table B. 10.
Table B.10. Headspace Gas Composition vs Heating Time at 90°C: Effect of C<2(a)
Headspace Gas Composition mole %
Rxn time, h
Ar
Oxygen
Hydrogen
N2O
Nitrogen
Methane
0
100
0
0
0
0
00
1338
62.90.26
14.5
21.0
1.31
0.004
2184
44.5
0.127
23.8
28.5
• 3
0.001
0
80
20
0
0
0
0
1239
59.8
4.44
17.0
17.1
1.69
0.008(a) Cover gas volume is 25 mL, of which 7.8 mL is tubing between the gas manifold andreactor. Starting gas pressure was 1 atm at 292K.
B.6

Table B.l l . Approximate Compositions of Solutions Used toPrepare SIM-PAS-95-1 Simulants
Component
Solution 1
NaOHA1(NO3)3-9H2O
Na2SiO3»9H2O
NaNO3
NaFNa2SO4
Na3PO4«12H2O
Na3HEDTA«2H2O
Na4EDTA-3H2O
Na3Citrate
Glycolic acid
H2O
Solution 2
Fe(NO3)3»9H2O
H2O
Solution 3NaNO2
Cr(NO3)3-9H2O
Ni(NO3)2«6H2O
Mn(NO3) 2
KNO3
Pd(NO3)2
RuCl4»5H2O
Rh(NO3)3«2H2O
Ce(NO3)3«6H2O
Bi(NO3)3«5H2O
Pb(NO3)2
H2O
Mol. Wt(g/mol)
40375.13
284.2
84.99
41.99
142.04
380.13
344.18
380.2
294
7618
404
18
69
400.15
290.81
178.95
101.1
230.41
332.96
324.93
434.23
485.07
331.23
18
Mass
(g)
14232
0.9
1874.41.2
3.1
36.2
8.79
35.8
23735
29.1
64.8
87.3
0.5
0.8
0.3
0.4
0.012
0.02
0.019
1.8
. 1.5
2.6
162.5
Cone.(M)
3.550.085
0.003
2.20
0.10
0.01
0.01
0.11
0.02
0.12
0.30
40.8
0.72
36.00
6.33
0.01
0.01
0.01
0.02
0.0003
0.0003
0.0003
0.02
.0.02
0.04
45.1
B.7

Table B.12. Procedure for Irradiating the Simulant and Collecting Gas Samples1. Close vent, open purge valves, and turn on headspace gas mixture for 10 minutes2. Close purge valves and turn off gas3̂ Open vent4. Hook up vessels; close vent5. Open gas (oxygen/argon) inlet (2.7 atm)6. Slowly open purge valves; let the vessel sit for 5 to 10 minutes; leak-check fittings on the
lid with leak detector solution7. Take readings of temperature and pressure; close purge valves; open vent; let the vessel
sit for 30 to 60 minutes8. Take pressure readings to verify that the vessel does not leak9. Slowly open each purge valve until bubbles are gone; close purge valves
10. Turn gas on and vent manifold; close vent11. Slowly open purge valves; let the vessel sit for 5 to 10 minutes12. Close purge valves; close gas inlet13. Open vent14. Repeat steps 6 to 1015. Repeat 6; take readings, including pressure16. Repeat 7 and continue at step 1717. Open purge valves slowly and wait until the pressure reaches -2.7 atm; let the vessel sit
for 5 to 10 minutes18. Take readings; close purge valves19. Close gas supply; open vent. Shut off regulator20. Leave vessel at pressure overnight21. Check pressures22. If pressures are OK, then open vent; slowly open each purge valve until bubbles are gone23. Close purge valves24. Connect thermocouple and heat tape to temperature controller; place vessel in the
irradiator, if irradiating25. Bring vessel up to temperature slowly; stabilize at temperature for 1 to 2 hours26. Take readings and start data logging27. Record time and pressure prior to discontinuing heating and removal of vessel from y
irradiator.28. Collect headspace gas sample after reactor has cooled to ambient temperature (~25°C)29. Close reactor valve and disconnect from the gas manifold30. Remove solution and solids from the reactor and clean the vessel
B.8
Table B.13. Columns and Conditions Used for IPC Analyses of EDTA and HEDTA
Guard column: Adsorbosphere® C-8 cartridge
Analytical Column: Adsorbosphere® C-8 (25 cm x 4.6 mm, 5-jim particle size)
Flow: 1.5 mL/minSample Volume: 5 uL
Detection: UV, 280 nm, as copper complexMobile phase: 0.002 M dodecyltrimethylammonium bromide and 0.05 M
potassium dihydrogen phosphate, pH 6.5 '
Table B.14. AS-11IC Analysis Conditions
Guard column: Dionex AG11
Analytical Column: Dionex AS 11
Anion Suppressor: ASRS-1,4mm
How: 2.0 mL/min
Sample Volume: 25 \JL
Column Temperature: Ambient
Detection: Conductivity
Table B.15. AS-11. Analysis Mobile Phase Gradient
Time 5 raM 100 mM(minutes) e r NaOH NaOH
0.02.9
6.4
18.4
9090
0
0
1010
100
65
0
0
0
35
B.9

Table B.16. AS-6 Analysis Conditions
Guard column: None
Analytical Column: Dionex ICE-IonPac AS6 (9x250 mm)
Flow: l.OmL/min
Sample Volume: 25 \iL
Mobile phase: 0.4 mM heptafluorobutyric acid
Detection: Conductivity
Suppressor: AMMS-ICE
Suppression eluant: 5 mM tetrabutylammonium hydroxide
Suppression eluant flow 3 mL/min
Column Temperature Ambient
B.10

Appendix C
The Energy Content of Intermediate Organic Compounds

The Energy Content of Intermediate Organic Compounds
Leon M. StockAugust 11,1998
The chemical reaction sequences discussed in this report and in other reports indicate that avariety of intermediate compounds are produced during the conversion of the original com-plexants into remnants, oxalate, formate, and carbonate ion. Concerns have often been expressedabout the energy contents of the intermediates formed during these reactions and especially aboutthe possibility that one or another of the intermediates might be more energetic than the originalcomplexants.
Some chemical transformations of the original complexants proceed directly to form theobserved products. But, in other cases, the chemical transformations of the original complexantsproceed indirectly through more highly functionalized intermediates containing additionalhydroxyl, nitroso, C- or O-nitro groups. Intermediates containing carbonyl, amido, and cyanogroups also participate in the chemical transformations that eventually lead to the observedremnants and oxidized products.
The well-known concept that the molecular behavior of a complex molecule can be describedas the additive sum of the contributions of its functional groups has been used to estimatechanges in the thermodynamic heats of the nitrate-ion oxidation of the intermediates and theoriginal complexants. The results indicate the substitution of a hydrogen atom in a complexantby. a hydroxyl, C-nitro, O-nitro, or nitroso group either has'no effect or decreases thethermodynamic heat of nitrate ion-oxidation. The conversion of a carbon atom in a wastemolecule into an aldehydo, keto, amido, or cyano group should lower the thermodynamic heat ofthe nitrate ion-oxidation reaction. Generally, the results of this assessment indicate that the heatsof the nitrate-ion oxidation of these intermediate compounds should be the same or smaller thanthe heats of reaction of the original complexants. The fuel content of the waste is systematicallydecreased during the aging process as the less-energetic intermediates, remnant molecules, oxalate,formate, and carbonate ion form.
C.I Introduction
The chemical reaction sequences discussed in this report and in Stock and Pederson (1997)indicate that a variety of intermediate compounds are produced during conversion of the originalcomplexants into remnant molecules such as ED3A, ED2A, NTA, and IDA, and acetate, oxalate,and formate ion. The thermodynamic heats of the nitrate ion-oxidation reactions of the originalcomplexants and the elementary carboxylic acids have been established (Burger 1995). However,the heats of oxidation for many of the intermediate compounds have not been examined. Becauseinformation about the energy contents of the different organic waste constituents is needed forthe confident discussion of the energetics and the evaluation of risks (Hunter et al. 1997), thisaspect of the chemistry is examined in this appendix. The chemistry of aging is briefly outlinedin Section C.2, and energy changes associated with aging are examined in Section C.3.
C.I

C.2 The Chemistry of Intermediate Compounds
The investigations of pure compounds, mixtures of waste simulants, and the wastes haveshown the chemistry is more subtle than implied by equations showing, for example, theoxidation of glycolate ion to oxalate ion and the reduction of nitrate ion to nitrite ion::
HOCH2CO2Na +2NaNO3 + NaOH-4 NaO2CCO2Na + 2NaNO2 + 2 H 2 O
because the oxidation proceeds through several different intermediates and the inorganic oxidantbecomes enmeshed in a reaction cascade leading to NO, NO-, N2O, N2, NH2OH, and NH3.
As already discussed in the main report, the chemistry begins with the radiolysis of the wasteto provide H, OH, O~, electrons, NO32-, NO and NO2. The organic oxidation reactions proceedby several different pathways. In one, the oxidation begins with reactions in which one of thereactive radicals produced during radiolysis or thermolysis abstracts a hydrogen atom from thecomplexant, and that reaction is followed by recombination reactions to produce a substitutedmolecule. In another pathway, the complexant undergoes an electron transfer reaction in theinitial step, and that reaction is followed by chemical transformations that lead to oxidizedintermediates.
Elaboration of this chemistry begins with the recognition that the family of reactive radicals israther restricted, with most of the chemical processes dictated by the reactions with nitric oxideand nitrogen dioxide. The family of organic radicals is much broader because of the array ofdifferent hydrogen atoms in the complexants and intermediates. The abstraction reactions ofglycolate and citrate ions each produce one free radical. EDTA provides two free radicals.HEDTA provides four radicals closely related to the substances formed from EDTA, and anotherradical with a distinctive structure. The electron transfer reactions and decarboxylation of EDTAand HEDTA provide primary radicals:
HOCHCO2"
HOC(CHCO2")(CH2CO21(CO2")
CO2CCH2)2NCH2CH2N(CHCO2")(CH2CO2-)
("O2CCH2)2NCH2CHN(CH2CO2-)2
CO2CCH2)2NCH2CH2N(CHCH2OH)(CH2CO2-)
("O2CCH2)2NCH2CH2N(CH2)(CH2CO2")
C.2

The recombination reactions of these radicals with the inorganic radicals lead to substitutionproducts as illustrated for the radical from glycolate and for one of the EDTA radicals[R = C02CCH2)2NCH2CHiNCH2CO2")].
HOCHCO2~ + NO2 -> HOCH(ONO)CO2" .
. HOCHCO2- + NO2 -> HOCH(NO2)CO2-
HOCHCO2" + NO -> HOCH(NO)CO2"
RCHCO2~ +N0 2 -4RCH(0N0)C0 2 "
• RCHCO2" + NO2 -> RCH(NO2)CO2-
RCHCO-f + NO -> RCH(NO)CO2~
Inspection of the structures of the products shown in these equations and consideration ofthe broad family of reactions of the other radicals shown above and the related radicals producedfrom the remnants reveal that the recombination reactions lead to the replacement of a hydrogenatom in the original complexant by a group with an electronegative oxygen or nitrogen. Thereactions of the different radicals provide new substances with an additional C-nitro, O-nitro, ornitroso group.
The products from these initial reactions are transformed into other substances in the alkalinewaste solutions discussed in Stock and Pederson (1997). Some processes are quite elementary.For example, the O-nitro group, a nitrite ester, is converted into a hydroxyl group by hydrolysisand the products from the original complexants with two electronegative functional groupsbonded to one carbon atom are hydrolyzed to molecules with carbonyl groups yielding
aldehydes, ketones, and amides. The chemistry of the molecules with C-nitroso and C-nitrogroups is somewhat more complex. The compounds with C-nitroso groups rearrange to oximesor oximates, which are subsequently converted into carbonyl compounds or carboxylates, and theC-nitro compounds are either converted into carbonyl compounds or oxidized by additionalreactions with the inorganic nitrogen oxides.
In summary, the oxidation reactions of the complexants that are initiated by free radicals leadto hydrogen atom removal or decarboxylation and to the introduction of an electronegativehydroxyl, C-nitroso, C- or O-nitro group into the molecule. These oxidized molecules areconverted into carbonyl compounds, including aldehydes, amides, and carboxylates. Thesefunctionalized intermediate substances are not stable in the aqueous alkaline wastes and areconverted into the more stable remnant molecules including ED3 A, NTA and IDA and formate,and oxalate and carbonate ions.
C.3

C.3 The Energy Content of the Intermediate Molecules
Burger (1995) calculated the thermodynamic heats of reaction for the oxidation of the organiccomplexants, selected remnants, and the simple carboxylate ions by sodium nitrite and sodiumnitrate in alkaline solution. His approach could not be used for the evaluation of the heats ofreaction of intermediates because the required thermodynamic data are not available for thesesomewhat unusual substances.
Fortunately, there is an alternative approach based upon the concept that molecularproperties can be treated additively to provide approximate but reliable estimates of the expectedchanges in the energy contents of the intermediates. Linear free energy relationships and groupincrement approaches have been used for many years to evaluate the physical and chemicalproperties of substituted organic molecules (Lowry and Richardson 1987; March.1992). Forexample, the group increment heats of formation data tabulated by Benson (Benson 1975; Lowryand Richardson 1987) have been widely used to estimate the heats of formation of chemicalcompounds for which the thermodynamic information has not been obtained.
The well-known concept asserts that the molecular properties of molecules can be regarded asthe additive sum of the contributions of their functional groups. This approach has been usedhere in an elementary form to estimate the change in the thermodynamic heats of reactionresulting from the replacement of a hydrogen atom in a complexant by the groups discussed inSection C.2 to determine whether the intermediate organic compounds have increased ordecreased energy contents.
Specifically, it is postulated that the difference in the heat content of an intermediate and thecompound from which it was formed can be estimated with sufficient accuracy by comparing thedifference in the heat content resulting from the introduction'of the same substituent group into asimple molecule for which accurate data are available. To illustrate, the difference in the heat ofoxidation of glycolate ion and the nitroglycolate ion is equated to the difference in the heats ofreaction of methane and nitromethane or ethane and nitroethane:
{[heat of oxidation of HOCH2CO21 - [heat of oxidation of HOCH(NO2)CO2"]}
is approximately equal to
{[heat of oxidation of CH4] - [heat of oxidation of CH3NO2]}
and to
{[heat of oxidation of CH3CH3] - [heat of oxidation of CH3CH2NO2]}
The approach is most suitable when the structural change is modest, as it is for substitutionreactions where, as in this illustration, a nitro group is substituted for a hydrogen atom in eachcase.
In addition, it is necessary to select molecular fragments for which the heats of formation areknown. Fortunately, there are many heat of formation data for methanes and ethanes with the
C.4

desired functional groups. Unfortunately, the heats of solution of these substances are not allknown. This difficulty was circumvented by adopting the gas phase oxidation with nitric acid.The heats of formation of the requisite molecules are available, and the reaction leading to carbondioxide and nitrous oxide was employed to represent the nitrate-ion oxidation.
4CH3CH3 +14HNO3-» 8CO2 +7N2O + 13H2O
The accuracy of the approach was examined in several ways. First, it was noted thatCamaioni et al. 1994; Camaioni and Samuels (1995) and their colleagues had shown that the heatsof nitrate-ion oxidation of the organic complexants in alkaline solution evaluated by Burger werelinearly related with the heats of oxidation of the same substances with oxygen in the gas phase.Next, the heats of oxidation of ethane by nitric acid for the reaction shown in the equation werecompared with the heat of reaction for the same reaction with nitrate ion in alkaline solution.
4CH3CH3(g) + 14NaNO3(aq) + 2NaOH (aq) -> 8Na2CO3(aq).+ 7N2O(g)+ 13H2O(1)
The results indicate the heat of oxidation is -1216 kJ/mole for the liquid phase reactioncompared with -1246 kJ/mole for the gas phase reaction. Similarly, the heats of the oxidationreactions of ethanol and acetaldehyde in alkaline aqueous systems with sodium nitrate and in thegas phase with nitric acid were compared:
4CH3CH2OH(1) + 12NaNO3(aq) + 4NaOH (aq) -* 8Na2CO3(aq) + 6N2O(g) + 14H2O(1)
Heat of oxidation is -1104 U/mole compared to -1113 kJ/mole for the gas phase reaction.
4CH3CHO(g) + 10NaNO3(aq) + 6NaOH (aq) -» 8Na2CO3(aq) + 5N2O(g)+ 11H2O(1)
Heat of oxidation is -906 kJ/mole compared to -958 kJ/mole for the gas phase reaction.
These observations indicate there are no significant differences between the heats of reactionof ethane and ethanol in the gas and liquid phases and that the difference for acetaldehyde issmall, about 50 kJ/mole, compared with the difference in the heat of oxidation of ethanol andacetaldehyde, 150 to 200 kJ/mole. Differences of this kind would not compromise theconclusions of the analysis presented in the remainder of this section.
The observations-for the family of different derivatives of methane and ethane are assembledin Tables C.I through C.3. The results in Table C.I reaffirm the generally agreed-upon viewpointthat oxidation reduces the energy content of organic substances in a systematic manner. The heatcontent of the organic molecule is reduced by more than 100 kJ/mole by oxidation of the hydro-carbon to the alcohol and by oxidation of the alcohol to the aldehyde, and by even larger amountsby oxidation of the aldehyde to the acid and the acid to carbon dioxide.
C.5

Table C.l. Heats of Nitric Acid Oxidation of Methane and Ethane and TheirOxidized Derivatives in kJ/Mole at 300K in the Gas Phase
Compound Heat Compound HeatMethaneMethanolMethanalFormic Acid
Carbon Dioxide
-693-594-472-230
0
EthaneEthanolEthanalAcetic AcidOxalic AcidCarbon Dioxide
-1246-1113
-858-727-269
0
Table C.2. Heats of Nitric Acid Oxidation of Methane and Ethane and theNitrate Ester, Nitrite Ester, Nitroso and Nitro Compounds inkJ/Mole at 300K in the Gas Phase
Compound Heat Compound Heat.. -1246-1233
MethaneNitrosomethaneNitromethaneTrinitromethaneTetranitromethaneMethyl NitriteMethyl Nitrate
Table CA Heats of Nit
-693-700-586-521-460-595-570
icAcidOxid
EthaneNitrosoethane
ation of Methane iRelated Oxides, Amides, Nitriles and Amines in kJ/Mole at 300Kin the Gas Phase
Compound Heat Compound HeatMethane
Methyl hydroperoxideHydrogen cyanideFormamideMethyl amine
-693
-691-527-447-798
EthaneDimethyl etherDimethyl peroxideAcetonitrile
Dimethyl amine
-1246-1165-1253-1032
-1354
The influences of the substitution of an electronegative hydroxyl, C-nitro, O-nitro or nitrosogroup for a hydrogen atom are explored in Table C.2. The heats of oxidation of the nitrosocompounds are unchanged from the heats of oxidation of the parent hydrocarbons. In contrast,the heats of oxidation of the inorganic esters, i.e., the O-nitro compound and the related ester ofnitric acid, are smaller than the heats of oxidation of the unsubstituted compound. The C-nitrocompound also has a smaller heat of oxidation than the unsubstituted compound. These
C.6

reductions in the heat content of the organic intermediates are anticipated because of the oxidativenature of the process in which a fuel-rich carbon-hydrogen unit is replaced by a relativelyfuel-poor carbon-oxygen or carbon-nitrogen unit
The ongoing interest in the role of C-nitro compounds in the waste prompted the comparisonof the consequences of the systematic substitution of all of the carbon-hydrogen sites with nitrogroups. The heats of oxidation for the compounds with one, three and four C-nitro groups inTable C.2 show the successive replacement of hydrogen systematically decreases the fuel valueof these compounds. Nitromethane and its derivatives are not energetic molecules in the environ-ment of the waste for tworeasons. First, as already mentioned, the replacement of a hydrogenatom by an electronegative nitro group decreases the energy content of the molecule, and second,because it is inconsequential whether the oxidizing agent is provided intermolecularly orintramolecularly in the oxidant rich environment of the waste.
Results for several other substances are assembled in Table C.3. Hydroperoxides are antici-pated intermediates in the reactions of oxygen generated during radiolysis with the organic wastemolecules. The results in the table suggest that the heats of oxidation of the molecules formed bythe replacement of hydrogen with a hydroperoxy group and the related ethers and peroxides,which are considered for completeness, should have energy contents comparable with the energycontent of the compounds from which they are formed.
The heats of oxidation of amides and nitriles were examined since molecules with thesestructural components are anticipated intermediates. These substances, in which carbon is in thesame oxidation state as the carbon in a carboxylic acid or carboxylate ion, have considerablysmaller heats of oxidation than the molecules from which they would have been formed asexpected on the basis of the results displayed in Table C.3.
The results in Table C.3 indicate the replacement of a hydrogen atom by an amino group toform an alkyl amine would lead to an increase in the energy content of the molecule as a conse-quence of the introduction of the additional, energetic nitrogen-hydrogen bonds. However,amines do not form by substitution reactions because chemistry of this kind is precluded by theoxidative nature of the reaction system. Rather, the organic molecules with primary aminogroups such as glycinate ion and secondary amino groups such as IDA are produced after ratherlong reaction sequences. The changing energy contents are illustrated by the conversion ofEDTA into an amide and the conversion of the amide into NTA and IDA.
CO2CCH2)2NCH2CH2N(CH2CO2-)2 -> -»
CO2CCH2)2NCH2C(=O)N(CH2CO2-)2 -> CO2CCH2)2NCH2CO2- + HN(CH2CO2-)2
The secondary amino group of IDA (bold type) is derived from the nitrogen (also shown inbold type) in EDTA and the amide formed from it. The heat of oxidation of the amide with anoxidized methylene group is considerably smaller than the heat of oxidation of EDTA. Hydroly-sis of the intermediate amide provides NTA and IDA. The heat of oxidation per carbon of IDA,which has a secondary amino group and a nitrogen-hydrogen bond, is somewhat greater than the
C.7
heat of oxidation per carbon of NTA. However, the sum of the heats of oxidation of NTA andIDA is much less than the heat of oxidation of EDTA. As before, the oxidation reactionssystematically decrease the energy content of the reaction system.
In summary, an additivity approach has been used to estimate the changes hi the thermo-dynamic heats of the nitrate-ion oxidation of the intermediates and the original complexants.Some of the reactions involving the substitution of a hydrogen atom in a complexant by ahydroxyl, C-nitro, O-nitro, or nitroso group yield intermediates with the same energy content asthe original complexant, but most reactions provide intermediates with lower thermodynamicheats of oxidation. The conversion of a carbon atom in a waste molecule into an aldehydo, keto,amido, or cyano group should similarly lower the thermodynamic heat of the nitrate ion-oxidationreaction. When molecules fragment, as discussed for the conversion of EDTA to NTA and IDA,the energy content of the system is both reduced and redistributed. Quite generally, the resultsindicate that the heats of the nitrate-ion oxidation of intermediate compounds should be the sameor smaller than the heats of reaction of the original complexants. The fuel content of the waste issystematically decreased during the aging process as the less energetic intermediates, remnantmolecules, oxalate, formate, and carbonate ion form.
C.4 References
Benson SW. 1976. Thermochemical Kinetics, Second Edition, John Wiley and Sons, New York.
Burger LL. 1995. Calculation of Reaction Energies andAdiabatic Temperatures for Waste TankReactions. PNL-8557 Rev 1, Pacific Northwest Laboratory, Richland, Washington.
Camaioni DM and WD Samuels. 1995. "Origin and Subsequent Aging of Organic Chemicals inHanford Tank Farms." InWebbetal. 1995, Preliminary Safety Criteria for Organic Watch ListTanks at the Hanford Site, WHC-SD-WM-SARR-033 Rev. 0, Westinghouse Hanford Company,Richland, Washington.
Hunter VL, SD Colson, T Ferryman, RE Gephart, P Heasler, and RD Scheele. 1997.Applications of the Risk-Based Strategy to the Hanford Tank Waste Organic-Nitrate Safety Issue.PNNL-11798, Pacific Northwest National Laboratory, Richland, Washington.
Lowry TH and KS Richardson. 1987. Mechanism and Theory in Organic Chemistry, ThirdEdition. Harper and Row, New York.
March J. 1992. Advanced Organic Chemistry: Reactions, Mechanisms, and Structure, FourthEdition. John Wiley and Sons, New York. . .
Samuels WD, DM Camaioni, LL Burger, and H Babad. 1994. "Effects of Aging on the EnergyContent of Organic Compounds in the Hanford Tanks." Symposia on Scientific Issues Related toSafety and Treatment of Hanford Waste Tanks, 208th American Chemical Society Meeting,August 21-25,1994. PNL-SA-24067, Pacific Northwest Laboratory, Richland, Washington.
Stock LM and LR Pederson. 1997. Chemical Pathways for the Formation of Ammonia inHanford Waste. PNNL-11702, Pacific Northwest National Laboratory, Richland, Washington.
C.8