Embed Size (px)
Citation preview
48 PART VII: SECTION 1. BUILDING USE
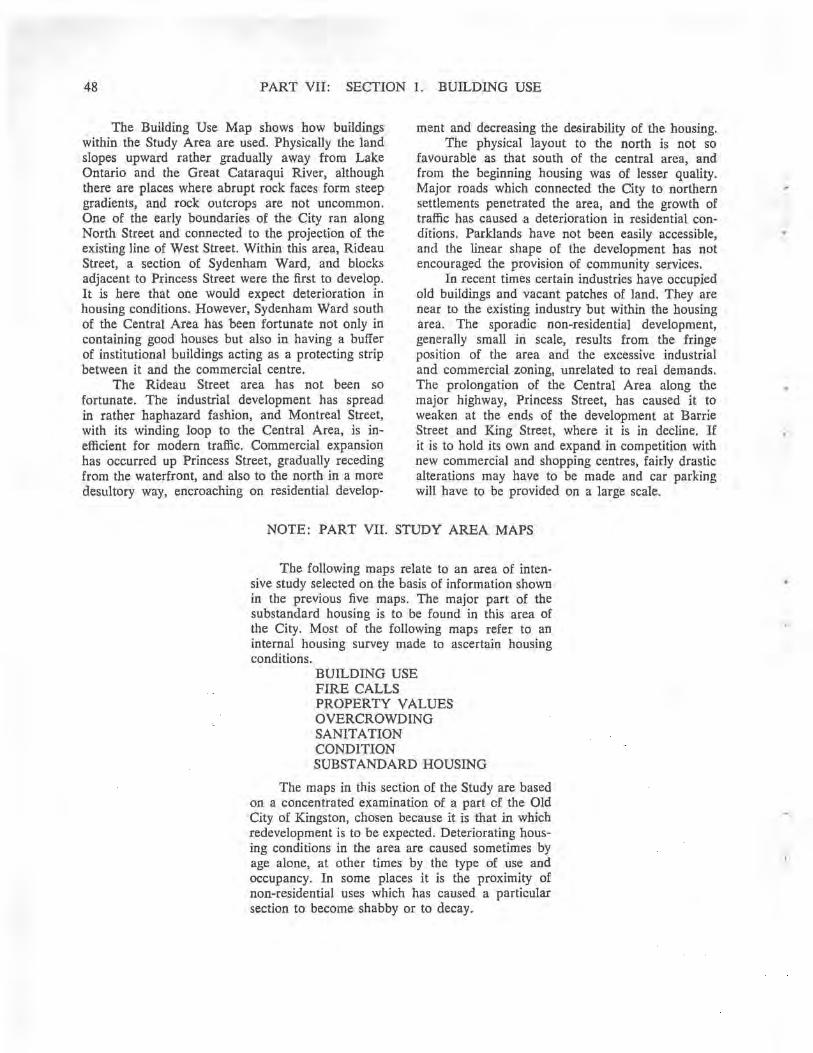
The Building Use Map shows how buildings within the Study Area are used. Physically the land slopes upward rather gradually away from Lake Ontario and the Great Cataraqui River, although there are places where abrupt rock faces form steep gradients, and rock outcrops are not uncommon. One of the early boundaries of the City ran along North Street and connected to the projection of the existing line of West Street. Within this area, Rideau Street, a section of Sydenham Ward, and blocks adjacent to Princess Street were the first to develop. It is here that one would expect deterioration in housing conditions. However, Sydenham Ward south of the Central Area has been fortunate not only in containing good houses but also in having a buffer of institutional buildings acting as a protecting strip between it and the commercial centre.
The Rideau Street area has not been so fortunate. The industrial development has spread in rather haphazard fashion, and Montreal Street, with its winding loop to the Central Area, is inefficient for modern traffic. Commercial expansion has occurred up Princess Street, gradually receding from the waterfront, and also to the north in a more desultory way, encroaching on residential develop-
ment and decreasing the desirability of the housing. The physical layout to the north is not so
favourable as that south of the central area, and from the beginning housing was of lesser quality. Major roads which connected the City to northern settlement-s penetrated the area, and the growth of traffic has caused a deterioration in residential conditions. Parklands have not been easily accessible, and the linear shape of the development has not encouraged the provision of community services.
In recent times certain industries have occupied old buildings and vacant patches of land. They are near to the existing industry but within the housing area. The sporadic non-residential development, generally small in scale, results from the fringe position of the area and the excessive industrial and commercial zoning, unrelated to real demands. The prolongation of the Central Area along the major highway, Princess Street, has caused it to weaken at the ends of the development at Barrie Street and King Street, where it is in decline. If it is to hold its own and expand in competition with new commercial and shopping centres, fairly drastic alterations may have to be made and car parking will have to be provided on a large scale.
NOTE: PART VII. STUDY AREA MAPS
The following maps relate to an area of intensive study selected on the basis of information shown in the previous five maps. The major part of the substandard housing is to be found in this area of the City. Most of the following maps refer to an internal housing survey made to ascertain housing conditions.
BUILDING USE FIRE CALLS PROPERTY VALUES OVERCROWDING SANITATION CONDITION SUBSTANDARD HOUSING
The maps in this section of the Study are based on a concentrated examination of a part ef the Old City of Kingston, chosen because it is that in which redevelopment is to be expected. Deteriorating housing conditions in the area are caused sometimes by age alone, at other times by the type of use and occupancy. In some places it is the proximity of non-residential uses which has caused a particular section to become shabby or to decay.
..
1000
RESIDENTIAL
IN STITUTlONAL
COMMERCIAL
AND INDUSTRIAL
o ---I
-.'
1000 I
2000 !
BUILDING USE
3OpO
SCALE IN FEET
4000 !
5000 !
6000 !
7000 I
ILLUSTRATION NO. 4I-MAP 8-EXISTING USE OF BUILDINGS. The generalized land uses for the City were shown in Map No. 3 on page 39. Building uses are shown in three categories and the general shape of the commercial area can be noted. Source- 1955 SlIrvey.
49
50 PART VII: SECTION 2. FIRES IN DWELLINGS
The next two maps indicate areas where heavy expenses in firefighting are incurred by the City, or where low returnoS' for real estate taxation are evident. Both these maps were used to distinguish further areas which might be investigated through an internal survey of the houses.
Fire lalls for the years 1953-57 formed the basis for this 'section. They were classified into two types, primary and secondary hazards, in an attempt to relate the fire calls to the structure of a house rather than to the occupants or external forces.
Calls made due to any form of heater, fireplace or chimney, or because of a fault in the wiring of the house, were regarded as primary; calls related to cooking, cigarette smoking, backyard rubbish, lightning or short circuits in appliances were regarded as being secondary fires.
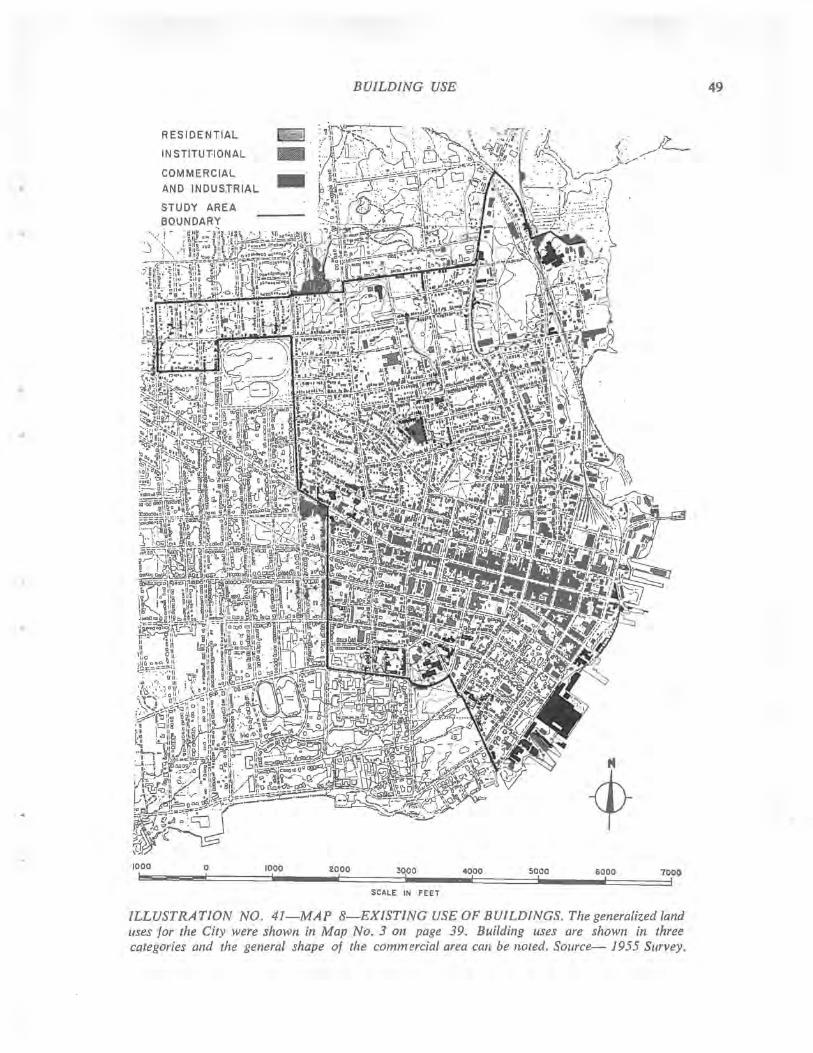
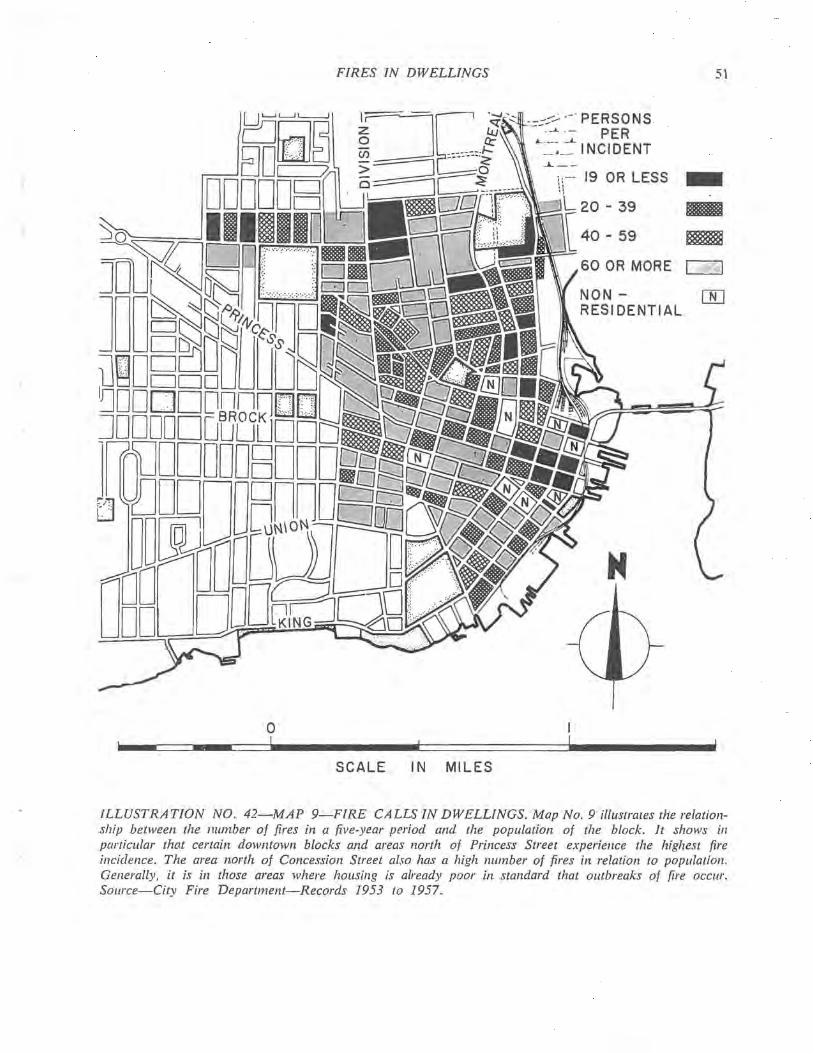
The results of this examination of the fire calls were then related to the population of the housing block concerned; i.e. a certain number of per'sons per fire call; the lower numbers per fire call indicating a higher fire hazard area.
Although most fire calls associated with heating appliances are caused by human negligence, it is generally in those areas where housing is already poor in standard that outbreaks of fire occur. The construction of many houses is a permanent fire hazard compared with better properties. The situation is made much more dangerous by the use in these same structures of inefficient and unsafe heaters. Appliances often are raised in temperatures to make up for the loss of heat through a badly insulated structure, increasing the hazard. All these factors point to false economy, and underline the need for stricter bylaws and enforcement.
Based on 1957 as a typical year, the following is an analysis of all residential fire calls excluding false alarms.
Causes Percentage Heating (Chimneys, stoves,
oil heaters, ashes) ... ..... .. ...... ..... . 52 ro Food Preparation (Cooker, grease) 11 % Electrical ......................... .. .... .. ..... .. .... .. . 18 % Miscellaneous (General
Carelessness Etc.) ..... ..... .... ........ ... ... 19 % Two areas are outstanding for the high number
of fires in relation to population. They include blocks of the worst category, and many surrounding blocks are almost as bad. The first area is between Rideau and Montreal Streets, and the 'second is in the Wartime Housing Area north of Concession Street and between Macdonnell Street and Grey Street.
Other poor areas are scattered generally to the north of Princess Street, although the easterly end of the Central Area below Bagot Street is concentrated.
During the 5 year period for which figures have been analyzed, 6 civilians have died through fires, and 7 civilians and 23 firemen have been treated medically for injuries received. Just recently in late 1959, a residential fire caused the deaths of 3 children within the Study Area. A heating appliance caused a rapid conflagration. This disastrous fire occurred at 222 Montreal Street. The external survey classified the property as being poor; an earlier survey showed that it was overcrowded.
The Fire Department, as well as being called to fires, makes fire prevention inspections of houses on request or on complaint. Heating appliances, electrical and gas services and supply, and alternative escape routes are examined.
The Department has power to authorize compliance with its code and, in certain situations, can authorize the removal of dilapidated buildings that are a fire hazard.
The Fire Department might act jointly with the Health and Building Departments when a city housing code has been established.
TABLE VI
FIRE CALL FREQUENCY ---Block No. Residence Fires People Persons Fire
65 1 - -66 3 136 45.3 67 5 208 41.6 68 2 94 47.0 69 none 71 -70 4 96 24.0 71 5 156 31.2 72 1 56 56.0 73 3 138 46.0
74 & 78 5 177 35.4 75 16 152 9.5 76 3 98 32.6 77 3 128 42.6 79 2 107 53.5 80 5 162 32.4 81 1 Institution -82 2 135 67.5
83 8 158 19.7 84 1 125 125.0 85 4 214 53.5 86 2 140 70.0 87 2 130 65.0 88 6 218 36.3 89 1 Institution -90 2 91 45.5 91 3 115 38.3 92 5 163 32.6 93 5 Commercial -94 2 8 4.0 95 4 195 48.7 96 none 140 -97 2 Industrial -
Sources: Kingston Fire Department figures - 1953-1957. Population and Building Density Report - 1957 - Ian MacGregor. Note: This is only a section of a table covering blocks 1-161 inclusive. The complete table may be seen in the City Planning Office.
o !
FIRES IN DWELLINGS
SCALE I N MILES
---;:-.;. --' PERSONS -: .. ~ ~ PER
__ L_ INCIDENT . .L __
;;-- 19 OR LESS
\L20 - 39
5\
-11IIIIIIII
~
60 OR MORE [2J
ILLUSTRATION NO. 42-MAP 9-FIRE CALLS IN DWELLINGS. Map No. 9 illustrates the relationship between the /lumber of fires in a five-year period and the population of the block. It shows ill particular that certain dowlltown blocks and areas north of Princess Street experiellce the highest fire incidence. The area north of Concession Street also has a high number of fires in relation to population. Generally, it is in those areas where hOllsing is already poor in standard that olltbreaks of fire occur. Source-City Fire Department-Records 1953 to 1957.
52 PART VII: SECTION 3. PROPERTY VALUES
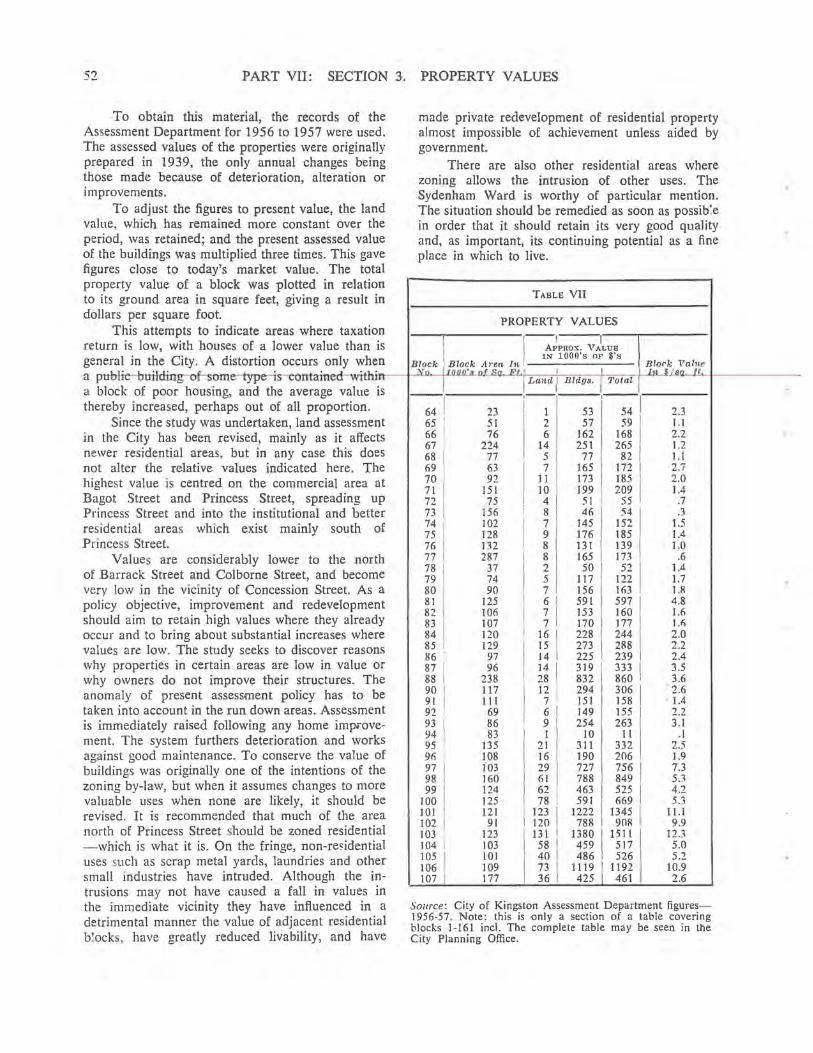
To obtain this material, the records of the Assessment Department for 1956 to 1957 were used. The assessed values of the properties were originally prepared in 1939, the only annual changes being those made because of deterioration, alteration or improvements.
To adjust the figures to present value, the land value, which has remained more constant over the period, was retained; and the present assessed value of the buildings was multiplied three times. This gave figures close to today's market value. The total property value of a block was plotted in relation to its ground area in square feet, giving a result in dollars per square foot.
This attempts to indicate areas where taxation
made private redevelopment of residential property almost impossible of achievement unless aided by government.
There are also other residential areas where zoning allows the intrusion of other uses. The Sydenham Ward is worthy of particular mention. The situation should be remedied as soon as possib~e in order that it should retain its very good quality and, as important, its continuing potential as a fine place in which to live.
TABLE VII
PROPERTY VALUES
return is low, with houses of a lower value than is ! A J PROX. V.~LUE .. I h IN 1000's OF $'8 general in the CIty. A dIstortion occurs on y w en Block Block Mea I" . I I!l{)"..k, _:-al!'te
Ll: b...:.J.A· &.-. • • .....L. ·,t-hi~-.J...-...!c¥· o'.U·---J.lf '-JJcnl"Il.!!Ot:.:"8U .. o~1(JSUla:.....t!:FL.t ' ,h:-:' ~+I -==:-+-;;;:-;-::-;-l-'LlL"~~'U'rl, "'Ul....].h.."-t-----_ -a pttUTIUIIUmg-ol "ome-typels-contan1~u wtu,,", I Lanel l Blclgs. I Total a block of poor housing, and the average value is ___ ', ______ ;. __
thereby increased, perhaps out of all proportion 64 I 23 " 1 I' 53 I'~I Since the study was undertaken, land assessment 65 I 51 I ~ 1 ~~ I 1 ~~ I
in the City has been revised, mainly as it affects ~~ 2~~ 14 I 251 265 I
newer residential areas, but in any case this does 68 77 5 1 77 82 I not alter the relative values indicated here. The 69 63 I 7 165 I 172 I highest value is centred on the commercial area at i? In I g l~~ I ~~~ I Bagot Street and Princess Street, spreading up 72 75 4 51 I 55 Princess Street and into the institutional and better 73 156 I 8 46 1 54
residential areas which exist mainly south of i1 1 l~~ I ~ lj~ l~~ Princess Street. 76 I 132 8 131 \ 139
Values are considerably lower to the north 77 I 287 I 8 165 173 78 I 37 I 2 50 52 \ of Barrack Street and Col borne Street, and become 79 74 I 5 117 122
very low in the vicinity of Concession Street. As a 80 I 90 7 156 163
policy objective, improvement and redevelopment ~i I 1 ~~ , ~ I i~j i~6 I should aim to retain high values where they already 83 I 107 7 170 177 occur and to bring about substantial increases where 84 I 120 I 16 I 228 \ 244
values are low. The study seeks to discover reasons ~~ I 1~~ I l~ I ~~~ ~~~ why properties in certain areas are low in value or 87 I 96 I 14 I 319 I 333 I why owners do not improve their structures. The 88 I 238 I 28 832 860
anomaly of present assessment policy has to be ~? I Ui I 1~ i~i i~~ I taken into account in the run down areas. Assessment 92 I 69 I 6 I 149 155
is immediately raised following any home improve- ~! I ~~ : ~ I 2ib 21i ment. The system furthers deterioration and works 95 I 135 I 21 311 332 against good maintenance. To conserve the value of 96 I 108 16 I 190 206
buildings was originally one of the intentions of the ~~ I 1 ~~ 1 ~~ I i~~ 1 ~~~ I
zoning by-law, but when it assumes changes to more 99 I 124 1 62 I 463 525 I valuable uses when none are likely, it should be 100 125 78 591 669 revised. It is recommended that much of the area 101 I 121 I 123 I 1222 1345 I
102 91 I 120 788 908 north of Princess Street should be zoned residential 103 I 123 1 131 I 1380 1 1511 1 - which is what it is. On the fringe, non-residential 104 103 58 \ 459 517
d d h 105 I 101 1 40 486 526 uses such as scrap metal yar s, laundries an ot er 106 109 73 1119 1 i 1192 I small industries have intruded. Although the in- 107 I 177 36 I 425 461
2.3 1.1 2.2 1.2 1.1 2.7 2.0 1.4
.7
.3 1.5 1.4 1.0
.6 1.4 1.7 1.8 4.8 1.6 Ui 2.0 2.2 2.4 3.5 3.6 2.6 1.4 2.2 3.1
.1 2.5 1.9 7.3 53 4.2 5.3
11.1 9.9
12.3 5.0 5.2
10.9 2.6
trusions may not have caused a fall in values ID
the immediate vicinity they have influenced in a detrimental manner the value of adjacent residential b:ocks, have greatly reduced livability, and have
Source: City of Kingston Assessment Department figures-1956-57. Note: this is only a section of a table covering blocks 1-161 incl. The complete table may be seen in the City Planning Office.
..
tI
o !
PROPERTY VALUES
SCALE I N MILES
S3
DOLLARS PER SQUARE FOOT
o - 1 l¥~~:::::::ii::::::iil
1 - 2 Em3 ... 2-4 ~ 4-8 ~ 8 -12 -12 + -
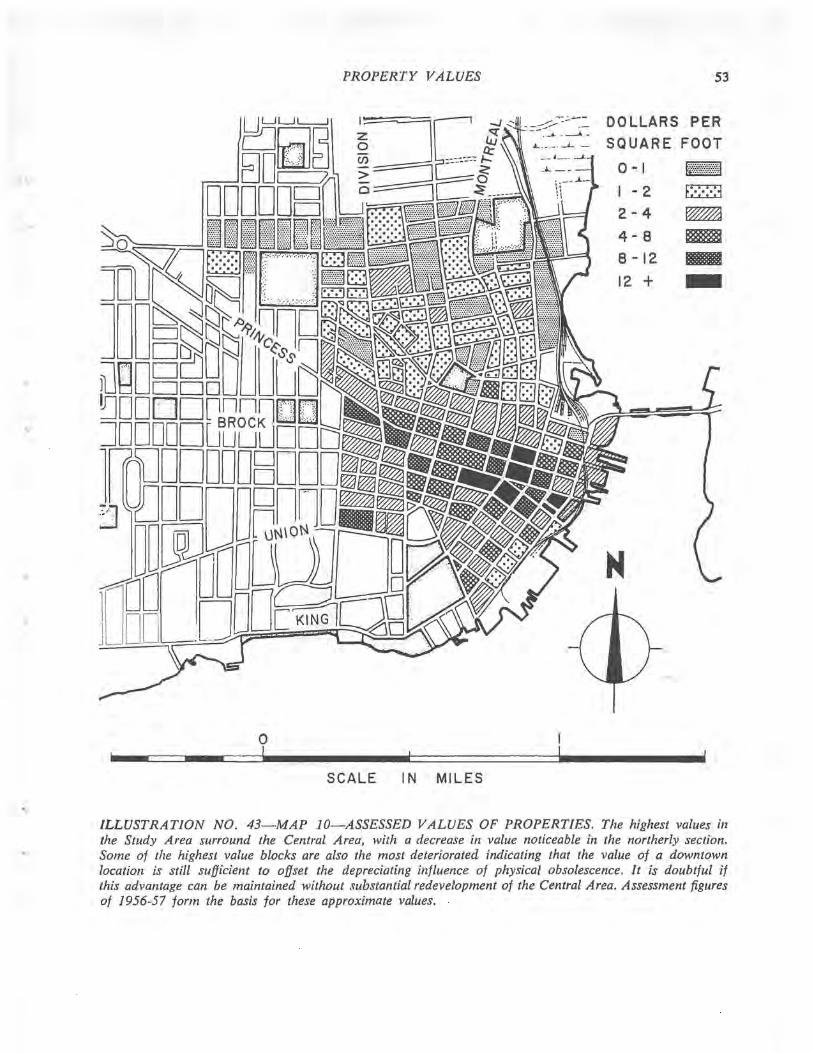
ILLUSTRATION NO. 43-MAP IO-ASSESSED VALUES OF PROPERTIES. The highest values ill the Study Area surround the Central Area, with a decrease in value noticeable in the northerly section. Some of the highest value blocks are also the most deteriorated indicating that the value of a downtown location is still sufficient to offset the depreciating influence of physical obsolescence. It is doubtful if this advantage can be maintained without substantial redevelopment of the Central Area. Assessment figures of 1956-57 form the basis for these approximate values.
54 PART VII: SECTION 4. OVERCROWDING
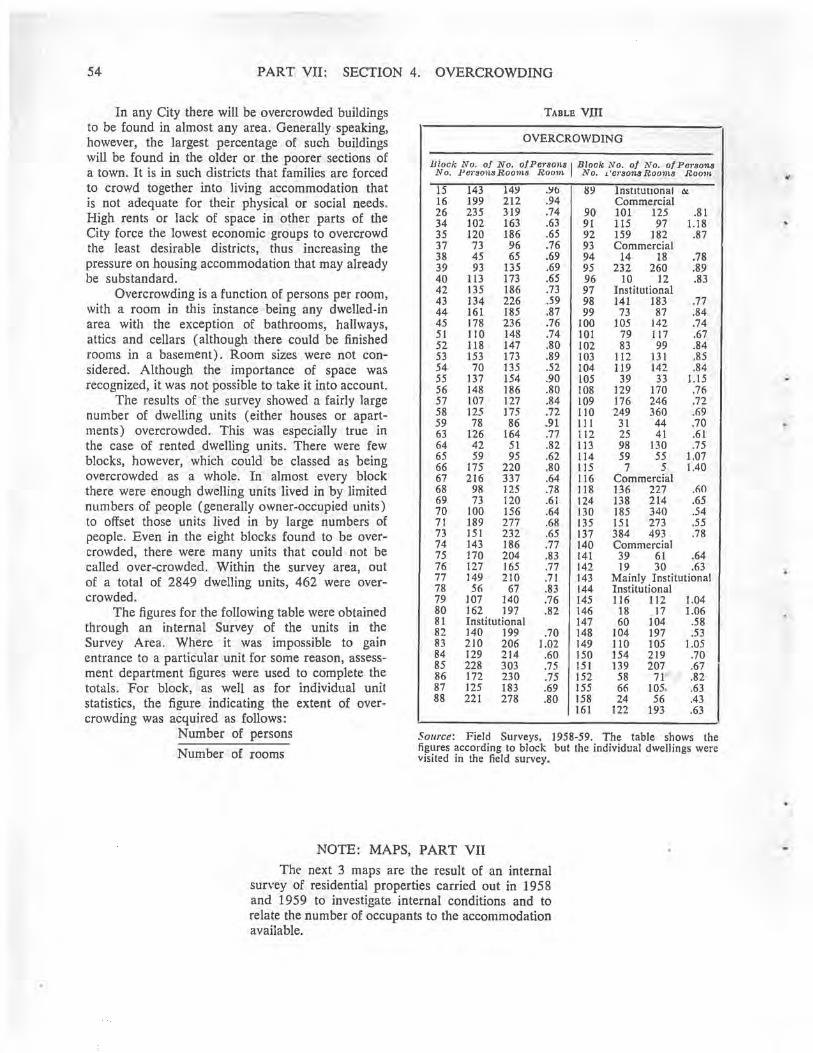
TABLE vm In any City there will be overcrowded buildings to be found in almost any area. Generally speaking, however, the largest percentage of such buildings will be found in the older or the poorer sections of a town. It is in such districts that families are forced to crowd together into living accommodation that is not adequate for their physical or social needs. High rents or lack of space in other parts of the City force the lowest economic groups to overcrowd the least desirable districts, thus increasing the pressure on housing accommodation that may already be substandard.
OVERCROWDING
Block No, of No. of pm'sonsl Block No, oJ No, 01 Persons No, P6I'sons Rooms Room No. L '61'sons Rooms Room
Overcrowding is a function of persons per room, with a room in this instance being any dwelled-in area with the exception of bathrooms, hallways, attics and cellars (although there could be finished rooms in a basement). Room sizes were not considered. Although the importance of space was recognized, it was not possible to take it into account.
The results of the survey showed a fairly large number of dwelling units (either houses or apartments) overcrowded. This was especially true in the case of rented dwelling units. There were few blocks, however, which could be classed as being overcrowded as a whole. In almost every block there were enough dwelling units lived in by limited numbers of people (generally owner-occupied units) to offset those units lived in by large numbers of people. Even in the eight blocks found to be overcrowded, there were many units that could not be called over-crowded. Within the survey area, out of a total of 2849 dwelling units, 462 were overcrowded.
The figures for the following table were obtained through an internal Survey of the units in the Survey Area. Where it was impossible to gain entrance to a particular unit for some reason, assessment department figures were used to complete the totals. For block, as well as for individual unit statistics, the figure indicating the extent of overcrowding was acquired as follows:
15 16 26 34 35 37 38 39 40 42 43 44 45 51 52 53 54 55 56 57 58 59 63 64 65 66 67 68 69 70 71 73 74 75 76 77 78 79 80 81 82 83 84 85 86 87 88
143 14~ 199 212 235 319 102 163 120 186 73 96 45 65 93 135
113 173 135 186 134 226 161 185 178 236 110 148 118 147 153 173 70 135
137 154 148 186 107 127 125 175 78 86
126 164 42 51 59 95
175 220 216 337
98 125 73 120
100 156 189 277 151 232 143 186 170 204 127 165 149 210 56 67
107 140 162 197 Institutional 140 199 210 206 129 214 228 303 172 230 125 183 221 278
.YfJ 119
.94
.74 90
.63 91
.65 92
.76 93
.69 94
.69 95
.65 96
.73 97
.59 98
.87 99
.76 100
.74 101
.80 102
.89 103
.52 104
.90 105
.80 108
.84 109
.72 110
.91 III
.77 112
.82 113
.62 114
.80 115
.64 116
.78 118
.61 124
.64 130
.68 135
.65 137
.77 140
.83 141
.77 142
.71 143
.83 144
.76 145
.82 146 147
.70 148 1.02 149 .60 150 .75 151 .75 152 .69 155 .80 158
161
InstitutIOnal <I.: Commercial 101 125 .81 115 97 1.18 159 182 .87 Commercial
14 18 .78 232 260 .89
10 12 .83 Institutional 141 183 .77 73 87 .84
105 142 .74 79 117 .67 83 99 .84
112 131 .85 119 142 .84 39 33 1.15
129 170 .76 176 246 .72 249 360 .69
31 44 .70 25 41 .61 98 130 .75 59 55 1.07 7 5 1.40
Commercial 136 227 .60 138 214 .65 185 340 ,54 151 273 .55 384 493 .78 Commercial 39 61 .64 19 30 .63
Mainly Institutional Institutional 116 112 1.04
18 17 1.06 60 104 .58
104 197 .53 110 105 1.05 154 219 .70 139 207 .67 58 71 .82 66 105 .63 24 56 .43
122 193 .63
Number of persons
Number of rooms Source: Field Surveys, 1958-59. The table shows the figures according to block but the individual dwellings were visited in the field survey.
NOTE: MAPS, PART VII
The- next 3 maps are the result of an internal survey of residential properties carried out in 1958 and 1959 to investigate internal conditions and to relate the number of occupants to the accommodation available.
.9 PERSONS PER HABITABLE RM.
OVERCROWDING
.. z o
MORE THAN I PERSON _ CI):::=::::==1 PER HABITABLE RM. > '---:::::;:::::::;;...
~ IUUUULJUU ~V(]a r"'j~B DDu .......... , D=-=,'?.;\
BB8@8EBB8BBQ~"",',',',',',',',',','J""----l OlLJDDDDDBDDo9&' ::J []ODDO° DD' m 000 DO
noD lOO uoo I ~. , o !
SCALE IN MILES
55
M
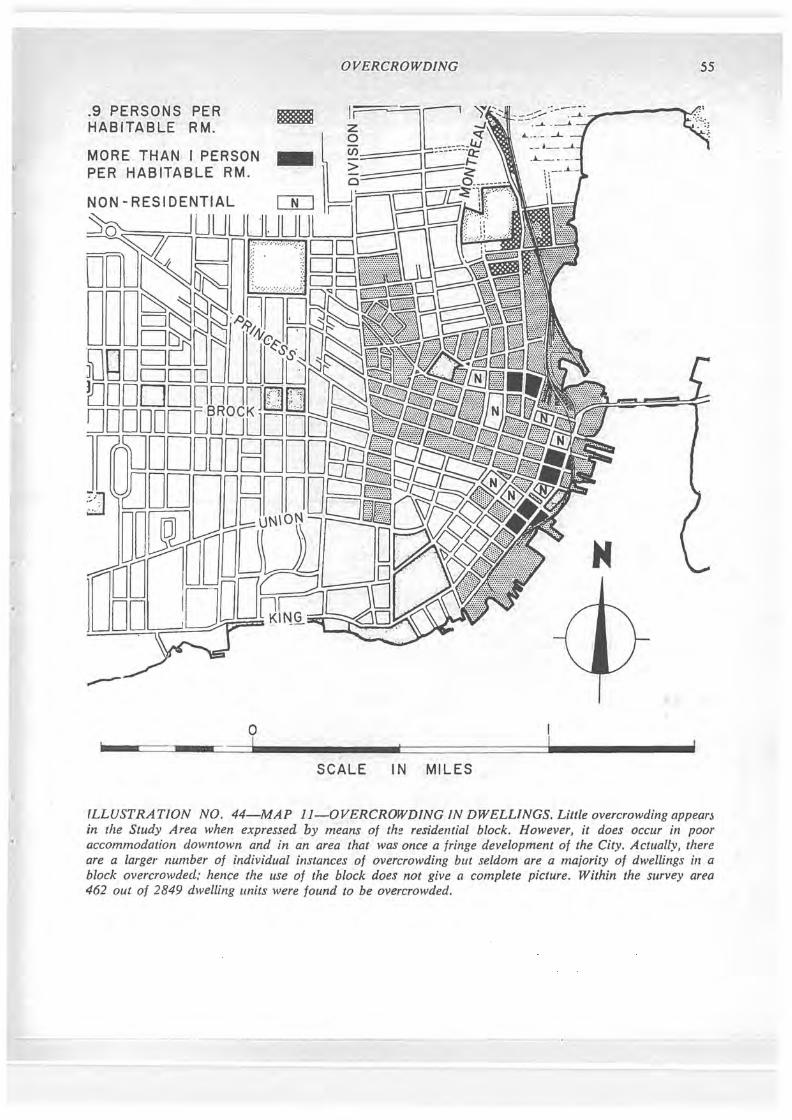
rLLUSTRATION NO. 44-MAP IJ-OVERCROWDING IN DWELLINGS. Little overcrowding appear~ in the Study Area when expressed by means of th~ residential block. However, it does occur in poor accommodation downtown and in an area that was once a fringe development of the City. Actually, there are a larger number of individual instances of overcrowding but seldom are a majority of dwellings ill a block overcrowded; hence the use of the block does not give a complete picture. Within the survey area 462 out of 2849 dwelling units were found to be overcrowded.
56 PART VII: SECTION 5. SANITATION
For persons who have always lived in homes with complete sanitary equipment it is difficult to realize how many others live in units where equipment is not adequate or where it must be shared with large groups, often with separate families. Where sanitary facilities do not come up to a required standard, especially where there is not hot water, it is a problem of health as well as inconvenience which is involved.
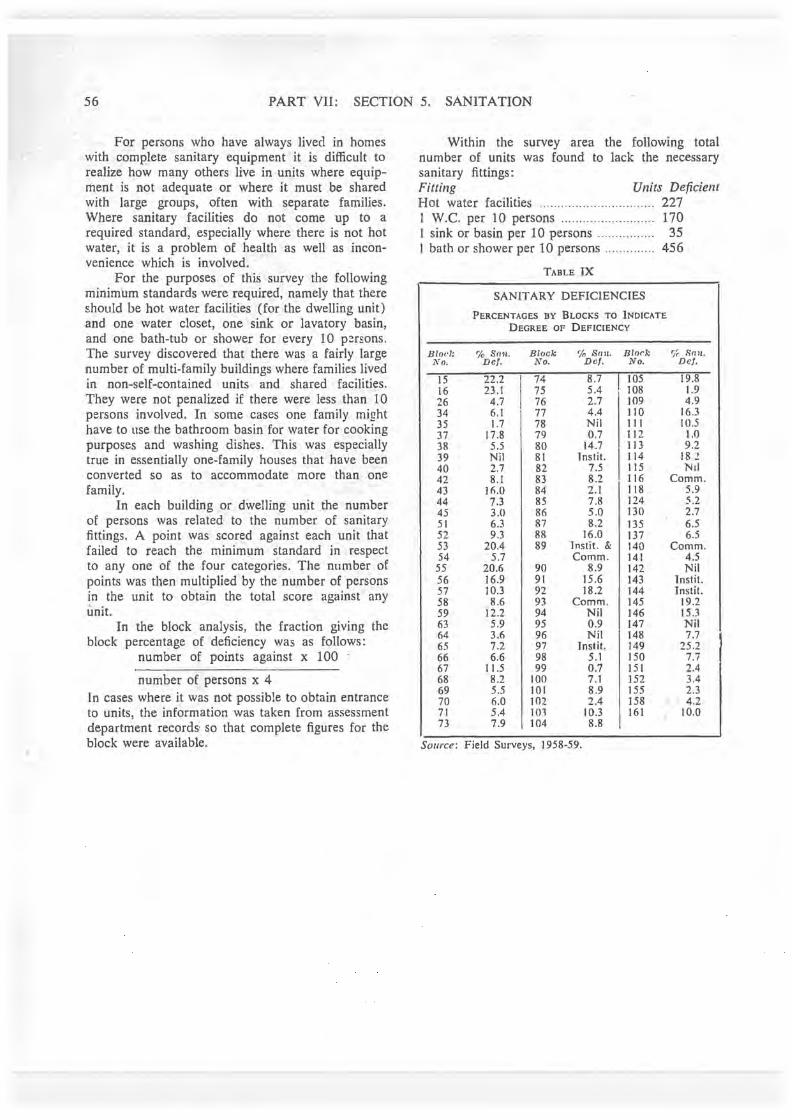
For the purposes of this survey the following minimum standards were required, namely that there should be hot water facilities (for the dwelIing unit) and one water closet, one sink or lavatory basin, and one bath-tub or shower for every 1 0 p~rsons. The survey discovered that there was a fairly large number of multi-family buildings where families lived in non-self-contained units and shared facilities. They were not penalized if there were less than 10 persons involved. In some cases one family might have to use the bathroom basin for water for cooking purposes and washing dishes. This was especially true in essentially one-family houses that have been converted so as to accommodate more than one family.
In each building or dwelling unit the number of persons was related to the number of sanitary fittings. A point was scored against each unit that failed to reach the minimum standard in respect to anyone of the four categories. The number of points was then multiplied by the number of persons in the unit to obtain the total score against any unit.
In the block analysis, the fraction giving the block percentage of deficiency was as follows:
number of points against x 100
number of persons x 4 In cases where it was not possible to obtain entrance to units, the information was taken from assessment department records~ so that complete figures for the block were available.
'.
Within the survey area the following total number of units was found to lack the necessary sanitary fittings: Fitting Units Deficient Hot water facilities ....... ...... .. ............. .... 227 I W.C. per 10 persons ........ .... .. ... .... ..... 170 I sink or basin per 10 persons .. .. .... .. ...... 35 I bath or shower per 10 persons .... .... ...... 456
TABLE IX
SANLT ARY DEFICIENCIES
PERCENTAGES BY BLOCKS TO INDICATE
DEGREE OF DEFICIENCY
BloC/; % S(l1I. Block % SOli. Blork 'I, S(lII . No. De!. No. Dc/. No. De/.
15 16 26 34 35 37 38 39 40 42 43 44 45 51 52 53 54 55 56 57 58 59 63 64 65 66 67 68 69 70 71 73
22.2 23.1
4.7 6.1 1.7
17.8 5.5 Nil 2.7 8.1
IIl.O 7.3 3.0 6.3 9.3
20.4 5.7
20.6 16.9 10.3 8.6
12.2 5.9 3.6 7.2 6.6
11.5 8.2 5.5 6.0 5.4 7.9
74 75 76 77 78 79 80 81 82 83 84 85 86 87 88 89
90 91 92 93 94 95 96 97 98 99
100 101 102 103 104
8.7 105 5.4 108 2.7 109 4.4 110 Nil III 0.7 112
14.7 113 Instit. 114
7.5 115 8.2 116 2.1 118 7.8 124 5.0 130 8.2 135
16.0 137 I nstit. & 140 Comm. 141
8.9 142 15.6 143 18.2 144
Comm. 145 Nil 146 0.9 147 Nil 148
Instit. 149 5.1 150 0.7 151 7.1 152 8.9 155 2.4 158
10.3 161 8.8
Source: Field Surveys, 1958-59.
19.8 1.9 4.9
16.3 10.5
1.0 9.2
18.! Nil
Comm. 5.9 5.2 2.7 6.5 6.5
Comm. 4.5 Nil
I nstit. Instit.
19.2 15.3 Nil 7.7
25.2 7.7 2.4 3.4 2.3 4.2
10.0
..
o !
SANITATION
SCALE IN MILES
57
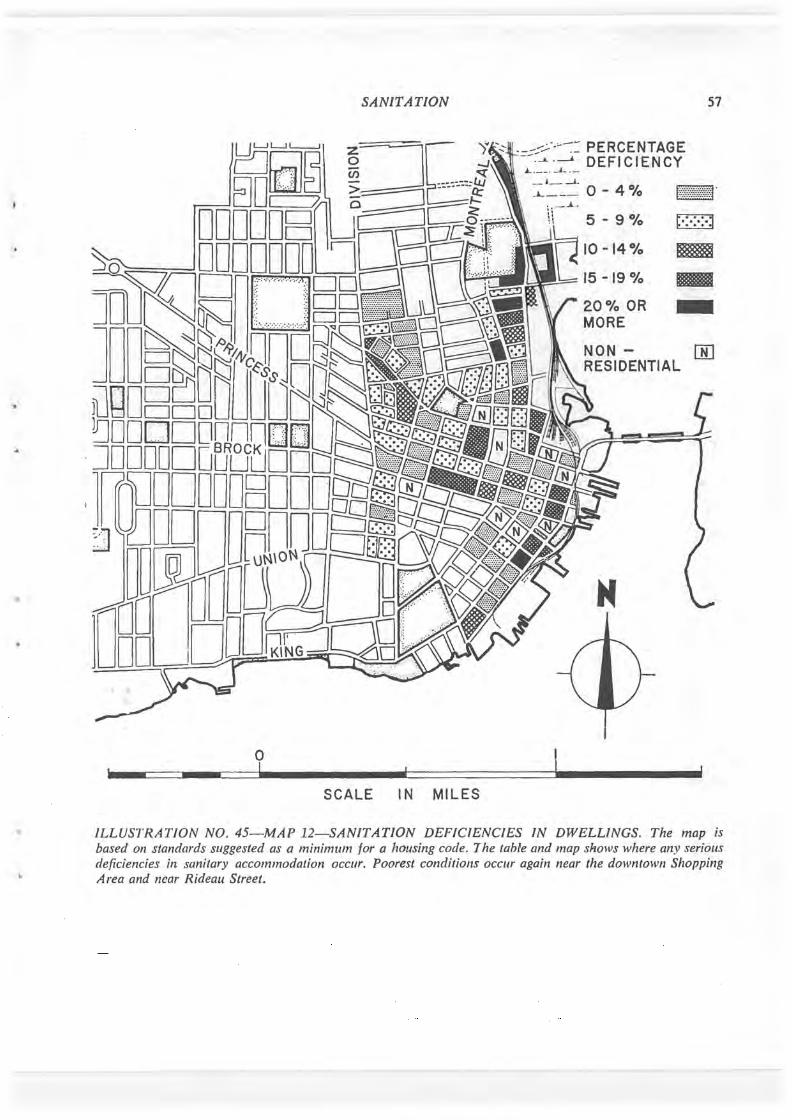
ILLUSTRATION NO. 45-MAP 12-SANITATION DEFICIENCIES IN DWELLINGS. The map is based on standards suggested as a minimum for a housing code. 1 he table and map shows where any serious deficiencies in sanitary accommodation occlIr. Poorest conditions occlIr again near the downtowfl Shopping
.. A rea and near Rideau Street.
58 PART VII: SECTION 6. CONDITION OF DWELLINGS
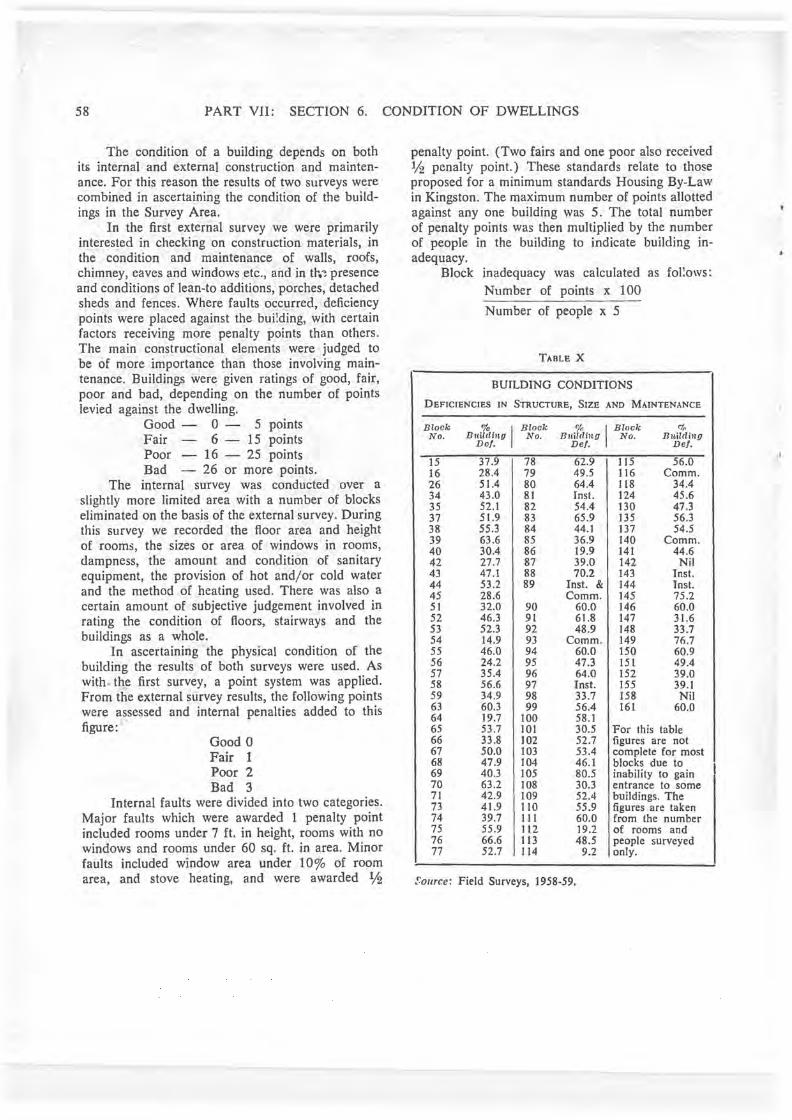
The condition of a building depends on both its internal and external construction and maintenance. For this reason the results of two surveys were combined in ascertaining the condition of the buildings in the Survey Area.
In the first external survey we were primarily interested in checking on construction materials, in the condition and maintenance of walls, roofs, chimney, eaves and windows etc., and in tr.~ presence and conditions of lean-to additions, porches, detached sheds and fences. Where faults occurred, deficiency points were placed against the building, with certain factors receiving more penalty points than others. The main constructional elements were judged to be of more importance than those involving maintenance. Buildings were given ratings of good, fair, poor and bad, depending on the number of points levied against the dwelling.
Good - 0 - 5 points Fair 6 - 15 points Poor - 16 - 25 points Bad - 26 or more points.
The internal survey was conducted over a slightly more limited area with a number of blocks eliminated on the basis of the external survey. During this survey we recorded the floor area and height of rooms, the sizes or area of windows in rooms, dampness, the amount and condition of sanitary equipment, the provision of hot and/or cold water and the method of heating used. There was also a certain amount of subjective judgement involved in rating the condition of floors, stairways and the buildings as a whole.
In ascertaining the physical condition of the building the results of both surveys were used. As with the first survey, a point system was applied. From the external survey results, the following points were assessed and internal penalties added to this figure:
Good 0 Fair 1 Poor 2 Bad 3
Internal faults were divided into two categories. Major faults which were awarded 1 penalty point included rooms under 7 ft. in height, rooms with no windows and rooms under 60 sq. ft. in area. Minor faults included window area under 10ro of room area, and stove heating, and were awarded 1f2
penalty point. (Two fairs and one poor also received 1f2 penalty point.) These standards relate to those proposed for a minimum standards Housing By-Law in Kingston. The maximum number of points allotted against anyone building was 5. The total number of penalty points was then multiplied by the number of people in the building to indicate building inadequacy.
Block inadequacy was calculated as fol!ows: Number of points x 100
Number of people x 5
TABLE X
BUILDING CONDITIONS
DEFICIENCIES IN STRUCTURE, SIZE AND MAINTENANCE
Block % I Block % I Block <1,
No. Building No. Builcling No. Bnil(liltg Dc/. Del. Del.
15 37.9 78 62.9 115 56.0 16 28.4 79 49.5 116 Comm. 26 51.4 80 64.4 118 34.4 34 43.0 81 Inst. 124 45.6 35 52.1 82 54.4 130 47.3 37 51.9 83 65.9 135 56.3 38 55.3 84 44.1 137 54.5 39 63.6 85 36.9 140 Comm. 40 30.4 86 19.9 141 44.6 42 27.7 87 39.0 142 Nil 43 47.1 88 70.2 143 Inst. 44 53 .2 89 Inst. & 144 lnst. 45 28.6 Comm. 145 75.2 51 32.0 90 60.0 146 60.0 52 46.3 91 61.8 147 31.6 53 52.3 92 48.9 148 33.7 54 14.9 93 Comm. 149 76.7 55 46.0 94 60.0 150 60.9 56 24.2 95 47.3 151 49.4 57 35.4 96 64.0 152 39.0 58 56.6 97 Inst. 155 39.1 59 34.9 98 33.7 158 Nil 63 60.3 99 56.4 161 60.0 64 19.7 100 58.1 65 53.7 101 30.5 For this table 66 33.8 102 52.7 figures are not 67 50.0 103 53.4 complete for most 68 47.9 104 46.1 blocks due to 69 40.3 105 80.5 inability to gain 70 63.2 108 30.3 entrance to some 71 42.9 109 52.4 buildings. The 73 41.9 110 55.9 figures are taken 74 39.7 I11 60.0 from the number 75 55.9 112 19.2 of rooms and 76 66.6 113 48.5 people surveyed 77 52.7 114 9.2 only.
f:ollrce: Field Surveys, 1958-59.
I
..
"
..
o !
CONDITION OF DWELLINGS
SCALE IN MILES
~9
---~/":-- PERCENTAGE -- . .L.-, INADEQUACY £.._ . ....L
__ 1 __ _
. .L ____ 0 - 29% [:::::::::~~::::::::::~:~
,.:.:.:. :1 30-44%
NON - [ID RESIDENTIAL
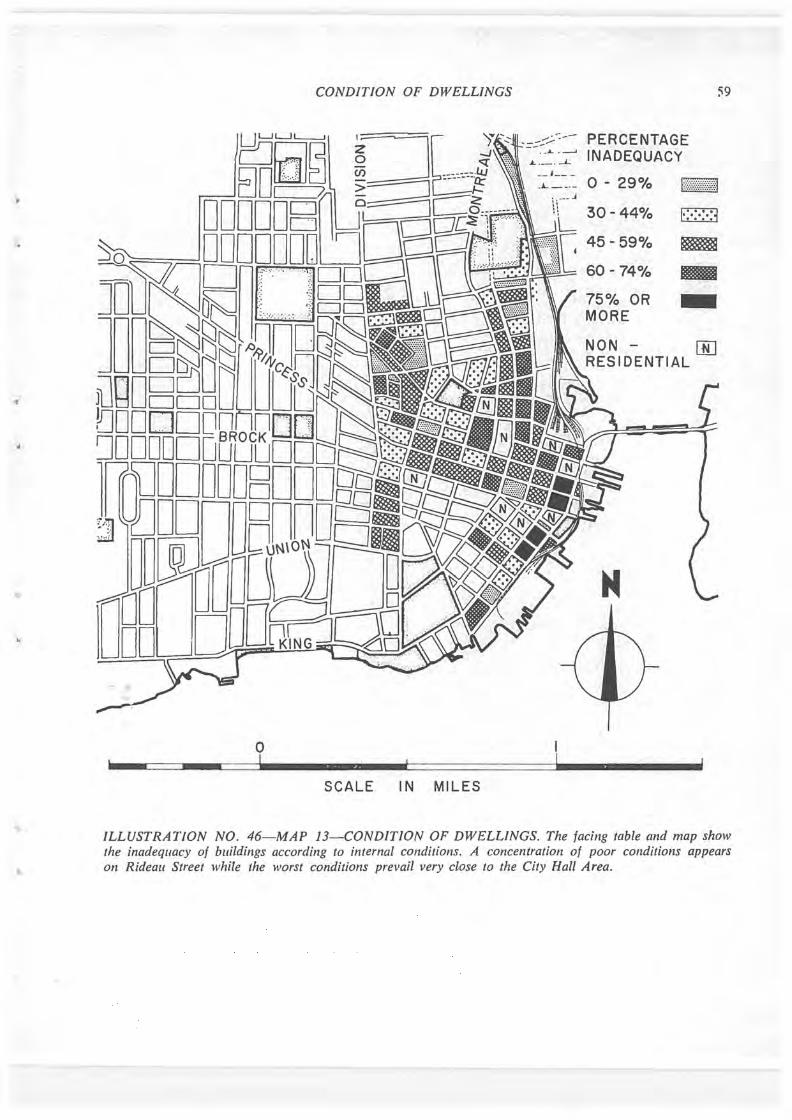
ILLUSTRATION NO. 46-MAP J3-CONDITION OF DWELLINGS. The facing table and map show the inadequacy of buildings according to internal conditions. A concentration of poor conditions appears on Rideau Street while the worst conditions prevail very close to the City Hall Area.
60 PART VII: SECTION 7. DISTRIBUTION OF SUBSTANDARD HOUSING
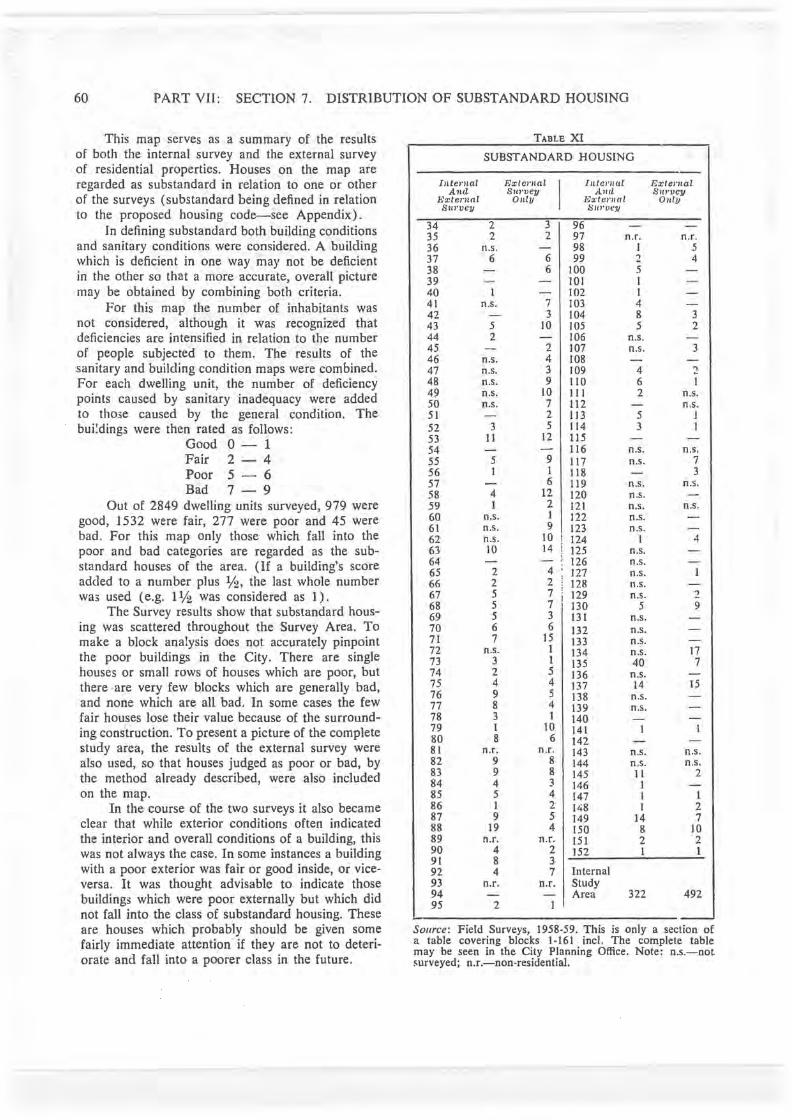
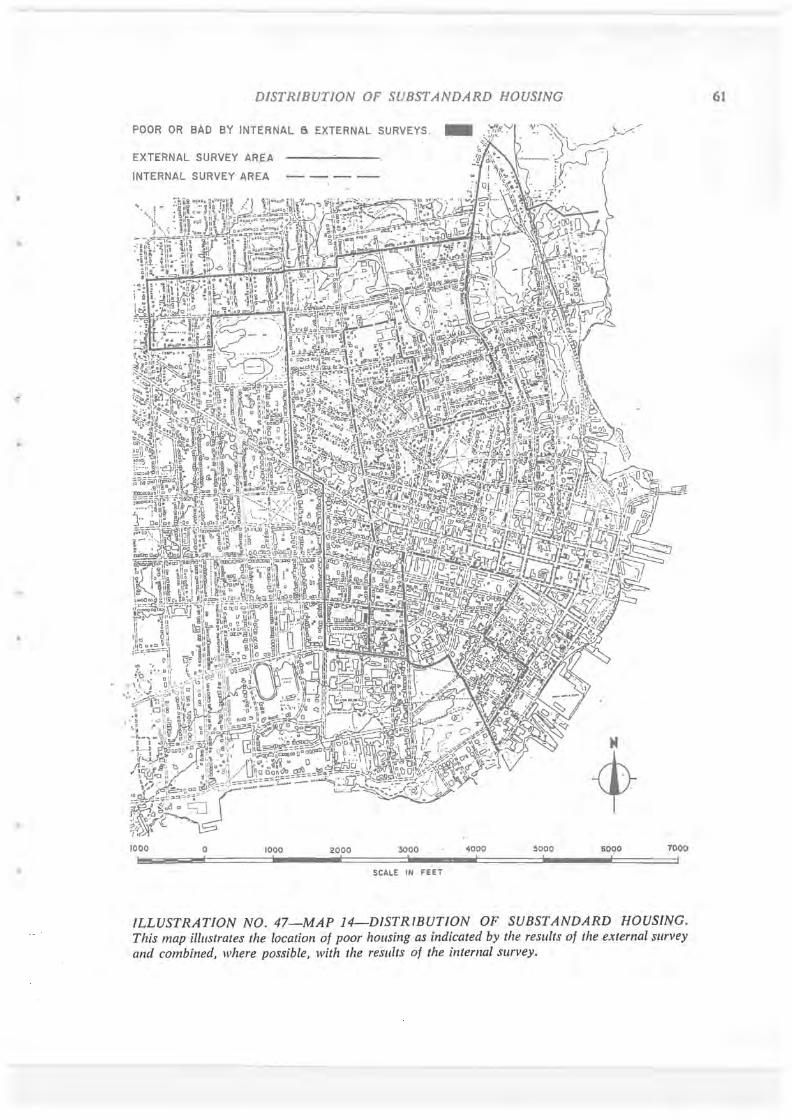
This map serves as a summary of the results of both the internal survey and the external survey of residential properties. Houses on the map are regarded as substandard in relation to one or other of the surveys (substandard being defined in relation to the proposed housing code-see Appendix).
In defining substandard both building conditions and sanitary conditions were considered. A building which is deficient in one way may not be deficient in the other so that a more accurate, overall picture may be obtained by combining both criteria.
For this map the number of inhabitants was not considered, although it was recognized that deficiencies are intensified in relation to the number of people subjected to them. The results of the sanitary and building condition maps were combined. For each dwelling unit, the number of deficiency points caused by sanitary inadequacy were added to th03e caused by the general condition. The bui;ding5 were then rated as follows:
Good 0 - 1 Fair 2 4 Poor 5 - 6 Bad 7 - 9
Out of 2849 dwelling units surveyed, 979 were good, 1532 were fair, 277 were poor and 45 were bad. For this map only those which fall into the poor and bad categories are regarded as the substandard houses of the area. (If a building's score added to a number plus %, the last whole number wa5 used (e.g. 1% was considered as 1).
The Survey results show that substandard housing was scattered throughout the Survey Area. To make a block analysis does not accurately pinpoint the poor buildings in the City. There are single houses or small rows of houses which are poor, but there are very few blocks which are generally bad, and none which are all bad. In some cases the few fair houses lose their value because of the surrounding construction. To present a picture of the complete study area, the results of the external survey were also used, so that houses judged as poor or bad, by the method already described, were also included on the map.
In the course of the two surveys it also became clear that while exterior conditions often indicated the interior and overall conditions of a building, this was not always the case. In some instances a building with a poor exterior was fair or good inside, or viceversa. It was thought advisable to indicate those buildings which were poor externally but which did not fall into the class of substandard housing. These are houses which probably should be given some fairly immediate attention if they are not to deteriorate and fall into a poorer class in the future.
TABLE XI
SUBSTANDARD HOUSING
Ilttel' IIaI Ex/cI'ual
I IMc,.ulll E x /ental
Anll Sm'vell And Stfl'vey Bxtenlol Only Ba: t c l"Jlol Only Survey SIII'vey
34 2 3 96 - -35 2 2 97 n.r. n.r. 36 n.s. - 98 I 5 37 6 6 99 2 4 38 - 6 100 5 -39 - - 101 I -40 1 - 102 1 -41 n.s. 7 103 4 -42 - 3 104 8 3 43 5 10 105 5 2 44 2 - 106 n.s. -45 - 2 107 n.s. 3 46 n.s. 4 108 - -47 n.s. 3 109 4 2 48 n.s. 9 110 6 I 49 n.s. 10 I11 2 n.s. 50 n.s. 7 112 - n.s. 51 - 2 113 5 1 52 3 5 114 3 I 53 11 12 115 - -54 - - 116 n.s. n.s. 55 5 9 117 n.s. 7 56 1 1 118 - 3 57 - 6 119 n.s. n.s. 58 4 12 120 n.s. -59 1 2 121 n.s. n.s. 60 n.s. 1 122 n.s. -61 n.s. 9 123 n.s. -62 n.s. 10 124 1 4 63 10 14 125 n.s. -64 - - 126 n.s. -65 2 4 127 n.s. I 66 2 2 128 n.s. -67 5 7 129 n.s. 2 68 5 7 130 5 9 69 5 3 131 n.s. -70 6 6 132 n.s. -71 7 15 133 n.s. -72 n.s. 1 134 n.s. 17 73 3 1 135 40 7 74 2 5 136 n.s. -75 4 4 137 14 15 76 9 5 138 n.s. -77 8 4 139 n.s. -78 3 1 140 - -79 I 10 141 I I 80 8 6 142 - -81 n.r. n.r. 143 n.s. n.s. 82 9 8 144 n.s. n.s. 83 9 8 145 11 2 84 4 3 146 1 -85 5 4 147 I 1 86 I 2 148 1 2 87 9 5 149 14 7 88 19 4 150 8 10 89 n.r. n.r. 151 2 2 90 4 2 152 1 1 91 8 3 92 4 7 Internal 93 n.r. n.r. Study 94 - - Area 322 492 95 2 1
-SOllrce : Field Surveys, 1958-59. This is only a section of a table covering blocks 1-161 inc!. The complete table may be seen in the City Planning Office. Note : n.s.-not ~urveyed; n.r.-non-residential.
DISTRIBUTION OF SUBSTANDARD HOUSING
POOR OR BAD BY INTERNAL a EXTERNAL SURVEYS. _
EXTERNAL SURVEY AR.EA
INTERNAL SURVEY AREA
1000 o ---'
1000 2000 :
3000 4000 :
SCALE IN FEET
5000
H
1t 6090 7000
I I
ILLUSTRATION NO. 47-MAP 14-DISTRfBUTION OF SUBSTANDARD HOUSING. This map illustrates the location of poor housing as indicated by the results of the external survey and combined, where possible, with the results of the internal survey.
61
62 PART Vlll: SECTION 1. THE CITY AS A WHOLE
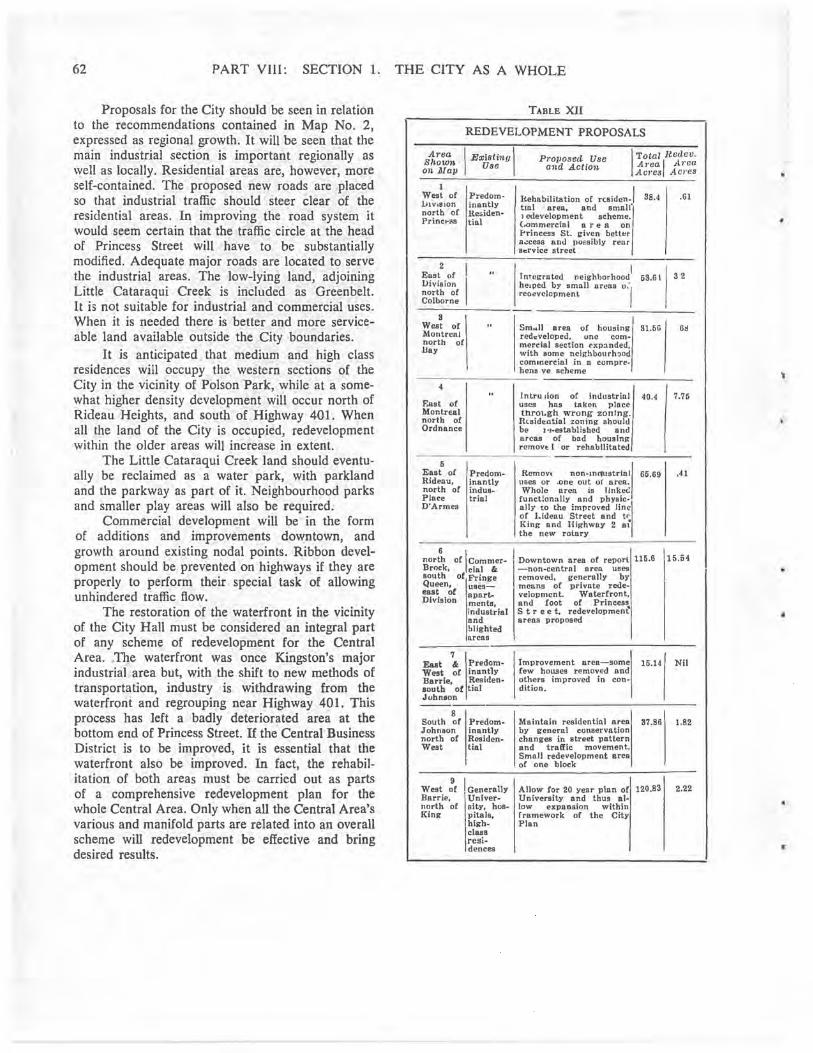
Proposals for the City should be seen in relation to the recommendations contained in Map No. 2, expressed as regional growth. It will be seen that the main industrial section is important region ally as well as locally. Residential areas are, however, more self-contained. The proposed new roads are placed so that industrial traffic should steer clear of the residential areas. In improving the road system it would seem certain that the traffic circle at the head of Princess Street will have to be substantially modified. Adequate major roads are located to serve the industrial areas. The low-lying land, adjoining Little Cataraqui Creek is included as Greenbelt. It is not suitable for industrial and commercial uses. When it is needed there is better and more serviceable land available outside the City boundaries.
It is anticipated that medium and high class residences will occupy the western sections of the City in the vicinity of PoIson Park, while at a somewhat higher density development will occur north of Rideau Heights, and south of Highway 401. When all the land of the City is occupied, redevelopment within the older areas will increase in extent.
The Little Cataraqui Creek land should eventually be reclaimed as a water park, with parkland and the parkway as part of it. Neighbourhood parks and smaller play areas will also be required.
Commercial development will be in the form of additions and improvements downtown, and growth around existing nodal points. Ribbon development should be prevented on highways if they are properly to perform their special task of allowing unhindered traffic flow.
The restoration of the waterfront in the vicinity of the City Hall must be considered an integral part of any scheme of redevelopment for the Central Area . • The waterfront was once Kingston's major industrial area but, with the shift to new methods of transportation, industry is withdrawing from the waterfront and regrouping near Highway 401. This process has left a badly deteriorated area at the bottom end of Princess Street. If the Central Business District is to be improved, it is essential that the waterfront also be improved. In fact, the rehabilitation of both areas must be carried out as parts of a comprehensive redevelopment plan for the whole Central Area. Only when all the Central Area's various and manifold parts are related into an overall scheme will redevelopment be effective and bring desired results.
TABLE XII
REDEVELOPMENT PROPOSALS
Area I Existing 1 PrOl)osecZ Use I Total /tccZcv. Shown Area A,·ea on Map Use altd Action Ac,.csl Acres
1
Rehabilitation oC residen-I West oC Predom- 38.4 .61 Ulvl810n inllntiy tIll I area, and smnll" north oC Residen- I edevelopment scheme. Princ"'Rs tial (,ommercia I area on
I'rineess St. given bett"r B..:cess and possibly rear service street
2 I . I East of " InTegrated 32
I nelghborhood 63.61
Division helped by small arellS 0:, north of reaevclopmen t Col borne
8 West of " Sm,,1l area of housing Bl.6G 6d Montreal redeveloped. onc eom-north of mereial section f"xp:lnded, llay with some neighbourhood
commercial in n compre· hens ve scheme
4 " Intru ,ion of industrial 40.4 7.75
East of uses has taken place Montr.al tnrol.gh wrong zonIng. north of Rlsidential zoning should Ordnance b. ,·.-established and
arcas of blld housing rcmovt.l or rehabilitated
----6
East oC Predom- Remov. non-Jn<1U8trllll! 65.69 .41 Rideau, inantly uses or .one out ot area. north oC indus- Whole area is IInkecl Place trial functionally and physie-D'Armes ally to the improved linel
oC I_ideau Street and te King nnd Highway 2 n~ the new rotary
nort~ oC Jcommer- I Downtown area of report 116.6 \15.54 Brock. cial 8< -non-central area Uses south of Fringe removed. generally by Queen. uses- means of private rede-eaat of npart- velopment. WaterCront. Division menta. and foot of Princes'!,
industrial S t r e e t. redevelopment and areas proposed hlighted arens
7 Eaat 8< Predom- Improvement area-some 15.14 Nil West of inantly few houses removed and Barrle. Residen- others improved in con-south of tial dltion. Juhnaon
8 South of Predom- Maintain residential area 37.86 1.82 Johnson inantly by general conservation north of Reslden- changes in street pattern West tial and traffic movement.
Small redevelopment area of one block
9 I Generally I West of Allow for 20 year plnn of 120.83 2.22 Barrie, Univer- University and thus al-north of sity, hoa- low expansion within King pitals, framework of the City
high- Plan class resi-dences
•
«
THE CITY AS A WHOLE 63
RESIDENTIAL ~ OPEN SPACE D PROPOSED PARKS 0 PUBLIC 8 SEPARATE SCHOOLS ®
HIGH SCHOOLS @ COMMERCIAL • INDUSTRIAL •
2 3 4 ! ! !
SCALE IN MILES
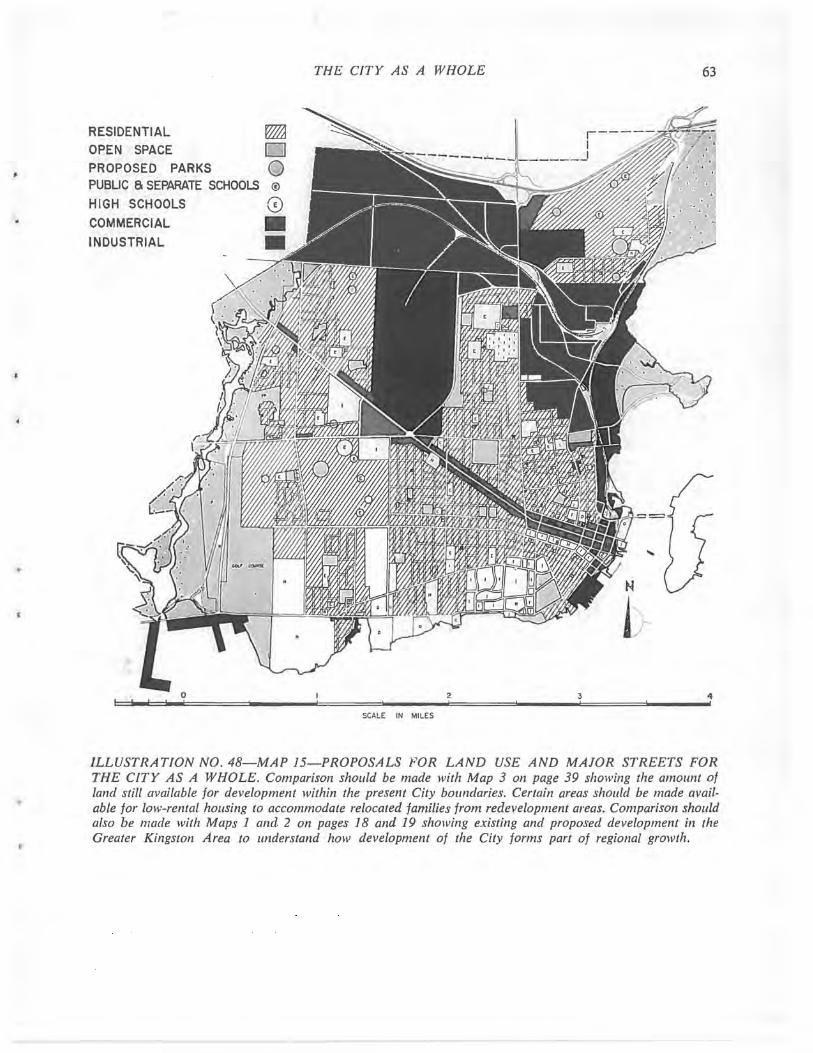
ILLUSTRATION NO. 48-MAP IS-PROPOSALS FOR LAND USE AND MAJOR STREETS FOR THE CITY AS A WHOLE. Comparison should be made with Map 3 on page 39 showing the amount of land still available for development within the present City boundaries. Certain areas should be made available for low-rental hOllsing to accommodate relocated families from redevelopment areas. Comparison should also be made with Maps 1 and 2 on pages 18 and 19 showing existing and proposed development ill the Greater Kingston Area to understand how development of the City forms part of regional growth.
64 PART VIII: SECTION 2. THE REDEVELOPMENT AREAS
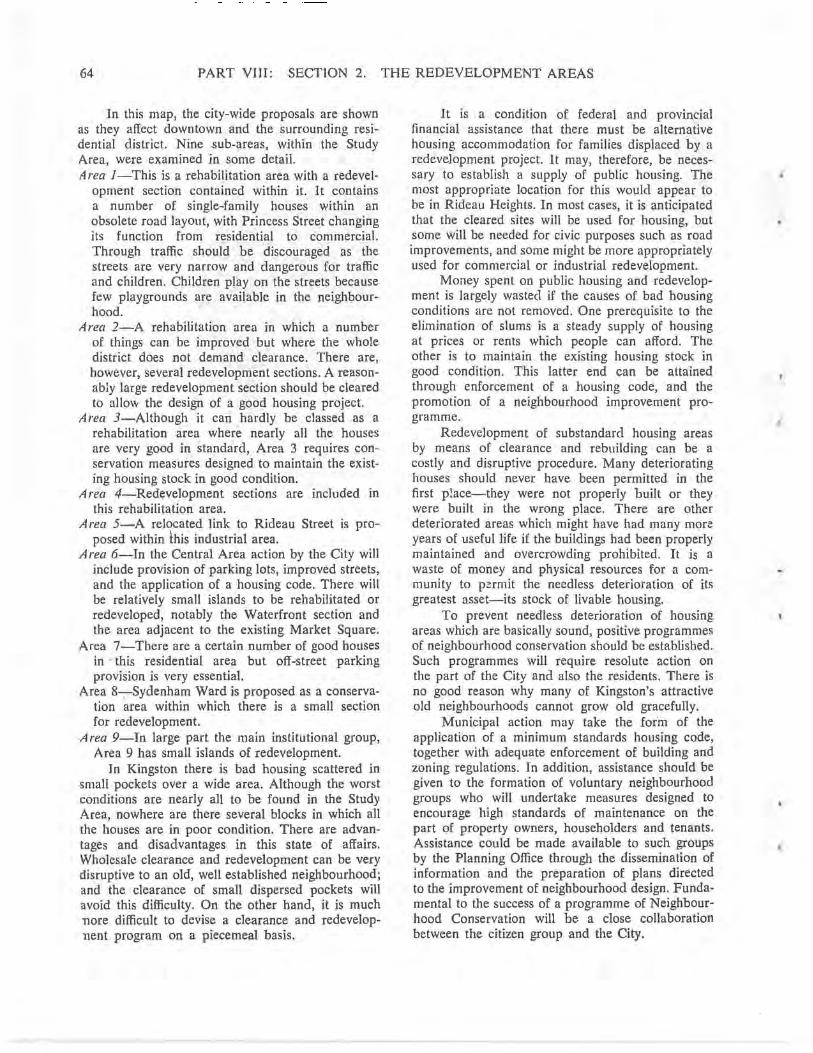
In this map, the city-wide proposals are shown as they affect downtown and the surrounding residential district. Nine sub-areas, within the Study Area, were examined in some detail. Area I-This is a rehabilitation area with a redevel
opment section contained within it. It contains a number of single-family houses within an obsolete road layout, with Princess Street changing its function from residential to commercial. Through traffic should be discouraged as the streets are very narrow and dangerous for traffic and children. Children play on the streets because few playgrounds are available in the neighbourhood.
Area 2-A rehabilitation area in which a number of things can be improved but where the whole district does not demand clearance. There are, however, several redevelopment sections. A reasonably large redevelopment section should be cleared to allow the design of a good housing project.
Area 3-Although it can hardly be classed as a rehabilitation area where nearly all the houses are very good in standard, Area 3 requires conservation measures designed to maintain the existing housing stock in good condition.
Area 4-Redevelopment sections are included in this rehabilitation area.
A rea 5-A relocated link to Rideau Street is proposed within this industrial area.
A rea 6-In the Central Area action by the City will include provision of parking lots, improved streets, and the application of a housing code. There will be relatively small islands to be rehabilitated or redeveloped, notably the Waterfront section and the area adjacent to the existing Market Square.
Area 7-There are a certain number of good houses in this residential area but off-street parking provision is very essential.
Area 8-;-Sydenham Ward is proposed as a conservation area within which there is a small section for redevelopment.
A rea 9-In large part the main institutional group, Area 9 has small islands of redevelopment.
In Kingston there is bad housing scattered in small pockets over a wide area. Although the worst conditions are nearly all to be found in the Study Area, nowhere are there several blocks in which all the houses are in poor condition. There are advantages and disadvantages in this state of affairs. Wholesale clearance and redevelopment can be very disruptive to an old, well established neighbourhood; and the clearance of small dispersed pockets wi11 avoid this difficulty. On the other hand, it is much nore difficult to devise a clearance and redevelopnent program on a piecemeal basis.
It is a condition of federal and provincial financial assistance that there must be alternative housing accommodation for families displaced by a redevelopment project. It may, therefore, be necessary to establish a supply of public housing. The most appropriate location for this would appear to be in Rideau Heights. In most cases, it is anticipated that the cleared sites will be used for housing, but some will be needed for civic purposes such as road improvements, and some might be more appropriately used for commercial or industrial redevelopment.
Money spent on public housing and redevelopment is largely wasted if the causes of bad housing conditions are not removed. One prerequisite to the elimination of slums is a steady supply of housing at prices or rents which people can afford. The other is to maintain the existing housing stock in good condition. This latter end can be attained through enforcement of a housing code, and the promotion of a neighbourhood improvement programme.
Redevelopment of substandard housing areas by means of clearance and rebuilding can be a costly and disruptive procedure. Many deteriorating houses should never have been permitted in the first p!ace-they were not properly built or they were built in the wrong place. There are other deteriorated areas which might have had many more years of useful life if the buildings had been properly maintained and overcrowding prohibited. It is a waste of money and physical resources for a community to permit the needless deterioration of its greatest asset-its stock of livable housing.
To prevent needless deterioration of housing areas which are basically sound, positive programmes of neighbourhood conservation should be established. Such programmes will require resolute action on the part of the City and also the residents. There is no good reason why many of Kingston's attractive old neighbourhoods cannot grow old graceful1y.
Municipal action may take the form of the application of a minimum standards housing code, together with adequate enforcement of building and zoning regulations. In addition, assistance should be given to the formation of voluntary neighbourhood groups who will undertake measures designed to encourage high standards of maintenance on the part of property owners, householders and tenants. Assistance could be made available to such groups by the Planning Office through the dissemination of information and the preparation of plans directed to the improvement of neighbourhood design. Fundamental to the success of a programme of Neighbourhood Conservation will be a close collaboration between the citizen group and the City.
•
"
1
RESIDENTIAL
OPEN SPACE
APARTMENTS
_ INSTITUTIONAL
..: . COMMERCIAL
-."~-:; INDUSTRIAL
:1'k'Y REDEVELOPMENT 'hi, to AREA : ~~~~ -=;~~"
1000 o 1000
THE REDEVELOPMENT AREAS
2000 3000 4000 sooo 6000 7000
SCALE IN FEE T
ILLUSTRATION NO . 49-MAP 16 - PROPOSALS FOR LAND USE AND MAIOR STREETS FOR THE STUDY AREA. As a result it is suggested that certain redevelopment schemes be initiated by the City COllncil, together with the adoption of a HOllsing Code.
6'
66 PART VIII: SECTION 2. THE REDEVELOPMENT AREAS
\ ~IN5DoSofRiA~ ... ~~ \"-~:~~ Yl!X
BEFORE AFTER
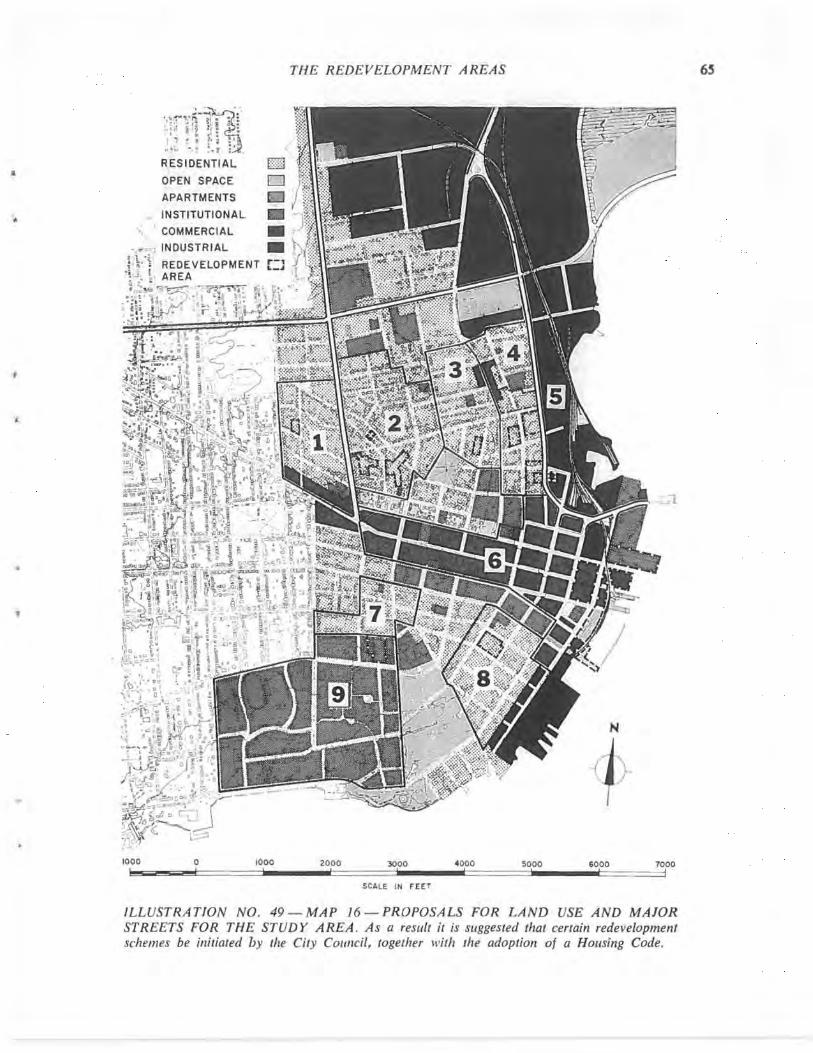
ILLUSTRATION NO. 50-DIAGRAM 6. An example of a redevelopment scheme within an area which should be rehabilitated. It suggests the possible inclusion of new housing, an improvement in street layout and recreational facilities, and the provision of ofj~street parking. Density control in these areas will be very important.
Introduction to
PART IX SPECIAL STUDIES
In the following pages attention is directed to certain specific areas which because of their unusual qualities or importance deserve special consideration. Section 1 examines the Rideau Heights area where there exists a housing problem peculiar to new areas on the fringes of Canadian cities. Section 2 is concerned with the conservation of the Old Sydenham Ward area which contains numerous buildings of great architectural and historic merit. Section 3 contains a variety of proposals for the improvement of the Central Business District. Section 4 includes recommendations for the restoration of the waterfront which has become badly deteriorated in the Central Area.
PART IX: SECTION 1. RIDEAU HEIGHTS 67
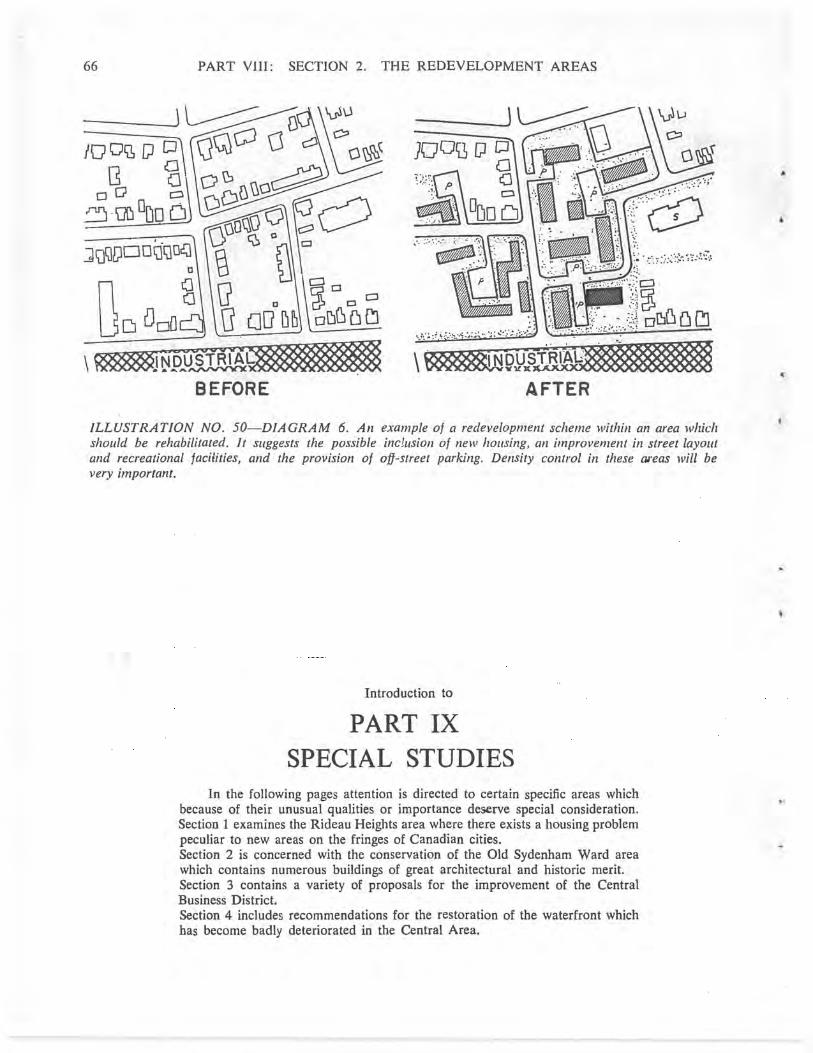
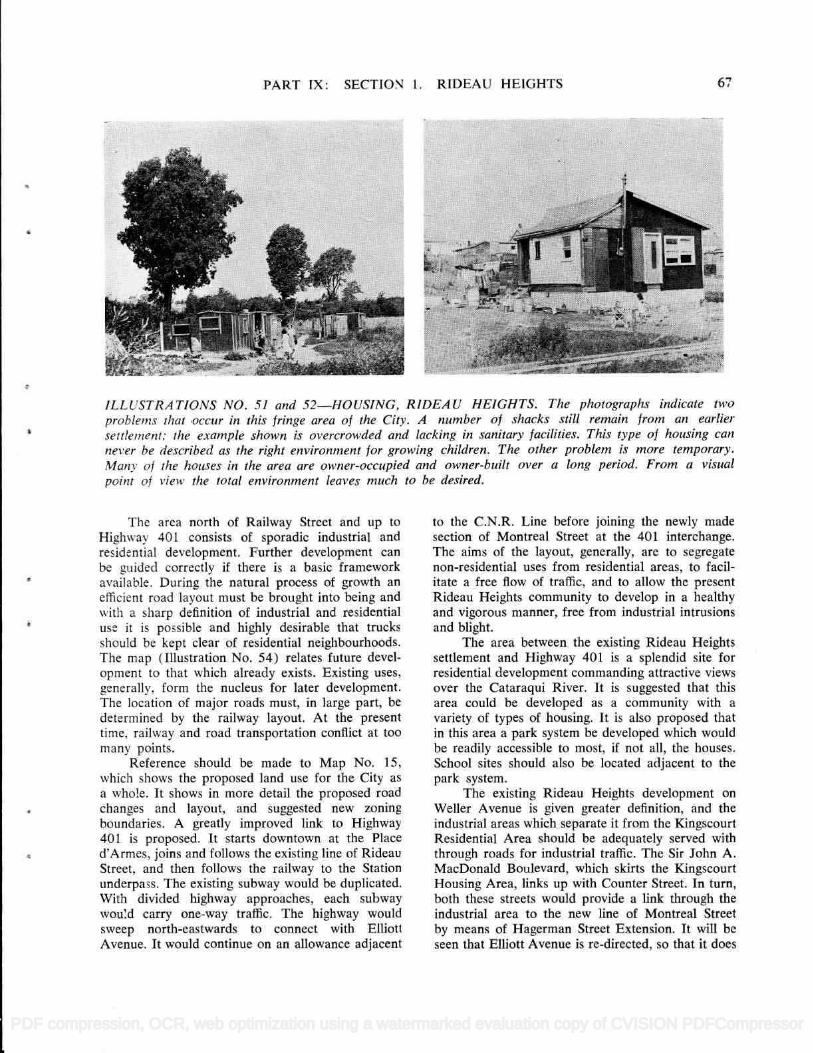
iLLUSTRA TIONS NO. 51 and 52.-HOUSING, RIDEAU HE1GHTS The photographs indicate two problems that occur in this Iringe area of the City. A number of shacks still remain from an earlier settlement: the example shown is overcrowded and lacking in sanitary facilities. This type of housing can never be described as the right environment for growing children. The other problem ¡s more temporary. ?i4anv of the houses in the area are owner-occupied and owner-built over a long period. From a visual point of view the total environment leaves much to be desired.
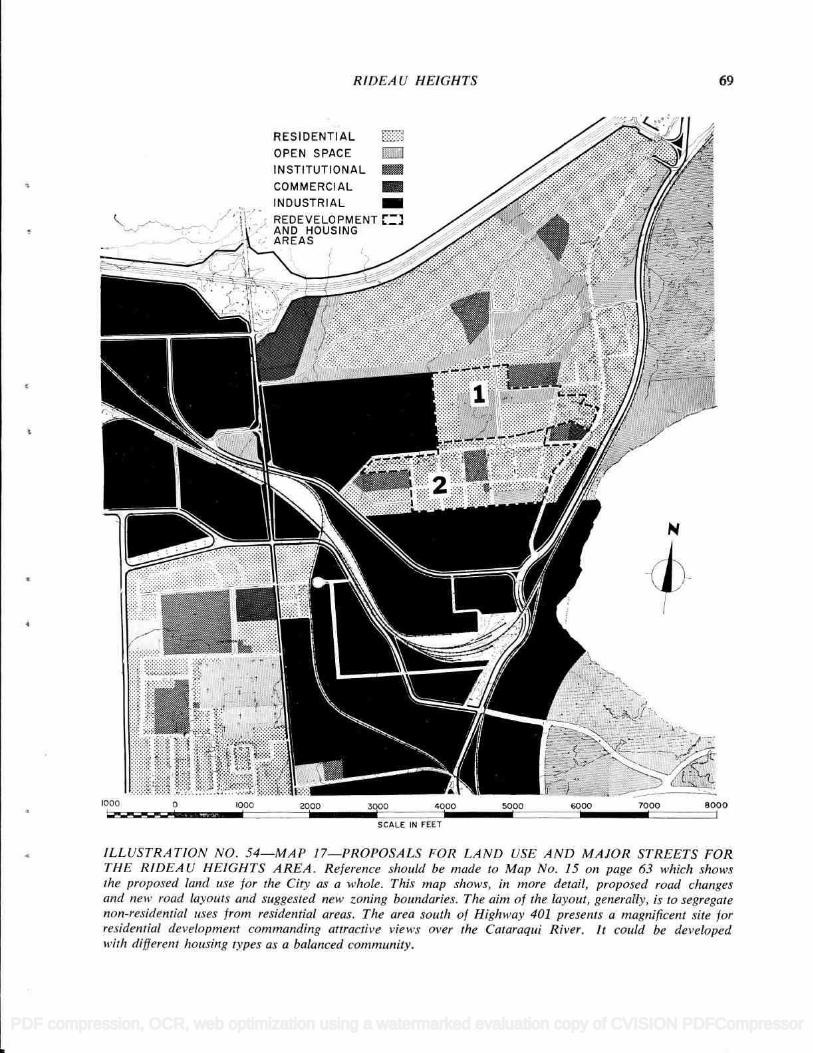
The of Street to Highway 401 consists of sporadic industrial and residential development. Further development can be guided correctly if there is a basic framework available. During the natural process of growth an efficient road layout must be brought into being and with a sharp definition of industrial and residential use it is possible and highly desirable that trucks should be kept clear of residential neighbourhoods. The map (Illustration No. 54) relates future devel- Opmeflt to that which already exists. Existing uses, generally, form the nucleus for later development. The location of major roads must, in large part, be determined by the railway layout. At the present time, railway and road transportation conflict at too many points.
Reference should be made to Map No. 15, which shows the proposed land use for the City as a whole. It shows in more detail the proposed road changes and layout, and suggested new zoning boundaries. A greatly improved link to Highway 401 is proposed. It starts downtown at the Place d'Armes, joins and follows the existing line of Rideau Street, and then follows the railway to the Station underpass. The existing subway would be duplicated. With divided highway approaches, each subway woud carry one-way traffic. The highway would sweep north-eastwards to connect with Elliott Avenue. It would continue on an allowance adjacent
to the C.N.R. Line before joining the newly made section of Montreal Street at the 401 interchange. The aims of the layout, generally, are to segregate non-residential uses from residential areas, to facil- itate a free flow of traffic, and to allow the present Rideau Heights community to develop in a healthy and vigorous manner, free from industrial intrusions and blight.
The area between the existing Rideau Heights settlement and Highway 401 is a splendid site for residential development commanding attractive views over the Cataraqui River. It is suggested that this area could be developed as a community with a variety of types of housing. It is also proposed that in this area a park system be developed which would be readily accessible to most, if not all, the houses. School sites should also be located adjacent to the park system.
The existing Rideau Heights development on Weller Avenue is given greater definition, and the industrial areas which separate it from the Kingscourt Residential Area should be adequately served with through roads for industrial traffic. The Sir John A. MacDonald Boulevard, which skirts the Kingscourt Housing Area, links up with Counter Street. In turn, both these streets would provide a link through the industrial area to the new line of Montreal Street by means of Hagerman Street Extension. It will be seen that Elliott Avenue is re-directed, so that it does
PDF compression, OCR, web optimization using a watermarked evaluation copy of CVISION PDFCompressor
68 PART IX: SECTION 1. RIDEAU HEIGHTS
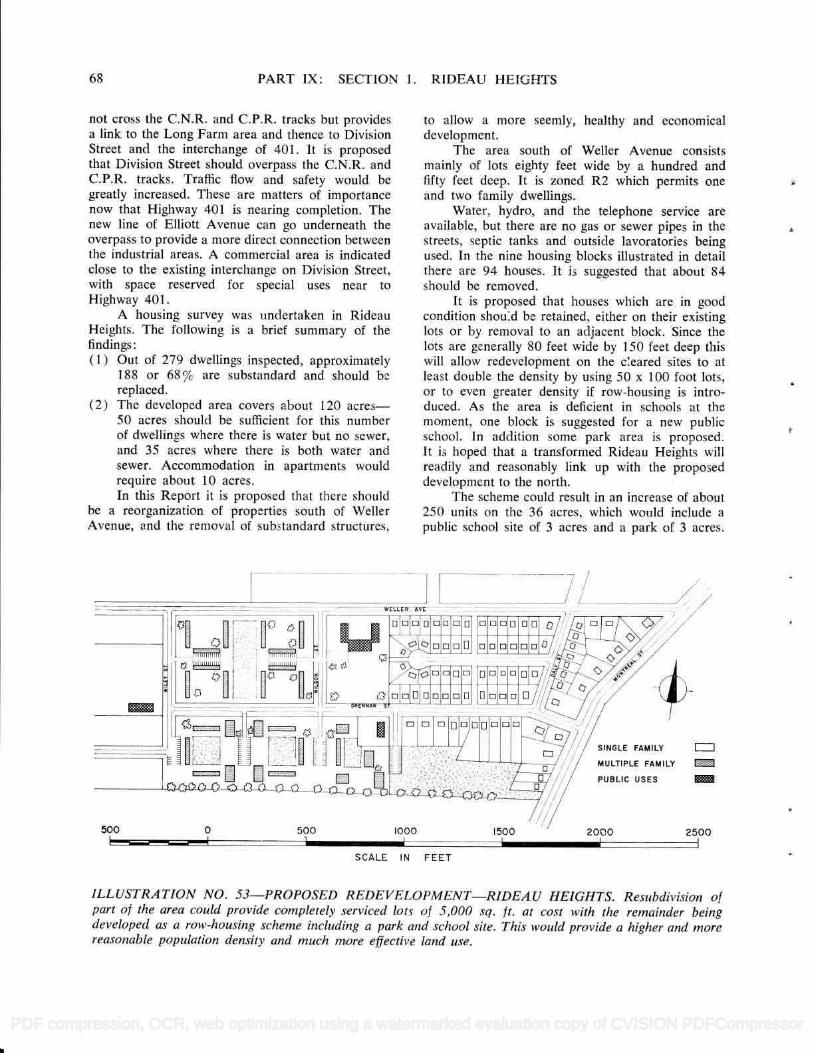
not cross the C.N.R. and CP.R. tracks but provides a link to the Long Farm area and thence to Division Street and the interchange of 401. It is proposed that Division Street should overpass the C.N.R. and C.P.R. tracks. Traffic flow and safety would be greatly increased. These are matters of importance now that Highway 401 is nearing completion. The new line of Elliott Avenue can go underneath the overpass to provide a more direct connection between the industrial areas. A commercial area is indicated close to the existing interchange on Division Street, with space reserved for special uses near to Highway 401.
A housing survey was undertaken in Rideau Heights. The following is a brief summary of the findings: ( I ) Out of 279 dwellings inspected, approximately
188 or 68% are substandard and should bc replaced.
(2) The developed area covers about 120 acres- 50 acres should be sufficient for this number of dwellings where there is water but no sewer, and 35 acres where there is both water and sewer. Accommodation in apartments would require about 10 acres. In this Report it is proposed that there should
be a reorganization of properties south of Weller Avenue, and the removal of substandard structures,
to allow a more seemly, healthy and economical development.
The area south of Weller Avenue consists mainly of lots eighty feet wide by a hundred and fifty feet deep. It is zoned R2 which permits one and two family dwellings.
Water, hydro, and the telephone service are available, but there are no gas or sewer pipes in the streets, septic tanks and outside lavoratories being used. In the nine housing blocks illustrated in detail there are 94 houses. It is suggested that about 84 should be removed.
It is proposed that houses which are in good condition shoud be retained, either on their existing lots or by removal to an adjacent block, Since the lots are generally 80 feet wide by I 50 feet deep this will allow redevelopment on the ceared sites to at least double the density by using 50 x 100 foot lots, or to even greater density if row-housing is intro- duced. As the area is deficient in schools at the moment, one block is suggested for a new public school. In addition some park area is proposed. lt is hoped that a transformed Rideau Heights will readily and reasonably link up with the proposed development to the north.
The scheme could result in an increase of about 250 units on the 36 acres, which would include a public school site of 3 acres and a park of 3 acres.
____ _ r -_ L_17 r- -- -- - - -
'rn..
,,, /
500 0 500 1000 1500 2000 2500 .-I_..._r------.._____...-...-1
i t Ì
SCALE IN FEET
ILLUSTRATION NO. 53-PROPOSED REDEVELOPMENT-RIDEAU HEiGHTS. Resubdivision of part of the area could provide completely serviced lots of 5,000 sq. ft. at cost with the remainder being developed as a row-housing scheme including a park and school site. This would provide a higher and more reasonable population density and much more effective land use.
PDF compression, OCR, web optimization using a watermarked evaluation copy of CVISION PDFCompressor
R IDEA U HEIGHTS
RESIDENTIAL OPEN SPACE III INSTITUTIONAL COMMERCIAL INDUSTRIAL REDE VELOPMENT AND HOUSING AREAS
69
r '
-__- --
oo 7000 8000 1000 0 1000 Ooo sqoo o 500C I---- . - -
SCALE IN FEET
ILLUSTRATION NO. 54-MAP 17-PROPOSALS FOR LAND USE AND MAJOR STREETS FOR THE RIDEA U HEIGHTS AREA. Reference should be made to Map No. 15 on page 63 which shows ¡he proposed land use for the City as a whole. This map shows, in more detail, proposed road changes and new road layouts and suggested new zoning boundaries. The aim of the layout, generatly, is to segregate non-residential uses from residential areas. The area south of Highway 401 presents a magnificent site for residential development commanding attractive views over the Cataraqui River. It could be developed with difieren: housing types as a balanced community.
PDF compression, OCR, web optimization using a watermarked evaluation copy of CVISION PDFCompressor
70 PART IX: SECTION 2. OLD SYDENHAM WARD
.
:
\
: ;
rt r A 1
:\
4 /'
T
i- t:E i L . . . - ,, /
e !L :
J '
L 4F- r - ,k- - _- ,
I
i:_:' EtL_
c
\ :-\) . . i
2' p-rT- I . p- - flø [ _ r- #' -
' . . : ?
r L .
1 ./ r [
.r F'E - - -- r \. \'
F '
-: Ir _3
;. -'J 'c -çr --
L:
'.
7 I[T:' FL1: :- TT 4 /r \
..' ---,-.. C I A I R u -
rr;TT T r-TT d r*:;í [ -- r---------- - _-;F; r fltZ j \:i
L
r
L% - I'Lr; rTi_ [ i --:: r,
: 1i;:J;tF1
L..__J\ '
1L11 ;
f -
L -
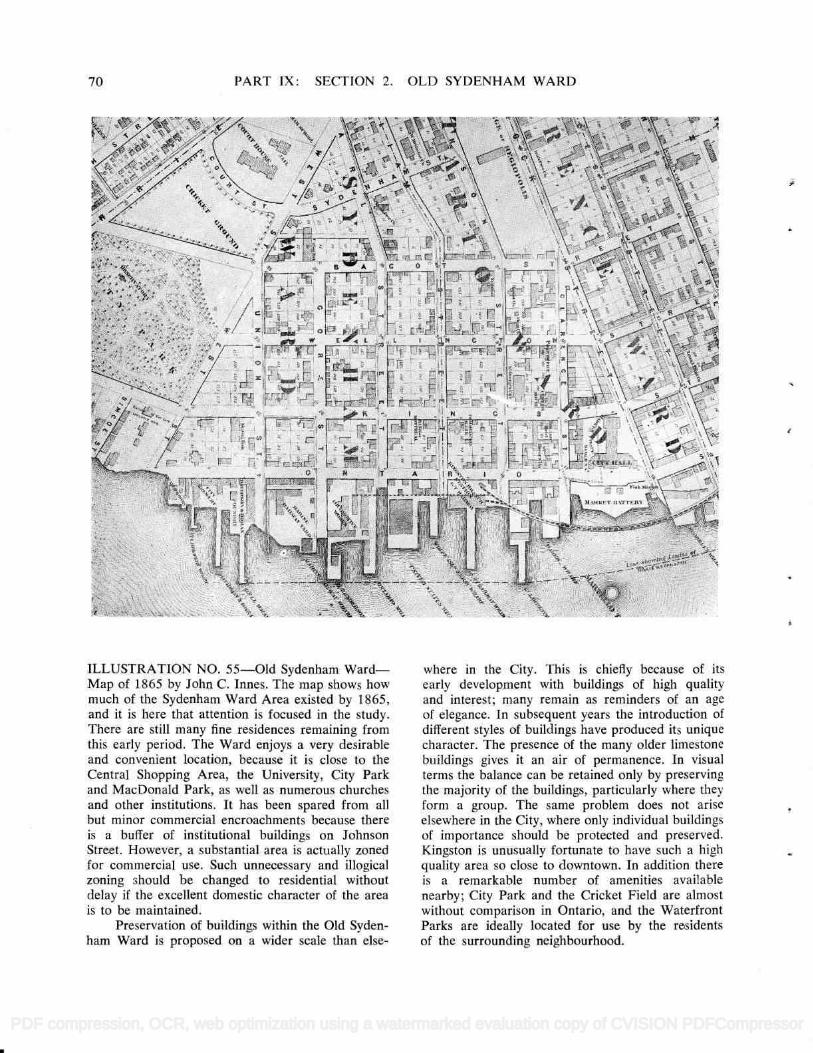
ILLUSTRATION NO. 55-Old Sydenham Ward- Map of i 865 by John C. Innes. The map shows how much of the Sydenham Ward Area existed by 1865, and it is here that attention is focused in the study.
There are still many fine residences remaining from this early period. The Ward enjoys a very desirable and convenient location, because it is close to the
Central Shopping Area, the University, City Park
and MacDonald Park, as well as numerous churches and other institutions. It has been spared from all
but minor commercial encroachments because there
is a buffer of institutional buildings on Johnson
Street . However, a substantial area is actually zoned for commercial use. Such unnecessary and illogical
zoning should be changed to residential without
delay if the excellent domestic character of the area
is to be maintained.
Preservation of buildings within the Old Syden- ham Ward is proposed on a wider scale than else-
where in the City. This is chiefly because of its
early development with buildings of high quality
and interest; many remain as reminders of an age
of elegance. In subsequent years the introduction of
different styles of buildings have produced its unique
character. The presence of the many older limestone buildings gives it an air of permanence. In visual
terms the balance can be retained only by preserving
the majority of the buildings, particularly where they
form a group. The same problem does not arise
elsewhere in the City, where only individual buildings
of importance should be protected and preserved.
Kingston is unusually fortunate to have such a high
quality area so close to downtown. In addition there
is a remarkable number of amenities available
nearby; City Park and the Cricket Field are almost
without comparison in Ontario, and the Waterfront
Parks are ideally located for use by the residents
of the surrounding neighbourhood.
PDF compression, OCR, web optimization using a watermarked evaluation copy of CVISION PDFCompressor
OLD SYDENHAM WARD
Why This Area: Preservation of excellent and usable building
groups from a past age can not only influence future thoughts, but also preserve property values in a residential area of high character. Beacon Hill in
Boston and Georgetown, Washington, D.C., are examples worth mentioning.
Why Idea Is Unique: Old Sydenham Ward has been singled out for
stud because it forms a homogenous area close to the origin of the City, and it has remained unspoiled over a long period of time. While only certain buildings justity individual preservation, it is as a
group that the old Ward provides an interesting example of civic design. Certain improvements will he necessary to maintain the character of the area, and certain sections are being badly maintained. There is always the danger that such deterioration will spread, particularly now that conversions into apartments are increasing under the present low standards demanded by the City.
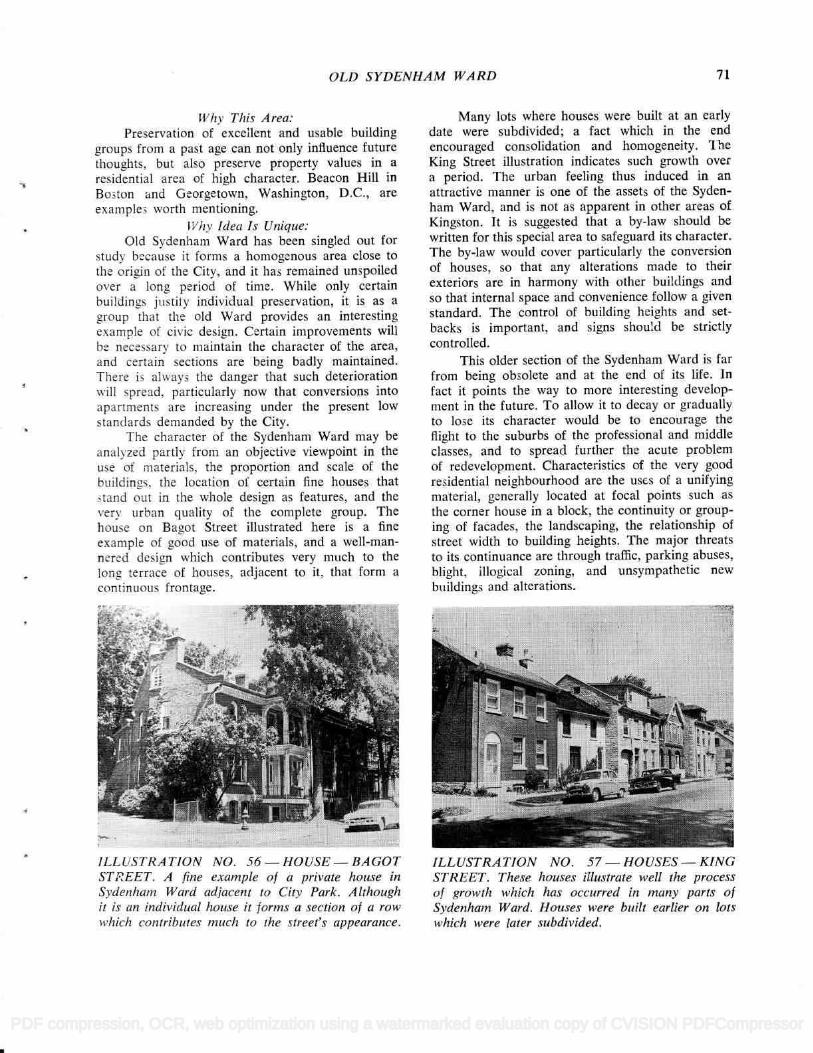
The character of the Sydenham Ward may be analyzed partly from an objective viewpoint in the use of materials, the proportion and scale of the buildings. the location of certain fine houses that tand out in the whole design as features, and the
vers' urban quality of the complete group. The house on Bagot Street illustrated here is a fine example of good use of materials, and a well-man- nered design which contributes very much to the long terrace of houses, adjacent to it, that forni a
continuous frontage.
ILLUSTRATION NO. 56-HOUSE-BAGOT STREET. A fine example of a private house in Sydenham Ward adjacent to City Park. Although il is an individual house it forms a section of a row which contributes much to the Street's appearance.
71
Many lots where houses were built at an early date were subdivided; a fact which in the end encouraged consolidation and homogeneity. i he King Street illustration indicates such growth over a period. The urban feeling thus induced in an attractive manner is one of the assets of the Syden- ham Ward, and is not as apparent in other areas of Kingston. It is suggested that a by-law should be written for this special area to safeguard its character. The by-law would cover particularly the conversion of houses, so that any alterations made to their exteriors are in harmony with other buildings and so that internal space and convenience follow a given standard. The control of building heights and set- backs is important, and signs should be strictly controlled.
This older section of the Sydenham Ward is far from being obsolete and at the end of its life. In fact it points the way to more interesting develop- ment in the future. To allow it to decay or gradually to lose its character would be to encourage the flight to the suburbs of the professional and middle classes, and to spread further the acute problem of redevelopment. Characteristics of the very good residential neighbourhood are the uses of a unifying material, generally located at focal points such as the corner house in a block, the continuity or group- ing of facades, the landscaping, the relationship of street width to building heights. The major threats to its continuance are through traffic, parking abuses, blight, illogical zoning, and unsympathetic new buildings and alterations.
. . . , ' .. ,. . ': : ...
. . . .
:. .. ................................ : E
ILLUSTRA TION NO. 57 - HOUSES - KING STREET. These houses illustrate well the process of growth which has occurred in many parts of
Sydenham Ward. Houses were built earlier on lots which were later subdivided.
PDF compression, OCR, web optimization using a watermarked evaluation copy of CVISION PDFCompressor
72 PART IX: SECTION 2. OLD SYDENHAM WARD
In fact, although this area may be looked upon as crowded in comparison to the openness of new suburban developments, which have large side and front yards and rights-of-way, it is unusually spacious. One has only to compare it with the very attractive minor streets of eighteenth century Philadelphia or London to realize the inherent quality of spacious- ness, the attractive scale of design which should be retained, and above all its delightful urbanity.
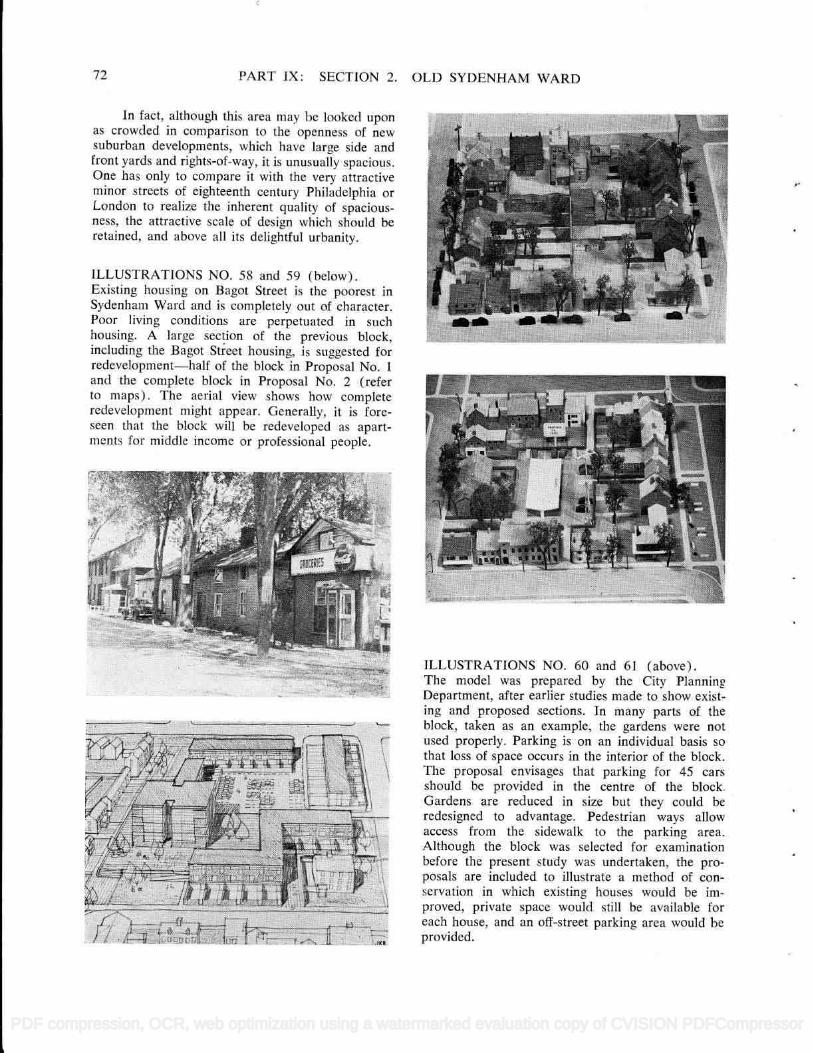
ILLUSTRATIONS NO. 58 and 59 (below). Existing housing on Ragot Street is the poorest in Sydenham Ward and is completely out of character. Poor living conditions are perpetuated in such housing. A large section of the previous block, including the Bagot Street housing, is suggested for redevelopment-half of the block in Proposal No. 1
and the complete block in Proposal No. 2 (refer to maps). The aerial view shows how complete redevelopment might appear. Generally, it is forc- seen that the block will be redeveloped as apart- ments for middle income or professional people.
--- - .. .. - ,. .- I
T93r:4i l
.. -L
V- --=' ___
*71 ±-:; t
/ .i.__:.I:-u:.rn.t2 U9 r----y--
ILLUSTRATIONS NO. 60 and 61 (above). The model was prepared by the City Planning Department, after earlier studies made to show exist- ing and proposed sections. In many parts of the block, taken as an example, the gardens were not used properly. Parking is on an individual basis so that loss of space occurs in the interior of the block. The proposal envisages that parking for 45 cars should be provided in the centre of the block. Gardens are reduced in size but they could be redesigned to advantage. Pedestrian ways allow access from the sidewalk to the parking area. Although the block was selected for examination before the present study was undertaken, the pro- posals are included to illustrate a method of con- servation in which existing houses would be im- proved, private space would still be available for each house, and an off-street parking area would be provided.
PDF compression, OCR, web optimization using a watermarked evaluation copy of CVISION PDFCompressor
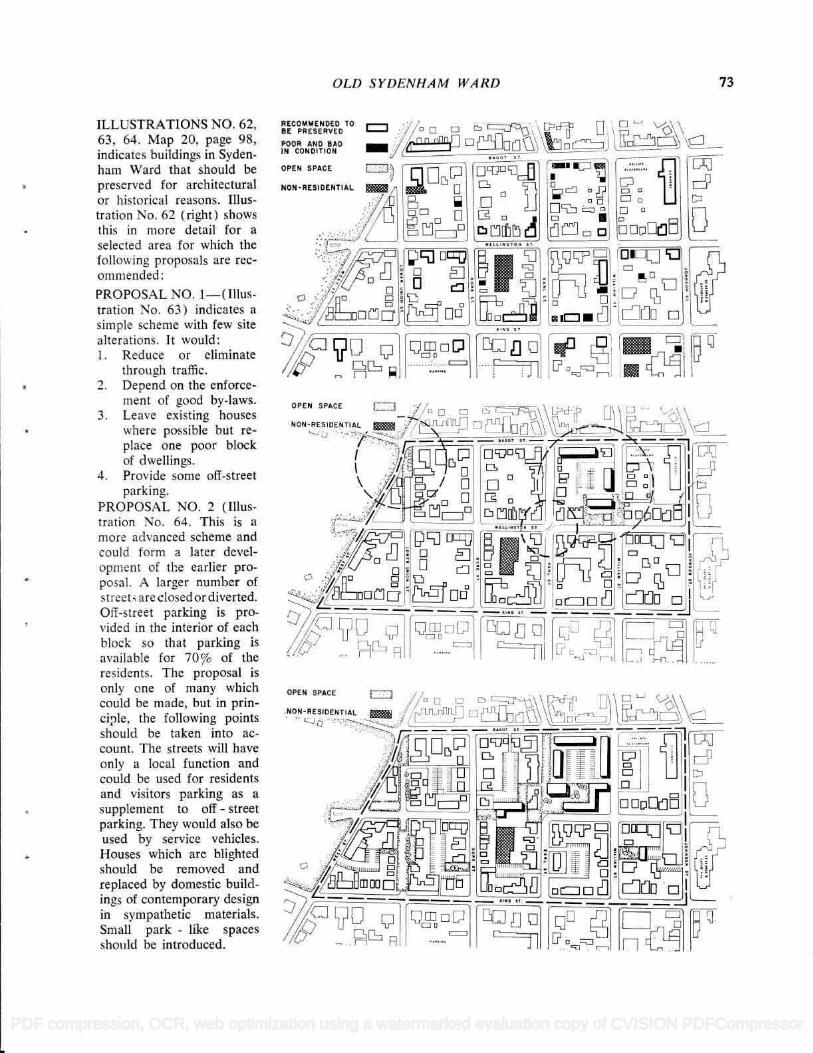
ILLUSTRATIONS NO. 62, 63, 64. Map 20, page 98, indicates buildings in Syden- ham Ward that should be preserved for architectural or historical reasons. Illus- tration No. 62 (right) shows this in more detail for a selected area for which the following proposals are rec- ommended; PROPOSAL NO. l-(IlIus- tration No. 63) indicates a simple scheme with few site alterations. It would: i . Reduce or eliminate
through traffic. 2. Depend on the enforce-
ment of good by-laws. 3. Leave existing houses
where possible but re- place one poor block of dwellings.
4. Provide some off-street parking.
PROPOSAL NO. 2 (Illus-
This is a
more advanced scheme and could form a later devel- opment of the earlier pro- posai. A larger number of streets are closed or diverted. Off-street parking is pro- vided in the interior of each block so that parking is
available for 70% of the residents. The proposal is only one of many which could be made, but in prin- ciple, the following points should be taken into ac- count. The streets will have only a local function and could be used for residents and visitors parking as a supplement to off - street parking. They would also be used by service vehicles. Houses which are blighted should be removed and replaced by domestic build- ings of contemporary design in sympathetic materials. Small park - like spaces should be introduced.
OLD SYDENFIAM WARD
TO ::// o d:I u
° '- \
POORANOBAD _LfL1 D :P
OPEN SPACE
r-o1231 11
NON-ESIOENTIAL Di
'J U j
..:.. )
ti F °
1F1 r!1 oj11DÖD .
J u n [J - r ./ .-, .. r1cri III
NONRSIOENTlAL -
\..
73
OPLN SPACE ::: // o o \L;:f-n \ tj -
NONRESIDNÎIAL
41b[
II
D 6?
R
PDF compression, OCR, web optimization using a watermarked evaluation copy of CVISION PDFCompressor
74 PART IX: SECTION 2. OLD SYDENHAM WARD
A
:7 ';
Ì IIr ; !
.. - .- :'
.q -I
. L
-,
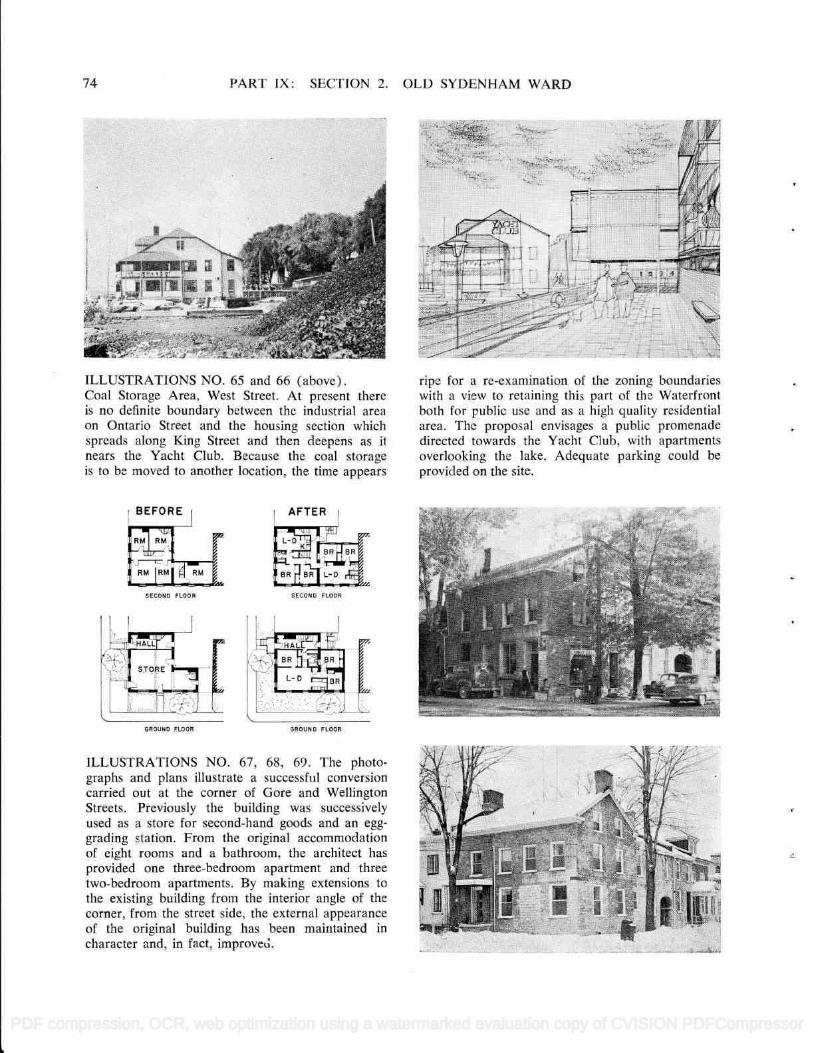
ILLUSTRATIONS NO. 65 and 66 (above). Coal Storage Area, West Street. At present there is no definite boundary between the industrial area on Ontario Street and the housing section which spreads along King Street and then deepens as il
nears the Yacht Club. Because the coal storage is to be moved to another location, the time appears
BEFORE !
AFTER
i_r L:_[:.L:_,L
BR a L-D
$ECO FLOOR SECOIO FLOOR
OROUNO FLOOR RROUKD FLOOR
ILLUSTRATIONS NO. 67, 68, 69. The photo- graphs and plans illustrate a successful conversion carried out at the corner of Gore and Wellington Streets. Previously the building was successively used as a store for second-hand goods and an egg- grading station. From the original accommodation of eight rooms and a bathroom, the architect has provided one three-bedroom apartment and three two-bedroom apartments. By making extensions to the existing building from the interior angle of the corner, from the street side, the external appearance of the original building has been maintained in character and, in fact, improveL
±TA:;
. - .. - - -
_
ripe for a re-examination of the zoning boundaries with a view to retaining this part of the Waterfront both for public use and as a high quality residential area. The proposal envisages a public promenade directed towards the Yacht Club, with apartments overlooking the lake. Adequate parking could be provided on the site.
r! i 1j.
i.
b c.i
. -.
PDF compression, OCR, web optimization using a watermarked evaluation copy of CVISION PDFCompressor
THE CENTRAL AREA
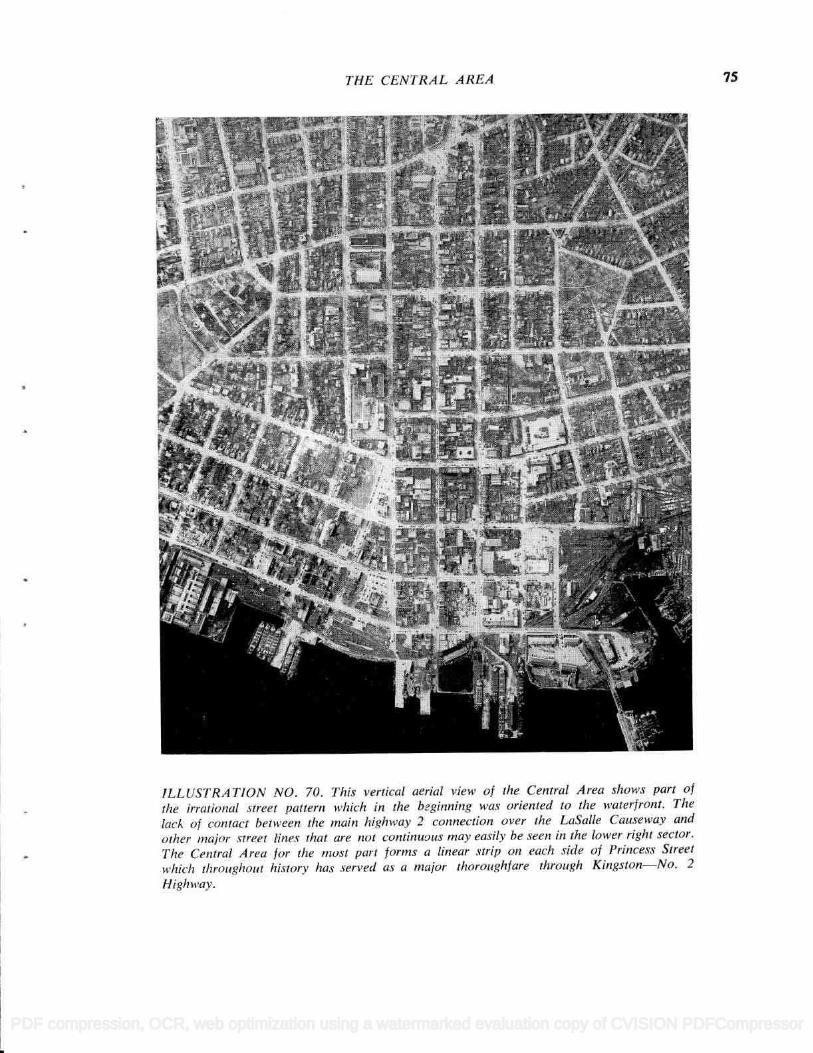
ILLUSTRA TION NO. 70. This vertical aerial view of the Central Area shows part of
the irrajional Street pattern which in the beginning was oriented to the waterfront. The
lac!.. of contact between the main highway 2 connection over ¡he LaSalle Causeway and
other major street lines that are not continuous may easily be seen in the lower right sector.
The Central A rea for the most part forms a linear strip on each side of Princess Street
which throughout history has served as a major thoroughfare through Kingston-No. 2
Highway.
75
PDF compression, OCR, web optimization using a watermarked evaluation copy of CVISION PDFCompressor
76 PART iX: SECTION 3. THE CENTRAL AREA
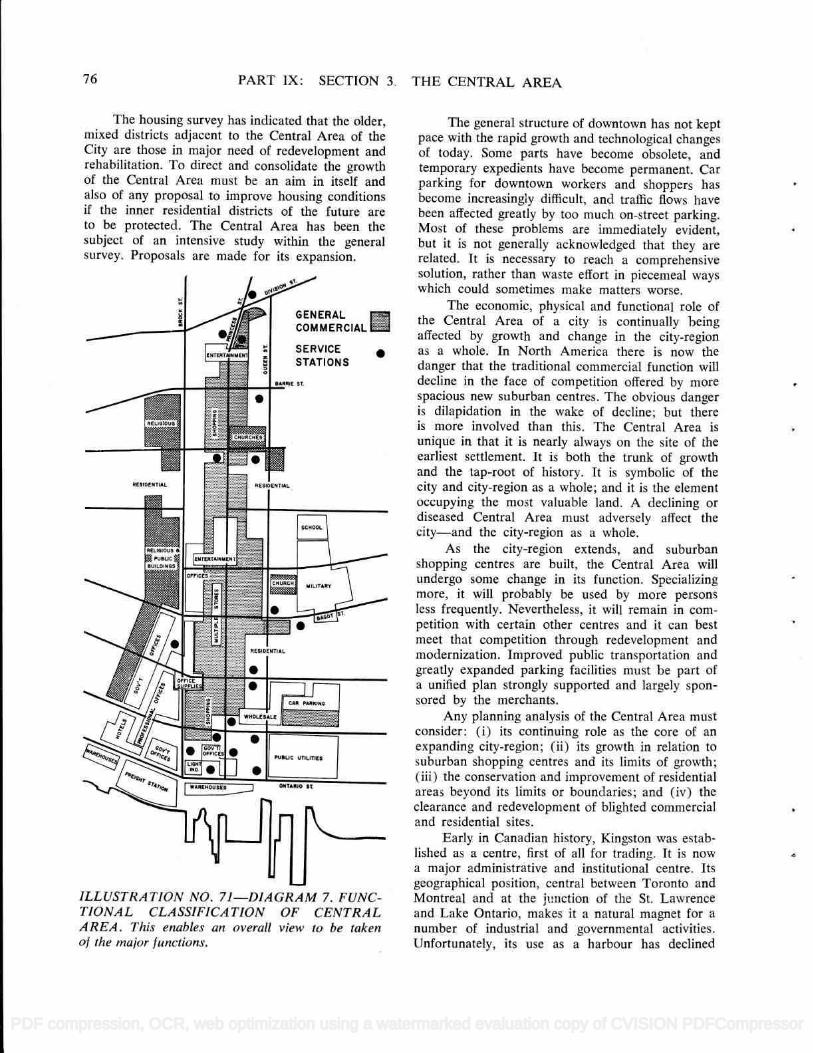
The housing survey has indicated that the older, mixed districts adjacent to the Central Area of the City are those in major need of redevelopment and rehabilitation. To direct and consolidate the growth of the Central Area must be an aim in itself and also of any proposal to improve housing conditions if the inner residential districts of the future are to be protected. The Central Area has been the subject of an intensive study within the general survey. Proposals are made for its expansion.
GENERAL COMMERCIAL
iLLUSTRATiON NO. 71-DiAGRAM 7. FUNC- TIONAL CLASSiFICATION OF CENTRAL AREA. This enables an overall view to be taken of the major functions.
The general structure of downtown has not kept pace with the rapid growth and technological changes of today. Some parts have become obsolete, and temporary expedients have become permanent. Car parking for downtown workers and shoppers has become increasingly difficult, and traffic flows have been affected greatly by too much on-street parking. Most of these problems are immediately evident, but it is not generally acknowledged that they are related. It is necessary to reach a comprehensive solution, rather than waste effort in piecemeal ways which could sometimes make matters worse.
The economic, physical and functional role of the Central Area of a city is continually being affected by growth and change in the city-region as a whole. In North America there is now the danger that the traditional commercial function will decline in the face of competition offered by more spacious new suburban centres. The obvious danger is dilapidation in the wake of decline; but there is more involved than this. The Central Area is unique in that it is nearly always on the site of the earliest settlement. It is both the trunk of growth and the tap-root of history. It is symbolic of the city and city-region as a whole; and it is the element occupying the most valuable land. A declining or diseased Central Area must adversely affect the city-and the city-region as a whole.
As the city-region extends, and suburban shopping centres are built, the Central Area will undergo some change in its function. Specializing more, it will probably be used by more persons less frequently. Nevertheless, it will remain in corn- petition with certain other centres and it can best meet that competition through redevelopment and modernization. Improved public transportation and greatly expanded parking facilities must be part of a unified plan strongly supported and largely spon- sored by the merchants.
Any planning analysis of the Central Area must consider: (i) its continuing role as the core of an expanding city-region; (ii) its growth in relation to suburban shopping centres and its limits of growth; ( iii ) the conservation and improvement of residential areas beyond its limits or boundaries; and (iv) the clearance and redevelopment of blighted commercial and residential sites.
Early in Canadian history, Kingston was estab- lished as a centre, first of all for trading. It is now a major administrative and institutional centre. Its geographical position, central between Toronto and Montreal and at the junction of the St. Lawrence and Lake Ontario, makes it a natural magnet for a number of industrial and governmental activities. Unfortunately, its use as a harbour has declined
PDF compression, OCR, web optimization using a watermarked evaluation copy of CVISION PDFCompressor
THE CENTRAL AREA
considerably since the last century and its ship- building activity has been reduced. The new St. Lawrence Seaway has had little influence, because the channel is not consistent enough in depth to allow ocean going ships to pass on the Kingston side of Wolfe Island. Industrial developments along the lake are stimulating the growth of residential suburbs to the west of the City. This growth will continue as further industrial development takes place in this direction.
The boundary of the "Central Area" under consideration is formed by Lake Ontario, and William, King, Clarence, Brock, Division, Queen, Montreal, Barrack, Wellington Streets, and the Place D'Armes.
The general development of the Central Area has been consistent in scale and relatively compact. As yet there are no tall buildings. Early retail trade clustered at the bottom of Princess Street adjacent to the Market Square, and its centre of greatest use, or high value, has gradually been moving up Princess Street. Professional offices are adjacent to the Market Square, and extend up Clarence Street to Wellington Street. Recently Central Area growth has been taking place at the westerly end of Princess Street, with a large and important new shopping centre acting as a magnet. It is the pull it exerts, which is in part responsible for the languishing eastern extremity of Princess Street. The Central Area already has a clearly discernible ar- rangement of uses. Places of entertainment generally are between Montreal Street and Clergy Street. Furnishing stores gather close to Sydenham Street, and men's outfitters are found from Wellington Street to Bagot Street.
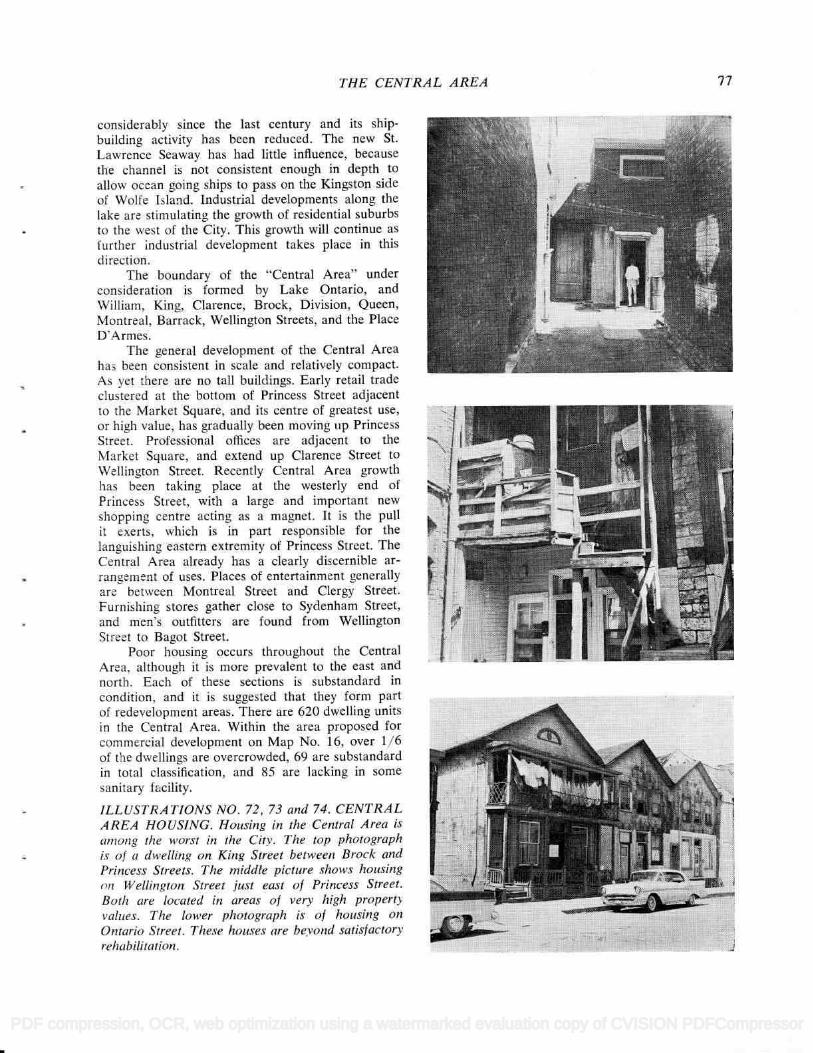
Poor housing occurs throughout the Central Area, although it is more prevalent to the east and north. Each of these sections is substandard in condition, and it is suggested that they form part of redevelopment areas. There are 620 dwelling units in the Central Area. Within the area proposed for commercial development on Map No. 16, over 1/6 of the dwellings are overcrowded, 69 are substandard in total classification, and 85 are lacking in some sanitary facility.
ILLUSTRATIONS NO. 72, 73 and 74. CENTRAL AREA HOUSING. Housing in the Central Area is among the worst in the Citv. The lop photograph is of a dwelling on King Street between Brock and Princess Streets. The middle picture shows housing on Wellington Street just east of Princess Street. Both are located in areas of very high property values. The lower photograph is of housing on Ontario Street. These houses are beyond satisfactory rehabilitation.
77
» t:-. f
irijr! j
áJ
i:.H_--- .::. r;---
PDF compression, OCR, web optimization using a watermarked evaluation copy of CVISION PDFCompressor
78 PART IX: SECTION 3. THE CENTRAL AREA
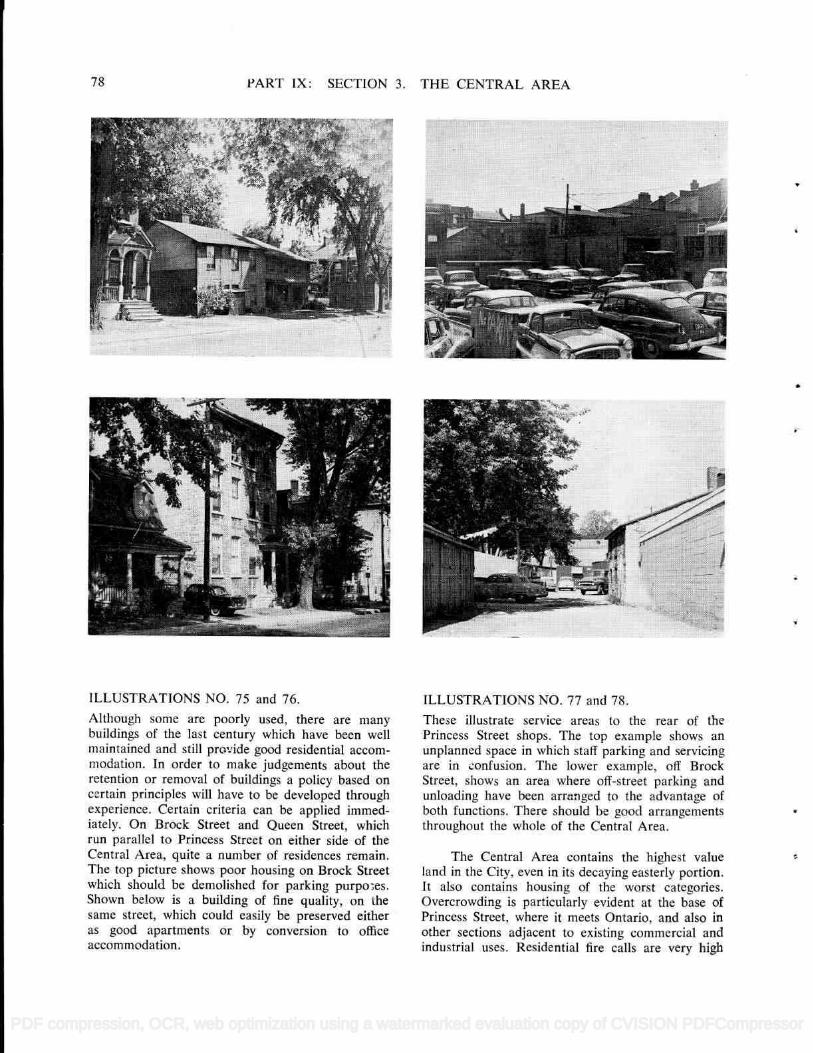
ILLUSTRATIONS NO. 75 and 76.
AlthougJ some are poorly used, there are many buildings of the last century which have been well maintained and still provide good residential accom- modation. In order to make judgements about the retention or removal of buildings a policy based on certain principles will have to be developed through experience. Certain criteria can be applied immed- iately. On Brock Street and Queen Street, which run parallel to Princess Street on either side of the Central Area, quite a number of residences remain. The top picture shows poor housing on Broek Street which should be demolished for parking purpo;es. Shown below is a building of fine quality, on the same street, which could easily be preserved either as good apartments or by conversion to office accommodation.
ILLUSTRATIONS NO. 77 and 78.
These illustrate service areas to the rear of the Princess Street shops. The top example shows an unplanned space in which staff parking and servicing are in confusion. The lower example, off Brock Street, shows an area where off-street parking and unloading have been armnged to the advantage of both functions. There should be good arrangements throughout the whole of the Central Area.
The Central Area contains the highest value land in the City, even in its decaying easterly portion. It also contains housing of the worst categories. Overcrowding is particularly evident at the base of Princess Street, where it meets Ontario, and also in other sections adjacent to existing commercial and industrial uses. Residential fire calls are very high
PDF compression, OCR, web optimization using a watermarked evaluation copy of CVISION PDFCompressor
p
s
p
a
's
¡
THE CENTRAL AREA
in the eastern part of Princess Street, and the general condition of residences is bad. The survey clearly shows that certain downtown areas contain uses which are not the highest and best. Substandard housing, such as is illustrated, should be removed, and give way to planned and well organized corn- merciai redevelopment.
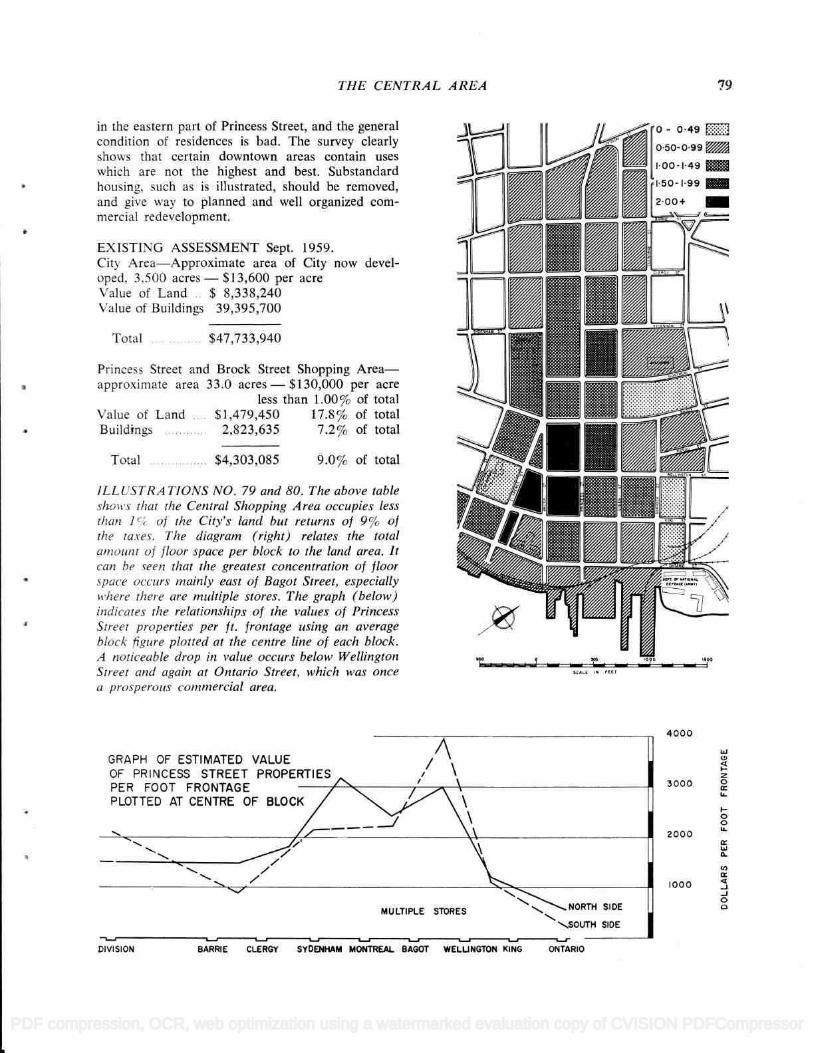
EXISTING ASSESSMENT Sept. 1959. City Area-Approximate area of City now devel- oped, 3.500 acres - $13,600 per acre Value of Land . $ 8,338,240 Value of Buildings 39,395,700
Total $47,733,940
Princess Street and Brock Street Shopping Area- approximate area 33.0 acres -$ 1 30,000 per acre
less than 1.00% of total Value of Land .. $1,479,450 17.8% of total Buildings 2.823,635 7.2% of total
Total ........ $4,303,085 9.0% of total
ILLUSTRA TIONS NO. 79 and 80. The above table shoR'S that the Central Shopping Area occupies less t/za?l I C / ¡he City's land but returns of 9% of
the taxes. The diagram (right) relates the total amount of floor space per block to the land area. ¡t can be seen that the greatest concentration of floor space Occurs mainly east of Bago: Street, especially where there are multiple stores. The graph (below) indicates the relationships of the values of Princess Street properties per ft. frontage using an average block figure plotted at the centre line of each block. A noticeable drop in value occurs below Wellington Street and again at Ontario Street, which was once a prosperous cotuinercial area.
79
I /1'fnirrl L.r i s
ji9L A IV
_______ , r__i
4000
A
3000
GRAPH OF ESTIMATED VALUE / OF PRINCESS STREET PROPERTIES
PLOTTED AT
2000
PER FOOT FRONTAGE __________________ _______
-____.
MULTIPLE STORES
_______ / / bOO
Sb DE
-.. ..SOUTH SIDE
- Th- - - - DIVISION BARRIE CLERGY SYDEW44M MONTREAL BAGOT WELLINGTON KING ONTARIO
Li
i
LJ e'
o t'-
o o u-
w Q-
Q) Q-
-J -J
o c-J
PDF compression, OCR, web optimization using a watermarked evaluation copy of CVISION PDFCompressor
80 PART IX: SECTION 3. ThE CENTRAL AREA
Stati k Pii?
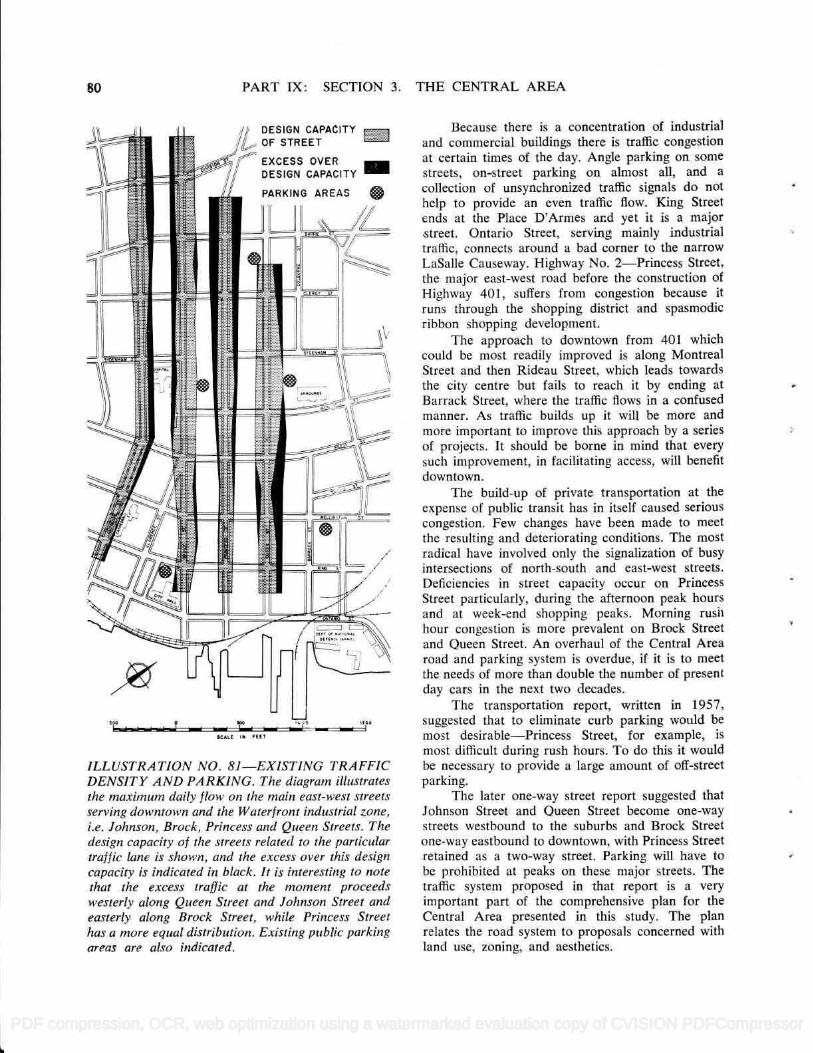
ILLUSTRATION NO. 81-EXISTING TRAFFIC DENSITY AND PARKING. The diagram illustrates the maximum daily flow on the main east-west streets serving downtown and the Waterfront industrial zone, i.e. Johnson, B rock, Princess and Queen Streets. The design capacity of the streets related to the particular tra /f Ic lane is shown, and the excess over this design capacity is indicated in black. It is interesting to note that the excess traffic at the moment proceeds westerly along Queen Street and Johnson Street and easterly along Brock Street, while Princess Street has a more equal distribution. Existing public parking areas are also indicated.
Because there is a concentration of industrial and commercial buildings there is traffic congestion at certain times of the day. Angle parking on some streets, on-street parking on almost all, and a collection of unsynchronized traffic signals do not help to provide an even traffic flow. King Street ends at the Place D'Armes and yet it is a major street. Ontario Street, serving mainly industrial traffic, connects around a bad corner to the narrow LaSalle Causeway. Highway No. 2-Princess Street, the major east-west road before the construction of Highway 401, suffers from congestion because it runs through the shopping district and spasmodic ribbon shopping development.
The approach to downtown from 401 which could be most readily improved is along Montreal Street and then Rideau Street, which leads towards the city centre but fails to reach it by ending at Barrack Street, where the traffic flows in a confused manner. As traffic builds up it will be more and more important to improve this approach by a series of projects. It should be borne in mind that every such improvement, in facilitating access, will benefit downtown.
The build-up of private transportation at the expense of public transit has in itself caused serious congestion. Few changes have been made to meet the resulting and deteriorating conditions. The most radical have involved only the signalization of busy intersections of north-south and east-west streets. Deficiencies in street capacity occur on Princess Street particularly, during the afternoon peak hours and at week-end shopping peaks. Morning rush hour congestion is more prevalent on Brock Street and Queen Street. An overhaul of the Central Area road and parking system is overdue, if it is to meet the needs of more than double the number of present day cars in the next two decades.
The transportation report, written in 1957, suggested that to eliminate curb parking would be most desirable-Princess Street, for example, is
most difficult during rush hours. To do this it would be necessary to provide a large amount of off-street parking.
The later one-way street report suggested that Johnson Street and Queen Street become one-way streets westbound to the suburbs and Brock Street one-way eastbound to downtown, with Princess Street retained as a two-way street. Parking will have to be prohibited at peaks on these major streets. The traffic system proposed in that report is a very important part of the comprehensive plan for the Central Area presented in this study. The plan relates the road system to proposals concerned with land use, zoning, and aesthetics.
PDF compression, OCR, web optimization using a watermarked evaluation copy of CVISION PDFCompressor
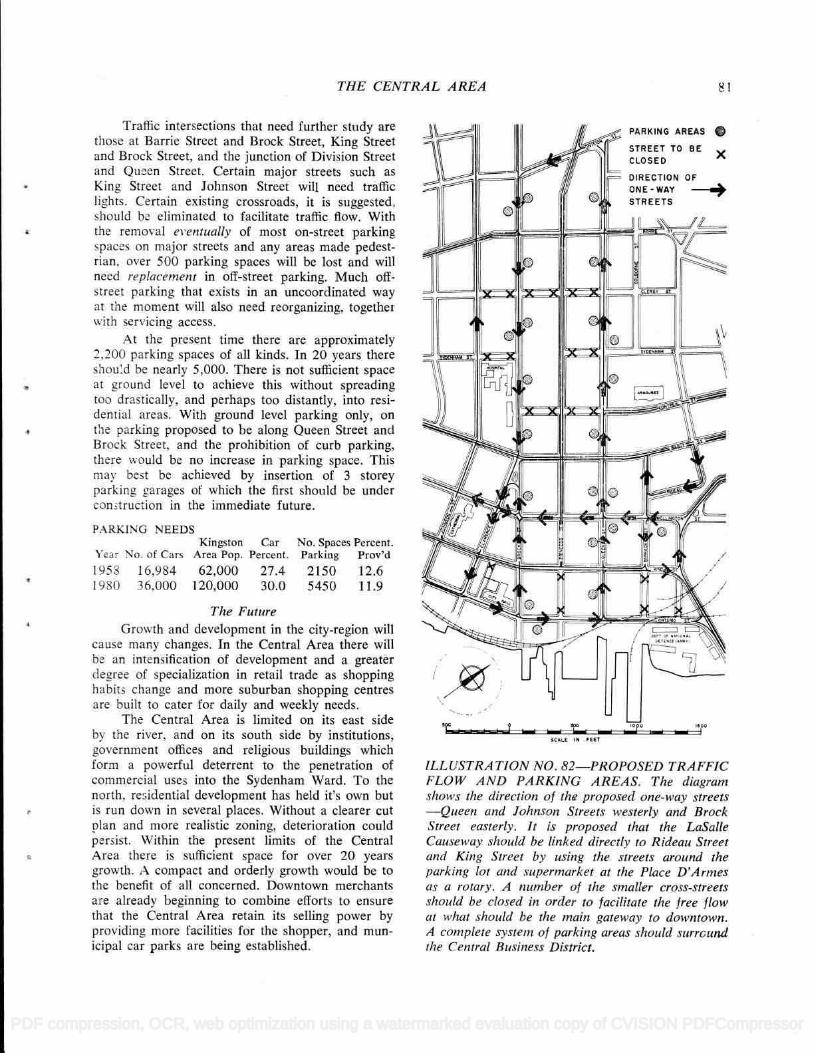
THE CENTRAL AREA
Traffic intersections that need further study are those at Barrie Street and Brock Street, King Street and Brock Street, and the junction of Division Street and Queen Street. Certain major streets such as King Street and Johnson Street will need traffic lights. Certain existing crossroads, it is suggested, should be eliminated to facilitate traffic flow. With the removal eentual1y of most on-street parking spaces on major streets and any areas made pedest- nan, over 500 parking spaces will be lost and will need replacement in off-street parking. Much off- street parking that exists in an uncoordinated way at the moment will also need reorganizing, together with servicing access.
At the present time there are approximately 2,200 parking spaces of all kinds. In 20 years there shoud be nearly 5,000. There is not sufficient space at ground level to achieve this without spreading too drastically, and perhaps too distantly, into resi- dential areas. With ground level parking only, on the parking proposed to be along Queen Street and Brock Street, and the prohibition of curb parking, there would be no increase in parking space. This may best be achieved by insertion of 3 storey parking garages of which the first should be under COntruction in the immediate future.
PARKING NEEDS Kingston Car No. Spaces Percent.
'ear No. of Cars Area Pop. Percent. Parking Prov'd
1953 16,984 62,000 27.4 2150 12.6 1980 36,000 120,000 30.0 5450 11.9
The Future Growth and development in the city-region will
cause many changes. In the Central Area there will be an intensification of development and a greater degree of specialization in retail trade as shopping habits change and more suburban shopping centres are built to cater for daily and weekly needs.
The Central Area is limited on its east side the river, and on its south side by institutions,
government offices and religious buildings which form a powerful deterrent to the penetration of commercial uses into the Sydenham Ward. To the north, residential development has held it's own but is run down in several places. Without a clearer cut plan and more realistic zoning, deterioration could persist. Within the present limits of the Central Area there is suthcient space for over 20 years growth. A compact and orderly growth would be to the benefit of all concerned. Downtown merchants are already beginning to combine efforts to ensure that the Central Area retain its selling power by providing more facilities for the shopper, and mun- icipal car parks are being established.
$cA.c .N FlIT
ILLUSTRATION NO. 82-PROPOSED TRAFFIC FLOW AND PARKING AREAS. The diagram shows the direction of the proposed one-way streets -Queen and Johnson Streets westerly and Brock Street easterly. It is proposed that the LaSalle Causeway should be linked directly to Rideau Street and King Street by using the streets around the parking loi and supermarket at the Place D'Armes as a rotary. A number of the smaller cross-streets should be closed in order to facilitate the free flow at what should be the main gateway lo downtown. A complete system of parking areas should surrcund the Central Business District.
PDF compression, OCR, web optimization using a watermarked evaluation copy of CVISION PDFCompressor
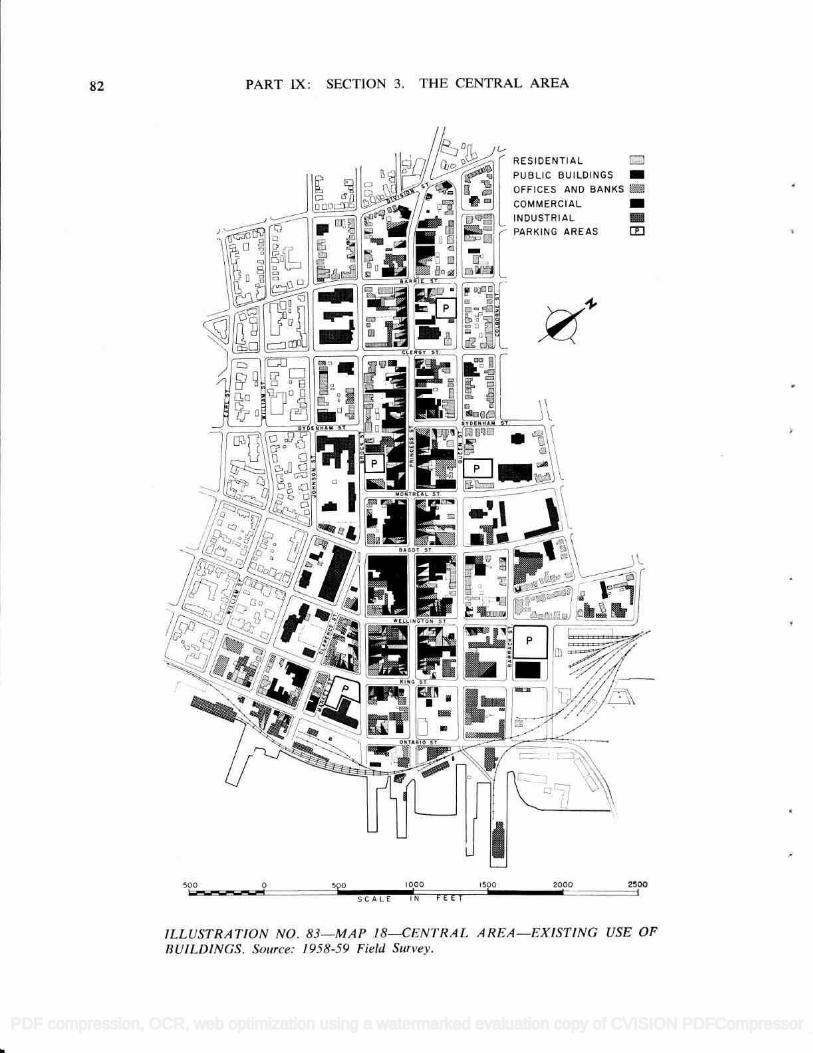
82
//
//$
PART iX: SECTION 3. THE CENTRAL AREA
:jQ&/(__ RESIDENTIAL -------- røA3 PUBLIC BUILDINGS
OFFICES AND BANNS . COMMERCIAL -
I
INDUSTRIAL
h1 PARKING AREAS EI
500 0 çc 000 500 2000 2500
SCALE N FEET
iLLUSTRATION NO. 83-MAP 18-CENTRAL AREA-EXISTING USE OF BUILDINGS. Source: 1958-59 Field Survey.
i
Li
PDF compression, OCR, web optimization using a watermarked evaluation copy of CVISION PDFCompressor
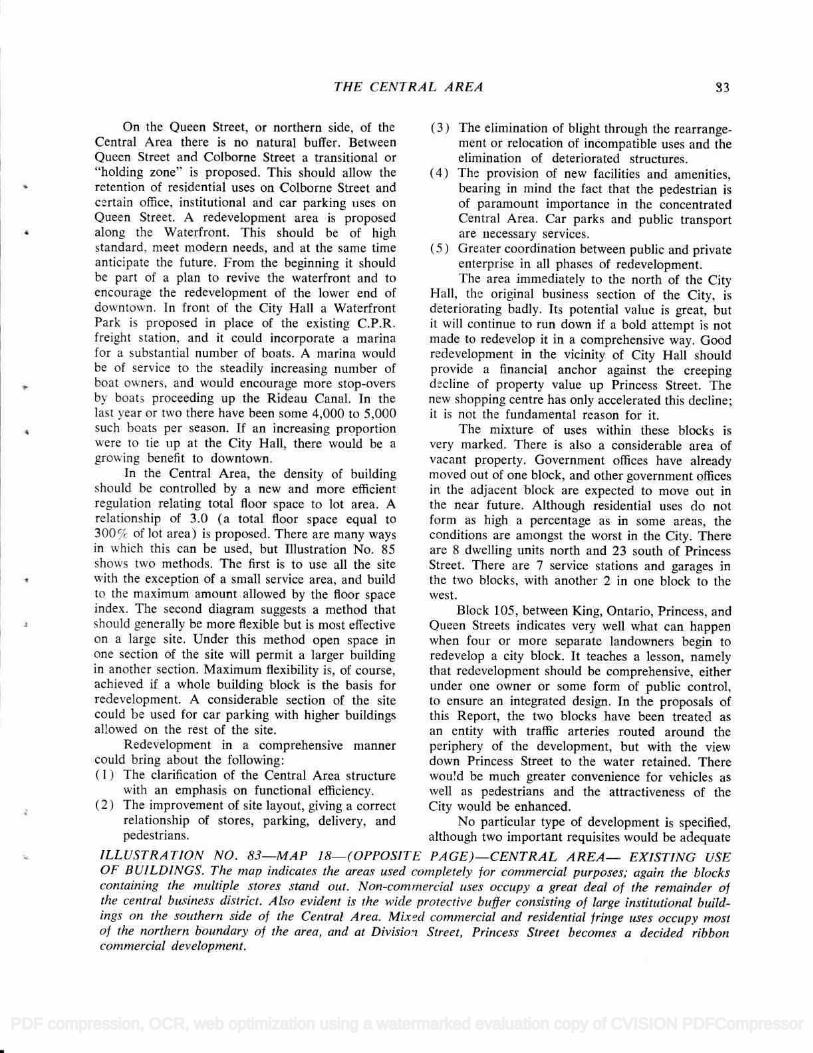
THE CENTRAL AREA
On the Queen Street, or northern side, of the Central Area there is no natural buffer. Between Queen Street and Cotborne Street a transitional or "holding zone' is proposed. This should allow the retention of residential uses on Colborne Street and certain office, institutional and car parking uses on Queen Street. A redevelopment area is proposed along the Waterfront. This should be of high standard, meet modern needs, and at the same time anticipate the future. From the beginning it should be part of a plan to revive the waterfront and to encourage the redevelopment of the lower end of downtown. In front of the City Hall a Waterfront Park is proposed in place of the existing C.P.R. freight station, and it could incorporate a marina for a substantial number of boats. A marina would be of service to the steadily increasing number of boat owners. and would encourage more stop-overs by boats proceeding up the Rideau Canal. In the last year or two there have been some 4,000 to 5,000 such boats per season. If an increasing proportion were to tie up at the City Hall, there would be a growing benefit to downtown.
In the Central Area, the density of building should be controlled by a new and more efficient regulation relating total floor space to lot area. A relationship of 3.0 (a total floor space equal to 300% of lot area) is proposed. There are many ways in which this can be used, but Illustration No. 85 shows two methods. The first is to use all the site with the exception of a small service area, and build to the maximum amount allowed by the floor space index. The second diagram suggests a method that should generally be more flexible but is most effective on a large site. Under this method open space in one section of the site will permit a larger building in another section. Maximum flexibility is, of course, achieved if a whole building block is the basis for redevelopment. A considerable section of the site could be used for car parking with higher buildings allowed on the rest of the site.
Redevelopment in a comprehensive manner could bring about the following: ( I ) The clarification of the Central Area structure
with an emphasis on functional efficiency. ( 2 ) The improvement of site layout, giving a correct
relationship of stores, parking, delivery, and pedestrians.
S3
( 3 ) The elimination of blight through the rearrange- ment or relocation of incompatible uses and the elimination of deteriorated structures.
(4) The provision of new facilities and amenities, bearing in mind the fact that the pedestrian is of paramount importance in the concentrated Central Area. Car parks and public transport are necessary services.
(5 ) Greater coordination between public and private enterprise in all phases of redevelopment. The area immediately to the north of the City
Hall, the original business section of the City, is deteriorating badly. Its potential value is great, but it will continue to run down if a bold attempt is not made to redevelop it in a comprehensive way. Good redevelopment in the vicinity of City Hall should provide a financial anchor against the creeping decline of property value up Princess Street. The new shopping centre has only accelerated this decline; it is not the fundamental reason for it.
The mixture of uses within these blocks is very marked. There is also a considerable area of vacant property. Government offices have already moved out of one block, and other government offices in the adjacent block are expected to move out in the near future. Although residential uses do not form as high a percentage as in some areas, the conditions are amongst the worst in the City. There are 8 dwelling units north and 23 south of Princess Street. There are 7 service stations and garages in the two blocks, with another 2 in one block to the west.
Block 105, between King, Ontario, Princess, and Queen Streets indicates very well what can happen when foui or more separate landowners begin to redevelop a city block. It teaches a lesson, namely that redevelopment should be comprehensive, either under one owner or some form of public control, to ensure an integrated design. In the proposals of this Report, the two blocks have been treated as an entity with traffic arteries routed around the periphery of the development, but with the view down Princess Street to the water retained. There wou!d be much greater convenience for vehicles as well as pedestrians and the attractiveness of the City would be enhanced.
No particular type of development is specified, although two important requisites would be adequate
ILLUSTRA TION NO. 83-MAP 18-(OPPOSJTE PAGE)-CENTRAL AREA- EXISTiNG USE OF B UILDINGS. The map indicates the arear used completely for commercial purposes; again the blocks containing the multiple stores stand oui. Non-commercial uses occupy a great deal of the remainder of the central business district. A Iso evident is the wide protective buffer consisting of large institutional bui! d- ings on the southern side of the Central A rea. Mixed commercial and residential fringe uses occupy most of the northern boundary of the area, and at Divisioi Street, Princess Street becomes a decided ribbon commercial development.
PDF compression, OCR, web optimization using a watermarked evaluation copy of CVISION PDFCompressor
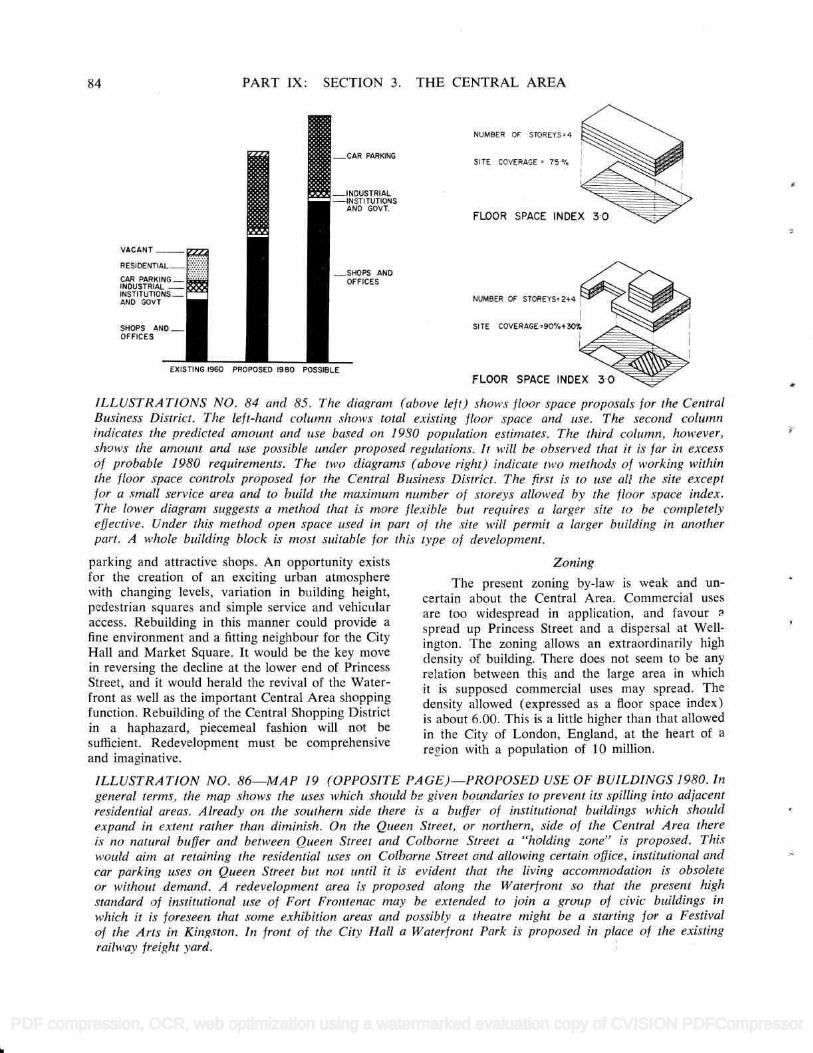
84 PART IX: SECTION 3. THE CENTRAL AREA
VACANT - RESI DNT;
CAR PARKII INDUSTRIAL INSTITUT1O AND GOVT
SHOPS AP
OFFICES
EXISTING 19GO PROPOSED 1980 POSSLE
NUM6ER OF STOREYS4
R PARK*IG SrTE COVERAGE 75%
D US T R IAL ST I TUTIONS 1O GOVT
FLOOR SPACE NDE
OPS AND CE S
NUMeER OF STOREYS 2+4
SITE COVERAGE9O%+30,!
FLOOR SP#C INDEX
ILLUSTRA TIONS NO. 84 and 85. The diagram (above left) shows floor space proposals for the Central Business District. The left-hand column shows total existing floor space and use. The second colunn indicates the predicted amount and use based on I 980 population estimates. The third column, however, shows the amount and use possible under proposed regulations. It will be observed that it is far in excess of probable 1980 requirements. The two diagrams (above right) indicale two methods of working within the floor space controls proposed for the Central Business District. The firs: is lo use all the site except for a small service area and to build the maximum number of storeys allowed by the floor space index. The lower diagram suggests a method that is tmore flexible bui requires a larger site io be completely effective. Under this method open space used in part of the site will permit a larger building in another part. A whole building block is most suitable for this type of development.
parking and attractive shops. An opportunity exists for the creation of an exciting urban atmosphere with changing levels, variation in building height, pedestrian squares and simple service and vehicular access. Rebuilding in this manner could provide a fine environment and a fitting neighbour for the City Hall and Market Square. It would be the key move in reversing the decline at the lower end of Princess Street, and it would herald the revival of the Water- front as well as the important Central Area shopping function. Rebuilding of the Central Shopping District in a haphazard, piecemeal fashion will not be sufficient. Redevelopment must be comprehensive and imaginative.
Zoning
The present zoning by-law is weak and un- certain about the Central Area. Commercial uses are too widespread in application, and favour spread up Princess Street and a dispersal at Well- ington. The zoning allows an extraordinarily high density of building. There does not seem to be any relation between this and the large area in which it is supposed commercial uses may spread. The density allowed (expressed as a floor space index) is about 6.00. This is a little higher than that allowed in the City of London, England, at the heart of a
re!ion with a population of I O million.
ILLUSTRATION NO. 86-MAP 19 (OPPOSITE PAGE)-PROPOSED USE OF BUiLDINGS 1980. In general terms, the map shows the uses which should be given boundaries to prevent its spilling into adjacent residential areas, Already on the southern side there is a bufter of institutional buildings which should expand in extent rather than diminish. On the Queen Street, or northern, side of the Central A rea there is no natural buffer and between Queen Street and Co/borne Street a 'holding zone" is proposed. This would aim at retaining the residential uses on Colborne Street and allowing certain office, institutional and car parking uses on Queen Street but not until it is evident that the living accommodation is obsolete or without demand. A redevelopment area is proposed along the Waterfront so that the present high standard of institutional use of Fort Frontenac may be extended io join a group of civic buildings in which it is foreseen that some exhibition areas and possibly a theatre might be a starting for a Festival of the Arts in Kingston. In front of the City Hall a Waterfront Park is proposed in place of the existing railway freight yard.
PDF compression, OCR, web optimization using a watermarked evaluation copy of CVISION PDFCompressor
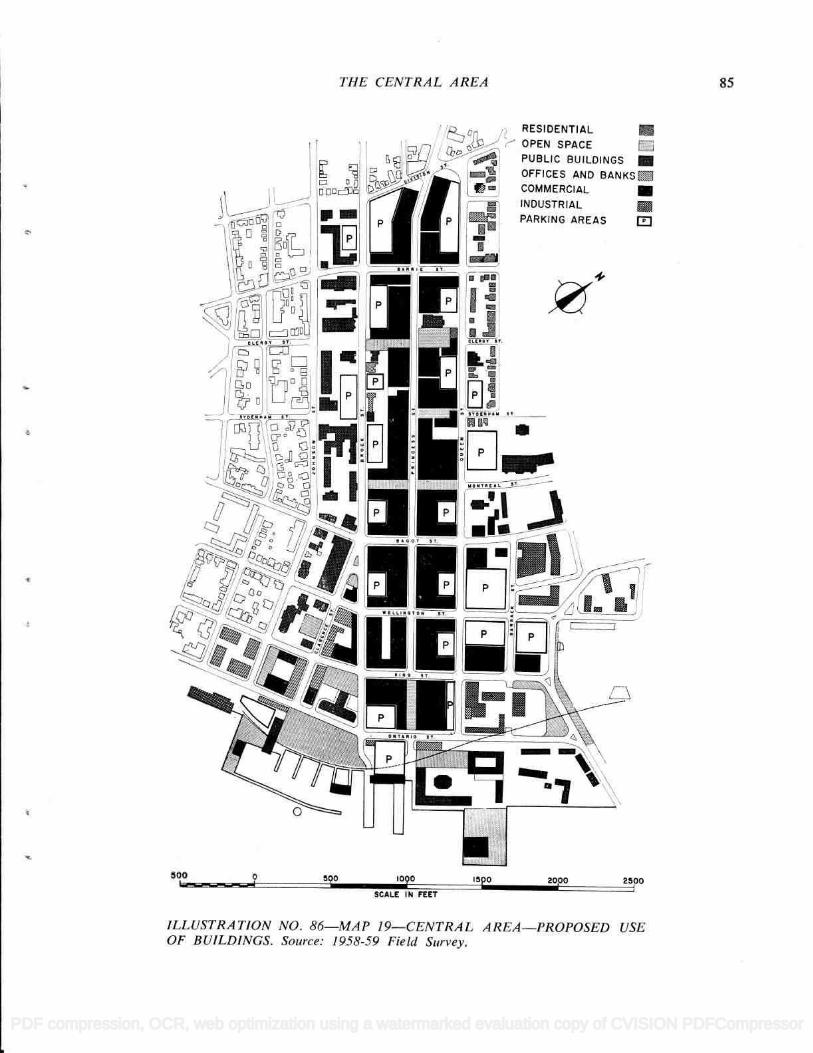
THE CENTRAL AREA
1
1« U' .-
/) I zI/g0oi;
1:!1 /OPk1 I ='ú"p:r;iI
I I I E LI
uip.
5ÍQc. 7ìc3
, RESIDENTIAL ,a .
OPEN SPACE
PUBLtC BUILDINGS OFFICES AND 8ANKS COMMERCIAL
I.- g rl
INDUSTRIAL
p PARKING AREAS
L
LJ3 - l'o
'ì -J.i$-
OO O 590 090 590 2000 25100
SCALE IN FEET
ILLUSTRATION NO. 86-MAP 19-CENTRAL AREA-PROPOSED USE OF BU!LDINGS. Source: 1958-59 Field Survey.
85
PDF compression, OCR, web optimization using a watermarked evaluation copy of CVISION PDFCompressor
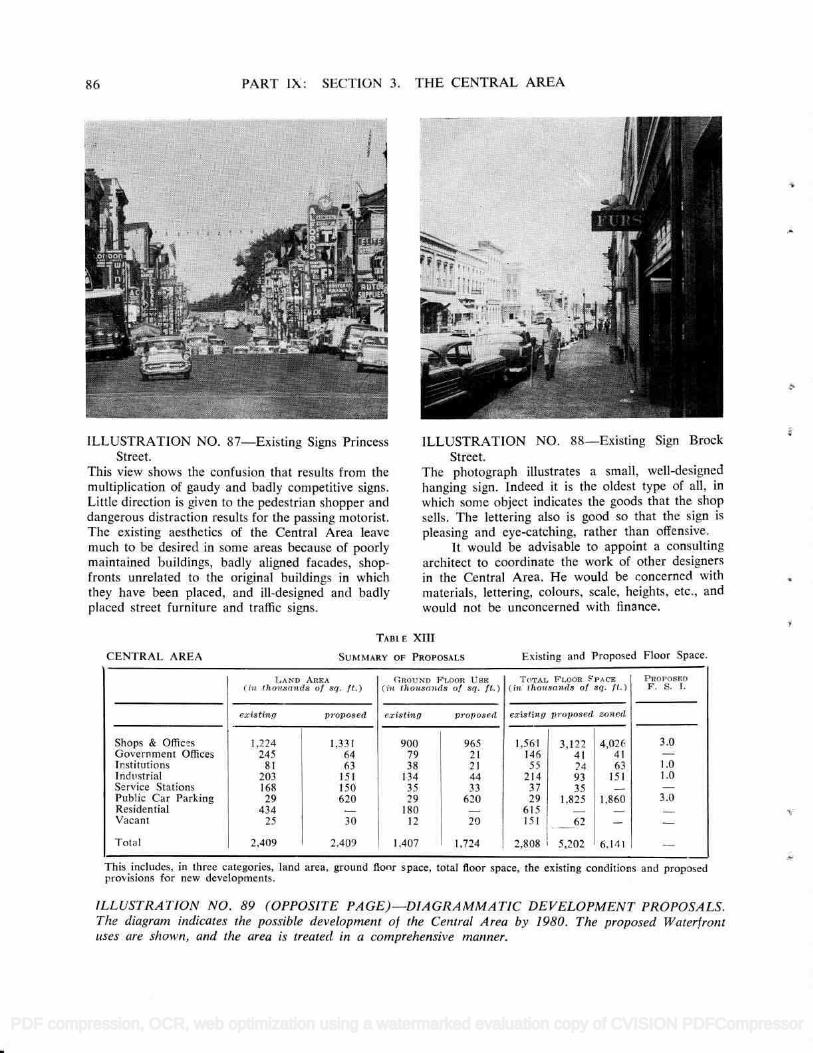
86 PART IX: SECTION 3. THE CENTRAL AREA
1
ILLUSTRATION NO. 87-Existing Signs Princess Street.
This view shows the confusion that results from the multiplication of gaudy and badly competitive signs. Little direction is given to the pedestrian shopper and dangerous distraction results for the passing motorist. The existing aesthetics of the Central Area leave much to be desired in some areas because of poorly maintained buildings, badly aligned facades, shop- fronts unrelated to the original buildings in which they have been placed, and ill-designed and badly placed street furniture and traffic signs.
;, p
.-.-----, . :-
,
T.
ILLUSTRATION NO. 88-Existing Sign Brock Street.
The photograph illustrates a small, well-designed hanging sign. Indeed it is the oldest type of all, in
which sanie object indicates the goods that the shop sells. The lettering also is good so that the sign is
pleasing and eye-catching, rather than offensive. lt would be advisable to appoint a consulting
architect to coordinate the work of other designers in the Central Area. He would be concerned with materials, lettering, colours, scale, heights. etc. . and would not be unconcerned with finance.
CENTRAL AREA
TAeL E XIII
SUMMARY OF PROPOSALS Existing and Proposed Floor Space.
LAND AItEA (bi honsond8 Of *f. ft.)
(aouwn FLOOR Usa (in tht-ni.,snnds of sq. ft.)
TOTAL FLOoR 'PACE (i thouRa,ds o! sq. ft.)
PROPOSED F, S. F.
3.0
ex8tInp propo8ed e'i.ting proposed existing proposed zoned
Shops & Offices 1,224 1,331 900 965 1,561 3,122 4,026 Government Offices 245 64 79 21 146 41 41 Institutions 81 63 38 21 55 '4 63 1.0 Industrial 203 151 134 44 214 93 151 1.0 Service Stations 168 f50 35 33 37 35 - Public Car Parking 29 620 29 620 29 1,825 1,860 3.0 Residential 434 - 180 - 615 - - - Vacant 25 30 12 20 151 62 - - Total 2,409 2.409 1.407 1,724 2808 5,202 6,141 -
This includes, in three categories, land area, ground font space. total floor space, the existing conditions and proposed provisions for new developments.
ILLUSTRA TION NO. 89 (OPPOSITE PA GE) -DIA GRA MMA TIC DEVELOPMENT PROPOSALS. The diagram indicates the possible development of the Central Area by ¡980. The proposed Waterfront uses are shown, and the area is treated in a comprehensive ,nanner.
PDF compression, OCR, web optimization using a watermarked evaluation copy of CVISION PDFCompressor
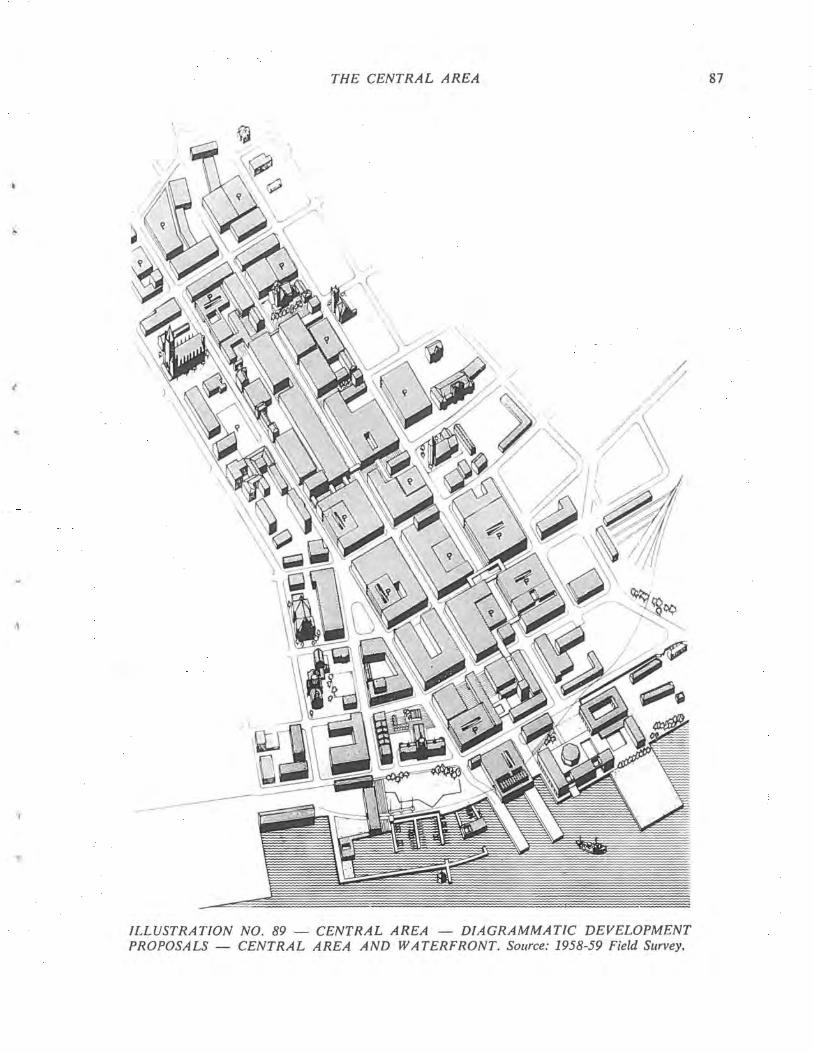
THE CENTRAL AREA
ILLUSTRATION NO. 89 - CENTRAL AREA - DIAGRAMMATIC DEVELOPMENT PROPOSALS - CENTRAL AREA AND WATERFRONT. Source: 1958-59 Field Survey.
87
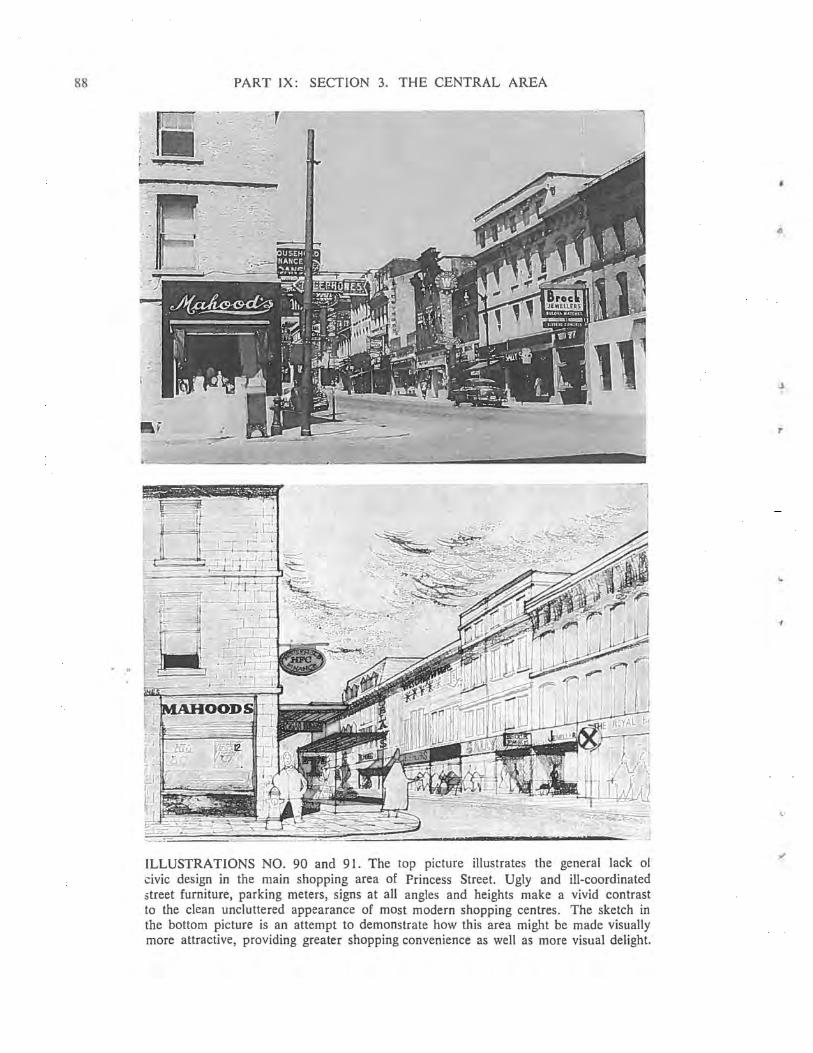
88
. "
PART IX: SECTION 3. THE CENTRAL AREA
: .~ . :' .. - --:~'.~'! ;: J. : ~'-?-'-::= : -:-~.
¥_. :1:1 . "
f
ILLUSTRATIONS NO. 90 and 91. The top picture illustrates the general lack 01 civic design in the main shopping area of Princess Street. Ugly and ill-coordinated street furniture, parking meters, signs at all angles and heights make a vivid contrast to the clean uncluttered appearance of most modern shopping centres. The sketch in the bottom picture is an attempt to demonstrate how this area might be made visually more attractive, providing greater shopping convenience as well as more visual delight.
-f
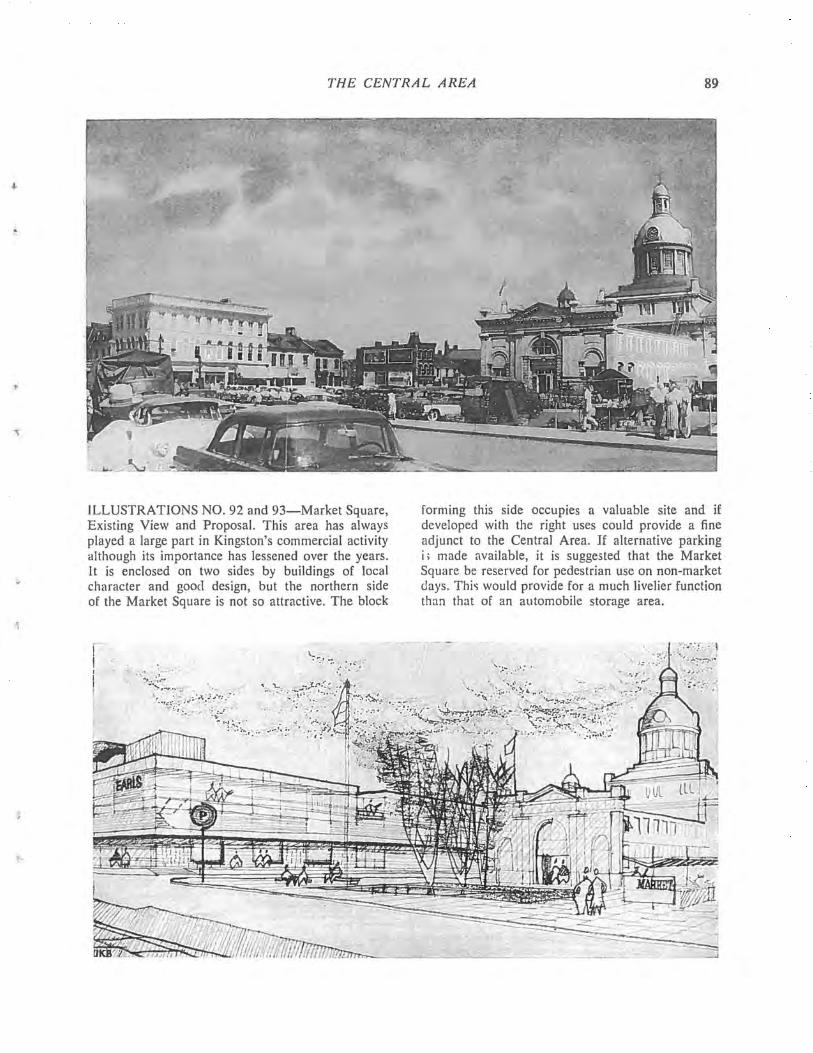
THE CENTRAL AREA 89
ILLUSTRATIONS NO. 92 and 93-Market Square, Existing View and Proposal. This area has always played a large part in Kingston's commercial activity although its importance has lessened over the years. It is enclosed on two sides by buildings of local character and good design, but the northern side of the Market Square is not so attractive. The block
r i
forming this side occupies a valuable site and if developed with the right uses could provide a fine adjunct to the Central Area. If alternative parking i; made available, it is suggested that the Market Square be reserved for pedestrian use on non-market days. Thi., would provide for a much livelier function than that of an automobile storage area.
..... !~ • "I : .
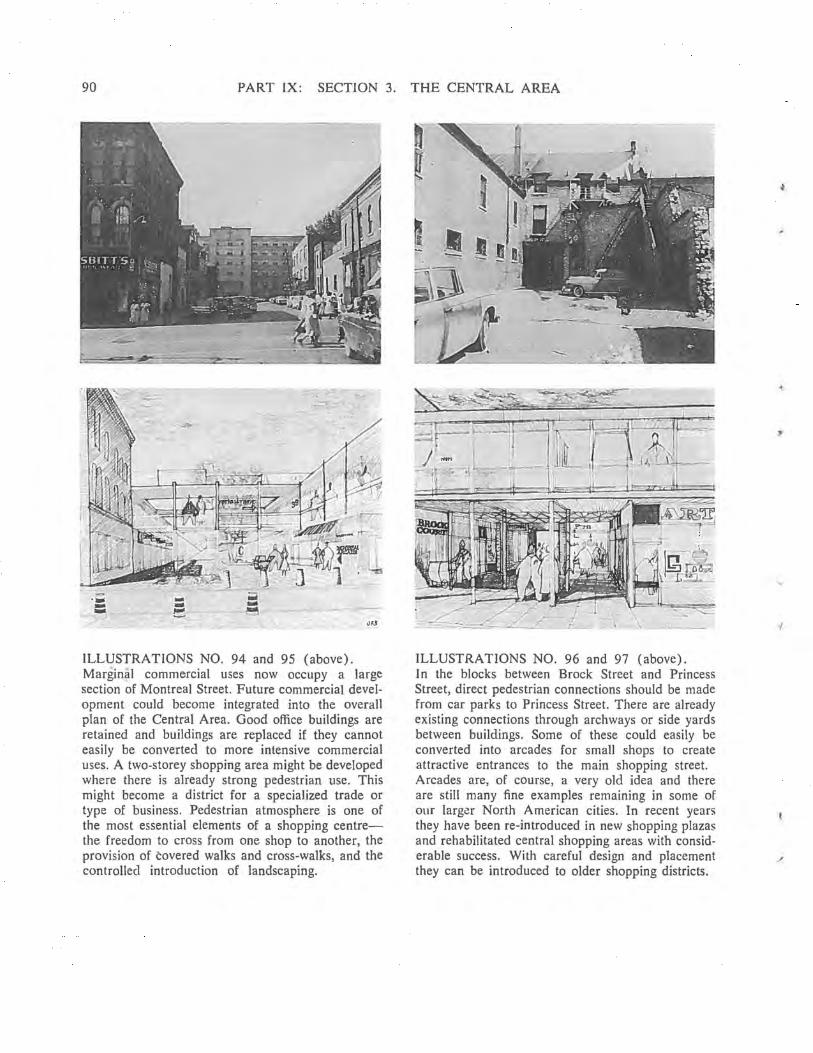
90 PART IX: SECTION 3. THE CENTRAL AREA
ILLUSTRATIONS NO. 94 and 95 (above). Marginal commercial uses now occupy a large section of Montreal Street. Future commercial development could become integrated into the overall plan of the Central Area. Good office buildings are retained and buildings are replaced if they cannot easily be converted to more intensive commercial uses. A two-storey shopping area might be developed where there is already strong pedestrian use. This might become a district for a specialized trade or type of business. Pedestrian atmosphere is one of the most essential elements of a shopping centrethe freedom to cross from one shop to another, the provision of covered walks and cross-walks, and the controlled introduction of landscaping.
ILLUSTRATIONS NO. 96 and 97 (above). In the blocks between Brock Street and Princess Street, direct pedestrian connections should be made from car parks to Princess Street. There are already existing connections through archways or side yards between buildings. Some of these could easily be converted into arcades for small shops to create attractive entrances to the main shopping street. Arcades are, of course, a very old idea and there are still many fine examples remaining in some of our larg<!r North American cities. In recent years they have been re-introduced in new shopping plazas and rehabilitated central shopping areas with considerable success. With careful design and placement they can be introduced to older shopping districts.
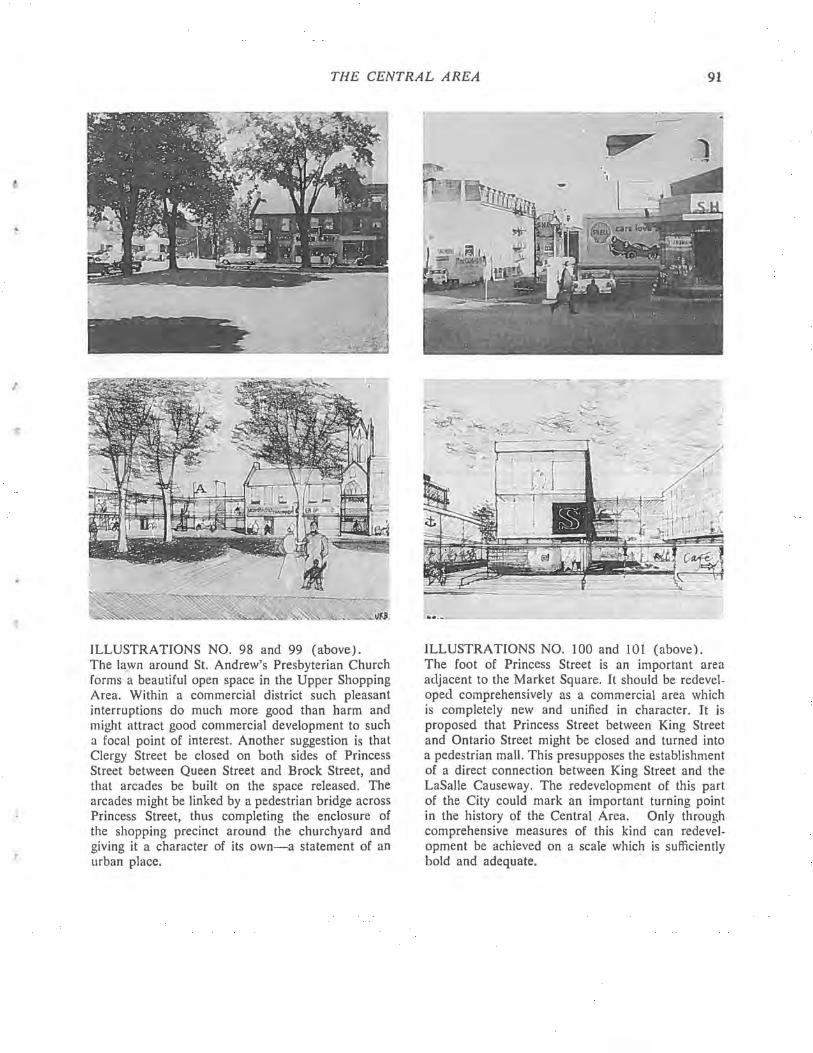
THE CENTRAL AREA 91
ILLUSTRATIONS NO. 98 and 99 (above). The lawn around St. Andrew's Presbyterian Church forms a beautiful open space in the Upper Shopping Area. Within a commercial district such pleasant interruptions do much more good than harm and might attract good commercial development to such a focal point of interest. Another suggestion is that Clergy Street be closed on both sides of Princess Street between Queen Street and Brock Street, and that arcades be built on the space released. The arcades might be linked by a pedestrian bridge across Princess Street, thus completing the enclosure of the shopping precinct around the churchyard and giving it a character of its own-a statement of an urban place.
ILLUSTRATIONS NO. 100 and 101 (above). The foot of Princess Street is an important area adjacent to the Market Square. It should be redeveloped comprehensively as a commercial area which is completely new and unified in character. It is proposed that Princess Street between King Street and Ontario Street might be closed and turned into a pedestrian mall. This presupposes the establishment of a direct connection between King Street and the LaSalle Causeway. The redevelopment of this part of the City could mark an important turning point in the history of the Central Area. Only through comprehensive measures of this kind can redevelopment be achieved on a scale which is sufficiently bold and adequate. -
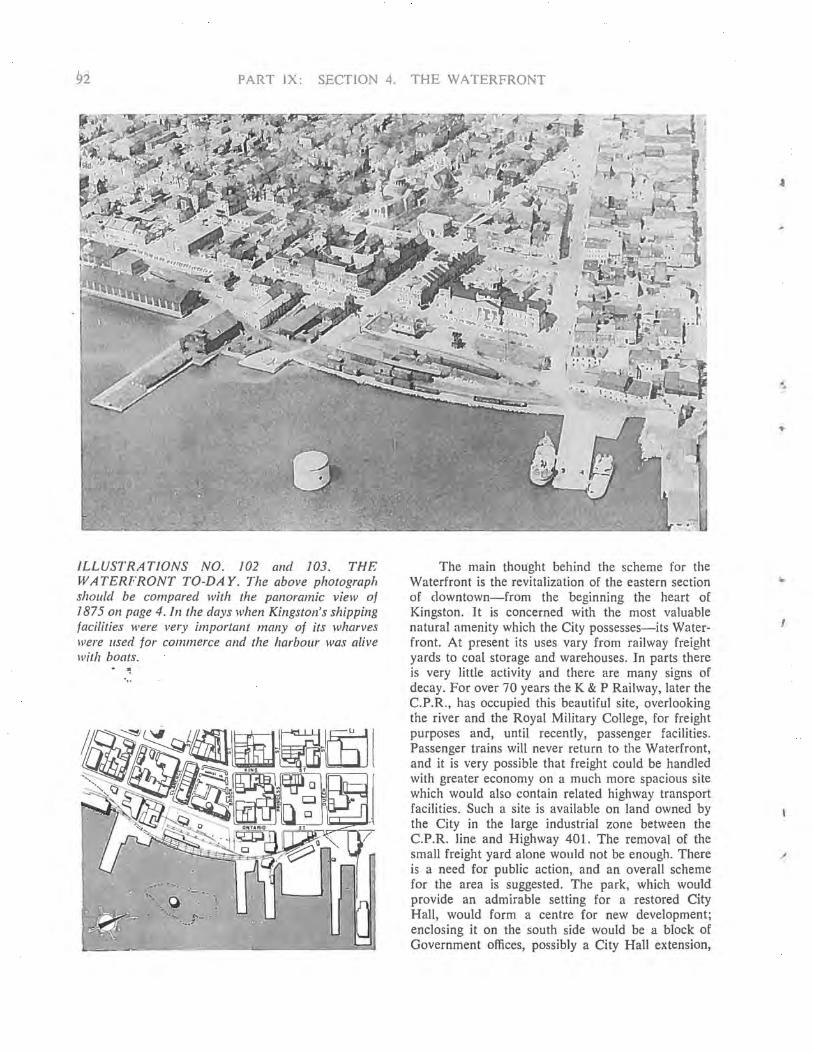
PART IX: SECTION 4. THE WATERFRONT
ILLUSTRATIONS NO. 102 and 103. THE WATERFRONT TO-DAY. The above photograph should be compared with the panoramic view of 1875 on page 4. In the days when Kingston's shipping facilities were very important many of its wharves were l/sed for commerce and the harbour was alive with boats.
• '! ",.
The main thought behind the scheme for the Waterfront is the revitalization of the eastern section of downtown-from the beginning the heart of Kingston. It is concerned with the most valuable natural amenity which the City possesses-its Waterfront. At present its uses vary from railway freight yards to coal storage and warehouses. In parts there is very little activity and there are many signs of decay. For over 70 years the K & P Railway, later the C.P.R., has occupied this beautiful site, overlooking the river and the Royal Military College, for freight purposes and, until recently, passenger facilities. Passenger trains will never return to the Waterfront, and it is very possible that freight could be handled with greater economy on a much more spacious site which would also contain related highway transport facilities. Such a site is available on land owned by the City in the large industrial zone between the C.P.R. line and Highway 401. The removal of the small freight yard alone would not be enough. There is a need for public action, and an overall scheme for the area is suggested. The park, which would provide an admirable setting for a restored City Hall, would form a centre for new development; enclosing it on the south side would be a block of Government offices, possibly a City Hall extension,
/
/
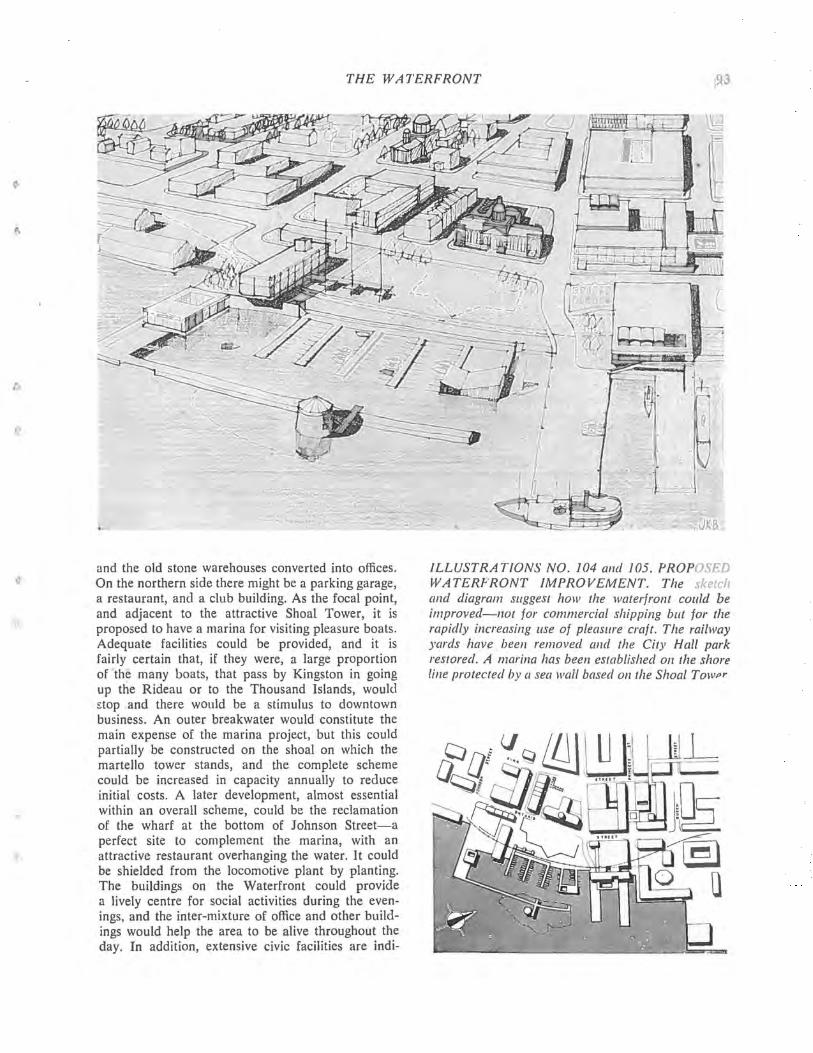
THE WATERFRONT
and the old stone warehouses converted into offices. On the northern side there might be a parking garage, a restaurant, and a club building. As the focal point, and adjacent to the attractive Shoal Tower, it is proposed to have a marina for visiting pleasure boats. Adequate facilities could be provided, and it is fairly certain that, if they were, a large proportion of the many boats, that pass by Kingston in going up the Rideau or to the Thousand Islands, would £top and there would be a stimulus to downtown business. An outer breakwater would constitute the main expense of the marina project, but this could partially be constructed on the shoal on which the martello tower stands, and the complete scheme could be increased in capacity annually to reduce initial costs. A later development, almost essential within an overall scheme, could be the reclamation of the wharf at the bottom of 10hnson Street-a perfect site to complement the marina, with an attractive restaurant overhanging the water. It could be shielded from the locomotive plant by planting. The buildings on the Waterfront could provide a lively centre for social activities during the evenings, and the inter-mixture of office and other buildings would help the area to be alive throughout the day. In addition, extensive civic facilities are indi-
ILLUSTRATIONS NO. 104 a1ld 105. PROPOSED WATERFRONT IMPROVEMENT. The sketch and diagram suggest how the waterfront could be improved-not for commercial shipping but for the rapidly increasing use of pleasure craft. The railway yards have been removed alld the City Hall park restored. A marina has been established on the shore line protected by a sea waN based 011 the Shoal Tmvpr
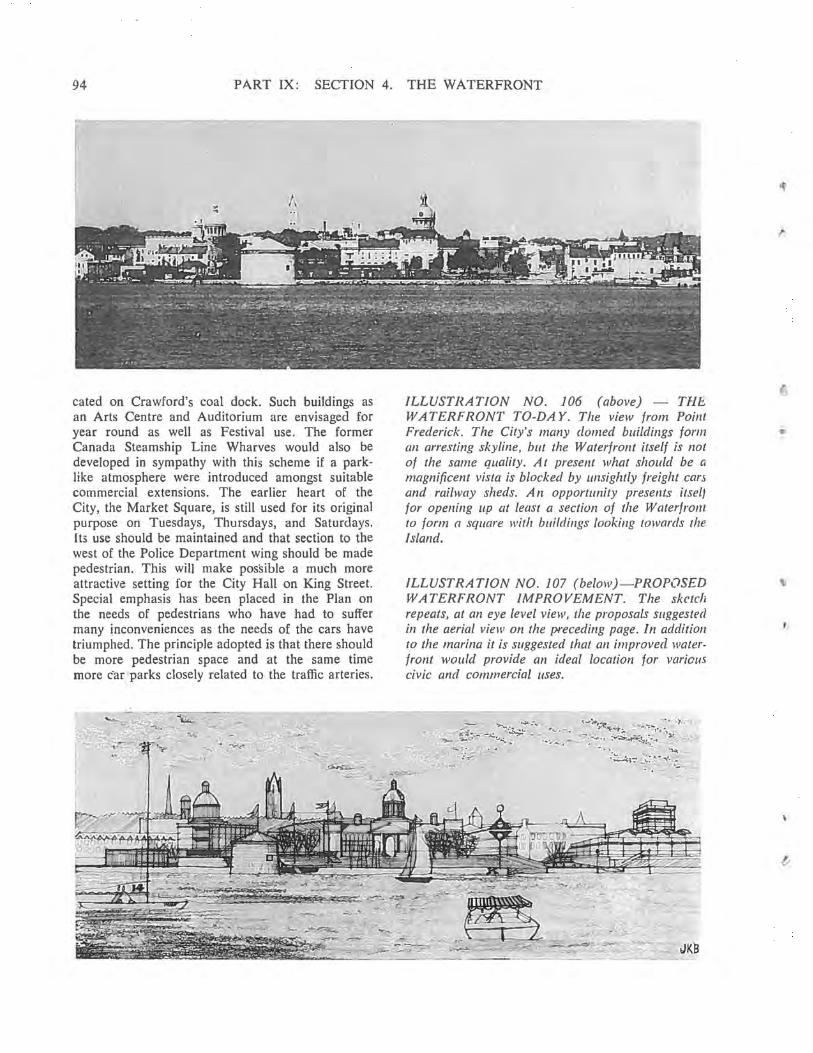
94 PART IX: SECTION 4. THE WATERFRONT
cated on Crawford's coal dock. Such buildings as an Arts Centre and Auditorium are envisaged for year round as well as Festival use. The former Canada Steamship Line Wharves would also be developed in sympathy with this scheme if a parklike atmosphere were introduced amongst suitable commercial extensions. The earlier heart of the City, the Market Square, is still used for its original purpose on Tuesdays, Thursdays, and Saturdays. Its use should be maintained and that section to the west of the Police Department wing should be made pedestrian. This will make possible a much more attractive setting for the City Hall on King Street. Special emphasis has been placed in the Plan on the needs of pedestrians who have had to suffer many inconveniences as the needs of the cars have triumphed. The principle adopted is that there should be more pedestrian space and at the same time more c"ar parks closely related to the traffic arteries.
ILLUSTRATION NO. 106 (above) - THt. WATERFRONT TO-DAY. The view from Poillt Frederick. The City's many domed buildings form an arresting skyline, but the Waterfrollt itself is not of the same quality. At present what should be a magnificent vista is blocked by unsightly freight car~ and railway sheds. A n opportunity presents itselJ for opening up at least a section of the Waterfrolll to form n square with buildings lookillg towards the Island.
ILLUSTRATION NO. 107 (below)-PROPOSED WATERFRONT IMPROVEMENT. The sketch repeats, at an eye level view, the proposals suggested in the aerial view on the preceding page. In additioll to the marina it is suggested that an improved waterfront would provide an ideal location for various civic and commercial uses.
" ".·.~~t- -.:::'~-:::>.::'~~ -~~:.:.:~~~~~:~~:;:: . ~~.~;~ ;:.~~ : -~:~ ~
" ' . . ..........
JKB
\
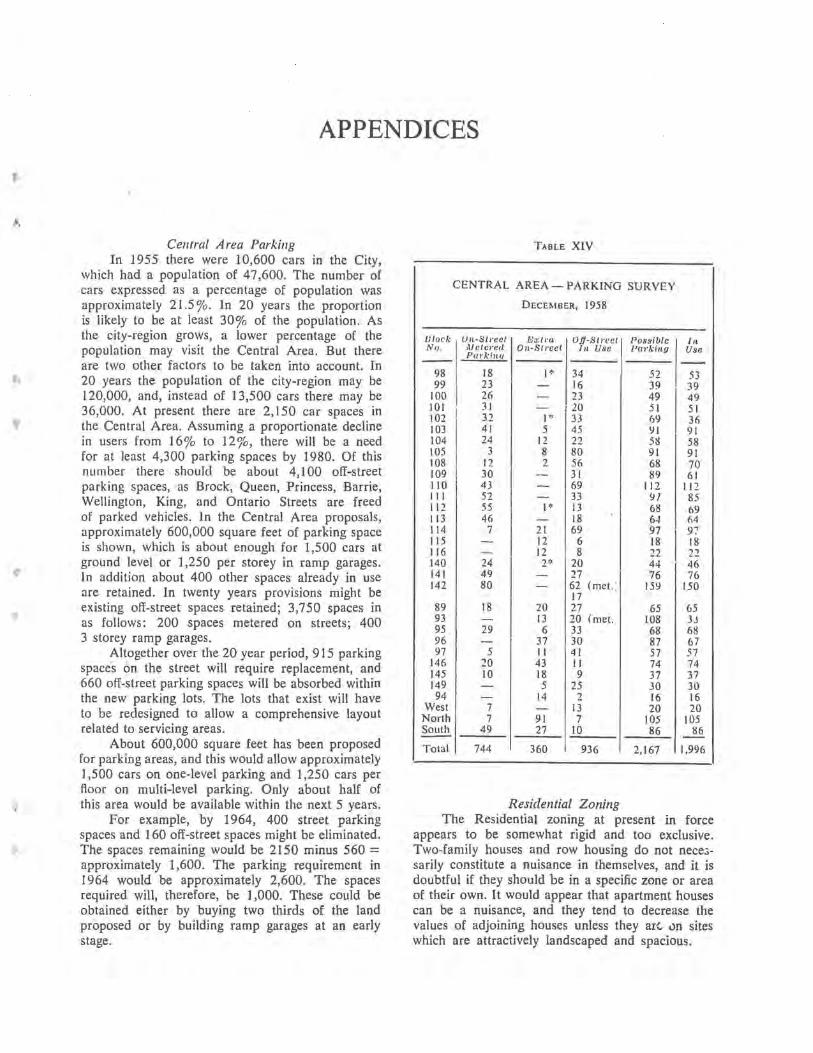
APPENDICES
Central A rea Parking In 1955 there were 10,600 cars in the City,
which had a population of 47,600. The number of cars expressed as a percentage of population was approximately 21.5 ro. In 20 years the proportion is likely to be at least 300/0 of the population. As the city-region grows, a lower percentage of the population may visit the Central Area. But there are two other factors to be taken into account. In 20 years the population of the city-region may be 120,000, and, instead of 13,500 cars there may be 36,000. At present there are 2,150 car spaces in the Central Area. Assuming a proportionate decline in users from 16 ro to 12 ~'o, there will be a need for at least 4,300 parking spaces by 1980. Of this number there should be about 4,100 off-street parking spaces, as Brock, Queen, Princess, Barrie, Wellington, King, and Ontario Streets are freed of parked vehicles. In the Central Area proposals, approximately 600,000 square feet of parking space is shown, which is about enough for 1,500 cars at ground level or 1,250 per storey in ramp garages. In addition about 400 other spaces already in use are retained. In twenty years provisions might be existing off-street spaces retained; 3,750 spaces in as follows: 200 spaces metered on streets; 400 3 storey ramp garages.
Altogether over the 20 year period, 915 parking spaces on the street will require replacement, and 660 off-street parking spaces will be absorbed within the new parking lots. The lots that exist will have to be redesigned to allow a comprehensive layout related to servicing areas.
About 600,000 square feet has been proposed for parking areas, and this would aIlow approximately 1,500 cars on one-level parking and 1,250 cars per floor on multi-level parking. Only about half of this area would be available within the next 5 years.
For example, by 1964, 400 street parking spaces and 160 off-street spaces might be eliminated. The spaces remaining would be 2150 minus 560 = approximately 1,600. The parking requirement in 1964 would be approximately 2,600. The spaces required will, therefore, be 1,000. These could be obtained either by buying two thirds of the land proposed or by building ramp garages at an early stage.
TABLE XIV
CENTRAL AREA - PARKING SURVEY
DECEMBER, 1958
lJlock Un-SII'eel Exll'lI Off-SII'eel Possible 1,1 Nu. MclCl"ell Oll-Streel In Use I'm'king Usa
P",'k ill I1 -- --98 18 I" 34 52 53 99 23 - 16 39 39
100 26 - 23 49 49 101 I
31 - 20 51 51 102 32 1* 33 69 36 103 41 5 45 ')1 91 104 24 12 22 58 58 105 3 8 80 91 91 108 12 2 56 68 70 109 30 - 31 89 61 110 43 - 69 112 112 III 52 - 33 91 85 112 55 1* 13 " I 68 69 113 46 - 18 64 M 114 7 21 69 97
I 97
115 - 12 6 18 18 116 - 12 8 22 2:! 140 24 2~' 20 44 46 141 49 - 27 76 76 142 80 - 62 (met.: IS') 150
17 89 18 20 27 65 65 93 - 13 20 (met. 108 33 95 29 6 33 68 68 96 - 37 30 87 67 97 5 11 41 57 57
146 20 43 I1 74 74 145 10 18 9 37 37 149 - 5 25 30 30 94 - 14 2 16 16
West 7 - 13 20 20 North 7 91 7 105 105 South 49 27 10 86 86
Total 744 360 936 2,167 1,996
Residential Zoning The Residential zoning at present in force
appears to be somewhat rigid and too exclusive. Two-family houses and row housing do not nece;;sarily constitute a nuisance in themselves, and it is doubtful if they should be in a specific zone or area of their own. It would appear that apartment houses can be a nuisance, and they tend to decrease the values of adjoining houses unless they arG un sites which are attractively landscaped and spacious.
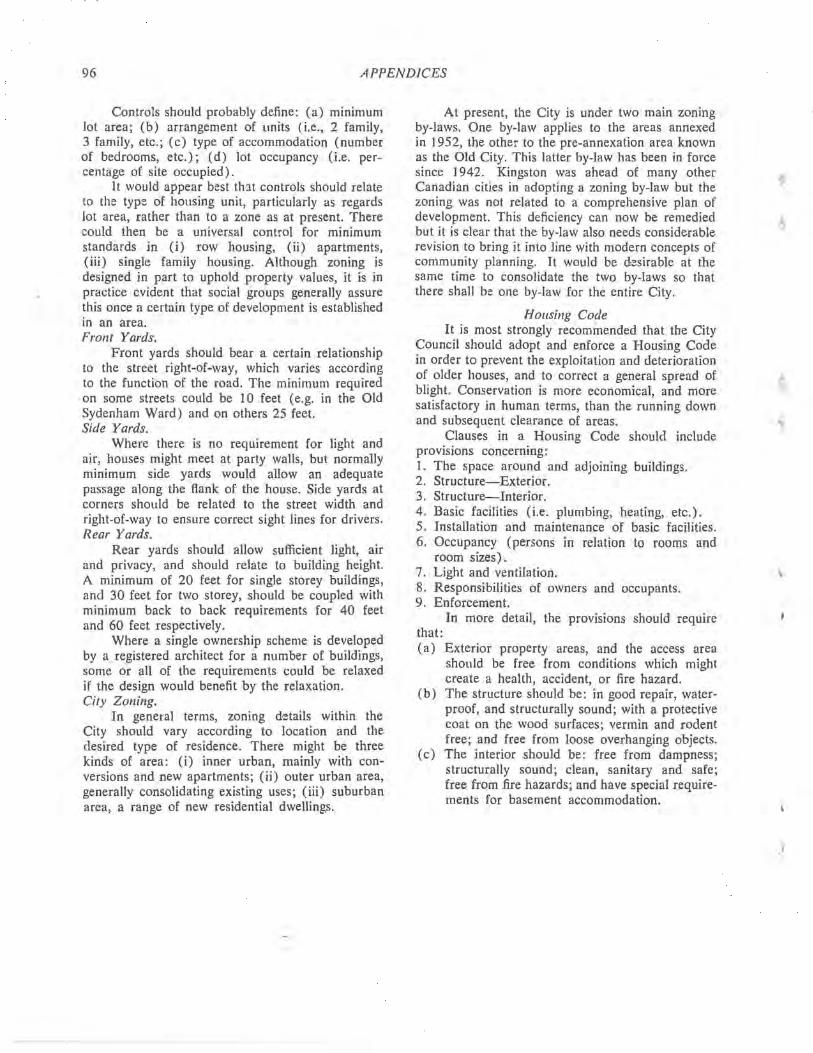
96 APPENDICES
Controls should probably define: (a) minimum lot area; (b) arrangement of units (i.e., 2 family, 3 family, etc.; (c) type of accommodation (number of bedrooms, etc.); (d) lot occupancy (i.e. percentage of site occupied).
It would appear best th:1t controls should relate to the type of housing unit, particularly as regards lot area, rather than to a zone as at present. There could then be a universal control for minimum standards in (i) row housing, (H) apartments, (iii) single family housing. Although zoning is designed in part to uphold property values, it is in practice evident that social groups generally assure this once a certain type of development is established in an area. Front Yards.
Front yards should bear a certain relationship to the street right-of-way, which varies according to the function of the road. The minimum required on some streets could be 10 feet (e.g. in the Old Sydenham Ward) and on others 25 feet. Side Yards.
Where there is no requirement for light and air, houses might meet at party walls, but normally minimum side yards would allow an adequate passage along the flank of the house. Side yards at corners should be related to the street width and right-of-way to ensure correct sight lines for drivers. Rear Yards.
Rear yards should allow sufficient light, air and privacy, and should relate to building height. A minimum of 20 feet for single storey buildings, and 30 feet for two storey, should be coupled with minimum back to back requirements for 40 feet and 60 feet respectively.
Where a single ownership scheme is developed by a registered architect for a number of buildings, some or all of the requirements could be relaxed if the design would benefit by the relaxation. City Zoning.
In general terms, zoning details within the City should vary according to location and the desired type of residence. There might be three kinds of area: (i) inner urban, mainly with conversions and new apartments; (ii) outer urban area, generally consolidating existing uses; (iii) suburban area, a range of new residential dwellings.
At present, the City is under two main zoning by-laws. One by-law applies to the areas annexed in 1952, the other to the pre-annexation area known as the Old City. This latter by-law has been in force since 1942. Kingston was ahead of many other Canadian cities in adopting a zoning by-law but the zoning was not related to a comprehensive plan of development. This deficiency can now be remedied but it is clear that the by-law also needs considerable revision to bring it into line with modern concepts of community planning. It would be desirable at the same time to consolidate the two by-laws so that there shall be one by-law for the entire City.
HOllsi1lg Code It is most strongly recommended that the City
Council should adopt and enforce a Housing Code in order to prevent the exploitation and deterioration of older houses, and to correct a general spread of blight. Conservation is more economical, and more satisfactory in human terms, than the running down and subsequent clearance of areas.
Clauses in a Housing Code should include provisions concerning: 1. The space around and adjoining buildings. 2. Structure-Exterior. 3. Structure-Interior. 4. Basic facilities (i.e. plumbing, heating, etc.). 5. Installation and maintenance of basic facilities. 6. Occupancy (persons in relation to rooms and
room sizes). 7. Light and ventilation. 8. Responsibilities of owners and occupants. 9. Enforcement.
In more detail, the provisions should require that: (a) Exterior property areas, and the access area
should be free from conditions which might create a health, accident, or fire hazard.
(b) The structure should be: in good repair, waterproof, and structurally sound; with a protective coat on the wood surfaces; vermin and rodent free; and free from loose overhanging objects.
(c) The interior should be: free from dampness; structurally sound; clean, sanitary and safe; free from fire hazards; and have special requirements for basement accommodation.
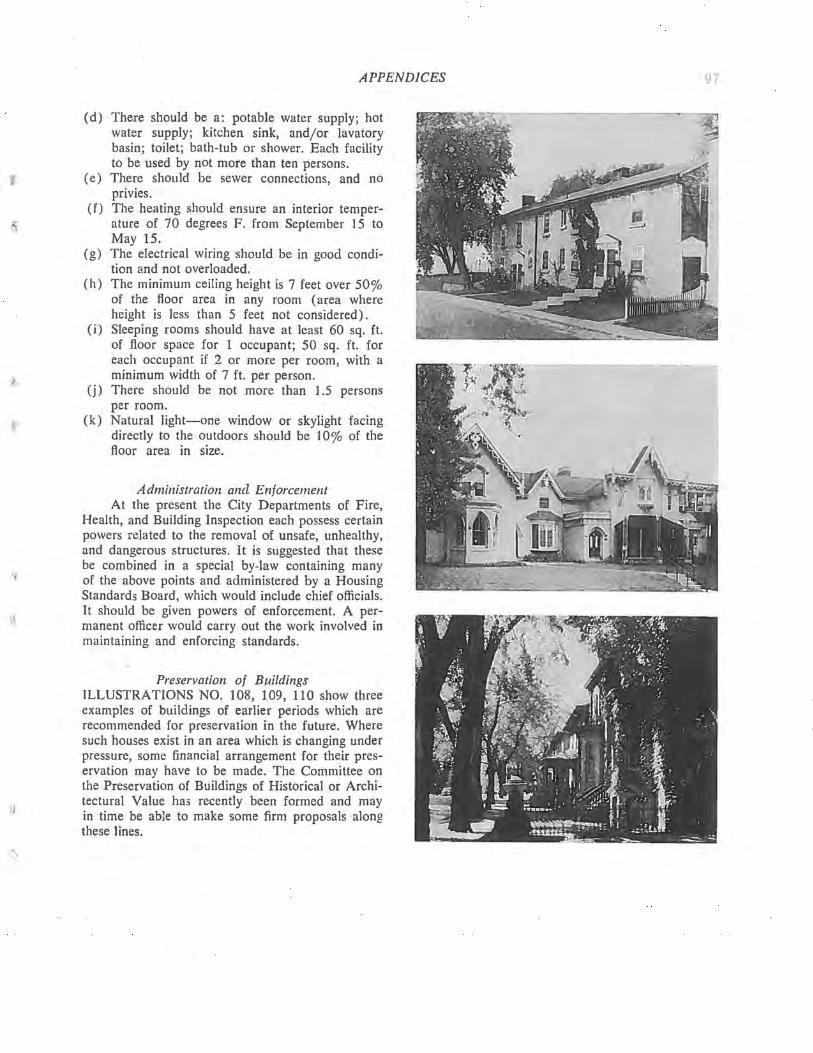
APPENDICES
(d) There should be a: potable water supply; hot water supply; kitchen sink, and/or lavatory basin; toilet; bath-tub or shower. Each facility to be used by not more than ten persons.
(e) There should be sewer connections, and no privies.
(f) The heating should ensure an interior temperature of 70 degrees F. from September IS to May 15.
(g) The electrical wiring should be in good condition and not overloaded.
(h) The minimum ceiling height is 7 feet over 50% of the floor area in any room (area where height is less than 5 feet not considered).
(i) Sleeping rooms should have at least 60 sq. ft. of floor space for 1 occupant; 50 sq. ft. for each occupant if 2 or more per room, with a minimum width of 7 ft. per person.
(j) There should be not more than 1.5 persons per room.
(k) Natural light-one window or skylight facing directly to the outdoors should be 10% of the floor area in size.
A dministration and Enforcement At the present the City Departments of Fire,
Health, and Building Inspection each possess certain powers related to the removal of unsafe, unhealthy, and dangerous structures. It is suggested that these be combined in a special by-law containing many of the above points and administered by a Housing Standards Board, which would include chief officials. It should be given powers of enforcement. A permanent officer would carry out the work involved in maintaining and enforcing standards.
Preservation of Buildings ILLUSTRATIONS NO. 108, 109, 110 show three examples of buildings of earlier periods which are recommended for preservation in the future. Where such houses exist in an area which is changing under pressure, some financial arrangement for their preservation may have to be made. The Committee on the Preservation of Buildings of Historical or Architectural Value has recently been formed and may in time be able to make some firm proposals along these lines.
97
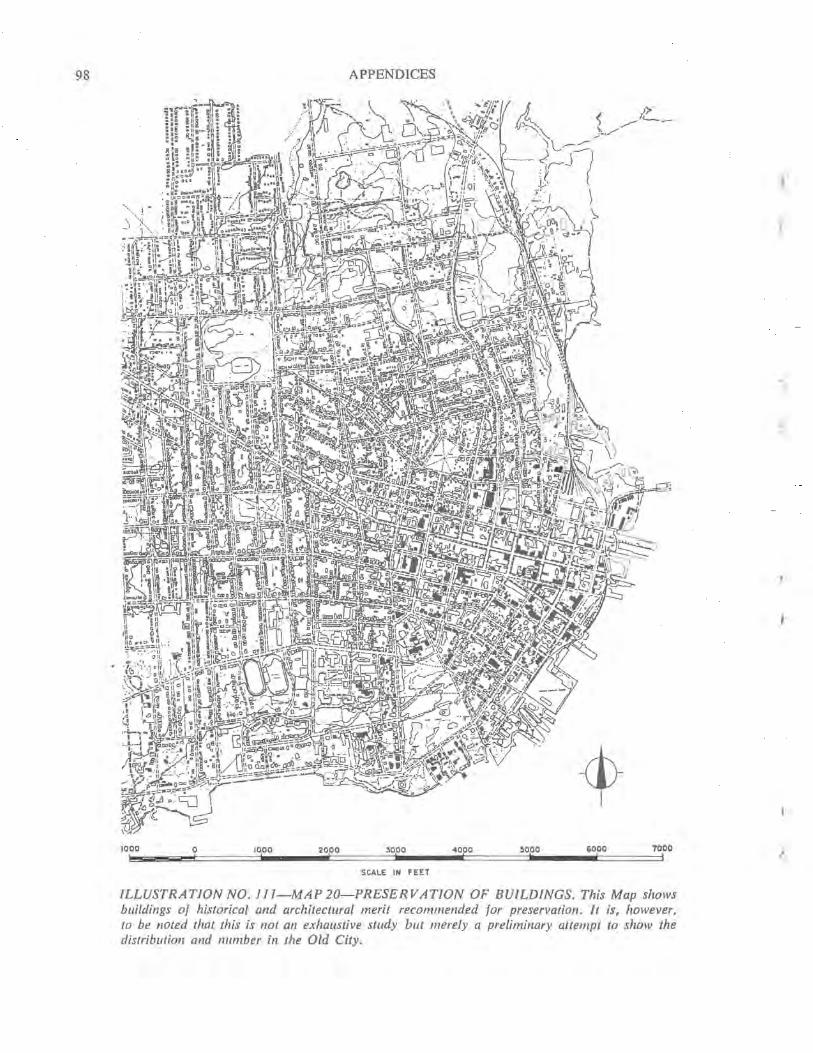
98
1000 o , 10.00
APPENDICES
30,00
SCALE IN FEET
.. 000 ,
4> ~OpO 6000 7000
: I
ILLUSTRATION NO. 111-MAP 20-PRESERV ATION OF BUILDINGS. This Map shows buildings of historical and architectural merit recommended for preservation. 1t is, however, to be noted that this is lIot an exhaustive study bllt merely a preliminary attempt to show the distribution and nllmber ill the Old City.
r
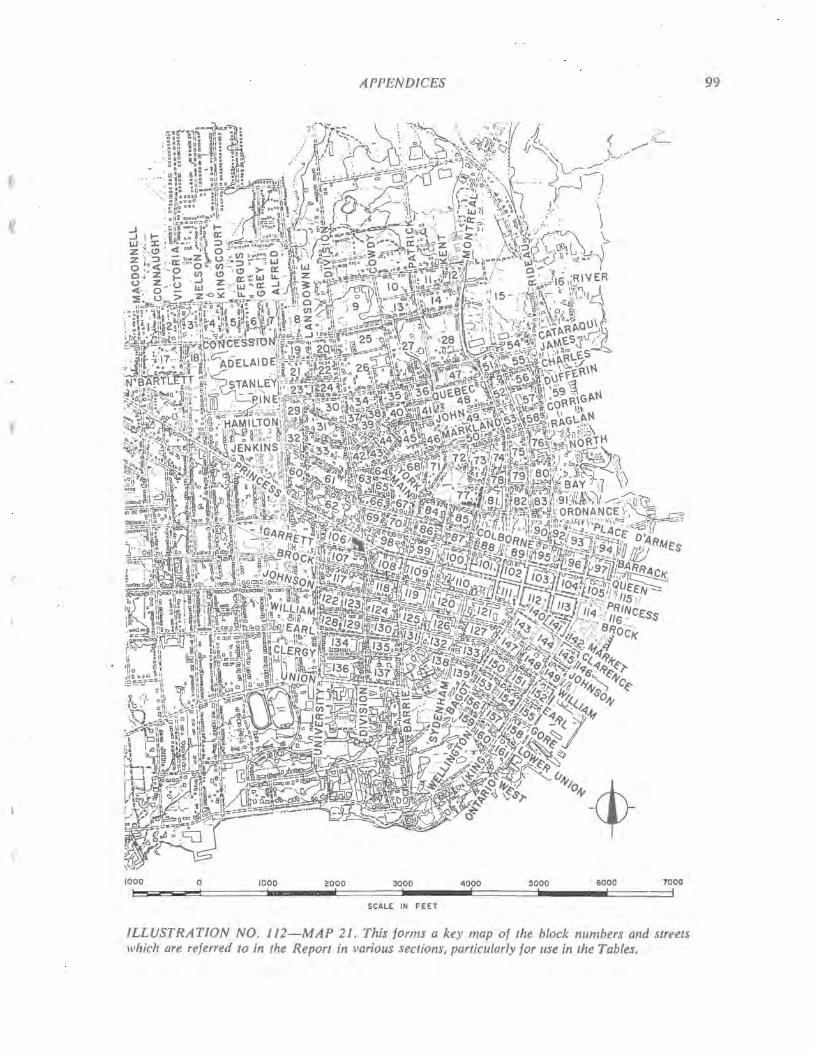
J
1000
b o
d 1000 . 2000 ....,
APPENDICES
3000 . SCALE IN FEET
4000 5000 6000 7000 . . ===i
ILLUSTRATION NO. JJ2-MAP 2J. This forms a key map of the block numbers and streets which are referred to in the Report in various sections, particularly for use in the Tables.
99
100
REGION l. H. Richards l. H. Meacham & Co. City Planni'1g Board, Kingston Chapman & Putnam Pat rick Abercrombie HISTORICAL REVIEW lames A. Roy Donald Creighton E. E. Horsey Agnes Machan Richard A. Preston STRUCTURE OF THE CITY Gordon Stephenson C.M.H.C. Dr. A. Rose M. Seymour I. MacGregor W. E. Ewens R. A. Low H. M. Edwards
OLD SYDENHAM WARD Detroit City Plan Commission Housing & Home Agency National Association of Real Estate Boards RIDEA U HEIGHTS
APPENDICES
SOME REFERENCES
Land Use, Pittsburgh Township, 1957 Illustrated Atlas, 1878 Population Report, Kingston 1954 The Physiography of Southern Ontario Greater London Plan
Kingston, the King's Town The Empire of the St. Lawrence History of Kingston A History of Old Kingston Kingston Before the War of 1812
A Redevelopment Study of Halifax Local Housing Conditions and Needs Report on Land Use and Zoning Population Study Public Transportation in Kingston, Ont. Traffic Survey of the City of Kingston Study of the Effect of Various EastWest Onc-Way Streets on the Flow of Traffic in Kingston
Neighbourhood Conservation-A Pilot
Kingston Toronto Kingston Toronto London
Toronto Toronto Unpub. Manuscript Toronto Toronto
Halifax, N.S. Ottawa Kingston Kingston OakvilIe Kingston
Kingston
Study Detroit Blueprint for Neighbourhood ·Conservation Washington
City of Kingston Planning Board Preliminary Report Housing Conditions, Ride-au Heights Kingston
WATERFRONT Urban Land Institute, Bulletin No. 14, ] 950 (C. A. Chaney) Marinas, their Planning & Development Washington ZONING City of Kingston City of Kingston HOUSING CODE National Research Council Urban Renewal Bulletin No. 3,1956 New York State Division of Housing & Housing & Home Finance Agency American Public Health Association on the Hygiene of Housing WiIliam Courage
PRESERVATION John Codman OTHER SOURCES
By-Law No. 3077 (formerly 184) Kingston By-Law No. 3078 (formerly 2082) Kingston
National Building Code Col. 1 to 111 Ottawa Provision of Housing Codes in Various American Cities Washington
Housing Codes-the Key to Housing Conservation New York An Appraisal Method for Measuring the Quality of Housing New York Report on the Housing Survey of the Central Area of Winnipeg Winnipeg
Preservation of Historic Districts Chicago
Dominion Bureau of Statistics Census of Canada ] 941, 195], 1956 Ottawa Might Directories Ltd. Kingston City Directory 1950 Toronto
1957 1878 1954 ]951 1944
1952 1956
1908 1959
1957 1955 1955 1957 1957 1942
1958
1958
1956
1957
1950
1959 1959
1941
1956
1958
1945
1955
1956
1950