Embed Size (px)
Citation preview
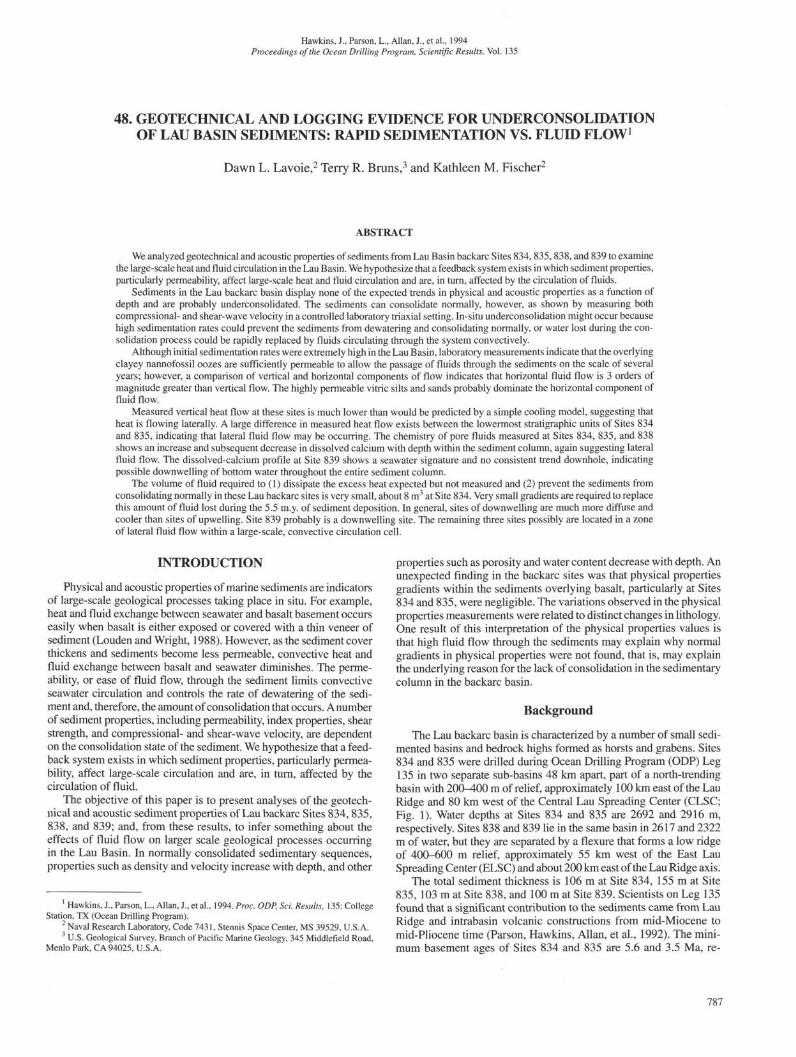
Hawkins, J., Parson, L., Allan, J., et al., 1994Proceedings of the Ocean Drilling Program, Scientific Results, Vol. 135
48. GEOTECHNICAL AND LOGGING EVIDENCE FOR UNDERCONSOLIDATIONOF LAU BASIN SEDIMENTS: RAPID SEDIMENTATION VS. FLUID FLOW1
Dawn L. Lavoie,2 Terry R. Binns,3 and Kathleen M. Fischer2
ABSTRACT
We analyzed geotechnical and acoustic properties of sediments from Lau Basin backarc Sites 834, 835,838, and 839 to examinethe large-scale heat and fluid circulation in the Lau Basin. We hypothesize that a feedback system exists in which sediment properties,particularly permeability, affect large-scale heat and fluid circulation and are, in turn, affected by the circulation of fluids.
Sediments in the Lau backarc basin display none of the expected trends in physical and acoustic properties as a function ofdepth and are probably underconsolidated. The sediments can consolidate normally, however, as shown by measuring bothcompressional- and shear-wave velocity in a controlled laboratory triaxial setting. In-situ underconsolidation might occur becausehigh sedimentation rates could prevent the sediments from dewatering and consolidating normally, or water lost during the con-solidation process could be rapidly replaced by fluids circulating through the system convectively.
Although initial sedimentation rates were extremely high in the Lau Basin, laboratory measurements indicate that the overlyingclayey nannofossil oozes are sufficiently permeable to allow the passage of fluids through the sediments on the scale of severalyears; however, a comparison of vertical and horizontal components of flow indicates that horizontal fluid flow is 3 orders ofmagnitude greater than vertical flow. The highly permeable vitric silts and sands probably dominate the horizontal component offluid flow.
Measured vertical heat flow at these sites is much lower than would be predicted by a simple cooling model, suggesting thatheat is flowing laterally. A large difference in measured heat flow exists between the lowermost stratigraphic units of Sites 834and 835, indicating that lateral fluid flow may be occurring. The chemistry of pore fluids measured at Sites 834, 835, and 838shows an increase and subsequent decrease in dissolved calcium with depth within the sediment column, again suggesting lateralfluid flow. The dissolved-calcium profile at Site 839 shows a seawater signature and no consistent trend downhole, indicatingpossible downwelling of bottom water throughout the entire sediment column.
The volume of fluid required to (1) dissipate the excess heat expected but not measured and (2) prevent the sediments fromconsolidating normally in these Lau backarc sites is very small, about 8 m3 at Site 834. Very small gradients are required to replacethis amount of fluid lost during the 5.5 m.y. of sediment deposition. In general, sites of downwelling are much more diffuse andcooler than sites of upwelling. Site 839 probably is a downwelling site. The remaining three sites possibly are located in a zoneof lateral fluid flow within a large-scale, convective circulation cell.
INTRODUCTION
Physical and acoustic properties of marine sediments are indicatorsof large-scale geological processes taking place in situ. For example,heat and fluid exchange between seawater and basalt basement occurseasily when basalt is either exposed or covered with a thin veneer ofsediment (Louden and Wright, 1988). However, as the sediment coverthickens and sediments become less permeable, convective heat andfluid exchange between basalt and seawater diminishes. The perme-ability, or ease of fluid flow, through the sediment limits convectiveseawater circulation and controls the rate of dewatering of the sedi-ment and, therefore, the amount of consolidation that occurs. A numberof sediment properties, including permeability, index properties, shearstrength, and compressional- and shear-wave velocity, are dependenton the consolidation state of the sediment. We hypothesize that a feed-back system exists in which sediment properties, particularly permea-bility, affect large-scale circulation and are, in turn, affected by thecirculation of fluid.
The objective of this paper is to present analyses of the geotech-nical and acoustic sediment properties of Lau backarc Sites 834, 835,838, and 839; and, from these results, to infer something about theeffects of fluid flow on larger scale geological processes occurringin the Lau Basin. In normally consolidated sedimentary sequences,properties such as density and velocity increase with depth, and other
Hawkins, J., Parson, L., Allan, J., et al., 1994. Proc. ODP, Sci. Results, 135: CollegeStation, TX (Ocean Drilling Program).
2 Naval Research Laboratory, Code 7431, Stennis Space Center, MS 39529, U.S.A.3 U.S. Geological Survey, Branch of Pacific Marine Geology, 345 Middlefield Road,
Menlo Park, CA 94025, U.S.A.
properties such as porosity and water content decrease with depth. Anunexpected finding in the backarc sites was that physical propertiesgradients within the sediments overlying basalt, particularly at Sites834 and 835, were negligible. The variations observed in the physicalproperties measurements were related to distinct changes in lithology.One result of this interpretation of the physical properties values isthat high fluid flow through the sediments may explain why normalgradients in physical properties were not found, that is, may explainthe underlying reason for the lack of consolidation in the sedimentarycolumn in the backarc basin.
Background
The Lau backarc basin is characterized by a number of small sedi-mented basins and bedrock highs formed as horsts and grabens. Sites834 and 835 were drilled during Ocean Drilling Program (ODP) Leg135 in two separate sub-basins 48 km apart, part of a north-trendingbasin with 200-400 m of relief, approximately 100 km east of the LauRidge and 80 km west of the Central Lau Spreading Center (CLSC;Fig. 1). Water depths at Sites 834 and 835 are 2692 and 2916 m,respectively. Sites 838 and 839 lie in the same basin in 2617 and 2322m of water, but they are separated by a flexure that forms a low ridgeof 400-600 m relief, approximately 55 km west of the East LauSpreading Center (ELSC) and about 200 km east of the Lau Ridge axis.
The total sediment thickness is 106 m at Site 834, 155 m at Site835, 103 m at Site 838, and 100 m at Site 839. Scientists on Leg 135found that a significant contribution to the sediments came from LauRidge and intrabasin volcanic constructions from mid-Miocene tomid-Pliocene time (Parson, Hawkins, Allan, et al., 1992). The mini-mum basement ages of Sites 834 and 835 are 5.6 and 3.5 Ma, re-
7X7

D.L. LAVOIE, T.R. BRUNS, K.M. FISCHER
Figure 1. Bathymetric map of the Lau Basin area showing the locations of Sites 834, 835, 838,and 839. Redrawn from Parson, Hawkins, Allan, et al. (1992). Central Lau (CLSC) and EasternLau (ELSC) spreading centers, Valu Fa (VF) Ridge, Tonga Trench, and Mangatolu TripleJunction (MTJ) are shown for reference. Contour intervals in kilometers.
spectively. The age of basement at Site 838 is at least 3 Ma, and atSite 839, 1.7 Ma. The sedimentation rates were extremely high duringperiods of intense volcanic activity from the late Miocene to the latePliocene, up to 383 mm/k.y. at Site 834 and 882 mm/k.y. at Site 839,when basalts and thick vitric ash beds were deposited. The cessationof volcanism at all sites was followed by an influx of volcanic silt,sand, and gravels; sedimentation rates were lower from this periodduring the late Pliocene to the Quaternary, between 38 and 9 mm/k.y.
The sediments found at the four sites are predominantly clayeynannofossil oozes, clayey nannofossil mixed sediments, and volcanicsilts and sands. Modes of deposition were pelagic, turbiditic, anddebris flows. The volcaniclastic sediments are mainly epiclastic andpredominantly mass-flow deposits (e.g., turbidites). The larger sizefraction is composed of fibrous pumice shards with elongated tubularvesicles. All are enriched with vitric shards.
METHODS
Physical properties analyses made on board the JOIDES Resolutioninclude gamma-ray attenuation porosity evaluator (GRAPE) densitymeasurements; P-wave logger compressional-wave velocity measure-
ments; index properties measurements, including water content, poros-ity, void ratio, and wet-bulk density; thermal conductivity and down-hole temperature measurements using the ODP temperature probe;and compressional-wave velocity measurements using the HamiltonFrame device. These measurements, with the exception of the down-hole temperature measurements, were made at ambient laboratorypressures after the cores had equilibrated (Parson, Hawkins, Allan, etal., 1992, pp. 49-79).
Onshore, eight samples from Sites 834, 835, 838, and 839 werereconsolidated to estimated in-situ pressures in a triaxial apparatus inwhich the stresses in all three planes could be controlled. Compres-sional- and shear-wave velocities were measured continuously duringthe process of consolidation. Permeability was measured after pri-mary consolidation was complete by using a constant-head perme-ability technique (Lambe, 1951). The samples were consolidated toan estimated additional 50-mbsf in-situ stress, and the same measure-ments were repeated. Two additional samples were consolidated in anodometer, and permeability was measured after each load using afalling-head permeameter (Lambe, 1951).
The lower parts of these holes were logged by personnel fromLamont-Doherty Earth Observatory, Columbia University, during
RAPID SEDIMENTATION VS. FLUID FLOW
Leg 135 using standard downhole logging techniques (Parson,Hawkins, Allan, et al., 1992). Compressional-wave velocity resultswere smoothed over approximately 0.3-m intervals by using a 15-point running average.
RESULTS
Index Properties
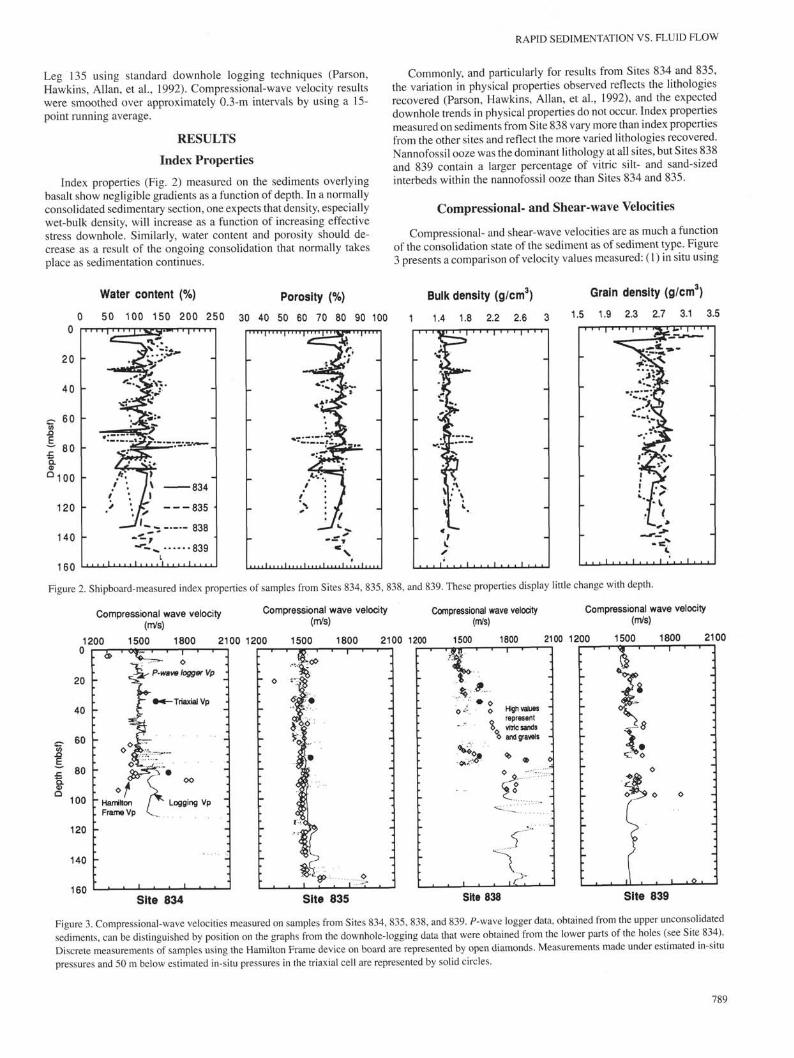
Index properties (Fig. 2) measured on the sediments overlyingbasalt show negligible gradients as a function of depth. In a normallyconsolidated sedimentary section, one expects that density, especiallywet-bulk density, will increase as a function of increasing effectivestress downhole. Similarly, water content and porosity should de-crease as a result of the ongoing consolidation that normally takesplace as sedimentation continues.
Commonly, and particularly for results from Sites 834 and 835,the variation in physical properties observed reflects the lithologiesrecovered (Parson, Hawkins, Allan, et al., 1992), and the expecteddownhole trends in physical properties do not occur. Index propertiesmeasured on sediments from Site 838 vary more than index propertiesfrom the other sites and reflect the more varied lithologies recovered.Nannofossil ooze was the dominant lithology at all sites, but Sites 838and 839 contain a larger percentage of vitric silt- and sand-sizedinterbeds within the nannofossil ooze than Sites 834 and 835.
Compressional- and Shear-wave Velocities
Compressional- and shear-wave velocities are as much a functionof the consolidation state of the sediment as of sediment type. Figure3 presents a comparison of velocity values measured: (1) in situ using
Water content (%)
50 100 150 200 250
Porosity (%)
30 40 50 60 70 80 90 100
Bulk density (g/cm3)
1.4 1.8 2.2 2.6 3
140
160
Grain density (g/cm )
1.5 1.9 2.3 2.7 3.1 3.5
Figure 2. Shipboard-measured index properties of samples from Sites 834, 835, 838, and 839. These properties display little change with depth.
Compressional wave velocity(m/s)
Compressional wave velocity(m/s)
Compressional wave velocity(m/s)
Compressional wave velocity(m/s)
1200
20 -
40 -
60 -
80 -
100 -
120 -
140 -
160
1500 1800 2100 1200 1500 1800 2100 1200
ó
J‰, P-wavβ logger Vp
f - <-TriaxialVp
• pf•'• "f X" Hamilton / ^. Frame Vp v _
oo
Logging Vp "
-
!00 1500
%:*
: 7 oO = : O. . . ^
-
•
1800 21
High values -
represent '
. vitric sands
0 and gravels -
^i.'
5*"":i C'~. .
2100 1200 1500 1800 2100
Site 834 Site 835 Site 838 Site 839
Figure 3. Compressional-wave velocities measured on samples from Sites 834, 835, 838, and 839. P-wave logger data, obtained from the upper unconsolidated
sediments, can be distinguished by position on the graphs from the downhole-logging data that were obtained from the lower parts of the holes (see Site 834).
Discrete measurements of samples using the Hamilton Frame device on board are represented by open diamonds. Measurements made under estimated in-situ
pressures and 50 m below estimated in-situ pressures in the triaxial cell are represented by solid circles.
789
D.L. LAVOIE, T.R. BRUNS, K.M. FISCHER
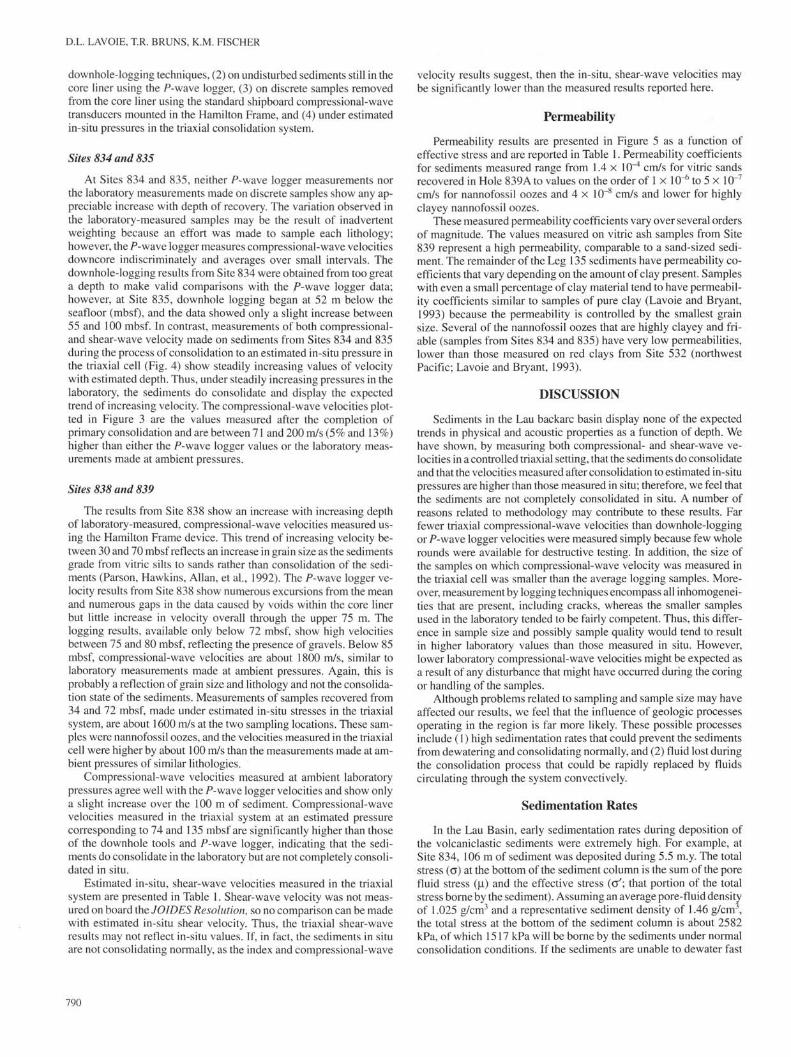
downhole-logging techniques, (2) on undisturbed sediments still in thecore liner using the P-wave logger, (3) on discrete samples removedfrom the core liner using the standard shipboard compressional-wavetransducers mounted in the Hamilton Frame, and (4) under estimatedin-situ pressures in the triaxial consolidation system.
Sites 834 and 835
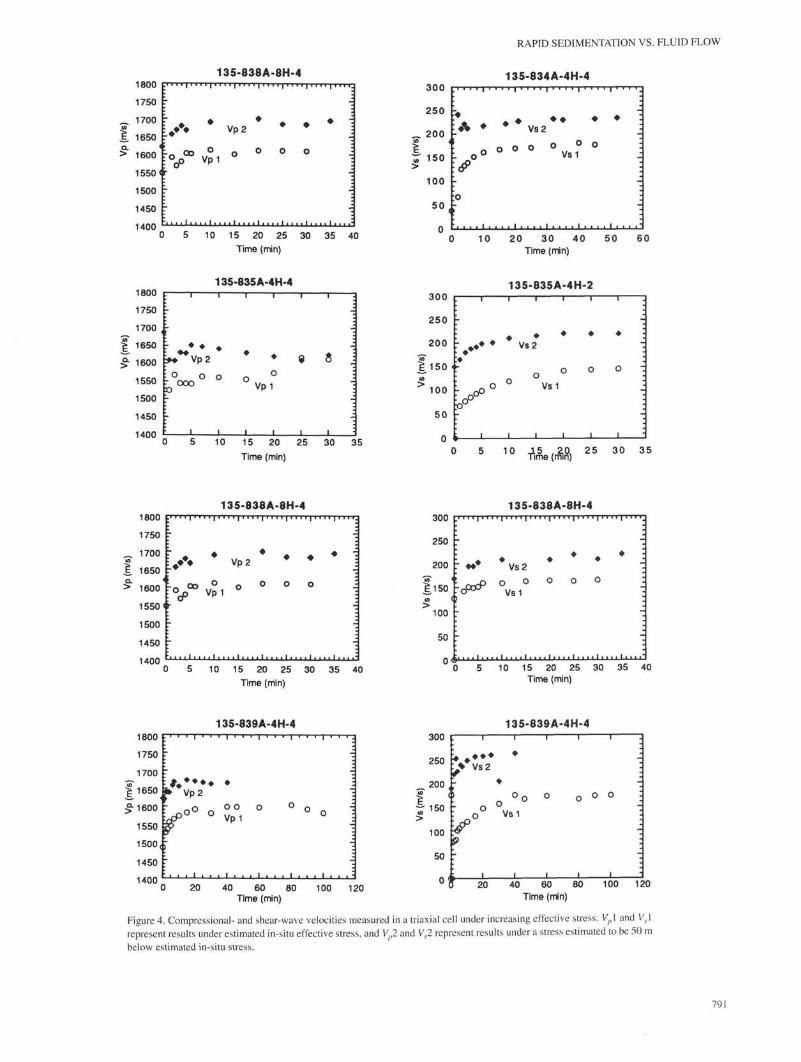
At Sites 834 and 835, neither P-wave logger measurements northe laboratory measurements made on discrete samples show any ap-preciable increase with depth of recovery. The variation observed inthe laboratory-measured samples may be the result of inadvertentweighting because an effort was made to sample each lithology;however, the P-wave logger measures compressional-wave velocitiesdowncore indiscriminately and averages over small intervals. Thedownhole-logging results from Site 834 were obtained from too greata depth to make valid comparisons with the P-wave logger data;however, at Site 835, downhole logging began at 52 m below theseafloor (mbsf), and the data showed only a slight increase between55 and 100 mbsf. In contrast, measurements of both compressional-and shear-wave velocity made on sediments from Sites 834 and 835during the process of consolidation to an estimated in-situ pressure inthe triaxial cell (Fig. 4) show steadily increasing values of velocitywith estimated depth. Thus, under steadily increasing pressures in thelaboratory, the sediments do consolidate and display the expectedtrend of increasing velocity. The compressional-wave velocities plot-ted in Figure 3 are the values measured after the completion ofprimary consolidation and are between 71 and 200 m/s (5% and 13%)higher than either the P-wave logger values or the laboratory meas-urements made at ambient pressures.
Sites 838 and 839
The results from Site 838 show an increase with increasing depthof laboratory-measured, compressional-wave velocities measured us-ing the Hamilton Frame device. This trend of increasing velocity be-tween 30 and 70 mbsf reflects an increase in grain size as the sedimentsgrade from vitric silts to sands rather than consolidation of the sedi-ments (Parson, Hawkins, Allan, et al., 1992). The P-wave logger ve-locity results from Site 838 show numerous excursions from the meanand numerous gaps in the data caused by voids within the core linerbut little increase in velocity overall through the upper 75 m. Thelogging results, available only below 72 mbsf, show high velocitiesbetween 75 and 80 mbsf, reflecting the presence of gravels. Below 85mbsf, compressional-wave velocities are about 1800 m/s, similar tolaboratory measurements made at ambient pressures. Again, this isprobably a reflection of grain size and lithology and not the consolida-tion state of the sediments. Measurements of samples recovered from34 and 72 mbsf, made under estimated in-situ stresses in the triaxialsystem, are about 1600 m/s at the two sampling locations. These sam-ples were nannofossil oozes, and the velocities measured in the triaxialcell were higher by about 100 m/s than the measurements made at am-bient pressures of similar lithologies.
Compressional-wave velocities measured at ambient laboratorypressures agree well with the P-wave logger velocities and show onlya slight increase over the 100 m of sediment. Compressional-wavevelocities measured in the triaxial system at an estimated pressurecorresponding to 74 and 135 mbsf are significantly higher than thoseof the downhole tools and P-wave logger, indicating that the sedi-ments do consolidate in the laboratory but are not completely consoli-dated in situ.
Estimated in-situ, shear-wave velocities measured in the triaxialsystem are presented in Table 1. Shear-wave velocity was not meas-ured on board the JOIDES Resolution, so no comparison can be madewith estimated in-situ shear velocity. Thus, the triaxial shear-waveresults may not reflect in-situ values. If, in fact, the sediments in situare not consolidating normally, as the index and compressional-wave
velocity results suggest, then the in-situ, shear-wave velocities maybe significantly lower than the measured results reported here.
Permeability
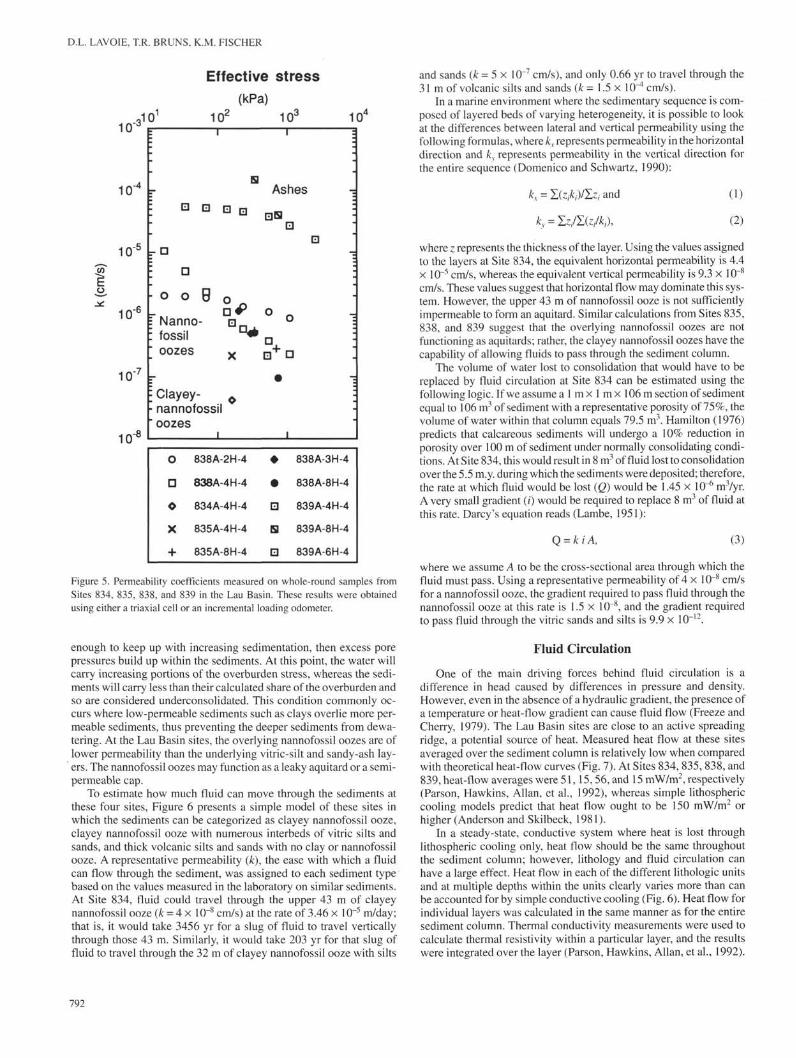
Permeability results are presented in Figure 5 as a function ofeffective stress and are reported in Table 1. Permeability coefficientsfor sediments measured range from 1.4 × lO~4 cm/s for vitric sandsrecovered in Hole 839A to values on the order of 1 × I0"6 to 5 × I0"7
cm/s for nannofossil oozes and 4 × I0"8 cm/s and lower for highlyclayey nannofossil oozes.
These measured permeability coefficients vary over several ordersof magnitude. The values measured on vitric ash samples from Site839 represent a high permeability, comparable to a sand-sized sedi-ment. The remainder of the Leg 135 sediments have permeability co-efficients that vary depending on the amount of clay present. Sampleswith even a small percentage of clay material tend to have permeabil-ity coefficients similar to samples of pure clay (Lavoie and Bryant,1993) because the permeability is controlled by the smallest grainsize. Several of the nannofossil oozes that are highly clayey and fri-able (samples from Sites 834 and 835) have very low permeabilities,lower than those measured on red clays from Site 532 (northwestPacific; Lavoie and Bryant, 1993).
DISCUSSION
Sediments in the Lau backarc basin display none of the expectedtrends in physical and acoustic properties as a function of depth. Wehave shown, by measuring both compressional- and shear-wave ve-locities in a controlled triaxial setting, that the sediments do consolidateand that the velocities measured after consolidation to estimated in-situpressures are higher than those measured in situ; therefore, we feel thatthe sediments are not completely consolidated in situ. A number ofreasons related to methodology may contribute to these results. Farfewer triaxial compressional-wave velocities than downhole-loggingor P-wave logger velocities were measured simply because few wholerounds were available for destructive testing. In addition, the size ofthe samples on which compressional-wave velocity was measured inthe triaxial cell was smaller than the average logging samples. More-over, measurement by logging techniques encompass all inhomogenei-ties that are present, including cracks, whereas the smaller samplesused in the laboratory tended to be fairly competent. Thus, this differ-ence in sample size and possibly sample quality would tend to resultin higher laboratory values than those measured in situ. However,lower laboratory compressional-wave velocities might be expected asa result of any disturbance that might have occurred during the coringor handling of the samples.
Although problems related to sampling and sample size may haveaffected our results, we feel that the influence of geologic processesoperating in the region is far more likely. These possible processesinclude (1) high sedimentation rates that could prevent the sedimentsfrom dewatering and consolidating normally, and (2) fluid lost duringthe consolidation process that could be rapidly replaced by fluidscirculating through the system convectively.
Sedimentation Rates
In the Lau Basin, early sedimentation rates during deposition ofthe volcaniclastic sediments were extremely high. For example, atSite 834, 106 m of sediment was deposited during 5.5 m.y. The totalstress (σ) at the bottom of the sediment column is the sum of the porefluid stress (µ) and the effective stress (σ'; that portion of the totalstress borne by the sediment). Assuming an average pore-fluid densityof 1.025 g/cm3 and a representative sediment density of 1.46 g/cm3,the total stress at the bottom of the sediment column is about 2582kPa, of which 1517 kPa will be borne by the sediments under normalconsolidation conditions. If the sediments are unable to dewater fast
790
135-838A-8H-41800
1750
Λ 1700
J. 1650
> 1600 r
1550<r
1500
1450
1400
[y*
r
-
Φ
OVp1
Vp2
o o
Φ
O
'– Φ
- *
O
10 15 20 25 30 35 40
Time (min)
135-835 A-4H-4
RAPID SEDIMENTATION VS. FLUID FLOW
135-834A-4H-4
10 20 30 40 50 60Time (min)
10 15 20 25 30 35
Time (min)
300
250
200
I . 1 5 0 r> 100
50
0
p
>
Φ Φ
O
135-835A-4H
Φ Φ
Vs 2
o °0 V.1
• i i
-2
*
o
i
* j
o -
-
5 1 0 T̂ me(m1n0) 2 5 3 0 3 5
1 3 5 - 8 3 8 A-8H-4 135-838A-8H-41800
1750
_ 1700
1 . 1650
> 1600
1550<r
1500
1450
1400
Vp2
OVp
* *
o o o
10 15 20 25 30 35 40
Time (min)
5 10 15 20 25 30 35 40Time (min)
135-839 A-4H-4 135-839A-4H-4
40 60 80Time (min)
100 120 40 60 80Time (min)
100 120
Figure 4. Compressional- and shear-wave velocities measured in a triaxial cell under increasing effective stress. Vp\ and Vvl
represent results under estimated in-situ effective stress, and Vp2 and VS2 represent results under a stress estimated to be 50 m
below estimated in-situ stress.
791
D.L. LAVOIE, T.R. BRUNS, K.M. FISCHER
Effective stress
(kPa)
JO10' 3 r
10' 10s10"
10*
10"6 \r
10-8
I I
B
" Ul Q HI n
r B
π
: o o g o
FNanno- π: fossil ^; oozes x
: Clayey- o
• nannofossil"oozes
O 838A-2H-4
D 838A-4H-4
O 834A-4H-4
X 835A-4H-4
+ 835A-8H-4
Ashes -=
Q B
Ü
•
D
B
B
BB
i
•
o 1
D
838A-3H-4
838A-8H-4
839A-4H-4
839A-8H-4
839A-6H-4
Figure 5. Permeability coefficients measured on whole-round samples fromSites 834, 835, 838, and 839 in the Lau Basin. These results were obtainedusing either a triaxial cell or an incremental loading odometer.
enough to keep up with increasing sedimentation, then excess porepressures build up within the sediments. At this point, the water willcarry increasing portions of the overburden stress, whereas the sedi-ments will carry less than their calculated share of the overburden andso are considered underconsolidated. This condition commonly oc-curs where low-permeable sediments such as clays overlie more per-meable sediments, thus preventing the deeper sediments from dewa-tering. At the Lau Basin sites, the overlying nannofossil oozes are oflower permeability than the underlying vitric-silt and sandy-ash lay-ers. The nannofossil oozes may function as a leaky aquitard or a semi-permeable cap.
To estimate how much fluid can move through the sediments atthese four sites, Figure 6 presents a simple model of these sites inwhich the sediments can be categorized as clayey nannofossil ooze,clayey nannofossil ooze with numerous interbeds of vitric silts andsands, and thick volcanic silts and sands with no clay or nannofossilooze. A representative permeability (k), the ease with which a fluidcan flow through the sediment, was assigned to each sediment typebased on the values measured in the laboratory on similar sediments.At Site 834, fluid could travel through the upper 43 m of clayeynannofossil ooze (k = A× 1CT8 cm/s) at the rate of 3.46 × I0'5 m/day;that is, it would take 3456 yr for a slug of fluid to travel verticallythrough those 43 m. Similarly, it would take 203 yr for that slug offluid to travel through the 32 m of clayey nannofossil ooze with silts
and sands (k = 5 × 10 7 cm/s), and only 0.66 yr to travel through the31 m of volcanic silts and sands (k= 1.5 × I0"4 cm/s).
In a marine environment where the sedimentary sequence is com-posed of layered beds of varying heterogeneity, it is possible to lookat the differences between lateral and vertical permeability using thefollowing formulas, where kx represents permeability in the horizontaldirection and ky represents permeability in the vertical direction forthe entire sequence (Domenico and Schwartz, 1990):
kx = Z, and (I)
(2)
where z represents the thickness of the layer. Using the values assignedto the layers at Site 834, the equivalent horizontal permeability is 4.4× I0"5 cm/s, whereas the equivalent vertical permeability is 9.3 × I0"8
cm/s. These values suggest that horizontal flow may dominate this sys-tem. However, the upper 43 m of nannofossil ooze is not sufficientlyimpermeable to form an aquitard. Similar calculations from Sites 835,838, and 839 suggest that the overlying nannofossil oozes are notfunctioning as aquitards; rather, the clayey nannofossil oozes have thecapability of allowing fluids to pass through the sediment column.
The volume of water lost to consolidation that would have to bereplaced by fluid circulation at Site 834 can be estimated using thefollowing logic. If we assume a 1 m × 1 m × 106 m section of sedimentequal to 106 m3 of sediment with a representative porosity of 75%, thevolume of water within that column equals 79.5 m3. Hamilton (1976)predicts that calcareous sediments will undergo a 10% reduction inporosity over 100 m of sediment under normally consolidating condi-tions. At Site 834, this would result in 8 m3 of fluid lost to consolidationover the 5.5 m.y. during which the sediments were deposited; therefore,the rate at which fluid would be lost ( 0 would be 1.45 × I0"6 nrVyr.A very small gradient (/) would be required to replace 8 m3 of fluid atthis rate. Darcy's equation reads (Lambe, 1951):
Q = kiA, (3)
where we assume A to be the cross-sectional area through which thefluid must pass. Using a representative permeability of 4 × I0"8 cm/sfor a nannofossil ooze, the gradient required to pass fluid through thenannofossil ooze at this rate is 1.5 × I0"8, and the gradient requiredto pass fluid through the vitric sands and silts is 9.9 × I01 2 .
Fluid Circulation
One of the main driving forces behind fluid circulation is adifference in head caused by differences in pressure and density.However, even in the absence of a hydraulic gradient, the presence ofa temperature or heat-flow gradient can cause fluid flow (Freeze andCherry, 1979). The Lau Basin sites are close to an active spreadingridge, a potential source of heat. Measured heat flow at these sitesaveraged over the sediment column is relatively low when comparedwith theoretical heat-flow curves (Fig. 7). At Sites 834, 835, 838, and839, heat-flow averages were 51, 15, 56, and 15 mW/m2, respectively(Parson, Hawkins, Allan, et al., 1992), whereas simple lithosphericcooling models predict that heat flow ought to be 150 mW/m2 orhigher (Anderson and Skilbeck, 1981).
In a steady-state, conductive system where heat is lost throughlithospheric cooling only, heat flow should be the same throughoutthe sediment column; however, Hthology and fluid circulation canhave a large effect. Heat flow in each of the different lithologic unitsand at multiple depths within the units clearly varies more than canbe accounted for by simple conductive cooling (Fig. 6). Heat flow forindividual layers was calculated in the same manner as for the entiresediment column. Thermal conductivity measurements were used tocalculate thermal resistivity within a particular layer, and the resultswere integrated over the layer (Parson, Hawkins, Allan, et al., 1992).
792

RAPID SEDIMENTATION VS. FLUID FLOW
Table 1. Geotechnical properties of samples from Sites 834, 835,838, and 839 in the Lau Basin.
Core, section,interval (cm)
135-834A-4H-4, 135-140
9H-4, 135-140
135-835 A-4H-4, 135-140
8H-4, 135-140
135-838A-2H-4, 135-140
3H-4, 135-140
4H-4, 135-140
8H-4, 135-140
135-839A-4H-4, 135-140
8H-4, 135-140
Recoverydepth
(mbsf)
34.35
81.85
34.35
72.35
9.55
24.85
28.55
72.35
29.35
67.35
Estimateddepth(mbsf)
37.1170.8058.31
118.65
37.97
98.12
75.42145.77
—
_60.2480.55—
73.81134.84
38.87
129.8773.82
151.02
vp(tri axial)
(m/s)
162017101700
—
1570
1650
15501575
—
_
1630NC—
16101690
1600
1670TF
16)0
V,(triaxial)
(m/s)
170230140
160
145
220
160240
75d
_215NC
99d
_160210
165
2601550TF
yp
(laboratory)(m/s)
1500a
1500
—
1465
—
1479—
1480
_
1600
1520
_1800—
1525
1550—
vp(logging)
(m/s)
1600b
1600
—
1525C
—
1520—
NA
NA
NA
_
2200-23001800e
1525?
1525—
vp(P-wave log)
(m/s)
15001500NA
—
1500 avg.
(variation:glass)15001500
1450
150015001500
15001500
1525g
1525—
*(cm/s)
4.18 × 18~8
TS
—
2.18 × I0"7
—
5.55 × I0"7
2.82 × I0"7
1.95 × I0"6
1.14 × I0"6
4.96 × I0"7
1.10 × I0"10
_
5.08 × I0"7
9.50 × I0"8
7.37 × I0"7
2.18 × I0"7
1.50 × 10""*3.99 × I0"5
w(%)
103.488.7
134.0
108.0
106.0
84.0
97.190.1
126.9
79.6142.1128.3123.6
77.494.775.0
111.1
102.180.877.4
P ,(g/cm3)
1.441.491.35
1.43
1.43
1.52
1.461.49
1.39
1.521.341.381.39
1.521.471.56
1.42
1.441.471.50
n(%)
737078
75
74
69
7270
78
67797777
677267
75
736665
e
2.752.363.49
2.93
2.80
2.26
2.542.38
3.47
2.053.683.403.32
1.972.512.00
2.96
2.651.921.88
G(g/cm3)
2.652.662.59
2.69
2.63
2.69
2.622.64
2.73
2.572.592.652.69
2.552.652.67
2.66
2.592.382.43
Lithology
Clayey nannofossil ooze
Dry friable nannofossilooze
Vitric glass particles withinclayey nannofossil ooze
Friable nannofossil ooze
Nannofossil ooze
Nannofossil ooze
Nannofossil ooze
Nannofossil ooze withvitric sand and gravel
Vitric sands with somenannofossil ooze
Vitric silt and sand
Notes: Abbreviations are as follows: Vp = compressional-wave velocity, Vs = shear-wave velocity, k = permeability coefficient, w = water content, p = wet-bulk density, n = porosity, e = void ratio, Gspecific gravity, NA = not available, avg. = average, NC no change, TS = too slow to measure, and TF = too fast to measure.
a Average value, 0-80 mbsf.b Average value, 80-100 mbsf.c Average value, 50-75 mbsf.d Measurement obtained with Hamilton Frame device.e Average value at 95 mbsf.f Average value, 150-160 mbsf.8 Average value, no gradient.
Site 834 Site 835 Site 838 Site 839
&
u
43
75
106
293
432
50.8 mW/m2
;51.5mW/m2
::47.θ'mW/m2
128
13.5 mW/m2
20.0 mW/m2
4.6 mW/m2
16.7mW/m2
21.2mW/m2
9.3 mW/m2
:70.8mW/m2
2326
60.1 mW/m2
60.3 mW/m2
58.5 mW/m2
53.3 mW/m2j
18
30
55
4.87 mW/m2
14.49 mW/m;
3.08rnW/m2
6.17 mW/m2
213
Clayeynannofossilooze
Clayeynannofossilooze with silts andsands
k = 4.0 x 10 "8m/s
Thick volcanicsilts and sands
= 5.0xl0"7m/s k = 1.5 x 10'4m/s
Basalt Sandstone
Figure 6. Schematic representation of a model for fluid flow through simplified sections representing Sites 834, 835,838, and 839 (not to scale).
793

D.L. LAVOIE, T.R. BRUNS, K.M. FISCHER
200
150
l | , o .X ^ 50
1I
• *\
\• \
s
*%»I
t
NS
H
9
t
1 * ** —
•••
Crozet BasinMadagascar BasinLau Basin (*)
• t
~ ~ —
10 20 30 40 50
Age (m.y.)60 70 80
Figure 7. Heat flow vs. crustal age. The dashed line represents heat flow cal-culated from simple lithospheric cooling. The small circles represent measureddata from the Crozet and Madagascar basins (after Anderson and Skilbeck,1981). The Lau Basin data points are represented by asterisks.
When the resulting thermal resistance is plotted vs. the temperaturemeasurements from the layer, the slope of the regression line is equalto the heat flow within that layer.
The calculated heat flow for the various layers and within some ofthe layers is presented in Figure 6. At Site 834, for example, the heatflow within the sediment column is roughly 50 mW/m2. In the overly-ing nannofossil oozes, heat-flow values are roughly 50 mW/m2; in thevolcanic silts and sands at 75 mbsf, heat flow is 47 mW/m2; in the basaltsill at 106 mbsf, heat flow is 54 mW/m2; and in the underlying sand-stones at 106 mbsf, heat flow is 64 mW/m2. This variation in heat-flowvalues suggests that some of the expected heat is being removed fromthe sediment column. One possible place is at the boundary betweenthe sandstones and the basalt. Another possible place for heat removalmay be within the volcanic silts and sands, particularly if this layerdominates the horizontal component of fluid flow within the system.Similarly, at Site 835, heat varies somewhat throughout the nanno-fossil oozes, but a significant difference in heat flow occurs betweennear-surface nannofossil oozes and the underlying interbedded nanno-fossil oozes and silt and sand. The silt and sand oozes, and the under-lying basalt, have heat flow of about 70 mW/m2. Therefore, at Site 835,some of the heat may be removed along the boundary between the nan-nofossil oozes and the silt and sand nannofossil oozes. At Site 838, notenough data were obtained to determine if, or how much, heat is being
lost between the sediment and sandstones; this site did not penetratebasalt. Site 839 has very low heat-flow values throughout the sedimentand the underlying basalt section, particularly within the volcanic siltsand sands; the whole system must be losing heat somewhere.
Active convective fluid circulation is a possible mechanism for re-moving heat. If the fluids were traveling upward from the heat source,heat flow should be high, possibly as high as theoretical heat-flowpredictions (Fig. 7). If, however, these sites are in downwelling zonesof fluid circulation, then heat flow would be low, reflecting the pres-ence of cold seawater. An abrupt or significant change in heat flowfrom one section of the sediment column to another may indicate lateralfluid flow (Domenico and Schwartz, 1990).
In general, the chemistry of pore fluids measured at these sitesindicates (1) that the primary reaction taking place in the pore fluidsis the alteration of either the volcanogenic sediments or the underlyingbasalt (or both), and (2) water with a seawater signature is beingintroduced into the sediment column, either by downwelling throughthe entire sediment column or laterally along the most permeablesediment layers (Parson, Hawkins, Allan, et al., 1992). Because theorganic content of these sediments is low and the organic matterpresent is refractory, diagenetic reactions resulting from organiccarbon decomposition, and the associated changes in pore-waterchemistry, do not occur.
At Site 834 the dissolved-calcium profile increases steadily withdepth to the datum at about 100 mbsf, suggesting lateral advection ofbottom water below 80 mbsf, either with the bottom sediment sectionalong the sediment/basalt interface or within the uppermost basaltlayer (Fig. 8; Parson. Hawkins, Allan, et al., 1992). Similarly, at Site835 the dissolved calcium profile steadily increases with depth toabout 110 mbsf and then decreases. This suggests lateral injection ofbottom water within the bottom sediment section along the sedi-ment/basalt interface or within the uppermost basalt layer. At Site 839,a low gradient of dissolved calcium and magnesium suggests that thefluid circulation system includes exchange with the underlying base-ment. A trend in dissolved calcium with depth does not appear to exist.This is consistent with downwelling of bottom water through theentire sediment column; however, it is possible that lateral advectionof bottom water is occurring through the two major vitric silt and sandsequences and that diffusive mixing is occurring between adjacentsediment sections, resulting in no appreciable gradient.
Ca2+ (mM)
9 10 11 12 13 14 15 16
20
40
60
80
100
120
Clayey nannofossil ooze
50mWAn2
Clayey nannofossil ooze
with silts and sands
51.5mW/m2
• Thick volcanic
silts and sands
47.0 mWAn2
Basalt
64,0 tηWft)2.
Ca2+ (mM)
9 10 11 12 13 14 15 16
C a z + (mM)
Site 834
40
80
120
160
Clayey nannofossil ooze
4.6-21.2 mWtoi2
Clayey nannofossil ooze'
with silts and sands -
70.8 mW/m2
Basalt
71.0mWMi 2
Ca 2 + (mM)9 10 11 12 13 14 15 16 9 10 11 12 13 14 15 16
Site 835
u
25
50
75
100
125
_ Clayey nannofossil ooze '
60.1 mWAn2
•
. Clayey nannofossil ooze
with silts and sands
_ 58.5-60.3 mW/m2
•
- Volcanic silts and sands
53.3 mWAn2
. Basalt
ü
25
50
75
100
125
' K 1 ' ' ' 'Clayey nannofossil ooze
4.9 mW/hi2
•Volcanic silts and sands -
Clayey nannofossil ooze 'with silts and sands
# 14.5 mW/m2
Volcanic sifts and sands •
• 3.1 mWAn2
Clayey nannofossil ooze
with silts and sands 6.2 mW/rn2
Basalt
10.5 mW/lmz
Site 838 Site 839
Figure 8. Profiles of dissolved pore-fluid calcium from the Lau backarc sites. The decrease in dissolved calcium from Sites 834 and 835 may have resulted fromdiagenetic reactions or dilution by fluid circulation.
794

RAPID SEDIMENTATION VS. FLUID FLOW
SUMMARY AND CONCLUSIONS
The volume of fluid required to (1) dissipate the excess heatexpected but not measured and (2) prevent the sediments from con-solidating normally in the Lau backarc sites is very small, about 8 m3
at Site 834. Very small gradients are required to replace this amountof fluid during the 5.5 m.y. of sediment deposition.
In general, sites of downwelling are much more diffuse and coolerthan sites of upwelling. Site 839 is probably a downwelling site, butthe remaining three sites are possibly located in a zone of lateral fluidflow within a large-scale, convective circulation cell. Although theoverlying nannofossil oozes are not sufficiently impermeable toprevent vertical fluid flow, the very permeable vitric silts and sandsmay act as horizontal conduits for this flow.
The lack of expected gradients in index properties and compres-sional-wave velocities may result from the inability of the sedimentto consolidate in a zone of active fluid circulation where water lost toconsolidation is immediately replaced.
ACKNOWLEDGMENTS
The authors thank Drs. Angela Davis and James Bennell ofUniversity College, Menai Bridge, North Wales, for making theirtriaxial laboratory and expertise available to us. We also thank the Leg135 Scientific Party for making their data available to us and DeniseKennedy of the U.S. Naval Research Laboratory for patiently runninglaboratory analyses. This paper was greatly improved as a result ofdiscussions with Dr. H.A. Pittenger of the Naval Research Laboratory.This project was supported by the Naval Research Laboratory, DoDProgram Element 0601153N.
REFERENCES
Anderson, R.N., and Skilbeck, J.N., 1981. Oceanic heat flow. In Emiliani, C.(Ed.), The Sea (Vol. 7): The Oceanic Lithosphere: New York (Wiley),489-524.
Domenico, RA., and Schwartz, F.W., 1990. Physical and Chemical Hydro-geology: New York (Wiley).
Freeze, R.A., and Cherry, J.A., 1979. Groundwater: Englewood Cliffs, NJ(Prentice-Hall).
Hamilton, E.L., 1976. Variations of density and porosity with depth in deep-seasediments. /. Sediment. Petrol., 46:280-300.
Lambe, T.W., 1951. Soil Testing for Engineers: New York (Wiley).Lavoie, D.L., and Bryant, W.R., 1993. Permeability characteristics of conti-
nental slope and deep water carbonates from a microfabric perspective. InRezak, R., and Lavoie, D. (Eds.), Carbonate Microfabrics: Heidelberg(Springer-Verlag).
Louden, K.E., and Wright, J.A., 1988. Marine heat flow data: a new compila-tion of observations and brief review of its analysis. In Wright, J.A.,Louden, K.E., and Moore, J.R. (Eds.), CRC Handbook of Seafloor HeatFlow: Boca Raton, FL (CRC Press).
Parson, L., Hawkins, J., Allan, J., et al., 1992. Proc. ODP, Init. Repts., 135:College Station, TX (Ocean Drilling Program).
Abbreviations for names of organizations and publication titles in ODP reference listsfollow the style given in Chemical Abstracts Service Source Index (published byAmerican Chemical Society).
Date of initial receipt: 30 June 1992Date of acceptance: 3 August 1993Ms 135SR-148
795