Embed Size (px)
Citation preview
Proposed Methodology for Utilising Automated Core
Logging Technology to Extract Geotechnical Index Parameters
Cassady Harraden, Ron Berry, James Lett GeoMet 2016
June 15-16 Perth, WA
Introduction
Geotechnical assessment and modelling vital to mining
Rock mass
properties the
result of geologic
history of the ore
deposit
Mineability relies
on rock properties
and success of
geotechnical
models
Successful
geotechnical
assessment =
successful mining
= profit
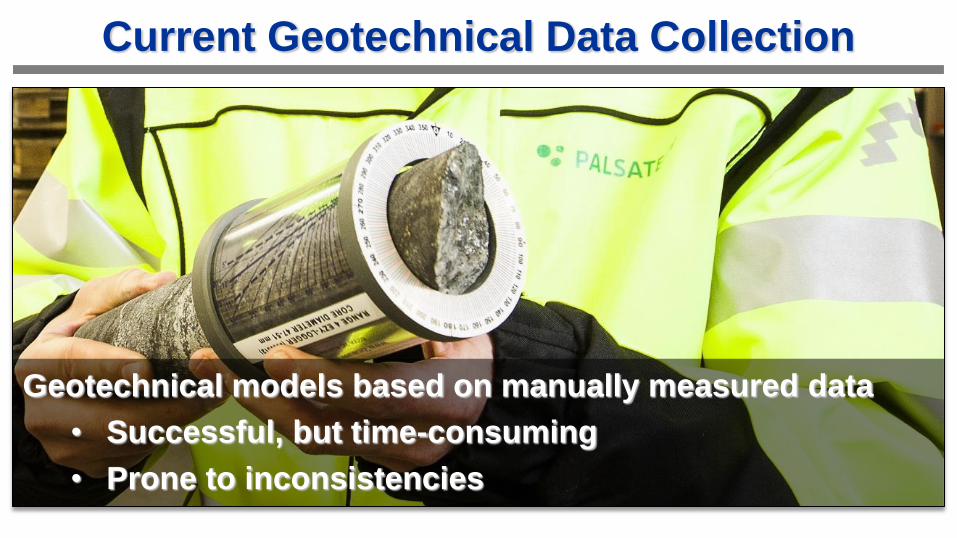
Current Geotechnical Data Collection
Geotechnical models based on manually measured data
• Successful, but time-consuming
• Prone to inconsistencies
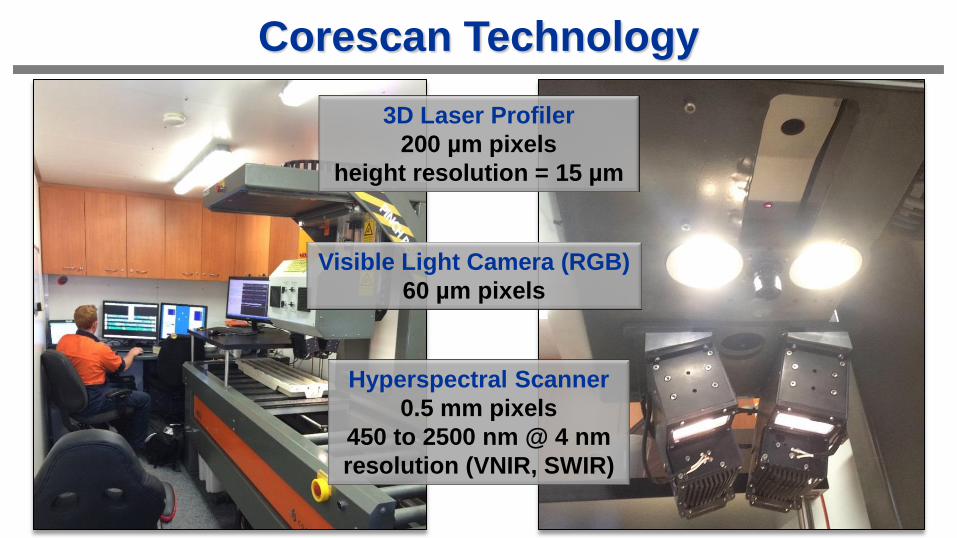
Corescan Technology
3D Laser Profiler
200 µm pixels
height resolution = 15 µm
Visible Light Camera (RGB)
60 µm pixels
Hyperspectral Scanner
0.5 mm pixels
450 to 2500 nm @ 4 nm
resolution (VNIR, SWIR)
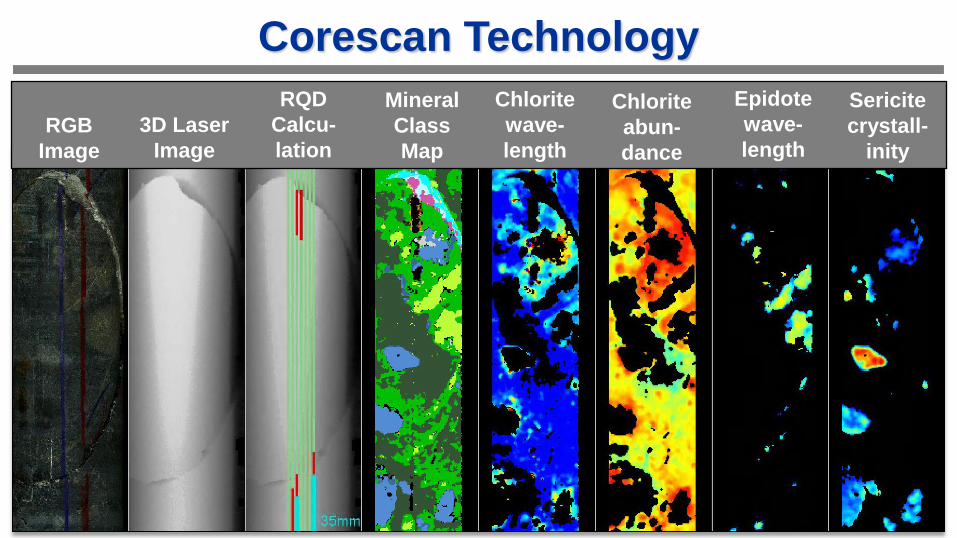
Corescan Technology
RGB
Image
3D Laser
Image
RQD
Calcu-
lation
Mineral
Class
Map
Chlorite
wave-
length
Chlorite
abun-
dance
Epidote
wave-
length
Sericite
crystall-
inity
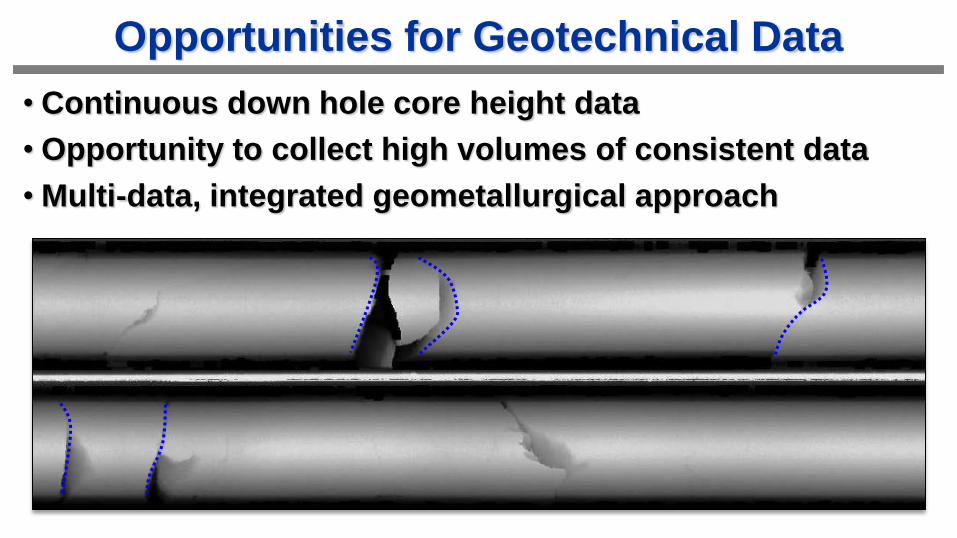
Opportunities for Geotechnical Data
• Continuous down hole core height data
• Opportunity to collect high volumes of consistent data
• Multi-data, integrated geometallurgical approach
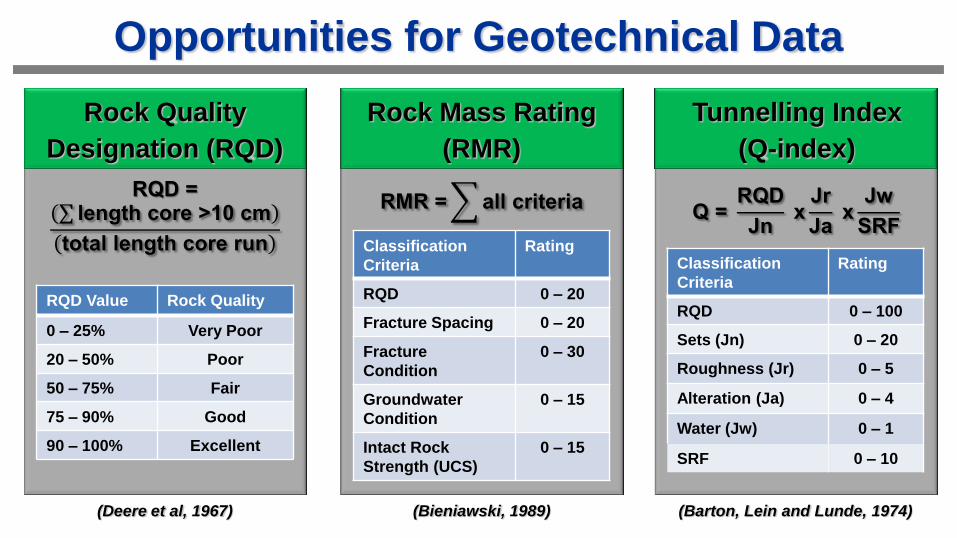
Opportunities for Geotechnical Data
RQD = length core >10 cm
total length core run
Classification
Criteria
Rating
RQD 0 – 20
Fracture Spacing 0 – 20
Fracture
Condition
0 – 30
Groundwater
Condition
0 – 15
Intact Rock
Strength (UCS)
0 – 15
RQD Value Rock Quality
0 – 25% Very Poor
20 – 50% Poor
50 – 75% Fair
75 – 90% Good
90 – 100% Excellent
Q = RQD
Jn x
Jr
Ja x
Jw
SRF
Rock Mass Rating
(RMR)
Tunnelling Index
(Q-index)
RMR = all criteria
Classification
Criteria
Rating
RQD 0 – 100
Sets (Jn) 0 – 20
Roughness (Jr) 0 – 5
Alteration (Ja) 0 – 4
Water (Jw) 0 – 1
SRF 0 – 10
Rock Quality
Designation (RQD)
(Deere et al, 1967) (Bieniawski, 1989) (Barton, Lein and Lunde, 1974)
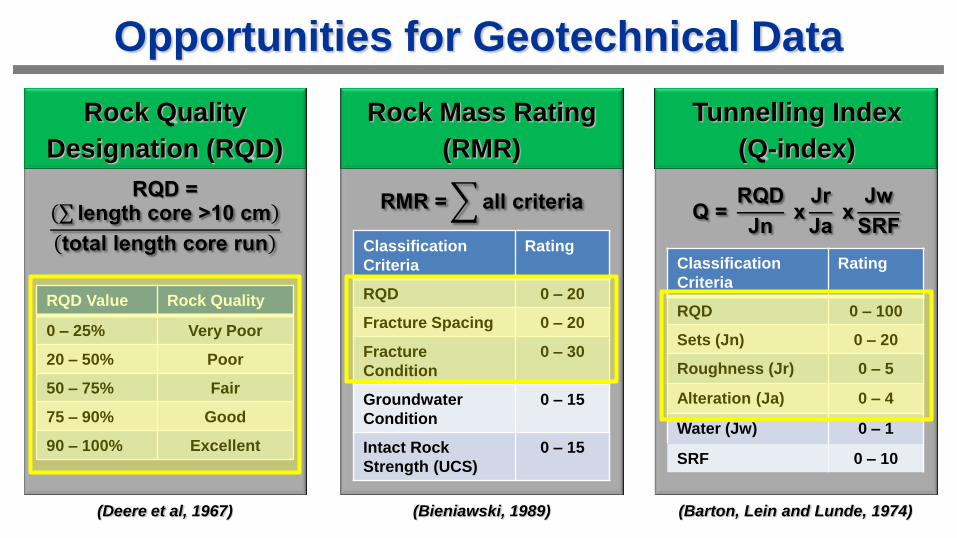
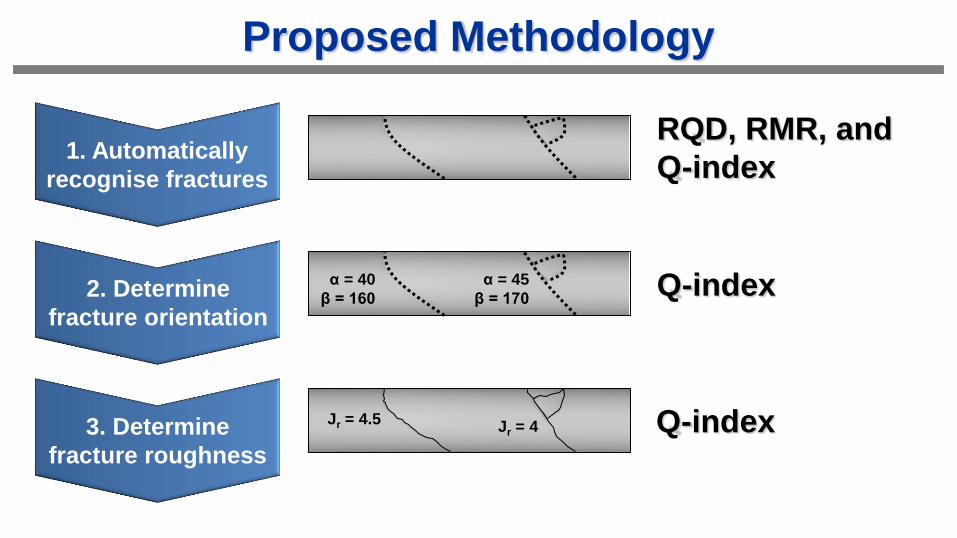
Proposed Methodology
1. Automatically
recognise fractures
RQD, RMR, and
Q-index
2. Determine
fracture orientation
α = 40
β = 160 Q-index α = 45
β = 170
3. Determine
fracture roughness
Q-index Jr = 4.5 Jr = 4
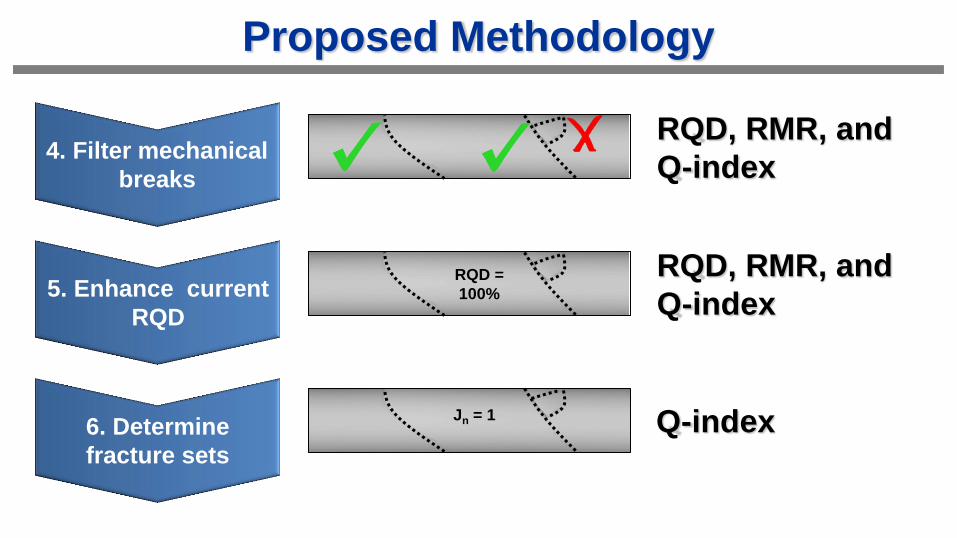
Jn = 1
RQD, RMR, and
Q-index RQD =
100%
RQD, RMR, and
Q-index
Proposed Methodology
4. Filter mechanical
breaks
5. Enhance current
RQD
6. Determine
fracture sets
Q-index
RMR and Q-index
RQD and RMR 9.5 cm
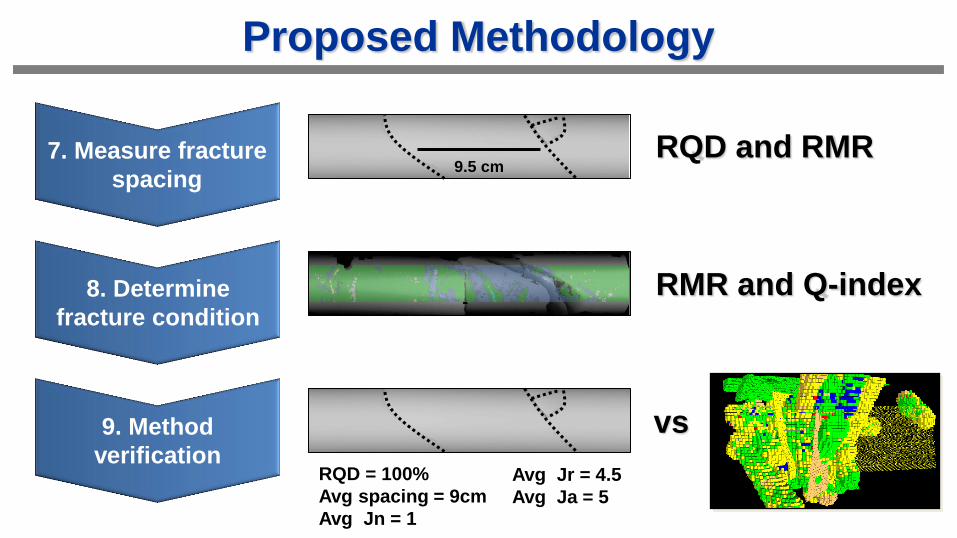
Proposed Methodology
7. Measure fracture
spacing
8. Determine
fracture condition
9. Method
verification RQD = 100%
Avg spacing = 9cm
Avg Jn = 1
Avg Jr = 4.5
Avg Ja = 5
vs
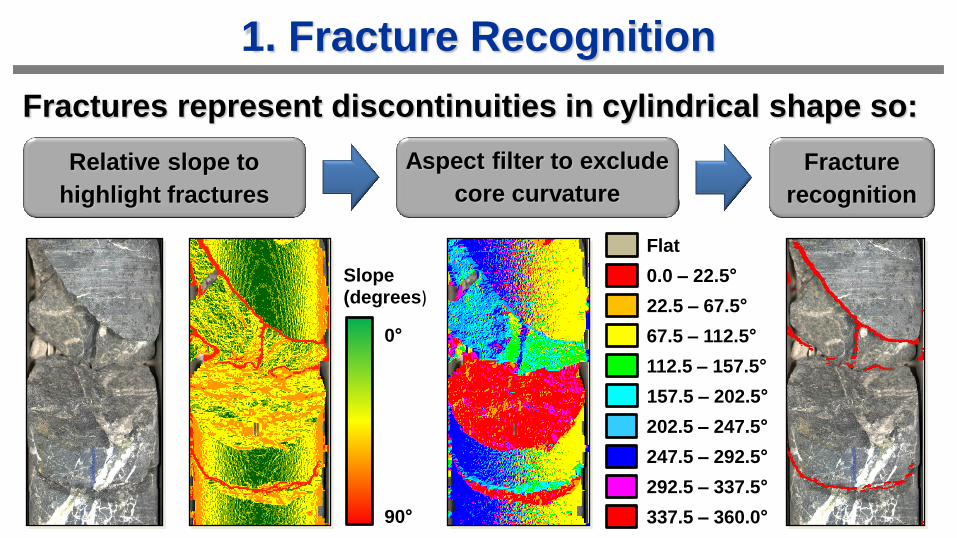
1. Fracture Recognition
Fractures represent discontinuities in cylindrical shape so:
Slope (degrees)
90°
0°
Flat
0.0 – 22.5°
22.5 – 67.5°
67.5 – 112.5°
112.5 – 157.5°
157.5 – 202.5°
202.5 – 247.5°
247.5 – 292.5°
292.5 – 337.5°
337.5 – 360.0°
Aspect (degrees)
Relative slope to
highlight fractures
Aspect filter to exclude
core curvature
Fracture
recognition
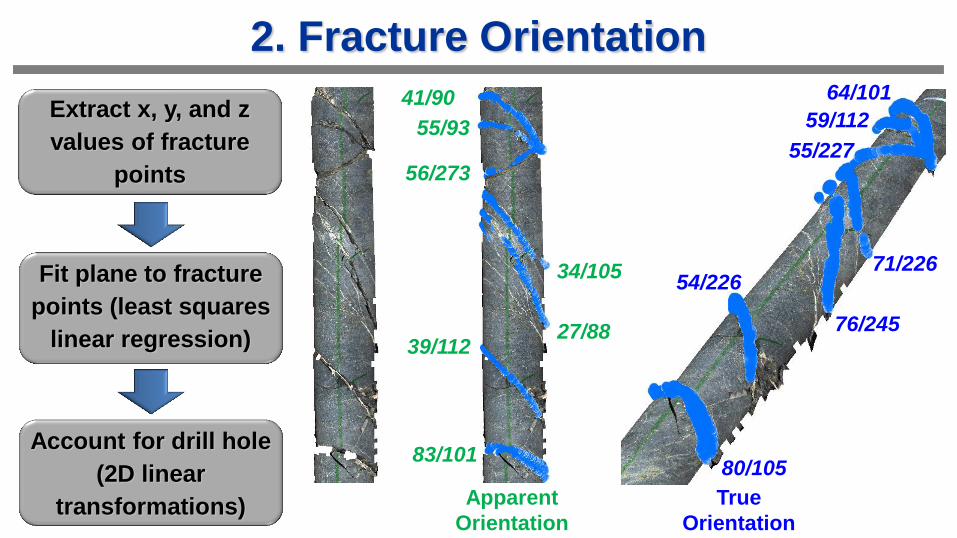
2. Fracture Orientation 64/101
59/112
55/227
71/226
76/245
54/226
80/105
True
Orientation
41/90
55/93
56/273
34/105
27/88 39/112
83/101
Apparent
Orientation
Extract x, y, and z
values of fracture
points
Fit plane to fracture
points (least squares
linear regression)
Account for drill hole
(2D linear
transformations)
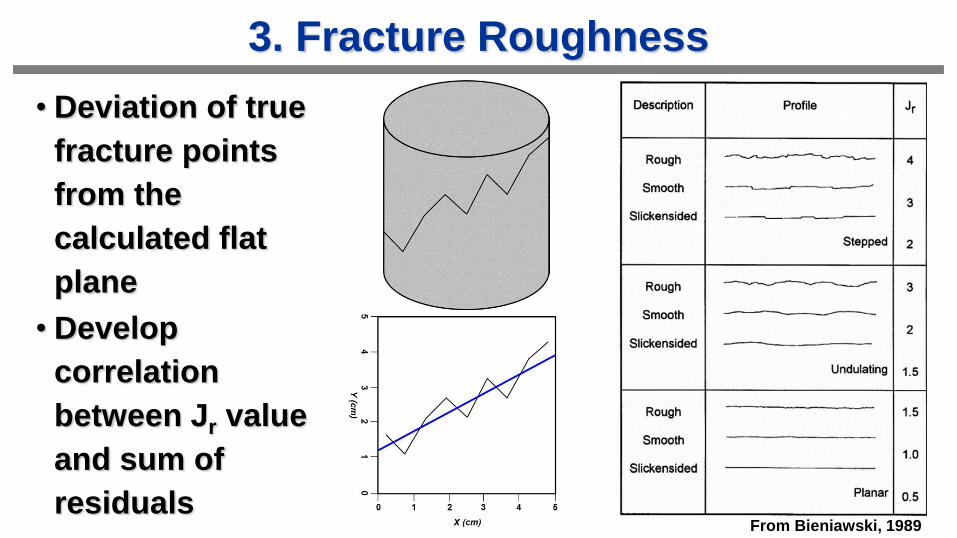
3. Fracture Roughness
• Deviation of true
fracture points
from the
calculated flat
plane
• Develop
correlation
between Jr value
and sum of
residuals From Bieniawski, 1989

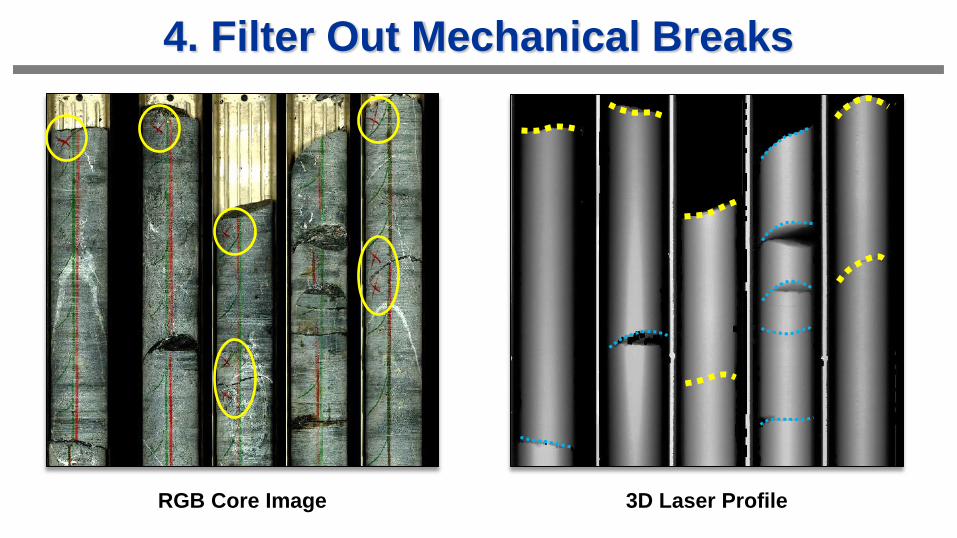
4. Filter Out Mechanical Breaks
3D Laser Profile RGB Core Image
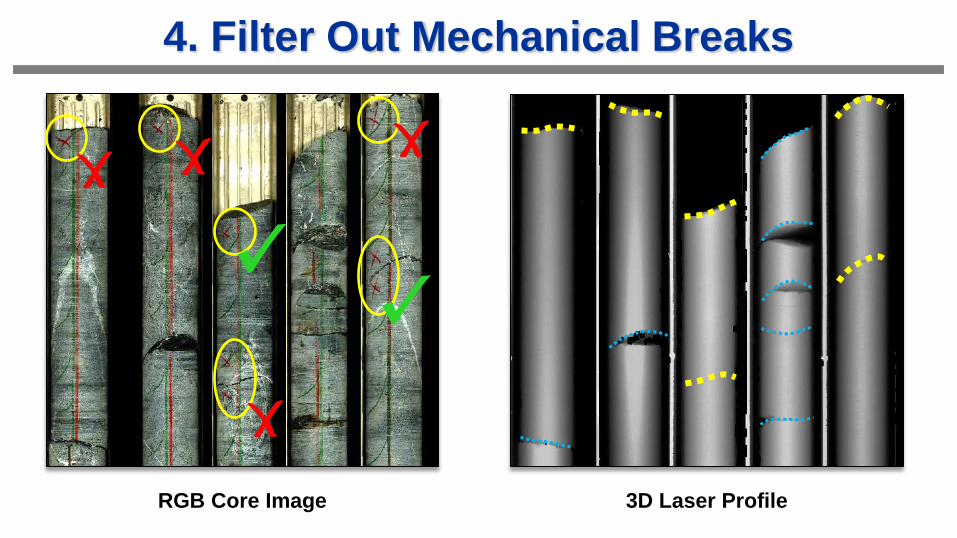
4. Filter Out Mechanical Breaks
3D Laser Profile RGB Core Image
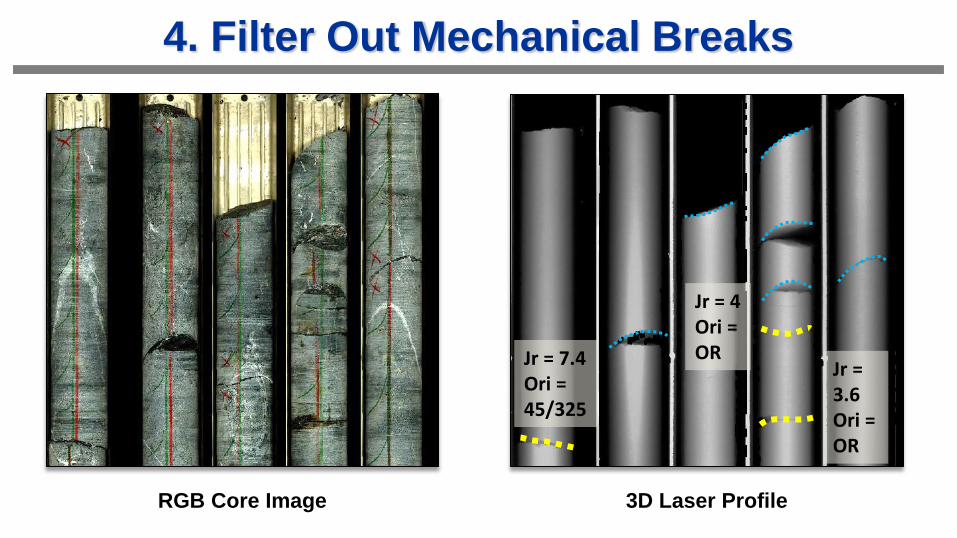
4. Filter Out Mechanical Breaks
3D Laser Profile RGB Core Image

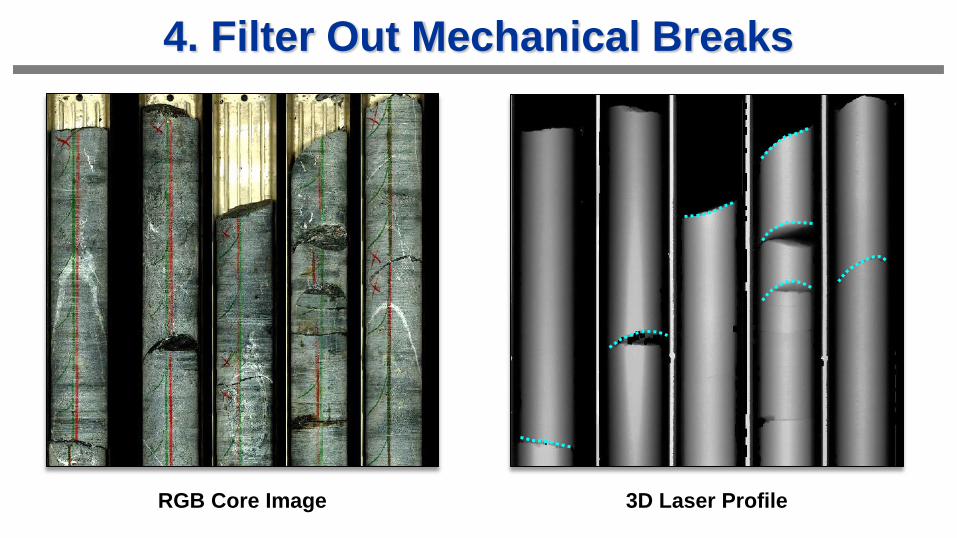
4. Filter Out Mechanical Breaks
3D Laser Profile RGB Core Image
4. Filter Out Mechanical Breaks
3D Laser Profile RGB Core Image
Jr = 7.4 Ori = 45/325
Jr = 3.6 Ori = OR
Jr = 4 Ori = OR

4. Filter Out Mechanical Breaks
3D Laser Profile RGB Core Image

4. Filter Out Mechanical Breaks
3D Laser Profile RGB Core Image
4. Filter Out Mechanical Breaks
3D Laser Profile RGB Core Image
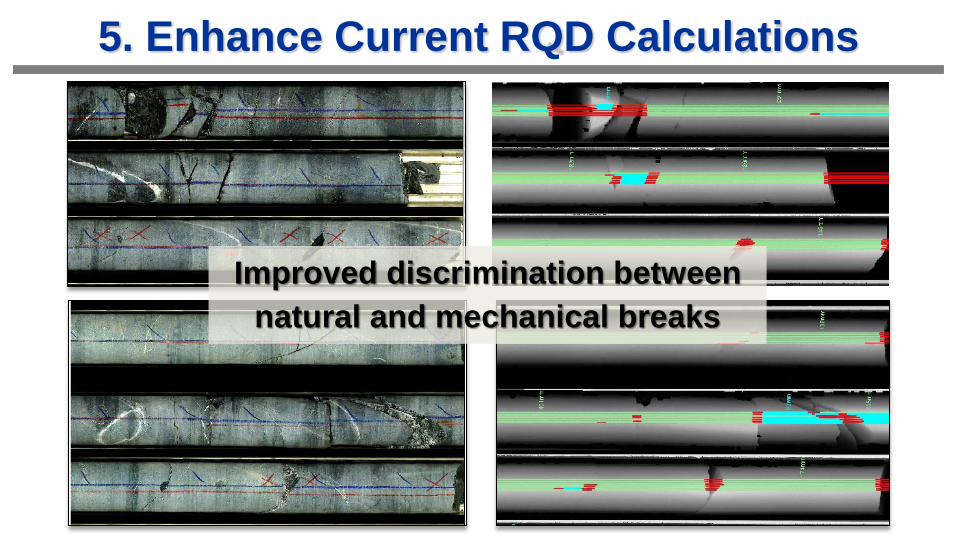
5. Enhance Current RQD Calculations
Improved discrimination between
natural and mechanical breaks
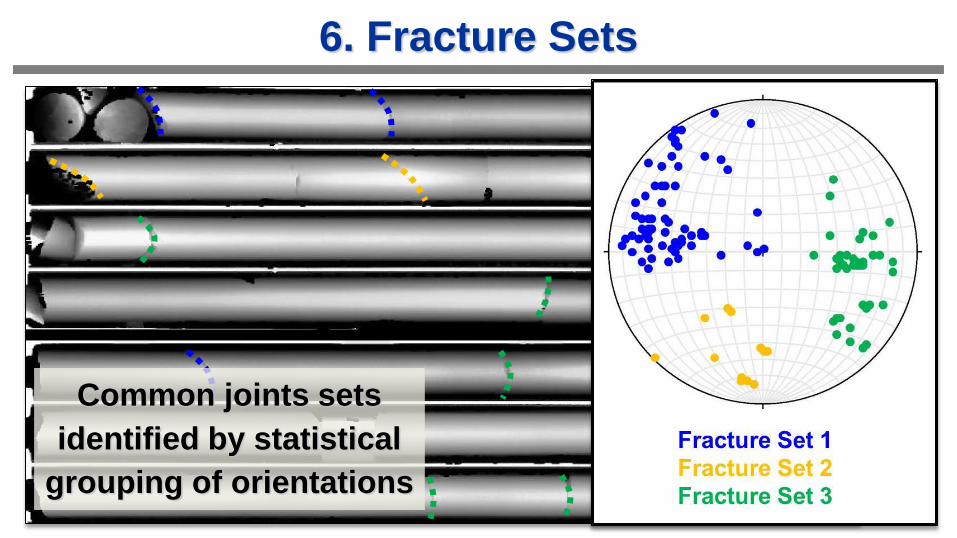
6. Fracture Sets
Common joints sets
identified by statistical
grouping of orientations
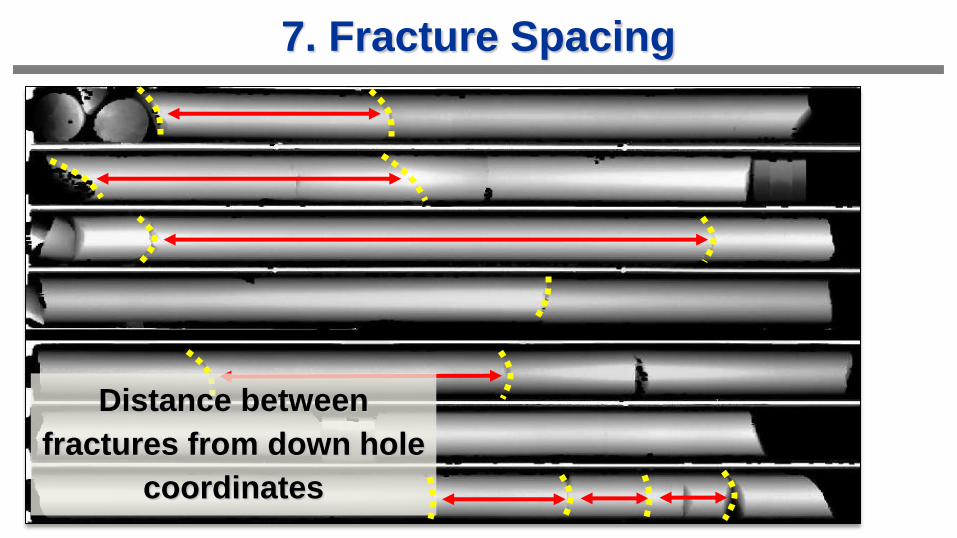
7. Fracture Spacing
Distance between
fractures from down hole
coordinates
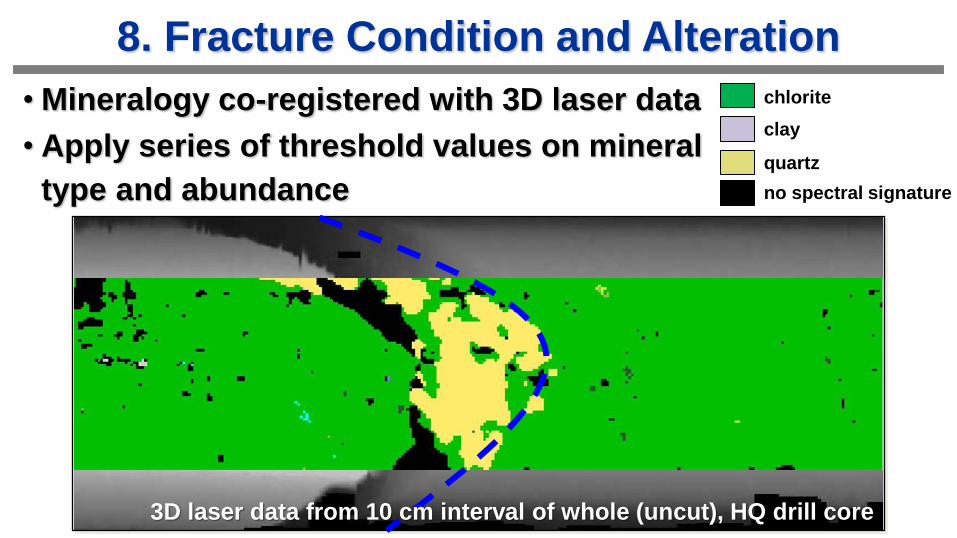
8. Fracture Condition and Alteration
• Mineralogy co-registered with 3D laser data
• Apply series of threshold values on mineral
type and abundance
clay
quartz
chlorite
no spectral signature
3D laser data from 10 cm interval of whole (uncut), HQ drill core
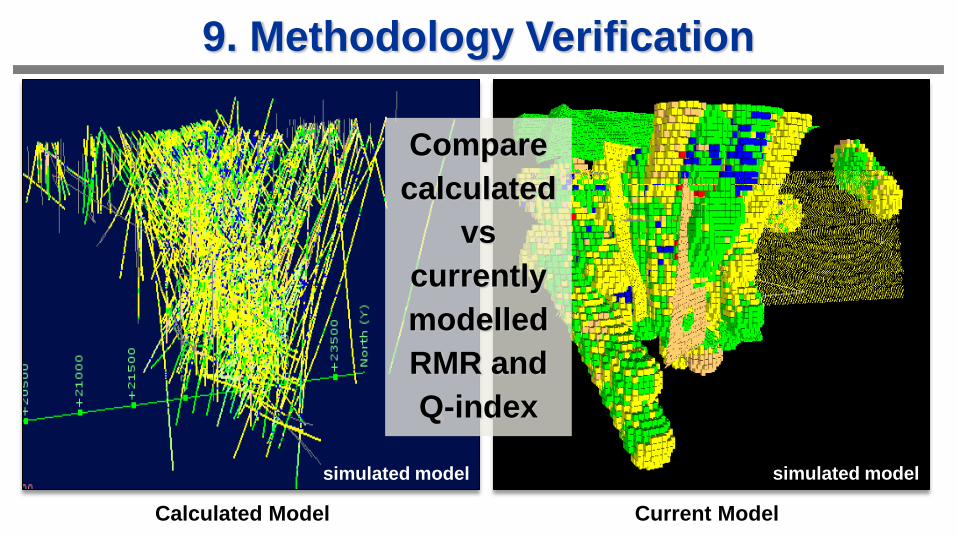
9. Methodology Verification
simulated model simulated model
Current Model Calculated Model
Compare
calculated
vs
currently
modelled
RMR and
Q-index
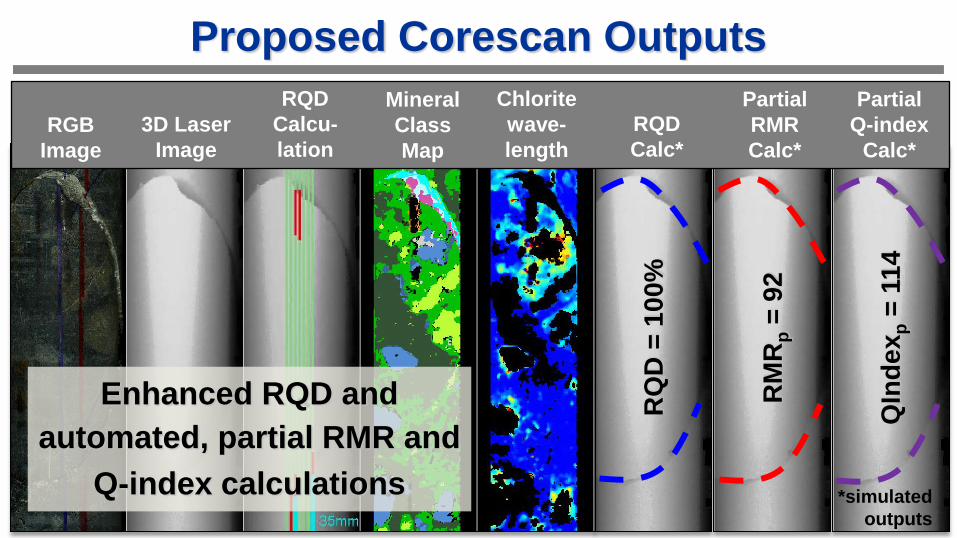
Proposed Corescan Outputs
RGB
Image
3D Laser
Image
RQD
Calcu-
lation
Mineral
Class
Map
Chlorite
wave-
length
Enhanced RQD and
automated, partial RMR and
Q-index calculations
RQD
Calc*
Partial
RMR
Calc*
Partial
Q-index
Calc*
RQ
D =
10
0%
RM
Rp =
92
QIn
de
xp =
11
4
*simulated
outputs
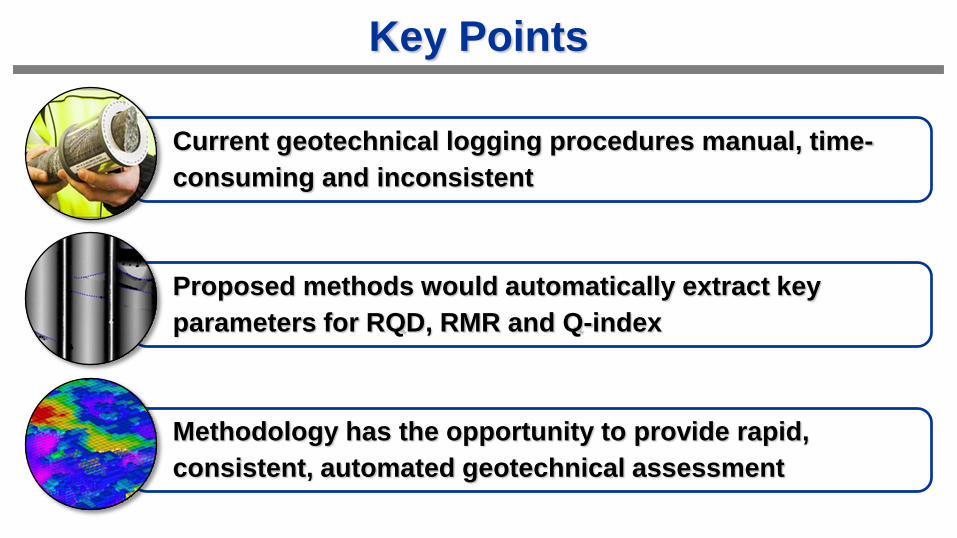
Key Points
Current geotechnical logging procedures manual, time-
consuming and inconsistent
Proposed methods would automatically extract key
parameters for RQD, RMR and Q-index
Methodology has the opportunity to provide rapid,
consistent, automated geotechnical assessment
Acknowledgements
• This research is being conducted by the ARC Research Hub for Transforming
the Mining Value Chain (project #IH130200004)
• Thanks to Anthony Harris (Newcrest Mining Ltd) and Neil Goodey (Corescan Pty Ltd)
• Special thanks to Maya Secheny, Chris Chester and Ann Winchester